UNITED STATES
SECURITIES AND EXCHANGE COMMISSION
Washington, D.C. 20549
FORM N-CSR
CERTIFIED SHAREHOLDER REPORT OF REGISTERED
MANAGEMENT INVESTMENT COMPANIES
Investment Company Act file number 811-4008
Fidelity Investment Trust
(Exact name of registrant as specified in charter)
82 Devonshire St., Boston, Massachusetts 02109
(Address of principal executive offices) (Zip code)
Eric D. Roiter, Secretary
82 Devonshire St.
Boston, Massachusetts 02109
(Name and address of agent for service)
Registrant's telephone number, including area code: 617-563-7000
Date of fiscal year end: | October 31 |
| |
Date of reporting period: | October 31, 2004 |
Item 1. Reports to Stockholders
Fidelity Advisor
International Small Cap
Fund - Class A, Class T, Class B
and Class C
Annual Report
October 31, 2004
(2_fidelity_logos) (Registered_Trademark)
Class A, Class T, Class B, and Class C are classes of Fidelity®
International Small Cap Fund
Contents
Chairman's Message | 4 | Ned Johnson's message to shareholders. |
Performance | 5 | How the fund has done over time. |
Management's Discussion | 7 | The managers' review of fund performance, strategy and outlook. |
Shareholder Expense Example | 8 | An example of shareholder expenses. |
Investment Changes | 10 | A summary of major shifts in the fund's investments over the past six months. |
Investments | 12 | A complete list of the fund's investments with their market values. |
Financial Statements | 27 | Statements of assets and liabilities, operations, and changes in net assets,
as well as financial highlights. |
Notes | 27 | Notes to the financial statements. |
Report of Independent Registered Public Accounting Firm | 46 | |
Trustees and Officers | 47 | |
Distributions | 59 | |
Proxy Voting Results | 60 | |
To view a fund's proxy voting guidelines and proxy voting record for the 12-month period ended June 30, visit www.fidelity.com/proxyvotingresults or visit the Securities and Exchange Commission's (SEC) web site at www.sec.gov. You may also call 1-877-208-0098 to request a free copy of the proxy voting guidelines.
Standard & Poor's, S&P and S&P 500 are registered service marks of The McGraw-Hill Companies, Inc. and have been licensed for use by Fidelity Distributors Corporation.
Other third party marks appearing herein are the property of their respective owners.
All other marks appearing herein are registered or unregistered trademarks or service marks of FMR Corp. or an affiliated company.
(Recycle graphic) This report is printed on recycled paper using soy-based inks.
Annual Report
This report and the financial statements contained herein are submitted for the general information of the shareholders of the fund. This report is not authorized for distribution to prospective investors in the fund unless preceded or accompanied by an effective prospectus.
The fund files its complete schedule of portfolio holdings with the SEC for the first and third quarters of each fiscal year on Form N-Q. Forms N-Q are available on the SEC's web site at http://www.sec.gov. The fund's Forms N-Q may be reviewed and copied at the SEC's Public Reference Room in Washington, DC. Information regarding the operation of the SEC's Public Reference Room may be obtained by calling 1-800-SEC-0330. For a complete list of the fund's portfolio holdings, view the fund's most recent quarterly holdings report, semiannual report, or annual report on Fidelity's web site at http://www.fidelity.com/holdings.
NOT FDIC INSURED ·MAY LOSE VALUE ·NO BANK GUARANTEE
Neither the fund nor Fidelity Distributors Corporation is a bank.
Annual Report
Chairman's Message
(photo_of_Edward_C_Johnson_3d)
Dear Shareholder:
During the past year or so, much has been reported about the mutual fund industry, and much of it has been more critical than I believe is warranted. Allegations that some companies have been less than forthright with their shareholders have cast a shadow on the entire industry. I continue to find these reports disturbing, and assert that they do not create an accurate picture of the industry overall. Therefore, I would like to remind everyone where Fidelity stands on these issues. I will say two things specifically regarding allegations that some mutual fund companies were in violation of the Securities and Exchange Commission's forward pricing rules or were involved in so-called "market timing" activities.
First, Fidelity has no agreements that permit customers who buy fund shares after 4 p.m. to obtain the 4 p.m. price. This is not a new policy. This is not to say that someone could not deceive the company through fraudulent acts. However, we are extremely diligent in preventing fraud from occurring in this manner - and in every other. But I underscore again that Fidelity has no so-called "agreements" that sanction illegal practices.
Second, Fidelity continues to stand on record, as we have for years, in opposition to predatory short-term trading that adversely affects shareholders in a mutual fund. Back in the 1980s, we initiated a fee - which is returned to the fund and, therefore, to investors - to discourage this activity. Further, we took the lead several years ago in developing a Fair Value Pricing Policy to prevent market timing on foreign securities in our funds. I am confident we will find other ways to make it more difficult for predatory traders to operate. However, this will only be achieved through close cooperation among regulators, legislators and the industry.
Yes, there have been unfortunate instances of unethical and illegal activity within the mutual fund industry from time to time. That is true of any industry. When this occurs, confessed or convicted offenders should be dealt with appropriately. But we are still concerned about the risk of over-regulation and the quick application of simplistic solutions to intricate problems. Every system can be improved, and we support and applaud well thought out improvements by regulators, legislators and industry representatives that achieve the common goal of building and protecting the value of investors' holdings.
For nearly 60 years, Fidelity has worked very hard to improve its products and service to justify your trust. When our family founded this company in 1946, we had only a few hundred customers. Today, we serve more than 18 million customers including individual investors and participants in retirement plans across America.
Let me close by saying that we do not take your trust in us for granted, and we realize that we must always work to improve all aspects of our service to you. In turn, we urge you to continue your active participation with your financial matters, so that your interests can be well served.
Best regards,
/s/Edward C. Johnson 3d
Edward C. Johnson 3d
Annual Report
Performance: The Bottom Line
Average annual total return reflects the change in the value of an investment, assuming reinvestment of the class' dividend income and capital gains (the profits earned upon the sale of securities that have grown in value) and assuming a constant rate of performance each year. The $10,000 table and the fund's returns do not reflect the deduction of taxes that a shareholder would pay on fund distributions or the redemption of fund shares. During periods of reimbursement by Fidelity, a fund's total return will be greater than it would be had the reimbursement not occurred. How a fund did yesterday is no guarantee of how it will do tomorrow. Returns may reflect the conversion of Class B shares to Class A shares after a maximum of seven years.
Average Annual Total Returns
Periods ending October 31, 2004 | | | Past 1
year | Life of
fundA |
Class A (incl. 5.75% sales charge)B | | | 15.32% | 40.08% |
Class T (incl. 3.50% sales charge)C | | | 17.80% | 41.45% |
Class B (incl. contingent deferred sales charge)D | | | 16.21% | 42.19% |
Class C (incl. contingent deferred sales charge)E | | | 20.43% | 43.34% |
AFrom September 18, 2002.
BClass A shares bear a 0.25% 12b-1 fee. The initial offering of Class A shares took place on May 27, 2003. Returns prior to May 27, 2003 are those of International Small Cap, the original class of the fund, which has no 12b-1 fee. Had Class A shares' 12b-1 fee been reflected, returns prior to May 27, 2003 would have been lower.
CClass T shares bear a 0.50% 12b-1 fee. The initial offering of Class T shares took place on May 27, 2003. Returns prior to May 27, 2003 are those of International Small Cap, the original class of the fund, which has no 12b-1 fee. Had Class T shares' 12b-1 fee been reflected, returns prior to May 27, 2003 would have been lower.
DClass B shares bear a 1.00% 12b-1 fee. The initial offering of Class B shares took place on May 27, 2003. Returns prior to May 27, 2003 are those of International Small Cap, the original class of the fund, which has no 12b-1 fee. Had Class B shares' 12b-1 fee been reflected, returns prior to May 27, 2003 would have been lower. Class B shares' contingent deferred sales charge included in the past one year and life of fund total return figure is 5% and 3%, respectively.
EClass C shares bear a 1.00% 12b-1 fee. The initial offering of Class C shares took place on May 27, 2003. Returns prior to May 27, 2003 are those of International Small Cap, the original class of the fund, which has no 12b-1 fee. Had Class C shares' 12b-1 fee been reflected, returns prior to May 27, 2003 would have been lower. Class C shares' contingent deferred sales charge included in the past one year and life of fund total return figure is 1% and 0%, respectively.
Annual Report
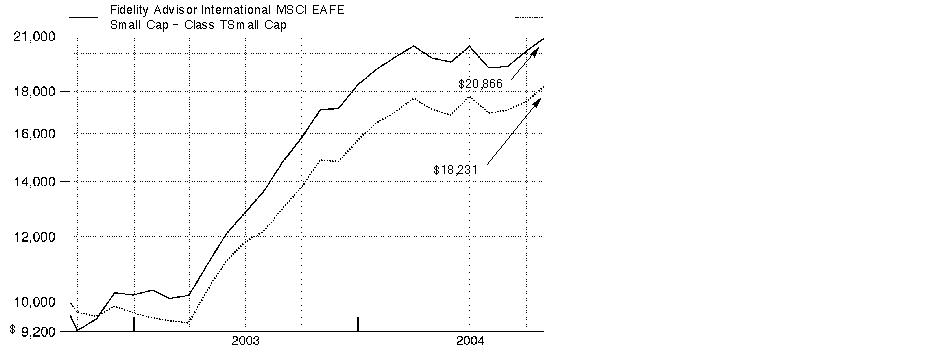
$10,000 Over Life of Fund
Let's say hypothetically that $10,000 was invested in Fidelity Advisor International Small Cap Fund - Class T on September 18, 2002, when the fund started, and the current 3.50% sales charge was paid. The chart shows how the value of your investment would have grown, and also shows how the MSCI® EAFE® Small Cap Index did over the same period.
Annual Report
Management's Discussion of Fund Performance
Comments from Tokuya Sano and Ben Paton, Co-Portfolio Managers of Fidelity Advisor International Small Cap Fund
Most of the world's major stock markets posted solid gains for the year ending October 31, 2004. The Morgan Stanley Capital InternationalSM Europe, Australasia, Far East (MSCI® EAFE®) Index - designed to represent the performance of developed stock markets outside the United States and Canada - gained 19.00%, compared to 9.42% for the Standard & Poor's 500SM Index. A weak U.S. dollar relative to most foreign currencies was partly responsible for the performance disparity. On a regional basis, Europe was one of the top performers. Many investors felt European stocks offered better valuations and brighter earnings prospects than U.S. equities. Latin American countries, many of which are exporters of oil and materials that received strong support from high commodity prices, also did well. Conversely, Japan significantly underperformed, as early optimism was eroded by disappointing economic indicators and concerns about the impact of China's economic slowdown on exports. Meanwhile, technology-focused Asian emerging markets suffered due to a deceleration in corporate capital spending.
For the 12 months ending October 31, 2004, the fund's Class A, Class T, Class B and Class C shares returned 22.36%, 22.07%, 21.21% and 21.43%, respectively, slightly trailing the 22.72% mark posted by the Morgan Stanley Capital International Europe, Australasia, Far East Small Cap Index. However, the fund finished ahead of the LipperSM International Small Cap Funds Average, which returned 18.46%. Strong stock selection in telecommunication services, semiconductors and capital goods aided performance compared with the index. Looking at geographical categories, Germany and Australia were two of the fund's stronger countries, while Japan struggled. German wireless services reseller MobilCom was the fund's top contributor both in absolute terms and compared with the MSCI EAFE Small Cap Index. Believing its valuation to be stretched, I liquidated the position - a timely decision. Performance was also helped by United Group Ltd., an Australian conglomerate. On the negative side, our picks in automobiles and components hurt the fund's results, as did an underweighting in real estate and an overweighting in software and services. Russian oil giant Yukos was the largest detractor in absolute terms and the second-largest relative to the index. The biggest detractor compared to the index was Japanese holding NOK, a maker of flexible printed circuit boards.
The views expressed in this statement reflect those of the portfolio managers only through the end of the period of the report as stated on the cover and do not necessarily represent the views of Fidelity or any other person in the Fidelity organization. Any such views are subject to change at any time based upon market or other conditions and Fidelity disclaims any responsibility to update such views. These views may not be relied on as investment advice and, because investment decisions for a Fidelity fund are based on numerous factors, may not be relied on as an indication of trading intent on behalf of any Fidelity fund.
Annual Report
Shareholder Expense Example
As a shareholder of the Fund, you incur two types of costs: (1) transaction costs, including sales charges (loads) on purchase payments or redemption proceeds, redemption fees, and (2) ongoing costs, including management fees, distribution and/or service (12b-1) fees and other Fund expenses. This Example is intended to help you understand your ongoing costs (in dollars) of investing in the Fund and to compare these costs with the ongoing costs of investing in other mutual funds.
The Example is based on an investment of $1,000 invested at the beginning of the period and held for the entire period (May 1, 2004 to October 31, 2004).
Actual Expenses
The first line of the table below for each class of the Fund provides information about actual account values and actual expenses. You may use the information in this line, together with the amount you invested, to estimate the expenses that you paid over the period. Simply divide your account value by $1,000.00 (for example, an $8,600 account value divided by $1,000.00 = 8.6), then multiply the result by the number in the first line for a class of the Fund under the heading entitled "Expenses Paid During Period" to estimate the expenses you paid on your account during this period. A small balance maintenance fee of $12.00 that is charged once a year may apply for certain accounts with a value of less than $2,000. This fee is not included in the table below. If it was, the estimate of expenses you paid during the period would be higher, and your ending account value lower, by this amount.
Hypothetical Example for Comparison Purposes
The second line of the table below for each class of the Fund provides information about hypothetical account values and hypothetical expenses based on a Class' actual expense ratio and an assumed rate of return of 5% per year before expenses, which is not the Class' actual return. The hypothetical account values and expenses may not be used to estimate the actual ending account balance or expenses you paid for the period. You may use this information to compare the ongoing costs of investing in the Fund and other funds. To do so, compare this 5% hypothetical example with the 5% hypothetical examples that appear in the shareholder reports of the other funds. A small balance maintenance fee of $12.00 that is charged once a year may apply for certain accounts with a value of less than $2,000. This fee is not included in the table below. If it was, the estimate of expenses you paid during the period would be higher, and your ending account value lower, by this amount.
Please note that the expenses shown in the table are meant to highlight your ongoing costs only and do not reflect any transaction costs. Therefore, the second line of the table is useful in comparing ongoing costs only, and will not help you determine the relative total costs of owning different funds. In addition, if these transactional costs were included, your costs would have been higher.
Annual Report
| Beginning
Account Value
May 1, 2004 | Ending
Account Value
October 31, 2004 | Expenses Paid
During Period *
May 1, 2004
to October 31, 2004 |
Class A | | | |
Actual | $1,000.00 | $1,057.20 | $8.95 |
HypotheticalA | $1,000.00 | $1,016.19 | $8.81 |
Class T | | | |
Actual | $1,000.00 | $1,056.30 | $10.23 |
HypotheticalA | $1,000.00 | $1,014.92 | $10.08 |
Class B | | | |
Actual | $1,000.00 | $1,052.70 | $13.83** |
HypotheticalA | $1,000.00 | $1,011.36 | $13.64** |
Class C | | | |
Actual | $1,000.00 | $1,053.60 | $12.70 |
HypotheticalA | $1,000.00 | $1,012.48 | $12.52 |
Institutional Class | | | |
Actual | $1,000.00 | $1,059.50 | $6.94 |
HypotheticalA | $1,000.00 | $1,018.18 | $6.82 |
International Small Cap | | | |
Actual | $1,000.00 | $1,059.50 | $6.78 |
HypotheticalA | $1,000.00 | $1,018.33 | $6.67 |
A5% return per year before expenses
*Expenses are equal to each Class' annualized expense ratio (shown in the table below); multiplied by the average account value over the period, multiplied by 184/366 (to reflect the one-half year period).
| Annualized
Expense Ratio |
Class A | 1.73% |
Class T | 1.98% |
Class B | 2.68% |
Class C | 2.46% |
Institutional Class | 1.34% |
International Small Cap | 1.31% |
**If fees effective January 1, 2005 had been in effect during the period, the annualized expense ratio and the expenses paid in the actual and hypothetical examples above would have been as follows:
| Annualized
Expense Ratio | Expenses Paid |
Class B | | |
Actual | 2.52% | $13.00 |
HypotheticalA | | $12.83 |
A5% return per year before expenses
Annual Report
Investment Changes
Geographic Diversification (% of fund's net assets) |
As of October 31, 2004 |
 | Japan27.7% | |
 | United Kingdom16.1% | |
 | Australia9.2% | |
 | Germany7.7% | |
 | United States of America5.2% | |
 | South Africa3.0% | |
 | Norway2.9% | |
 | Greece2.6% | |
 | Italy2.4% | |
 | Other23.2% | |

Percentages are adjusted for the effect of futures contracts, if applicable. |
|
As of April 30, 2004 |
| Japan31.0% | |
| United Kingdom17.4% | |
| Germany8.8% | |
| Australia7.8% | |
| Greece3.0% | |
| Sweden2.9% | |
| Norway2.9% | |
| France2.8% | |
| Hong Kong2.3% | |
| Other21.1% | |

Percentages are adjusted for the effect of futures contracts, if applicable. |
Asset Allocation |
| % of fund's
net assets | % of fund's net assets
6 months ago |
Stocks | 96.6 | 98.6 |
Short-Term Investments and Net Other Assets | 3.4 | 1.4 |
Top Ten Stocks as of October 31, 2004 |
| % of fund's
net assets | % of fund's net assets
6 months ago |
Steinhoff International Holdings Ltd. (South Africa, Household Durables) | 1.8 | 1.4 |
K&S AG (Germany, Chemicals) | 1.5 | 0.0 |
United Group Ltd. (Australia, Construction & Engineering) | 1.5 | 0.9 |
Hikari Tsushin, Inc. (Japan, Specialty Retail) | 1.5 | 0.0 |
Orascom Telecom SAE unit (Egypt, Wireless Telecommunication Services) | 1.4 | 0.3 |
Freenet.de AG (Germany, Internet Software & Services) | 1.4 | 2.5 |
Pfleiderer AG (Germany, Building Products) | 1.3 | 0.6 |
BlueScope Steel Ltd. (Australia, Metals & Mining) | 1.3 | 1.0 |
Centennial Coal Co. Ltd. (Australia, Metals & Mining) | 1.2 | 0.7 |
QBE Insurance Group Ltd. (Australia, Insurance) | 1.1 | 1.0 |
| 14.0 | |
Market Sectors as of October 31, 2004 |
| % of fund's
net assets | % of fund's net assets
6 months ago |
Consumer Discretionary | 22.7 | 21.2 |
Materials | 14.5 | 10.8 |
Industrials | 13.9 | 15.4 |
Information Technology | 13.3 | 19.9 |
Financials | 10.8 | 12.7 |
Health Care | 7.7 | 6.6 |
Energy | 6.6 | 4.8 |
Telecommunication Services | 3.9 | 4.2 |
Consumer Staples | 2.8 | 2.6 |
Utilities | 0.4 | 0.4 |
Annual Report
Investments October 31, 2004
Showing Percentage of Net Assets
Common Stocks - 95.5% |
| Shares | | Value (Note 1) |
Australia - 9.2% |
Australian Stock Exchange Ltd. | 603,839 | | $8,368,824 |
BlueScope Steel Ltd. | 2,519,309 | | 14,581,351 |
Boral Ltd. | 1,902,417 | | 9,458,247 |
Bradken Ltd. | 63,288 | | 145,952 |
Centamin Egypt Ltd. (a) | 5,509,616 | | 1,126,378 |
Centennial Coal Co. Ltd. | 4,089,388 | | 13,166,296 |
Corporate Express Australia Ltd. (d) | 1,697,169 | | 7,294,135 |
Dwyka Diamonds Ltd. (a) | 4,010,385 | | 2,358,299 |
Elkedra Diamonds NL | 3,000,000 | | 689,119 |
Fox Resources Ltd. (a) | 1,000,000 | | 486,688 |
Hardman Resources Ltd. (a) | 915,681 | | 1,474,075 |
Hardman Resources Ltd. (UK) (a) | 217,653 | | 351,974 |
JB Hi-Fi Ltd. | 1,483,593 | | 3,976,808 |
Patrick Corp. Ltd. | 914,738 | | 3,808,100 |
Promina Group Ltd. | 914,490 | | 3,108,649 |
QBE Insurance Group Ltd. | 1,235,719 | | 12,703,608 |
Stockland New (a) | 12,301 | | 54,065 |
United Group Ltd. | 3,412,640 | | 17,324,352 |
Virotec International Ltd. (a) | 1,852,832 | | 638,162 |
Virotec International Ltd. (a) | 1,084,000 | | 373,502 |
Westpac Banking Corp. | 212,356 | | 3,001,949 |
TOTAL AUSTRALIA | | 104,490,533 |
Belgium - 1.3% |
EVS Broadcast Equipment SA | 28,000 | | 2,239,475 |
Exmar NV | 17,400 | | 1,046,539 |
Melexis NV | 93,199 | | 1,115,144 |
Omega Pharma SA | 60,100 | | 3,299,438 |
Recticel SA | 67,444 | | 724,125 |
Roularta Media Group NV | 22,376 | | 1,438,887 |
Telindus Group NV | 582,193 | | 5,371,683 |
TOTAL BELGIUM | | 15,235,291 |
Bermuda - 0.4% |
Frontline Ltd. | 54,700 | | 2,701,043 |
Ship Finance International Ltd. | 2,895 | | 58,190 |
Tanzanite One Ltd. (a) | 1,166,001 | | 1,521,318 |
TOTAL BERMUDA | | 4,280,551 |
Brazil - 0.3% |
Petroleo Brasileiro SA Petrobras sponsored ADR | 108,000 | | 3,835,080 |
Canada - 0.8% |
Adastra Minerals, Inc. (a) | 10,000 | | 11,302 |
Common Stocks - continued |
| Shares | | Value (Note 1) |
Canada - continued |
La Mancha Resources, Inc. (a) | 334,000 | | $246,828 |
Oilexco, Inc. (a) | 1,388,800 | | 3,295,670 |
Ontzinc Corp. (a)(e) | 16,612,000 | | 1,841,458 |
Uruguay Mineral Exploration, Inc. (a) | 515,300 | | 2,200,238 |
Western Canadian Coal Corp. (f) | 385,886 | | 1,024,682 |
TOTAL CANADA | | 8,620,178 |
Cayman Islands - 0.0% |
Kingboard Chemical Holdings Ltd. warrants 12/31/06 (a) | 362,380 | | 167,603 |
China - 0.8% |
Aluminum Corp. of China Ltd. (H Shares) | 5,744,000 | | 3,283,888 |
Global Bio-Chem Technology Group Co. Ltd. | 2,632,000 | | 2,062,669 |
Global Bio-Chem Technology Group Co. Ltd. warrants 5/31/07 (a) | 376,000 | | 26,085 |
PICC Property & Casualty Co. Ltd. (H Shares) | 9,086,000 | | 3,268,471 |
TOTAL CHINA | | 8,641,113 |
Czech Republic - 0.3% |
Komercni Banka AS unit | 84,634 | | 3,512,311 |
Denmark - 0.2% |
Coloplast AS Series B | 5,950 | | 592,183 |
SimCorp AS | 33,539 | | 1,498,643 |
TOTAL DENMARK | | 2,090,826 |
Egypt - 1.4% |
Orascom Telecom SAE unit (a) | 928,725 | | 15,881,198 |
Estonia - 0.4% |
Hansabank SA | 422,628 | | 4,272,613 |
Finland - 0.8% |
Aldata Solutions Oyj (a) | 1,617,346 | | 2,255,992 |
Alma Media Corp. (d) | 133,020 | | 1,463,941 |
Capman Oyj (A Shares) | 496,937 | | 1,163,752 |
Nokian Tyres Ltd. | 25,678 | | 2,791,140 |
Vacon Oyj | 73,381 | | 1,031,084 |
TOTAL FINLAND | | 8,705,909 |
France - 2.1% |
Areva (investment certificates) | 7,600 | | 2,809,760 |
Bacou Dalloz | 20,330 | | 1,567,482 |
Galeries Lafayette SA | 5,900 | | 1,155,940 |
Generale de Sante | 200,152 | | 3,439,887 |
Groupe Bourbon SA | 40,038 | | 1,972,610 |
Common Stocks - continued |
| Shares | | Value (Note 1) |
France - continued |
Groupe Open SA | 52,500 | | $560,317 |
Groupe Open SA warrants 10/21/06 (a) | 14,809 | | 6,064 |
Inter Parfums SA | 17,290 | | 604,040 |
Ipsos SA | 16,003 | | 1,501,114 |
Maisons France Confort | 10,498 | | 836,956 |
Medidep SA (a) | 46,000 | | 1,280,340 |
Nexity | 40,000 | | 956,704 |
Oeneo Group (a) | 86,962 | | 144,671 |
Orpea (a) | 25,207 | | 746,759 |
Stedim SA | 27,038 | | 2,524,109 |
Toupargel-Agrigel | 43,520 | | 1,732,038 |
U10 SA (d) | 12,679 | | 700,934 |
Vivendi Universal SA (a) | 66,932 | | 1,835,945 |
TOTAL FRANCE | | 24,375,670 |
Germany - 7.0% |
Advanced Photonics Technologies AG (a) | 48,552 | | 80,772 |
Articon-Integralis AG (Reg.) (a) | 495,185 | | 1,191,334 |
Bijou Brigitte Modische Accessoires AG | 21,486 | | 2,532,348 |
Deutsche Boerse AG | 42,300 | | 2,119,241 |
ElringKlinger AG | 9,142 | | 583,781 |
Fielmann AG | 19,100 | | 1,201,093 |
Freenet.de AG (a)(d) | 773,219 | | 15,633,916 |
Fresenius AG | 43,586 | | 4,049,410 |
Fresenius Medical Care AG | 65,113 | | 4,999,506 |
Gpc Biotech AG (a) | 49,345 | | 628,311 |
Grenkeleasing AG | 100,818 | | 3,825,348 |
Hyrican Informationssysteme AG | 17,925 | | 155,294 |
K&S AG | 420,200 | | 17,562,260 |
Kontron AG (a) | 154,264 | | 1,411,493 |
Merck KGaA | 48,441 | | 2,707,101 |
Parsytec AG (a) | 188,871 | | 693,674 |
PC-Spezialist Franchise AG (d) | 150,000 | | 1,516,445 |
Pfleiderer AG (a) | 1,644,359 | | 14,582,703 |
PSI AG (a) | 228,043 | | 992,211 |
Pulsion Medical Systems AG (a) | 156,865 | | 682,516 |
Rational AG | 17,800 | | 1,404,532 |
United Internet AG | 40,352 | | 984,745 |
TOTAL GERMANY | | 79,538,034 |
Greece - 2.6% |
Alfa-Beta Vassilopoulos SA (Reg.) | 31,800 | | 516,820 |
Common Stocks - continued |
| Shares | | Value (Note 1) |
Greece - continued |
Cosmote Mobile Telecommunications SA | 148,300 | | $2,687,278 |
Folli Follie SA | 268,648 | | 8,250,932 |
Greek Organization of Football Prognostics SA | 266,442 | | 5,448,634 |
Hellenic Exchanges Holding SA (a) | 166,195 | | 1,510,026 |
Hyatt Regency SA (Reg.) | 213,182 | | 2,367,982 |
Public Power Corp. of Greece | 54,000 | | 1,344,760 |
Sarantis SA (Reg.) | 1,046,648 | | 5,705,825 |
Technical Olympic SA (Reg.) | 426,896 | | 2,054,084 |
TOTAL GREECE | | 29,886,341 |
Hong Kong - 2.2% |
ASM Pacific Technology Ltd. | 528,500 | | 1,714,432 |
China Insurance International Holdings Co. Ltd. | 13,106,000 | | 6,019,496 |
China Merchants Holdings International Co. Ltd. | 5,166,000 | | 7,632,488 |
China Pharmaceutical Enterprise and Investment Corp. Ltd. (a) | 9,820,000 | | 2,409,677 |
Kingboard Chemical Holdings Ltd. | 3,623,800 | | 7,588,671 |
TOTAL HONG KONG | | 25,364,764 |
Hungary - 0.6% |
MOL Magyar Olay-es Gazipari RT Series A (For. Reg.) | 44,200 | | 2,481,194 |
OTP Bank Rt. | 152,073 | | 3,856,565 |
TOTAL HUNGARY | | 6,337,759 |
India - 0.0% |
Kotak Mahindra Bank Ltd. | 100,669 | | 398,590 |
State Bank of India | 6,592 | | 68,958 |
TOTAL INDIA | | 467,548 |
Ireland - 1.4% |
DEPFA BANK PLC | 187,900 | | 2,885,468 |
Glanbia PLC | 543,500 | | 1,704,017 |
IAWS Group PLC (Ireland) | 38,059 | | 507,010 |
Independent News & Media PLC (Ireland) | 846,964 | | 2,471,200 |
Kenmare Resources PLC (a) | 6,850,000 | | 2,045,534 |
Kenmare Resources PLC warrants 7/23/09 (a) | 1,712,500 | | 178,748 |
Paddy Power PLC | 137,311 | | 1,825,698 |
Petroceltic International PLC (a) | 12,421,734 | | 3,937,623 |
TOTAL IRELAND | | 15,555,298 |
Italy - 2.0% |
Amplifon Spa | 38,350 | | 1,713,751 |
Cassa Di Risparmio Di Firenze | 2,942,982 | | 5,758,419 |
Lottomatica Spa New (d) | 383,300 | | 11,571,108 |
Common Stocks - continued |
| Shares | | Value (Note 1) |
Italy - continued |
Saipem Spa | 79,800 | | $922,553 |
Teleunit Spa (a) | 7,365,800 | | 2,571,795 |
TOTAL ITALY | | 22,537,626 |
Japan - 27.7% |
Able, Inc. | 272,700 | | 7,678,424 |
Adtec Plasma Technology Co. Ltd. (a) | 32 | | 323,522 |
Ahresty Corp. | 53,300 | | 694,987 |
Amiyaki Tei Co. Ltd. (d) | 185 | | 592,573 |
Apple International Co. Ltd. | 384 | | 885,303 |
ARRK Corp. | 140,600 | | 5,234,223 |
Asahi Broadcasting Corp. | 14,940 | | 961,321 |
Asahi Denka Co. Ltd. | 108,000 | | 953,106 |
Asahi Glass Co. Ltd. | 102,000 | | 938,706 |
Asahi Intecc Co. Ltd. | 49,300 | | 1,784,088 |
Axell Corp. | 282 | | 1,718,619 |
Benefit One, Inc. (a) | 1 | | 12,378 |
Casio Computer Co. Ltd. | 170,700 | | 2,030,626 |
Chiyoda Integre Co. Ltd. | 78,960 | | 1,437,671 |
Citizen Electronics Co. Ltd. (d) | 19,200 | | 865,347 |
CMK Corp. (d) | 55,000 | | 727,028 |
Culture Convenience Club Co. Ltd. (d) | 63,400 | | 790,740 |
Cyber Agent Ltd. (a)(d) | 867 | | 2,523,135 |
Cyber Agent Ltd. New (a)(d) | 867 | | 2,523,135 |
Daikin Industries Ltd. | 24,000 | | 585,062 |
Dream Technologies Corp. (a)(d) | 718 | | 511,525 |
Dwango Co. Ltd. New (a) | 168 | | 888,931 |
Dynic Corp. (a) | 45,000 | | 191,336 |
Eizo Nanao Corp. | 119,000 | | 3,339,443 |
Faith, Inc. (d) | 3,374 | | 9,245,146 |
Fancl Corp. | 26,500 | | 976,520 |
Fuji Seal International, Inc. | 81,300 | | 3,495,205 |
Fuji Spinning Co. Ltd. (a) | 2,524,000 | | 3,195,691 |
Fujikura Ltd. | 1,740,000 | | 7,661,360 |
Fujitsu Business Systems Ltd. | 29,800 | | 380,683 |
Globaly Corp. | 23,100 | | 757,377 |
Heian Ceremony Service Co. Ltd. (d) | 151,000 | | 984,457 |
Hikari Tsushin, Inc. (d) | 277,300 | | 16,611,537 |
Hogy Medical Co. | 21,400 | | 877,555 |
Hokuto Corp. | 35,100 | | 644,061 |
Human Holdings Co. Ltd. (a) | 4 | | 15,496 |
HUNET, Inc. (d) | 520,000 | | 967,922 |
Common Stocks - continued |
| Shares | | Value (Note 1) |
Japan - continued |
Ibiden Co. Ltd. (d) | 83,400 | | $1,286,835 |
Information Planning Co. Ltd. (d) | 111 | | 326,178 |
Intelligent Wave, Inc. (d) | 901 | | 1,489,819 |
Intertrade Co. Ltd. | 8 | | 48,831 |
Ishihara Chemical Co. Ltd. (d) | 53,000 | | 901,403 |
Ishihara Sangyo Kaisha Ltd. | 269,000 | | 564,256 |
Iwatani International Corp. | 945,000 | | 2,294,751 |
JACCS Co. Ltd. (d) | 226,000 | | 1,136,032 |
Japan Medical Dynamic Marketing, Inc. | 82,600 | | 850,702 |
Jastec Co. Ltd. | 54,500 | | 933,094 |
JFE Shoji Holdings, Inc. (a)(d) | 922,000 | | 4,486,512 |
KAGA ELECTRONICS Co. Ltd. (d) | 160,500 | | 2,714,556 |
Kibun Food Chemifa Co. Ltd. (d) | 49,400 | | 963,868 |
Kobe Steel Ltd. | 7,068,000 | | 9,883,914 |
Kubota Corp. | 197,000 | | 899,050 |
Kura Corp. Ltd. | 1,054 | | 2,688,902 |
Lawson, Inc. (d) | 53,300 | | 1,782,794 |
Leopalace21 Corp. | 82,000 | | 1,499,995 |
livedoor Co. Ltd. (a)(d) | 301,100 | | 1,007,128 |
Marktec Corp. | 1,000 | | 7,644 |
Maruha Group, Inc. (a) | 303,000 | | 658,478 |
Matsui Securities Co. Ltd. (d) | 43,700 | | 1,160,268 |
Meganesuper Co. Ltd. | 47,520 | | 830,651 |
Meitec Corp. | 15,075 | | 568,330 |
Melco Holdings, Inc. (d) | 70,200 | | 1,086,480 |
Mitsubishi Materials Corp. (d) | 1,179,000 | | 2,372,816 |
Mitsubishi Plastics, Inc. | 317,000 | | 805,716 |
Mitsui & Associates Telepark Corp. | 484 | | 1,495,422 |
Mitsui Fudosan Co. Ltd. | 246,000 | | 2,614,919 |
Mitsui O.S.K. Lines Ltd. | 296,000 | | 1,756,394 |
Mitsui Trust Holdings, Inc. | 768,000 | | 5,290,046 |
Mobilephone Telecommunications International Ltd. | 364 | | 567,487 |
Neturen Co. Ltd. (d) | 195,000 | | 1,227,099 |
NHK Spring Co. Ltd. | 148,000 | | 1,023,631 |
Nidec Corp. | 46,700 | | 5,065,583 |
Nihon Chouzai Co. Ltd. (a) | 39,700 | | 1,575,471 |
Nihon Dempa Kogyo Co. Ltd. (d) | 510,100 | | 10,820,376 |
Nihon Falcom Corp. | 330 | | 926,064 |
Nihon Micro Coating Co. Ltd. (a) | 10,300 | | 111,920 |
Nihon Trim Co. Ltd. (d) | 72,050 | | 4,976,478 |
Nihon Unicom Corp. | 5,300 | | 78,122 |
Ninety-Nine Plus, Inc. | 1 | | 17,669 |
Common Stocks - continued |
| Shares | | Value (Note 1) |
Japan - continued |
Nippon Chemi-con Corp. (d) | 1,046,000 | | $5,119,554 |
Nippon Chemical Industrial Co. Ltd. | 222,000 | | 788,699 |
Nippon Electric Glass Co. Ltd. | 56,000 | | 1,251,382 |
Nippon Mining Holdings, Inc. | 542,500 | | 2,583,455 |
Nippon Oil Corp. | 329,000 | | 2,092,096 |
Nippon Shinpan Co. Ltd. | 195,000 | | 591,440 |
Nippon Suisan Kaisha Co. Ltd. | 319,000 | | 1,015,760 |
Nishi-Nippon City Bank Ltd. | 199,000 | | 885,614 |
Nissin Co. Ltd. (d) | 221,300 | | 460,018 |
Nissin Co. Ltd. New (a)(d) | 221,300 | | 460,018 |
Nissin Kogyo Co. Ltd. | 378,400 | | 11,155,175 |
Nitta Corp. | 172,800 | | 2,504,608 |
Nittoku Engineering Co. Ltd. | 87,500 | | 632,470 |
NOK Corp. | 372,600 | | 11,336,250 |
Opt, Inc. | 70 | | 380,309 |
Organo Corp. | 274,000 | | 1,444,626 |
Osaki Electric Co. Ltd. (d) | 60,000 | | 239,240 |
Pacific Metals Co. Ltd. (a)(d) | 846,000 | | 3,453,224 |
Park24 Co. Ltd. (d) | 78,900 | | 1,340,409 |
Park24 Co. Ltd. New (a) | 78,900 | | 1,326,990 |
Pigeon Corp. | 217,400 | | 3,298,950 |
Pixela Corp. (d) | 25,700 | | 396,300 |
Rakuten, Inc. (d) | 323 | | 2,426,277 |
Reins International, Inc. (d) | 1,271 | | 4,983,843 |
Rohto Pharmaceutical Co. Ltd. | 611,000 | | 6,633,335 |
Sammy NetWorks Co. Ltd. (a) | 240 | | 8,934,662 |
Sega Sammy Holdings, Inc. (a) | 95,540 | | 4,441,412 |
Sekisui Chemical Co. Ltd. | 136,000 | | 866,103 |
Shicoh Engineering Co. Ltd. (a) | 28 | | 886,285 |
Shin Nippon Biomedical Laboratories Ltd. | 25,900 | | 502,901 |
Shinko Electric Industries Co.Ltd. | 41,500 | | 1,199,887 |
Showa Denko KK (d) | 1,726,000 | | 4,174,952 |
SMBC Friend Securities Co. Ltd. | 379,000 | | 2,402,882 |
So-net M3, Inc. | 3 | | 21,826 |
Soken Chemical & Engineer Co. Ltd. | 66,200 | | 1,057,098 |
Square Enix Co. Ltd. | 24,000 | | 667,832 |
Stanley Electric Co. Ltd. (d) | 195,700 | | 3,023,286 |
Sumitomo Corp. | 236,000 | | 1,759,380 |
Sumitomo Light Metal Industries Ltd. (d) | 1,819,000 | | 2,870,251 |
Sumitomo Metal Mining Co. Ltd. | 528,000 | | 3,567,062 |
Sumitomo Rubber Industries Ltd. | 132,000 | | 1,126,244 |
Sumitomo Titanium Corp. | 29,500 | | 1,410,403 |
Common Stocks - continued |
| Shares | | Value (Note 1) |
Japan - continued |
Suncall Corp. | 206,000 | | $1,080,266 |
Sunx Ltd. | 92,000 | | 1,607,294 |
Takara Co. Ltd. (d) | 228,600 | | 987,104 |
Techno Medica Co. Ltd. | 139 | | 577,881 |
Telewave, Inc. (d) | 230 | | 1,679,879 |
Teraoka Seisakusho Co. Ltd. | 58,000 | | 442,803 |
Toho Titanium Co. Ltd. | 65,000 | | 1,461,709 |
Tokyo Seimitsu Co. Ltd. (d) | 101,500 | | 3,155,242 |
Tokyo Steel Manufacturing Co. Ltd. (d) | 370,200 | | 5,848,485 |
Toppan Printing Co. Ltd. | 98,000 | | 948,193 |
Toray Industries, Inc. | 589,000 | | 2,754,807 |
Toyo Ink Manufacturing Co. Ltd. (d) | 2,749,000 | | 9,480,654 |
Toyo Machinery & Metal Co. Ltd. | 220,000 | | 1,184,863 |
Toyo Radiator Co. Ltd. (d) | 202,000 | | 988,671 |
Toyo Suisan Kaisha Ltd. | 65,000 | | 762,177 |
Trancom Co. Ltd. | 65,400 | | 1,328,577 |
Trend Micro, Inc. | 29,500 | | 1,415,978 |
Ulvac, Inc. | 2,900 | | 66,585 |
Unicharm Petcare Corp. | 200 | | 7,559 |
USS Co. Ltd. | 68,480 | | 5,545,175 |
Wintest Corp. | 70 | | 261,256 |
Works Applications Co. Ltd. (a) | 389 | | 1,201,899 |
Zakkaya Bulldog Co. Ltd. (a) | 31,400 | | 1,014,674 |
Zwei Co. Ltd. (a) | 500 | | 10,960 |
TOTAL JAPAN | | 314,325,122 |
Korea (South) - 0.2% |
SKC Co. Ltd. (a) | 353,470 | | 2,525,914 |
Luxembourg - 1.5% |
Millicom International Cellular SA unit (a) | 183,000 | | 3,711,889 |
Orco Property Group | 37,100 | | 1,401,042 |
Stolt-Nielsen SA (a)(d) | 572,390 | | 12,016,774 |
TOTAL LUXEMBOURG | | 17,129,705 |
Netherlands - 0.7% |
Completel Europe NV (a) | 76,809 | | 2,531,031 |
Efes Breweries International NV unit | 32,700 | | 907,425 |
Fugro NV (Certificaten Van Aandelen) | 24,365 | | 1,898,855 |
PinkRoccade NV | 137,626 | | 1,805,230 |
Wolters Kluwer NV (Certificaten Van Aandelen) | 46,025 | | 841,655 |
TOTAL NETHERLANDS | | 7,984,196 |
Common Stocks - continued |
| Shares | | Value (Note 1) |
New Zealand - 0.1% |
The Warehouse Group Ltd. | 344,626 | | $962,598 |
Norway - 2.9% |
ABG Sundal Collier ASA | 3,358,000 | | 2,640,373 |
Bolig-og Naeringsbanken ASA | 29,040 | | 1,214,767 |
Catch Communications ASA | 633,000 | | 1,592,716 |
Mamut ASA | 1,851,000 | | 2,605,218 |
Nordic VLSI ASA (a) | 591,000 | | 4,042,884 |
Norman ASA (a) | 65,300 | | 549,391 |
Norsk Hydro ASA | 101,680 | | 7,499,339 |
Orkla ASA (A Shares) | 47,772 | | 1,363,530 |
P4 Radio Hele Norge ASA (a)(d) | 141,400 | | 378,018 |
Petroleum Geo-Services ASA (a) | 38,750 | | 1,788,522 |
Statoil ASA | 215,500 | | 3,126,283 |
Tandberg ASA | 339,500 | | 3,203,359 |
TANDBERG Television ASA (a) | 388,829 | | 2,824,979 |
TOTAL NORWAY | | 32,829,379 |
Poland - 0.9% |
Polski Koncern Naftowy Orlen SA unit | 455,400 | | 9,791,100 |
Portugal - 0.8% |
Impresa SGPS (a) | 596,953 | | 3,483,479 |
Media Capital SGPS SA | 880,576 | | 5,983,696 |
TOTAL PORTUGAL | | 9,467,175 |
Russia - 0.4% |
Mobile TeleSystems OJSC sponsored ADR | 17,100 | | 2,481,552 |
Surgutneftegaz JSC sponsored ADR | 36,600 | | 1,916,925 |
TOTAL RUSSIA | | 4,398,477 |
Singapore - 1.2% |
Accord Customer Care Solutions Ltd. (a) | 13,435,000 | | 6,220,842 |
Singapore Exchange Ltd. | 2,698,000 | | 2,855,456 |
Singapore Petroleum Co. Ltd. | 1,501,000 | | 3,375,772 |
Venture Corp. Ltd. | 124,000 | | 1,178,147 |
TOTAL SINGAPORE | | 13,630,217 |
South Africa - 3.0% |
African Bank Investments Ltd. | 1,208,151 | | 2,831,983 |
Discovery Holdings Ltd. (a) | 2,442,719 | | 6,651,488 |
MTN Group Ltd. | 594,602 | | 3,247,939 |
Common Stocks - continued |
| Shares | | Value (Note 1) |
South Africa - continued |
Steinhoff International Holdings Ltd. | 11,751,132 | | $20,567,495 |
Wilson Bayly Holmes-Ovcon Ltd. | 333,456 | | 1,364,729 |
TOTAL SOUTH AFRICA | | 34,663,634 |
Spain - 0.2% |
Antena 3 Television SA (a) | 36,758 | | 2,368,424 |
Sweden - 1.7% |
Eniro AB | 153,028 | | 1,297,819 |
Finnveden Invest AB Series B (a) | 368,884 | | 2,854,736 |
Gambro AB (A Shares) | 269,000 | | 3,146,388 |
Hexagon AB (B Shares) | 80,143 | | 2,956,637 |
Lindex AB | 31,898 | | 885,968 |
Mekonomen AB | 68,000 | | 1,807,002 |
Modern Times Group AB (MTG) (B Shares) (a) | 105,200 | | 2,342,007 |
Observer AB | 297,314 | | 1,176,699 |
OMX AB (a) | 162,285 | | 1,921,123 |
VBG AB Class B | 6,710 | | 100,536 |
Wedins Norden AB Series B (a) | 3,202,790 | | 307,843 |
TOTAL SWEDEN | | 18,796,758 |
Switzerland - 1.6% |
A Hiestand Holding AG | 1,812 | | 1,265,880 |
Actelion Ltd. (Reg.) (a) | 18,108 | | 2,078,067 |
Amazys Holding AG | 54,100 | | 2,628,413 |
Barry Callebaut AG | 5,721 | | 1,102,220 |
Escor Casino & Entertainment SA | 19,770 | | 514,205 |
Geberit AG (Reg.) | 1,663 | | 1,086,564 |
Micronas Semiconductor Holding AG (a) | 15,752 | | 620,157 |
Mobilezone Holding AG | 462,199 | | 1,579,638 |
Roche Holding AG (participation certificate) | 30,328 | | 3,109,522 |
Sika AG (Bearer) | 1,436 | | 886,524 |
Sulzer AG (Reg.) | 4,024 | | 1,361,783 |
Swissquote Group Holding SA (a) | 18,811 | | 1,402,395 |
Temenos Group AG (a) | 63,126 | | 449,465 |
TOTAL SWITZERLAND | | 18,084,833 |
Taiwan - 0.1% |
Merry Electronics Co. Ltd. | 584,568 | | 1,319,626 |
Turkey - 0.8% |
Beko Elektronik AS (a) | 887,743,640 | | 3,726,215 |
Common Stocks - continued |
| Shares | | Value (Note 1) |
Turkey - continued |
Dogan Gazetecilik AS (a) | 2,269,570,200 | | $4,363,657 |
Dogan Yayin Holding AS (a) | 359,364,500 | | 1,277,271 |
TOTAL TURKEY | | 9,367,143 |
United Kingdom - 16.1% |
Advanced Technology (UK) PLC (a)(e) | 7,355,000 | | 558,207 |
AeroBox PLC (a) | 3,640,000 | | 986,634 |
Air Partner PLC | 45,000 | | 361,787 |
Alba PLC | 402,700 | | 5,498,361 |
Alliance Pharma PLC (a)(e) | 6,259,500 | | 1,811,686 |
Amlin PLC | 157,014 | | 419,821 |
Asia Energy PLC | 694,600 | | 4,607,918 |
Atrium Underwriting PLC | 257,060 | | 862,105 |
Axis Shield PLC (a) | 89,600 | | 330,953 |
BETonSPORTS PLC | 2,407,121 | | 6,922,693 |
BG Group PLC | 441,600 | | 2,880,847 |
BHP Billiton PLC | 193,400 | | 1,967,147 |
Biocompatibles International PLC | 79,010 | | 330,313 |
Blacks Leisure Group PLC | 45,443 | | 367,437 |
Caffe Nero Group PLC (a) | 282,978 | | 520,015 |
Carphone Warehouse Group PLC | 542,849 | | 1,660,948 |
Chaucer Holdings PLC | 1,612,100 | | 1,303,489 |
Cobra Biomanufacturing PLC (a) | 818,400 | | 515,097 |
Corac Group PLC (a)(e) | 4,698,004 | | 2,460,487 |
Corin Group PLC | 1,122,914 | | 7,067,566 |
CSS Stellar PLC (a) | 623,908 | | 418,481 |
CustomVis PLC (a) | 375,215 | | 131,008 |
Domino's Pizza UK & IRL PLC | 344,636 | | 1,304,640 |
Edinburgh Oil & Gas PLC (a) | 713,381 | | 2,484,240 |
Entertainment Rights PLC (a) | 4,002,089 | | 965,638 |
Flomerics Group PLC | 449,658 | | 458,604 |
Future Network PLC | 1,717,169 | | 1,830,222 |
GMA Resources PLC (a) | 6,547,930 | | 1,955,331 |
Goldshield Group PLC | 575,700 | | 2,248,112 |
GTL Resources PLC (a) | 13,669,072 | | 1,318,746 |
Gyrus Group PLC (a) | 220,640 | | 950,802 |
Hardide Ltd. | 125,000 | | 918,825 |
Healthcare Enterprise Group PLC (a) | 30,417,845 | | 1,062,050 |
Hereward Ventures PLC (a) | 1,818,182 | | 167,059 |
Highbury House Communications PLC | 713,914 | | 131,192 |
Holidaybreak PLC | 72,426 | | 714,047 |
Common Stocks - continued |
| Shares | | Value (Note 1) |
United Kingdom - continued |
Hornby PLC | 471,440 | | $2,391,103 |
Hunting PLC | 530,400 | | 1,832,416 |
Icap PLC | 298,550 | | 1,283,795 |
Ideal Shopping Direct PLC (a) | 273,686 | | 749,379 |
Inchcape PLC | 30,122 | | 818,128 |
International Energy Group Ltd. | 1,148,800 | | 3,937,187 |
Intertek Group PLC | 116,310 | | 1,470,511 |
ITE Group PLC | 3,133,116 | | 4,505,299 |
ITM Power PLC | 2,700,000 | | 3,845,283 |
Jubilee Platinum PLC (a)(e) | 3,852,022 | | 1,822,757 |
Kesa Electricals PLC | 556,201 | | 2,780,120 |
Lambert Howarth Group PLC (e) | 1,320,284 | | 6,550,794 |
Landround PLC | 74,400 | | 345,221 |
Lastminute.com PLC (a) | 1,749,526 | | 3,584,743 |
Lawrence PLC | 1,073,124 | | 7,424,679 |
London Clubs International PLC (a) | 1,172,500 | | 2,510,161 |
LTG Technologies PLC (a) | 6,914,968 | | 1,207,193 |
Man Group PLC | 36,969 | | 887,925 |
Manganese Bronze Holdings PLC | 239,797 | | 846,073 |
Manpower Software PLC (a) | 258,824 | | 160,524 |
Marlborough Stirling PLC | 793,069 | | 648,536 |
Matchnet PLC unit (a) | 823,933 | | 5,271,935 |
Meridian Petroleum PLC | 2,747,000 | | 1,438,687 |
Microgen PLC (a) | 289,948 | | 303,709 |
N Brown Group PLC | 439,410 | | 1,037,614 |
NDS Group PLC sponsored ADR (a) | 105,154 | | 2,751,880 |
Ocean Wilsons Holdings Ltd. | 170,311 | | 604,036 |
Oystertec PLC (a) | 7,009,687 | | 3,155,931 |
P&MM Group PLC (e) | 2,035,000 | | 2,299,865 |
Peacock Group PLC | 835,318 | | 3,968,032 |
Phytopharm PLC (a) | 528,100 | | 1,455,694 |
Pilat Media Global PLC (a)(e) | 2,880,000 | | 2,196,359 |
PlusNet Technologies Ltd. | 912,355 | | 2,347,225 |
Premier Oil PLC (a) | 159,291 | | 1,832,434 |
Proteome Sciences PLC (a) | 645,184 | | 889,217 |
Provident Financial PLC | 434,894 | | 4,671,224 |
Psion PLC | 2,900,000 | | 3,130,896 |
QA PLC (a) | 13,554,656 | | 592,827 |
Regal Petroleum PLC (a) | 137,516 | | 865,519 |
Royalblue Group PLC | 210,803 | | 1,646,374 |
Sanctuary Group PLC | 3,046,215 | | 2,337,114 |
SCI Entertainment Group PLC (a) | 401,531 | | 1,014,576 |
Common Stocks - continued |
| Shares | | Value (Note 1) |
United Kingdom - continued |
SDL PLC (a) | 227,897 | | $487,896 |
Sibir Energy PLC (a) | 1,162,800 | | 299,155 |
Sinclair Pharma PLC | 734,198 | | 1,517,849 |
SkyePharma PLC (a) | 124,100 | | 121,438 |
Sondex PLC | 354,900 | | 1,317,408 |
Spice Holdings PLC | 1,362,100 | | 3,566,865 |
Sportingbet PLC | 345,100 | | 697,590 |
Sterling Energy PLC (a) | 4,035,800 | | 1,409,114 |
SubSea Resources PLC (a) | 7,222,500 | | 2,654,485 |
SubSea Resources PLC warrants 11/4/09 (a) | 1,805,625 | | 33 |
Taghmen Energy Ltd. | 2,279,573 | | 1,481,722 |
Teesland PLC | 1,380,000 | | 1,711,771 |
Tikit Group PLC (e) | 822,761 | | 2,154,524 |
ukbetting PLC (a) | 2,517,419 | | 1,954,542 |
Unibet Group PLC unit | 55,964 | | 1,589,999 |
Urbium PLC | 141,255 | | 1,265,439 |
William Hill PLC | 333,186 | | 2,994,046 |
William Ransom & Son PLC (e) | 2,684,500 | | 2,392,588 |
Windsor PLC | 700,000 | | 546,701 |
Wolfson Microelectronics PLC | 685,250 | | 1,240,361 |
Xstrata PLC | 133,500 | | 2,073,007 |
TOTAL UNITED KINGDOM | | 183,382,016 |
United States of America - 1.8% |
Frontier Mining Ltd. (e) | 4,487,533 | | 1,443,140 |
Golden Telecom, Inc. (d) | 88,900 | | 2,532,761 |
Marathon Oil Corp. | 39,900 | | 1,520,589 |
NTL, Inc. (a) | 69,000 | | 4,589,190 |
Private Media Group, Inc. (a)(d) | 202,400 | | 514,096 |
ResMed, Inc. CHESS Depositary Interests (a) | 642,463 | | 3,054,630 |
Solar Integrated Technologies, Inc. | 876,373 | | 2,214,392 |
Valero Energy Corp. | 41,400 | | 1,778,958 |
XL TechGroup, Inc. | 736,700 | | 2,707,594 |
TOTAL UNITED STATES OF AMERICA | | 20,355,350 |
TOTAL COMMON STOCKS (Cost $910,182,332) | 1,085,177,913 |
Nonconvertible Preferred Stocks - 1.1% |
| Shares | | Value (Note 1) |
Germany - 0.7% |
Fresenius AG | 49,105 | | $4,166,270 |
Fresenius Medical Care AG | 68,266 | | 3,736,387 |
TOTAL GERMANY | | 7,902,657 |
Italy - 0.4% |
Buzzi Unicem Spa (Risp) | 483,900 | | 4,415,230 |
TOTAL NONCONVERTIBLE PREFERRED STOCKS (Cost $9,850,251) | 12,317,887 |
Money Market Funds - 8.3% |
| | | |
Fidelity Cash Central Fund, 1.79% (b) | 31,425,450 | | 31,425,450 |
Fidelity Securities Lending Cash Central Fund, 1.77% (b)(c) | 62,835,268 | | 62,835,268 |
TOTAL MONEY MARKET FUNDS (Cost $94,260,718) | 94,260,718 |
TOTAL INVESTMENT PORTFOLIO - 104.9% (Cost $1,014,293,301) | | 1,191,756,518 |
NET OTHER ASSETS - (4.9)% | | (55,719,257) |
NET ASSETS - 100% | $1,136,037,261 |
Legend |
(a)Non-income producing |
(b)Affiliated fund that is available only to investment companies and other accounts managed by Fidelity Investments. The rate quoted is the annualized seven-day yield of the fund at period end. A complete listing of the fund's holdings as of its most recent fiscal year end is available upon request. |
(c)Includes investment made with cash collateral received from securities on loan. |
(d)Security or a portion of the security is on loan at period end. |
(e)Affiliated company |
(f)Restricted securities - Investment in securities not registered under the Securities Act of 1933 (excluding 144A issues). At the end of the period, the value of restricted securities (excluding 144A issues) amounted to $1,024,682 or 0.1% of net assets. |
Additional information on each holding is as follows: |
Security | Acquisition Date | Acquisition Cost |
Western Canadian Coal Corp. | 9/29/04 | $0 |
Other Information |
An affiliated company is a company in which the fund has ownership of at least 5% of the voting securities. Companies which are affiliates of the fund at period-end are noted in the fund's Schedule of Investments. Transactions during the period with companies which are or were affiliates are as follows: |
Affiliates | Value, beginning of period | Purchases | Sales Proceeds | Dividend Income | Value,
end of
period |
Advanced Technology (UK) PLC | $- | $677,635 | $- | $- | $558,207 |
Alliance Pharma PLC | - | 1,378,455 | - | - | 1,811,686 |
Articon-Integralis AG (Reg.) | - | 3,216,353 | 382,484 | - | - |
Corac Group PLC | - | 2,448,084 | - | - | 2,460,487 |
Frontier Mining Ltd. | - | 1,213,216 | - | - | 1,443,140 |
Jubilee Platinum PLC | - | 1,879,542 | 562,643 | - | 1,822,757 |
Lambert Howarth Group PLC | 4,376,721 | 1,140,404 | - | 228,933 | 6,550,794 |
Online Travel Corp. PLC | 2,164,843 | - | - | - | - |
Ontzinc Corp. | - | 1,719,571 | - | - | 1,841,458 |
P&MM Group PLC | - | 1,986,262 | - | - | 2,299,865 |
Pilat Media Global PLC | - | 2,810,095 | - | - | 2,196,359 |
Tikit Group PLC | - | 2,069,038 | - | 24,172 | 2,154,524 |
Wedins Norden AB Series B | 956,215 | 2,235,131 | 1,034,922 | - | - |
William Ransom & Son PLC | - | 2,458,423 | - | 48,384 | 2,392,588 |
Totals | $7,497,779 | $25,232,209 | $1,980,049 | $301,489 | $25,531,865 |
See accompanying notes which are an integral part of the financial statements.
Annual Report
Financial Statements
Statement of Assets and Liabilities
October 31, 2004 |
| | |
Assets | | |
Investment in securities, at value (including securities loaned of $58,511,696) (cost $1,014,293,301) - See accompanying schedule | | $1,191,756,518 |
Cash | | 153,592 |
Foreign currency held at value (cost $5,447,045) | | 5,423,146 |
Receivable for investments sold | | 9,813,009 |
Receivable for fund shares sold | | 2,888,611 |
Dividends receivable | | 1,251,600 |
Interest receivable | | 38,100 |
Other affiliated receivables | | 3,355 |
Other receivables | | 129,888 |
Total assets | | 1,211,457,819 |
| | |
Liabilities | | |
Payable for investments purchased | $9,970,193 | |
Payable for fund shares redeemed | 1,253,833 | |
Accrued management fee | 896,565 | |
Distribution fees payable | 19,420 | |
Other affiliated payables | 246,714 | |
Other payables and accrued expenses | 198,565 | |
Collateral on securities loaned, at value | 62,835,268 | |
Total liabilities | | 75,420,558 |
| | |
Net Assets | | $1,136,037,261 |
Net Assets consist of: | | |
Paid in capital | | $898,686,393 |
Undistributed net investment income | | 5,017,937 |
Accumulated undistributed net realized gain (loss) on investments and foreign currency transactions | | 54,860,187 |
Net unrealized appreciation (depreciation) on investments and assets and liabilities in foreign currencies | | 177,472,744 |
Net Assets | | $1,136,037,261 |
See accompanying notes which are an integral part of the financial statements.
Annual Report
Financial Statements - continued
Statement of Assets and Liabilities - continued
October 31, 2004 |
| | |
Calculation of Maximum Offering Price
Class A:
Net Asset Value and redemption price per share
($13,277,823 ÷ 624,767 shares) | | $21.25 |
| | |
Maximum offering price per share (100/94.25 of $21.25) | | $22.55 |
Class T:
Net Asset Value and redemption price per share ($15,131,252 ÷ 713,891 shares) | | $21.20 |
| | |
Maximum offering price per share (100/96.50 of $21.20) | | $21.97 |
Class B:
Net Asset Value and offering price per share ($5,060,793 ÷ 241,137 shares) A | | $20.99 |
| | |
Class C:
Net Asset Value and offering price per share ($8,664,337 ÷ 411,711 shares) A | | $21.04 |
| | |
| | |
International Small Cap:
Net Asset Value, offering price and redemption price per share ($1,091,335,065 ÷ 51,091,331 shares) | | $21.36 |
| | |
Institutional Class:
Net Asset Value, offering price and redemption price per share ($2,567,991 ÷ 120,234 shares) | | $21.36 |
ARedemption price per share is equal to net asset value less any applicable contingent deferred sales charge.
See accompanying notes which are an integral part of the financial statements.
Annual Report
Statement of Operations
Year ended October 31, 2004 |
| | |
Investment Income | | |
Dividends (including $301,489 received from
affiliated issuers) | | $17,760,750 |
Interest | | 500,442 |
Security lending | | 1,159,171 |
| | 19,420,363 |
Less foreign taxes withheld | | (1,435,129) |
Total income | | 17,985,234 |
| | |
Expenses | | |
Management fee
Basic fee | $8,826,255 | |
Performance adjustment | 713,427 | |
Transfer agent fees | 2,181,571 | |
Distribution fees | 153,758 | |
Accounting and security lending fees | 516,934 | |
Non-interested trustees' compensation | 4,963 | |
Custodian fees and expenses | 574,790 | |
Registration fees | 266,493 | |
Audit | 41,794 | |
Legal | 19,756 | |
Interest | 2,571 | |
Miscellaneous | 54,905 | |
Total expenses before reductions | 13,357,217 | |
Expense reductions | (235,589) | 13,121,628 |
Net investment income (loss) | | 4,863,606 |
Realized and Unrealized Gain (Loss) Net realized gain (loss) on: | | |
Investment securities (Including realized gain (loss) of $(1,489,101) from affiliated issuers) | 55,896,770 | |
Foreign currency transactions | (196,336) | |
Total net realized gain (loss) | | 55,700,434 |
Change in net unrealized appreciation (depreciation) on: Investment securities | 104,967,642 | |
Assets and liabilities in foreign currencies | 20,845 | |
Total change in net unrealized appreciation (depreciation) | | 104,988,487 |
Net gain (loss) | | 160,688,921 |
Net increase (decrease) in net assets resulting from operations | | $165,552,527 |
See accompanying notes which are an integral part of the financial statements.
Annual Report
Financial Statements - continued
Statement of Changes in Net Assets
| Year ended
October 31,
2004 | Year ended
October 31,
2003 |
Increase (Decrease) in Net Assets | | |
Operations | | |
Net investment income (loss) | $4,863,606 | $516,714 |
Net realized gain (loss) | 55,700,434 | 11,443,482 |
Change in net unrealized appreciation (depreciation) | 104,988,487 | 72,481,971 |
Net increase (decrease) in net assets resulting
from operations | 165,552,527 | 84,442,167 |
Distributions to shareholders from net investment income | (740,885) | - |
Distributions to shareholders from net realized gain | (11,573,205) | (27,060) |
Total distributions | (12,314,090) | (27,060) |
Share transactions - net increase (decrease) | 422,159,706 | 470,607,516 |
Redemption fees | 1,900,450 | 290,434 |
Total increase (decrease) in net assets | 577,298,593 | 555,313,057 |
| | |
Net Assets | | |
Beginning of period | 558,738,668 | 3,425,611 |
End of period (including undistributed net investment income of $5,017,937 and undistributed net investment income of $614,412, respectively) | $1,136,037,261 | $558,738,668 |
See accompanying notes which are an integral part of the financial statements.
Annual Report
Financial Highlights - Class A
Years ended October 31, | 2004 | 2003 G |
Selected Per-Share Data | | |
Net asset value, beginning of period | $17.69 | $12.35 |
Income from Investment Operations | | |
Net investment income (loss) E | .02 | .02 F |
Net realized and unrealized gain (loss) | 3.83 | 5.30 |
Total from investment operations | 3.85 | 5.32 |
Distributions from net investment income | (.02) | - |
Distributions from net realized gain | (.31) | - |
Total distributions | (.33) | - |
Redemption fees added to paid in capital E | .04 | .02 |
Net asset value, end of period | $21.25 | $17.69 |
Total Return B, C, D | 22.36% | 43.24% |
Ratios to Average Net Assets H | | |
Expenses before expense reductions | 1.71% | 1.77% A |
Expenses net of voluntary waivers, if any | 1.71% | 1.77% A |
Expenses net of all reductions | 1.69% | 1.74% A |
Net investment income (loss) | .09% | .28% A |
Supplemental Data | | |
Net assets, end of period (000 omitted) | $13,278 | $4,960 |
Portfolio turnover rate | 77% | 84% A |
AAnnualized
BTotal returns for periods of less than one year are not annualized.
CTotal returns would have been lower had certain expenses not been reduced during the periods shown.
DTotal returns do not include the effect of the sales charges.
ECalculated based on average shares outstanding during the period.
FInvestment income per share reflects a special dividend which amounted to $.01 per share.
GFor the period May 27, 2003 (commencement of sale of shares) to October 31, 2003.
HExpense ratios reflect operating expenses of the class. Expenses before reductions do not reflect amounts reimbursed by the investment adviser or reductions from brokerage service arrangements or other expense offset arrangements and do not represent the amount paid by the class during periods when reimbursements or reductions occur. Expense ratios before reductions for start-up periods may not be representative of longer-term operating periods. Expenses net of any voluntary waivers reflect expenses after reimbursement by the investment adviser but prior to reductions from brokerage service arrangements or other expense offset arrangements. Expenses net of all reductions represent the net expenses paid by the class.
See accompanying notes which are an integral part of the financial statements.
Annual Report
Financial Highlights - Class T
Years ended October 31, | 2004 | 2003 G |
Selected Per-Share Data | | |
Net asset value, beginning of period | $17.68 | $12.35 |
Income from Investment Operations | | |
Net investment income (loss) E | (.03) | -F,I |
Net realized and unrealized gain (loss) | 3.83 | 5.31 |
Total from investment operations | 3.80 | 5.31 |
Distributions from net investment income | (.01) | - |
Distributions from net realized gain | (.31) | - |
Total distributions | (.32) | - |
Redemption fees added to paid in capital E | .04 | .02 |
Net asset value, end of period | $21.20 | $17.68 |
Total Return B,C,D | 22.07% | 43.16% |
Ratios to Average Net AssetsH | | |
Expenses before expense reductions | 1.94% | 2.12% A |
Expenses net of voluntary waivers, if any | 1.94% | 2.12% A |
Expenses net of all reductions | 1.92% | 2.09% A |
Net investment income (loss) | (.14)% | (.07)%A |
Supplemental Data | | |
Net assets, end of period (000 omitted) | $15,131 | $3,990 |
Portfolio turnover rate | 77% | 84% A |
AAnnualized
BTotal returns for periods of less than one year are not annualized.
CTotal returns would have been lower had certain expenses not been reduced during the periods shown.
DTotal returns do not include the effect of the sales charges.
ECalculated based on average shares outstanding during the period.
FInvestment income per share reflects a special dividend which amounted to $.01 per share.
GFor the period May 27, 2003 (commencement of sale of shares) to October 31, 2003.
HExpense ratios reflect operating expenses of the class. Expenses before reductions do not reflect amounts reimbursed by the investment adviser or reductions from brokerage service arrangements or other expense offset arrangements and do not represent the amount paid by the class during periods when reimbursements or reductions occur. Expense ratios before reductions for start-up periods may not be representative of longer-term operating periods. Expenses net of any voluntary waivers reflect expenses after reimbursement by the investment adviser but prior to reductions from brokerage service arrangements or other expense offset arrangements. Expenses net of all reductions represent the net expenses paid by the class.
IAmount represents less than $.01 per share.
See accompanying notes which are an integral part of the financial statements.
Annual Report
Financial Highlights - Class B
Years ended October 31, | 2004 | 2003 G |
Selected Per-Share Data | | |
Net asset value, beginning of period | $17.62 | $12.35 |
Income from Investment Operations | | |
Net investment income (loss) E | (.16) | (.05) F |
Net realized and unrealized gain (loss) | 3.80 | 5.30 |
Total from investment operations | 3.64 | 5.25 |
Distributions from net realized gain | (.31) | - |
Redemption fees added to paid in capital E | .04 | .02 |
Net asset value, end of period | $20.99 | $17.62 |
Total Return B, C, D | 21.21% | 42.67% |
Ratios to Average Net Assets H | | |
Expenses before expense reductions | 2.63% | 2.76% A |
Expenses net of voluntary waivers, if any | 2.63% | 2.76%A |
Expenses net of all reductions | 2.60% | 2.73%A |
Net investment income (loss) | (.83)% | (.71)%A |
Supplemental Data | | |
Net assets, end of period (000 omitted) | $5,061 | $1,016 |
Portfolio turnover rate | 77% | 84%A |
AAnnualized
BTotal returns for periods of less than one year are not annualized.
CTotal returns would have been lower had certain expenses not been reduced during the periods shown.
DTotal returns do not include the effect of the contingent deferred sales charge.
ECalculated based on average shares outstanding during the period.
FInvestment income per share reflects a special dividend which amounted to $.01 per share.
GFor the period May 27, 2003 (commencement of sale of shares) to October 31, 2003.
HExpense ratios reflect operating expenses of the class. Expenses before reductions do not reflect amounts reimbursed by the investment adviser or reductions from brokerage service arrangements or other expense offset arrangements and do not represent the amount paid by the class during periods when reimbursements or reductions occur. Expense ratios before reductions for start-up periods may not be representative of longer-term operating periods. Expenses net of any voluntary waivers reflect expenses after reimbursement by the investment adviser but prior to reductions from brokerage service arrangements or other expense offset arrangements. Expenses net of all reductions represent the net expenses paid by the class.
See accompanying notes which are an integral part of the financial statements.
Annual Report
Financial Highlights - Class C
Years ended October 31, | 2004 | 2003 G |
Selected Per-Share Data | | |
Net asset value, beginning of period | $17.64 | $12.35 |
Income from Investment Operations | | |
Net investment income (loss) E | (.12) | (.04) F |
Net realized and unrealized gain (loss) | 3.80 | 5.31 |
Total from investment operations | 3.68 | 5.27 |
Distributions from net investment income | (.01) | - |
Distributions from net realized gain | (.31) | - |
Total distributions | (.32) | - |
Redemption fees added to paid in capital E | .04 | .02 |
Net asset value, end of period | $21.04 | $17.64 |
Total Return B, C, D | 21.43% | 42.83% |
Ratios to Average Net Assets H | | |
Expenses before expense reductions | 2.43% | 2.57% A |
Expenses net of voluntary waivers, if any | 2.43% | 2.57% A |
Expenses net of all reductions | 2.40% | 2.55% A |
Net investment income (loss) | (.62)% | (.52)%A |
Supplemental Data | | |
Net assets, end of period (000 omitted) | $8,664 | $1,383 |
Portfolio turnover rate | 77% | 84% A |
AAnnualized
BTotal returns for periods of less than one year are not annualized.
CTotal returns would have been lower had certain expenses not been reduced during the periods shown.
DTotal returns do not include the effect of the contingent deferred sales charge.
ECalculated based on average shares outstanding during the period.
FInvestment income per share reflects a special dividend which amounted to $.01 per share.
GFor the period May 27, 2003 (commencement of sale of shares) to October 31, 2003.
HExpense ratios reflect operating expenses of the class. Expenses before reductions do not reflect amounts reimbursed by the investment adviser or reductions from brokerage service arrangements or other expense offset arrangements and do not represent the amount paid by the class during periods when reimbursements or reductions occur. Expense ratios before reductions for start-up periods may not be representative of longer-term operating periods. Expenses net of any voluntary waivers reflect expenses after reimbursement by the investment adviser but prior to reductions from brokerage service arrangements or other expense offset arrangements. Expenses net of all reductions represent the net expenses paid by the class.
See accompanying notes which are an integral part of the financial statements.
Annual Report
Financial Highlights - International Small Cap
Years ended October 31, | 2004 | 2003 | 2002 F |
Selected Per-Share Data | | | |
Net asset value, beginning of period | $17.71 | $9.87 | $10.00 |
Income from Investment Operations | | | |
Net investment income (loss) D | .10 | .07 E | (.01) |
Net realized and unrealized gain (loss) | 3.84 | 7.75 | (.12) |
Total from investment operations | 3.94 | 7.82 | (.13) |
Distributions from net investment income | (.02) | - | - |
Distributions from net realized gain | (.31) | (.02) | - |
Total distributions | (.33) | (.02) | - |
Redemption fees added to paid in capital D | .04 | .04 | - H |
Net asset value, end of period | $21.36 | $17.71 | $9.87 |
Total Return B, C | 22.84% | 79.78% | (1.30)% |
Ratios to Average Net Assets G | | | |
Expenses before expense reductions | 1.30% | 1.54% | 13.70% A |
Expenses net of voluntary waivers, if any | 1.30% | 1.54% | 1.80% A |
Expenses net of all reductions | 1.28% | 1.51% | 1.80% A |
Net investment income (loss) | .50% | .46% | (.56)% A |
Supplemental Data | | | |
Net assets, end of period (000 omitted) | $1,091,335 | $546,989 | $3,426 |
Portfolio turnover rate | 77% | 84% | 85% A |
AAnnualized
BTotal returns for periods of less than one year are not annualized.
CTotal returns would have been lower had certain expenses not been reduced during the periods shown.
DCalculated based on average shares outstanding during the period.
EInvestment income per share reflects a special dividend which amounted to $.03 per share.
FFor the period September 18, 2002 (commencement of operations) to October 31, 2002.
GExpense ratios reflect operating expenses of the class. Expenses before reductions do not reflect amounts reimbursed by the investment adviser or reductions from brokerage service arrangements or other expense offset arrangements and do not represent the amount paid by the class during periods when reimbursements or reductions occur. Expense ratios before reductions for start-up periods may not be representative of longer-term operating periods. Expenses net of any voluntary waivers reflect expenses after reimbursement by the investment adviser but prior to reductions from brokerage service arrangements or other expense offset arrangements. Expenses net of all reductions represent the net expenses paid by the class.
HAmount represents less than $.01 per share.
See accompanying notes which are an integral part of the financial statements.
Annual Report
Financial Highlights - Institutional Class
Years ended October 31, | 2004 | 2003 F |
Selected Per-Share Data | | |
Net asset value, beginning of period | $17.72 | $12.35 |
Income from Investment Operations | | |
Net investment income (loss) D | .10 | .04 E |
Net realized and unrealized gain (loss) | 3.84 | 5.31 |
Total from investment operations | 3.94 | 5.35 |
Distributions from net investment income | (.03) | - |
Distributions from net realized gain | (.31) | - |
Total distributions | (.34) | - |
Redemption fees added to paid in capital D | .04 | .02 |
Net asset value, end of period | $21.36 | $17.72 |
Total Return B, C | 22.84% | 43.48% |
Ratios to Average Net Assets G | | |
Expenses before expense reductions | 1.32% | 1.51% A |
Expenses net of voluntary waivers, if any | 1.32% | 1.51% A |
Expenses net of all reductions | 1.29% | 1.48% A |
Net investment income (loss) | .49% | .54% A |
Supplemental Data | | |
Net assets, end of period (000 omitted) | $2,568 | $401 |
Portfolio turnover rate | 77% | 84% A |
AAnnualized
BTotal returns for periods of less than one year are not annualized.
CTotal returns would have been lower had certain expenses not been reduced during the periods shown.
DCalculated based on average shares outstanding during the period.
EInvestment income per share reflects a special dividend which amounted to $.01 per share.
FFor the period May 27, 2003 (commencement of sale of shares) to October 31, 2003.
GExpense ratios reflect operating expenses of the class. Expenses before reductions do not reflect amounts reimbursed by the investment adviser or reductions from brokerage service arrangements or other expense offset arrangements and do not represent the amount paid by the class during periods when reimbursements or reductions occur. Expense ratios before reductions for start-up periods may not be representative of longer-term operating periods. Expenses net of any voluntary waivers reflect expenses after reimbursement by the investment adviser but prior to reductions from brokerage service arrangements or other expense offset arrangements. Expenses net of all reductions represent the net expenses paid by the class.
See accompanying notes which are an integral part of the financial statements.
Annual Report
Notes to Financial Statements
For the period ended October 31, 2004
1. Significant Accounting Policies.
Fidelity International Small Cap Fund (the fund) is a fund of Fidelity Investment Trust (the trust) and is authorized to issue an unlimited number of shares. The trust is registered under the Investment Company Act of 1940, as amended (the 1940 Act), as an open-end management investment company organized as a Massachusetts business trust.
The fund offers Class A, Class T, Class B, Class C, International Small Cap (the original class), and Institutional Class shares, each of which has equal rights as to assets and voting privileges. Each class has exclusive voting rights with respect to matters that affect that class. Class B shares will automatically convert to Class A shares after a holding period of seven years from the initial date of purchase. Investment income, realized and unrealized capital gains and losses, the common expenses of the fund, and certain fund-level expense reductions, if any, are allocated on a pro rata basis to each class based on the relative net assets of each class to the total net assets of the fund. Each class differs with respect to transfer agent and distribution and service plan fees incurred. Certain expense reductions also differ by class.
The financial statements have been prepared in conformity with accounting principles generally accepted in the United States of America, which require management to make certain estimates and assumptions at the date of the financial statements. The following summarizes the significant accounting policies of the fund:
Security Valuation. Net asset value per share (NAV calculation) is calculated as of the close of business of the New York Stock Exchange, normally 4:00 p.m. Eastern time. Equity securities, including restricted securities, for which market quotations are available are valued at the last sale price or official closing price (closing bid price or last evaluated quote if no sale has occurred) on the primary market or exchange on which they trade. Debt securities, including restricted securities, for which quotations are readily available are valued at their most recent bid prices (sales prices if the principal market is an exchange) in the principal market in which such securities are normally traded, as determined by recognized dealers in such securities, or securities are valued on the basis of information provided by a pricing service. Pricing services use valuation matrices that incorporate both dealer-supplied valuations and valuation models. If prices are not readily available or do not accurately reflect fair value for a security, or if a security's value has been materially affected by events occurring after the close of the exchange or market on which the security is principally traded, that security may be valued by another method that the Board of Trustees believes accurately reflects fair value. A security's valuation may differ depending on the method used for determining value. Price movements in futures contracts and ADRs, market and trading trends, the bid/ask quotes of brokers and off-exchange institutional trading may be reviewed in the course of making a good faith determination of a security's fair value. Short-term securities with remaining maturities of sixty days or less for which quotations are not readily
Annual Report
Notes to Financial Statements - continued
1. Significant Accounting Policies - continued
Security Valuation - continued
available are valued on the basis of amortized cost. Investments in open-end investment companies are valued at their net asset value each business day.
Foreign Currency. The fund uses foreign currency contracts to facilitate transactions in foreign-denominated securities. Losses from these transactions may arise from changes in the value of the foreign currency or if the counterparties do not perform under the contracts' terms.
Foreign-denominated assets, including investment securities, and liabilities are translated into U.S. dollars at the exchange rate at period end. Purchases and sales of investment securities, income and dividends received and expenses denominated in foreign currencies are translated into U.S. dollars at the exchange rate in effect on the transaction date.
The effects of exchange rate fluctuations on investments are included with the net realized and unrealized gain (loss) on investment securities. Other foreign currency transactions resulting in realized and unrealized gain (loss) are disclosed separately.
Investment Transactions and Income. Security transactions are accounted for as of trade date. Gains and losses on securities sold are determined on the basis of identified cost and may include proceeds received from litigation. Dividend income is recorded on the ex-dividend date, except for certain dividends from foreign securities where the ex-dividend date may have passed, which are recorded as soon as the fund is informed of the ex-dividend date. Non-cash dividends included in dividend income, if any, are recorded at the fair market value of the securities received. Interest income is accrued as earned. Interest income includes coupon interest and amortization of premium and accretion of discount on debt securities. Investment income is recorded net of foreign taxes withheld where recovery of such taxes is uncertain.
Expenses. Most expenses of the trust can be directly attributed to a fund. Expenses which cannot be directly attributed are apportioned among the funds in the trust.
Income Tax Information and Distributions to Shareholders. Each year, the fund intends to qualify as a regulated investment company by distributing all of its taxable income and realized gains under Subchapter M of the Internal Revenue Code. As a result, no provision for income taxes is required in the accompanying financial statements. Foreign taxes are provided for based on the fund's understanding of the tax rules and rates that exist in the foreign markets in which it invests.
Annual Report
1. Significant Accounting Policies - continued
Income Tax Information and Distributions to Shareholders - continued
Distributions are recorded on the ex-dividend date. Income dividends and capital gain distributions are declared separately for each class. Income and capital gain distributions are determined in accordance with income tax regulations, which may differ from generally accepted accounting principles. In addition, the fund will claim a portion of the payment made to redeeming shareholders as a distribution for income tax purposes.
Capital accounts within the financial statements are adjusted for permanent book-tax differences. These adjustments have no impact on net assets or the results of operations. Temporary book-tax differences will reverse in a subsequent period.
Book-tax differences are primarily due to foreign currency transactions, passive foreign investment companies (PFIC) and losses deferred due to wash sales.
The tax-basis components of distributable earnings and the federal tax cost as of period end were as follows:
Unrealized appreciation | $217,728,209 | |
Unrealized depreciation | (43,208,604) | |
Net unrealized appreciation (depreciation) | 174,519,605 | |
Undistributed ordinary income | 30,238,812 | |
Undistributed long-term capital gain | 18,049,009 | |
| | |
Cost for federal income tax purposes | $1,017,236,913 | |
The tax character of distributions paid was as follows:
| October 31,
2004 | October 31,
2003 |
Ordinary Income | $12,314,090 | $ 27,060 |
Short-Term Trading (Redemption) Fees. Shares held in the fund less than 90 days are subject to a redemption fee equal to 2.00% of the proceeds of the redeemed shares. All redemption fees, including any estimated redemption fees paid by Fidelity Management & Research Company (FMR), are retained by the fund and accounted for as an addition to paid in capital.
Annual Report
Notes to Financial Statements - continued
2. Operating Policies.
Repurchase Agreements. FMR has received an Exemptive Order from the Securities and Exchange Commission (the SEC) which permits the fund and other affiliated entities of FMR to transfer uninvested cash balances into joint trading accounts. These accounts are then invested in repurchase agreements that are collateralized by U.S. Treasury or Government obligations. The fund may also invest directly with institutions, in repurchase agreements that are collateralized by commercial paper obligations and corporate obligations. Collateral is held in segregated accounts with custodian banks and may be obtained in the event of a default of the counterparty. Collateral is marked-to-market daily and maintained at a value at least equal to the principal amount of the repurchase agreement (including accrued interest).
Restricted Securities. The fund may invest in securities that are subject to legal or contractual restrictions on resale. These securities generally may be resold in transactions exempt from registration or to the public if the securities are registered. Disposal of these securities may involve time-consuming negotiations and expense, and prompt sale at an acceptable price may be difficult. Information regarding restricted securities is included at the end of the fund's Schedule of Investments.
3. Purchases and Sales of Investments.
Purchases and sales of securities, other than short-term securities and U.S. government securities, aggregated $1,186,404,079 and $735,977,091, respectively.
4. Fees and Other Transactions with Affiliates.
Management Fee. FMR and its affiliates provide the fund with investment management related services for which the fund pays a monthly management fee. The management fee is the sum of an individual fund fee rate that is based on an annual rate of .60% of the fund's average net assets and a group fee rate that averaged .28% during the period. The group fee rate is based upon the average net assets of all the mutual funds advised by FMR. The group fee rate decreases as assets under management increase and increases as assets under management decrease. In addition, the management fee is subject to a performance adjustment (up to a maximum of ±.20% of the fund's average net assets over a 36 month performance period). The upward or downward adjustment to the management fee is based on the investment performance of the asset-weighted return of all classes as compared to an appropriate benchmark index. For the period, the total annual management fee rate, including the performance adjustment, was .94% of the fund's average net assets.
Annual Report
4. Fees and Other Transactions with Affiliates - continued
Distribution and Service Plan. In accordance with Rule 12b-1 of the 1940 Act, the Fund has adopted separate Distribution and Service Plans for each class of shares. Certain classes pay Fidelity Distributors Corporation (FDC), an affiliate of FMR, separate Distribution and Service Fees, each of which is based on an annual percentage of each class' average net assets. In addition, FDC may pay financial intermediaries for selling shares of the fund and providing shareholder support services. For the period, the Distribution and Service Fee rates and the total amounts paid to and retained by FDC were as follows:
| Distribution
Fee | Service
Fee | Paid to
FDC | Retained
by FDC |
Class A | 0% | .25% | $20,474 | $325 |
Class T | .25% | .25% | 49,312 | 539 |
Class B | .75% | .25% | 31,386 | 23,852 |
Class C | .75% | .25% | 52,586 | 37,268 |
| | | $153,758 | $61,984 |
Sales Load. FDC receives a front-end sales charge of up to 5.75% for selling Class A shares, and 3.50% for selling Class T shares, some of which is paid to financial intermediaries for selling shares of the fund. FDC receives the proceeds of contingent deferred sales charges levied on Class A, Class T, Class B, and Class C redemptions. These charges depend on the holding period. The deferred sales charges range from 5% to 1% for Class B, 1% for Class C, and .25% for certain purchases of Class A and Class T shares.
For the period, sales charge amounts retained by FDC were as follows:
| Retained
by FDC | |
Class A | $29,979 | |
Class T | 10,916 | |
Class B * | 3,470 | |
Class C * | 5,990 | |
| $50,355 | |
*When Class B and Class C shares are initially sold, FDC pays commissions from its own resources to financial intermediaries through which the sales are made.
Annual Report
Notes to Financial Statements - continued
4. Fees and Other Transactions with Affiliates - continued
Transfer Agent Fees. Fidelity Investments Institutional Operations Company, Inc. (FIIOC), an affiliate of FMR, is the transfer, dividend disbursing and shareholder servicing agent for each class of the fund, except for International Small Cap. Fidelity Service Company, Inc. (FSC), an affiliate of FMR, is the transfer agent for International Small Cap shares. FIIOC and FSC receive account fees and asset-based fees that vary according to the account size and type of account of the shareholders of the respective classes of the fund. FIIOC and FSC pay for typesetting, printing and mailing of shareholder reports, except proxy statements. For the period the total transfer agent fees paid by each class to FIIOC or FSC, were as follows:
| Amount | % of
Average
Net Assets |
Class A | $30,826 | .37 |
Class T | 35,396 | .36 |
Class B | 17,158 | .54 |
Class C | 18,101 | .34 |
International Small Cap | 2,076,187 | .21 |
Institutional Class | 3,903 | .23 |
| $2,181,571 | |
Accounting and Security Lending Fees. FSC maintains the fund's accounting records. The accounting fee is based on the level of average net assets for the month. Under a separate contract, FSC administers the security lending program. The security lending fee is based on the number and duration of lending transactions.
Central Funds. The fund may invest in affiliated Central Funds managed by Fidelity Investments Money Management, Inc. (FIMM), an affiliate of FMR. The Central Funds are open-end investment companies available only to investment companies and other accounts managed by FMR and its affiliates. The Central Funds seek preservation of capital and current income and do not pay a management fee. Income distributions earned by the fund are recorded as income in the accompanying financial statements and totaled $459,974 for the period.
Brokerage Commissions. The fund placed a portion of its portfolio transactions with brokerage firms which are affiliates of the investment adviser. The commissions paid to these affiliated firms were $2 for the period.
Annual Report
4. Fees and Other Transactions with Affiliates - continued
Interfund Lending Program. Pursuant to an Exemptive Order issued by the SEC, the fund, along with other registered investment companies having management contracts with FMR, may participate in an interfund lending program. This program provides an alternative credit facility allowing the funds to borrow from, or lend money to, other participating funds. At period end, there were no interfund loans outstanding. The fund's activity in this program during the period was as follows:
Borrower or Lender | Average Daily Loan Balance | Weighted Average Interest Rate | Interest Expense |
Borrower | $27,505,333 | 1.12% | $2,571 |
5. Committed Line of Credit.
The fund participates with other funds managed by FMR in a $4.2 billion credit facility (the "line of credit") to be utilized for temporary or emergency purposes to fund shareholder redemptions or for other short-term liquidity purposes. The fund has agreed to pay commitment fees on its pro rata portion of the line of credit. During the period, there were no borrowings on this line of credit.
6. Security Lending.
The fund lends portfolio securities from time to time in order to earn additional income. The fund receives collateral (in the form of U.S. Treasury obligations, letters of credit and/or cash) against the loaned securities and maintains collateral in an amount not less than 100% of the market value of the loaned securities during the period of the loan. The market value of the loaned securities is determined at the close of business of the fund and any additional required collateral is delivered to the fund on the next business day. If the borrower defaults on its obligation to return the securities loaned because of insolvency or other reasons, a fund could experience delays and costs in recovering the securities loaned or in gaining access to the collateral. Cash collateral is invested in cash equivalents. The value of loaned securities and cash collateral at period end are disclosed on the fund's Statement of Assets and Liabilities.
Annual Report
Notes to Financial Statements - continued
7. Expense Reductions.
Many of the brokers with whom FMR places trades on behalf of the fund provided services to the fund in addition to trade execution. These services included payments of certain expenses on behalf of the fund totaling $231,874 for the period. In addition, through arrangements with the fund's custodian, credits realized as a result of uninvested cash balances were used to reduce the fund's expenses. During the period, these credits reduced the fund's custody expenses by $3,715.
8. Distributions to Shareholders.
Distributions to shareholders of each class were as follows:
| Years ended October 31, |
| 2004 | 2003 |
From net investment income | | |
Class A | $3,252 | $- |
Class T | 2,950 | - |
Class C | 1,354 | - |
International Small Cap | 732,332 | - |
Institutional Class | 997 | - |
Total | $740,885 | $- |
From net realized gain | | |
Class A | $50,399 | $- |
Class T | 91,451 | - |
Class B | 28,049 | - |
Class C | 41,980 | - |
International Small Cap | 11,351,027 | 27,060 |
Institutional Class | 10,299 | - |
Total | $11,573,205 | $27,060 |
Annual Report
9. Share Transactions.
Transactions for each class of shares were as follows:
| Shares
Years ended October 31, | Dollars
Years ended October 31, |
| 2004 | 2003 A | 2004 | 2003 A |
Class A | | | | |
Shares sold | 655,161 | 287,827 | $12,872,993 | $4,774,574 |
Reinvestment of distributions | 2,641 | - | 46,931 | - |
Shares redeemed | (313,383) | (7,479) | (5,810,697) | (125,524) |
Net increase (decrease) | 344,419 | 280,348 | $7,109,227 | $4,649,050 |
Class T | | | | |
Shares sold | 729,426 | 229,190 | $14,388,966 | $3,468,992 |
Reinvestment of distributions | 4,802 | - | 85,378 | - |
Shares redeemed | (246,002) | (3,525) | (4,796,147) | (55,853) |
Net increase (decrease) | 488,226 | 225,665 | $9,678,197 | $3,413,139 |
Class B | | | | |
Shares sold | 254,206 | 60,233 | $4,980,844 | $911,644 |
Reinvestment of distributions | 1,477 | - | 26,163 | - |
Shares redeemed | (72,209) | (2,570) | (1,405,301) | (40,678) |
Net increase (decrease) | 183,474 | 57,663 | $3,601,706 | $870,966 |
Class C | | | | |
Shares sold | 412,202 | 88,372 | $8,031,151 | $1,388,024 |
Reinvestment of distributions | 2,245 | - | 39,811 | - |
Shares redeemed | (81,166) | (9,942) | (1,589,819) | (158,911) |
Net increase (decrease) | 333,281 | 78,430 | $6,481,143 | $1,229,113 |
International Small Cap | | | | |
Shares sold | 48,249,110 | 32,919,552 | $942,554,096 | $492,932,712 |
Reinvestment of distributions | 631,834 | 2,491 | 11,252,965 | 25,785 |
Shares redeemed | (28,670,350) | (2,388,222) | (560,463,897) | (32,859,600) |
Net increase (decrease) | 20,210,594 | 30,533,821 | $393,343,164 | $460,098,897 |
Institutional Class | | | | |
Shares sold | 181,090 | 23,006 | $3,601,810 | $351,524 |
Reinvestment of distributions | 290 | - | 5,166 | - |
Shares redeemed | (83,756) | (396) | (1,660,707) | (5,173) |
Net increase (decrease) | 97,624 | 22,610 | $1,946,269 | $346,351 |
AShare transactions for Class A, Class T, Class B, Class C and Institutional Class are for the period May 27, 2003 (commencement of sale of shares) to October 31, 2003.
Annual Report
Report of Independent Registered Public Accounting Firm
To the Trustees of Fidelity Investment Trust and Shareholders of Fidelity International Small Cap Fund:
We have audited the accompanying statement of assets and liabilities of Fidelity International Small Cap Fund (the Fund), a fund of Fidelity Investment Trust, including the portfolio of investments, as of October 31, 2004, and the related statement of operations for the year then ended, the statement of changes in net assets for each of the two years in the period then ended, and the financial highlights for each of the three years in the period then ended. These financial statements and financial highlights are the responsibility of the Fund's management. Our responsibility is to express an opinion on these financial statements and financial highlights based on our audits.
We conducted our audits in accordance with standards of the Public Company Accounting Oversight Board (United States). Those standards require that we plan and perform the audit to obtain reasonable assurance about whether the financial statements and financial highlights are free of material misstatement. An audit includes examining, on a test basis, evidence supporting the amounts and disclosures in the financial statements. Our procedures included confirmation of securities owned as of October 31, 2004, by correspondence with the custodian and brokers; where replies were not received from brokers, we performed other auditing procedures. An audit also includes assessing the accounting principles used and significant estimates made by management, as well as evaluating the overall financial statement presentation. We believe that our audits provide a reasonable basis for our opinion.
In our opinion, the financial statements and financial highlights referred to above present fairly, in all material respects, the financial position of Fidelity International Small Cap Fund as of October 31, 2004, the results of its operations for the year then ended, the changes in its net assets for each of the two years in the period then ended, and its financial highlights for each of the three years in the period then ended, in conformity with accounting principles generally accepted in the United States of America.
/s/DELOITTE & TOUCHE LLP
DELOITTE & TOUCHE LLP
Boston, Massachusetts
December 17, 2004
Annual Report
Trustees and Officers
The Trustees, Members of the Advisory Board, and executive officers of the trust and fund, as applicable, are listed below. The Board of Trustees governs the fund and is responsible for protecting the interests of shareholders. The Trustees are experienced executives who meet periodically throughout the year to oversee the fund's activities, review contractual arrangements with companies that provide services to the fund, and review the fund's performance. Except for William O. McCoy, each of the Trustees oversees 298 funds advised by FMR or an affiliate. Mr. McCoy oversees 300 funds advised by FMR or an affiliate.
The Trustees hold office without limit in time except that (a) any Trustee may resign; (b) any Trustee may be removed by written instrument, signed by at least two-thirds of the number of Trustees prior to such removal; (c) any Trustee who requests to be retired or who has become incapacitated by illness or injury may be retired by written instrument signed by a majority of the other Trustees; and (d) any Trustee may be removed at any special meeting of shareholders by a two-thirds vote of the outstanding voting securities of the trust. In any event, each non-interested Trustee shall retire not later than the last day of the calendar year in which his or her 72nd birthday occurs. The executive officers and Advisory Board Members hold office without limit in time, except that any officer and Advisory Board Member may resign or may be removed by a vote of a majority of the Trustees at any regular meeting or any special meeting of the Trustees. Except as indicated, each individual has held the office shown or other offices in the same company for the past five years.
The fund's Statement of Additional Information (SAI) includes more information about the Trustees. To request a free copy, call Fidelity at 1-877-208-0098.
Interested Trustees*:
Correspondence intended for each Trustee who is an "interested person" (as defined in the 1940 Act) may be sent to Fidelity Investments, 82 Devonshire Street, Boston, Massachusetts 02109.
Name, Age; Principal Occupation |
Edward C. Johnson 3d (74)** |
| Year of Election or Appointment: 1984 Mr. Johnson is Chairman of the Board of Trustees. Mr. Johnson serves as Chief Executive Officer, Chairman, and a Director of FMR Corp.; a Director and Chairman of the Board and of the Executive Committee of FMR; Chairman and a Director of Fidelity Management & Research (Far East) Inc.; Chairman (1998) and a Director of Fidelity Investments Money Management, Inc.; and Chairman (2001) and a Director (2000) of FMR Co., Inc. |
Abigail P. Johnson (42)** |
| Year of Election or Appointment: 2001 Senior Vice President of the fund (2002). Ms. Johnson also serves as Senior Vice President of other Fidelity funds (2001). She is President and a Director of FMR (2001), Fidelity Investments Money Management, Inc. (2001), FMR Co., Inc. (2001), and a Director of FMR Corp. Previously, Ms. Johnson managed a number of Fidelity funds. |
Laura B. Cronin (50) |
| Year of Election or Appointment: 2003 Ms. Cronin is an Executive Vice President (2002) and Chief Financial Officer (2002) of FMR Corp. and is a member of the Fidelity Management Committee (2003). Previously, Ms. Cronin served as Vice President of Finance of FMR (1997-1999), and Chief Financial Officer of FMR (1999-2001), Fidelity Personal Investments (2001), and Fidelity Brokerage Company (2001-2002). |
Robert L. Reynolds (52) |
| Year of Election or Appointment: 2003 Mr. Reynolds is a Director (2003) and Chief Operating Officer (2002) of FMR Corp. and is the head of the Fidelity Management Committee (2003). He also serves on the Board at Fidelity Investments Canada, Ltd. (2000). Previously, Mr. Reynolds served as President of Fidelity Investments Institutional Retirement Group (1996-2000). |
*Trustees have been determined to be "Interested Trustees" by virtue of, among other things, their affiliation with the trust or various entities under common control with FMR.
**Edward C. Johnson 3d, Trustee, is Abigail P. Johnson's father.
Annual Report
Non-Interested Trustees:
Correspondence intended for each non-interested Trustee (that is, the Trustees other than the Interested Trustees) may be sent to Fidelity Investments, P.O. Box 55235, Boston, Massachusetts 02205-5235.
Name, Age; Principal Occupation |
J. Michael Cook (62) |
| Year of Election or Appointment: 2001 Prior to Mr. Cook's retirement in May 1999, he served as Chairman and Chief Executive Officer of Deloitte & Touche LLP (accounting/consulting), Chairman of the Deloitte & Touche Foundation, and a member of the Board of Deloitte Touche Tohmatsu. He currently serves as a Director of Comcast (telecommunications, 2002), International Flavors & Fragrances, Inc. (2000), The Dow Chemical Company (2000), and Northrop Grumman Corporation (global defense technology, 2003). He is a Member of the Diversity Advisory Council of Marakon (2003) and the Advisory Council of the Public Company Accounting Oversight Board (PCAOB), Chairman Emeritus of the Board of Catalyst (a leading organization for the advancement of women in business), and is Chairman of the Accountability Advisory Council to the Comptroller General of the United States. He also serves as a Member of the Advisory Board of the Graduate School of Business of the University of Florida, his alma mater. |
Ralph F. Cox (72) |
| Year of Election or Appointment: 1991 Mr. Cox is President of RABAR Enterprises (management consulting for the petroleum industry). Prior to February 1994, he was President of Greenhill Petroleum Corporation (petroleum exploration and production). Until March 1990, Mr. Cox was President and Chief Operating Officer of Union Pacific Resources Company (exploration and production). He is a Director of CH2M Hill Companies (engineering), and Abraxas Petroleum (petroleum exploration and production, 1999). In addition, he is a member of advisory boards of Texas A&M University and the University of Texas at Austin. |
Robert M. Gates (61) |
| Year of Election or Appointment: 1997 Dr. Gates is President of Texas A&M University (2002). He was Director of the Central Intelligence Agency (CIA) from 1991 to 1993. From 1989 to 1991, Dr. Gates served as Assistant to the President of the United States and Deputy National Security Advisor. Dr. Gates is a Director of NACCO Industries, Inc. (mining and manufacturing), Parker Drilling Co., Inc. (drilling and rental tools for the energy industry, 2001), and Brinker International (restaurant management, 2003). He also serves as a member of the Advisory Board of VoteHere.net (secure Internet voting, 2001). Previously, Dr. Gates served as a Director of LucasVarity PLC (automotive components and diesel engines), a Director of TRW Inc. (automotive, space, defense, and information technology), and Dean of the George Bush School of Government and Public Service at Texas A&M University (1999-2001). Dr. Gates also is a Trustee of the Forum for International Policy. |
George H. Heilmeier (68) |
| Year of Election or Appointment: 2004 Dr. Heilmeier is Chairman Emeritus of Telcordia Technologies (communication software and systems), where prior to his retirement, he served as company Chairman and Chief Executive Officer. He currently serves on the Boards of Directors of The Mitre Corporation (systems engineering and information technology support for the government), INET Technologies Inc. (telecommunications network surveillance, 2001), Teletech Holdings (customer management services), and and HRL Laboratories (private research and development, 2004). He is Chairman of the General Motors Technology Advisory Committee and a Life Fellow of the Institute of Electrical and Electronics Engineers (IEEE) (2000). Dr. Heilmeier is a member of the Defense Science Board and the National Security Agency Advisory Board. He is also a member
of the National Academy of Engineering, the American Academy of Arts and Sciences, and the Board of Overseers of the School of Engineering and Applied Science of the University of Pennsylvania. Previously, Dr. Heilmeier served as a Director of TRW Inc. (automotive, space, defense, and information technology, 1992-2002), Compaq (1994-2002), and Automatic Data Processing, Inc. (ADP) (technology-based business outsourcing, 1995-2002). |
Donald J. Kirk (71) |
| Year of Election or Appointment: 1987 Mr. Kirk is a Governor of the American Stock Exchange (2001), a Trustee and former Chairman of the Board of Trustees of the Greenwich Hospital Association, a Director of the Yale-New Haven Health Services Corp. (1998), and a Director Emeritus and former Chairman of the Board of Directors of National Arts Strategies Inc. (leadership education for arts and culture). Mr. Kirk was an Executive-in-Residence (1995-2000) and a Professor (1987-1995) at Columbia University Graduate School of Business. Prior to 1987, he was Chairman of the Financial Accounting Standards Board. Previously, Mr. Kirk served as a Governor of the National Association of Securities Dealers, Inc. (1996-2002), a member and Vice Chairman of the Public Oversight Board of the American Institute of Certified Public Accountants' SEC Practice Section (1995-2002), a Director of General Re Corporation (reinsurance, 1987-1998) and as a Director of Valuation Research Corp. (appraisals and valuations). |
Marie L. Knowles (58) |
| Year of Election or Appointment: 2001 Prior to Ms. Knowles' retirement in June 2000, she served as Executive Vice President and Chief Financial Officer of Atlantic Richfield Company (ARCO) (diversified energy, 1996-2000). From 1993 to 1996, she was a Senior Vice President of ARCO and President of ARCO Transportation Company. She served as a Director of ARCO from 1996 to 1998. She currently serves as a Director of Phelps Dodge Corporation (copper mining and manufacturing) and McKesson Corporation (healthcare service, 2002). Ms. Knowles is a Trustee of the Brookings Institution and the Catalina Island Conservancy and also serves as a member of the Advisory Board for the School of Engineering of the University of Southern California. |
Ned C. Lautenbach (60) |
| Year of Election or Appointment: 2000 Mr. Lautenbach has been a partner of Clayton, Dubilier & Rice, Inc. (private equity investment firm) since September 1998. Previously, Mr. Lautenbach was with the International Business Machines Corporation (IBM) from 1968 until his retirement in 1998. He was most recently Senior Vice President and Group Executive of Worldwide Sales and Services. From 1993 to 1995, he was Chairman of IBM World Trade Corporation, and from 1994 to 1998 was a member of IBM's Corporate Executive Committee. Mr. Lautenbach serves as Co-Chairman and a Director of Covansys, Inc. (global provider of business and technology solutions, 2000). In addition, he is a Director of Italtel Holding S.p.A. (telecommunications (Milan, Italy), 2004) and Eaton Corporation (diversified industrial) as well as the Philharmonic Center for the Arts in Naples, Florida (1999). He also is a member of the Council on Foreign Relations. |
Marvin L. Mann (71) |
| Year of Election or Appointment: 1993 Mr. Mann is Chairman of the non-interested Trustees (2001). He is Chairman Emeritus of Lexmark International, Inc. (computer peripherals), where he served as CEO until April 1998, retired as Chairman May 1999, and remains a member of the Board. Prior to 1991, he held the positions of Vice President of International Business Machines Corporation (IBM) and President and General Manager of various IBM divisions and subsidiaries. He is a member of the Executive Committee of the Independent Director's Council of the Investment Company Institute. In addition, Mr. Mann is a member of the President's Cabinet at the University of Alabama and the Board of Visitors of the Culverhouse College of Commerce and Business Administration at the University of Alabama. |
William O. McCoy (71) |
| Year of Election or Appointment: 1997 Prior to his retirement in December 1994, Mr. McCoy was Vice Chairman of the Board of BellSouth Corporation (telecommunications) and President of BellSouth Enterprises. He is currently a Director of Liberty Corporation (holding company), Duke Realty Corporation (real estate), and Progress Energy, Inc. (electric utility). He is also a partner of Franklin Street Partners (private investment management firm) and a member of the Research Triangle Foundation Board. In addition, Mr. McCoy served as the Interim Chancellor (1999-2000) and a member of the Board of Visitors (1994-1998) for the University of North Carolina at Chapel Hill and currently serves on the Board of Directors of the University of North Carolina Health Care System and the Board of Visitors of the Kenan-Flagler Business School (University of North Carolina at Chapel Hill). He also served as Vice President of Finance for the University of North Carolina (16-school system, 1995-1998). |
William S. Stavropoulos (64) |
| Year of Election or Appointment: 2001 Mr. Stavropoulos is Chairman of the Board (2000), CEO (2002), a position he previously held from 1995-2000, Chairman of the Executive Committee (2000), and a Member of the Board of Directors of The Dow Chemical Company. Since joining The Dow Chemical Company in 1967, Mr. Stavropoulos served in numerous senior management positions, including President (1993-2000; 2002-2003). Currently, he is a Director of NCR Corporation (data warehousing and technology solutions), BellSouth Corporation (telecommunications), Chemical Financial Corporation, and Maersk Inc. (industrial conglomerate, 2002). He also serves as a member of the Board of Trustees of the American Enterprise Institute for Public Policy Research. In addition, Mr. Stavropoulos is a member of The Business Council, J.P. Morgan International Council and the University of Notre Dame Advisory Council for the College of Science. |
Annual Report
Trustees and Officers - continued
Advisory Board Members and Executive Officers:
Correspondence intended for Mr. Dirks, Ms. Small, and Mr. Wolfe may be sent to Fidelity Investments, P.O. Box 55235, Boston, Massachusetts 02205-5235. Correspondence intended for each executive officer and Mr. Lynch may be sent to Fidelity Investments, 82 Devonshire Street, Boston, Massachusetts 02109.
Name, Age; Principal Occupation |
Dennis J. Dirks (56) |
| Year of Election or Appointment: 2004 Member of the Advisory Board of Fidelity Investment Trust. Prior to his retirement in May 2003, Mr. Dirks was Chief Operating Officer and a member of the Board of The Depository Trust & Clearing Corporation (DTCC) (1999-2003). He also served as President, Chief Operating Officer, and Board member of The Depository Trust Company (DTC) (1999-2003) and President and Board member of the National Securities Clearing Corporation (NSCC) (1999-2003). In addition, Mr. Dirks served as Chief Executive Officer and Board member of the Government Securities Clearing Corporation (2001-2003) and Chief Executive Officer and Board member of the Mortgage-Backed Securities Clearing Corporation (2001-2003). |
Peter S. Lynch (61) |
| Year of Election or Appointment: 2003 Member of the Advisory Board of Fidelity Investment Trust. Vice Chairman and a Director of FMR, and Vice Chairman (2001) and a Director (2000) of FMR Co., Inc. Previously, Mr. Lynch served as a Trustee of the Fidelity funds (1990-2003). Prior to May 31, 1990, he was a Director of FMR and Executive Vice President of FMR (a position he held until March 31, 1991), Vice President of Fidelity® Magellan® Fund and FMR Growth Group Leader, and Managing Director of FMR Corp. Mr. Lynch was also Vice President of Fidelity Investments Corporate Services. In addition, he serves as a Trustee of Boston College, Massachusetts Eye & Ear Infirmary, Historic Deerfield, John F. Kennedy Library, and the Museum of Fine Arts of Boston. |
Cornelia M. Small (60) |
| Year of Election or Appointment: 2004 Member of the Advisory Board of Fidelity Investment Trust. Ms. Small is a member (2000) and Chairperson (2002) of the Investment Committee, and a member (2002) of the Board of Trustees of Smith College. Previously, she served as Chief Investment Officer (1999-2000), Director of Global Equity Investments (1996-1999), and a member of the Board of Directors of Scudder, Stevens & Clark (1990-1997) and Scudder Kemper Investments (1997-1998). In addition, Ms. Small served as Co-Chair (2000-2003) of the Annual Fund for the Fletcher School of Law and Diplomacy. |
Kenneth L. Wolfe (65) |
| Year of Election or Appointment: 2004 Member of the Advisory Board of Fidelity Investment Trust. Prior to his retirement in 2001, Mr. Wolfe was Chairman and Chief Executive Officer of Hershey Foods Corporation (1993-2001). He currently serves as a member of the boards of Adelphia Communications Corporation (2003), Bausch & Lomb, Inc., and Revlon Inc. (2004). |
Philip L. Bullen (45) |
| Year of Election or Appointment: 2002 Vice President of the fund. Mr. Bullen also serves as Vice President of certain Equity Funds (2001) and certain High Income Funds (2001). He is Senior Vice President of FMR (2001) and FMR Co., Inc. (2001), President and a Director of Fidelity Management & Research (Far East) Inc. (2001), President and a Director of Fidelity Management & Research (U.K.) Inc. (2002), and a Director of Strategic Advisers, Inc. (2002). Before joining Fidelity Investments, Mr. Bullen was President and Chief Investment Officer of Santander Global Advisors (1997-2000) and President and Chief Executive Officer of Boston's Baring Asset Management Inc. (1994-1997). |
Eric D. Roiter (55) |
| Year of Election or Appointment: 1998 Secretary of the fund. He also serves as Secretary of other Fidelity funds (1998); Vice President, General Counsel, and Clerk of FMR Co., Inc. (2001) and FMR (1998); Vice President and Clerk of FDC (1998); Assistant Clerk of Fidelity Management & Research (U.K.) Inc. (2001) and Fidelity Management & Research (Far East) Inc. (2001); and Assistant Secretary of Fidelity Investments Money Management, Inc. (2001). Prior to joining Fidelity, Mr. Roiter was with the law firm of Debevoise & Plimpton, as an associate (1981-1984) and as a partner (1985-1997), and served as an Assistant General Counsel of the U.S. Securities and Exchange Commission (1979-1981). Mr. Roiter is an Adjunct Member, Faculty of Law, at Boston College Law School (2003). |
Stuart Fross (45) |
| Year of Election or Appointment: 2003 Assistant Secretary of the fund. Mr. Fross also serves as Assistant Secretary of other Fidelity funds (2003) and is an employee of FMR. |
Christine Reynolds (46) |
| Year of Election or Appointment: 2004 President, Treasurer, and Anti-Money Laundering (AML) officer of the fund. Ms. Reynolds also serves as President, Treasurer, and AML officer of other Fidelity funds (2004) and is a Vice President (2003) and an employee (2002) of FMR. Before joining Fidelity Investments, Ms. Reynolds worked at PricewaterhouseCoopers LLP (PwC) (1980-2002), where she was most recently an audit partner with PwC's investment management practice. |
Timothy F. Hayes (53) |
| Year of Election or Appointment: 2002 Chief Financial Officer of the fund. Mr. Hayes also serves as Chief Financial Officer of other Fidelity funds (2002). Recently he was appointed President of Fidelity Service Company (2003) where he also serves as a Director. Mr. Hayes also serves as President of Fidelity Investments Operations Group (FIOG, 2002), which includes Fidelity Pricing and Cash Management Services Group (FPCMS), where he was appointed President in 1998. Previously, Mr. Hayes served as Chief Financial Officer of Fidelity Investments Corporate Systems and Service Group (1998) and Fidelity Systems Company (1997-1998). |
Kenneth A. Rathgeber (57) |
| Year of Election or Appointment: 2004 Chief Compliance Officer of the fund. Mr. Rathgeber also serves as Chief Compliance Officer of other Fidelity funds (2004) and Executive Vice President of Risk Oversight for Fidelity Investments (2002). Previously, he served as Executive Vice President and Chief Operating Officer for Fidelity Investments Institutional Services Company, Inc. (1998-2002). |
John R. Hebble (46) |
| Year of Election or Appointment: 2003 Deputy Treasurer of the fund. Mr. Hebble also serves as Deputy Treasurer of other Fidelity funds (2003), and is an employee of FMR. Before joining Fidelity Investments, Mr. Hebble worked at Deutsche Asset Management where he served as Director of Fund Accounting (2002-2003) and Assistant Treasurer of the Scudder Funds (1998-2003). |
Kimberley H. Monasterio (40) |
| Year of Election or Appointment: 2004 Deputy Treasurer of the fund. Ms. Monasterio also serves as Deputy Treasurer of other Fidelity funds (2004) and is an employee of FMR (2004). Before joining Fidelity Investments, Ms. Monasterio served as Treasurer (2000-2004) and Chief Financial Officer (2002-2004) of the Franklin Templeton Funds and Senior Vice President of Franklin Templeton Services, LLC (2000-2004). |
John H. Costello (58) |
| Year of Election or Appointment: 1986 Assistant Treasurer of the fund. Mr. Costello also serves as Assistant Treasurer of other Fidelity funds and is an employee of FMR. |
Francis V. Knox, Jr. (57) |
| Year of Election or Appointment: 2002 Assistant Treasurer of the fund. Mr. Knox also serves as Assistant Treasurer of other Fidelity funds (2002), and is a Vice President and an employee of FMR. Previously, Mr. Knox served as Vice President of Investment & Advisor Compliance (1990-2001), and Compliance Officer of Fidelity Management & Research (U.K.) Inc. (1992-2002), Fidelity Management & Research (Far East) Inc. (1991-2002), and FMR Corp. (1995-2002). |
Peter L. Lydecker (50) |
| Year of Election or Appointment: 2004 Assistant Treasurer of the fund. Mr. Lydecker also serves as Assistant Treasurer of other Fidelity funds (2004) and is an employee of FMR. |
Mark Osterheld (49) |
| Year of Election or Appointment: 2002 Assistant Treasurer of the fund. Mr. Osterheld also serves as Assistant Treasurer of other Fidelity funds (2002) and is an employee of FMR. |
Kenneth B. Robins (35) |
| Year of Election or Appointment: 2004 Assistant Treasurer of the fund. Mr. Robins also serves as Assistant Treasurer of other Fidelity funds (2004) and is an employee of FMR (2004). Before joining Fidelity Investments, Mr. Robins worked at KPMG LLP, where he was a partner in KPMG's department of professional practice (2002-2004) and a Senior Manager (1999-2000). In addition, Mr. Robins served as Assistant Chief Accountant, United States Securities and Exchange Commission (2000-2002). |
Thomas J. Simpson (46) |
| Year of Election or Appointment: 2000 Assistant Treasurer of the fund. Mr. Simpson is Assistant Treasurer of other Fidelity funds (2000) and an employee of FMR (1996). Prior to joining FMR, Mr. Simpson was Vice President and Fund Controller of Liberty Investment Services (1987-1995). |
Annual Report
Distributions
The Board of Trustees of Fidelity International Small Cap Fund voted to pay to shareholders of record at the opening of business on record date, the following distributions per share derived from capital gains realized from sales of portfolio securities, and dividends derived from net investment income:
| Pay Date | Record Date | Dividends | Capital Gains |
Class A | 12/13/04 | 12/10/04 | $.02 | $.77 |
Class T | 12/13/04 | 12/10/04 | - | $.76 |
Class B | 12/13/04 | 12/10/04 | - | $.71 |
Class C | 12/13/04 | 12/10/04 | - | $.72 |
Class A, Class T, Class B, and Class C designates 14% of the dividends distributed during the fiscal year as amounts which may be taken into account as a dividend for purposes of the maximum rate under section 1(h)(11) of the Internal Revenue Code.
The amounts per share which represent income derived from sources within, and taxes paid to, foreign countries or possessions of the United States are as follows:
| Income | Taxes |
Class A | $.034 | $.004 |
Class T | $.033 | $.004 |
Class B | $.032 | $.004 |
Class C | $.033 | $.004 |
The fund will notify shareholders in January 2005 of amounts for use in preparing 2004 income tax returns.
Annual Report
Proxy Voting Results
A special meeting of the fund's shareholders was held on October 14, 2004. The results of votes taken among shareholders on proposals before them are reported below. Each vote reported represents one dollar of net asset value held on the record date for the meeting.
PROPOSAL 1 |
To amend the Declaration of Trust to allow the Board of Trustees, if permitted by applicable law, to authorize fund mergers without shareholder approval. A |
| # of
Votes | % of
Votes |
Affirmative | 15,718,325,709.37 | 74.142 |
Against | 3,816,318,151.70 | 18.001 |
Abstain | 840,597,158.37 | 3.965 |
Broker
Non-Votes | 825,022,241.94 | 3.892 |
TOTAL | 21,200,263,261.38 | 100.000 |
PROPOSAL 2 |
To elect a Board of Trustees. A |
| # of
Votes | % of
Votes |
J. Michael Cook |
Affirmative | 20,046,954,592.62 | 94.560 |
Withheld | 1,153,308,668.76 | 5.440 |
TOTAL | 21,200,263,261.38 | 100.000 |
Ralph F. Cox |
Affirmative | 20,022,775,321.09 | 94.446 |
Withheld | 1,177,487,940.29 | 5.554 |
TOTAL | 21,200,263,261.38 | 100.000 |
Laura B. Cronin |
Affirmative | 20,020,502,157.24 | 94.435 |
Withheld | 1,179,761,104.14 | 5.565 |
TOTAL | 21,200,263,261.38 | 100.000 |
Dennis J. Dirks B |
Affirmative | 20,051,128,100.47 | 94.580 |
Withheld | 1,149,135,160.91 | 5.420 |
TOTAL | 21,200,263,261.38 | 100.000 |
| # of
Votes | % of
Votes |
Robert M. Gates |
Affirmative | 20,029,013,552.52 | 94.475 |
Withheld | 1,171,249,708.86 | 5.525 |
TOTAL | 21,200,263,261.38 | 100.000 |
George H. Heilmeier |
Affirmative | 20,064,274,525.78 | 94.642 |
Withheld | 1,135,988,735.60 | 5.358 |
TOTAL | 21,200,263,261.38 | 100.000 |
Abigail P. Johnson |
Affirmative | 19,965,491,863.72 | 94.176 |
Withheld | 1,234,771,397.66 | 5.824 |
TOTAL | 21,200,263,261.38 | 100.000 |
Edward C. Johnson 3d |
Affirmative | 19,910,643,140.70 | 93.917 |
Withheld | 1,289,620,120.68 | 6.083 |
TOTAL | 21,200,263,261.38 | 100.000 |
Donald J. Kirk |
Affirmative | 20,034,697,704.85 | 94.502 |
Withheld | 1,165,565,556.53 | 5.498 |
TOTAL | 21,200,263,261.38 | 100.000 |
Marie L. Knowles |
Affirmative | 20,071,617,016.84 | 94.676 |
Withheld | 1,128,646,244.54 | 5.324 |
TOTAL | 21,200,263,261.38 | 100.000 |
Ned C. Lautenbach |
Affirmative | 20,069,374,137.98 | 94.666 |
Withheld | 1,130,889,123.40 | 5.334 |
TOTAL | 21,200,263,261.38 | 100.000 |
Marvin L. Mann |
Affirmative | 20,034,126,102.77 | 94.499 |
Withheld | 1,166,137,158.61 | 5.501 |
TOTAL | 21,200,263,261.38 | 100.000 |
| # of
Votes | % of
Votes |
William O. McCoy |
Affirmative | 20,046,749,092.57 | 94.559 |
Withheld | 1,153,514,168.81 | 5.441 |
TOTAL | 21,200,263,261.38 | 100.000 |
Robert L. Reynolds |
Affirmative | 20,051,009,814.32 | 94.579 |
Withheld | 1,149,253,447.06 | 5.421 |
TOTAL | 21,200,263,261.38 | 100.000 |
Cornelia M. Small B |
Affirmative | 20,037,030,750.74 | 94.513 |
Withheld | 1,163,232,510.64 | 5.487 |
TOTAL | 21,200,263,261.38 | 100.000 |
William S. Stavropoulos |
Affirmative | 20,037,089,868.63 | 94.513 |
Withheld | 1,163,173,392.75 | 5.487 |
TOTAL | 21,200,263,261.38 | 100.000 |
ADenotes trust-wide proposals and voting results. BEffective January 1, 2005. |
Annual Report
Investment Adviser
Fidelity Management & Research Company
Boston, MA
Investment Sub-Advisers
FMR Co., Inc.
Fidelity Management & Research
(U.K.) Inc.
Fidelity Management & Research
(Far East) Inc.
Fidelity International
Investment Advisors
Fidelity Investments Japan Limited
Fidelity International Investment Advisors (U.K.) Limited
General Distributor
Fidelity Distributors Corporation
Boston, MA
Transfer and Shareholder
Servicing Agents
Fidelity Investments Institutional Operations Company, Inc.
Boston, MA
Custodian
Mellon Bank
Pittsburgh, PA
AISC-UANN-1204
1.793568.101
(Fidelity Investment logo)(registered trademark)
Fidelity Advisor
International Small Cap
Fund - Institutional Class
Annual Report
October 31, 2004
(2_fidelity_logos) (Registered_Trademark)
Institutional Class is a class of
Fidelity® International Small Cap Fund
Contents
Chairman's Message | 4 | Ned Johnson's message to shareholders. |
Performance | 5 | How the fund has done over time. |
Management's Discussion | 6 | The managers' review of fund performance, strategy and outlook. |
Shareholder Expense Example | 7 | An example of shareholder expenses. |
Investment Changes | 9 | A summary of major shifts in the fund's investments over the past six months. |
Investments | 11 | A complete list of the fund's investments with their market values. |
Financial Statements | 26 | Statements of assets and liabilities, operations, and changes in net assets,
as well as financial highlights. |
Notes | 36 | Notes to the financial statements. |
Report of Independent Registered Public Accounting Firm | 45 | |
Trustees and Officers | 46 | |
Distributions | 58 | |
Proxy Voting Results | 59 | |
To view a fund's proxy voting guidelines and proxy voting record for the 12-month period ended June 30, visit www.fidelity.com/proxyvotingresults or visit the Securities and Exchange Commission's (SEC) web site at www.sec.gov. You may also call 1-877-208-0098 to request a free copy of the proxy voting guidelines.
Standard & Poor's, S&P and S&P 500 are registered service marks of The McGraw-Hill Companies, Inc. and have been licensed for use by Fidelity Distributors Corporation.
Other third party marks appearing herein are the property of their respective owners.
All other marks appearing herein are registered or unregistered trademarks or service marks of FMR Corp. or an affiliated company.
(Recycle graphic) This report is printed on recycled paper using soy-based inks.
Annual Report
This report and the financial statements contained herein are submitted for the general information of the shareholders of the fund. This report is not authorized for distribution to prospective investors in the fund unless preceded or accompanied by an effective prospectus.
The fund files its complete schedule of portfolio holdings with the SEC for the first and third quarters of each fiscal year on Form N-Q. Forms N-Q are available on the SEC's web site at http://www.sec.gov. The fund's Forms N-Q may be reviewed and copied at the SEC's Public Reference Room in Washington, DC. Information regarding the operation of the SEC's Public Reference Room may be obtained by calling 1-800-SEC-0330. For a complete list of the fund's portfolio holdings, view the fund's most recent quarterly holdings report, semiannual report, or annual report on Fidelity's web site at http://www.fidelity.com/holdings.
NOT FDIC INSURED ·MAY LOSE VALUE ·NO BANK GUARANTEE
Neither the fund nor Fidelity Distributors Corporation is a bank.
Annual Report
Chairman's Message
(photo_of_Edward_C_Johnson_3d)
Dear Shareholder:
During the past year or so, much has been reported about the mutual fund industry, and much of it has been more critical than I believe is warranted. Allegations that some companies have been less than forthright with their shareholders have cast a shadow on the entire industry. I continue to find these reports disturbing, and assert that they do not create an accurate picture of the industry overall. Therefore, I would like to remind everyone where Fidelity stands on these issues. I will say two things specifically regarding allegations that some mutual fund companies were in violation of the Securities and Exchange Commission's forward pricing rules or were involved in so-called "market timing" activities.
First, Fidelity has no agreements that permit customers who buy fund shares after 4 p.m. to obtain the 4 p.m. price. This is not a new policy. This is not to say that someone could not deceive the company through fraudulent acts. However, we are extremely diligent in preventing fraud from occurring in this manner - and in every other. But I underscore again that Fidelity has no so-called "agreements" that sanction illegal practices.
Second, Fidelity continues to stand on record, as we have for years, in opposition to predatory short-term trading that adversely affects shareholders in a mutual fund. Back in the 1980s, we initiated a fee - which is returned to the fund and, therefore, to investors - to discourage this activity. Further, we took the lead several years ago in developing a Fair Value Pricing Policy to prevent market timing on foreign securities in our funds. I am confident we will find other ways to make it more difficult for predatory traders to operate. However, this will only be achieved through close cooperation among regulators, legislators and the industry.
Yes, there have been unfortunate instances of unethical and illegal activity within the mutual fund industry from time to time. That is true of any industry. When this occurs, confessed or convicted offenders should be dealt with appropriately. But we are still concerned about the risk of over-regulation and the quick application of simplistic solutions to intricate problems. Every system can be improved, and we support and applaud well thought out improvements by regulators, legislators and industry representatives that achieve the common goal of building and protecting the value of investors' holdings.
For nearly 60 years, Fidelity has worked very hard to improve its products and service to justify your trust. When our family founded this company in 1946, we had only a few hundred customers. Today, we serve more than 18 million customers including individual investors and participants in retirement plans across America.
Let me close by saying that we do not take your trust in us for granted, and we realize that we must always work to improve all aspects of our service to you. In turn, we urge you to continue your active participation with your financial matters, so that your interests can be well served.
Best regards,
/s/Edward C. Johnson 3d
Edward C. Johnson 3d
Annual Report
Performance: The Bottom Line
Average annual total return reflects the change in the value of an investment, assuming reinvestment of the class' dividend income and capital gains (the profits earned upon the sale of securities that have grown in value) and assuming a constant rate of performance each year. The $10,000 table and the fund's returns do not reflect the deduction of taxes that a shareholder would pay on fund distributions or the redemption of fund shares. During periods of reimbursement by Fidelity, a fund's total return will be greater than it would be had the reimbursement not occurred. How a fund did yesterday is no guarantee of how it will do tomorrow.
Average Annual Total Returns
Periods ended October 31, 2004 | | | Past 1
year | Life of
fundA |
Institutional Class B | | | 22.84% | 44.43% |
A From September 18, 2002.
B The initial offering of Institutional Class shares took place on May 27, 2003. Returns prior to May 27, 2003 are those of International Small Cap, the original class of the fund.
$10,000 Over Life of Fund
Let's say hypothetically that $10,000 was invested in Fidelity Advisor International Small Cap Fund - Institutional Class on September 18, 2002, when the fund started. The chart shows how the value of your investment would have grown, and also shows how the MSCI® EAFE® Small Cap Index did over the same period.
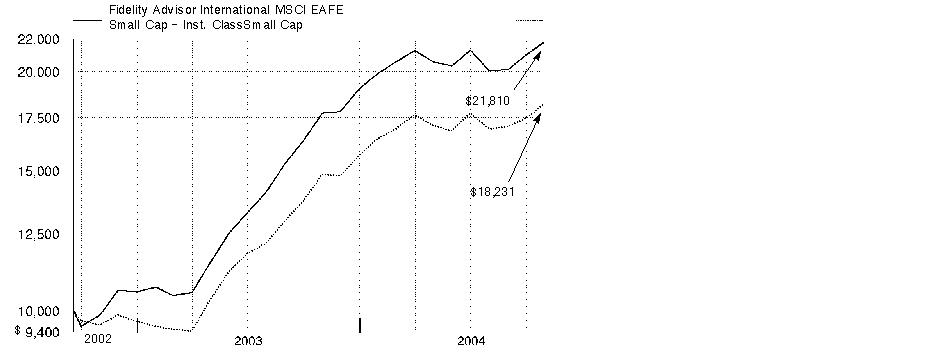
Annual Report
Management's Discussion of Fund Performance
Comments from Tokuya Sano and Ben Paton, Co-Portfolio Managers of Fidelity Advisor International Small Cap Fund
Most of the world's major stock markets posted solid gains for the year ending October 31, 2004. The Morgan Stanley Capital InternationalSM Europe, Australasia, Far East (MSCI® EAFE®) Index - designed to represent the performance of developed stock markets outside the United States and Canada - gained 19.00%, compared to 9.42% for the Standard & Poor's 500SM Index. A weak U.S. dollar relative to most foreign currencies was partly responsible for the performance disparity. On a regional basis, Europe was one of the top performers. Many investors felt European stocks offered better valuations and brighter earnings prospects than U.S. equities. Latin American countries, many of which are exporters of oil and materials that received strong support from high commodity prices, also did well. Conversely, Japan significantly underperformed, as early optimism was eroded by disappointing economic indicators and concerns about the impact of China's economic slowdown on exports. Meanwhile, technology-focused Asian emerging markets suffered due to a deceleration in corporate capital spending.
For the 12 months ending October 31, 2004, the fund's Institutional Class shares returned 22.84%, narrowly beating the 22.72% mark posted by the Morgan Stanley Capital International Europe, Australasia, Far East Small Cap Index. The fund also finished ahead of the LipperSM International Small Cap Funds Average, which returned 18.46%. Strong stock selection in telecommunication services, semiconductors and capital goods aided performance compared with the index. Looking at geographical categories, Germany and Australia were two of the fund's stronger countries, while Japan struggled. German wireless services reseller MobilCom was the fund's top contributor both in absolute terms and compared with the MSCI EAFE Small Cap Index. Believing its valuation to be stretched, I liquidated the position - a timely decision. Performance was also helped by United Group Ltd., an Australian conglomerate. On the negative side, our picks in automobiles and components hurt the fund's results, as did an underweighting in real estate and an overweighting in software and services. Russian oil giant Yukos was the largest detractor in absolute terms and the second-largest relative to the index. The biggest detractor compared to the index was Japanese holding NOK, a maker of flexible printed circuit boards.
The views expressed in this statement reflect those of the portfolio managers only through the end of the period of the report as stated on the cover and do not necessarily represent the views of Fidelity or any other person in the Fidelity organization. Any such views are subject to change at any time based upon market or other conditions and Fidelity disclaims any responsibility to update such views. These views may not be relied on as investment advice and, because investment decisions for a Fidelity fund are based on numerous factors, may not be relied on as an indication of trading intent on behalf of any Fidelity fund.
Annual Report
Shareholder Expense Example
As a shareholder of the Fund, you incur two types of costs: (1) transaction costs, including sales charges (loads) on purchase payments or redemption proceeds, redemption fees, and (2) ongoing costs, including management fees, distribution and/or service (12b-1) fees and other Fund expenses. This Example is intended to help you understand your ongoing costs (in dollars) of investing in the Fund and to compare these costs with the ongoing costs of investing in other mutual funds.
The Example is based on an investment of $1,000 invested at the beginning of the period and held for the entire period (May 1, 2004 to October 31, 2004).
Actual Expenses
The first line of the table below for each class of the Fund provides information about actual account values and actual expenses. You may use the information in this line, together with the amount you invested, to estimate the expenses that you paid over the period. Simply divide your account value by $1,000.00 (for example, an $8,600 account value divided by $1,000.00 = 8.6), then multiply the result by the number in the first line for a class of the Fund under the heading entitled "Expenses Paid During Period" to estimate the expenses you paid on your account during this period. A small balance maintenance fee of $12.00 that is charged once a year may apply for certain accounts with a value of less than $2,000. This fee is not included in the table below. If it was, the estimate of expenses you paid during the period would be higher, and your ending account value lower, by this amount.
Hypothetical Example for Comparison Purposes
The second line of the table below for each class of the Fund provides information about hypothetical account values and hypothetical expenses based on a Class' actual expense ratio and an assumed rate of return of 5% per year before expenses, which is not the Class' actual return. The hypothetical account values and expenses may not be used to estimate the actual ending account balance or expenses you paid for the period. You may use this information to compare the ongoing costs of investing in the Fund and other funds. To do so, compare this 5% hypothetical example with the 5% hypothetical examples that appear in the shareholder reports of the other funds. A small balance maintenance fee of $12.00 that is charged once a year may apply for certain accounts with a value of less than $2,000. This fee is not included in the table below. If it was, the estimate of expenses you paid during the period would be higher, and your ending account value lower, by this amount.
Please note that the expenses shown in the table are meant to highlight your ongoing costs only and do not reflect any transaction costs. Therefore, the second line of the table is useful in comparing ongoing costs only, and will not help you determine the relative total costs of owning different funds. In addition, if these transactional costs were included, your costs would have been higher.
Annual Report
| Beginning
Account Value
May 1, 2004 | Ending
Account Value
October 31, 2004 | Expenses Paid
During Period *
May 1, 2004
to October 31, 2004 |
Class A | | | |
Actual | $1,000.00 | $1,057.20 | $8.95 |
HypotheticalA | $1,000.00 | $1,016.19 | $8.81 |
Class T | | | |
Actual | $1,000.00 | $1,056.30 | $10.23 |
HypotheticalA | $1,000.00 | $1,014.92 | $10.08 |
Class B | | | |
Actual | $1,000.00 | $1,052.70 | $13.83** |
HypotheticalA | $1,000.00 | $1,011.36 | $13.64** |
Class C | | | |
Actual | $1,000.00 | $1,053.60 | $12.70 |
HypotheticalA | $1,000.00 | $1,012.48 | $12.52 |
Institutional Class | | | |
Actual | $1,000.00 | $1,059.50 | $6.94 |
HypotheticalA | $1,000.00 | $1,018.18 | $6.82 |
International Small Cap | | | |
Actual | $1,000.00 | $1,059.50 | $6.78 |
HypotheticalA | $1,000.00 | $1,018.33 | $6.67 |
A5% return per year before expenses
*Expenses are equal to each Class' annualized expense ratio (shown in the table below); multiplied by the average account value over the period, multiplied by 184/366 (to reflect the one-half year period).
| Annualized
Expense Ratio |
Class A | 1.73% |
Class T | 1.98% |
Class B | 2.68% |
Class C | 2.46% |
Institutional Class | 1.34% |
International Small Cap | 1.31% |
**If fees effective January 1, 2005 had been in effect during the period, the annualized expense ratio and the expenses paid in the actual and hypothetical examples above would have been as follows:
| Annualized
Expense Ratio | Expenses Paid |
Class B | | |
Actual | 2.52% | $13.00 |
HypotheticalA | | $12.83 |
A5% return per year before expenses
Annual Report
Investment Changes
Geographic Diversification (% of fund's net assets) |
As of October 31, 2004 |
| Japan27.7% | |
| United Kingdom16.1% | |
| Australia9.2% | |
| Germany7.7% | |
| United States of America5.2% | |
| South Africa3.0% | |
| Norway2.9% | |
| Greece2.6% | |
| Italy2.4% | |
| Other23.2% | |

Percentages are adjusted for the effect of futures contracts, if applicable. |
|
As of April 30, 2004 |
| Japan31.0% | |
| United Kingdom17.4% | |
| Germany8.8% | |
| Australia7.8% | |
| Greece3.0% | |
| Sweden2.9% | |
| Norway2.9% | |
| France2.8% | |
| Hong Kong2.3% | |
| Other21.1% | |

Percentages are adjusted for the effect of futures contracts, if applicable. |
Asset Allocation |
| % of fund's
net assets | % of fund's net assets
6 months ago |
Stocks | 96.6 | 98.6 |
Short-Term Investments and Net Other Assets | 3.4 | 1.4 |
Top Ten Stocks as of October 31, 2004 |
| % of fund's
net assets | % of fund's net assets
6 months ago |
Steinhoff International Holdings Ltd. (South Africa, Household Durables) | 1.8 | 1.4 |
K&S AG (Germany, Chemicals) | 1.5 | 0.0 |
United Group Ltd. (Australia, Construction & Engineering) | 1.5 | 0.9 |
Hikari Tsushin, Inc. (Japan, Specialty Retail) | 1.5 | 0.0 |
Orascom Telecom SAE unit (Egypt, Wireless Telecommunication Services) | 1.4 | 0.3 |
Freenet.de AG (Germany, Internet Software & Services) | 1.4 | 2.5 |
Pfleiderer AG (Germany, Building Products) | 1.3 | 0.6 |
BlueScope Steel Ltd. (Australia, Metals & Mining) | 1.3 | 1.0 |
Centennial Coal Co. Ltd. (Australia, Metals & Mining) | 1.2 | 0.7 |
QBE Insurance Group Ltd. (Australia, Insurance) | 1.1 | 1.0 |
| 14.0 | |
Market Sectors as of October 31, 2004 |
| % of fund's
net assets | % of fund's net assets
6 months ago |
Consumer Discretionary | 22.7 | 21.2 |
Materials | 14.5 | 10.8 |
Industrials | 13.9 | 15.4 |
Information Technology | 13.3 | 19.9 |
Financials | 10.8 | 12.7 |
Health Care | 7.7 | 6.6 |
Energy | 6.6 | 4.8 |
Telecommunication Services | 3.9 | 4.2 |
Consumer Staples | 2.8 | 2.6 |
Utilities | 0.4 | 0.4 |
Annual Report
Investments October 31, 2004
Showing Percentage of Net Assets
Common Stocks - 95.5% |
| Shares | | Value (Note 1) |
Australia - 9.2% |
Australian Stock Exchange Ltd. | 603,839 | | $8,368,824 |
BlueScope Steel Ltd. | 2,519,309 | | 14,581,351 |
Boral Ltd. | 1,902,417 | | 9,458,247 |
Bradken Ltd. | 63,288 | | 145,952 |
Centamin Egypt Ltd. (a) | 5,509,616 | | 1,126,378 |
Centennial Coal Co. Ltd. | 4,089,388 | | 13,166,296 |
Corporate Express Australia Ltd. (d) | 1,697,169 | | 7,294,135 |
Dwyka Diamonds Ltd. (a) | 4,010,385 | | 2,358,299 |
Elkedra Diamonds NL | 3,000,000 | | 689,119 |
Fox Resources Ltd. (a) | 1,000,000 | | 486,688 |
Hardman Resources Ltd. (a) | 915,681 | | 1,474,075 |
Hardman Resources Ltd. (UK) (a) | 217,653 | | 351,974 |
JB Hi-Fi Ltd. | 1,483,593 | | 3,976,808 |
Patrick Corp. Ltd. | 914,738 | | 3,808,100 |
Promina Group Ltd. | 914,490 | | 3,108,649 |
QBE Insurance Group Ltd. | 1,235,719 | | 12,703,608 |
Stockland New (a) | 12,301 | | 54,065 |
United Group Ltd. | 3,412,640 | | 17,324,352 |
Virotec International Ltd. (a) | 1,852,832 | | 638,162 |
Virotec International Ltd. (a) | 1,084,000 | | 373,502 |
Westpac Banking Corp. | 212,356 | | 3,001,949 |
TOTAL AUSTRALIA | | 104,490,533 |
Belgium - 1.3% |
EVS Broadcast Equipment SA | 28,000 | | 2,239,475 |
Exmar NV | 17,400 | | 1,046,539 |
Melexis NV | 93,199 | | 1,115,144 |
Omega Pharma SA | 60,100 | | 3,299,438 |
Recticel SA | 67,444 | | 724,125 |
Roularta Media Group NV | 22,376 | | 1,438,887 |
Telindus Group NV | 582,193 | | 5,371,683 |
TOTAL BELGIUM | | 15,235,291 |
Bermuda - 0.4% |
Frontline Ltd. | 54,700 | | 2,701,043 |
Ship Finance International Ltd. | 2,895 | | 58,190 |
Tanzanite One Ltd. (a) | 1,166,001 | | 1,521,318 |
TOTAL BERMUDA | | 4,280,551 |
Brazil - 0.3% |
Petroleo Brasileiro SA Petrobras sponsored ADR | 108,000 | | 3,835,080 |
Canada - 0.8% |
Adastra Minerals, Inc. (a) | 10,000 | | 11,302 |
Common Stocks - continued |
| Shares | | Value (Note 1) |
Canada - continued |
La Mancha Resources, Inc. (a) | 334,000 | | $246,828 |
Oilexco, Inc. (a) | 1,388,800 | | 3,295,670 |
Ontzinc Corp. (a)(e) | 16,612,000 | | 1,841,458 |
Uruguay Mineral Exploration, Inc. (a) | 515,300 | | 2,200,238 |
Western Canadian Coal Corp. (f) | 385,886 | | 1,024,682 |
TOTAL CANADA | | 8,620,178 |
Cayman Islands - 0.0% |
Kingboard Chemical Holdings Ltd. warrants 12/31/06 (a) | 362,380 | | 167,603 |
China - 0.8% |
Aluminum Corp. of China Ltd. (H Shares) | 5,744,000 | | 3,283,888 |
Global Bio-Chem Technology Group Co. Ltd. | 2,632,000 | | 2,062,669 |
Global Bio-Chem Technology Group Co. Ltd. warrants 5/31/07 (a) | 376,000 | | 26,085 |
PICC Property & Casualty Co. Ltd. (H Shares) | 9,086,000 | | 3,268,471 |
TOTAL CHINA | | 8,641,113 |
Czech Republic - 0.3% |
Komercni Banka AS unit | 84,634 | | 3,512,311 |
Denmark - 0.2% |
Coloplast AS Series B | 5,950 | | 592,183 |
SimCorp AS | 33,539 | | 1,498,643 |
TOTAL DENMARK | | 2,090,826 |
Egypt - 1.4% |
Orascom Telecom SAE unit (a) | 928,725 | | 15,881,198 |
Estonia - 0.4% |
Hansabank SA | 422,628 | | 4,272,613 |
Finland - 0.8% |
Aldata Solutions Oyj (a) | 1,617,346 | | 2,255,992 |
Alma Media Corp. (d) | 133,020 | | 1,463,941 |
Capman Oyj (A Shares) | 496,937 | | 1,163,752 |
Nokian Tyres Ltd. | 25,678 | | 2,791,140 |
Vacon Oyj | 73,381 | | 1,031,084 |
TOTAL FINLAND | | 8,705,909 |
France - 2.1% |
Areva (investment certificates) | 7,600 | | 2,809,760 |
Bacou Dalloz | 20,330 | | 1,567,482 |
Galeries Lafayette SA | 5,900 | | 1,155,940 |
Generale de Sante | 200,152 | | 3,439,887 |
Groupe Bourbon SA | 40,038 | | 1,972,610 |
Common Stocks - continued |
| Shares | | Value (Note 1) |
France - continued |
Groupe Open SA | 52,500 | | $560,317 |
Groupe Open SA warrants 10/21/06 (a) | 14,809 | | 6,064 |
Inter Parfums SA | 17,290 | | 604,040 |
Ipsos SA | 16,003 | | 1,501,114 |
Maisons France Confort | 10,498 | | 836,956 |
Medidep SA (a) | 46,000 | | 1,280,340 |
Nexity | 40,000 | | 956,704 |
Oeneo Group (a) | 86,962 | | 144,671 |
Orpea (a) | 25,207 | | 746,759 |
Stedim SA | 27,038 | | 2,524,109 |
Toupargel-Agrigel | 43,520 | | 1,732,038 |
U10 SA (d) | 12,679 | | 700,934 |
Vivendi Universal SA (a) | 66,932 | | 1,835,945 |
TOTAL FRANCE | | 24,375,670 |
Germany - 7.0% |
Advanced Photonics Technologies AG (a) | 48,552 | | 80,772 |
Articon-Integralis AG (Reg.) (a) | 495,185 | | 1,191,334 |
Bijou Brigitte Modische Accessoires AG | 21,486 | | 2,532,348 |
Deutsche Boerse AG | 42,300 | | 2,119,241 |
ElringKlinger AG | 9,142 | | 583,781 |
Fielmann AG | 19,100 | | 1,201,093 |
Freenet.de AG (a)(d) | 773,219 | | 15,633,916 |
Fresenius AG | 43,586 | | 4,049,410 |
Fresenius Medical Care AG | 65,113 | | 4,999,506 |
Gpc Biotech AG (a) | 49,345 | | 628,311 |
Grenkeleasing AG | 100,818 | | 3,825,348 |
Hyrican Informationssysteme AG | 17,925 | | 155,294 |
K&S AG | 420,200 | | 17,562,260 |
Kontron AG (a) | 154,264 | | 1,411,493 |
Merck KGaA | 48,441 | | 2,707,101 |
Parsytec AG (a) | 188,871 | | 693,674 |
PC-Spezialist Franchise AG (d) | 150,000 | | 1,516,445 |
Pfleiderer AG (a) | 1,644,359 | | 14,582,703 |
PSI AG (a) | 228,043 | | 992,211 |
Pulsion Medical Systems AG (a) | 156,865 | | 682,516 |
Rational AG | 17,800 | | 1,404,532 |
United Internet AG | 40,352 | | 984,745 |
TOTAL GERMANY | | 79,538,034 |
Greece - 2.6% |
Alfa-Beta Vassilopoulos SA (Reg.) | 31,800 | | 516,820 |
Common Stocks - continued |
| Shares | | Value (Note 1) |
Greece - continued |
Cosmote Mobile Telecommunications SA | 148,300 | | $2,687,278 |
Folli Follie SA | 268,648 | | 8,250,932 |
Greek Organization of Football Prognostics SA | 266,442 | | 5,448,634 |
Hellenic Exchanges Holding SA (a) | 166,195 | | 1,510,026 |
Hyatt Regency SA (Reg.) | 213,182 | | 2,367,982 |
Public Power Corp. of Greece | 54,000 | | 1,344,760 |
Sarantis SA (Reg.) | 1,046,648 | | 5,705,825 |
Technical Olympic SA (Reg.) | 426,896 | | 2,054,084 |
TOTAL GREECE | | 29,886,341 |
Hong Kong - 2.2% |
ASM Pacific Technology Ltd. | 528,500 | | 1,714,432 |
China Insurance International Holdings Co. Ltd. | 13,106,000 | | 6,019,496 |
China Merchants Holdings International Co. Ltd. | 5,166,000 | | 7,632,488 |
China Pharmaceutical Enterprise and Investment Corp. Ltd. (a) | 9,820,000 | | 2,409,677 |
Kingboard Chemical Holdings Ltd. | 3,623,800 | | 7,588,671 |
TOTAL HONG KONG | | 25,364,764 |
Hungary - 0.6% |
MOL Magyar Olay-es Gazipari RT Series A (For. Reg.) | 44,200 | | 2,481,194 |
OTP Bank Rt. | 152,073 | | 3,856,565 |
TOTAL HUNGARY | | 6,337,759 |
India - 0.0% |
Kotak Mahindra Bank Ltd. | 100,669 | | 398,590 |
State Bank of India | 6,592 | | 68,958 |
TOTAL INDIA | | 467,548 |
Ireland - 1.4% |
DEPFA BANK PLC | 187,900 | | 2,885,468 |
Glanbia PLC | 543,500 | | 1,704,017 |
IAWS Group PLC (Ireland) | 38,059 | | 507,010 |
Independent News & Media PLC (Ireland) | 846,964 | | 2,471,200 |
Kenmare Resources PLC (a) | 6,850,000 | | 2,045,534 |
Kenmare Resources PLC warrants 7/23/09 (a) | 1,712,500 | | 178,748 |
Paddy Power PLC | 137,311 | | 1,825,698 |
Petroceltic International PLC (a) | 12,421,734 | | 3,937,623 |
TOTAL IRELAND | | 15,555,298 |
Italy - 2.0% |
Amplifon Spa | 38,350 | | 1,713,751 |
Cassa Di Risparmio Di Firenze | 2,942,982 | | 5,758,419 |
Lottomatica Spa New (d) | 383,300 | | 11,571,108 |
Common Stocks - continued |
| Shares | | Value (Note 1) |
Italy - continued |
Saipem Spa | 79,800 | | $922,553 |
Teleunit Spa (a) | 7,365,800 | | 2,571,795 |
TOTAL ITALY | | 22,537,626 |
Japan - 27.7% |
Able, Inc. | 272,700 | | 7,678,424 |
Adtec Plasma Technology Co. Ltd. (a) | 32 | | 323,522 |
Ahresty Corp. | 53,300 | | 694,987 |
Amiyaki Tei Co. Ltd. (d) | 185 | | 592,573 |
Apple International Co. Ltd. | 384 | | 885,303 |
ARRK Corp. | 140,600 | | 5,234,223 |
Asahi Broadcasting Corp. | 14,940 | | 961,321 |
Asahi Denka Co. Ltd. | 108,000 | | 953,106 |
Asahi Glass Co. Ltd. | 102,000 | | 938,706 |
Asahi Intecc Co. Ltd. | 49,300 | | 1,784,088 |
Axell Corp. | 282 | | 1,718,619 |
Benefit One, Inc. (a) | 1 | | 12,378 |
Casio Computer Co. Ltd. | 170,700 | | 2,030,626 |
Chiyoda Integre Co. Ltd. | 78,960 | | 1,437,671 |
Citizen Electronics Co. Ltd. (d) | 19,200 | | 865,347 |
CMK Corp. (d) | 55,000 | | 727,028 |
Culture Convenience Club Co. Ltd. (d) | 63,400 | | 790,740 |
Cyber Agent Ltd. (a)(d) | 867 | | 2,523,135 |
Cyber Agent Ltd. New (a)(d) | 867 | | 2,523,135 |
Daikin Industries Ltd. | 24,000 | | 585,062 |
Dream Technologies Corp. (a)(d) | 718 | | 511,525 |
Dwango Co. Ltd. New (a) | 168 | | 888,931 |
Dynic Corp. (a) | 45,000 | | 191,336 |
Eizo Nanao Corp. | 119,000 | | 3,339,443 |
Faith, Inc. (d) | 3,374 | | 9,245,146 |
Fancl Corp. | 26,500 | | 976,520 |
Fuji Seal International, Inc. | 81,300 | | 3,495,205 |
Fuji Spinning Co. Ltd. (a) | 2,524,000 | | 3,195,691 |
Fujikura Ltd. | 1,740,000 | | 7,661,360 |
Fujitsu Business Systems Ltd. | 29,800 | | 380,683 |
Globaly Corp. | 23,100 | | 757,377 |
Heian Ceremony Service Co. Ltd. (d) | 151,000 | | 984,457 |
Hikari Tsushin, Inc. (d) | 277,300 | | 16,611,537 |
Hogy Medical Co. | 21,400 | | 877,555 |
Hokuto Corp. | 35,100 | | 644,061 |
Human Holdings Co. Ltd. (a) | 4 | | 15,496 |
HUNET, Inc. (d) | 520,000 | | 967,922 |
Common Stocks - continued |
| Shares | | Value (Note 1) |
Japan - continued |
Ibiden Co. Ltd. (d) | 83,400 | | $1,286,835 |
Information Planning Co. Ltd. (d) | 111 | | 326,178 |
Intelligent Wave, Inc. (d) | 901 | | 1,489,819 |
Intertrade Co. Ltd. | 8 | | 48,831 |
Ishihara Chemical Co. Ltd. (d) | 53,000 | | 901,403 |
Ishihara Sangyo Kaisha Ltd. | 269,000 | | 564,256 |
Iwatani International Corp. | 945,000 | | 2,294,751 |
JACCS Co. Ltd. (d) | 226,000 | | 1,136,032 |
Japan Medical Dynamic Marketing, Inc. | 82,600 | | 850,702 |
Jastec Co. Ltd. | 54,500 | | 933,094 |
JFE Shoji Holdings, Inc. (a)(d) | 922,000 | | 4,486,512 |
KAGA ELECTRONICS Co. Ltd. (d) | 160,500 | | 2,714,556 |
Kibun Food Chemifa Co. Ltd. (d) | 49,400 | | 963,868 |
Kobe Steel Ltd. | 7,068,000 | | 9,883,914 |
Kubota Corp. | 197,000 | | 899,050 |
Kura Corp. Ltd. | 1,054 | | 2,688,902 |
Lawson, Inc. (d) | 53,300 | | 1,782,794 |
Leopalace21 Corp. | 82,000 | | 1,499,995 |
livedoor Co. Ltd. (a)(d) | 301,100 | | 1,007,128 |
Marktec Corp. | 1,000 | | 7,644 |
Maruha Group, Inc. (a) | 303,000 | | 658,478 |
Matsui Securities Co. Ltd. (d) | 43,700 | | 1,160,268 |
Meganesuper Co. Ltd. | 47,520 | | 830,651 |
Meitec Corp. | 15,075 | | 568,330 |
Melco Holdings, Inc. (d) | 70,200 | | 1,086,480 |
Mitsubishi Materials Corp. (d) | 1,179,000 | | 2,372,816 |
Mitsubishi Plastics, Inc. | 317,000 | | 805,716 |
Mitsui & Associates Telepark Corp. | 484 | | 1,495,422 |
Mitsui Fudosan Co. Ltd. | 246,000 | | 2,614,919 |
Mitsui O.S.K. Lines Ltd. | 296,000 | | 1,756,394 |
Mitsui Trust Holdings, Inc. | 768,000 | | 5,290,046 |
Mobilephone Telecommunications International Ltd. | 364 | | 567,487 |
Neturen Co. Ltd. (d) | 195,000 | | 1,227,099 |
NHK Spring Co. Ltd. | 148,000 | | 1,023,631 |
Nidec Corp. | 46,700 | | 5,065,583 |
Nihon Chouzai Co. Ltd. (a) | 39,700 | | 1,575,471 |
Nihon Dempa Kogyo Co. Ltd. (d) | 510,100 | | 10,820,376 |
Nihon Falcom Corp. | 330 | | 926,064 |
Nihon Micro Coating Co. Ltd. (a) | 10,300 | | 111,920 |
Nihon Trim Co. Ltd. (d) | 72,050 | | 4,976,478 |
Nihon Unicom Corp. | 5,300 | | 78,122 |
Ninety-Nine Plus, Inc. | 1 | | 17,669 |
Common Stocks - continued |
| Shares | | Value (Note 1) |
Japan - continued |
Nippon Chemi-con Corp. (d) | 1,046,000 | | $5,119,554 |
Nippon Chemical Industrial Co. Ltd. | 222,000 | | 788,699 |
Nippon Electric Glass Co. Ltd. | 56,000 | | 1,251,382 |
Nippon Mining Holdings, Inc. | 542,500 | | 2,583,455 |
Nippon Oil Corp. | 329,000 | | 2,092,096 |
Nippon Shinpan Co. Ltd. | 195,000 | | 591,440 |
Nippon Suisan Kaisha Co. Ltd. | 319,000 | | 1,015,760 |
Nishi-Nippon City Bank Ltd. | 199,000 | | 885,614 |
Nissin Co. Ltd. (d) | 221,300 | | 460,018 |
Nissin Co. Ltd. New (a)(d) | 221,300 | | 460,018 |
Nissin Kogyo Co. Ltd. | 378,400 | | 11,155,175 |
Nitta Corp. | 172,800 | | 2,504,608 |
Nittoku Engineering Co. Ltd. | 87,500 | | 632,470 |
NOK Corp. | 372,600 | | 11,336,250 |
Opt, Inc. | 70 | | 380,309 |
Organo Corp. | 274,000 | | 1,444,626 |
Osaki Electric Co. Ltd. (d) | 60,000 | | 239,240 |
Pacific Metals Co. Ltd. (a)(d) | 846,000 | | 3,453,224 |
Park24 Co. Ltd. (d) | 78,900 | | 1,340,409 |
Park24 Co. Ltd. New (a) | 78,900 | | 1,326,990 |
Pigeon Corp. | 217,400 | | 3,298,950 |
Pixela Corp. (d) | 25,700 | | 396,300 |
Rakuten, Inc. (d) | 323 | | 2,426,277 |
Reins International, Inc. (d) | 1,271 | | 4,983,843 |
Rohto Pharmaceutical Co. Ltd. | 611,000 | | 6,633,335 |
Sammy NetWorks Co. Ltd. (a) | 240 | | 8,934,662 |
Sega Sammy Holdings, Inc. (a) | 95,540 | | 4,441,412 |
Sekisui Chemical Co. Ltd. | 136,000 | | 866,103 |
Shicoh Engineering Co. Ltd. (a) | 28 | | 886,285 |
Shin Nippon Biomedical Laboratories Ltd. | 25,900 | | 502,901 |
Shinko Electric Industries Co.Ltd. | 41,500 | | 1,199,887 |
Showa Denko KK (d) | 1,726,000 | | 4,174,952 |
SMBC Friend Securities Co. Ltd. | 379,000 | | 2,402,882 |
So-net M3, Inc. | 3 | | 21,826 |
Soken Chemical & Engineer Co. Ltd. | 66,200 | | 1,057,098 |
Square Enix Co. Ltd. | 24,000 | | 667,832 |
Stanley Electric Co. Ltd. (d) | 195,700 | | 3,023,286 |
Sumitomo Corp. | 236,000 | | 1,759,380 |
Sumitomo Light Metal Industries Ltd. (d) | 1,819,000 | | 2,870,251 |
Sumitomo Metal Mining Co. Ltd. | 528,000 | | 3,567,062 |
Sumitomo Rubber Industries Ltd. | 132,000 | | 1,126,244 |
Sumitomo Titanium Corp. | 29,500 | | 1,410,403 |
Common Stocks - continued |
| Shares | | Value (Note 1) |
Japan - continued |
Suncall Corp. | 206,000 | | $1,080,266 |
Sunx Ltd. | 92,000 | | 1,607,294 |
Takara Co. Ltd. (d) | 228,600 | | 987,104 |
Techno Medica Co. Ltd. | 139 | | 577,881 |
Telewave, Inc. (d) | 230 | | 1,679,879 |
Teraoka Seisakusho Co. Ltd. | 58,000 | | 442,803 |
Toho Titanium Co. Ltd. | 65,000 | | 1,461,709 |
Tokyo Seimitsu Co. Ltd. (d) | 101,500 | | 3,155,242 |
Tokyo Steel Manufacturing Co. Ltd. (d) | 370,200 | | 5,848,485 |
Toppan Printing Co. Ltd. | 98,000 | | 948,193 |
Toray Industries, Inc. | 589,000 | | 2,754,807 |
Toyo Ink Manufacturing Co. Ltd. (d) | 2,749,000 | | 9,480,654 |
Toyo Machinery & Metal Co. Ltd. | 220,000 | | 1,184,863 |
Toyo Radiator Co. Ltd. (d) | 202,000 | | 988,671 |
Toyo Suisan Kaisha Ltd. | 65,000 | | 762,177 |
Trancom Co. Ltd. | 65,400 | | 1,328,577 |
Trend Micro, Inc. | 29,500 | | 1,415,978 |
Ulvac, Inc. | 2,900 | | 66,585 |
Unicharm Petcare Corp. | 200 | | 7,559 |
USS Co. Ltd. | 68,480 | | 5,545,175 |
Wintest Corp. | 70 | | 261,256 |
Works Applications Co. Ltd. (a) | 389 | | 1,201,899 |
Zakkaya Bulldog Co. Ltd. (a) | 31,400 | | 1,014,674 |
Zwei Co. Ltd. (a) | 500 | | 10,960 |
TOTAL JAPAN | | 314,325,122 |
Korea (South) - 0.2% |
SKC Co. Ltd. (a) | 353,470 | | 2,525,914 |
Luxembourg - 1.5% |
Millicom International Cellular SA unit (a) | 183,000 | | 3,711,889 |
Orco Property Group | 37,100 | | 1,401,042 |
Stolt-Nielsen SA (a)(d) | 572,390 | | 12,016,774 |
TOTAL LUXEMBOURG | | 17,129,705 |
Netherlands - 0.7% |
Completel Europe NV (a) | 76,809 | | 2,531,031 |
Efes Breweries International NV unit | 32,700 | | 907,425 |
Fugro NV (Certificaten Van Aandelen) | 24,365 | | 1,898,855 |
PinkRoccade NV | 137,626 | | 1,805,230 |
Wolters Kluwer NV (Certificaten Van Aandelen) | 46,025 | | 841,655 |
TOTAL NETHERLANDS | | 7,984,196 |
Common Stocks - continued |
| Shares | | Value (Note 1) |
New Zealand - 0.1% |
The Warehouse Group Ltd. | 344,626 | | $962,598 |
Norway - 2.9% |
ABG Sundal Collier ASA | 3,358,000 | | 2,640,373 |
Bolig-og Naeringsbanken ASA | 29,040 | | 1,214,767 |
Catch Communications ASA | 633,000 | | 1,592,716 |
Mamut ASA | 1,851,000 | | 2,605,218 |
Nordic VLSI ASA (a) | 591,000 | | 4,042,884 |
Norman ASA (a) | 65,300 | | 549,391 |
Norsk Hydro ASA | 101,680 | | 7,499,339 |
Orkla ASA (A Shares) | 47,772 | | 1,363,530 |
P4 Radio Hele Norge ASA (a)(d) | 141,400 | | 378,018 |
Petroleum Geo-Services ASA (a) | 38,750 | | 1,788,522 |
Statoil ASA | 215,500 | | 3,126,283 |
Tandberg ASA | 339,500 | | 3,203,359 |
TANDBERG Television ASA (a) | 388,829 | | 2,824,979 |
TOTAL NORWAY | | 32,829,379 |
Poland - 0.9% |
Polski Koncern Naftowy Orlen SA unit | 455,400 | | 9,791,100 |
Portugal - 0.8% |
Impresa SGPS (a) | 596,953 | | 3,483,479 |
Media Capital SGPS SA | 880,576 | | 5,983,696 |
TOTAL PORTUGAL | | 9,467,175 |
Russia - 0.4% |
Mobile TeleSystems OJSC sponsored ADR | 17,100 | | 2,481,552 |
Surgutneftegaz JSC sponsored ADR | 36,600 | | 1,916,925 |
TOTAL RUSSIA | | 4,398,477 |
Singapore - 1.2% |
Accord Customer Care Solutions Ltd. (a) | 13,435,000 | | 6,220,842 |
Singapore Exchange Ltd. | 2,698,000 | | 2,855,456 |
Singapore Petroleum Co. Ltd. | 1,501,000 | | 3,375,772 |
Venture Corp. Ltd. | 124,000 | | 1,178,147 |
TOTAL SINGAPORE | | 13,630,217 |
South Africa - 3.0% |
African Bank Investments Ltd. | 1,208,151 | | 2,831,983 |
Discovery Holdings Ltd. (a) | 2,442,719 | | 6,651,488 |
MTN Group Ltd. | 594,602 | | 3,247,939 |
Common Stocks - continued |
| Shares | | Value (Note 1) |
South Africa - continued |
Steinhoff International Holdings Ltd. | 11,751,132 | | $20,567,495 |
Wilson Bayly Holmes-Ovcon Ltd. | 333,456 | | 1,364,729 |
TOTAL SOUTH AFRICA | | 34,663,634 |
Spain - 0.2% |
Antena 3 Television SA (a) | 36,758 | | 2,368,424 |
Sweden - 1.7% |
Eniro AB | 153,028 | | 1,297,819 |
Finnveden Invest AB Series B (a) | 368,884 | | 2,854,736 |
Gambro AB (A Shares) | 269,000 | | 3,146,388 |
Hexagon AB (B Shares) | 80,143 | | 2,956,637 |
Lindex AB | 31,898 | | 885,968 |
Mekonomen AB | 68,000 | | 1,807,002 |
Modern Times Group AB (MTG) (B Shares) (a) | 105,200 | | 2,342,007 |
Observer AB | 297,314 | | 1,176,699 |
OMX AB (a) | 162,285 | | 1,921,123 |
VBG AB Class B | 6,710 | | 100,536 |
Wedins Norden AB Series B (a) | 3,202,790 | | 307,843 |
TOTAL SWEDEN | | 18,796,758 |
Switzerland - 1.6% |
A Hiestand Holding AG | 1,812 | | 1,265,880 |
Actelion Ltd. (Reg.) (a) | 18,108 | | 2,078,067 |
Amazys Holding AG | 54,100 | | 2,628,413 |
Barry Callebaut AG | 5,721 | | 1,102,220 |
Escor Casino & Entertainment SA | 19,770 | | 514,205 |
Geberit AG (Reg.) | 1,663 | | 1,086,564 |
Micronas Semiconductor Holding AG (a) | 15,752 | | 620,157 |
Mobilezone Holding AG | 462,199 | | 1,579,638 |
Roche Holding AG (participation certificate) | 30,328 | | 3,109,522 |
Sika AG (Bearer) | 1,436 | | 886,524 |
Sulzer AG (Reg.) | 4,024 | | 1,361,783 |
Swissquote Group Holding SA (a) | 18,811 | | 1,402,395 |
Temenos Group AG (a) | 63,126 | | 449,465 |
TOTAL SWITZERLAND | | 18,084,833 |
Taiwan - 0.1% |
Merry Electronics Co. Ltd. | 584,568 | | 1,319,626 |
Turkey - 0.8% |
Beko Elektronik AS (a) | 887,743,640 | | 3,726,215 |
Common Stocks - continued |
| Shares | | Value (Note 1) |
Turkey - continued |
Dogan Gazetecilik AS (a) | 2,269,570,200 | | $4,363,657 |
Dogan Yayin Holding AS (a) | 359,364,500 | | 1,277,271 |
TOTAL TURKEY | | 9,367,143 |
United Kingdom - 16.1% |
Advanced Technology (UK) PLC (a)(e) | 7,355,000 | | 558,207 |
AeroBox PLC (a) | 3,640,000 | | 986,634 |
Air Partner PLC | 45,000 | | 361,787 |
Alba PLC | 402,700 | | 5,498,361 |
Alliance Pharma PLC (a)(e) | 6,259,500 | | 1,811,686 |
Amlin PLC | 157,014 | | 419,821 |
Asia Energy PLC | 694,600 | | 4,607,918 |
Atrium Underwriting PLC | 257,060 | | 862,105 |
Axis Shield PLC (a) | 89,600 | | 330,953 |
BETonSPORTS PLC | 2,407,121 | | 6,922,693 |
BG Group PLC | 441,600 | | 2,880,847 |
BHP Billiton PLC | 193,400 | | 1,967,147 |
Biocompatibles International PLC | 79,010 | | 330,313 |
Blacks Leisure Group PLC | 45,443 | | 367,437 |
Caffe Nero Group PLC (a) | 282,978 | | 520,015 |
Carphone Warehouse Group PLC | 542,849 | | 1,660,948 |
Chaucer Holdings PLC | 1,612,100 | | 1,303,489 |
Cobra Biomanufacturing PLC (a) | 818,400 | | 515,097 |
Corac Group PLC (a)(e) | 4,698,004 | | 2,460,487 |
Corin Group PLC | 1,122,914 | | 7,067,566 |
CSS Stellar PLC (a) | 623,908 | | 418,481 |
CustomVis PLC (a) | 375,215 | | 131,008 |
Domino's Pizza UK & IRL PLC | 344,636 | | 1,304,640 |
Edinburgh Oil & Gas PLC (a) | 713,381 | | 2,484,240 |
Entertainment Rights PLC (a) | 4,002,089 | | 965,638 |
Flomerics Group PLC | 449,658 | | 458,604 |
Future Network PLC | 1,717,169 | | 1,830,222 |
GMA Resources PLC (a) | 6,547,930 | | 1,955,331 |
Goldshield Group PLC | 575,700 | | 2,248,112 |
GTL Resources PLC (a) | 13,669,072 | | 1,318,746 |
Gyrus Group PLC (a) | 220,640 | | 950,802 |
Hardide Ltd. | 125,000 | | 918,825 |
Healthcare Enterprise Group PLC (a) | 30,417,845 | | 1,062,050 |
Hereward Ventures PLC (a) | 1,818,182 | | 167,059 |
Highbury House Communications PLC | 713,914 | | 131,192 |
Holidaybreak PLC | 72,426 | | 714,047 |
Common Stocks - continued |
| Shares | | Value (Note 1) |
United Kingdom - continued |
Hornby PLC | 471,440 | | $2,391,103 |
Hunting PLC | 530,400 | | 1,832,416 |
Icap PLC | 298,550 | | 1,283,795 |
Ideal Shopping Direct PLC (a) | 273,686 | | 749,379 |
Inchcape PLC | 30,122 | | 818,128 |
International Energy Group Ltd. | 1,148,800 | | 3,937,187 |
Intertek Group PLC | 116,310 | | 1,470,511 |
ITE Group PLC | 3,133,116 | | 4,505,299 |
ITM Power PLC | 2,700,000 | | 3,845,283 |
Jubilee Platinum PLC (a)(e) | 3,852,022 | | 1,822,757 |
Kesa Electricals PLC | 556,201 | | 2,780,120 |
Lambert Howarth Group PLC (e) | 1,320,284 | | 6,550,794 |
Landround PLC | 74,400 | | 345,221 |
Lastminute.com PLC (a) | 1,749,526 | | 3,584,743 |
Lawrence PLC | 1,073,124 | | 7,424,679 |
London Clubs International PLC (a) | 1,172,500 | | 2,510,161 |
LTG Technologies PLC (a) | 6,914,968 | | 1,207,193 |
Man Group PLC | 36,969 | | 887,925 |
Manganese Bronze Holdings PLC | 239,797 | | 846,073 |
Manpower Software PLC (a) | 258,824 | | 160,524 |
Marlborough Stirling PLC | 793,069 | | 648,536 |
Matchnet PLC unit (a) | 823,933 | | 5,271,935 |
Meridian Petroleum PLC | 2,747,000 | | 1,438,687 |
Microgen PLC (a) | 289,948 | | 303,709 |
N Brown Group PLC | 439,410 | | 1,037,614 |
NDS Group PLC sponsored ADR (a) | 105,154 | | 2,751,880 |
Ocean Wilsons Holdings Ltd. | 170,311 | | 604,036 |
Oystertec PLC (a) | 7,009,687 | | 3,155,931 |
P&MM Group PLC (e) | 2,035,000 | | 2,299,865 |
Peacock Group PLC | 835,318 | | 3,968,032 |
Phytopharm PLC (a) | 528,100 | | 1,455,694 |
Pilat Media Global PLC (a)(e) | 2,880,000 | | 2,196,359 |
PlusNet Technologies Ltd. | 912,355 | | 2,347,225 |
Premier Oil PLC (a) | 159,291 | | 1,832,434 |
Proteome Sciences PLC (a) | 645,184 | | 889,217 |
Provident Financial PLC | 434,894 | | 4,671,224 |
Psion PLC | 2,900,000 | | 3,130,896 |
QA PLC (a) | 13,554,656 | | 592,827 |
Regal Petroleum PLC (a) | 137,516 | | 865,519 |
Royalblue Group PLC | 210,803 | | 1,646,374 |
Sanctuary Group PLC | 3,046,215 | | 2,337,114 |
SCI Entertainment Group PLC (a) | 401,531 | | 1,014,576 |
Common Stocks - continued |
| Shares | | Value (Note 1) |
United Kingdom - continued |
SDL PLC (a) | 227,897 | | $487,896 |
Sibir Energy PLC (a) | 1,162,800 | | 299,155 |
Sinclair Pharma PLC | 734,198 | | 1,517,849 |
SkyePharma PLC (a) | 124,100 | | 121,438 |
Sondex PLC | 354,900 | | 1,317,408 |
Spice Holdings PLC | 1,362,100 | | 3,566,865 |
Sportingbet PLC | 345,100 | | 697,590 |
Sterling Energy PLC (a) | 4,035,800 | | 1,409,114 |
SubSea Resources PLC (a) | 7,222,500 | | 2,654,485 |
SubSea Resources PLC warrants 11/4/09 (a) | 1,805,625 | | 33 |
Taghmen Energy Ltd. | 2,279,573 | | 1,481,722 |
Teesland PLC | 1,380,000 | | 1,711,771 |
Tikit Group PLC (e) | 822,761 | | 2,154,524 |
ukbetting PLC (a) | 2,517,419 | | 1,954,542 |
Unibet Group PLC unit | 55,964 | | 1,589,999 |
Urbium PLC | 141,255 | | 1,265,439 |
William Hill PLC | 333,186 | | 2,994,046 |
William Ransom & Son PLC (e) | 2,684,500 | | 2,392,588 |
Windsor PLC | 700,000 | | 546,701 |
Wolfson Microelectronics PLC | 685,250 | | 1,240,361 |
Xstrata PLC | 133,500 | | 2,073,007 |
TOTAL UNITED KINGDOM | | 183,382,016 |
United States of America - 1.8% |
Frontier Mining Ltd. (e) | 4,487,533 | | 1,443,140 |
Golden Telecom, Inc. (d) | 88,900 | | 2,532,761 |
Marathon Oil Corp. | 39,900 | | 1,520,589 |
NTL, Inc. (a) | 69,000 | | 4,589,190 |
Private Media Group, Inc. (a)(d) | 202,400 | | 514,096 |
ResMed, Inc. CHESS Depositary Interests (a) | 642,463 | | 3,054,630 |
Solar Integrated Technologies, Inc. | 876,373 | | 2,214,392 |
Valero Energy Corp. | 41,400 | | 1,778,958 |
XL TechGroup, Inc. | 736,700 | | 2,707,594 |
TOTAL UNITED STATES OF AMERICA | | 20,355,350 |
TOTAL COMMON STOCKS (Cost $910,182,332) | 1,085,177,913 |
Nonconvertible Preferred Stocks - 1.1% |
| Shares | | Value (Note 1) |
Germany - 0.7% |
Fresenius AG | 49,105 | | $4,166,270 |
Fresenius Medical Care AG | 68,266 | | 3,736,387 |
TOTAL GERMANY | | 7,902,657 |
Italy - 0.4% |
Buzzi Unicem Spa (Risp) | 483,900 | | 4,415,230 |
TOTAL NONCONVERTIBLE PREFERRED STOCKS (Cost $9,850,251) | 12,317,887 |
Money Market Funds - 8.3% |
| | | |
Fidelity Cash Central Fund, 1.79% (b) | 31,425,450 | | 31,425,450 |
Fidelity Securities Lending Cash Central Fund, 1.77% (b)(c) | 62,835,268 | | 62,835,268 |
TOTAL MONEY MARKET FUNDS (Cost $94,260,718) | 94,260,718 |
TOTAL INVESTMENT PORTFOLIO - 104.9% (Cost $1,014,293,301) | | 1,191,756,518 |
NET OTHER ASSETS - (4.9)% | | (55,719,257) |
NET ASSETS - 100% | $1,136,037,261 |
Legend |
(a)Non-income producing |
(b)Affiliated fund that is available only to investment companies and other accounts managed by Fidelity Investments. The rate quoted is the annualized seven-day yield of the fund at period end. A complete listing of the fund's holdings as of its most recent fiscal year end is available upon request. |
(c)Includes investment made with cash collateral received from securities on loan. |
(d)Security or a portion of the security is on loan at period end. |
(e)Affiliated company |
(f)Restricted securities - Investment in securities not registered under the Securities Act of 1933 (excluding 144A issues). At the end of the period, the value of restricted securities (excluding 144A issues) amounted to $1,024,682 or 0.1% of net assets. |
Additional information on each holding is as follows: |
Security | Acquisition Date | Acquisition Cost |
Western Canadian Coal Corp. | 9/29/04 | $0 |
Other Information |
An affiliated company is a company in which the fund has ownership of at least 5% of the voting securities. Companies which are affiliates of the fund at period-end are noted in the fund's Schedule of Investments. Transactions during the period with companies which are or were affiliates are as follows: |
Affiliates | Value, beginning of period | Purchases | Sales Proceeds | Dividend Income | Value,
end of
period |
Advanced Technology (UK) PLC | $- | $677,635 | $- | $- | $558,207 |
Alliance Pharma PLC | - | 1,378,455 | - | - | 1,811,686 |
Articon-Integralis AG (Reg.) | - | 3,216,353 | 382,484 | - | - |
Corac Group PLC | - | 2,448,084 | - | - | 2,460,487 |
Frontier Mining Ltd. | - | 1,213,216 | - | - | 1,443,140 |
Jubilee Platinum PLC | - | 1,879,542 | 562,643 | - | 1,822,757 |
Lambert Howarth Group PLC | 4,376,721 | 1,140,404 | - | 228,933 | 6,550,794 |
Online Travel Corp. PLC | 2,164,843 | - | - | - | - |
Ontzinc Corp. | - | 1,719,571 | - | - | 1,841,458 |
P&MM Group PLC | - | 1,986,262 | - | - | 2,299,865 |
Pilat Media Global PLC | - | 2,810,095 | - | - | 2,196,359 |
Tikit Group PLC | - | 2,069,038 | - | 24,172 | 2,154,524 |
Wedins Norden AB Series B | 956,215 | 2,235,131 | 1,034,922 | - | - |
William Ransom & Son PLC | - | 2,458,423 | - | 48,384 | 2,392,588 |
Totals | $7,497,779 | $25,232,209 | $1,980,049 | $301,489 | $25,531,865 |
See accompanying notes which are an integral part of the financial statements.
Annual Report
Financial Statements
Statement of Assets and Liabilities
October 31, 2004 |
| | |
Assets | | |
Investment in securities, at value (including securities loaned of $58,511,696) (cost $1,014,293,301) - See accompanying schedule | | $1,191,756,518 |
Cash | | 153,592 |
Foreign currency held at value (cost $5,447,045) | | 5,423,146 |
Receivable for investments sold | | 9,813,009 |
Receivable for fund shares sold | | 2,888,611 |
Dividends receivable | | 1,251,600 |
Interest receivable | | 38,100 |
Other affiliated receivables | | 3,355 |
Other receivables | | 129,888 |
Total assets | | 1,211,457,819 |
| | |
Liabilities | | |
Payable for investments purchased | $9,970,193 | |
Payable for fund shares redeemed | 1,253,833 | |
Accrued management fee | 896,565 | |
Distribution fees payable | 19,420 | |
Other affiliated payables | 246,714 | |
Other payables and accrued expenses | 198,565 | |
Collateral on securities loaned, at value | 62,835,268 | |
Total liabilities | | 75,420,558 |
| | |
Net Assets | | $1,136,037,261 |
Net Assets consist of: | | |
Paid in capital | | $898,686,393 |
Undistributed net investment income | | 5,017,937 |
Accumulated undistributed net realized gain (loss) on investments and foreign currency transactions | | 54,860,187 |
Net unrealized appreciation (depreciation) on investments and assets and liabilities in foreign currencies | | 177,472,744 |
Net Assets | | $1,136,037,261 |
See accompanying notes which are an integral part of the financial statements.
Annual Report
Financial Statements - continued
Statement of Assets and Liabilities - continued
October 31, 2004 |
| | |
Calculation of Maximum Offering Price
Class A:
Net Asset Value and redemption price per share
($13,277,823 ÷ 624,767 shares) | | $21.25 |
| | |
Maximum offering price per share (100/94.25 of $21.25) | | $22.55 |
Class T:
Net Asset Value and redemption price per share ($15,131,252 ÷ 713,891 shares) | | $21.20 |
| | |
Maximum offering price per share (100/96.50 of $21.20) | | $21.97 |
Class B:
Net Asset Value and offering price per share ($5,060,793 ÷ 241,137 shares) A | | $20.99 |
| | |
Class C:
Net Asset Value and offering price per share ($8,664,337 ÷ 411,711 shares) A | | $21.04 |
| | |
| | |
International Small Cap:
Net Asset Value, offering price and redemption price per share ($1,091,335,065 ÷ 51,091,331 shares) | | $21.36 |
| | |
Institutional Class:
Net Asset Value, offering price and redemption price per share ($2,567,991 ÷ 120,234 shares) | | $21.36 |
ARedemption price per share is equal to net asset value less any applicable contingent deferred sales charge.
See accompanying notes which are an integral part of the financial statements.
Annual Report
Statement of Operations
Year ended October 31, 2004 |
| | |
Investment Income | | |
Dividends (including $301,489 received from
affiliated issuers) | | $17,760,750 |
Interest | | 500,442 |
Security lending | | 1,159,171 |
| | 19,420,363 |
Less foreign taxes withheld | | (1,435,129) |
Total income | | 17,985,234 |
| | |
Expenses | | |
Management fee
Basic fee | $8,826,255 | |
Performance adjustment | 713,427 | |
Transfer agent fees | 2,181,571 | |
Distribution fees | 153,758 | |
Accounting and security lending fees | 516,934 | |
Non-interested trustees' compensation | 4,963 | |
Custodian fees and expenses | 574,790 | |
Registration fees | 266,493 | |
Audit | 41,794 | |
Legal | 19,756 | |
Interest | 2,571 | |
Miscellaneous | 54,905 | |
Total expenses before reductions | 13,357,217 | |
Expense reductions | (235,589) | 13,121,628 |
Net investment income (loss) | | 4,863,606 |
Realized and Unrealized Gain (Loss) Net realized gain (loss) on: | | |
Investment securities (Including realized gain (loss) of $(1,489,101) from affiliated issuers) | 55,896,770 | |
Foreign currency transactions | (196,336) | |
Total net realized gain (loss) | | 55,700,434 |
Change in net unrealized appreciation (depreciation) on: Investment securities | 104,967,642 | |
Assets and liabilities in foreign currencies | 20,845 | |
Total change in net unrealized appreciation (depreciation) | | 104,988,487 |
Net gain (loss) | | 160,688,921 |
Net increase (decrease) in net assets resulting from operations | | $165,552,527 |
See accompanying notes which are an integral part of the financial statements.
Annual Report
Financial Statements - continued
Statement of Changes in Net Assets
| Year ended
October 31,
2004 | Year ended
October 31,
2003 |
Increase (Decrease) in Net Assets | | |
Operations | | |
Net investment income (loss) | $4,863,606 | $516,714 |
Net realized gain (loss) | 55,700,434 | 11,443,482 |
Change in net unrealized appreciation (depreciation) | 104,988,487 | 72,481,971 |
Net increase (decrease) in net assets resulting
from operations | 165,552,527 | 84,442,167 |
Distributions to shareholders from net investment income | (740,885) | - |
Distributions to shareholders from net realized gain | (11,573,205) | (27,060) |
Total distributions | (12,314,090) | (27,060) |
Share transactions - net increase (decrease) | 422,159,706 | 470,607,516 |
Redemption fees | 1,900,450 | 290,434 |
Total increase (decrease) in net assets | 577,298,593 | 555,313,057 |
| | |
Net Assets | | |
Beginning of period | 558,738,668 | 3,425,611 |
End of period (including undistributed net investment income of $5,017,937 and undistributed net investment income of $614,412, respectively) | $1,136,037,261 | $558,738,668 |
See accompanying notes which are an integral part of the financial statements.
Annual Report
Financial Highlights - Class A
Years ended October 31, | 2004 | 2003 G |
Selected Per-Share Data | | |
Net asset value, beginning of period | $17.69 | $12.35 |
Income from Investment Operations | | |
Net investment income (loss) E | .02 | .02 F |
Net realized and unrealized gain (loss) | 3.83 | 5.30 |
Total from investment operations | 3.85 | 5.32 |
Distributions from net investment income | (.02) | - |
Distributions from net realized gain | (.31) | - |
Total distributions | (.33) | - |
Redemption fees added to paid in capital E | .04 | .02 |
Net asset value, end of period | $21.25 | $17.69 |
Total Return B, C, D | 22.36% | 43.24% |
Ratios to Average Net Assets H | | |
Expenses before expense reductions | 1.71% | 1.77% A |
Expenses net of voluntary waivers, if any | 1.71% | 1.77% A |
Expenses net of all reductions | 1.69% | 1.74% A |
Net investment income (loss) | .09% | .28% A |
Supplemental Data | | |
Net assets, end of period (000 omitted) | $13,278 | $4,960 |
Portfolio turnover rate | 77% | 84% A |
AAnnualized
BTotal returns for periods of less than one year are not annualized.
CTotal returns would have been lower had certain expenses not been reduced during the periods shown.
DTotal returns do not include the effect of the sales charges.
ECalculated based on average shares outstanding during the period.
FInvestment income per share reflects a special dividend which amounted to $.01 per share.
GFor the period May 27, 2003 (commencement of sale of shares) to October 31, 2003.
HExpense ratios reflect operating expenses of the class. Expenses before reductions do not reflect amounts reimbursed by the investment adviser or reductions from brokerage service arrangements or other expense offset arrangements and do not represent the amount paid by the class during periods when reimbursements or reductions occur. Expense ratios before reductions for start-up periods may not be representative of longer-term operating periods. Expenses net of any voluntary waivers reflect expenses after reimbursement by the investment adviser but prior to reductions from brokerage service arrangements or other expense offset arrangements. Expenses net of all reductions represent the net expenses paid by the class.
See accompanying notes which are an integral part of the financial statements.
Annual Report
Financial Highlights - Class T
Years ended October 31, | 2004 | 2003 G |
Selected Per-Share Data | | |
Net asset value, beginning of period | $17.68 | $12.35 |
Income from Investment Operations | | |
Net investment income (loss) E | (.03) | -F,I |
Net realized and unrealized gain (loss) | 3.83 | 5.31 |
Total from investment operations | 3.80 | 5.31 |
Distributions from net investment income | (.01) | - |
Distributions from net realized gain | (.31) | - |
Total distributions | (.32) | - |
Redemption fees added to paid in capital E | .04 | .02 |
Net asset value, end of period | $21.20 | $17.68 |
Total Return B,C,D | 22.07% | 43.16% |
Ratios to Average Net AssetsH | | |
Expenses before expense reductions | 1.94% | 2.12% A |
Expenses net of voluntary waivers, if any | 1.94% | 2.12% A |
Expenses net of all reductions | 1.92% | 2.09% A |
Net investment income (loss) | (.14)% | (.07)%A |
Supplemental Data | | |
Net assets, end of period (000 omitted) | $15,131 | $3,990 |
Portfolio turnover rate | 77% | 84% A |
AAnnualized
BTotal returns for periods of less than one year are not annualized.
CTotal returns would have been lower had certain expenses not been reduced during the periods shown.
DTotal returns do not include the effect of the sales charges.
ECalculated based on average shares outstanding during the period.
FInvestment income per share reflects a special dividend which amounted to $.01 per share.
GFor the period May 27, 2003 (commencement of sale of shares) to October 31, 2003.
HExpense ratios reflect operating expenses of the class. Expenses before reductions do not reflect amounts reimbursed by the investment adviser or reductions from brokerage service arrangements or other expense offset arrangements and do not represent the amount paid by the class during periods when reimbursements or reductions occur. Expense ratios before reductions for start-up periods may not be representative of longer-term operating periods. Expenses net of any voluntary waivers reflect expenses after reimbursement by the investment adviser but prior to reductions from brokerage service arrangements or other expense offset arrangements. Expenses net of all reductions represent the net expenses paid by the class.
IAmount represents less than $.01 per share.
See accompanying notes which are an integral part of the financial statements.
Annual Report
Financial Highlights - Class B
Years ended October 31, | 2004 | 2003 G |
Selected Per-Share Data | | |
Net asset value, beginning of period | $17.62 | $12.35 |
Income from Investment Operations | | |
Net investment income (loss) E | (.16) | (.05) F |
Net realized and unrealized gain (loss) | 3.80 | 5.30 |
Total from investment operations | 3.64 | 5.25 |
Distributions from net realized gain | (.31) | - |
Redemption fees added to paid in capital E | .04 | .02 |
Net asset value, end of period | $20.99 | $17.62 |
Total Return B, C, D | 21.21% | 42.67% |
Ratios to Average Net Assets H | | |
Expenses before expense reductions | 2.63% | 2.76% A |
Expenses net of voluntary waivers, if any | 2.63% | 2.76%A |
Expenses net of all reductions | 2.60% | 2.73%A |
Net investment income (loss) | (.83)% | (.71)%A |
Supplemental Data | | |
Net assets, end of period (000 omitted) | $5,061 | $1,016 |
Portfolio turnover rate | 77% | 84%A |
AAnnualized
BTotal returns for periods of less than one year are not annualized.
CTotal returns would have been lower had certain expenses not been reduced during the periods shown.
DTotal returns do not include the effect of the contingent deferred sales charge.
ECalculated based on average shares outstanding during the period.
FInvestment income per share reflects a special dividend which amounted to $.01 per share.
GFor the period May 27, 2003 (commencement of sale of shares) to October 31, 2003.
HExpense ratios reflect operating expenses of the class. Expenses before reductions do not reflect amounts reimbursed by the investment adviser or reductions from brokerage service arrangements or other expense offset arrangements and do not represent the amount paid by the class during periods when reimbursements or reductions occur. Expense ratios before reductions for start-up periods may not be representative of longer-term operating periods. Expenses net of any voluntary waivers reflect expenses after reimbursement by the investment adviser but prior to reductions from brokerage service arrangements or other expense offset arrangements. Expenses net of all reductions represent the net expenses paid by the class.
See accompanying notes which are an integral part of the financial statements.
Annual Report
Financial Highlights - Class C
Years ended October 31, | 2004 | 2003 G |
Selected Per-Share Data | | |
Net asset value, beginning of period | $17.64 | $12.35 |
Income from Investment Operations | | |
Net investment income (loss) E | (.12) | (.04) F |
Net realized and unrealized gain (loss) | 3.80 | 5.31 |
Total from investment operations | 3.68 | 5.27 |
Distributions from net investment income | (.01) | - |
Distributions from net realized gain | (.31) | - |
Total distributions | (.32) | - |
Redemption fees added to paid in capital E | .04 | .02 |
Net asset value, end of period | $21.04 | $17.64 |
Total Return B, C, D | 21.43% | 42.83% |
Ratios to Average Net Assets H | | |
Expenses before expense reductions | 2.43% | 2.57% A |
Expenses net of voluntary waivers, if any | 2.43% | 2.57% A |
Expenses net of all reductions | 2.40% | 2.55% A |
Net investment income (loss) | (.62)% | (.52)%A |
Supplemental Data | | |
Net assets, end of period (000 omitted) | $8,664 | $1,383 |
Portfolio turnover rate | 77% | 84% A |
AAnnualized
BTotal returns for periods of less than one year are not annualized.
CTotal returns would have been lower had certain expenses not been reduced during the periods shown.
DTotal returns do not include the effect of the contingent deferred sales charge.
ECalculated based on average shares outstanding during the period.
FInvestment income per share reflects a special dividend which amounted to $.01 per share.
GFor the period May 27, 2003 (commencement of sale of shares) to October 31, 2003.
HExpense ratios reflect operating expenses of the class. Expenses before reductions do not reflect amounts reimbursed by the investment adviser or reductions from brokerage service arrangements or other expense offset arrangements and do not represent the amount paid by the class during periods when reimbursements or reductions occur. Expense ratios before reductions for start-up periods may not be representative of longer-term operating periods. Expenses net of any voluntary waivers reflect expenses after reimbursement by the investment adviser but prior to reductions from brokerage service arrangements or other expense offset arrangements. Expenses net of all reductions represent the net expenses paid by the class.
See accompanying notes which are an integral part of the financial statements.
Annual Report
Financial Highlights - International Small Cap
Years ended October 31, | 2004 | 2003 | 2002 F |
Selected Per-Share Data | | | |
Net asset value, beginning of period | $17.71 | $9.87 | $10.00 |
Income from Investment Operations | | | |
Net investment income (loss) D | .10 | .07 E | (.01) |
Net realized and unrealized gain (loss) | 3.84 | 7.75 | (.12) |
Total from investment operations | 3.94 | 7.82 | (.13) |
Distributions from net investment income | (.02) | - | - |
Distributions from net realized gain | (.31) | (.02) | - |
Total distributions | (.33) | (.02) | - |
Redemption fees added to paid in capital D | .04 | .04 | - H |
Net asset value, end of period | $21.36 | $17.71 | $9.87 |
Total Return B, C | 22.84% | 79.78% | (1.30)% |
Ratios to Average Net Assets G | | | |
Expenses before expense reductions | 1.30% | 1.54% | 13.70% A |
Expenses net of voluntary waivers, if any | 1.30% | 1.54% | 1.80% A |
Expenses net of all reductions | 1.28% | 1.51% | 1.80% A |
Net investment income (loss) | .50% | .46% | (.56)% A |
Supplemental Data | | | |
Net assets, end of period (000 omitted) | $1,091,335 | $546,989 | $3,426 |
Portfolio turnover rate | 77% | 84% | 85% A |
AAnnualized
BTotal returns for periods of less than one year are not annualized.
CTotal returns would have been lower had certain expenses not been reduced during the periods shown.
DCalculated based on average shares outstanding during the period.
EInvestment income per share reflects a special dividend which amounted to $.03 per share.
FFor the period September 18, 2002 (commencement of operations) to October 31, 2002.
GExpense ratios reflect operating expenses of the class. Expenses before reductions do not reflect amounts reimbursed by the investment adviser or reductions from brokerage service arrangements or other expense offset arrangements and do not represent the amount paid by the class during periods when reimbursements or reductions occur. Expense ratios before reductions for start-up periods may not be representative of longer-term operating periods. Expenses net of any voluntary waivers reflect expenses after reimbursement by the investment adviser but prior to reductions from brokerage service arrangements or other expense offset arrangements. Expenses net of all reductions represent the net expenses paid by the class.
HAmount represents less than $.01 per share.
See accompanying notes which are an integral part of the financial statements.
Annual Report
Financial Highlights - Institutional Class
Years ended October 31, | 2004 | 2003 F |
Selected Per-Share Data | | |
Net asset value, beginning of period | $17.72 | $12.35 |
Income from Investment Operations | | |
Net investment income (loss) D | .10 | .04 E |
Net realized and unrealized gain (loss) | 3.84 | 5.31 |
Total from investment operations | 3.94 | 5.35 |
Distributions from net investment income | (.03) | - |
Distributions from net realized gain | (.31) | - |
Total distributions | (.34) | - |
Redemption fees added to paid in capital D | .04 | .02 |
Net asset value, end of period | $21.36 | $17.72 |
Total Return B, C | 22.84% | 43.48% |
Ratios to Average Net Assets G | | |
Expenses before expense reductions | 1.32% | 1.51% A |
Expenses net of voluntary waivers, if any | 1.32% | 1.51% A |
Expenses net of all reductions | 1.29% | 1.48% A |
Net investment income (loss) | .49% | .54% A |
Supplemental Data | | |
Net assets, end of period (000 omitted) | $2,568 | $401 |
Portfolio turnover rate | 77% | 84% A |
AAnnualized
BTotal returns for periods of less than one year are not annualized.
CTotal returns would have been lower had certain expenses not been reduced during the periods shown.
DCalculated based on average shares outstanding during the period.
EInvestment income per share reflects a special dividend which amounted to $.01 per share.
FFor the period May 27, 2003 (commencement of sale of shares) to October 31, 2003.
GExpense ratios reflect operating expenses of the class. Expenses before reductions do not reflect amounts reimbursed by the investment adviser or reductions from brokerage service arrangements or other expense offset arrangements and do not represent the amount paid by the class during periods when reimbursements or reductions occur. Expense ratios before reductions for start-up periods may not be representative of longer-term operating periods. Expenses net of any voluntary waivers reflect expenses after reimbursement by the investment adviser but prior to reductions from brokerage service arrangements or other expense offset arrangements. Expenses net of all reductions represent the net expenses paid by the class.
See accompanying notes which are an integral part of the financial statements.
Annual Report
Notes to Financial Statements
For the period ended October 31, 2004
1. Significant Accounting Policies.
Fidelity International Small Cap Fund (the fund) is a fund of Fidelity Investment Trust (the trust) and is authorized to issue an unlimited number of shares. The trust is registered under the Investment Company Act of 1940, as amended (the 1940 Act), as an open-end management investment company organized as a Massachusetts business trust.
The fund offers Class A, Class T, Class B, Class C, International Small Cap (the original class), and Institutional Class shares, each of which has equal rights as to assets and voting privileges. Each class has exclusive voting rights with respect to matters that affect that class. Class B shares will automatically convert to Class A shares after a holding period of seven years from the initial date of purchase. Investment income, realized and unrealized capital gains and losses, the common expenses of the fund, and certain fund-level expense reductions, if any, are allocated on a pro rata basis to each class based on the relative net assets of each class to the total net assets of the fund. Each class differs with respect to transfer agent and distribution and service plan fees incurred. Certain expense reductions also differ by class.
The financial statements have been prepared in conformity with accounting principles generally accepted in the United States of America, which require management to make certain estimates and assumptions at the date of the financial statements. The following summarizes the significant accounting policies of the fund:
Security Valuation. Net asset value per share (NAV calculation) is calculated as of the close of business of the New York Stock Exchange, normally 4:00 p.m. Eastern time. Equity securities, including restricted securities, for which market quotations are available are valued at the last sale price or official closing price (closing bid price or last evaluated quote if no sale has occurred) on the primary market or exchange on which they trade. Debt securities, including restricted securities, for which quotations are readily available are valued at their most recent bid prices (sales prices if the principal market is an exchange) in the principal market in which such securities are normally traded, as determined by recognized dealers in such securities, or securities are valued on the basis of information provided by a pricing service. Pricing services use valuation matrices that incorporate both dealer-supplied valuations and valuation models. If prices are not readily available or do not accurately reflect fair value for a security, or if a security's value has been materially affected by events occurring after the close of the exchange or market on which the security is principally traded, that security may be valued by another method that the Board of Trustees believes accurately reflects fair value. A security's valuation may differ depending on the method used for determining value. Price movements in futures contracts and ADRs, market and trading trends, the bid/ask quotes of brokers and off-exchange institutional trading may be reviewed in the course of making a good faith determination of a security's fair value. Short-term securities with remaining maturities of sixty days or less for which quotations are not readily
Annual Report
Notes to Financial Statements - continued
1. Significant Accounting Policies - continued
Security Valuation - continued
available are valued on the basis of amortized cost. Investments in open-end investment companies are valued at their net asset value each business day.
Foreign Currency. The fund uses foreign currency contracts to facilitate transactions in foreign-denominated securities. Losses from these transactions may arise from changes in the value of the foreign currency or if the counterparties do not perform under the contracts' terms.
Foreign-denominated assets, including investment securities, and liabilities are translated into U.S. dollars at the exchange rate at period end. Purchases and sales of investment securities, income and dividends received and expenses denominated in foreign currencies are translated into U.S. dollars at the exchange rate in effect on the transaction date.
The effects of exchange rate fluctuations on investments are included with the net realized and unrealized gain (loss) on investment securities. Other foreign currency transactions resulting in realized and unrealized gain (loss) are disclosed separately.
Investment Transactions and Income. Security transactions are accounted for as of trade date. Gains and losses on securities sold are determined on the basis of identified cost and may include proceeds received from litigation. Dividend income is recorded on the ex-dividend date, except for certain dividends from foreign securities where the ex-dividend date may have passed, which are recorded as soon as the fund is informed of the ex-dividend date. Non-cash dividends included in dividend income, if any, are recorded at the fair market value of the securities received. Interest income is accrued as earned. Interest income includes coupon interest and amortization of premium and accretion of discount on debt securities. Investment income is recorded net of foreign taxes withheld where recovery of such taxes is uncertain.
Expenses. Most expenses of the trust can be directly attributed to a fund. Expenses which cannot be directly attributed are apportioned among the funds in the trust.
Income Tax Information and Distributions to Shareholders. Each year, the fund intends to qualify as a regulated investment company by distributing all of its taxable income and realized gains under Subchapter M of the Internal Revenue Code. As a result, no provision for income taxes is required in the accompanying financial statements. Foreign taxes are provided for based on the fund's understanding of the tax rules and rates that exist in the foreign markets in which it invests.
Annual Report
1. Significant Accounting Policies - continued
Income Tax Information and Distributions to Shareholders - continued
Distributions are recorded on the ex-dividend date. Income dividends and capital gain distributions are declared separately for each class. Income and capital gain distributions are determined in accordance with income tax regulations, which may differ from generally accepted accounting principles. In addition, the fund will claim a portion of the payment made to redeeming shareholders as a distribution for income tax purposes.
Capital accounts within the financial statements are adjusted for permanent book-tax differences. These adjustments have no impact on net assets or the results of operations. Temporary book-tax differences will reverse in a subsequent period.
Book-tax differences are primarily due to foreign currency transactions, passive foreign investment companies (PFIC) and losses deferred due to wash sales.
The tax-basis components of distributable earnings and the federal tax cost as of period end were as follows:
Unrealized appreciation | $217,728,209 | |
Unrealized depreciation | (43,208,604) | |
Net unrealized appreciation (depreciation) | 174,519,605 | |
Undistributed ordinary income | 30,238,812 | |
Undistributed long-term capital gain | 18,049,009 | |
| | |
Cost for federal income tax purposes | $1,017,236,913 | |
The tax character of distributions paid was as follows:
| October 31,
2004 | October 31,
2003 |
Ordinary Income | $12,314,090 | $ 27,060 |
Short-Term Trading (Redemption) Fees. Shares held in the fund less than 90 days are subject to a redemption fee equal to 2.00% of the proceeds of the redeemed shares. All redemption fees, including any estimated redemption fees paid by Fidelity Management & Research Company (FMR), are retained by the fund and accounted for as an addition to paid in capital.
Annual Report
Notes to Financial Statements - continued
2. Operating Policies.
Repurchase Agreements. FMR has received an Exemptive Order from the Securities and Exchange Commission (the SEC) which permits the fund and other affiliated entities of FMR to transfer uninvested cash balances into joint trading accounts. These accounts are then invested in repurchase agreements that are collateralized by U.S. Treasury or Government obligations. The fund may also invest directly with institutions, in repurchase agreements that are collateralized by commercial paper obligations and corporate obligations. Collateral is held in segregated accounts with custodian banks and may be obtained in the event of a default of the counterparty. Collateral is marked-to-market daily and maintained at a value at least equal to the principal amount of the repurchase agreement (including accrued interest).
Restricted Securities. The fund may invest in securities that are subject to legal or contractual restrictions on resale. These securities generally may be resold in transactions exempt from registration or to the public if the securities are registered. Disposal of these securities may involve time-consuming negotiations and expense, and prompt sale at an acceptable price may be difficult. Information regarding restricted securities is included at the end of the fund's Schedule of Investments.
3. Purchases and Sales of Investments.
Purchases and sales of securities, other than short-term securities and U.S. government securities, aggregated $1,186,404,079 and $735,977,091, respectively.
4. Fees and Other Transactions with Affiliates.
Management Fee. FMR and its affiliates provide the fund with investment management related services for which the fund pays a monthly management fee. The management fee is the sum of an individual fund fee rate that is based on an annual rate of .60% of the fund's average net assets and a group fee rate that averaged .28% during the period. The group fee rate is based upon the average net assets of all the mutual funds advised by FMR. The group fee rate decreases as assets under management increase and increases as assets under management decrease. In addition, the management fee is subject to a performance adjustment (up to a maximum of ±.20% of the fund's average net assets over a 36 month performance period). The upward or downward adjustment to the management fee is based on the investment performance of the asset-weighted return of all classes as compared to an appropriate benchmark index. For the period, the total annual management fee rate, including the performance adjustment, was .94% of the fund's average net assets.
Annual Report
4. Fees and Other Transactions with Affiliates - continued
Distribution and Service Plan. In accordance with Rule 12b-1 of the 1940 Act, the Fund has adopted separate Distribution and Service Plans for each class of shares. Certain classes pay Fidelity Distributors Corporation (FDC), an affiliate of FMR, separate Distribution and Service Fees, each of which is based on an annual percentage of each class' average net assets. In addition, FDC may pay financial intermediaries for selling shares of the fund and providing shareholder support services. For the period, the Distribution and Service Fee rates and the total amounts paid to and retained by FDC were as follows:
| Distribution
Fee | Service
Fee | Paid to
FDC | Retained
by FDC |
Class A | 0% | .25% | $20,474 | $325 |
Class T | .25% | .25% | 49,312 | 539 |
Class B | .75% | .25% | 31,386 | 23,852 |
Class C | .75% | .25% | 52,586 | 37,268 |
| | | $153,758 | $61,984 |
Sales Load. FDC receives a front-end sales charge of up to 5.75% for selling Class A shares, and 3.50% for selling Class T shares, some of which is paid to financial intermediaries for selling shares of the fund. FDC receives the proceeds of contingent deferred sales charges levied on Class A, Class T, Class B, and Class C redemptions. These charges depend on the holding period. The deferred sales charges range from 5% to 1% for Class B, 1% for Class C, and .25% for certain purchases of Class A and Class T shares.
For the period, sales charge amounts retained by FDC were as follows:
| Retained
by FDC | |
Class A | $29,979 | |
Class T | 10,916 | |
Class B * | 3,470 | |
Class C * | 5,990 | |
| $50,355 | |
*When Class B and Class C shares are initially sold, FDC pays commissions from its own resources to financial intermediaries through which the sales are made.
Annual Report
Notes to Financial Statements - continued
4. Fees and Other Transactions with Affiliates - continued
Transfer Agent Fees. Fidelity Investments Institutional Operations Company, Inc. (FIIOC), an affiliate of FMR, is the transfer, dividend disbursing and shareholder servicing agent for each class of the fund, except for International Small Cap. Fidelity Service Company, Inc. (FSC), an affiliate of FMR, is the transfer agent for International Small Cap shares. FIIOC and FSC receive account fees and asset-based fees that vary according to the account size and type of account of the shareholders of the respective classes of the fund. FIIOC and FSC pay for typesetting, printing and mailing of shareholder reports, except proxy statements. For the period the total transfer agent fees paid by each class to FIIOC or FSC, were as follows:
| Amount | % of
Average
Net Assets |
Class A | $30,826 | .37 |
Class T | 35,396 | .36 |
Class B | 17,158 | .54 |
Class C | 18,101 | .34 |
International Small Cap | 2,076,187 | .21 |
Institutional Class | 3,903 | .23 |
| $2,181,571 | |
Accounting and Security Lending Fees. FSC maintains the fund's accounting records. The accounting fee is based on the level of average net assets for the month. Under a separate contract, FSC administers the security lending program. The security lending fee is based on the number and duration of lending transactions.
Central Funds. The fund may invest in affiliated Central Funds managed by Fidelity Investments Money Management, Inc. (FIMM), an affiliate of FMR. The Central Funds are open-end investment companies available only to investment companies and other accounts managed by FMR and its affiliates. The Central Funds seek preservation of capital and current income and do not pay a management fee. Income distributions earned by the fund are recorded as income in the accompanying financial statements and totaled $459,974 for the period.
Brokerage Commissions. The fund placed a portion of its portfolio transactions with brokerage firms which are affiliates of the investment adviser. The commissions paid to these affiliated firms were $2 for the period.
Annual Report
4. Fees and Other Transactions with Affiliates - continued
Interfund Lending Program. Pursuant to an Exemptive Order issued by the SEC, the fund, along with other registered investment companies having management contracts with FMR, may participate in an interfund lending program. This program provides an alternative credit facility allowing the funds to borrow from, or lend money to, other participating funds. At period end, there were no interfund loans outstanding. The fund's activity in this program during the period was as follows:
Borrower or Lender | Average Daily Loan Balance | Weighted Average Interest Rate | Interest Expense |
Borrower | $27,505,333 | 1.12% | $2,571 |
5. Committed Line of Credit.
The fund participates with other funds managed by FMR in a $4.2 billion credit facility (the "line of credit") to be utilized for temporary or emergency purposes to fund shareholder redemptions or for other short-term liquidity purposes. The fund has agreed to pay commitment fees on its pro rata portion of the line of credit. During the period, there were no borrowings on this line of credit.
6. Security Lending.
The fund lends portfolio securities from time to time in order to earn additional income. The fund receives collateral (in the form of U.S. Treasury obligations, letters of credit and/or cash) against the loaned securities and maintains collateral in an amount not less than 100% of the market value of the loaned securities during the period of the loan. The market value of the loaned securities is determined at the close of business of the fund and any additional required collateral is delivered to the fund on the next business day. If the borrower defaults on its obligation to return the securities loaned because of insolvency or other reasons, a fund could experience delays and costs in recovering the securities loaned or in gaining access to the collateral. Cash collateral is invested in cash equivalents. The value of loaned securities and cash collateral at period end are disclosed on the fund's Statement of Assets and Liabilities.
Annual Report
Notes to Financial Statements - continued
7. Expense Reductions.
Many of the brokers with whom FMR places trades on behalf of the fund provided services to the fund in addition to trade execution. These services included payments of certain expenses on behalf of the fund totaling $231,874 for the period. In addition, through arrangements with the fund's custodian, credits realized as a result of uninvested cash balances were used to reduce the fund's expenses. During the period, these credits reduced the fund's custody expenses by $3,715.
8. Distributions to Shareholders.
Distributions to shareholders of each class were as follows:
| Years ended October 31, |
| 2004 | 2003 |
From net investment income | | |
Class A | $3,252 | $- |
Class T | 2,950 | - |
Class C | 1,354 | - |
International Small Cap | 732,332 | - |
Institutional Class | 997 | - |
Total | $740,885 | $- |
From net realized gain | | |
Class A | $50,399 | $- |
Class T | 91,451 | - |
Class B | 28,049 | - |
Class C | 41,980 | - |
International Small Cap | 11,351,027 | 27,060 |
Institutional Class | 10,299 | - |
Total | $11,573,205 | $27,060 |
Annual Report
9. Share Transactions.
Transactions for each class of shares were as follows:
| Shares
Years ended October 31, | Dollars
Years ended October 31, |
| 2004 | 2003 A | 2004 | 2003 A |
Class A | | | | |
Shares sold | 655,161 | 287,827 | $12,872,993 | $4,774,574 |
Reinvestment of distributions | 2,641 | - | 46,931 | - |
Shares redeemed | (313,383) | (7,479) | (5,810,697) | (125,524) |
Net increase (decrease) | 344,419 | 280,348 | $7,109,227 | $4,649,050 |
Class T | | | | |
Shares sold | 729,426 | 229,190 | $14,388,966 | $3,468,992 |
Reinvestment of distributions | 4,802 | - | 85,378 | - |
Shares redeemed | (246,002) | (3,525) | (4,796,147) | (55,853) |
Net increase (decrease) | 488,226 | 225,665 | $9,678,197 | $3,413,139 |
Class B | | | | |
Shares sold | 254,206 | 60,233 | $4,980,844 | $911,644 |
Reinvestment of distributions | 1,477 | - | 26,163 | - |
Shares redeemed | (72,209) | (2,570) | (1,405,301) | (40,678) |
Net increase (decrease) | 183,474 | 57,663 | $3,601,706 | $870,966 |
Class C | | | | |
Shares sold | 412,202 | 88,372 | $8,031,151 | $1,388,024 |
Reinvestment of distributions | 2,245 | - | 39,811 | - |
Shares redeemed | (81,166) | (9,942) | (1,589,819) | (158,911) |
Net increase (decrease) | 333,281 | 78,430 | $6,481,143 | $1,229,113 |
International Small Cap | | | | |
Shares sold | 48,249,110 | 32,919,552 | $942,554,096 | $492,932,712 |
Reinvestment of distributions | 631,834 | 2,491 | 11,252,965 | 25,785 |
Shares redeemed | (28,670,350) | (2,388,222) | (560,463,897) | (32,859,600) |
Net increase (decrease) | 20,210,594 | 30,533,821 | $393,343,164 | $460,098,897 |
Institutional Class | | | | |
Shares sold | 181,090 | 23,006 | $3,601,810 | $351,524 |
Reinvestment of distributions | 290 | - | 5,166 | - |
Shares redeemed | (83,756) | (396) | (1,660,707) | (5,173) |
Net increase (decrease) | 97,624 | 22,610 | $1,946,269 | $346,351 |
AShare transactions for Class A, Class T, Class B, Class C and Institutional Class are for the period May 27, 2003 (commencement of sale of shares) to October 31, 2003.
Annual Report
Report of Independent Registered Public Accounting Firm
To the Trustees of Fidelity Investment Trust and Shareholders of Fidelity International Small Cap Fund:
We have audited the accompanying statement of assets and liabilities of Fidelity International Small Cap Fund (the Fund), a fund of Fidelity Investment Trust, including the portfolio of investments, as of October 31, 2004, and the related statement of operations for the year then ended, the statement of changes in net assets for each of the two years in the period then ended, and the financial highlights for each of the three years in the period then ended. These financial statements and financial highlights are the responsibility of the Fund's management. Our responsibility is to express an opinion on these financial statements and financial highlights based on our audits.
We conducted our audits in accordance with standards of the Public Company Accounting Oversight Board (United States). Those standards require that we plan and perform the audit to obtain reasonable assurance about whether the financial statements and financial highlights are free of material misstatement. An audit includes examining, on a test basis, evidence supporting the amounts and disclosures in the financial statements. Our procedures included confirmation of securities owned as of October 31, 2004, by correspondence with the custodian and brokers; where replies were not received from brokers, we performed other auditing procedures. An audit also includes assessing the accounting principles used and significant estimates made by management, as well as evaluating the overall financial statement presentation. We believe that our audits provide a reasonable basis for our opinion.
In our opinion, the financial statements and financial highlights referred to above present fairly, in all material respects, the financial position of Fidelity International Small Cap Fund as of October 31, 2004, the results of its operations for the year then ended, the changes in its net assets for each of the two years in the period then ended, and its financial highlights for each of the three years in the period then ended, in conformity with accounting principles generally accepted in the United States of America.
/s/DELOITTE & TOUCHE LLP
DELOITTE & TOUCHE LLP
Boston, Massachusetts
December 17, 2004
Annual Report
Trustees and Officers
The Trustees, Members of the Advisory Board, and executive officers of the trust and fund, as applicable, are listed below. The Board of Trustees governs the fund and is responsible for protecting the interests of shareholders. The Trustees are experienced executives who meet periodically throughout the year to oversee the fund's activities, review contractual arrangements with companies that provide services to the fund, and review the fund's performance. Except for William O. McCoy, each of the Trustees oversees 298 funds advised by FMR or an affiliate. Mr. McCoy oversees 300 funds advised by FMR or an affiliate.
The Trustees hold office without limit in time except that (a) any Trustee may resign; (b) any Trustee may be removed by written instrument, signed by at least two-thirds of the number of Trustees prior to such removal; (c) any Trustee who requests to be retired or who has become incapacitated by illness or injury may be retired by written instrument signed by a majority of the other Trustees; and (d) any Trustee may be removed at any special meeting of shareholders by a two-thirds vote of the outstanding voting securities of the trust. In any event, each non-interested Trustee shall retire not later than the last day of the calendar year in which his or her 72nd birthday occurs. The executive officers and Advisory Board Members hold office without limit in time, except that any officer and Advisory Board Member may resign or may be removed by a vote of a majority of the Trustees at any regular meeting or any special meeting of the Trustees. Except as indicated, each individual has held the office shown or other offices in the same company for the past five years.
The fund's Statement of Additional Information (SAI) includes more information about the Trustees. To request a free copy, call Fidelity at 1-877-208-0098.
Interested Trustees*:
Correspondence intended for each Trustee who is an "interested person" (as defined in the 1940 Act) may be sent to Fidelity Investments, 82 Devonshire Street, Boston, Massachusetts 02109.
Name, Age; Principal Occupation |
Edward C. Johnson 3d (74)** |
| Year of Election or Appointment: 1984 Mr. Johnson is Chairman of the Board of Trustees. Mr. Johnson serves as Chief Executive Officer, Chairman, and a Director of FMR Corp.; a Director and Chairman of the Board and of the Executive Committee of FMR; Chairman and a Director of Fidelity Management & Research (Far East) Inc.; Chairman (1998) and a Director of Fidelity Investments Money Management, Inc.; and Chairman (2001) and a Director (2000) of FMR Co., Inc. |
Abigail P. Johnson (42)** |
| Year of Election or Appointment: 2001 Senior Vice President of the fund (2002). Ms. Johnson also serves as Senior Vice President of other Fidelity funds (2001). She is President and a Director of FMR (2001), Fidelity Investments Money Management, Inc. (2001), FMR Co., Inc. (2001), and a Director of FMR Corp. Previously, Ms. Johnson managed a number of Fidelity funds. |
Laura B. Cronin (50) |
| Year of Election or Appointment: 2003 Ms. Cronin is an Executive Vice President (2002) and Chief Financial Officer (2002) of FMR Corp. and is a member of the Fidelity Management Committee (2003). Previously, Ms. Cronin served as Vice President of Finance of FMR (1997-1999), and Chief Financial Officer of FMR (1999-2001), Fidelity Personal Investments (2001), and Fidelity Brokerage Company (2001-2002). |
Robert L. Reynolds (52) |
| Year of Election or Appointment: 2003 Mr. Reynolds is a Director (2003) and Chief Operating Officer (2002) of FMR Corp. and is the head of the Fidelity Management Committee (2003). He also serves on the Board at Fidelity Investments Canada, Ltd. (2000). Previously, Mr. Reynolds served as President of Fidelity Investments Institutional Retirement Group (1996-2000). |
*Trustees have been determined to be "Interested Trustees" by virtue of, among other things, their affiliation with the trust or various entities under common control with FMR.
**Edward C. Johnson 3d, Trustee, is Abigail P. Johnson's father.
Annual Report
Non-Interested Trustees:
Correspondence intended for each non-interested Trustee (that is, the Trustees other than the Interested Trustees) may be sent to Fidelity Investments, P.O. Box 55235, Boston, Massachusetts 02205-5235.
Name, Age; Principal Occupation |
J. Michael Cook (62) |
| Year of Election or Appointment: 2001 Prior to Mr. Cook's retirement in May 1999, he served as Chairman and Chief Executive Officer of Deloitte & Touche LLP (accounting/consulting), Chairman of the Deloitte & Touche Foundation, and a member of the Board of Deloitte Touche Tohmatsu. He currently serves as a Director of Comcast (telecommunications, 2002), International Flavors & Fragrances, Inc. (2000), The Dow Chemical Company (2000), and Northrop Grumman Corporation (global defense technology, 2003). He is a Member of the Diversity Advisory Council of Marakon (2003) and the Advisory Council of the Public Company Accounting Oversight Board (PCAOB), Chairman Emeritus of the Board of Catalyst (a leading organization for the advancement of women in business), and is Chairman of the Accountability Advisory Council to the Comptroller General of the United States. He also serves as a Member of the Advisory Board of the Graduate School of Business of the University of Florida, his alma mater. |
Ralph F. Cox (72) |
| Year of Election or Appointment: 1991 Mr. Cox is President of RABAR Enterprises (management consulting for the petroleum industry). Prior to February 1994, he was President of Greenhill Petroleum Corporation (petroleum exploration and production). Until March 1990, Mr. Cox was President and Chief Operating Officer of Union Pacific Resources Company (exploration and production). He is a Director of CH2M Hill Companies (engineering), and Abraxas Petroleum (petroleum exploration and production, 1999). In addition, he is a member of advisory boards of Texas A&M University and the University of Texas at Austin. |
Robert M. Gates (61) |
| Year of Election or Appointment: 1997 Dr. Gates is President of Texas A&M University (2002). He was Director of the Central Intelligence Agency (CIA) from 1991 to 1993. From 1989 to 1991, Dr. Gates served as Assistant to the President of the United States and Deputy National Security Advisor. Dr. Gates is a Director of NACCO Industries, Inc. (mining and manufacturing), Parker Drilling Co., Inc. (drilling and rental tools for the energy industry, 2001), and Brinker International (restaurant management, 2003). He also serves as a member of the Advisory Board of VoteHere.net (secure Internet voting, 2001). Previously, Dr. Gates served as a Director of LucasVarity PLC (automotive components and diesel engines), a Director of TRW Inc. (automotive, space, defense, and information technology), and Dean of the George Bush School of Government and Public Service at Texas A&M University (1999-2001). Dr. Gates also is a Trustee of the Forum for International Policy. |
George H. Heilmeier (68) |
| Year of Election or Appointment: 2004 Dr. Heilmeier is Chairman Emeritus of Telcordia Technologies (communication software and systems), where prior to his retirement, he served as company Chairman and Chief Executive Officer. He currently serves on the Boards of Directors of The Mitre Corporation (systems engineering and information technology support for the government), INET Technologies Inc. (telecommunications network surveillance, 2001), Teletech Holdings (customer management services), and and HRL Laboratories (private research and development, 2004). He is Chairman of the General Motors Technology Advisory Committee and a Life Fellow of the Institute of Electrical and Electronics Engineers (IEEE) (2000). Dr. Heilmeier is a member of the Defense Science Board and the National Security Agency Advisory Board. He is also a member
of the National Academy of Engineering, the American Academy of Arts and Sciences, and the Board of Overseers of the School of Engineering and Applied Science of the University of Pennsylvania. Previously, Dr. Heilmeier served as a Director of TRW Inc. (automotive, space, defense, and information technology, 1992-2002), Compaq (1994-2002), and Automatic Data Processing, Inc. (ADP) (technology-based business outsourcing, 1995-2002). |
Donald J. Kirk (71) |
| Year of Election or Appointment: 1987 Mr. Kirk is a Governor of the American Stock Exchange (2001), a Trustee and former Chairman of the Board of Trustees of the Greenwich Hospital Association, a Director of the Yale-New Haven Health Services Corp. (1998), and a Director Emeritus and former Chairman of the Board of Directors of National Arts Strategies Inc. (leadership education for arts and culture). Mr. Kirk was an Executive-in-Residence (1995-2000) and a Professor (1987-1995) at Columbia University Graduate School of Business. Prior to 1987, he was Chairman of the Financial Accounting Standards Board. Previously, Mr. Kirk served as a Governor of the National Association of Securities Dealers, Inc. (1996-2002), a member and Vice Chairman of the Public Oversight Board of the American Institute of Certified Public Accountants' SEC Practice Section (1995-2002), a Director of General Re Corporation (reinsurance, 1987-1998) and as a Director of Valuation Research Corp. (appraisals and valuations). |
Marie L. Knowles (58) |
| Year of Election or Appointment: 2001 Prior to Ms. Knowles' retirement in June 2000, she served as Executive Vice President and Chief Financial Officer of Atlantic Richfield Company (ARCO) (diversified energy, 1996-2000). From 1993 to 1996, she was a Senior Vice President of ARCO and President of ARCO Transportation Company. She served as a Director of ARCO from 1996 to 1998. She currently serves as a Director of Phelps Dodge Corporation (copper mining and manufacturing) and McKesson Corporation (healthcare service, 2002). Ms. Knowles is a Trustee of the Brookings Institution and the Catalina Island Conservancy and also serves as a member of the Advisory Board for the School of Engineering of the University of Southern California. |
Ned C. Lautenbach (60) |
| Year of Election or Appointment: 2000 Mr. Lautenbach has been a partner of Clayton, Dubilier & Rice, Inc. (private equity investment firm) since September 1998. Previously, Mr. Lautenbach was with the International Business Machines Corporation (IBM) from 1968 until his retirement in 1998. He was most recently Senior Vice President and Group Executive of Worldwide Sales and Services. From 1993 to 1995, he was Chairman of IBM World Trade Corporation, and from 1994 to 1998 was a member of IBM's Corporate Executive Committee. Mr. Lautenbach serves as Co-Chairman and a Director of Covansys, Inc. (global provider of business and technology solutions, 2000). In addition, he is a Director of Italtel Holding S.p.A. (telecommunications (Milan, Italy), 2004) and Eaton Corporation (diversified industrial) as well as the Philharmonic Center for the Arts in Naples, Florida (1999). He also is a member of the Council on Foreign Relations. |
Marvin L. Mann (71) |
| Year of Election or Appointment: 1993 Mr. Mann is Chairman of the non-interested Trustees (2001). He is Chairman Emeritus of Lexmark International, Inc. (computer peripherals), where he served as CEO until April 1998, retired as Chairman May 1999, and remains a member of the Board. Prior to 1991, he held the positions of Vice President of International Business Machines Corporation (IBM) and President and General Manager of various IBM divisions and subsidiaries. He is a member of the Executive Committee of the Independent Director's Council of the Investment Company Institute. In addition, Mr. Mann is a member of the President's Cabinet at the University of Alabama and the Board of Visitors of the Culverhouse College of Commerce and Business Administration at the University of Alabama. |
William O. McCoy (71) |
| Year of Election or Appointment: 1997 Prior to his retirement in December 1994, Mr. McCoy was Vice Chairman of the Board of BellSouth Corporation (telecommunications) and President of BellSouth Enterprises. He is currently a Director of Liberty Corporation (holding company), Duke Realty Corporation (real estate), and Progress Energy, Inc. (electric utility). He is also a partner of Franklin Street Partners (private investment management firm) and a member of the Research Triangle Foundation Board. In addition, Mr. McCoy served as the Interim Chancellor (1999-2000) and a member of the Board of Visitors (1994-1998) for the University of North Carolina at Chapel Hill and currently serves on the Board of Directors of the University of North Carolina Health Care System and the Board of Visitors of the Kenan-Flagler Business School (University of North Carolina at Chapel Hill). He also served as Vice President of Finance for the University of North Carolina (16-school system, 1995-1998). |
William S. Stavropoulos (64) |
| Year of Election or Appointment: 2001 Mr. Stavropoulos is Chairman of the Board (2000), CEO (2002), a position he previously held from 1995-2000, Chairman of the Executive Committee (2000), and a Member of the Board of Directors of The Dow Chemical Company. Since joining The Dow Chemical Company in 1967, Mr. Stavropoulos served in numerous senior management positions, including President (1993-2000; 2002-2003). Currently, he is a Director of NCR Corporation (data warehousing and technology solutions), BellSouth Corporation (telecommunications), Chemical Financial Corporation, and Maersk Inc. (industrial conglomerate, 2002). He also serves as a member of the Board of Trustees of the American Enterprise Institute for Public Policy Research. In addition, Mr. Stavropoulos is a member of The Business Council, J.P. Morgan International Council and the University of Notre Dame Advisory Council for the College of Science. |
Annual Report
Trustees and Officers - continued
Advisory Board Members and Executive Officers:
Correspondence intended for Mr. Dirks, Ms. Small, and Mr. Wolfe may be sent to Fidelity Investments, P.O. Box 55235, Boston, Massachusetts 02205-5235. Correspondence intended for each executive officer and Mr. Lynch may be sent to Fidelity Investments, 82 Devonshire Street, Boston, Massachusetts 02109.
Name, Age; Principal Occupation |
Dennis J. Dirks (56) |
| Year of Election or Appointment: 2004 Member of the Advisory Board of Fidelity Investment Trust. Prior to his retirement in May 2003, Mr. Dirks was Chief Operating Officer and a member of the Board of The Depository Trust & Clearing Corporation (DTCC) (1999-2003). He also served as President, Chief Operating Officer, and Board member of The Depository Trust Company (DTC) (1999-2003) and President and Board member of the National Securities Clearing Corporation (NSCC) (1999-2003). In addition, Mr. Dirks served as Chief Executive Officer and Board member of the Government Securities Clearing Corporation (2001-2003) and Chief Executive Officer and Board member of the Mortgage-Backed Securities Clearing Corporation (2001-2003). |
Peter S. Lynch (61) |
| Year of Election or Appointment: 2003 Member of the Advisory Board of Fidelity Investment Trust. Vice Chairman and a Director of FMR, and Vice Chairman (2001) and a Director (2000) of FMR Co., Inc. Previously, Mr. Lynch served as a Trustee of the Fidelity funds (1990-2003). Prior to May 31, 1990, he was a Director of FMR and Executive Vice President of FMR (a position he held until March 31, 1991), Vice President of Fidelity® Magellan® Fund and FMR Growth Group Leader, and Managing Director of FMR Corp. Mr. Lynch was also Vice President of Fidelity Investments Corporate Services. In addition, he serves as a Trustee of Boston College, Massachusetts Eye & Ear Infirmary, Historic Deerfield, John F. Kennedy Library, and the Museum of Fine Arts of Boston. |
Cornelia M. Small (60) |
| Year of Election or Appointment: 2004 Member of the Advisory Board of Fidelity Investment Trust. Ms. Small is a member (2000) and Chairperson (2002) of the Investment Committee, and a member (2002) of the Board of Trustees of Smith College. Previously, she served as Chief Investment Officer (1999-2000), Director of Global Equity Investments (1996-1999), and a member of the Board of Directors of Scudder, Stevens & Clark (1990-1997) and Scudder Kemper Investments (1997-1998). In addition, Ms. Small served as Co-Chair (2000-2003) of the Annual Fund for the Fletcher School of Law and Diplomacy. |
Kenneth L. Wolfe (65) |
| Year of Election or Appointment: 2004 Member of the Advisory Board of Fidelity Investment Trust. Prior to his retirement in 2001, Mr. Wolfe was Chairman and Chief Executive Officer of Hershey Foods Corporation (1993-2001). He currently serves as a member of the boards of Adelphia Communications Corporation (2003), Bausch & Lomb, Inc., and Revlon Inc. (2004). |
Philip L. Bullen (45) |
| Year of Election or Appointment: 2002 Vice President of the fund. Mr. Bullen also serves as Vice President of certain Equity Funds (2001) and certain High Income Funds (2001). He is Senior Vice President of FMR (2001) and FMR Co., Inc. (2001), President and a Director of Fidelity Management & Research (Far East) Inc. (2001), President and a Director of Fidelity Management & Research (U.K.) Inc. (2002), and a Director of Strategic Advisers, Inc. (2002). Before joining Fidelity Investments, Mr. Bullen was President and Chief Investment Officer of Santander Global Advisors (1997-2000) and President and Chief Executive Officer of Boston's Baring Asset Management Inc. (1994-1997). |
Eric D. Roiter (55) |
| Year of Election or Appointment: 1998 Secretary of the fund. He also serves as Secretary of other Fidelity funds (1998); Vice President, General Counsel, and Clerk of FMR Co., Inc. (2001) and FMR (1998); Vice President and Clerk of FDC (1998); Assistant Clerk of Fidelity Management & Research (U.K.) Inc. (2001) and Fidelity Management & Research (Far East) Inc. (2001); and Assistant Secretary of Fidelity Investments Money Management, Inc. (2001). Prior to joining Fidelity, Mr. Roiter was with the law firm of Debevoise & Plimpton, as an associate (1981-1984) and as a partner (1985-1997), and served as an Assistant General Counsel of the U.S. Securities and Exchange Commission (1979-1981). Mr. Roiter is an Adjunct Member, Faculty of Law, at Boston College Law School (2003). |
Stuart Fross (45) |
| Year of Election or Appointment: 2003 Assistant Secretary of the fund. Mr. Fross also serves as Assistant Secretary of other Fidelity funds (2003) and is an employee of FMR. |
Christine Reynolds (46) |
| Year of Election or Appointment: 2004 President, Treasurer, and Anti-Money Laundering (AML) officer of the fund. Ms. Reynolds also serves as President, Treasurer, and AML officer of other Fidelity funds (2004) and is a Vice President (2003) and an employee (2002) of FMR. Before joining Fidelity Investments, Ms. Reynolds worked at PricewaterhouseCoopers LLP (PwC) (1980-2002), where she was most recently an audit partner with PwC's investment management practice. |
Timothy F. Hayes (53) |
| Year of Election or Appointment: 2002 Chief Financial Officer of the fund. Mr. Hayes also serves as Chief Financial Officer of other Fidelity funds (2002). Recently he was appointed President of Fidelity Service Company (2003) where he also serves as a Director. Mr. Hayes also serves as President of Fidelity Investments Operations Group (FIOG, 2002), which includes Fidelity Pricing and Cash Management Services Group (FPCMS), where he was appointed President in 1998. Previously, Mr. Hayes served as Chief Financial Officer of Fidelity Investments Corporate Systems and Service Group (1998) and Fidelity Systems Company (1997-1998). |
Kenneth A. Rathgeber (57) |
| Year of Election or Appointment: 2004 Chief Compliance Officer of the fund. Mr. Rathgeber also serves as Chief Compliance Officer of other Fidelity funds (2004) and Executive Vice President of Risk Oversight for Fidelity Investments (2002). Previously, he served as Executive Vice President and Chief Operating Officer for Fidelity Investments Institutional Services Company, Inc. (1998-2002). |
John R. Hebble (46) |
| Year of Election or Appointment: 2003 Deputy Treasurer of the fund. Mr. Hebble also serves as Deputy Treasurer of other Fidelity funds (2003), and is an employee of FMR. Before joining Fidelity Investments, Mr. Hebble worked at Deutsche Asset Management where he served as Director of Fund Accounting (2002-2003) and Assistant Treasurer of the Scudder Funds (1998-2003). |
Kimberley H. Monasterio (40) |
| Year of Election or Appointment: 2004 Deputy Treasurer of the fund. Ms. Monasterio also serves as Deputy Treasurer of other Fidelity funds (2004) and is an employee of FMR (2004). Before joining Fidelity Investments, Ms. Monasterio served as Treasurer (2000-2004) and Chief Financial Officer (2002-2004) of the Franklin Templeton Funds and Senior Vice President of Franklin Templeton Services, LLC (2000-2004). |
John H. Costello (58) |
| Year of Election or Appointment: 1986 Assistant Treasurer of the fund. Mr. Costello also serves as Assistant Treasurer of other Fidelity funds and is an employee of FMR. |
Francis V. Knox, Jr. (57) |
| Year of Election or Appointment: 2002 Assistant Treasurer of the fund. Mr. Knox also serves as Assistant Treasurer of other Fidelity funds (2002), and is a Vice President and an employee of FMR. Previously, Mr. Knox served as Vice President of Investment & Advisor Compliance (1990-2001), and Compliance Officer of Fidelity Management & Research (U.K.) Inc. (1992-2002), Fidelity Management & Research (Far East) Inc. (1991-2002), and FMR Corp. (1995-2002). |
Peter L. Lydecker (50) |
| Year of Election or Appointment: 2004 Assistant Treasurer of the fund. Mr. Lydecker also serves as Assistant Treasurer of other Fidelity funds (2004) and is an employee of FMR. |
Mark Osterheld (49) |
| Year of Election or Appointment: 2002 Assistant Treasurer of the fund. Mr. Osterheld also serves as Assistant Treasurer of other Fidelity funds (2002) and is an employee of FMR. |
Kenneth B. Robins (35) |
| Year of Election or Appointment: 2004 Assistant Treasurer of the fund. Mr. Robins also serves as Assistant Treasurer of other Fidelity funds (2004) and is an employee of FMR (2004). Before joining Fidelity Investments, Mr. Robins worked at KPMG LLP, where he was a partner in KPMG's department of professional practice (2002-2004) and a Senior Manager (1999-2000). In addition, Mr. Robins served as Assistant Chief Accountant, United States Securities and Exchange Commission (2000-2002). |
Thomas J. Simpson (46) |
| Year of Election or Appointment: 2000 Assistant Treasurer of the fund. Mr. Simpson is Assistant Treasurer of other Fidelity funds (2000) and an employee of FMR (1996). Prior to joining FMR, Mr. Simpson was Vice President and Fund Controller of Liberty Investment Services (1987-1995). |
Annual Report
Distributions
The Board of Trustees of Fidelity International Small Cap Fund voted to pay to shareholders of record at the opening of business on record date, the following distributions per share derived from capital gains realized from sales of portfolio securities, and dividends derived from net investment income:
| Pay Date | Record Date | Dividends | Capital Gains |
Institutional Class | 12/13/04 | 12/10/04 | $.07 | $.77 |
Institutional Class designates 13% of the dividend distributed during the fiscal year as amounts which may be taken into account as a dividend for purposes of the maximum rate under section 1(h)(11) of the Internal Revenue Code.
The amounts per share which represent income derived from sources within, and taxes paid to, foreign countries or possessions of the United States are as follows:
| Income | Taxes |
Institutional Class | $.035 | $.004 |
The fund will notify shareholders in January 2005 of amounts for use in preparing 2004 income tax returns.
Annual Report
Proxy Voting Results
A special meeting of the fund's shareholders was held on October 14, 2004. The results of votes taken among shareholders on proposals before them are reported below. Each vote reported represents one dollar of net asset value held on the record date for the meeting.
PROPOSAL 1 |
To amend the Declaration of Trust to allow the Board of Trustees, if permitted by applicable law, to authorize fund mergers without shareholder approval. A |
| # of
Votes | % of
Votes |
Affirmative | 15,718,325,709.37 | 74.142 |
Against | 3,816,318,151.70 | 18.001 |
Abstain | 840,597,158.37 | 3.965 |
Broker
Non-Votes | 825,022,241.94 | 3.892 |
TOTAL | 21,200,263,261.38 | 100.000 |
PROPOSAL 2 |
To elect a Board of Trustees. A |
| # of
Votes | % of
Votes |
J. Michael Cook |
Affirmative | 20,046,954,592.62 | 94.560 |
Withheld | 1,153,308,668.76 | 5.440 |
TOTAL | 21,200,263,261.38 | 100.000 |
Ralph F. Cox |
Affirmative | 20,022,775,321.09 | 94.446 |
Withheld | 1,177,487,940.29 | 5.554 |
TOTAL | 21,200,263,261.38 | 100.000 |
Laura B. Cronin |
Affirmative | 20,020,502,157.24 | 94.435 |
Withheld | 1,179,761,104.14 | 5.565 |
TOTAL | 21,200,263,261.38 | 100.000 |
Dennis J. Dirks B |
Affirmative | 20,051,128,100.47 | 94.580 |
Withheld | 1,149,135,160.91 | 5.420 |
TOTAL | 21,200,263,261.38 | 100.000 |
| # of
Votes | % of
Votes |
Robert M. Gates |
Affirmative | 20,029,013,552.52 | 94.475 |
Withheld | 1,171,249,708.86 | 5.525 |
TOTAL | 21,200,263,261.38 | 100.000 |
George H. Heilmeier |
Affirmative | 20,064,274,525.78 | 94.642 |
Withheld | 1,135,988,735.60 | 5.358 |
TOTAL | 21,200,263,261.38 | 100.000 |
Abigail P. Johnson |
Affirmative | 19,965,491,863.72 | 94.176 |
Withheld | 1,234,771,397.66 | 5.824 |
TOTAL | 21,200,263,261.38 | 100.000 |
Edward C. Johnson 3d |
Affirmative | 19,910,643,140.70 | 93.917 |
Withheld | 1,289,620,120.68 | 6.083 |
TOTAL | 21,200,263,261.38 | 100.000 |
Donald J. Kirk |
Affirmative | 20,034,697,704.85 | 94.502 |
Withheld | 1,165,565,556.53 | 5.498 |
TOTAL | 21,200,263,261.38 | 100.000 |
Marie L. Knowles |
Affirmative | 20,071,617,016.84 | 94.676 |
Withheld | 1,128,646,244.54 | 5.324 |
TOTAL | 21,200,263,261.38 | 100.000 |
Ned C. Lautenbach |
Affirmative | 20,069,374,137.98 | 94.666 |
Withheld | 1,130,889,123.40 | 5.334 |
TOTAL | 21,200,263,261.38 | 100.000 |
Marvin L. Mann |
Affirmative | 20,034,126,102.77 | 94.499 |
Withheld | 1,166,137,158.61 | 5.501 |
TOTAL | 21,200,263,261.38 | 100.000 |
| # of
Votes | % of
Votes |
William O. McCoy |
Affirmative | 20,046,749,092.57 | 94.559 |
Withheld | 1,153,514,168.81 | 5.441 |
TOTAL | 21,200,263,261.38 | 100.000 |
Robert L. Reynolds |
Affirmative | 20,051,009,814.32 | 94.579 |
Withheld | 1,149,253,447.06 | 5.421 |
TOTAL | 21,200,263,261.38 | 100.000 |
Cornelia M. Small B |
Affirmative | 20,037,030,750.74 | 94.513 |
Withheld | 1,163,232,510.64 | 5.487 |
TOTAL | 21,200,263,261.38 | 100.000 |
William S. Stavropoulos |
Affirmative | 20,037,089,868.63 | 94.513 |
Withheld | 1,163,173,392.75 | 5.487 |
TOTAL | 21,200,263,261.38 | 100.000 |
ADenotes trust-wide proposals and voting results. BEffective January 1, 2005. |
Annual Report
Annual Report
Annual Report
Annual Report
Investment Adviser
Fidelity Management & Research Company
Boston, MA
Investment Sub-Advisers
FMR Co., Inc.
Fidelity Management & Research
(U.K.) Inc.
Fidelity Management & Research
(Far East) Inc.
Fidelity International
Investment Advisors
Fidelity Investments Japan Limited
Fidelity International Investment Advisors (U.K.) Limited
General Distributor
Fidelity Distributors Corporation
Boston, MA
Transfer and Shareholder
Servicing Agents
Fidelity Investments Institutional Operations Company, Inc.
Boston, MA
Custodian
Mellon Bank
Pittsburgh, PA
(Fidelity Investment logo)(registered trademark)
Corporate Headquarters
82 Devonshire St., Boston, MA 02109
www.fidelity.com
AISCI-UANN-1204
1.793572.101
Fidelity®
International Small Cap
Fund
Annual Report
October 31, 2004
(2_fidelity_logos) (Registered_Trademark)
Contents
Chairman's Message | 4 | Ned Johnson's message to shareholders. |
Performance | 5 | How the fund has done over time. |
Management's Discussion | 6 | The managers' review of fund performance, strategy and outlook. |
Shareholder Expense Example | 7 | An example of shareholder expenses. |
Investment Changes | 9 | A summary of major shifts in the fund's investments over the past six months. |
Investments | 11 | A complete list of the fund's investments with their market values. |
Financial Statements | 26 | Statements of assets and liabilities, operations, and changes in net assets,
as well as financial highlights. |
Notes | 36 | Notes to the financial statements. |
Report of Independent Registered Public Accounting Firm | 45 | |
Trustees and Officers | 46 | |
Distributions | 58 | |
Proxy Voting Results | 59 | |
To view a fund's proxy voting guidelines and proxy voting record for the 12-month period ended June 30, visit www.fidelity.com/proxyvotingresults or visit the Securities and Exchange Commission's (SEC) web site at www.sec.gov. You may also call 1-800-544-8544 to request a free copy of the proxy voting guidelines.
Standard & Poor's, S&P and S&P 500 are registered service marks of The McGraw-Hill Companies, Inc. and have been licensed for use by Fidelity Distributors Corporation.
Other third party marks appearing herein are the property of their respective owners.
All other marks appearing herein are registered or unregistered trademarks or service marks of FMR Corp. or an affiliated company.
(Recycle graphic) This report is printed on recycled paper using soy-based inks.
Annual Report
This report and the financial statements contained herein are submitted for the general information of the shareholders of the fund. This report is not authorized for distribution to prospective investors in the fund unless preceded or accompanied by an effective prospectus.
The fund files its complete schedule of portfolio holdings with the SEC for the first and third quarters of each fiscal year on Form N-Q. Forms N-Q are available on the SEC's web site at http://www.sec.gov. The fund's Forms N-Q may be reviewed and copied at the SEC's Public Reference Room in Washington, DC. Information regarding the operation of the SEC's Public Reference Room may be obtained by calling 1-800-SEC-0330. For a complete list of the fund's portfolio holdings, view the fund's most recent quarterly holdings report, semiannual report, or annual report on Fidelity's web site at http://www.fidelity.com/holdings.
NOT FDIC INSURED ·MAY LOSE VALUE ·NO BANK GUARANTEE
Neither the fund nor Fidelity Distributors Corporation is a bank.
Annual Report
Chairman's Message
(photo_of_Edward_C_Johnson_3d)
Dear Shareholder:
During the past year or so, much has been reported about the mutual fund industry, and much of it has been more critical than I believe is warranted. Allegations that some companies have been less than forthright with their shareholders have cast a shadow on the entire industry. I continue to find these reports disturbing, and assert that they do not create an accurate picture of the industry overall. Therefore, I would like to remind everyone where Fidelity stands on these issues. I will say two things specifically regarding allegations that some mutual fund companies were in violation of the Securities and Exchange Commission's forward pricing rules or were involved in so-called "market timing" activities.
First, Fidelity has no agreements that permit customers who buy fund shares after 4 p.m. to obtain the 4 p.m. price. This is not a new policy. This is not to say that someone could not deceive the company through fraudulent acts. However, we are extremely diligent in preventing fraud from occurring in this manner - and in every other. But I underscore again that Fidelity has no so-called "agreements" that sanction illegal practices.
Second, Fidelity continues to stand on record, as we have for years, in opposition to predatory short-term trading that adversely affects shareholders in a mutual fund. Back in the 1980s, we initiated a fee - which is returned to the fund and, therefore, to investors - to discourage this activity. Further, we took the lead several years ago in developing a Fair Value Pricing Policy to prevent market timing on foreign securities in our funds. I am confident we will find other ways to make it more difficult for predatory traders to operate. However, this will only be achieved through close cooperation among regulators, legislators and the industry.
Yes, there have been unfortunate instances of unethical and illegal activity within the mutual fund industry from time to time. That is true of any industry. When this occurs, confessed or convicted offenders should be dealt with appropriately. But we are still concerned about the risk of over-regulation and the quick application of simplistic solutions to intricate problems. Every system can be improved, and we support and applaud well thought out improvements by regulators, legislators and industry representatives that achieve the common goal of building and protecting the value of investors' holdings.
For nearly 60 years, Fidelity has worked very hard to improve its products and service to justify your trust. When our family founded this company in 1946, we had only a few hundred customers. Today, we serve more than 18 million customers including individual investors and participants in retirement plans across America.
Let me close by saying that we do not take your trust in us for granted, and we realize that we must always work to improve all aspects of our service to you. In turn, we urge you to continue your active participation with your financial matters, so that your interests can be well served.
Best regards,
/s/Edward C. Johnson 3d
Edward C. Johnson 3d
Annual Report
Performance: The Bottom Line
Average annual total return reflects the change in the value of an investment, assuming reinvestment of International Small Cap's dividend income and capital gains (the profits earned upon the sale of securities that have grown in value) and assuming a constant rate of performance each year. The $10,000 table and the fund's returns do not reflect the deduction of taxes that a shareholder would pay on fund distributions or the redemption of fund shares. During periods of reimbursement by Fidelity, a fund's total return will be greater than it would be had the reimbursement not occurred. How a fund did yesterday is no guarantee of how it will do tomorrow.
Average Annual Total Returns
Periods ended October 31, 2004 | Past 1
year | Life of
fundA |
International Small Cap | 22.84% | 44.40% |
AFrom September 18, 2002.
$10,000 Over Life of Fund
Let's say hypothetically that $10,000 was invested in International Small Cap on September 18, 2002, when the fund started. The chart shows how the value of your investment would have grown, and also shows how the MSCI® EAFE® Small Cap Index did over the same period.
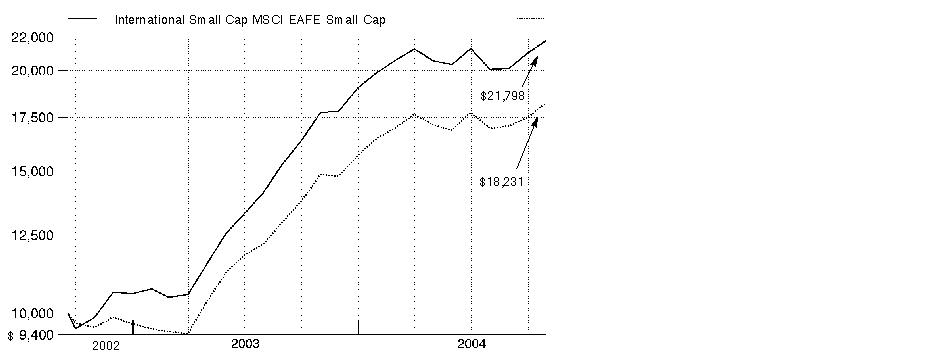
Annual Report
Management's Discussion of Fund Performance
Comments from Tokuya Sano and Ben Paton, Co-Portfolio Managers of Fidelity® International Small Cap Fund
Most of the world's major stock markets posted solid gains for the year ending October 31, 2004. The Morgan Stanley Capital InternationalSM Europe, Australasia, Far East (MSCI® EAFE®) Index - designed to represent the performance of developed stock markets outside the United States and Canada - gained 19.00%, compared to 9.42% for the Standard & Poor's 500SM Index. A weak U.S. dollar relative to most foreign currencies was partly responsible for the performance disparity. On a regional basis, Europe was one of the top performers. Many investors felt European stocks offered better valuations and brighter earnings prospects than U.S. equities. Latin American countries, many of which are exporters of oil and materials that received strong support from high commodity prices, also did well. Conversely, Japan significantly underperformed, as early optimism was eroded by disappointing economic indicators and concerns about the impact of China's economic slowdown on exports. Meanwhile, technology-focused Asian emerging markets suffered due to a deceleration in corporate capital spending.
For the 12 months ending October 31, 2004, International Small Cap's return was 22.84%, narrowly beating the 22.72% mark posted by the Morgan Stanley Capital International Europe, Australasia, Far East Small Cap Index. International Small Cap also finished ahead of the LipperSM International Small Cap Funds Average, which returned 18.46%. Strong stock selection in telecommunication services, semiconductors and capital goods aided performance compared with the index. Looking at geographical categories, Germany and Australia were two of the fund's stronger countries, while Japan struggled. German wireless services reseller MobilCom was the fund's top contributor both in absolute terms and compared with the MSCI EAFE Small Cap Index. Believing its valuation to be stretched, I liquidated the position - a timely decision. Performance was also helped by United Group Limited, an Australian conglomerate. On the negative side, our picks in automobiles and components hurt the fund's results, as did an underweighting in real estate and an overweighting in software and services. Russian oil giant Yukos was the largest detractor in absolute terms and the second-largest relative to the index. The biggest detractor compared to the index was Japanese holding NOK, a maker of flexible printed circuit boards.
The views expressed in this statement reflect those of the portfolio managers only through the end of the period of the report as stated on the cover and do not necessarily represent the views of Fidelity or any other person in the Fidelity organization. Any such views are subject to change at any time based upon market or other conditions and Fidelity disclaims any responsibility to update such views. These views may not be relied on as investment advice and, because investment decisions for a Fidelity fund are based on numerous factors, may not be relied on as an indication of trading intent on behalf of any Fidelity fund.
Annual Report
Shareholder Expense Example
As a shareholder of the Fund, you incur two types of costs: (1) transaction costs, including sales charges (loads) on purchase payments or redemption proceeds, redemption fees, and (2) ongoing costs, including management fees, distribution and/or service (12b-1) fees and other Fund expenses. This Example is intended to help you understand your ongoing costs (in dollars) of investing in the Fund and to compare these costs with the ongoing costs of investing in other mutual funds.
The Example is based on an investment of $1,000 invested at the beginning of the period and held for the entire period (May 1, 2004 to October 31, 2004).
Actual Expenses
The first line of the table below for each class of the Fund provides information about actual account values and actual expenses. You may use the information in this line, together with the amount you invested, to estimate the expenses that you paid over the period. Simply divide your account value by $1,000.00 (for example, an $8,600 account value divided by $1,000.00 = 8.6), then multiply the result by the number in the first line for a class of the Fund under the heading entitled "Expenses Paid During Period" to estimate the expenses you paid on your account during this period. A small balance maintenance fee of $12.00 that is charged once a year may apply for certain accounts with a value of less than $2,000. This fee is not included in the table below. If it was, the estimate of expenses you paid during the period would be higher, and your ending account value lower, by this amount.
Hypothetical Example for Comparison Purposes
The second line of the table below for each class of the Fund provides information about hypothetical account values and hypothetical expenses based on a Class' actual expense ratio and an assumed rate of return of 5% per year before expenses, which is not the Class' actual return. The hypothetical account values and expenses may not be used to estimate the actual ending account balance or expenses you paid for the period. You may use this information to compare the ongoing costs of investing in the Fund and other funds. To do so, compare this 5% hypothetical example with the 5% hypothetical examples that appear in the shareholder reports of the other funds. A small balance maintenance fee of $12.00 that is charged once a year may apply for certain accounts with a value of less than $2,000. This fee is not included in the table below. If it was, the estimate of expenses you paid during the period would be higher, and your ending account value lower, by this amount.
Please note that the expenses shown in the table are meant to highlight your ongoing costs only and do not reflect any transaction costs. Therefore, the second line of the table is useful in comparing ongoing costs only, and will not help you determine the relative total costs of owning different funds. In addition, if these transactional costs were included, your costs would have been higher.
Annual Report
| Beginning
Account Value
May 1, 2004 | Ending
Account Value
October 31, 2004 | Expenses Paid
During Period *
May 1, 2004
to October 31, 2004 |
Class A | | | |
Actual | $1,000.00 | $1,057.20 | $8.95 |
HypotheticalA | $1,000.00 | $1,016.19 | $8.81 |
Class T | | | |
Actual | $1,000.00 | $1,056.30 | $10.23 |
HypotheticalA | $1,000.00 | $1,014.92 | $10.08 |
Class B | | | |
Actual | $1,000.00 | $1,052.70 | $13.83** |
HypotheticalA | $1,000.00 | $1,011.36 | $13.64** |
Class C | | | |
Actual | $1,000.00 | $1,053.60 | $12.70 |
HypotheticalA | $1,000.00 | $1,012.48 | $12.52 |
Institutional Class | | | |
Actual | $1,000.00 | $1,059.50 | $6.94 |
HypotheticalA | $1,000.00 | $1,018.18 | $6.82 |
International Small Cap | | | |
Actual | $1,000.00 | $1,059.50 | $6.78 |
HypotheticalA | $1,000.00 | $1,018.33 | $6.67 |
A5% return per year before expenses
*Expenses are equal to each Class' annualized expense ratio (shown in the table below); multiplied by the average account value over the period, multiplied by 184/366 (to reflect the one-half year period).
| Annualized
Expense Ratio |
Class A | 1.73% |
Class T | 1.98% |
Class B | 2.68% |
Class C | 2.46% |
Institutional Class | 1.34% |
International Small Cap | 1.31% |
**If fees effective January 1, 2005 had been in effect during the period, the annualized expense ratio and the expenses paid in the actual and hypothetical examples above would have been as follows:
| Annualized
Expense Ratio | Expenses Paid |
Class B | | |
Actual | 2.52% | $13.00 |
HypotheticalA | | $12.83 |
A5% return per year before expenses
Annual Report
Investment Changes
Geographic Diversification (% of fund's net assets) |
As of October 31, 2004 |
| Japan27.7% | |
| United Kingdom16.1% | |
| Australia9.2% | |
| Germany7.7% | |
| United States of America5.2% | |
| South Africa3.0% | |
| Norway2.9% | |
| Greece2.6% | |
| Italy2.4% | |
| Other23.2% | |

Percentages are adjusted for the effect of futures contracts, if applicable. |
|
As of April 30, 2004 |
| Japan31.0% | |
| United Kingdom17.4% | |
| Germany8.8% | |
| Australia7.8% | |
| Greece3.0% | |
| Sweden2.9% | |
| Norway2.9% | |
| France2.8% | |
| Hong Kong2.3% | |
| Other21.1% | |

Percentages are adjusted for the effect of futures contracts, if applicable. |
Asset Allocation |
| % of fund's
net assets | % of fund's net assets
6 months ago |
Stocks | 96.6 | 98.6 |
Short-Term Investments and Net Other Assets | 3.4 | 1.4 |
Top Ten Stocks as of October 31, 2004 |
| % of fund's
net assets | % of fund's net assets
6 months ago |
Steinhoff International Holdings Ltd. (South Africa, Household Durables) | 1.8 | 1.4 |
K&S AG (Germany, Chemicals) | 1.5 | 0.0 |
United Group Ltd. (Australia, Construction & Engineering) | 1.5 | 0.9 |
Hikari Tsushin, Inc. (Japan, Specialty Retail) | 1.5 | 0.0 |
Orascom Telecom SAE unit (Egypt, Wireless Telecommunication Services) | 1.4 | 0.3 |
Freenet.de AG (Germany, Internet Software & Services) | 1.4 | 2.5 |
Pfleiderer AG (Germany, Building Products) | 1.3 | 0.6 |
BlueScope Steel Ltd. (Australia, Metals & Mining) | 1.3 | 1.0 |
Centennial Coal Co. Ltd. (Australia, Metals & Mining) | 1.2 | 0.7 |
QBE Insurance Group Ltd. (Australia, Insurance) | 1.1 | 1.0 |
| 14.0 | |
Market Sectors as of October 31, 2004 |
| % of fund's
net assets | % of fund's net assets
6 months ago |
Consumer Discretionary | 22.7 | 21.2 |
Materials | 14.5 | 10.8 |
Industrials | 13.9 | 15.4 |
Information Technology | 13.3 | 19.9 |
Financials | 10.8 | 12.7 |
Health Care | 7.7 | 6.6 |
Energy | 6.6 | 4.8 |
Telecommunication Services | 3.9 | 4.2 |
Consumer Staples | 2.8 | 2.6 |
Utilities | 0.4 | 0.4 |
Annual Report
Investments October 31, 2004
Showing Percentage of Net Assets
Common Stocks - 95.5% |
| Shares | | Value (Note 1) |
Australia - 9.2% |
Australian Stock Exchange Ltd. | 603,839 | | $8,368,824 |
BlueScope Steel Ltd. | 2,519,309 | | 14,581,351 |
Boral Ltd. | 1,902,417 | | 9,458,247 |
Bradken Ltd. | 63,288 | | 145,952 |
Centamin Egypt Ltd. (a) | 5,509,616 | | 1,126,378 |
Centennial Coal Co. Ltd. | 4,089,388 | | 13,166,296 |
Corporate Express Australia Ltd. (d) | 1,697,169 | | 7,294,135 |
Dwyka Diamonds Ltd. (a) | 4,010,385 | | 2,358,299 |
Elkedra Diamonds NL | 3,000,000 | | 689,119 |
Fox Resources Ltd. (a) | 1,000,000 | | 486,688 |
Hardman Resources Ltd. (a) | 915,681 | | 1,474,075 |
Hardman Resources Ltd. (UK) (a) | 217,653 | | 351,974 |
JB Hi-Fi Ltd. | 1,483,593 | | 3,976,808 |
Patrick Corp. Ltd. | 914,738 | | 3,808,100 |
Promina Group Ltd. | 914,490 | | 3,108,649 |
QBE Insurance Group Ltd. | 1,235,719 | | 12,703,608 |
Stockland New (a) | 12,301 | | 54,065 |
United Group Ltd. | 3,412,640 | | 17,324,352 |
Virotec International Ltd. (a) | 1,852,832 | | 638,162 |
Virotec International Ltd. (a) | 1,084,000 | | 373,502 |
Westpac Banking Corp. | 212,356 | | 3,001,949 |
TOTAL AUSTRALIA | | 104,490,533 |
Belgium - 1.3% |
EVS Broadcast Equipment SA | 28,000 | | 2,239,475 |
Exmar NV | 17,400 | | 1,046,539 |
Melexis NV | 93,199 | | 1,115,144 |
Omega Pharma SA | 60,100 | | 3,299,438 |
Recticel SA | 67,444 | | 724,125 |
Roularta Media Group NV | 22,376 | | 1,438,887 |
Telindus Group NV | 582,193 | | 5,371,683 |
TOTAL BELGIUM | | 15,235,291 |
Bermuda - 0.4% |
Frontline Ltd. | 54,700 | | 2,701,043 |
Ship Finance International Ltd. | 2,895 | | 58,190 |
Tanzanite One Ltd. (a) | 1,166,001 | | 1,521,318 |
TOTAL BERMUDA | | 4,280,551 |
Brazil - 0.3% |
Petroleo Brasileiro SA Petrobras sponsored ADR | 108,000 | | 3,835,080 |
Canada - 0.8% |
Adastra Minerals, Inc. (a) | 10,000 | | 11,302 |
Common Stocks - continued |
| Shares | | Value (Note 1) |
Canada - continued |
La Mancha Resources, Inc. (a) | 334,000 | | $246,828 |
Oilexco, Inc. (a) | 1,388,800 | | 3,295,670 |
Ontzinc Corp. (a)(e) | 16,612,000 | | 1,841,458 |
Uruguay Mineral Exploration, Inc. (a) | 515,300 | | 2,200,238 |
Western Canadian Coal Corp. (f) | 385,886 | | 1,024,682 |
TOTAL CANADA | | 8,620,178 |
Cayman Islands - 0.0% |
Kingboard Chemical Holdings Ltd. warrants 12/31/06 (a) | 362,380 | | 167,603 |
China - 0.8% |
Aluminum Corp. of China Ltd. (H Shares) | 5,744,000 | | 3,283,888 |
Global Bio-Chem Technology Group Co. Ltd. | 2,632,000 | | 2,062,669 |
Global Bio-Chem Technology Group Co. Ltd. warrants 5/31/07 (a) | 376,000 | | 26,085 |
PICC Property & Casualty Co. Ltd. (H Shares) | 9,086,000 | | 3,268,471 |
TOTAL CHINA | | 8,641,113 |
Czech Republic - 0.3% |
Komercni Banka AS unit | 84,634 | | 3,512,311 |
Denmark - 0.2% |
Coloplast AS Series B | 5,950 | | 592,183 |
SimCorp AS | 33,539 | | 1,498,643 |
TOTAL DENMARK | | 2,090,826 |
Egypt - 1.4% |
Orascom Telecom SAE unit (a) | 928,725 | | 15,881,198 |
Estonia - 0.4% |
Hansabank SA | 422,628 | | 4,272,613 |
Finland - 0.8% |
Aldata Solutions Oyj (a) | 1,617,346 | | 2,255,992 |
Alma Media Corp. (d) | 133,020 | | 1,463,941 |
Capman Oyj (A Shares) | 496,937 | | 1,163,752 |
Nokian Tyres Ltd. | 25,678 | | 2,791,140 |
Vacon Oyj | 73,381 | | 1,031,084 |
TOTAL FINLAND | | 8,705,909 |
France - 2.1% |
Areva (investment certificates) | 7,600 | | 2,809,760 |
Bacou Dalloz | 20,330 | | 1,567,482 |
Galeries Lafayette SA | 5,900 | | 1,155,940 |
Generale de Sante | 200,152 | | 3,439,887 |
Groupe Bourbon SA | 40,038 | | 1,972,610 |
Common Stocks - continued |
| Shares | | Value (Note 1) |
France - continued |
Groupe Open SA | 52,500 | | $560,317 |
Groupe Open SA warrants 10/21/06 (a) | 14,809 | | 6,064 |
Inter Parfums SA | 17,290 | | 604,040 |
Ipsos SA | 16,003 | | 1,501,114 |
Maisons France Confort | 10,498 | | 836,956 |
Medidep SA (a) | 46,000 | | 1,280,340 |
Nexity | 40,000 | | 956,704 |
Oeneo Group (a) | 86,962 | | 144,671 |
Orpea (a) | 25,207 | | 746,759 |
Stedim SA | 27,038 | | 2,524,109 |
Toupargel-Agrigel | 43,520 | | 1,732,038 |
U10 SA (d) | 12,679 | | 700,934 |
Vivendi Universal SA (a) | 66,932 | | 1,835,945 |
TOTAL FRANCE | | 24,375,670 |
Germany - 7.0% |
Advanced Photonics Technologies AG (a) | 48,552 | | 80,772 |
Articon-Integralis AG (Reg.) (a) | 495,185 | | 1,191,334 |
Bijou Brigitte Modische Accessoires AG | 21,486 | | 2,532,348 |
Deutsche Boerse AG | 42,300 | | 2,119,241 |
ElringKlinger AG | 9,142 | | 583,781 |
Fielmann AG | 19,100 | | 1,201,093 |
Freenet.de AG (a)(d) | 773,219 | | 15,633,916 |
Fresenius AG | 43,586 | | 4,049,410 |
Fresenius Medical Care AG | 65,113 | | 4,999,506 |
Gpc Biotech AG (a) | 49,345 | | 628,311 |
Grenkeleasing AG | 100,818 | | 3,825,348 |
Hyrican Informationssysteme AG | 17,925 | | 155,294 |
K&S AG | 420,200 | | 17,562,260 |
Kontron AG (a) | 154,264 | | 1,411,493 |
Merck KGaA | 48,441 | | 2,707,101 |
Parsytec AG (a) | 188,871 | | 693,674 |
PC-Spezialist Franchise AG (d) | 150,000 | | 1,516,445 |
Pfleiderer AG (a) | 1,644,359 | | 14,582,703 |
PSI AG (a) | 228,043 | | 992,211 |
Pulsion Medical Systems AG (a) | 156,865 | | 682,516 |
Rational AG | 17,800 | | 1,404,532 |
United Internet AG | 40,352 | | 984,745 |
TOTAL GERMANY | | 79,538,034 |
Greece - 2.6% |
Alfa-Beta Vassilopoulos SA (Reg.) | 31,800 | | 516,820 |
Common Stocks - continued |
| Shares | | Value (Note 1) |
Greece - continued |
Cosmote Mobile Telecommunications SA | 148,300 | | $2,687,278 |
Folli Follie SA | 268,648 | | 8,250,932 |
Greek Organization of Football Prognostics SA | 266,442 | | 5,448,634 |
Hellenic Exchanges Holding SA (a) | 166,195 | | 1,510,026 |
Hyatt Regency SA (Reg.) | 213,182 | | 2,367,982 |
Public Power Corp. of Greece | 54,000 | | 1,344,760 |
Sarantis SA (Reg.) | 1,046,648 | | 5,705,825 |
Technical Olympic SA (Reg.) | 426,896 | | 2,054,084 |
TOTAL GREECE | | 29,886,341 |
Hong Kong - 2.2% |
ASM Pacific Technology Ltd. | 528,500 | | 1,714,432 |
China Insurance International Holdings Co. Ltd. | 13,106,000 | | 6,019,496 |
China Merchants Holdings International Co. Ltd. | 5,166,000 | | 7,632,488 |
China Pharmaceutical Enterprise and Investment Corp. Ltd. (a) | 9,820,000 | | 2,409,677 |
Kingboard Chemical Holdings Ltd. | 3,623,800 | | 7,588,671 |
TOTAL HONG KONG | | 25,364,764 |
Hungary - 0.6% |
MOL Magyar Olay-es Gazipari RT Series A (For. Reg.) | 44,200 | | 2,481,194 |
OTP Bank Rt. | 152,073 | | 3,856,565 |
TOTAL HUNGARY | | 6,337,759 |
India - 0.0% |
Kotak Mahindra Bank Ltd. | 100,669 | | 398,590 |
State Bank of India | 6,592 | | 68,958 |
TOTAL INDIA | | 467,548 |
Ireland - 1.4% |
DEPFA BANK PLC | 187,900 | | 2,885,468 |
Glanbia PLC | 543,500 | | 1,704,017 |
IAWS Group PLC (Ireland) | 38,059 | | 507,010 |
Independent News & Media PLC (Ireland) | 846,964 | | 2,471,200 |
Kenmare Resources PLC (a) | 6,850,000 | | 2,045,534 |
Kenmare Resources PLC warrants 7/23/09 (a) | 1,712,500 | | 178,748 |
Paddy Power PLC | 137,311 | | 1,825,698 |
Petroceltic International PLC (a) | 12,421,734 | | 3,937,623 |
TOTAL IRELAND | | 15,555,298 |
Italy - 2.0% |
Amplifon Spa | 38,350 | | 1,713,751 |
Cassa Di Risparmio Di Firenze | 2,942,982 | | 5,758,419 |
Lottomatica Spa New (d) | 383,300 | | 11,571,108 |
Common Stocks - continued |
| Shares | | Value (Note 1) |
Italy - continued |
Saipem Spa | 79,800 | | $922,553 |
Teleunit Spa (a) | 7,365,800 | | 2,571,795 |
TOTAL ITALY | | 22,537,626 |
Japan - 27.7% |
Able, Inc. | 272,700 | | 7,678,424 |
Adtec Plasma Technology Co. Ltd. (a) | 32 | | 323,522 |
Ahresty Corp. | 53,300 | | 694,987 |
Amiyaki Tei Co. Ltd. (d) | 185 | | 592,573 |
Apple International Co. Ltd. | 384 | | 885,303 |
ARRK Corp. | 140,600 | | 5,234,223 |
Asahi Broadcasting Corp. | 14,940 | | 961,321 |
Asahi Denka Co. Ltd. | 108,000 | | 953,106 |
Asahi Glass Co. Ltd. | 102,000 | | 938,706 |
Asahi Intecc Co. Ltd. | 49,300 | | 1,784,088 |
Axell Corp. | 282 | | 1,718,619 |
Benefit One, Inc. (a) | 1 | | 12,378 |
Casio Computer Co. Ltd. | 170,700 | | 2,030,626 |
Chiyoda Integre Co. Ltd. | 78,960 | | 1,437,671 |
Citizen Electronics Co. Ltd. (d) | 19,200 | | 865,347 |
CMK Corp. (d) | 55,000 | | 727,028 |
Culture Convenience Club Co. Ltd. (d) | 63,400 | | 790,740 |
Cyber Agent Ltd. (a)(d) | 867 | | 2,523,135 |
Cyber Agent Ltd. New (a)(d) | 867 | | 2,523,135 |
Daikin Industries Ltd. | 24,000 | | 585,062 |
Dream Technologies Corp. (a)(d) | 718 | | 511,525 |
Dwango Co. Ltd. New (a) | 168 | | 888,931 |
Dynic Corp. (a) | 45,000 | | 191,336 |
Eizo Nanao Corp. | 119,000 | | 3,339,443 |
Faith, Inc. (d) | 3,374 | | 9,245,146 |
Fancl Corp. | 26,500 | | 976,520 |
Fuji Seal International, Inc. | 81,300 | | 3,495,205 |
Fuji Spinning Co. Ltd. (a) | 2,524,000 | | 3,195,691 |
Fujikura Ltd. | 1,740,000 | | 7,661,360 |
Fujitsu Business Systems Ltd. | 29,800 | | 380,683 |
Globaly Corp. | 23,100 | | 757,377 |
Heian Ceremony Service Co. Ltd. (d) | 151,000 | | 984,457 |
Hikari Tsushin, Inc. (d) | 277,300 | | 16,611,537 |
Hogy Medical Co. | 21,400 | | 877,555 |
Hokuto Corp. | 35,100 | | 644,061 |
Human Holdings Co. Ltd. (a) | 4 | | 15,496 |
HUNET, Inc. (d) | 520,000 | | 967,922 |
Common Stocks - continued |
| Shares | | Value (Note 1) |
Japan - continued |
Ibiden Co. Ltd. (d) | 83,400 | | $1,286,835 |
Information Planning Co. Ltd. (d) | 111 | | 326,178 |
Intelligent Wave, Inc. (d) | 901 | | 1,489,819 |
Intertrade Co. Ltd. | 8 | | 48,831 |
Ishihara Chemical Co. Ltd. (d) | 53,000 | | 901,403 |
Ishihara Sangyo Kaisha Ltd. | 269,000 | | 564,256 |
Iwatani International Corp. | 945,000 | | 2,294,751 |
JACCS Co. Ltd. (d) | 226,000 | | 1,136,032 |
Japan Medical Dynamic Marketing, Inc. | 82,600 | | 850,702 |
Jastec Co. Ltd. | 54,500 | | 933,094 |
JFE Shoji Holdings, Inc. (a)(d) | 922,000 | | 4,486,512 |
KAGA ELECTRONICS Co. Ltd. (d) | 160,500 | | 2,714,556 |
Kibun Food Chemifa Co. Ltd. (d) | 49,400 | | 963,868 |
Kobe Steel Ltd. | 7,068,000 | | 9,883,914 |
Kubota Corp. | 197,000 | | 899,050 |
Kura Corp. Ltd. | 1,054 | | 2,688,902 |
Lawson, Inc. (d) | 53,300 | | 1,782,794 |
Leopalace21 Corp. | 82,000 | | 1,499,995 |
livedoor Co. Ltd. (a)(d) | 301,100 | | 1,007,128 |
Marktec Corp. | 1,000 | | 7,644 |
Maruha Group, Inc. (a) | 303,000 | | 658,478 |
Matsui Securities Co. Ltd. (d) | 43,700 | | 1,160,268 |
Meganesuper Co. Ltd. | 47,520 | | 830,651 |
Meitec Corp. | 15,075 | | 568,330 |
Melco Holdings, Inc. (d) | 70,200 | | 1,086,480 |
Mitsubishi Materials Corp. (d) | 1,179,000 | | 2,372,816 |
Mitsubishi Plastics, Inc. | 317,000 | | 805,716 |
Mitsui & Associates Telepark Corp. | 484 | | 1,495,422 |
Mitsui Fudosan Co. Ltd. | 246,000 | | 2,614,919 |
Mitsui O.S.K. Lines Ltd. | 296,000 | | 1,756,394 |
Mitsui Trust Holdings, Inc. | 768,000 | | 5,290,046 |
Mobilephone Telecommunications International Ltd. | 364 | | 567,487 |
Neturen Co. Ltd. (d) | 195,000 | | 1,227,099 |
NHK Spring Co. Ltd. | 148,000 | | 1,023,631 |
Nidec Corp. | 46,700 | | 5,065,583 |
Nihon Chouzai Co. Ltd. (a) | 39,700 | | 1,575,471 |
Nihon Dempa Kogyo Co. Ltd. (d) | 510,100 | | 10,820,376 |
Nihon Falcom Corp. | 330 | | 926,064 |
Nihon Micro Coating Co. Ltd. (a) | 10,300 | | 111,920 |
Nihon Trim Co. Ltd. (d) | 72,050 | | 4,976,478 |
Nihon Unicom Corp. | 5,300 | | 78,122 |
Ninety-Nine Plus, Inc. | 1 | | 17,669 |
Common Stocks - continued |
| Shares | | Value (Note 1) |
Japan - continued |
Nippon Chemi-con Corp. (d) | 1,046,000 | | $5,119,554 |
Nippon Chemical Industrial Co. Ltd. | 222,000 | | 788,699 |
Nippon Electric Glass Co. Ltd. | 56,000 | | 1,251,382 |
Nippon Mining Holdings, Inc. | 542,500 | | 2,583,455 |
Nippon Oil Corp. | 329,000 | | 2,092,096 |
Nippon Shinpan Co. Ltd. | 195,000 | | 591,440 |
Nippon Suisan Kaisha Co. Ltd. | 319,000 | | 1,015,760 |
Nishi-Nippon City Bank Ltd. | 199,000 | | 885,614 |
Nissin Co. Ltd. (d) | 221,300 | | 460,018 |
Nissin Co. Ltd. New (a)(d) | 221,300 | | 460,018 |
Nissin Kogyo Co. Ltd. | 378,400 | | 11,155,175 |
Nitta Corp. | 172,800 | | 2,504,608 |
Nittoku Engineering Co. Ltd. | 87,500 | | 632,470 |
NOK Corp. | 372,600 | | 11,336,250 |
Opt, Inc. | 70 | | 380,309 |
Organo Corp. | 274,000 | | 1,444,626 |
Osaki Electric Co. Ltd. (d) | 60,000 | | 239,240 |
Pacific Metals Co. Ltd. (a)(d) | 846,000 | | 3,453,224 |
Park24 Co. Ltd. (d) | 78,900 | | 1,340,409 |
Park24 Co. Ltd. New (a) | 78,900 | | 1,326,990 |
Pigeon Corp. | 217,400 | | 3,298,950 |
Pixela Corp. (d) | 25,700 | | 396,300 |
Rakuten, Inc. (d) | 323 | | 2,426,277 |
Reins International, Inc. (d) | 1,271 | | 4,983,843 |
Rohto Pharmaceutical Co. Ltd. | 611,000 | | 6,633,335 |
Sammy NetWorks Co. Ltd. (a) | 240 | | 8,934,662 |
Sega Sammy Holdings, Inc. (a) | 95,540 | | 4,441,412 |
Sekisui Chemical Co. Ltd. | 136,000 | | 866,103 |
Shicoh Engineering Co. Ltd. (a) | 28 | | 886,285 |
Shin Nippon Biomedical Laboratories Ltd. | 25,900 | | 502,901 |
Shinko Electric Industries Co.Ltd. | 41,500 | | 1,199,887 |
Showa Denko KK (d) | 1,726,000 | | 4,174,952 |
SMBC Friend Securities Co. Ltd. | 379,000 | | 2,402,882 |
So-net M3, Inc. | 3 | | 21,826 |
Soken Chemical & Engineer Co. Ltd. | 66,200 | | 1,057,098 |
Square Enix Co. Ltd. | 24,000 | | 667,832 |
Stanley Electric Co. Ltd. (d) | 195,700 | | 3,023,286 |
Sumitomo Corp. | 236,000 | | 1,759,380 |
Sumitomo Light Metal Industries Ltd. (d) | 1,819,000 | | 2,870,251 |
Sumitomo Metal Mining Co. Ltd. | 528,000 | | 3,567,062 |
Sumitomo Rubber Industries Ltd. | 132,000 | | 1,126,244 |
Sumitomo Titanium Corp. | 29,500 | | 1,410,403 |
Common Stocks - continued |
| Shares | | Value (Note 1) |
Japan - continued |
Suncall Corp. | 206,000 | | $1,080,266 |
Sunx Ltd. | 92,000 | | 1,607,294 |
Takara Co. Ltd. (d) | 228,600 | | 987,104 |
Techno Medica Co. Ltd. | 139 | | 577,881 |
Telewave, Inc. (d) | 230 | | 1,679,879 |
Teraoka Seisakusho Co. Ltd. | 58,000 | | 442,803 |
Toho Titanium Co. Ltd. | 65,000 | | 1,461,709 |
Tokyo Seimitsu Co. Ltd. (d) | 101,500 | | 3,155,242 |
Tokyo Steel Manufacturing Co. Ltd. (d) | 370,200 | | 5,848,485 |
Toppan Printing Co. Ltd. | 98,000 | | 948,193 |
Toray Industries, Inc. | 589,000 | | 2,754,807 |
Toyo Ink Manufacturing Co. Ltd. (d) | 2,749,000 | | 9,480,654 |
Toyo Machinery & Metal Co. Ltd. | 220,000 | | 1,184,863 |
Toyo Radiator Co. Ltd. (d) | 202,000 | | 988,671 |
Toyo Suisan Kaisha Ltd. | 65,000 | | 762,177 |
Trancom Co. Ltd. | 65,400 | | 1,328,577 |
Trend Micro, Inc. | 29,500 | | 1,415,978 |
Ulvac, Inc. | 2,900 | | 66,585 |
Unicharm Petcare Corp. | 200 | | 7,559 |
USS Co. Ltd. | 68,480 | | 5,545,175 |
Wintest Corp. | 70 | | 261,256 |
Works Applications Co. Ltd. (a) | 389 | | 1,201,899 |
Zakkaya Bulldog Co. Ltd. (a) | 31,400 | | 1,014,674 |
Zwei Co. Ltd. (a) | 500 | | 10,960 |
TOTAL JAPAN | | 314,325,122 |
Korea (South) - 0.2% |
SKC Co. Ltd. (a) | 353,470 | | 2,525,914 |
Luxembourg - 1.5% |
Millicom International Cellular SA unit (a) | 183,000 | | 3,711,889 |
Orco Property Group | 37,100 | | 1,401,042 |
Stolt-Nielsen SA (a)(d) | 572,390 | | 12,016,774 |
TOTAL LUXEMBOURG | | 17,129,705 |
Netherlands - 0.7% |
Completel Europe NV (a) | 76,809 | | 2,531,031 |
Efes Breweries International NV unit | 32,700 | | 907,425 |
Fugro NV (Certificaten Van Aandelen) | 24,365 | | 1,898,855 |
PinkRoccade NV | 137,626 | | 1,805,230 |
Wolters Kluwer NV (Certificaten Van Aandelen) | 46,025 | | 841,655 |
TOTAL NETHERLANDS | | 7,984,196 |
Common Stocks - continued |
| Shares | | Value (Note 1) |
New Zealand - 0.1% |
The Warehouse Group Ltd. | 344,626 | | $962,598 |
Norway - 2.9% |
ABG Sundal Collier ASA | 3,358,000 | | 2,640,373 |
Bolig-og Naeringsbanken ASA | 29,040 | | 1,214,767 |
Catch Communications ASA | 633,000 | | 1,592,716 |
Mamut ASA | 1,851,000 | | 2,605,218 |
Nordic VLSI ASA (a) | 591,000 | | 4,042,884 |
Norman ASA (a) | 65,300 | | 549,391 |
Norsk Hydro ASA | 101,680 | | 7,499,339 |
Orkla ASA (A Shares) | 47,772 | | 1,363,530 |
P4 Radio Hele Norge ASA (a)(d) | 141,400 | | 378,018 |
Petroleum Geo-Services ASA (a) | 38,750 | | 1,788,522 |
Statoil ASA | 215,500 | | 3,126,283 |
Tandberg ASA | 339,500 | | 3,203,359 |
TANDBERG Television ASA (a) | 388,829 | | 2,824,979 |
TOTAL NORWAY | | 32,829,379 |
Poland - 0.9% |
Polski Koncern Naftowy Orlen SA unit | 455,400 | | 9,791,100 |
Portugal - 0.8% |
Impresa SGPS (a) | 596,953 | | 3,483,479 |
Media Capital SGPS SA | 880,576 | | 5,983,696 |
TOTAL PORTUGAL | | 9,467,175 |
Russia - 0.4% |
Mobile TeleSystems OJSC sponsored ADR | 17,100 | | 2,481,552 |
Surgutneftegaz JSC sponsored ADR | 36,600 | | 1,916,925 |
TOTAL RUSSIA | | 4,398,477 |
Singapore - 1.2% |
Accord Customer Care Solutions Ltd. (a) | 13,435,000 | | 6,220,842 |
Singapore Exchange Ltd. | 2,698,000 | | 2,855,456 |
Singapore Petroleum Co. Ltd. | 1,501,000 | | 3,375,772 |
Venture Corp. Ltd. | 124,000 | | 1,178,147 |
TOTAL SINGAPORE | | 13,630,217 |
South Africa - 3.0% |
African Bank Investments Ltd. | 1,208,151 | | 2,831,983 |
Discovery Holdings Ltd. (a) | 2,442,719 | | 6,651,488 |
MTN Group Ltd. | 594,602 | | 3,247,939 |
Common Stocks - continued |
| Shares | | Value (Note 1) |
South Africa - continued |
Steinhoff International Holdings Ltd. | 11,751,132 | | $20,567,495 |
Wilson Bayly Holmes-Ovcon Ltd. | 333,456 | | 1,364,729 |
TOTAL SOUTH AFRICA | | 34,663,634 |
Spain - 0.2% |
Antena 3 Television SA (a) | 36,758 | | 2,368,424 |
Sweden - 1.7% |
Eniro AB | 153,028 | | 1,297,819 |
Finnveden Invest AB Series B (a) | 368,884 | | 2,854,736 |
Gambro AB (A Shares) | 269,000 | | 3,146,388 |
Hexagon AB (B Shares) | 80,143 | | 2,956,637 |
Lindex AB | 31,898 | | 885,968 |
Mekonomen AB | 68,000 | | 1,807,002 |
Modern Times Group AB (MTG) (B Shares) (a) | 105,200 | | 2,342,007 |
Observer AB | 297,314 | | 1,176,699 |
OMX AB (a) | 162,285 | | 1,921,123 |
VBG AB Class B | 6,710 | | 100,536 |
Wedins Norden AB Series B (a) | 3,202,790 | | 307,843 |
TOTAL SWEDEN | | 18,796,758 |
Switzerland - 1.6% |
A Hiestand Holding AG | 1,812 | | 1,265,880 |
Actelion Ltd. (Reg.) (a) | 18,108 | | 2,078,067 |
Amazys Holding AG | 54,100 | | 2,628,413 |
Barry Callebaut AG | 5,721 | | 1,102,220 |
Escor Casino & Entertainment SA | 19,770 | | 514,205 |
Geberit AG (Reg.) | 1,663 | | 1,086,564 |
Micronas Semiconductor Holding AG (a) | 15,752 | | 620,157 |
Mobilezone Holding AG | 462,199 | | 1,579,638 |
Roche Holding AG (participation certificate) | 30,328 | | 3,109,522 |
Sika AG (Bearer) | 1,436 | | 886,524 |
Sulzer AG (Reg.) | 4,024 | | 1,361,783 |
Swissquote Group Holding SA (a) | 18,811 | | 1,402,395 |
Temenos Group AG (a) | 63,126 | | 449,465 |
TOTAL SWITZERLAND | | 18,084,833 |
Taiwan - 0.1% |
Merry Electronics Co. Ltd. | 584,568 | | 1,319,626 |
Turkey - 0.8% |
Beko Elektronik AS (a) | 887,743,640 | | 3,726,215 |
Common Stocks - continued |
| Shares | | Value (Note 1) |
Turkey - continued |
Dogan Gazetecilik AS (a) | 2,269,570,200 | | $4,363,657 |
Dogan Yayin Holding AS (a) | 359,364,500 | | 1,277,271 |
TOTAL TURKEY | | 9,367,143 |
United Kingdom - 16.1% |
Advanced Technology (UK) PLC (a)(e) | 7,355,000 | | 558,207 |
AeroBox PLC (a) | 3,640,000 | | 986,634 |
Air Partner PLC | 45,000 | | 361,787 |
Alba PLC | 402,700 | | 5,498,361 |
Alliance Pharma PLC (a)(e) | 6,259,500 | | 1,811,686 |
Amlin PLC | 157,014 | | 419,821 |
Asia Energy PLC | 694,600 | | 4,607,918 |
Atrium Underwriting PLC | 257,060 | | 862,105 |
Axis Shield PLC (a) | 89,600 | | 330,953 |
BETonSPORTS PLC | 2,407,121 | | 6,922,693 |
BG Group PLC | 441,600 | | 2,880,847 |
BHP Billiton PLC | 193,400 | | 1,967,147 |
Biocompatibles International PLC | 79,010 | | 330,313 |
Blacks Leisure Group PLC | 45,443 | | 367,437 |
Caffe Nero Group PLC (a) | 282,978 | | 520,015 |
Carphone Warehouse Group PLC | 542,849 | | 1,660,948 |
Chaucer Holdings PLC | 1,612,100 | | 1,303,489 |
Cobra Biomanufacturing PLC (a) | 818,400 | | 515,097 |
Corac Group PLC (a)(e) | 4,698,004 | | 2,460,487 |
Corin Group PLC | 1,122,914 | | 7,067,566 |
CSS Stellar PLC (a) | 623,908 | | 418,481 |
CustomVis PLC (a) | 375,215 | | 131,008 |
Domino's Pizza UK & IRL PLC | 344,636 | | 1,304,640 |
Edinburgh Oil & Gas PLC (a) | 713,381 | | 2,484,240 |
Entertainment Rights PLC (a) | 4,002,089 | | 965,638 |
Flomerics Group PLC | 449,658 | | 458,604 |
Future Network PLC | 1,717,169 | | 1,830,222 |
GMA Resources PLC (a) | 6,547,930 | | 1,955,331 |
Goldshield Group PLC | 575,700 | | 2,248,112 |
GTL Resources PLC (a) | 13,669,072 | | 1,318,746 |
Gyrus Group PLC (a) | 220,640 | | 950,802 |
Hardide Ltd. | 125,000 | | 918,825 |
Healthcare Enterprise Group PLC (a) | 30,417,845 | | 1,062,050 |
Hereward Ventures PLC (a) | 1,818,182 | | 167,059 |
Highbury House Communications PLC | 713,914 | | 131,192 |
Holidaybreak PLC | 72,426 | | 714,047 |
Common Stocks - continued |
| Shares | | Value (Note 1) |
United Kingdom - continued |
Hornby PLC | 471,440 | | $2,391,103 |
Hunting PLC | 530,400 | | 1,832,416 |
Icap PLC | 298,550 | | 1,283,795 |
Ideal Shopping Direct PLC (a) | 273,686 | | 749,379 |
Inchcape PLC | 30,122 | | 818,128 |
International Energy Group Ltd. | 1,148,800 | | 3,937,187 |
Intertek Group PLC | 116,310 | | 1,470,511 |
ITE Group PLC | 3,133,116 | | 4,505,299 |
ITM Power PLC | 2,700,000 | | 3,845,283 |
Jubilee Platinum PLC (a)(e) | 3,852,022 | | 1,822,757 |
Kesa Electricals PLC | 556,201 | | 2,780,120 |
Lambert Howarth Group PLC (e) | 1,320,284 | | 6,550,794 |
Landround PLC | 74,400 | | 345,221 |
Lastminute.com PLC (a) | 1,749,526 | | 3,584,743 |
Lawrence PLC | 1,073,124 | | 7,424,679 |
London Clubs International PLC (a) | 1,172,500 | | 2,510,161 |
LTG Technologies PLC (a) | 6,914,968 | | 1,207,193 |
Man Group PLC | 36,969 | | 887,925 |
Manganese Bronze Holdings PLC | 239,797 | | 846,073 |
Manpower Software PLC (a) | 258,824 | | 160,524 |
Marlborough Stirling PLC | 793,069 | | 648,536 |
Matchnet PLC unit (a) | 823,933 | | 5,271,935 |
Meridian Petroleum PLC | 2,747,000 | | 1,438,687 |
Microgen PLC (a) | 289,948 | | 303,709 |
N Brown Group PLC | 439,410 | | 1,037,614 |
NDS Group PLC sponsored ADR (a) | 105,154 | | 2,751,880 |
Ocean Wilsons Holdings Ltd. | 170,311 | | 604,036 |
Oystertec PLC (a) | 7,009,687 | | 3,155,931 |
P&MM Group PLC (e) | 2,035,000 | | 2,299,865 |
Peacock Group PLC | 835,318 | | 3,968,032 |
Phytopharm PLC (a) | 528,100 | | 1,455,694 |
Pilat Media Global PLC (a)(e) | 2,880,000 | | 2,196,359 |
PlusNet Technologies Ltd. | 912,355 | | 2,347,225 |
Premier Oil PLC (a) | 159,291 | | 1,832,434 |
Proteome Sciences PLC (a) | 645,184 | | 889,217 |
Provident Financial PLC | 434,894 | | 4,671,224 |
Psion PLC | 2,900,000 | | 3,130,896 |
QA PLC (a) | 13,554,656 | | 592,827 |
Regal Petroleum PLC (a) | 137,516 | | 865,519 |
Royalblue Group PLC | 210,803 | | 1,646,374 |
Sanctuary Group PLC | 3,046,215 | | 2,337,114 |
SCI Entertainment Group PLC (a) | 401,531 | | 1,014,576 |
Common Stocks - continued |
| Shares | | Value (Note 1) |
United Kingdom - continued |
SDL PLC (a) | 227,897 | | $487,896 |
Sibir Energy PLC (a) | 1,162,800 | | 299,155 |
Sinclair Pharma PLC | 734,198 | | 1,517,849 |
SkyePharma PLC (a) | 124,100 | | 121,438 |
Sondex PLC | 354,900 | | 1,317,408 |
Spice Holdings PLC | 1,362,100 | | 3,566,865 |
Sportingbet PLC | 345,100 | | 697,590 |
Sterling Energy PLC (a) | 4,035,800 | | 1,409,114 |
SubSea Resources PLC (a) | 7,222,500 | | 2,654,485 |
SubSea Resources PLC warrants 11/4/09 (a) | 1,805,625 | | 33 |
Taghmen Energy Ltd. | 2,279,573 | | 1,481,722 |
Teesland PLC | 1,380,000 | | 1,711,771 |
Tikit Group PLC (e) | 822,761 | | 2,154,524 |
ukbetting PLC (a) | 2,517,419 | | 1,954,542 |
Unibet Group PLC unit | 55,964 | | 1,589,999 |
Urbium PLC | 141,255 | | 1,265,439 |
William Hill PLC | 333,186 | | 2,994,046 |
William Ransom & Son PLC (e) | 2,684,500 | | 2,392,588 |
Windsor PLC | 700,000 | | 546,701 |
Wolfson Microelectronics PLC | 685,250 | | 1,240,361 |
Xstrata PLC | 133,500 | | 2,073,007 |
TOTAL UNITED KINGDOM | | 183,382,016 |
United States of America - 1.8% |
Frontier Mining Ltd. (e) | 4,487,533 | | 1,443,140 |
Golden Telecom, Inc. (d) | 88,900 | | 2,532,761 |
Marathon Oil Corp. | 39,900 | | 1,520,589 |
NTL, Inc. (a) | 69,000 | | 4,589,190 |
Private Media Group, Inc. (a)(d) | 202,400 | | 514,096 |
ResMed, Inc. CHESS Depositary Interests (a) | 642,463 | | 3,054,630 |
Solar Integrated Technologies, Inc. | 876,373 | | 2,214,392 |
Valero Energy Corp. | 41,400 | | 1,778,958 |
XL TechGroup, Inc. | 736,700 | | 2,707,594 |
TOTAL UNITED STATES OF AMERICA | | 20,355,350 |
TOTAL COMMON STOCKS (Cost $910,182,332) | 1,085,177,913 |
Nonconvertible Preferred Stocks - 1.1% |
| Shares | | Value (Note 1) |
Germany - 0.7% |
Fresenius AG | 49,105 | | $4,166,270 |
Fresenius Medical Care AG | 68,266 | | 3,736,387 |
TOTAL GERMANY | | 7,902,657 |
Italy - 0.4% |
Buzzi Unicem Spa (Risp) | 483,900 | | 4,415,230 |
TOTAL NONCONVERTIBLE PREFERRED STOCKS (Cost $9,850,251) | 12,317,887 |
Money Market Funds - 8.3% |
| | | |
Fidelity Cash Central Fund, 1.79% (b) | 31,425,450 | | 31,425,450 |
Fidelity Securities Lending Cash Central Fund, 1.77% (b)(c) | 62,835,268 | | 62,835,268 |
TOTAL MONEY MARKET FUNDS (Cost $94,260,718) | 94,260,718 |
TOTAL INVESTMENT PORTFOLIO - 104.9% (Cost $1,014,293,301) | | 1,191,756,518 |
NET OTHER ASSETS - (4.9)% | | (55,719,257) |
NET ASSETS - 100% | $1,136,037,261 |
Legend |
(a)Non-income producing |
(b)Affiliated fund that is available only to investment companies and other accounts managed by Fidelity Investments. The rate quoted is the annualized seven-day yield of the fund at period end. A complete listing of the fund's holdings as of its most recent fiscal year end is available upon request. |
(c)Includes investment made with cash collateral received from securities on loan. |
(d)Security or a portion of the security is on loan at period end. |
(e)Affiliated company |
(f)Restricted securities - Investment in securities not registered under the Securities Act of 1933 (excluding 144A issues). At the end of the period, the value of restricted securities (excluding 144A issues) amounted to $1,024,682 or 0.1% of net assets. |
Additional information on each holding is as follows: |
Security | Acquisition Date | Acquisition Cost |
Western Canadian Coal Corp. | 9/29/04 | $0 |
Other Information |
An affiliated company is a company in which the fund has ownership of at least 5% of the voting securities. Companies which are affiliates of the fund at period-end are noted in the fund's Schedule of Investments. Transactions during the period with companies which are or were affiliates are as follows: |
Affiliates | Value, beginning of period | Purchases | Sales Proceeds | Dividend Income | Value,
end of
period |
Advanced Technology (UK) PLC | $- | $677,635 | $- | $- | $558,207 |
Alliance Pharma PLC | - | 1,378,455 | - | - | 1,811,686 |
Articon-Integralis AG (Reg.) | - | 3,216,353 | 382,484 | - | - |
Corac Group PLC | - | 2,448,084 | - | - | 2,460,487 |
Frontier Mining Ltd. | - | 1,213,216 | - | - | 1,443,140 |
Jubilee Platinum PLC | - | 1,879,542 | 562,643 | - | 1,822,757 |
Lambert Howarth Group PLC | 4,376,721 | 1,140,404 | - | 228,933 | 6,550,794 |
Online Travel Corp. PLC | 2,164,843 | - | - | - | - |
Ontzinc Corp. | - | 1,719,571 | - | - | 1,841,458 |
P&MM Group PLC | - | 1,986,262 | - | - | 2,299,865 |
Pilat Media Global PLC | - | 2,810,095 | - | - | 2,196,359 |
Tikit Group PLC | - | 2,069,038 | - | 24,172 | 2,154,524 |
Wedins Norden AB Series B | 956,215 | 2,235,131 | 1,034,922 | - | - |
William Ransom & Son PLC | - | 2,458,423 | - | 48,384 | 2,392,588 |
Totals | $7,497,779 | $25,232,209 | $1,980,049 | $301,489 | $25,531,865 |
See accompanying notes which are an integral part of the financial statements.
Annual Report
Financial Statements
Statement of Assets and Liabilities
October 31, 2004 |
| | |
Assets | | |
Investment in securities, at value (including securities loaned of $58,511,696) (cost $1,014,293,301) - See accompanying schedule | | $1,191,756,518 |
Cash | | 153,592 |
Foreign currency held at value (cost $5,447,045) | | 5,423,146 |
Receivable for investments sold | | 9,813,009 |
Receivable for fund shares sold | | 2,888,611 |
Dividends receivable | | 1,251,600 |
Interest receivable | | 38,100 |
Other affiliated receivables | | 3,355 |
Other receivables | | 129,888 |
Total assets | | 1,211,457,819 |
| | |
Liabilities | | |
Payable for investments purchased | $9,970,193 | |
Payable for fund shares redeemed | 1,253,833 | |
Accrued management fee | 896,565 | |
Distribution fees payable | 19,420 | |
Other affiliated payables | 246,714 | |
Other payables and accrued expenses | 198,565 | |
Collateral on securities loaned, at value | 62,835,268 | |
Total liabilities | | 75,420,558 |
| | |
Net Assets | | $1,136,037,261 |
Net Assets consist of: | | |
Paid in capital | | $898,686,393 |
Undistributed net investment income | | 5,017,937 |
Accumulated undistributed net realized gain (loss) on investments and foreign currency transactions | | 54,860,187 |
Net unrealized appreciation (depreciation) on investments and assets and liabilities in foreign currencies | | 177,472,744 |
Net Assets | | $1,136,037,261 |
See accompanying notes which are an integral part of the financial statements.
Annual Report
Financial Statements - continued
Statement of Assets and Liabilities - continued
October 31, 2004 |
| | |
Calculation of Maximum Offering Price
Class A:
Net Asset Value and redemption price per share
($13,277,823 ÷ 624,767 shares) | | $21.25 |
| | |
Maximum offering price per share (100/94.25 of $21.25) | | $22.55 |
Class T:
Net Asset Value and redemption price per share ($15,131,252 ÷ 713,891 shares) | | $21.20 |
| | |
Maximum offering price per share (100/96.50 of $21.20) | | $21.97 |
Class B:
Net Asset Value and offering price per share ($5,060,793 ÷ 241,137 shares) A | | $20.99 |
| | |
Class C:
Net Asset Value and offering price per share ($8,664,337 ÷ 411,711 shares) A | | $21.04 |
| | |
| | |
International Small Cap:
Net Asset Value, offering price and redemption price per share ($1,091,335,065 ÷ 51,091,331 shares) | | $21.36 |
| | |
Institutional Class:
Net Asset Value, offering price and redemption price per share ($2,567,991 ÷ 120,234 shares) | | $21.36 |
ARedemption price per share is equal to net asset value less any applicable contingent deferred sales charge.
See accompanying notes which are an integral part of the financial statements.
Annual Report
Statement of Operations
Year ended October 31, 2004 |
| | |
Investment Income | | |
Dividends (including $301,489 received from
affiliated issuers) | | $17,760,750 |
Interest | | 500,442 |
Security lending | | 1,159,171 |
| | 19,420,363 |
Less foreign taxes withheld | | (1,435,129) |
Total income | | 17,985,234 |
| | |
Expenses | | |
Management fee
Basic fee | $8,826,255 | |
Performance adjustment | 713,427 | |
Transfer agent fees | 2,181,571 | |
Distribution fees | 153,758 | |
Accounting and security lending fees | 516,934 | |
Non-interested trustees' compensation | 4,963 | |
Custodian fees and expenses | 574,790 | |
Registration fees | 266,493 | |
Audit | 41,794 | |
Legal | 19,756 | |
Interest | 2,571 | |
Miscellaneous | 54,905 | |
Total expenses before reductions | 13,357,217 | |
Expense reductions | (235,589) | 13,121,628 |
Net investment income (loss) | | 4,863,606 |
Realized and Unrealized Gain (Loss) Net realized gain (loss) on: | | |
Investment securities (Including realized gain (loss) of $(1,489,101) from affiliated issuers) | 55,896,770 | |
Foreign currency transactions | (196,336) | |
Total net realized gain (loss) | | 55,700,434 |
Change in net unrealized appreciation (depreciation) on: Investment securities | 104,967,642 | |
Assets and liabilities in foreign currencies | 20,845 | |
Total change in net unrealized appreciation (depreciation) | | 104,988,487 |
Net gain (loss) | | 160,688,921 |
Net increase (decrease) in net assets resulting from operations | | $165,552,527 |
See accompanying notes which are an integral part of the financial statements.
Annual Report
Financial Statements - continued
Statement of Changes in Net Assets
| Year ended
October 31,
2004 | Year ended
October 31,
2003 |
Increase (Decrease) in Net Assets | | |
Operations | | |
Net investment income (loss) | $4,863,606 | $516,714 |
Net realized gain (loss) | 55,700,434 | 11,443,482 |
Change in net unrealized appreciation (depreciation) | 104,988,487 | 72,481,971 |
Net increase (decrease) in net assets resulting
from operations | 165,552,527 | 84,442,167 |
Distributions to shareholders from net investment income | (740,885) | - |
Distributions to shareholders from net realized gain | (11,573,205) | (27,060) |
Total distributions | (12,314,090) | (27,060) |
Share transactions - net increase (decrease) | 422,159,706 | 470,607,516 |
Redemption fees | 1,900,450 | 290,434 |
Total increase (decrease) in net assets | 577,298,593 | 555,313,057 |
| | |
Net Assets | | |
Beginning of period | 558,738,668 | 3,425,611 |
End of period (including undistributed net investment income of $5,017,937 and undistributed net investment income of $614,412, respectively) | $1,136,037,261 | $558,738,668 |
See accompanying notes which are an integral part of the financial statements.
Annual Report
Financial Highlights - Class A
Years ended October 31, | 2004 | 2003 G |
Selected Per-Share Data | | |
Net asset value, beginning of period | $17.69 | $12.35 |
Income from Investment Operations | | |
Net investment income (loss) E | .02 | .02 F |
Net realized and unrealized gain (loss) | 3.83 | 5.30 |
Total from investment operations | 3.85 | 5.32 |
Distributions from net investment income | (.02) | - |
Distributions from net realized gain | (.31) | - |
Total distributions | (.33) | - |
Redemption fees added to paid in capital E | .04 | .02 |
Net asset value, end of period | $21.25 | $17.69 |
Total Return B, C, D | 22.36% | 43.24% |
Ratios to Average Net Assets H | | |
Expenses before expense reductions | 1.71% | 1.77% A |
Expenses net of voluntary waivers, if any | 1.71% | 1.77% A |
Expenses net of all reductions | 1.69% | 1.74% A |
Net investment income (loss) | .09% | .28% A |
Supplemental Data | | |
Net assets, end of period (000 omitted) | $13,278 | $4,960 |
Portfolio turnover rate | 77% | 84% A |
AAnnualized
BTotal returns for periods of less than one year are not annualized.
CTotal returns would have been lower had certain expenses not been reduced during the periods shown.
DTotal returns do not include the effect of the sales charges.
ECalculated based on average shares outstanding during the period.
FInvestment income per share reflects a special dividend which amounted to $.01 per share.
GFor the period May 27, 2003 (commencement of sale of shares) to October 31, 2003.
HExpense ratios reflect operating expenses of the class. Expenses before reductions do not reflect amounts reimbursed by the investment adviser or reductions from brokerage service arrangements or other expense offset arrangements and do not represent the amount paid by the class during periods when reimbursements or reductions occur. Expense ratios before reductions for start-up periods may not be representative of longer-term operating periods. Expenses net of any voluntary waivers reflect expenses after reimbursement by the investment adviser but prior to reductions from brokerage service arrangements or other expense offset arrangements. Expenses net of all reductions represent the net expenses paid by the class.
See accompanying notes which are an integral part of the financial statements.
Annual Report
Financial Highlights - Class T
Years ended October 31, | 2004 | 2003 G |
Selected Per-Share Data | | |
Net asset value, beginning of period | $17.68 | $12.35 |
Income from Investment Operations | | |
Net investment income (loss) E | (.03) | -F,I |
Net realized and unrealized gain (loss) | 3.83 | 5.31 |
Total from investment operations | 3.80 | 5.31 |
Distributions from net investment income | (.01) | - |
Distributions from net realized gain | (.31) | - |
Total distributions | (.32) | - |
Redemption fees added to paid in capital E | .04 | .02 |
Net asset value, end of period | $21.20 | $17.68 |
Total Return B,C,D | 22.07% | 43.16% |
Ratios to Average Net AssetsH | | |
Expenses before expense reductions | 1.94% | 2.12% A |
Expenses net of voluntary waivers, if any | 1.94% | 2.12% A |
Expenses net of all reductions | 1.92% | 2.09% A |
Net investment income (loss) | (.14)% | (.07)%A |
Supplemental Data | | |
Net assets, end of period (000 omitted) | $15,131 | $3,990 |
Portfolio turnover rate | 77% | 84% A |
AAnnualized
BTotal returns for periods of less than one year are not annualized.
CTotal returns would have been lower had certain expenses not been reduced during the periods shown.
DTotal returns do not include the effect of the sales charges.
ECalculated based on average shares outstanding during the period.
FInvestment income per share reflects a special dividend which amounted to $.01 per share.
GFor the period May 27, 2003 (commencement of sale of shares) to October 31, 2003.
HExpense ratios reflect operating expenses of the class. Expenses before reductions do not reflect amounts reimbursed by the investment adviser or reductions from brokerage service arrangements or other expense offset arrangements and do not represent the amount paid by the class during periods when reimbursements or reductions occur. Expense ratios before reductions for start-up periods may not be representative of longer-term operating periods. Expenses net of any voluntary waivers reflect expenses after reimbursement by the investment adviser but prior to reductions from brokerage service arrangements or other expense offset arrangements. Expenses net of all reductions represent the net expenses paid by the class.
IAmount represents less than $.01 per share.
See accompanying notes which are an integral part of the financial statements.
Annual Report
Financial Highlights - Class B
Years ended October 31, | 2004 | 2003 G |
Selected Per-Share Data | | |
Net asset value, beginning of period | $17.62 | $12.35 |
Income from Investment Operations | | |
Net investment income (loss) E | (.16) | (.05) F |
Net realized and unrealized gain (loss) | 3.80 | 5.30 |
Total from investment operations | 3.64 | 5.25 |
Distributions from net realized gain | (.31) | - |
Redemption fees added to paid in capital E | .04 | .02 |
Net asset value, end of period | $20.99 | $17.62 |
Total Return B, C, D | 21.21% | 42.67% |
Ratios to Average Net Assets H | | |
Expenses before expense reductions | 2.63% | 2.76% A |
Expenses net of voluntary waivers, if any | 2.63% | 2.76%A |
Expenses net of all reductions | 2.60% | 2.73%A |
Net investment income (loss) | (.83)% | (.71)%A |
Supplemental Data | | |
Net assets, end of period (000 omitted) | $5,061 | $1,016 |
Portfolio turnover rate | 77% | 84%A |
AAnnualized
BTotal returns for periods of less than one year are not annualized.
CTotal returns would have been lower had certain expenses not been reduced during the periods shown.
DTotal returns do not include the effect of the contingent deferred sales charge.
ECalculated based on average shares outstanding during the period.
FInvestment income per share reflects a special dividend which amounted to $.01 per share.
GFor the period May 27, 2003 (commencement of sale of shares) to October 31, 2003.
HExpense ratios reflect operating expenses of the class. Expenses before reductions do not reflect amounts reimbursed by the investment adviser or reductions from brokerage service arrangements or other expense offset arrangements and do not represent the amount paid by the class during periods when reimbursements or reductions occur. Expense ratios before reductions for start-up periods may not be representative of longer-term operating periods. Expenses net of any voluntary waivers reflect expenses after reimbursement by the investment adviser but prior to reductions from brokerage service arrangements or other expense offset arrangements. Expenses net of all reductions represent the net expenses paid by the class.
See accompanying notes which are an integral part of the financial statements.
Annual Report
Financial Highlights - Class C
Years ended October 31, | 2004 | 2003 G |
Selected Per-Share Data | | |
Net asset value, beginning of period | $17.64 | $12.35 |
Income from Investment Operations | | |
Net investment income (loss) E | (.12) | (.04) F |
Net realized and unrealized gain (loss) | 3.80 | 5.31 |
Total from investment operations | 3.68 | 5.27 |
Distributions from net investment income | (.01) | - |
Distributions from net realized gain | (.31) | - |
Total distributions | (.32) | - |
Redemption fees added to paid in capital E | .04 | .02 |
Net asset value, end of period | $21.04 | $17.64 |
Total Return B, C, D | 21.43% | 42.83% |
Ratios to Average Net Assets H | | |
Expenses before expense reductions | 2.43% | 2.57% A |
Expenses net of voluntary waivers, if any | 2.43% | 2.57% A |
Expenses net of all reductions | 2.40% | 2.55% A |
Net investment income (loss) | (.62)% | (.52)%A |
Supplemental Data | | |
Net assets, end of period (000 omitted) | $8,664 | $1,383 |
Portfolio turnover rate | 77% | 84% A |
AAnnualized
BTotal returns for periods of less than one year are not annualized.
CTotal returns would have been lower had certain expenses not been reduced during the periods shown.
DTotal returns do not include the effect of the contingent deferred sales charge.
ECalculated based on average shares outstanding during the period.
FInvestment income per share reflects a special dividend which amounted to $.01 per share.
GFor the period May 27, 2003 (commencement of sale of shares) to October 31, 2003.
HExpense ratios reflect operating expenses of the class. Expenses before reductions do not reflect amounts reimbursed by the investment adviser or reductions from brokerage service arrangements or other expense offset arrangements and do not represent the amount paid by the class during periods when reimbursements or reductions occur. Expense ratios before reductions for start-up periods may not be representative of longer-term operating periods. Expenses net of any voluntary waivers reflect expenses after reimbursement by the investment adviser but prior to reductions from brokerage service arrangements or other expense offset arrangements. Expenses net of all reductions represent the net expenses paid by the class.
See accompanying notes which are an integral part of the financial statements.
Annual Report
Financial Highlights - International Small Cap
Years ended October 31, | 2004 | 2003 | 2002 F |
Selected Per-Share Data | | | |
Net asset value, beginning of period | $17.71 | $9.87 | $10.00 |
Income from Investment Operations | | | |
Net investment income (loss) D | .10 | .07 E | (.01) |
Net realized and unrealized gain (loss) | 3.84 | 7.75 | (.12) |
Total from investment operations | 3.94 | 7.82 | (.13) |
Distributions from net investment income | (.02) | - | - |
Distributions from net realized gain | (.31) | (.02) | - |
Total distributions | (.33) | (.02) | - |
Redemption fees added to paid in capital D | .04 | .04 | - H |
Net asset value, end of period | $21.36 | $17.71 | $9.87 |
Total Return B, C | 22.84% | 79.78% | (1.30)% |
Ratios to Average Net Assets G | | | |
Expenses before expense reductions | 1.30% | 1.54% | 13.70% A |
Expenses net of voluntary waivers, if any | 1.30% | 1.54% | 1.80% A |
Expenses net of all reductions | 1.28% | 1.51% | 1.80% A |
Net investment income (loss) | .50% | .46% | (.56)% A |
Supplemental Data | | | |
Net assets, end of period (000 omitted) | $1,091,335 | $546,989 | $3,426 |
Portfolio turnover rate | 77% | 84% | 85% A |
AAnnualized
BTotal returns for periods of less than one year are not annualized.
CTotal returns would have been lower had certain expenses not been reduced during the periods shown.
DCalculated based on average shares outstanding during the period.
EInvestment income per share reflects a special dividend which amounted to $.03 per share.
FFor the period September 18, 2002 (commencement of operations) to October 31, 2002.
GExpense ratios reflect operating expenses of the class. Expenses before reductions do not reflect amounts reimbursed by the investment adviser or reductions from brokerage service arrangements or other expense offset arrangements and do not represent the amount paid by the class during periods when reimbursements or reductions occur. Expense ratios before reductions for start-up periods may not be representative of longer-term operating periods. Expenses net of any voluntary waivers reflect expenses after reimbursement by the investment adviser but prior to reductions from brokerage service arrangements or other expense offset arrangements. Expenses net of all reductions represent the net expenses paid by the class.
HAmount represents less than $.01 per share.
See accompanying notes which are an integral part of the financial statements.
Annual Report
Financial Highlights - Institutional Class
Years ended October 31, | 2004 | 2003 F |
Selected Per-Share Data | | |
Net asset value, beginning of period | $17.72 | $12.35 |
Income from Investment Operations | | |
Net investment income (loss) D | .10 | .04 E |
Net realized and unrealized gain (loss) | 3.84 | 5.31 |
Total from investment operations | 3.94 | 5.35 |
Distributions from net investment income | (.03) | - |
Distributions from net realized gain | (.31) | - |
Total distributions | (.34) | - |
Redemption fees added to paid in capital D | .04 | .02 |
Net asset value, end of period | $21.36 | $17.72 |
Total Return B, C | 22.84% | 43.48% |
Ratios to Average Net Assets G | | |
Expenses before expense reductions | 1.32% | 1.51% A |
Expenses net of voluntary waivers, if any | 1.32% | 1.51% A |
Expenses net of all reductions | 1.29% | 1.48% A |
Net investment income (loss) | .49% | .54% A |
Supplemental Data | | |
Net assets, end of period (000 omitted) | $2,568 | $401 |
Portfolio turnover rate | 77% | 84% A |
AAnnualized
BTotal returns for periods of less than one year are not annualized.
CTotal returns would have been lower had certain expenses not been reduced during the periods shown.
DCalculated based on average shares outstanding during the period.
EInvestment income per share reflects a special dividend which amounted to $.01 per share.
FFor the period May 27, 2003 (commencement of sale of shares) to October 31, 2003.
GExpense ratios reflect operating expenses of the class. Expenses before reductions do not reflect amounts reimbursed by the investment adviser or reductions from brokerage service arrangements or other expense offset arrangements and do not represent the amount paid by the class during periods when reimbursements or reductions occur. Expense ratios before reductions for start-up periods may not be representative of longer-term operating periods. Expenses net of any voluntary waivers reflect expenses after reimbursement by the investment adviser but prior to reductions from brokerage service arrangements or other expense offset arrangements. Expenses net of all reductions represent the net expenses paid by the class.
See accompanying notes which are an integral part of the financial statements.
Annual Report
Notes to Financial Statements
For the period ended October 31, 2004
1. Significant Accounting Policies.
Fidelity International Small Cap Fund (the fund) is a fund of Fidelity Investment Trust (the trust) and is authorized to issue an unlimited number of shares. The trust is registered under the Investment Company Act of 1940, as amended (the 1940 Act), as an open-end management investment company organized as a Massachusetts business trust.
The fund offers Class A, Class T, Class B, Class C, International Small Cap (the original class), and Institutional Class shares, each of which has equal rights as to assets and voting privileges. Each class has exclusive voting rights with respect to matters that affect that class. Class B shares will automatically convert to Class A shares after a holding period of seven years from the initial date of purchase. Investment income, realized and unrealized capital gains and losses, the common expenses of the fund, and certain fund-level expense reductions, if any, are allocated on a pro rata basis to each class based on the relative net assets of each class to the total net assets of the fund. Each class differs with respect to transfer agent and distribution and service plan fees incurred. Certain expense reductions also differ by class.
The financial statements have been prepared in conformity with accounting principles generally accepted in the United States of America, which require management to make certain estimates and assumptions at the date of the financial statements. The following summarizes the significant accounting policies of the fund:
Security Valuation. Net asset value per share (NAV calculation) is calculated as of the close of business of the New York Stock Exchange, normally 4:00 p.m. Eastern time. Equity securities, including restricted securities, for which market quotations are available are valued at the last sale price or official closing price (closing bid price or last evaluated quote if no sale has occurred) on the primary market or exchange on which they trade. Debt securities, including restricted securities, for which quotations are readily available are valued at their most recent bid prices (sales prices if the principal market is an exchange) in the principal market in which such securities are normally traded, as determined by recognized dealers in such securities, or securities are valued on the basis of information provided by a pricing service. Pricing services use valuation matrices that incorporate both dealer-supplied valuations and valuation models. If prices are not readily available or do not accurately reflect fair value for a security, or if a security's value has been materially affected by events occurring after the close of the exchange or market on which the security is principally traded, that security may be valued by another method that the Board of Trustees believes accurately reflects fair value. A security's valuation may differ depending on the method used for determining value. Price movements in futures contracts and ADRs, market and trading trends, the bid/ask quotes of brokers and off-exchange institutional trading may be reviewed in the course of making a good faith determination of a security's fair value. Short-term securities with remaining maturities of sixty days or less for which quotations are not readily
Annual Report
Notes to Financial Statements - continued
1. Significant Accounting Policies - continued
Security Valuation - continued
available are valued on the basis of amortized cost. Investments in open-end investment companies are valued at their net asset value each business day.
Foreign Currency. The fund uses foreign currency contracts to facilitate transactions in foreign-denominated securities. Losses from these transactions may arise from changes in the value of the foreign currency or if the counterparties do not perform under the contracts' terms.
Foreign-denominated assets, including investment securities, and liabilities are translated into U.S. dollars at the exchange rate at period end. Purchases and sales of investment securities, income and dividends received and expenses denominated in foreign currencies are translated into U.S. dollars at the exchange rate in effect on the transaction date.
The effects of exchange rate fluctuations on investments are included with the net realized and unrealized gain (loss) on investment securities. Other foreign currency transactions resulting in realized and unrealized gain (loss) are disclosed separately.
Investment Transactions and Income. Security transactions are accounted for as of trade date. Gains and losses on securities sold are determined on the basis of identified cost and may include proceeds received from litigation. Dividend income is recorded on the ex-dividend date, except for certain dividends from foreign securities where the ex-dividend date may have passed, which are recorded as soon as the fund is informed of the ex-dividend date. Non-cash dividends included in dividend income, if any, are recorded at the fair market value of the securities received. Interest income is accrued as earned. Interest income includes coupon interest and amortization of premium and accretion of discount on debt securities. Investment income is recorded net of foreign taxes withheld where recovery of such taxes is uncertain.
Expenses. Most expenses of the trust can be directly attributed to a fund. Expenses which cannot be directly attributed are apportioned among the funds in the trust.
Income Tax Information and Distributions to Shareholders. Each year, the fund intends to qualify as a regulated investment company by distributing all of its taxable income and realized gains under Subchapter M of the Internal Revenue Code. As a result, no provision for income taxes is required in the accompanying financial statements. Foreign taxes are provided for based on the fund's understanding of the tax rules and rates that exist in the foreign markets in which it invests.
Annual Report
1. Significant Accounting Policies - continued
Income Tax Information and Distributions to Shareholders - continued
Distributions are recorded on the ex-dividend date. Income dividends and capital gain distributions are declared separately for each class. Income and capital gain distributions are determined in accordance with income tax regulations, which may differ from generally accepted accounting principles. In addition, the fund will claim a portion of the payment made to redeeming shareholders as a distribution for income tax purposes.
Capital accounts within the financial statements are adjusted for permanent book-tax differences. These adjustments have no impact on net assets or the results of operations. Temporary book-tax differences will reverse in a subsequent period.
Book-tax differences are primarily due to foreign currency transactions, passive foreign investment companies (PFIC) and losses deferred due to wash sales.
The tax-basis components of distributable earnings and the federal tax cost as of period end were as follows:
Unrealized appreciation | $217,728,209 | |
Unrealized depreciation | (43,208,604) | |
Net unrealized appreciation (depreciation) | 174,519,605 | |
Undistributed ordinary income | 30,238,812 | |
Undistributed long-term capital gain | 18,049,009 | |
| | |
Cost for federal income tax purposes | $1,017,236,913 | |
The tax character of distributions paid was as follows:
| October 31,
2004 | October 31,
2003 |
Ordinary Income | $12,314,090 | $ 27,060 |
Short-Term Trading (Redemption) Fees. Shares held in the fund less than 90 days are subject to a redemption fee equal to 2.00% of the proceeds of the redeemed shares. All redemption fees, including any estimated redemption fees paid by Fidelity Management & Research Company (FMR), are retained by the fund and accounted for as an addition to paid in capital.
Annual Report
Notes to Financial Statements - continued
2. Operating Policies.
Repurchase Agreements. FMR has received an Exemptive Order from the Securities and Exchange Commission (the SEC) which permits the fund and other affiliated entities of FMR to transfer uninvested cash balances into joint trading accounts. These accounts are then invested in repurchase agreements that are collateralized by U.S. Treasury or Government obligations. The fund may also invest directly with institutions, in repurchase agreements that are collateralized by commercial paper obligations and corporate obligations. Collateral is held in segregated accounts with custodian banks and may be obtained in the event of a default of the counterparty. Collateral is marked-to-market daily and maintained at a value at least equal to the principal amount of the repurchase agreement (including accrued interest).
Restricted Securities. The fund may invest in securities that are subject to legal or contractual restrictions on resale. These securities generally may be resold in transactions exempt from registration or to the public if the securities are registered. Disposal of these securities may involve time-consuming negotiations and expense, and prompt sale at an acceptable price may be difficult. Information regarding restricted securities is included at the end of the fund's Schedule of Investments.
3. Purchases and Sales of Investments.
Purchases and sales of securities, other than short-term securities and U.S. government securities, aggregated $1,186,404,079 and $735,977,091, respectively.
4. Fees and Other Transactions with Affiliates.
Management Fee. FMR and its affiliates provide the fund with investment management related services for which the fund pays a monthly management fee. The management fee is the sum of an individual fund fee rate that is based on an annual rate of .60% of the fund's average net assets and a group fee rate that averaged .28% during the period. The group fee rate is based upon the average net assets of all the mutual funds advised by FMR. The group fee rate decreases as assets under management increase and increases as assets under management decrease. In addition, the management fee is subject to a performance adjustment (up to a maximum of ±.20% of the fund's average net assets over a 36 month performance period). The upward or downward adjustment to the management fee is based on the investment performance of the asset-weighted return of all classes as compared to an appropriate benchmark index. For the period, the total annual management fee rate, including the performance adjustment, was .94% of the fund's average net assets.
Annual Report
4. Fees and Other Transactions with Affiliates - continued
Distribution and Service Plan. In accordance with Rule 12b-1 of the 1940 Act, the Fund has adopted separate Distribution and Service Plans for each class of shares. Certain classes pay Fidelity Distributors Corporation (FDC), an affiliate of FMR, separate Distribution and Service Fees, each of which is based on an annual percentage of each class' average net assets. In addition, FDC may pay financial intermediaries for selling shares of the fund and providing shareholder support services. For the period, the Distribution and Service Fee rates and the total amounts paid to and retained by FDC were as follows:
| Distribution
Fee | Service
Fee | Paid to
FDC | Retained
by FDC |
Class A | 0% | .25% | $20,474 | $325 |
Class T | .25% | .25% | 49,312 | 539 |
Class B | .75% | .25% | 31,386 | 23,852 |
Class C | .75% | .25% | 52,586 | 37,268 |
| | | $153,758 | $61,984 |
Sales Load. FDC receives a front-end sales charge of up to 5.75% for selling Class A shares, and 3.50% for selling Class T shares, some of which is paid to financial intermediaries for selling shares of the fund. FDC receives the proceeds of contingent deferred sales charges levied on Class A, Class T, Class B, and Class C redemptions. These charges depend on the holding period. The deferred sales charges range from 5% to 1% for Class B, 1% for Class C, and .25% for certain purchases of Class A and Class T shares.
For the period, sales charge amounts retained by FDC were as follows:
| Retained
by FDC | |
Class A | $29,979 | |
Class T | 10,916 | |
Class B * | 3,470 | |
Class C * | 5,990 | |
| $50,355 | |
*When Class B and Class C shares are initially sold, FDC pays commissions from its own resources to financial intermediaries through which the sales are made.
Annual Report
Notes to Financial Statements - continued
4. Fees and Other Transactions with Affiliates - continued
Transfer Agent Fees. Fidelity Investments Institutional Operations Company, Inc. (FIIOC), an affiliate of FMR, is the transfer, dividend disbursing and shareholder servicing agent for each class of the fund, except for International Small Cap. Fidelity Service Company, Inc. (FSC), an affiliate of FMR, is the transfer agent for International Small Cap shares. FIIOC and FSC receive account fees and asset-based fees that vary according to the account size and type of account of the shareholders of the respective classes of the fund. FIIOC and FSC pay for typesetting, printing and mailing of shareholder reports, except proxy statements. For the period the total transfer agent fees paid by each class to FIIOC or FSC, were as follows:
| Amount | % of
Average
Net Assets |
Class A | $30,826 | .37 |
Class T | 35,396 | .36 |
Class B | 17,158 | .54 |
Class C | 18,101 | .34 |
International Small Cap | 2,076,187 | .21 |
Institutional Class | 3,903 | .23 |
| $2,181,571 | |
Accounting and Security Lending Fees. FSC maintains the fund's accounting records. The accounting fee is based on the level of average net assets for the month. Under a separate contract, FSC administers the security lending program. The security lending fee is based on the number and duration of lending transactions.
Central Funds. The fund may invest in affiliated Central Funds managed by Fidelity Investments Money Management, Inc. (FIMM), an affiliate of FMR. The Central Funds are open-end investment companies available only to investment companies and other accounts managed by FMR and its affiliates. The Central Funds seek preservation of capital and current income and do not pay a management fee. Income distributions earned by the fund are recorded as income in the accompanying financial statements and totaled $459,974 for the period.
Brokerage Commissions. The fund placed a portion of its portfolio transactions with brokerage firms which are affiliates of the investment adviser. The commissions paid to these affiliated firms were $2 for the period.
Annual Report
4. Fees and Other Transactions with Affiliates - continued
Interfund Lending Program. Pursuant to an Exemptive Order issued by the SEC, the fund, along with other registered investment companies having management contracts with FMR, may participate in an interfund lending program. This program provides an alternative credit facility allowing the funds to borrow from, or lend money to, other participating funds. At period end, there were no interfund loans outstanding. The fund's activity in this program during the period was as follows:
Borrower or Lender | Average Daily Loan Balance | Weighted Average Interest Rate | Interest Expense |
Borrower | $27,505,333 | 1.12% | $2,571 |
5. Committed Line of Credit.
The fund participates with other funds managed by FMR in a $4.2 billion credit facility (the "line of credit") to be utilized for temporary or emergency purposes to fund shareholder redemptions or for other short-term liquidity purposes. The fund has agreed to pay commitment fees on its pro rata portion of the line of credit. During the period, there were no borrowings on this line of credit.
6. Security Lending.
The fund lends portfolio securities from time to time in order to earn additional income. The fund receives collateral (in the form of U.S. Treasury obligations, letters of credit and/or cash) against the loaned securities and maintains collateral in an amount not less than 100% of the market value of the loaned securities during the period of the loan. The market value of the loaned securities is determined at the close of business of the fund and any additional required collateral is delivered to the fund on the next business day. If the borrower defaults on its obligation to return the securities loaned because of insolvency or other reasons, a fund could experience delays and costs in recovering the securities loaned or in gaining access to the collateral. Cash collateral is invested in cash equivalents. The value of loaned securities and cash collateral at period end are disclosed on the fund's Statement of Assets and Liabilities.
Annual Report
Notes to Financial Statements - continued
7. Expense Reductions.
Many of the brokers with whom FMR places trades on behalf of the fund provided services to the fund in addition to trade execution. These services included payments of certain expenses on behalf of the fund totaling $231,874 for the period. In addition, through arrangements with the fund's custodian, credits realized as a result of uninvested cash balances were used to reduce the fund's expenses. During the period, these credits reduced the fund's custody expenses by $3,715.
8. Distributions to Shareholders.
Distributions to shareholders of each class were as follows:
| Years ended October 31, |
| 2004 | 2003 |
From net investment income | | |
Class A | $3,252 | $- |
Class T | 2,950 | - |
Class C | 1,354 | - |
International Small Cap | 732,332 | - |
Institutional Class | 997 | - |
Total | $740,885 | $- |
From net realized gain | | |
Class A | $50,399 | $- |
Class T | 91,451 | - |
Class B | 28,049 | - |
Class C | 41,980 | - |
International Small Cap | 11,351,027 | 27,060 |
Institutional Class | 10,299 | - |
Total | $11,573,205 | $27,060 |
Annual Report
9. Share Transactions.
Transactions for each class of shares were as follows:
| Shares
Years ended October 31, | Dollars
Years ended October 31, |
| 2004 | 2003 A | 2004 | 2003 A |
Class A | | | | |
Shares sold | 655,161 | 287,827 | $12,872,993 | $4,774,574 |
Reinvestment of distributions | 2,641 | - | 46,931 | - |
Shares redeemed | (313,383) | (7,479) | (5,810,697) | (125,524) |
Net increase (decrease) | 344,419 | 280,348 | $7,109,227 | $4,649,050 |
Class T | | | | |
Shares sold | 729,426 | 229,190 | $14,388,966 | $3,468,992 |
Reinvestment of distributions | 4,802 | - | 85,378 | - |
Shares redeemed | (246,002) | (3,525) | (4,796,147) | (55,853) |
Net increase (decrease) | 488,226 | 225,665 | $9,678,197 | $3,413,139 |
Class B | | | | |
Shares sold | 254,206 | 60,233 | $4,980,844 | $911,644 |
Reinvestment of distributions | 1,477 | - | 26,163 | - |
Shares redeemed | (72,209) | (2,570) | (1,405,301) | (40,678) |
Net increase (decrease) | 183,474 | 57,663 | $3,601,706 | $870,966 |
Class C | | | | |
Shares sold | 412,202 | 88,372 | $8,031,151 | $1,388,024 |
Reinvestment of distributions | 2,245 | - | 39,811 | - |
Shares redeemed | (81,166) | (9,942) | (1,589,819) | (158,911) |
Net increase (decrease) | 333,281 | 78,430 | $6,481,143 | $1,229,113 |
International Small Cap | | | | |
Shares sold | 48,249,110 | 32,919,552 | $942,554,096 | $492,932,712 |
Reinvestment of distributions | 631,834 | 2,491 | 11,252,965 | 25,785 |
Shares redeemed | (28,670,350) | (2,388,222) | (560,463,897) | (32,859,600) |
Net increase (decrease) | 20,210,594 | 30,533,821 | $393,343,164 | $460,098,897 |
Institutional Class | | | | |
Shares sold | 181,090 | 23,006 | $3,601,810 | $351,524 |
Reinvestment of distributions | 290 | - | 5,166 | - |
Shares redeemed | (83,756) | (396) | (1,660,707) | (5,173) |
Net increase (decrease) | 97,624 | 22,610 | $1,946,269 | $346,351 |
AShare transactions for Class A, Class T, Class B, Class C and Institutional Class are for the period May 27, 2003 (commencement of sale of shares) to October 31, 2003.
Annual Report
Report of Independent Registered Public Accounting Firm
To the Trustees of Fidelity Investment Trust and Shareholders of Fidelity International Small Cap Fund:
We have audited the accompanying statement of assets and liabilities of Fidelity International Small Cap Fund (the Fund), a fund of Fidelity Investment Trust, including the portfolio of investments, as of October 31, 2004, and the related statement of operations for the year then ended, the statement of changes in net assets for each of the two years in the period then ended, and the financial highlights for each of the three years in the period then ended. These financial statements and financial highlights are the responsibility of the Fund's management. Our responsibility is to express an opinion on these financial statements and financial highlights based on our audits.
We conducted our audits in accordance with standards of the Public Company Accounting Oversight Board (United States). Those standards require that we plan and perform the audit to obtain reasonable assurance about whether the financial statements and financial highlights are free of material misstatement. An audit includes examining, on a test basis, evidence supporting the amounts and disclosures in the financial statements. Our procedures included confirmation of securities owned as of October 31, 2004, by correspondence with the custodian and brokers; where replies were not received from brokers, we performed other auditing procedures. An audit also includes assessing the accounting principles used and significant estimates made by management, as well as evaluating the overall financial statement presentation. We believe that our audits provide a reasonable basis for our opinion.
In our opinion, the financial statements and financial highlights referred to above present fairly, in all material respects, the financial position of Fidelity International Small Cap Fund as of October 31, 2004, the results of its operations for the year then ended, the changes in its net assets for each of the two years in the period then ended, and its financial highlights for each of the three years in the period then ended, in conformity with accounting principles generally accepted in the United States of America.
/s/DELOITTE & TOUCHE LLP
DELOITTE & TOUCHE LLP
Boston, Massachusetts
December 17, 2004
Annual Report
Trustees and Officers
The Trustees, Members of the Advisory Board, and executive officers of the trust and fund, as applicable, are listed below. The Board of Trustees governs the fund and is responsible for protecting the interests of shareholders. The Trustees are experienced executives who meet periodically throughout the year to oversee the fund's activities, review contractual arrangements with companies that provide services to the fund, and review the fund's performance. Except for William O. McCoy, each of the Trustees oversees 298 funds advised by FMR or an affiliate. Mr. McCoy oversees 300 funds advised by FMR or an affiliate.
The Trustees hold office without limit in time except that (a) any Trustee may resign; (b) any Trustee may be removed by written instrument, signed by at least two-thirds of the number of Trustees prior to such removal; (c) any Trustee who requests to be retired or who has become incapacitated by illness or injury may be retired by written instrument signed by a majority of the other Trustees; and (d) any Trustee may be removed at any special meeting of shareholders by a two-thirds vote of the outstanding voting securities of the trust. In any event, each non-interested Trustee shall retire not later than the last day of the calendar year in which his or her 72nd birthday occurs. The executive officers and Advisory Board Members hold office without limit in time, except that any officer and Advisory Board Member may resign or may be removed by a vote of a majority of the Trustees at any regular meeting or any special meeting of the Trustees. Except as indicated, each individual has held the office shown or other offices in the same company for the past five years.
The fund's Statement of Additional Information (SAI) includes more information about the Trustees. To request a free copy, call Fidelity at 1-800-544-8544.
Interested Trustees*:
Correspondence intended for each Trustee who is an "interested person" (as defined in the 1940 Act) may be sent to Fidelity Investments, 82 Devonshire Street, Boston, Massachusetts 02109.
Name, Age; Principal Occupation |
Edward C. Johnson 3d (74)** |
| Year of Election or Appointment: 1984 Mr. Johnson is Chairman of the Board of Trustees. Mr. Johnson serves as Chief Executive Officer, Chairman, and a Director of FMR Corp.; a Director and Chairman of the Board and of the Executive Committee of FMR; Chairman and a Director of Fidelity Management & Research (Far East) Inc.; Chairman (1998) and a Director of Fidelity Investments Money Management, Inc.; and Chairman (2001) and a Director (2000) of FMR Co., Inc. |
Abigail P. Johnson (42)** |
| Year of Election or Appointment: 2001 Senior Vice President of International Small Cap (2002). Ms. Johnson also serves as Senior Vice President of other Fidelity funds (2001). She is President and a Director of FMR (2001), Fidelity Investments Money Management, Inc. (2001), FMR Co., Inc. (2001), and a Director of FMR Corp. Previously, Ms. Johnson managed a number of Fidelity funds. |
Laura B. Cronin (50) |
| Year of Election or Appointment: 2003 Ms. Cronin is an Executive Vice President (2002) and Chief Financial Officer (2002) of FMR Corp. and is a member of the Fidelity Management Committee (2003). Previously, Ms. Cronin served as Vice President of Finance of FMR (1997-1999), and Chief Financial Officer of FMR (1999-2001), Fidelity Personal Investments (2001), and Fidelity Brokerage Company (2001-2002). |
Robert L. Reynolds (52) |
| Year of Election or Appointment: 2003 Mr. Reynolds is a Director (2003) and Chief Operating Officer (2002) of FMR Corp. and is the head of the Fidelity Management Committee (2003). He also serves on the Board at Fidelity Investments Canada, Ltd. (2000). Previously, Mr. Reynolds served as President of Fidelity Investments Institutional Retirement Group (1996-2000). |
*Trustees have been determined to be "Interested Trustees" by virtue of, among other things, their affiliation with the trust or various entities under common control with FMR.
**Edward C. Johnson 3d, Trustee, is Abigail P. Johnson's father.
Annual Report
Non-Interested Trustees:
Correspondence intended for each non-interested Trustee (that is, the Trustees other than the Interested Trustees) may be sent to Fidelity Investments, P.O. Box 55235, Boston, Massachusetts 02205-5235.
Name, Age; Principal Occupation |
J. Michael Cook (62) |
| Year of Election or Appointment: 2001 Prior to Mr. Cook's retirement in May 1999, he served as Chairman and Chief Executive Officer of Deloitte & Touche LLP (accounting/consulting), Chairman of the Deloitte & Touche Foundation, and a member of the Board of Deloitte Touche Tohmatsu. He currently serves as a Director of Comcast (telecommunications, 2002), International Flavors & Fragrances, Inc. (2000), The Dow Chemical Company (2000), and Northrop Grumman Corporation (global defense technology, 2003). He is a Member of the Diversity Advisory Council of Marakon (2003) and the Advisory Council of the Public Company Accounting Oversight Board (PCAOB), Chairman Emeritus of the Board of Catalyst (a leading organization for the advancement of women in business), and is Chairman of the Accountability Advisory Council to the Comptroller General of the United States. He also serves as a Member of the Advisory Board of the Graduate School of Business of the University of Florida, his alma mater. |
Ralph F. Cox (72) |
| Year of Election or Appointment: 1991 Mr. Cox is President of RABAR Enterprises (management consulting for the petroleum industry). Prior to February 1994, he was President of Greenhill Petroleum Corporation (petroleum exploration and production). Until March 1990, Mr. Cox was President and Chief Operating Officer of Union Pacific Resources Company (exploration and production). He is a Director of CH2M Hill Companies (engineering), and Abraxas Petroleum (petroleum exploration and production, 1999). In addition, he is a member of advisory boards of Texas A&M University and the University of Texas at Austin. |
Robert M. Gates (61) |
| Year of Election or Appointment: 1997 Dr. Gates is President of Texas A&M University (2002). He was Director of the Central Intelligence Agency (CIA) from 1991 to 1993. From 1989 to 1991, Dr. Gates served as Assistant to the President of the United States and Deputy National Security Advisor. Dr. Gates is a Director of NACCO Industries, Inc. (mining and manufacturing), Parker Drilling Co., Inc. (drilling and rental tools for the energy industry, 2001), and Brinker International (restaurant management, 2003). He also serves as a member of the Advisory Board of VoteHere.net (secure internet voting, 2001). Previously, Dr. Gates served as a Director of LucasVarity PLC (automotive components and diesel engines), a Director of TRW Inc. (automotive, space, defense, and information technology), and Dean of the George Bush School of Government and Public Service at Texas A&M University (1999-2001). Dr. Gates also is a Trustee of the Forum for International Policy. |
George H. Heilmeier (68) |
| Year of Election or Appointment: 2004 Dr. Heilmeier is Chairman Emeritus of Telcordia Technologies (communication software and systems), where prior to his retirement, he served as company Chairman and Chief Executive Officer. He currently serves on the Boards of Directors of The Mitre Corporation (systems engineering and information technology support for the government), INET Technologies Inc. (telecommunications network surveillance, 2001), Teletech Holdings (customer management services), and and HRL Laboratories (private research and development, 2004). He is Chairman of the General Motors Technology Advisory Committee and a Life Fellow of the Institute of Electrical and Electronics Engineers (IEEE) (2000). Dr. Heilmeier is a member of the Defense Science Board and the National Security Agency Advisory Board. He is also a member of the National Academy of Engineering, the American Academy of Arts and Sciences, and the Board of Overseers of the School of Engineering and Applied Science of the University of Pennsylvania. Previously, Dr. Heilmeier served as a Director of TRW Inc. (automotive, space, defense, and information technology, 1992-2002), Compaq (1994-2002), and Automatic Data Processing, Inc. (ADP) (technology-based business outsourcing, 1995-2002). |
Donald J. Kirk (71) |
| Year of Election or Appointment: 1987 Mr. Kirk is a Governor of the American Stock Exchange (2001), a Trustee and former Chairman of the Board of Trustees of the Greenwich Hospital Association, a Director of the Yale-New Haven Health Services Corp. (1998), and a Director Emeritus and former Chairman of the Board of Directors of National Arts Strategies Inc. (leadership education for arts and culture). Mr. Kirk was an Executive-in-Residence (1995-2000) and a Professor (1987-1995) at Columbia University Graduate School of Business. Prior to 1987, he was Chairman of the Financial Accounting Standards Board. Previously, Mr. Kirk served as a Governor of the National Association of Securities Dealers, Inc. (1996-2002), a member and Vice Chairman of the Public Oversight Board of the American Institute of Certified Public Accountants' SEC Practice Section (1995-2002), a Director of General Re Corporation (reinsurance, 1987-1998) and as a Director of Valuation Research Corp. (appraisals and valuations). |
Marie L. Knowles (58) |
| Year of Election or Appointment: 2001 Prior to Ms. Knowles' retirement in June 2000, she served as Executive Vice President and Chief Financial Officer of Atlantic Richfield Company (ARCO) (diversified energy, 1996-2000). From 1993 to 1996, she was a Senior Vice President of ARCO and President of ARCO Transportation Company. She served as a Director of ARCO from 1996 to 1998. She currently serves as a Director of Phelps Dodge Corporation (copper mining and manufacturing) and McKesson Corporation (healthcare service, 2002). Ms. Knowles is a Trustee of the Brookings Institution and the Catalina Island Conservancy and also serves as a member of the Advisory Board for the School of Engineering of the University of Southern California. |
Ned C. Lautenbach (60) |
| Year of Election or Appointment: 2000 Mr. Lautenbach has been a partner of Clayton, Dubilier & Rice, Inc. (private equity investment firm) since September 1998. Previously, Mr. Lautenbach was with the International Business Machines Corporation (IBM) from 1968 until his retirement in 1998. He was most recently Senior Vice President and Group Executive of Worldwide Sales and Services. From 1993 to 1995, he was Chairman of IBM World Trade Corporation, and from 1994 to 1998 was a member of IBM's Corporate Executive Committee. Mr. Lautenbach serves as Co-Chairman and a Director of Covansys, Inc. (global provider of business and technology solutions, 2000). In addition, he is a Director of Italtel Holding S.p.A. (telecommunications (Milan, Italy), 2004) and Eaton Corporation (diversified industrial) as well as the Philharmonic Center for the Arts in Naples, Florida (1999). He also is a member of the Council on Foreign Relations. |
Marvin L. Mann (71) |
| Year of Election or Appointment: 1993 Mr. Mann is Chairman of the non-interested Trustees (2001). He is Chairman Emeritus of Lexmark International, Inc. (computer peripherals), where he served as CEO until April 1998, retired as Chairman May 1999, and remains a member of the Board. Prior to 1991, he held the positions of Vice President of International Business Machines Corporation (IBM) and President and General Manager of various IBM divisions and subsidiaries. He is a member of the Executive Committee of the Independent Director's Council of the Investment Company Institute. In addition, Mr. Mann is a member of the President's Cabinet at the University of Alabama and the Board of Visitors of the Culverhouse College of Commerce and Business Administration at the University of Alabama. |
William O. McCoy (71) |
| Year of Election or Appointment: 1997 Prior to his retirement in December 1994, Mr. McCoy was Vice Chairman of the Board of BellSouth Corporation (telecommunications) and President of BellSouth Enterprises. He is currently a Director of Liberty Corporation (holding company), Duke Realty Corporation (real estate), and Progress Energy, Inc. (electric utility). He is also a partner of Franklin Street Partners (private investment management firm) and a member of the Research Triangle Foundation Board. In addition, Mr. McCoy served as the Interim Chancellor (1999-2000) and a member of the Board of Visitors (1994-1998) for the University of North Carolina at Chapel Hill and currently serves on the Board of Directors of the University of North Carolina Health Care System and the Board of Visitors of the Kenan-Flagler Business School (University of North Carolina at Chapel Hill). He also served as Vice President of Finance for the University of North Carolina (16-school system, 1995-1998). |
William S. Stavropoulos (64) |
| Year of Election or Appointment: 2001 Mr. Stavropoulos is Chairman of the Board (2000), CEO (2002), a position he previously held from 1995-2000, Chairman of the Executive Committee (2000), and a Member of the Board of Directors of The Dow Chemical Company. Since joining The Dow Chemical Company in 1967, Mr. Stavropoulos served in numerous senior management positions, including President (1993-2000; 2002-2003). Currently, he is a Director of NCR Corporation (data warehousing and technology solutions), BellSouth Corporation (telecommunications), Chemical Financial Corporation, and Maersk Inc. (industrial conglomerate, 2002). He also serves as a member of the Board of Trustees of the American Enterprise Institute for Public Policy Research. In addition, Mr. Stavropoulos is a member of The Business Council, J.P. Morgan International Council and the University of Notre Dame Advisory Council for the College of Science. |
Annual Report
Trustees and Officers - continued
Advisory Board Members and Executive Officers:
Correspondence intended for Mr. Dirks, Ms. Small, and Mr. Wolfe may be sent to Fidelity Investments, P.O. Box 55235, Boston, Massachusetts 02205-5235. Correspondence intended for each executive officer and Mr. Lynch may be sent to Fidelity Investments, 82 Devonshire Street, Boston, Massachusetts 02109.
Name, Age; Principal Occupation |
Dennis J. Dirks (56) |
| Year of Election or Appointment: 2004 Member of the Advisory Board of Fidelity Investment Trust. Prior to his retirement in May 2003, Mr. Dirks was Chief Operating Officer and a member of the Board of The Depository Trust & Clearing Corporation (DTCC) (1999-2003). He also served as President, Chief Operating Officer, and Board member of The Depository Trust Company (DTC) (1999-2003) and President and Board member of the National Securities Clearing Corporation (NSCC) (1999-2003). In addition, Mr. Dirks served as Chief Executive Officer and Board member of the Government Securities Clearing Corporation (2001-2003) and Chief Executive Officer and Board member of the Mortgage-Backed Securities Clearing Corporation (2001-2003). |
Peter S. Lynch (61) |
| Year of Election or Appointment: 2003 Member of the Advisory Board of Fidelity Investment Trust. Vice Chairman and a Director of FMR, and Vice Chairman (2001) and a Director (2000) of FMR Co., Inc. Previously, Mr. Lynch served as a Trustee of the Fidelity funds (1990-2003). Prior to May 31, 1990, he was a Director of FMR and Executive Vice President of FMR (a position he held until March 31, 1991), Vice President of Fidelity® Magellan® Fund and FMR Growth Group Leader, and Managing Director of FMR Corp. Mr. Lynch was also Vice President of Fidelity Investments Corporate Services. In addition, he serves as a Trustee of Boston College, Massachusetts Eye & Ear Infirmary, Historic Deerfield, John F. Kennedy Library, and the Museum of Fine Arts of Boston. |
Cornelia M. Small (60) |
| Year of Election or Appointment: 2004 Member of the Advisory Board of Fidelity Investment Trust. Ms. Small is a member (2000) and Chairperson (2002) of the Investment Committee, and a member (2002) of the Board of Trustees of Smith College. Previously, she served as Chief Investment Officer (1999-2000), Director of Global Equity Investments (1996-1999), and a member of the Board of Directors of Scudder, Stevens & Clark (1990-1997) and Scudder Kemper Investments (1997-1998). In addition, Ms. Small served as Co-Chair (2000-2003) of the Annual Fund for the Fletcher School of Law and Diplomacy. |
Kenneth L. Wolfe (65) |
| Year of Election or Appointment: 2004 Member of the Advisory Board of Fidelity Investment Trust. Prior to his retirement in 2001, Mr. Wolfe was Chairman and Chief Executive Officer of Hershey Foods Corporation (1993-2001). He currently serves as a member of the boards of Adelphia Communications Corporation (2003), Bausch & Lomb, Inc., and Revlon Inc. (2004). |
Philip L. Bullen (45) |
| Year of Election or Appointment: 2002 Vice President of International Small Cap. Mr. Bullen also serves as Vice President of certain Equity Funds (2001) and certain High Income Funds (2001). He is Senior Vice President of FMR (2001) and FMR Co., Inc. (2001), President and a Director of Fidelity Management & Research (Far East) Inc. (2001), President and a Director of Fidelity Management & Research (U.K.) Inc. (2002), and a Director of Strategic Advisers, Inc. (2002). Before joining Fidelity Investments, Mr. Bullen was President and Chief Investment Officer of Santander Global Advisors (1997-2000) and President and Chief Executive Officer of Boston's Baring Asset Management Inc. (1994-1997). |
Eric D. Roiter (55) |
| Year of Election or Appointment: 1998 Secretary of International Small Cap. He also serves as Secretary of other Fidelity funds (1998); Vice President, General Counsel, and Clerk of FMR Co., Inc. (2001) and FMR (1998); Vice President and Clerk of FDC (1998); Assistant Clerk of Fidelity Management & Research (U.K.) Inc. (2001) and Fidelity Management & Research (Far East) Inc. (2001); and Assistant Secretary of Fidelity Investments Money Management, Inc. (2001). Prior to joining Fidelity, Mr. Roiter was with the law firm of Debevoise & Plimpton, as an associate (1981-1984) and as a partner (1985-1997), and served as an Assistant General Counsel of the U.S. Securities and Exchange Commission (1979-1981). Mr. Roiter is an Adjunct Member, Faculty of Law, at Boston College Law School (2003). |
Stuart Fross (45) |
| Year of Election or Appointment: 2003 Assistant Secretary of International Small Cap. Mr. Fross also serves as Assistant Secretary of other Fidelity funds (2003) and is an employee of FMR. |
Christine Reynolds (46) |
| Year of Election or Appointment: 2004 President, Treasurer, and Anti-Money Laundering (AML) officer of International Small Cap. Ms. Reynolds also serves as President, Treasurer, and AML officer of other Fidelity funds (2004) and is a Vice President (2003) and an employee (2002) of FMR. Before joining Fidelity Investments, Ms. Reynolds worked at PricewaterhouseCoopers LLP (PwC) (1980-2002), where she was most recently an audit partner with PwC's investment management practice. |
Timothy F. Hayes (53) |
| Year of Election or Appointment: 2002 Chief Financial Officer of International Small Cap. Mr. Hayes also serves as Chief Financial Officer of other Fidelity funds (2002). Recently he was appointed President of Fidelity Service Company (2003) where he also serves as a Director. Mr. Hayes also serves as President of Fidelity Investments Operations Group (FIOG, 2002), which includes Fidelity Pricing and Cash Management Services Group (FPCMS), where he was appointed President in 1998. Previously, Mr. Hayes served as Chief Financial Officer of Fidelity Investments Corporate Systems and Service Group (1998) and Fidelity Systems Company (1997-1998). |
Kenneth A. Rathgeber (57) |
| Year of Election or Appointment: 2004 Chief Compliance Officer of International Small Cap. Mr. Rathgeber also serves as Chief Compliance Officer of other Fidelity funds (2004) and Executive Vice President of Risk Oversight for Fidelity Investments (2002). Previously, he served as Executive Vice President and Chief Operating Officer for Fidelity Investments Institutional Services Company, Inc. (1998-2002). |
John R. Hebble (46) |
| Year of Election or Appointment: 2003 Deputy Treasurer of International Small Cap. Mr. Hebble also serves as Deputy Treasurer of other Fidelity funds (2003), and is an employee of FMR. Before joining Fidelity Investments, Mr. Hebble worked at Deutsche Asset Management where he served as Director of Fund Accounting (2002-2003) and Assistant Treasurer of the Scudder Funds (1998-2003). |
Kimberley H. Monasterio (40) |
| Year of Election or Appointment: 2004 Deputy Treasurer of International Small Cap. Ms. Monasterio also serves as Deputy Treasurer of other Fidelity funds (2004) and is an employee of FMR (2004). Before joining Fidelity Investments, Ms. Monasterio served as Treasurer (2000-2004) and Chief Financial Officer (2002-2004) of the Franklin Templeton Funds and Senior Vice President of Franklin Templeton Services, LLC (2000-2004). |
John H. Costello (58) |
| Year of Election or Appointment: 1986 Assistant Treasurer of International Small Cap. Mr. Costello also serves as Assistant Treasurer of other Fidelity funds and is an employee of FMR. |
Francis V. Knox, Jr. (57) |
| Year of Election or Appointment: 2002 Assistant Treasurer of International Small Cap. Mr. Knox also serves as Assistant Treasurer of other Fidelity funds (2002), and is a Vice President and an employee of FMR. Previously, Mr. Knox served as Vice President of Investment & Advisor Compliance (1990-2001), and Compliance Officer of Fidelity Management & Research (U.K.) Inc. (1992-2002), Fidelity Management & Research (Far East) Inc. (1991-2002), and FMR Corp. (1995-2002). |
Peter L. Lydecker (50) |
| Year of Election or Appointment: 2004 Assistant Treasurer of International Small Cap. Mr. Lydecker also serves as Assistant Treasurer of other Fidelity funds (2004) and is an employee of FMR. |
Mark Osterheld (49) |
| Year of Election or Appointment: 2002 Assistant Treasurer of International Small Cap. Mr. Osterheld also serves as Assistant Treasurer of other Fidelity funds (2002) and is an employee of FMR. |
Kenneth B. Robins (35) |
| Year of Election or Appointment: 2004 Assistant Treasurer of International Small Cap. Mr. Robins also serves as Assistant Treasurer of other Fidelity funds (2004) and is an employee of FMR (2004). Before joining Fidelity Investments, Mr. Robins worked at KPMG LLP, where he was a partner in KPMG's department of professional practice (2002-2004) and a Senior Manager (1999-2000). In addition, Mr. Robins served as Assistant Chief Accountant, United States Securities and Exchange Commission (2000-2002). |
Thomas J. Simpson (46) |
| Year of Election or Appointment: 2000 Assistant Treasurer of International Small Cap. Mr. Simpson is Assistant Treasurer of other Fidelity funds (2000) and an employee of FMR (1996). Prior to joining FMR, Mr. Simpson was Vice President and Fund Controller of Liberty Investment Services (1987-1995). |
Annual Report
Distributions
The Board of Trustees of Fidelity International Small Cap Fund voted to pay to shareholders of record at the opening of business on record date, the following distributions per share derived from capital gains realized from sales of portfolio securities, and dividends derived from net investment income:
| Pay Date | Record Date | Dividends | Capital Gains |
International Small Cap | 12/13/04 | 12/10/04 | $.06 | $.77 |
International Small Cap designates 14% of the dividend distributed during the fiscal year as amounts which may be taken into account as a dividend for purposes of the maximum rate under section 1(h)(11) of the Internal Revenue Code.
The amounts per share which represent income derived from sources within, and taxes paid to, foreign countries or possessions of the United States are as follows:
| Income | Taxes |
International Small Cap | $.034 | $.004 |
The fund will notify shareholders in January 2005 of amounts for use in preparing 2004 income tax returns.
Annual Report
Proxy Voting Results
A special meeting of the fund's shareholders was held on October 14, 2004. The results of votes taken among shareholders on proposals before them are reported below. Each vote reported represents one dollar of net asset value held on the record date for the meeting.
PROPOSAL 1 |
To amend the Declaration of Trust to allow the Board of Trustees, if permitted by applicable law, to authorize fund mergers without shareholder approval. A |
| # of
Votes | % of
Votes |
Affirmative | 15,718,325,709.37 | 74.142 |
Against | 3,816,318,151.70 | 18.001 |
Abstain | 840,597,158.37 | 3.965 |
Broker
Non-Votes | 825,022,241.94 | 3.892 |
TOTAL | 21,200,263,261.38 | 100.000 |
PROPOSAL 2 |
To elect a Board of Trustees. A |
| # of
Votes | % of
Votes |
J. Michael Cook |
Affirmative | 20,046,954,592.62 | 94.560 |
Withheld | 1,153,308,668.76 | 5.440 |
TOTAL | 21,200,263,261.38 | 100.000 |
Ralph F. Cox |
Affirmative | 20,022,775,321.09 | 94.446 |
Withheld | 1,177,487,940.29 | 5.554 |
TOTAL | 21,200,263,261.38 | 100.000 |
Laura B. Cronin |
Affirmative | 20,020,502,157.24 | 94.435 |
Withheld | 1,179,761,104.14 | 5.565 |
TOTAL | 21,200,263,261.38 | 100.000 |
Dennis J. Dirks B |
Affirmative | 20,051,128,100.47 | 94.580 |
Withheld | 1,149,135,160.91 | 5.420 |
TOTAL | 21,200,263,261.38 | 100.000 |
| # of
Votes | % of
Votes |
Robert M. Gates |
Affirmative | 20,029,013,552.52 | 94.475 |
Withheld | 1,171,249,708.86 | 5.525 |
TOTAL | 21,200,263,261.38 | 100.000 |
George H. Heilmeier |
Affirmative | 20,064,274,525.78 | 94.642 |
Withheld | 1,135,988,735.60 | 5.358 |
TOTAL | 21,200,263,261.38 | 100.000 |
Abigail P. Johnson |
Affirmative | 19,965,491,863.72 | 94.176 |
Withheld | 1,234,771,397.66 | 5.824 |
TOTAL | 21,200,263,261.38 | 100.000 |
Edward C. Johnson 3d |
Affirmative | 19,910,643,140.70 | 93.917 |
Withheld | 1,289,620,120.68 | 6.083 |
TOTAL | 21,200,263,261.38 | 100.000 |
Donald J. Kirk |
Affirmative | 20,034,697,704.85 | 94.502 |
Withheld | 1,165,565,556.53 | 5.498 |
TOTAL | 21,200,263,261.38 | 100.000 |
Marie L. Knowles |
Affirmative | 20,071,617,016.84 | 94.676 |
Withheld | 1,128,646,244.54 | 5.324 |
TOTAL | 21,200,263,261.38 | 100.000 |
Ned C. Lautenbach |
Affirmative | 20,069,374,137.98 | 94.666 |
Withheld | 1,130,889,123.40 | 5.334 |
TOTAL | 21,200,263,261.38 | 100.000 |
Marvin L. Mann |
Affirmative | 20,034,126,102.77 | 94.499 |
Withheld | 1,166,137,158.61 | 5.501 |
TOTAL | 21,200,263,261.38 | 100.000 |
| # of
Votes | % of
Votes |
William O. McCoy |
Affirmative | 20,046,749,092.57 | 94.559 |
Withheld | 1,153,514,168.81 | 5.441 |
TOTAL | 21,200,263,261.38 | 100.000 |
Robert L. Reynolds |
Affirmative | 20,051,009,814.32 | 94.579 |
Withheld | 1,149,253,447.06 | 5.421 |
TOTAL | 21,200,263,261.38 | 100.000 |
Cornelia M. Small B |
Affirmative | 20,037,030,750.74 | 94.513 |
Withheld | 1,163,232,510.64 | 5.487 |
TOTAL | 21,200,263,261.38 | 100.000 |
William S. Stavropoulos |
Affirmative | 20,037,089,868.63 | 94.513 |
Withheld | 1,163,173,392.75 | 5.487 |
TOTAL | 21,200,263,261.38 | 100.000 |
ADenotes trust-wide proposals and voting results. BEffective January 1, 2005. |
Annual Report
Managing Your Investments
Fidelity offers several ways to conveniently manage your personal investments via your telephone or PC. You can access your account information, conduct trades and research your investments 24 hours a day.
By Phone
Fidelity Automated Service Telephone provides a single toll-free number to access account balances, positions, quotes and trading. It's easy to navigate the service, and on your first call, the system will help you create a personal identification number (PIN) for security.
(phone_graphic)Fidelity Automated
Service Telephone (FAST®)
1-800-544-5555
Press
1 For mutual fund and brokerage trading.
2 For quotes.*
3 For account balances and holdings.
4 To review orders and mutual
fund activity.
5 To change your PIN.
*0 To speak to a Fidelity representative.
By PC
Fidelity's web site on the Internet provides a wide range of information, including daily financial news, fund performance, interactive planning tools and news about Fidelity products and services.
(computer_graphic)Fidelity's Web Site
www.fidelity.com
* When you call the quotes line, please remember that a fund's yield and return will vary and, except for money market funds, share price will also vary. This means that you may have a gain or loss when you sell your shares. There is no assurance that money market funds will be able to maintain a stable $1 share price; an investment in a money market fund is not insured or guaranteed by the U.S. government. Total returns are historical and include changes in share price, reinvestment of dividends and capital gains, and the effects of any sales charges.
Annual Report
To Visit Fidelity
For directions and hours,
please call 1-800-544-9797.
Arizona
7001 West Ray Road
Chandler, AZ
7373 N. Scottsdale Road
Scottsdale, AZ
California
815 East Birch Street
Brea, CA
1411 Chapin Avenue
Burlingame, CA
851 East Hamilton Avenue
Campbell, CA
527 North Brand Boulevard
Glendale, CA
19200 Von Karman Avenue
Irvine, CA
601 Larkspur Landing Circle
Larkspur, CA
10100 Santa Monica Blvd.
Los Angeles, CA
27101 Puerta Real
Mission Viejo, CA
73-575 El Paseo
Palm Desert, CA
251 University Avenue
Palo Alto, CA
1760 Challenge Way
Sacramento, CA
7676 Hazard Center Drive
San Diego, CA
8 Montgomery Street
San Francisco, CA
21701 Hawthorne Boulevard
Torrance, CA
2001 North Main Street
Walnut Creek, CA
6300 Canoga Avenue
Woodland Hills, CA
Colorado
1625 Broadway
Denver, CO
9185 East Westview Road
Littleton, CO
Connecticut
48 West Putnam Avenue
Greenwich, CT
265 Church Street
New Haven, CT
300 Atlantic Street
Stamford, CT
29 South Main Street
West Hartford, CT
Delaware
222 Delaware Avenue
Wilmington, DE
Florida
4400 N. Federal Highway
Boca Raton, FL
121 Alhambra Plaza
Coral Gables, FL
2948 N. Federal Highway
Ft. Lauderdale, FL
1907 West State Road 434
Longwood, FL
8880 Tamiami Trail, North
Naples, FL
3501 PGA Boulevard
West Palm Beach, FL
8065 Beneva Road
Sarasota, FL
1502 N. Westshore Blvd.
Tampa, FL
Georgia
3445 Peachtree Road, N.E.
Atlanta, GA
1000 Abernathy Road
Atlanta, GA
Illinois
One North LaSalle Street
Chicago, IL
1415 West 22nd Street
Oak Brook, IL
1700 East Golf Road
Schaumburg, IL
3232 Lake Avenue
Wilmette, IL
Indiana
4729 East 82nd Street
Indianapolis, IN
Kansas
5400 College Boulevard
Overland Park, KS
Maine
Three Canal Plaza
Portland, ME
Maryland
7401 Wisconsin Avenue
Bethesda, MD
One W. Pennsylvania Ave.
Towson, MD
Massachusetts
801 Boylston Street
Boston, MA
155 Congress Street
Boston, MA
300 Granite Street
Braintree, MA
44 Mall Road
Burlington, MA
405 Cochituate Road
Framingham, MA
416 Belmont Street
Worcester, MA
Annual Report
Michigan
280 Old N. Woodward Ave.
Birmingham, MI
43420 Grand River Avenue
Novi, MI
29155 Northwestern Hwy.
Southfield, MI
Minnesota
7600 France Avenue South
Edina, MN
Missouri
8885 Ladue Road
Ladue, MO
New Jersey
150 Essex Street
Millburn, NJ
56 South Street
Morristown, NJ
501 Route 17, South
Paramus, NJ
3518 Route 1 North
Princeton, NJ
New York
1055 Franklin Avenue
Garden City, NY
37 West Jericho Turnpike
Huntington Station, NY
1271 Avenue of the Americas
New York, NY
61 Broadway
New York, NY
350 Park Avenue
New York, NY
North Carolina
4611 Sharon Road
Charlotte, NC
Ohio
3805 Edwards Road
Cincinnati, OH
28699 Chagrin Boulevard
Woodmere Village, OH
1324 Polaris Parkway
Columbus, OH
Oregon
16850 SW 72nd Avenue
Tigard, OR
Pennsylvania
600 West DeKalb Pike
King of Prussia, PA
1735 Market Street
Philadelphia, PA
12001 Perry Highway
Wexford, PA
Rhode Island
47 Providence Place
Providence, RI
Tennessee
6150 Poplar Avenue
Memphis, TN
Texas
10000 Research Boulevard
Austin, TX
4017 Northwest Parkway
Dallas, TX
12532 Memorial Drive
Houston, TX
2701 Drexel Drive
Houston, TX
400 East Las Colinas Blvd.
Irving, TX
14100 San Pedro
San Antonio, TX
19740 IH 45 North
Spring, TX
6005 West Park Boulevard
Plano, TX
Utah
215 South State Street
Salt Lake City, UT
Virginia
1861 International Drive
McLean, VA
Washington
411 108th Avenue, N.E.
Bellevue, WA
1518 6th Avenue
Seattle, WA
Washington, DC
1900 K Street, N.W.
Washington, DC
Wisconsin
595 North Barker Road
Brookfield, WI
Fidelity Brokerage Services, Inc., 100 Summer St., Boston, MA 02110 Member NYSE/SIPC
Annual Report
Investment Adviser
Fidelity Management & Research Company
Boston, MA
Investment Sub-Advisers
FMR Co., Inc.
Fidelity Management & Research
(U.K.) Inc.
Fidelity Management & Research
(Far East) Inc.
Fidelity International Investment
Advisors
Fidelity Investments Japan Limited
Fidelity International Investment
Advisors (U.K.) Limited
General Distributor
Fidelity Distributors Corporation
Boston, MA
Transfer and Shareholder
Servicing Agent
Fidelity Service Company, Inc.
Boston, MA
Custodian
Mellon Bank
Pittsburgh, PA
Fidelity's International Equity Funds
Aggressive International Fund
Canada Fund
China Region Fund
Diversified International Fund
Emerging Markets Fund
Europe Fund
Europe Capital Appreciation Fund
Global Balanced Fund
International Discovery Fund
International Small Cap Fund
Japan Fund
Japan Smaller Companies Fund
Latin America Fund
Nordic Fund
Overseas Fund
Pacific Basin Fund
Southeast Asia Fund
Worldwide Fund
Please carefully consider the funds' investment objectives, risks, charges and expenses before investing. For this and other information, call 1-800-544-6666 for a free prospectus. Read it carefully before you invest or send money.
The Fidelity Telephone Connection
Mutual Fund 24-Hour Service
Exchanges/Redemptions
and Account Assistance1-800-544-6666
Product Information1-800-544-8888
Retirement Accounts1-800-544-4774
(8 a.m. - 9 p.m.)
TDD Service1-800-544-0118
for the deaf and hearing impaired
(9 a.m. - 9 p.m. Eastern time)
Fidelity Automated Service
Telephone (FAST®) (automated graphic) 1-800-544-5555
(automated graphic) Automated line for quickest service
(Fidelity Investment logo)(registered trademark)
Corporate Headquarters
82 Devonshire St., Boston, MA 02109
www.fidelity.com
ISC-UANN-1204
1.793584.101
Fidelity's
Targeted International Equity
Funds®
Fidelity® Canada Fund
Fidelity China Region Fund
Fidelity Emerging Markets Fund
Fidelity Europe Fund
Fidelity Europe Capital Appreciation Fund
Fidelity Japan Fund
Fidelity Japan Smaller Companies Fund
Fidelity Latin America Fund
Fidelity Nordic Fund
Fidelity Pacific Basin Fund
Fidelity Southeast Asia Fund
Annual Report
October 31, 2004
(2_fidelity_logos) (Registered_Trademark)
Contents
Shareholder Expense Example | A-6 | An example of Shareholder Expenses |
Canada Fund | A-8 | Performance |
| A-9 | Management's Discussion |
| A-10 | Investment Changes |
| A-12 | Investments |
| A-17 | Financial Statements |
China Region Fund | A-20 | Performance |
| A-21 | Management's Discussion |
| A-22 | Investment Changes |
| A-24 | Investments |
| A-28 | Financial Statements |
Emerging Markets Fund | A-31 | Performance |
| A-32 | Management's Discussion |
| A-33 | Investment Changes |
| A-35 | Investments |
| A-41 | Financial Statements |
Europe Fund | A-44 | Performance |
| A-45 | Management's Discussion |
| A-46 | Investment Changes |
| A-48 | Investments |
| A-51 | Financial Statements |
Europe Capital Appreciation Fund | A-54 | Performance |
| A-55 | Management's Discussion |
| A-56 | Investment Changes |
| A-58 | Investments |
| A-63 | Financial Statements |
Japan Fund | A-66 | Performance |
| A-67 | Management's Discussion |
| A-68 | Investment Changes |
| A-70 | Investments |
| A-75 | Financial Statements |
Japan Smaller Companies Fund | A-78 | Performance |
| A-79 | Management's Discussion |
| A-80 | Investment Changes |
| A-82 | Investments |
| A-90 | Financial Statements |
Latin America Fund | A-93 | Performance |
| A-94 | Management's Discussion |
| A-95 | Investment Changes |
| A-97 | Investments |
| A-100 | Financial Statements |
Nordic Fund | A-103 | Performance |
| A-104 | Management's Discussion |
| A-105 | Investment Changes |
| A-107 | Investments |
| A-110 | Financial Statements |
Pacific Basin Fund | A-113 | Performance |
| A-114 | Management's Discussion |
| A-115 | Investment Changes |
| A-117 | Investments |
| A-123 | Financial Statements |
Southeast Asia Fund | A-126 | Performance |
| A-127 | Management's Discussion |
| A-128 | Investment Changes |
| A-130 | Investments |
| A-135 | Financial Statements |
Notes to Financial Statements | A-138 | Notes to Financial Statements |
Reports of Independent Registered Public Accounting Firms | A-146 | |
Trustees and Officers | A-148 | |
Distributions | A-154 | |
Proxy Voting Results | A-155 | |
Prospectus | P-1 | |
To view a fund's proxy voting guidelines and proxy voting record for the 12-month period ended June 30, visit www.fidelity.com/proxyvotingresults or visit the Securities and Exchange Commission's (SEC) web site at www.sec.gov. You may also call 1-800-544-8544 to request a free copy of the proxy voting guidelines.
Standard & Poor's, S&P and S&P 500 are registered service marks of The McGraw-Hill Companies, Inc. and have been licensed for use by
Fidelity Distributors Corporation.
Other third party marks appearing herein are the property of their respective owners.
All other marks appearing herein are registered or unregistered trademarks or service marks of FMR Corp. or an affiliated company.
(Recycle graphic) This report is printed on recycled paper using soy-based inks.
This report and the financial statements contained herein are submitted for the general information of the shareholders of the funds. This report is not authorized for distribution to prospective investors in the funds unless preceded or accompanied by an effective prospectus.
Each fund files its complete schedule of portfolio holdings with the SEC for the first and third quarters of each fiscal year on Form N-Q. Forms N-Q are available on the SEC's website at http://www.sec.gov. Each fund's Forms N-Q may be reviewed and copied at the SEC's Public Reference Room in Washington, DC. Information regarding the operation of the SEC's Public Reference Room may be obtained by calling 1-800-SEC-0330. For a complete list of each fund's portfolio holdings, view each fund's most recent quarterly holdings report, semiannual report, or annual report on Fidelity's website at http://www.fidelity.com/holdings.
NOT FDIC INSURED ·MAY LOSE VALUE ·NO BANK GUARANTEE
Neither the funds nor Fidelity Distributors Corporation is a bank.
Annual Report
Shareholder Expense Example
As a shareholder of a Fund, you incur two types of costs: (1) transaction costs, including sales charges (loads) on redemptions of Canada, Europe, and Pacific Basin shares purchased prior to October 12, 1990, and redemption fees, and (2) ongoing costs, including management fees and other Fund expenses. This Example is intended to help you understand your ongoing costs (in dollars) of investing in the Funds and to compare these costs with the ongoing costs of investing in other mutual funds.
The Example is based on an investment of $1,000 invested at the beginning of the period and held for the entire period (May 1, 2004 to October 31, 2004).
Actual Expenses
The first line of the table below for each fund provides information about actual account values and actual expenses. You may use the information in this line, together with the amount you invested, to estimate the expenses that you paid over the period. Simply divide your account value by $1,000.00 (for example, an $8,600 account value divided by $1,000.00 = 8.6), then multiply the result by the number in the first line for a fund under the heading entitled "Expenses Paid During Period" to estimate the expenses you paid on your account during this period. A small balance maintenance fee of $12.00 that is charged once a year may apply for certain accounts with a value of less than $2,000. This fee is not included in the table below. If it were, the estimate of expenses you paid during the period would be higher, and your ending account value lower, by this amount.
Hypothetical Example for Comparison Purposes
The second line of the table below for each fund provides information about hypothetical account values and hypothetical expenses based on a fund's actual expense ratio and an assumed rate of return of 5% per year before expenses, which is not the Fund's actual return. The hypothetical account values and expenses may not be used to estimate the actual ending account balance or expenses you paid for the period. You may use this information to compare the ongoing costs of investing in the Fund and other funds. To do so, compare this 5% hypothetical example with the 5% hypothetical examples that appear in the shareholder reports of the other funds. A small balance maintenance fee of $12.00 that is charged once a year may apply for certain accounts with a value of less than $2,000. This fee is not included in the table below. If it was, the estimate of expenses you paid during the period would be higher, and your ending account value lower, by this amount.
Please note that the expenses shown in the table are meant to highlight your ongoing costs only and do not reflect any transaction costs. Therefore, the second line of the table is useful in comparing ongoing costs only, and will not help you determine the relative total costs of owning different funds. In addition, if these transactional costs were included, your costs would have been higher.
| Beginning
Account Value
May 1, 2004 | Ending
Account Value
October 31, 2004 | Expenses Paid
During Period*
May 1, 2004 to
October 31, 2004 |
Canada | | | |
Actual | $1,000.00 | $1,214.60 | $6.68 |
HypotheticalA | $1,000.00 | $1,018.89 | $6.11 |
China Region | | | |
Actual | $1,000.00 | $1,056,60 | $6.36 |
HypotheticalA | $1,000.00 | $1,018.74 | $6.26 |
Emerging Markets | | | |
Actual | $1,000.00 | $1,062.00 | $6.53 |
HypotheticalA | $1,000.00 | $1,018.59 | $6.41 |
Europe | | | |
Actual | $1,000.00 | $1,123.30 | $6.03 |
HypotheticalA | $1,000.00 | $1,019.25 | $5.75 |
Europe Capital Appreciation | | | |
Actual | $1,000.00 | $1,043.60 | $5.96 |
HypotheticalA | $1,000.00 | $1,019.10 | $5.90 |
Japan | | | |
Actual | $1,000.00 | $938.70 | $5.21 |
HypotheticalA | $1,000.00 | $1,019.55 | $5.45 |
Japan Smaller Companies | | | |
Actual | $1,000.00 | $933.90 | $5.06 |
HypotheticalA | $1,000.00 | $1,019.71 | $5.29 |
Latin America | | | |
Actual | $1,000.00 | $1,232.10 | $6.51 |
HypotheticalA | $1,000.00 | $1,019.10 | $5.90 |
Nordic | | | |
Actual | $1,000.00 | $1,119.00 | $6.87 |
HypotheticalA | $1,000.00 | $1,018.43 | $6.57 |
Pacific Basin | | | |
Actual | $1,000.00 | $977.60 | $5.97 |
HypotheticalA | $1,000.00 | $1,018.89 | $6.11 |
Southeast Asia | | | |
Actual | $1,000.00 | $1,019.20 | $6.04 |
HypotheticalA | $1,000.00 | $1,018.94 | $6.06 |
A5% return per year before expenses
*Expenses are equal to each Fund's annualized expense ratio (shown in the table below); multiplied by the average account value over the period, multiplied by 184/366 (to reflect the one-half year period).
Annual Report
Investments
| Annualized
Expense Ratio |
Canada | 1.20% |
China Region | 1.23% |
Emerging Markets | 1.26% |
Europe | 1.13% |
Europe Capital Appreciation | 1.16% |
Japan | 1.07% |
Japan Smaller Companies | 1.04% |
Latin America | 1.16% |
Nordic | 1.29% |
Pacific Basin | 1.20% |
Southeast Asia | 1.19% |
Annual Report
Canada
Performance: The Bottom Line
Average annual total return reflects the change in the value of an investment, assuming reinvestment of the fund's dividend income and capital gains (the profits earned upon the sale of securities that have grown in value) and assuming a constant rate of performance each year. The $10,000 table and the fund's returns do not reflect the deduction of taxes that a shareholder would pay on fund distributions or the redemption of fund shares. During periods of reimbursement by Fidelity, a fund's total returns will be greater than it would be had the reimbursement not occurred. How a fund did yesterday is no guarantee of how it will do tomorrow.
Average Annual Total Returns
Periods ended
October 31, 2004 | Past 1
year | Past 5
years | Past 10
years |
Fidelity® Canada Fund | 27.45% | 16.24% | 10.89% |
$10,000 Over 10 Years
Let's say hypothetically that $10,000 was invested in Fidelity® Canada Fund on October 31, 1994. The chart shows how the value of your investment would have grown, and also shows how the S&P/TSX Composite Index did over the same period.
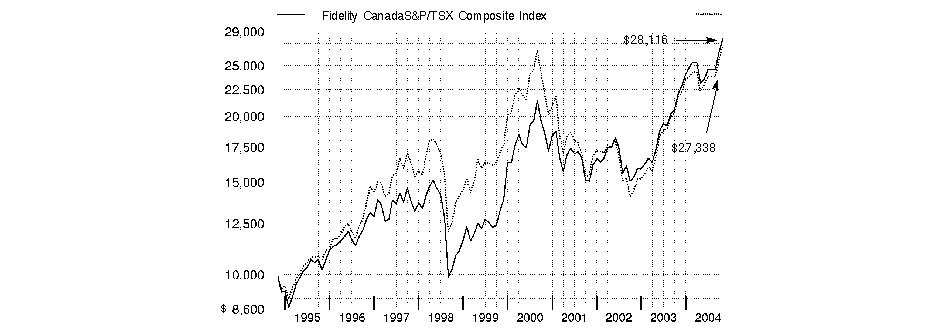
Annual Report
Canada
Management's Discussion of Fund Performance
Comments from Maxime Lemieux, Portfolio Manager of Fidelity® Canada Fund
Most of the world's major stock markets posted solid gains for the year ending October 31, 2004. The Morgan Stanley Capital InternationalSM Europe, Australasia, Far East (MSCI® EAFE®) Index - designed to represent the performance of developed stock markets outside the United States and Canada - gained 19.00%, compared to 9.42% for the Standard & Poor's 500SM Index. A weak U.S. dollar relative to most foreign currencies was partly responsible for the performance disparity. On a regional basis, Europe was one of the top performers. Many investors felt European stocks offered better valuations and brighter earnings prospects than U.S. equities. Latin American countries, many of which are exporters of oil and materials that received strong support from high commodity prices, also did well. Conversely, Japan significantly underperformed, as early optimism was eroded by disappointing economic indicators and concerns about the impact of China's economic slowdown on exports. Meanwhile, technology-focused Asian emerging markets suffered due to a deceleration in corporate capital spending.
For the 12-month period that ended October 31, 2004, Fidelity Canada Fund posted a total return of 27.45%, outperforming its benchmark, the S&P/TSX Composite Index, which returned 25.48%. Favorable stock picking in technology, transportation and banks - each of which I overweighted relative to the index - was the biggest big factor in beating the benchmark. Research In Motion, maker of the popular BlackBerry wireless communication device, was the top contributor compared to the index, with strong results also coming from tour operator Transat and several of Canada's large national banking companies. Performance was held back due to a relative underweighting in the energy sector, where many stock prices surged on record-high oil prices. Among the individual stocks that detracted were medical device maker Angiotech Pharmaceuticals and Open Text, a distributor of document management software.
Note to shareholders: Fidelity Canada Fund may invest up to 35% of its total assets in any industry that represents more than 20% of the Canadian market. As of October 31, 2004, the fund did not have more than 25% of its total assets invested in any one industry.
The views expressed in this statement reflect those of the portfolio manager only through the end of the period of the report as stated on the cover and do not necessarily represent the views of Fidelity or any other person in the Fidelity organization. Any such views are subject to change at any time based upon market or other conditions and Fidelity disclaims any responsibility to update such views. These views may not be relied on as investment advice and, because investment decisions for a Fidelity fund are based on numerous factors, may not be relied on as an indication of trading intent on behalf of any Fidelity fund.
Annual Report
Canada
Investment Changes
Geographic Diversification (% of fund's net assets) |
As of October 31, 2004 |
 | Canada | 96.1% | |
 | United States of America | 3.9% | |

Percentages are adjusted for the effect of futures contracts, if applicable. |
|
As of April 30, 2004 |
| Canada | 98.9% | |
| United States of America | 1.1% | |

Percentages are adjusted for the effect of futures contracts, if applicable. |
Asset Allocation |
| % of fund's
net assets | % of fund's net assets
6 months ago |
Stocks | 95.1 | 99.0 |
Short-Term Investments and Net Other Assets | 4.9 | 1.0 |
Top Ten Stocks as of October 31, 2004 |
| % of fund's
net assets | % of fund's net assets
6 months ago |
Canadian Imperial Bank of Commerce (Commercial Banks) | 4.9 | 5.3 |
Toronto-Dominion Bank (Commercial Banks) | 4.5 | 4.6 |
Bank of Montreal, Quebec (Commercial Banks) | 3.7 | 4.0 |
Canadian National Railway Co. (Road & Rail) | 3.5 | 2.2 |
EnCana Corp. (Oil & Gas) | 3.3 | 3.2 |
Manulife Financial Corp. (Insurance) | 3.2 | 1.6 |
Bank of Nova Scotia (Commercial Banks) | 2.8 | 2.9 |
Alcan, Inc. (Metals & Mining) | 2.5 | 3.2 |
Sun Life Financial, Inc. (Insurance) | 2.5 | 2.6 |
Talisman Energy, Inc. (Oil & Gas) | 2.4 | 2.3 |
| 33.3 | |
Market Sectors as of October 31, 2004 |
| % of fund's
net assets | % of fund's net assets
6 months ago |
Financials | 31.9 | 33.0 |
Energy | 16.3 | 15.4 |
Materials | 12.4 | 11.9 |
Industrials | 8.1 | 7.8 |
Information Technology | 7.7 | 10.7 |
Consumer Discretionary | 6.2 | 7.7 |
Consumer Staples | 6.1 | 4.0 |
Telecommunication Services | 4.3 | 4.8 |
Health Care | 1.4 | 1.6 |
Utilities | 0.7 | 2.1 |
Annual Report
Canada
Investments October 31, 2004
Showing Percentage of Net Assets
Common Stocks - 95.1% |
| Shares | | Value (Note 1) |
CONSUMER DISCRETIONARY - 6.2% |
Media - 4.9% |
Alliance Atlantis Communications, Inc. Class B (non-vtg.) (a) | 135,000 | | $3,103,831 |
Astral Media, Inc. Class A (non-vtg.) | 120,000 | | 2,778,667 |
Chum Ltd. Class B (non-vtg.) | 57,100 | | 1,312,337 |
Corus Entertainment, Inc. Class B | 85,700 | | 1,650,878 |
Quebecor, Inc. Class B (sub. vtg.) | 66,000 | | 1,403,621 |
Rogers Communications, Inc. Class B (non-vtg.) | 235,000 | | 5,431,909 |
Thomson Corp. | 65,000 | | 2,256,600 |
Yellow Pages Income Fund | 210,000 | | 2,181,303 |
| | 20,119,146 |
Multiline Retail - 0.4% |
Canadian Tire Corp. Ltd. Class A (non-vtg.) | 40,000 | | 1,716,139 |
Specialty Retail - 0.9% |
RONA, Inc. (a) | 140,000 | | 3,908,527 |
TOTAL CONSUMER DISCRETIONARY | | 25,743,812 |
CONSUMER STAPLES - 6.1% |
Beverages - 0.7% |
Molson, Inc. Class A | 102,000 | | 2,625,693 |
Food & Staples Retailing - 5.4% |
Alimentation Couche-Tard, Inc. Class B (sub. vtg.) (a) | 217,000 | | 5,006,938 |
Jean Coutu Group, Inc.: | | | |
Class A (e) | 105,500 | | 1,399,043 |
Class A (sub. vtg.) | 234,500 | | 3,109,722 |
Loblaw Companies Ltd. | 120,000 | | 6,513,117 |
Shoppers Drug Mart Corp. (a) | 208,900 | | 6,355,253 |
| | 22,384,073 |
TOTAL CONSUMER STAPLES | | 25,009,766 |
ENERGY - 16.3% |
Energy Equipment & Services - 3.1% |
CCS Income Trust | 100,000 | | 3,119,432 |
CHC Helicopter Corp. Class A (sub. vtg.) | 101,000 | | 3,790,869 |
Pason Systems, Inc. | 75,000 | | 1,879,542 |
Precision Drilling Corp. (a) | 47,000 | | 2,909,882 |
Savanna Energy Services Corp. (a) | 105,000 | | 1,283,779 |
Savanna Energy Services Corp. (a)(e) | 3,800 | | 46,461 |
| | 13,029,965 |
Oil & Gas - 13.2% |
Canadian Natural Resources Ltd. | 158,000 | | 6,652,905 |
EnCana Corp. | 272,116 | | 13,495,756 |
First Calgary Petroleum Ltd. (a) | 200,000 | | 2,749,107 |
Imperial Oil Ltd. | 30,000 | | 1,746,521 |
Penn West Petroleum Ltd. | 95,000 | | 5,772,468 |
|
| Shares | | Value (Note 1) |
Petro-Canada | 110,000 | | $6,004,680 |
PetroKazakhstan, Inc. (e) | 7,000 | | 258,653 |
PetroKazakhstan, Inc. Class A | 66,000 | | 2,438,724 |
Quicksilver Resources, Inc. (a) | 37,000 | | 1,170,310 |
Talisman Energy, Inc. | 375,000 | | 10,068,974 |
Thunder Energy, Inc. (a) | 125,000 | | 754,403 |
TransCanada Corp. | 146,000 | | 3,312,378 |
| | 54,424,879 |
TOTAL ENERGY | | 67,454,844 |
FINANCIALS - 31.9% |
Capital Markets - 0.4% |
GMP Capital Corp. | 125,000 | | 1,837,254 |
Commercial Banks - 20.5% |
Bank of Montreal, Quebec | 325,000 | | 15,358,008 |
Bank of Nova Scotia | 348,000 | | 11,315,679 |
Canadian Imperial Bank of Commerce | 335,900 | | 20,382,652 |
National Bank of Canada | 230,000 | | 9,212,465 |
Royal Bank of Canada | 190,000 | | 9,891,202 |
Toronto-Dominion Bank | 465,000 | | 18,701,564 |
| | 84,861,570 |
Diversified Financial Services - 3.9% |
Brascan Corp. Class A (ltd. vtg.) | 153,900 | | 5,481,941 |
Power Corp. of Canada (sub. vtg.) | 330,000 | | 7,944,821 |
TSX Group, Inc. | 59,400 | | 2,494,815 |
| | 15,921,577 |
Insurance - 6.7% |
Great-West Lifeco, Inc. | 97,000 | | 2,023,870 |
Industrial Alliance Life Insurance Co. | 54,000 | | 2,172,681 |
Manulife Financial Corp. | 283,000 | | 13,217,588 |
Sun Life Financial, Inc. | 336,501 | | 10,350,476 |
| | 27,764,615 |
Thrifts & Mortgage Finance - 0.4% |
Home Capital Group, Inc. | 70,000 | | 1,537,546 |
TOTAL FINANCIALS | | 131,922,562 |
HEALTH CARE - 1.4% |
Biotechnology - 1.4% |
Angiotech Pharmaceuticals, Inc. (a) | 220,000 | | 4,030,217 |
QLT, Inc. (a)(d) | 110,000 | | 1,824,527 |
| | 5,854,744 |
INDUSTRIALS - 8.1% |
Aerospace & Defense - 0.4% |
Bombardier, Inc. Class B (sub. vtg.) | 386,800 | | 889,305 |
CAE, Inc. | 200,000 | | 819,477 |
| | 1,708,782 |
Common Stocks - continued |
| Shares | | Value (Note 1) |
INDUSTRIALS - continued |
Airlines - 1.2% |
Transat A.T., Inc. (a) | 190,000 | | $3,510,285 |
WestJet Airlines Ltd. (a) | 142,500 | | 1,322,207 |
| | 4,832,492 |
Commercial Services & Supplies - 0.6% |
MacDonald Dettwiler & Associates Ltd. (a) | 45,000 | | 947,777 |
Quebecor World, Inc. (sub. vtg.) | 65,000 | | 1,360,471 |
| | 2,308,248 |
Construction & Engineering - 0.8% |
SNC-Lavalin Group, Inc. | 80,000 | | 3,472,349 |
Road & Rail - 4.2% |
Canadian National Railway Co. | 265,150 | | 14,280,239 |
Mullen Transportation, Inc. | 27,000 | | 953,319 |
TransForce Income Fund | 175,000 | | 2,054,851 |
| | 17,288,409 |
Trading Companies & Distributors - 0.9% |
Finning International, Inc. | 57,000 | | 1,539,845 |
Russel Metals, Inc. | 165,000 | | 1,769,430 |
Russel Metals, Inc. (e) | 25,000 | | 326,500 |
| | 3,635,775 |
TOTAL INDUSTRIALS | | 33,246,055 |
INFORMATION TECHNOLOGY - 7.7% |
Communications Equipment - 3.7% |
Mitec Telecom, Inc. (a) | 300,100 | | 327,736 |
Mitec Telecom, Inc. (a)(e) | 50,000 | | 66,500 |
Nortel Networks Corp. (a) | 1,450,000 | | 4,915,500 |
Research in Motion Ltd. (a) | 114,000 | | 10,048,774 |
| | 15,358,510 |
Electronic Equipment & Instruments - 0.7% |
Celestica, Inc. (sub. vtg.) (a) | 125,100 | | 1,817,152 |
Dalsa Corp. (a) | 55,000 | | 795,747 |
Dalsa Corp. (a)(e) | 12,400 | | 179,405 |
| | 2,792,304 |
Internet Software & Services - 0.3% |
Open Text Corp. (a) | 65,600 | | 1,105,318 |
IT Services - 1.1% |
Affiliated Computer Services, Inc. Class A (a) | 17,000 | | 927,350 |
CGI Group, Inc. Class A (sub. vtg.) (a) | 530,000 | | 3,481,545 |
| | 4,408,895 |
Semiconductors & Semiconductor Equipment - 0.7% |
ATI Technologies, Inc. (a) | 85,000 | | 1,535,493 |
Tundra Semiconductor Corp. Ltd. (a) | 81,000 | | 1,193,866 |
Tundra Semiconductor Corp. Ltd. (a)(e) | 4,300 | | 63,378 |
| | 2,792,737 |
Software - 1.2% |
Cognos, Inc. (a) | 69,600 | | 2,763,197 |
|
| Shares | | Value (Note 1) |
NAVTEQ Corp. | 27,800 | | $1,120,618 |
Workbrain Corp. | 101,100 | | 1,286,735 |
| | 5,170,550 |
TOTAL INFORMATION TECHNOLOGY | | 31,628,314 |
MATERIALS - 12.4% |
Chemicals - 1.0% |
Potash Corp. of Saskatchewan | 61,000 | | 4,089,707 |
Metals & Mining - 10.7% |
Aber Diamond Corp. (a) | 37,000 | | 1,288,779 |
Alcan, Inc. | 224,000 | | 10,364,495 |
Cameco Corp. | 49,000 | | 3,974,398 |
Eldorado Gold Corp. (a)(f) | 956,000 | | 3,061,461 |
Falconbridge Ltd. | 108,900 | | 2,740,719 |
Gabriel Resources Ltd. (a) | 630,000 | | 796,650 |
Gabriel Resources Ltd. (a)(e) | 60,000 | | 75,871 |
Gerdau AmeriSteel Corp. (a) | 230,000 | | 1,112,370 |
Inco Ltd. (a) | 61,300 | | 2,167,911 |
Inmet Mining Corp. (a) | 140,000 | | 2,166,934 |
Meridian Gold, Inc. (a) | 95,000 | | 1,609,270 |
Placer Dome, Inc. | 317,300 | | 6,820,966 |
Teck Cominco Ltd. Class B (sub. vtg.) | 95,000 | | 2,273,104 |
Wheaton River Minerals Ltd. (a) | 1,750,000 | | 5,733,465 |
| | 44,186,393 |
Paper & Forest Products - 0.7% |
Canfor Corp. (a) | 135,000 | | 1,621,751 |
Cascades, Inc. | 135,000 | | 1,502,032 |
| | 3,123,783 |
TOTAL MATERIALS | | 51,399,883 |
TELECOMMUNICATION SERVICES - 4.3% |
Diversified Telecommunication Services - 3.9% |
BCE, Inc. | 419,200 | | 9,737,790 |
TELUS Corp. (non-vtg.) | 275,000 | | 6,254,875 |
| | 15,992,665 |
Wireless Telecommunication Services - 0.4% |
Rogers Wireless Communications, Inc. Class B (a) | 17,500 | | 635,136 |
Telesystem International Wireless, Inc. (a) | 115,000 | | 1,255,902 |
| | 1,891,038 |
TOTAL TELECOMMUNICATION SERVICES | | 17,883,703 |
UTILITIES - 0.7% |
Electric Utilities - 0.7% |
Fortis, Inc. | 57,000 | | 3,007,144 |
TOTAL COMMON STOCKS (Cost $296,243,813) | 393,150,827 |
Government Obligations - 1.8% |
| Principal Amount | | Value
(Note 1) |
Canadian Government Treasury Bills 2.2784% to 2.3477% 11/4/04 to 11/18/04
(Cost $6,945,105) | CAD | 8,750,000 | | $7,178,591 |
Money Market Funds - 5.5% |
| Shares | | |
Fidelity Cash Central Fund, 1.79% (b) | 21,343,125 | | 21,343,125 |
Fidelity Securities Lending Cash Central Fund, 1.77% (b)(c) | 1,513,000 | | 1,513,000 |
TOTAL MONEY MARKET FUNDS (Cost $22,856,125) | 22,856,125 |
TOTAL INVESTMENT PORTFOLIO - 102.4% (Cost $326,045,043) | | 423,185,543 |
NET OTHER ASSETS - (2.4)% | | (9,867,009) |
NET ASSETS - 100% | $413,318,534 |
Currency Abbreviations |
CAD | - | Canadian dollar |
Legend |
(a)Non-income producing |
(b)Affiliated fund that is available only to investment companies and other accounts managed by Fidelity Investments. The rate quoted is the annualized seven-day yield of the fund at period end. A complete listing of the fund's holdings as of its most recent fiscal year end is available upon request. |
(c)Includes investment made with cash collateral received from securities on loan. |
(d)Security or a portion of the security is on loan at period end. |
(e)Security exempt from registration under Rule 144A of the Securities Act of 1933. These securities may be resold in transactions exempt from registration, normally to qualified institutional buyers. At the period end, the value of these securities amounted to $2,415,811 or 0.6% of net assets. |
(f)Security or a portion of the security purchased on a delayed delivery or when-issued basis. |
Income Tax Information |
At October 31, 2004, the fund had a capital loss carryforward of approximately $16,889,000 all of which will expire on October 31, 2009. |
See accompanying notes which are an integral part of the financial statements.
Annual Report
Canada
Financial Statements
Statement of Assets and Liabilities
| October 31, 2004 |
| | |
Assets | | |
Investment in securities, at value (including securities loaned of $1,481,850) (cost $326,045,043) - See accompanying schedule | | $423,185,543 |
Cash | | 90,826 |
Foreign currency held at value (cost $129,444) | | 129,444 |
Receivable for investments sold | | 1,724,011 |
Receivable for fund shares sold | | 3,785,252 |
Dividends receivable | | 467,939 |
Interest receivable | | 24,276 |
Other affiliated receivables | | 1,186 |
Other receivables | | 64,165 |
Total assets | | 429,472,642 |
| | |
Liabilities | | |
Payable for investments purchased
Regular delivery | $13,396,127 | |
Delayed delivery | 611,721 | |
Payable for fund shares redeemed | 222,901 | |
Accrued management fee | 244,875 | |
Other affiliated payables | 90,142 | |
Other payables and accrued expenses | 75,342 | |
Collateral on securities loaned, at value | 1,513,000 | |
Total liabilities | | 16,154,108 |
| | |
Net Assets | | $413,318,534 |
Net Assets consist of: | | |
Paid in capital | | $333,415,475 |
Undistributed net investment income | | 613,311 |
Accumulated undistributed net realized gain (loss) on investments and foreign currency transactions | | (17,846,192) |
Net unrealized appreciation (depreciation) on investments and assets and liabilities in foreign currencies | | 97,135,940 |
Net Assets, for 12,968,335 shares outstanding | | $413,318,534 |
Net Asset Value, offering price and redemption price per share ($413,318,534 ÷ 12,968,335 shares) | | $31.87 |
Statement of Operations
| Year ended October 31, 2004 |
| | |
Investment Income | | |
Dividends | | $4,482,848 |
Interest | | 113,711 |
Security lending | | 347,525 |
| | 4,944,084 |
Less foreign taxes withheld | | (672,964) |
Total income | | 4,271,120 |
| | |
Expenses | | |
Management fee
Basic fee | $2,078,886 | |
Performance adjustment | 235,571 | |
Transfer agent fees | 783,382 | |
Accounting and security lending fees | 147,896 | |
Non-interested trustees' compensation | 1,700 | |
Custodian fees and expenses | 96,216 | |
Registration fees | 40,461 | |
Audit | 52,752 | |
Legal | 538 | |
Miscellaneous | 24,271 | |
Total expenses before reductions | 3,461,673 | |
Expense reductions | (169,099) | 3,292,574 |
Net investment income (loss) | | 978,546 |
Realized and Unrealized Gain (Loss) Net realized gain (loss) on: | | |
Investment securities | 3,184,658 | |
Foreign currency transactions | 100,267 | |
Total net realized gain (loss) | | 3,284,925 |
Change in net unrealized appreciation (depreciation) on: Investment securities | 58,587,355 | |
Assets and liabilities in foreign currencies | (2,931) | |
Total change in net unrealized appreciation (depreciation) | | 58,584,424 |
Net gain (loss) | | 61,869,349 |
Net increase (decrease) in net assets resulting from operations | | $62,847,895 |
See accompanying notes which are an integral part of the financial statements.
Annual Report
Canada
Financial Statements - continued
Statement of Changes in Net Assets
| Year ended
October 31,
2004 | Year ended
October 31,
2003 |
Increase (Decrease) in Net Assets | | |
Operations | | |
Net investment income (loss) | $978,546 | $272,032 |
Net realized gain (loss) | 3,284,925 | 7,428,725 |
Change in net unrealized appreciation (depreciation) | 58,584,424 | 31,725,674 |
Net increase (decrease) in net assets resulting from operations | 62,847,895 | 39,426,431 |
Distributions to shareholders from net investment income | (959,083) | (173,335) |
Share transactions
Proceeds from sales of shares | 305,089,295 | 82,146,645 |
Reinvestment of distributions | 926,386 | 167,386 |
Cost of shares redeemed | (122,097,358) | (31,704,354) |
Net increase (decrease) in net assets resulting from share transactions | 183,918,323 | 50,609,677 |
Redemption fees | 306,230 | 91,826 |
Total increase (decrease) in net assets | 246,113,365 | 89,954,599 |
| | |
Net Assets | | |
Beginning of period | 167,205,169 | 77,250,570 |
End of period (including undistributed net investment income of $613,311 and undistributed net investment income of $125,080, respectively) | $413,318,534 | $167,205,169 |
Other Information Shares | | |
Sold | 10,724,172 | 3,767,421 |
Issued in reinvestment of distributions | 35,372 | 9,258 |
Redeemed | (4,444,814) | (1,533,580) |
Net increase (decrease) | 6,314,730 | 2,243,099 |
Financial Highlights
Years ended October 31, | 2004 | 2003 | 2002 | 2001 | 2000 |
Selected Per-Share Data | | | | | |
Net asset value, beginning of period | $25.13 | $17.52 | $17.23 | $22.27 | $15.91 |
Income from Investment Operations | | | | | |
Net investment income (loss) D | .10 | .05 | .02 | .02 | 1.98 E |
Net realized and unrealized gain (loss) | 6.74 | 7.58 | .28 | (4.04) | 4.32 |
Total from investment operations | 6.84 | 7.63 | .30 | (4.02) | 6.30 |
Distributions from net investment income | (.13) | (.04) | (.03) | (1.04) | (.03) |
Redemption fees added to paid in capital D | .03 | .02 | .02 | .02 | .09 |
Net asset value, end of period | $31.87 | $25.13 | $17.52 | $17.23 | $22.27 |
Total Return A, B, C | 27.45% | 43.75% | 1.85% | (18.87)% | 40.22% |
Ratios to Average Net Assets F | | | | | |
Expenses before expense reductions | 1.20% | 1.42% | 1.52% | 1.33% | 1.09% |
Expenses net of voluntary waivers, if any | 1.20% | 1.42% | 1.52% | 1.33% | 1.09% |
Expenses net of all reductions | 1.15% | 1.37% | 1.46% | 1.20% | 1.06% |
Net investment income (loss) | .34% | .26% | .12% | .11% | 9.00% |
Supplemental Data | | | | | |
Net assets, end of period (000 omitted) | $413,319 | $167,205 | $77,251 | $81,213 | $163,025 |
Portfolio turnover rate | 47% | 52% | 98% | 93% | 97% |
A Total returns would have been lower had certain expenses not been reduced during the periods shown. B Total returns do not include the effect of the former sales charges. C Total returns do not include the effect of the contingent deferred sales charge. D Calculated based on average shares outstanding during the period. E Investment income per share reflects a special dividend which amounted to $1.97 per share. F Expense ratios reflect operating expenses of the fund. Expenses before reductions do not reflect amounts reimbursed by the investment adviser or reductions from brokerage service arrangements or other expense offset arrangements and do not represent the amount paid by the fund during periods when reimbursements or reductions occur. Expenses net of any voluntary waivers reflect expenses after reimbursement by the investment adviser but prior to reductions from brokerage service arrangements or other expense offset arrangements. Expenses net of all reductions represent the net expenses paid by the fund. |
See accompanying notes which are an integral part of the financial statements.
Annual Report
China Region
Performance: The Bottom Line
Average annual total return reflects the change in the value of an investment, assuming reinvestment of the fund's dividend income and capital gains (the profits earned upon the sale of securities that have grown in value) and assuming a constant rate of performance each year. The $10,000 table and the fund's returns do not reflect the deduction of taxes that a shareholder would pay on fund distributions or the redemption of fund shares. During periods of reimbursement by Fidelity, a fund's total returns will be greater than it would be had the reimbursement not occurred. How a fund did yesterday is no guarantee of how it will do tomorrow.
Average Annual Total Returns
Periods ended
October 31, 2004 | Past 1
year | Past 5
years | Life of
fundA |
Fidelity China Region Fund | 6.71% | 4.25% | 6.99% |
A From November 1, 1995
$10,000 Over Life of Fund
Let's say hypothetically that $10,000 was invested in Fidelity China Region Fund on November 1, 1995, when the fund started. The chart shows how the value of your investment would have grown, and also shows how the Hang Seng Index did over the same period.
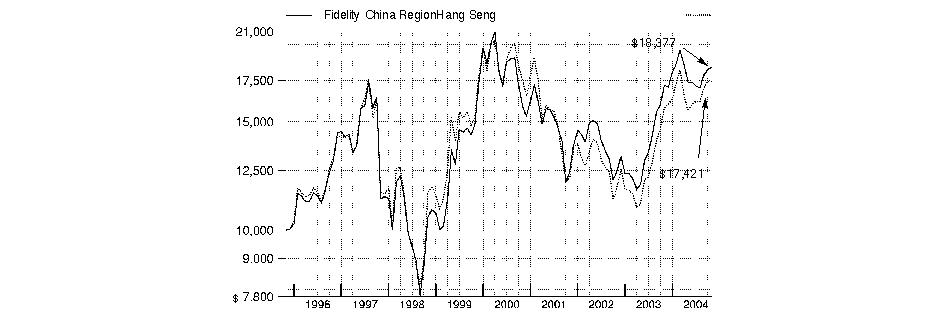
Annual Report
China Region
Management's Discussion of Fund Performance
Comments from Ignatius Lee, Portfolio Manager of Fidelity® China Region Fund
Most of the world's major stock markets posted solid gains for the year ending October 31, 2004. The Morgan Stanley Capital InternationalSM Europe, Australasia, Far East (MSCI® EAFE®) Index - designed to represent the performance of developed stock markets outside the United States and Canada - gained 19.00%, compared to 9.42% for the Standard & Poor's 500SM Index. A weak U.S. dollar relative to most foreign currencies was partly responsible for the performance disparity. On a regional basis, Europe was one of the top performers. Many investors felt European stocks offered better valuations and brighter earnings prospects than U.S. equities. Latin American countries, many of which are exporters of oil and materials that received strong support from high commodity prices, also did well. Conversely, Japan significantly underperformed, as early optimism was eroded by disappointing economic indicators and concerns about the impact of China's economic slowdown on exports. Meanwhile, technology-focused Asian emerging markets suffered due to a deceleration in corporate capital spending.
Fidelity China Region Fund posted solid relative returns, benefiting from successful stock selection in a number of industries. The fund gained 6.71% during the 12-month period, topping the Fidelity China Region Fund Linked Index - a measure of performance of the Hong Kong, Taiwanese and Chinese markets - which returned 6.41%, but underperforming the Hang Seng Index, which returned 10.29%. The fund also outperformed the 6.44% return for its peer group, the LipperSM China Region Funds Average. Fund holdings in the consumer discretionary and consumer staples sectors made strong contributions, including Hong Kong-based retailers Esprit Holdings and Giordano and Café de Coral, a Hong Kong restaurant operator. Information technology companies also contributed, including Kingboard Chemical Holdings in Hong Kong and High Tech Computer in Taiwan. The fund's underweighting in HSBC Holdings, which comprised over 36% of the China Region Fund Linked index at period end, detracted from relative performance, as did strong-performing real estate holding Swire Pacific, which was underweighted due to an uncertain long-term outlook.
Note to shareholders: Fidelity China Region Fund may invest up to 35% of its total assets in any industry that represents more than 20% of the Hong Kong, Taiwanese and Chinese market. As of October 31, 2004, the fund had more than 25% of its assets invested in the diversified banking industry, which accounted for approximately 30% of the Hong Kong, Taiwanese and Chinese market, as represented by the MSCI Golden Dragon Plus Index.
The views expressed in this statement reflect those of the portfolio manager only through the end of the period of the report as stated on the cover and do not necessarily represent the views of Fidelity or any other person in the Fidelity organization. Any such views are subject to change at any time based upon market or other conditions and Fidelity disclaims any responsibility to update such views. These views may not be relied on as investment advice and, because investment decisions for a Fidelity fund are based on numerous factors, may not be relied on as an indication of trading intent on behalf of any Fidelity fund.
Annual Report
China Region
Investment Changes
Geographic Diversification (% of fund's net assets) |
As of October 31, 2004 |
| Hong Kong | 50.4% | |
 | Taiwan | 20.6% | |
 | United Kingdom | 16.5% | |
 | China | 8.3% | |
 | United States of America | 1.9% | |
 | Korea (South) | 1.4% | |
 | Australia | 0.4% | |
 | Singapore | 0.3% | |
 | Bermuda | 0.2% | |
| Other | 0.0% | |

Percentages are adjusted for the effect of futures contracts, if applicable. |
|
As of April 30, 2004 |
| Hong Kong | 48.6% | |
| Taiwan | 24.9% | |
| United Kingdom | 12.0% | |
| China | 7.5% | |
| Korea (South) | 3.8% | |
| United States of America | 1.4% | |
| Bermuda | 0.7% | |
| Singapore | 0.6% | |
| Australia | 0.5% | |

Percentages are adjusted for the effect of futures contracts, if applicable. |
Asset Allocation |
| % of fund's
net assets | % of fund's net assets
6 months ago |
Stocks | 98.1 | 98.9 |
Short-Term Investments and
Net Other Assets | 1.9 | 1.1 |
Top Ten Stocks as of October 31, 2004 |
| % of fund's
net assets | % of fund's net assets
6 months ago |
HSBC Holdings PLC (Hong Kong) (Reg.) (Commercial Banks) | 12.9 | 10.6 |
Hang Seng Bank Ltd.
(Commercial Banks) | 4.4 | 0.9 |
Hutchison Whampoa Ltd. (Industrial Conglomerates) | 4.1 | 3.6 |
Hong Kong & China Gas Co. Ltd. (Gas Utilities) | 4.0 | 3.5 |
Cheung Kong Holdings Ltd.
(Real Estate) | 3.7 | 3.8 |
Standard Chartered PLC (Commercial Banks) | 3.6 | 1.4 |
Sun Hung Kai Properties Ltd.
(Real Estate) | 3.4 | 3.1 |
Esprit Holdings Ltd. (Specialty Retail) | 3.2 | 2.4 |
Chinatrust Financial Holding Co. (Commercial Banks) | 2.7 | 1.6 |
Dairy Farm International Holdings Ltd. (Food & Staples Retailing) | 2.3 | 1.6 |
| 44.3 | |
Market Sectors as of October 31, 2004 |
| % of fund's
net assets | % of fund's net assets
6 months ago |
Financials | 49.5 | 37.8 |
Consumer Discretionary | 10.1 | 14.3 |
Information Technology | 7.6 | 18.7 |
Telecommunication Services | 7.6 | 5.3 |
Industrials | 6.9 | 7.1 |
Utilities | 6.6 | 6.1 |
Energy | 3.7 | 3.1 |
Materials | 3.3 | 2.2 |
Consumer Staples | 2.8 | 3.7 |
Health Care | 0.0 | 0.6 |
Annual Report
China Region
Investments October 31, 2004
Showing Percentage of Net Assets
Common Stocks - 98.1% |
| Shares | | Value (Note 1) |
CONSUMER DISCRETIONARY - 10.1% |
Auto Components - 0.8% |
Tong Yang Industry Co. Ltd. | 1,866,736 | | $2,327,490 |
Automobiles - 1.4% |
Hyundai Motor Co. | 87,560 | | 4,246,993 |
Hotels, Restaurants & Leisure - 2.2% |
Cafe de Coral Holdings Ltd. | 4,552,000 | | 4,912,420 |
Hong Kong & Shanghai Hotels Ltd. | 2,138,500 | | 1,620,971 |
| | 6,533,391 |
Household Durables - 1.7% |
Grand Hall Enterprise Co. Ltd. | 178,250 | | 586,261 |
Merry Electronics Co. Ltd. | 1,704,988 | | 3,848,904 |
Skyworth Digital Holdings Ltd. | 1,674,275 | | 575,393 |
| | 5,010,558 |
Specialty Retail - 3.2% |
Esprit Holdings Ltd. | 1,746,000 | | 9,331,500 |
Textiles Apparel & Luxury Goods - 0.8% |
Li Ning Co. Ltd. | 2,552,000 | | 1,008,184 |
Yue Yuen Industrial Holdings Ltd. | 565,500 | | 1,420,343 |
| | 2,428,527 |
TOTAL CONSUMER DISCRETIONARY | | 29,878,459 |
CONSUMER STAPLES - 2.8% |
Food & Staples Retailing - 2.8% |
Convenience Retail Asia Ltd. | 2,306,200 | | 777,750 |
Dairy Farm International Holdings Ltd. | 2,883,600 | | 6,920,640 |
Wumart Stores, Inc. (H Shares) | 326,000 | | 557,036 |
| | 8,255,426 |
ENERGY - 3.7% |
Oil & Gas - 3.7% |
China Petroleum & Chemical Corp. (H Shares) | 9,628,000 | | 3,694,263 |
CNOOC Ltd. | 8,272,500 | | 4,285,155 |
PetroChina Co. Ltd. (H Shares) | 5,042,000 | | 2,653,100 |
Sinopec Zhenhai Refining & Chemical Co. Ltd. (H Shares) | 388,000 | | 371,366 |
Thai Oil PCL (a) | 61,900 | | 62,186 |
| | 11,066,070 |
FINANCIALS - 49.5% |
Commercial Banks - 30.0% |
BOC Hong Kong Holdings Ltd. | 607,000 | | 1,103,466 |
Chinatrust Financial Holding Co. | 7,075,332 | | 8,060,103 |
Dah Sing Banking Group Ltd. | 1,034,080 | | 2,085,776 |
Hang Seng Bank Ltd. | 977,900 | | 13,003,154 |
HSBC Holdings PLC (Hong Kong) (Reg.) | 2,364,852 | | 38,324,794 |
Mega Financial Holding Co. Ltd. | 4,313,000 | | 2,875,763 |
Standard Chartered PLC | 592,671 | | 10,602,601 |
Taishin Financial Holdings Co. Ltd. | 5,658,713 | | 4,619,012 |
|
| Shares | | Value (Note 1) |
Wing Hang Bank Ltd. | 718,000 | | $4,911,996 |
Wing Lung Bank Ltd. | 436,300 | | 3,363,182 |
| | 88,949,847 |
Diversified Financial Services - 3.7% |
First Pacific Co. Ltd. (a) | 15,504,000 | | 4,232,691 |
Fubon Financial Holding Co. Ltd. | 2,855,000 | | 2,688,967 |
Guoco Group Ltd. | 86,366 | | 715,676 |
Jardine Matheson Holdings Ltd. | 215,600 | | 3,190,880 |
| | 10,828,214 |
Insurance - 3.3% |
AXA Asia Pacific Holdings Ltd. | 399,750 | | 1,143,375 |
Cathay Financial Holding Co. Ltd. | 2,373,000 | | 4,540,948 |
China Life Insurance Co. Ltd. (H Shares) | 6,294,000 | | 4,164,356 |
| | 9,848,679 |
Real Estate - 12.5% |
Cheung Kong Holdings Ltd. | 1,328,000 | | 11,004,535 |
Fortune Real Estate Investment Trust | 923,000 | | 717,416 |
Henderson China Holdings Ltd. | 314,000 | | 151,278 |
Henderson Land Development Co. Ltd. | 879,000 | | 4,076,712 |
Hong Kong Land Holdings Ltd. | 775,000 | | 1,596,500 |
Shun Tak Holdings Ltd. | 2,041,000 | | 1,265,186 |
Sun Hung Kai Properties Ltd. | 1,100,021 | | 10,175,304 |
Swire Pacific Ltd. (A Shares) | 557,500 | | 3,939,322 |
Wharf Holdings Ltd. | 1,238,685 | | 4,073,941 |
| | 37,000,194 |
TOTAL FINANCIALS | | 146,626,934 |
INDUSTRIALS - 6.9% |
Electrical Equipment - 1.2% |
Johnson Electric Holdings Ltd. | 3,676,500 | | 3,660,582 |
Industrial Conglomerates - 4.1% |
Hutchison Whampoa Ltd. | 1,577,500 | | 12,109,360 |
Machinery - 0.5% |
Jenn Feng Industrial Co. Ltd. | 1,062,000 | | 1,387,633 |
Trading Companies & Distributors - 0.2% |
Dickson Concepts International Ltd. | 556,600 | | 464,805 |
Transportation Infrastructure - 0.9% |
Cosco Pacific Ltd. | 1,584,000 | | 2,737,104 |
TOTAL INDUSTRIALS | | 20,359,484 |
INFORMATION TECHNOLOGY - 7.6% |
Communications Equipment - 0.1% |
Comba Telecom Systems Holdings Ltd. | 860,000 | | 392,230 |
Computers & Peripherals - 3.8% |
ASUSTeK Computer, Inc. | 2,938,100 | | 6,500,804 |
High Tech Computer Corp. | 433,200 | | 1,800,413 |
Quanta Computer, Inc. | 559,329 | | 903,088 |
Solomon Systech Ltd. | 8,516,000 | | 2,155,340 |
| | 11,359,645 |
Common Stocks - continued |
| Shares | | Value (Note 1) |
INFORMATION TECHNOLOGY - continued |
Electronic Equipment & Instruments - 3.0% |
AU Optronics Corp. | 245,150 | | $260,946 |
Hon Hai Precision Industries Co. Ltd. | 1,406,655 | | 5,173,227 |
Kingboard Chemical Holdings Ltd. | 1,198,000 | | 2,508,755 |
Kingboard Chemical Holdings Ltd. warrants 12/31/06 (a) | 119,800 | | 55,408 |
Varitronix International Ltd. | 773,374 | | 740,218 |
| | 8,738,554 |
Semiconductors & Semiconductor Equipment - 0.7% |
Sunplus Technology Co. Ltd. | 214,500 | | 293,739 |
Taiwan Semiconductor Manufacturing Co. Ltd. | 1,281,797 | | 1,678,658 |
| | 1,972,397 |
TOTAL INFORMATION TECHNOLOGY | | 22,462,826 |
MATERIALS - 3.3% |
Chemicals - 1.5% |
Formosa Chemicals & Fibre Corp. | 907,000 | | 1,532,232 |
Formosa Plastics Corp. | 1,042,260 | | 1,604,915 |
Sinopec Shanghai Petrochemical Co. Ltd. (H Shares) | 3,404,000 | | 1,191,708 |
| | 4,328,855 |
Metals & Mining - 1.8% |
China Steel Corp. | 2,674,945 | | 2,687,342 |
Yanzhou Coal Mining Co. Ltd. (H Shares) (a) | 1,976,000 | | 2,602,104 |
| | 5,289,446 |
TOTAL MATERIALS | | 9,618,301 |
TELECOMMUNICATION SERVICES - 7.6% |
Diversified Telecommunication Services - 4.2% |
China Telecom Corp. Ltd. (H Shares) | 20,498,000 | | 6,567,559 |
PCCW Ltd. (a) | 9,569,400 | | 5,808,987 |
| | 12,376,546 |
Wireless Telecommunication Services - 3.4% |
China Mobile (Hong Kong) Ltd. | 988,500 | | 2,876,535 |
Far EasTone Telecommunications Co. Ltd. | 5,342,685 | | 5,702,911 |
Taiwan Cellular Co. Ltd. | 1,482,000 | | 1,480,006 |
| | 10,059,452 |
TOTAL TELECOMMUNICATION SERVICES | | 22,435,998 |
UTILITIES - 6.6% |
Electric Utilities - 2.6% |
Cheung Kong Infrastructure Holdings Ltd. | 1,136,000 | | 3,028,380 |
CLP Holdings Ltd. | 559,000 | | 3,210,209 |
Huaneng Power International, Inc. (H Shares) | 1,974,000 | | 1,481,980 |
| | 7,720,569 |
|
| Shares | | Value (Note 1) |
Gas Utilities - 4.0% |
Hong Kong & China Gas Co. Ltd. | 6,141,400 | | $11,835,117 |
TOTAL UTILITIES | | 19,555,686 |
TOTAL COMMON STOCKS (Cost $258,992,492) | 290,259,184 |
Money Market Funds - 1.6% |
| | | |
Fidelity Cash Central Fund, 1.79% (b)
(Cost $4,755,301) | 4,755,301 | | 4,755,301 |
TOTAL INVESTMENT PORTFOLIO - 99.7% (Cost $263,747,793) | | 295,014,485 |
NET OTHER ASSETS - 0.3% | | 989,423 |
NET ASSETS - 100% | $296,003,908 |
Legend |
(a)Non-income producing |
(b)Affiliated fund that is available only to investment companies and other accounts managed by Fidelity Investments. The rate quoted is the annualized seven-day yield of the fund at period end. A complete listing of the fund's holdings as of its most recent fiscal year end is available upon request. |
Income Tax Information |
At October 31, 2004, the fund had a capital loss carryforward of approximately $21,990,000 of which $12,624,000, $1,350,000 and $8,016,000 will expire on October 31, 2006, 2009 and 2010, respectively. |
See accompanying notes which are an integral part of the financial statements.
Annual Report
China Region
Financial Statements
Statement of Assets and Liabilities
| October 31, 2004 |
| | |
Assets | | |
Investment in securities, at value (cost $263,747,793) - See accompanying schedule | | $295,014,485 |
Foreign currency held at value (cost $1,794,083) | | 1,814,948 |
Receivable for fund shares sold | | 159,084 |
Dividends receivable | | 10,560 |
Interest receivable | | 7,124 |
Other affiliated receivables | | 875 |
Total assets | | 297,007,076 |
| | |
Liabilities | | |
Payable for fund shares redeemed | $637,769 | |
Accrued management fee | 179,953 | |
Transfer agent fee payable | 70,232 | |
Other affiliated payables | 12,553 | |
Other payables and accrued expenses | 102,661 | |
Total liabilities | | 1,003,168 |
| | |
Net Assets | | $296,003,908 |
Net Assets consist of: | | |
Paid in capital | | $282,638,712 |
Undistributed net investment income | | 4,701,276 |
Accumulated undistributed net realized gain (loss) on investments and foreign currency transactions | | (22,623,658) |
Net unrealized appreciation (depreciation) on investments and assets and liabilities in foreign currencies | | 31,287,578 |
Net Assets, for 18,645,006 shares outstanding | | $296,003,908 |
Net Asset Value, offering price and redemption price per share ($296,003,908 ÷ 18,645,006 shares) | | $15.88 |
Statement of Operations
| Year ended October 31, 2004 |
| | |
Investment Income | | |
Dividends | | $9,087,596 |
Interest | | 107,025 |
| | 9,194,621 |
Less foreign taxes withheld | | (560,547) |
Total income | | 8,634,074 |
| | |
Expenses | | |
Management fee | $2,192,317 | |
Transfer agent fees | 850,925 | |
Accounting fees and expenses | 155,269 | |
Non-interested trustees' compensation | 1,683 | |
Custodian fees and expenses | 366,371 | |
Registration fees | 47,931 | |
Audit | 52,136 | |
Legal | 1,031 | |
Interest | 716 | |
Miscellaneous | 23,456 | |
Total expenses before reductions | 3,691,835 | |
Expense reductions | (13,511) | 3,678,324 |
Net investment income (loss) | | 4,955,750 |
Realized and Unrealized Gain (Loss) Net realized gain (loss) on: | | |
Investment securities | 27,967,256 | |
Foreign currency transactions | (37,551) | |
Total net realized gain (loss) | | 27,929,705 |
Change in net unrealized appreciation (depreciation) on: Investment securities | (21,899,465) | |
Assets and liabilities in foreign currencies | 19,072 | |
Total change in net unrealized appreciation (depreciation) | | (21,880,393) |
Net gain (loss) | | 6,049,312 |
Net increase (decrease) in net assets resulting from operations | | $11,005,062 |
See accompanying notes which are an integral part of the financial statements.
Annual Report
China Region
Financial Statements - continued
Statement of Changes in Net Assets
| Year ended
October 31,
2004 | Year ended
October 31,
2003 |
Increase (Decrease) in Net Assets | | |
Operations | | |
Net investment income (loss) | $4,955,750 | $2,741,918 |
Net realized gain (loss) | 27,929,705 | 824,221 |
Change in net unrealized appreciation (depreciation) | (21,880,393) | 45,576,957 |
Net increase (decrease) in net assets resulting from operations | 11,005,062 | 49,143,096 |
Distributions to shareholders from net investment income | (4,174,789) | (1,902,675) |
Share transactions
Proceeds from sales of shares | 206,037,339 | 103,420,624 |
Reinvestment of distributions | 3,973,983 | 1,835,453 |
Cost of shares redeemed | (152,913,710) | (31,350,519) |
Net increase (decrease) in net assets resulting from share transactions | 57,097,612 | 73,905,558 |
Redemption fees | 421,910 | 148,688 |
Total increase (decrease) in net assets | 64,349,795 | 121,294,667 |
| | |
Net Assets | | |
Beginning of period | 231,654,113 | 110,359,446 |
End of period (including undistributed net investment income of $4,701,276 and undistributed net investment income of $2,516,769, respectively) | $296,003,908 | $231,654,113 |
Other Information Shares | | |
Sold | 12,991,397 | 7,827,883 |
Issued in reinvestment of distributions | 266,174 | 160,162 |
Redeemed | (9,912,893) | (2,578,985) |
Net increase (decrease) | 3,344,678 | 5,409,060 |
Financial Highlights
Years ended October 31, | 2004 | 2003 | 2002 | 2001 | 2000 |
Selected Per-Share Data | | | | | |
Net asset value, beginning of period | $15.14 | $11.16 | $11.27 | $14.96 | $14.15 |
Income from Investment Operations | | | | | |
Net investment income (loss) C | .25 | .25 | .19 | .14 | .10 |
Net realized and unrealized gain (loss) | .73 | 3.91 | (.15) | (3.29) | .80 |
Total from investment operations | .98 | 4.16 | .04 | (3.15) | .90 |
Distributions from net investment income | (.26) | (.19) | (.16) | (.56) | (.17) |
Redemption fees added to paid in capital C | .02 | .01 | .01 | .02 | .08 |
Net asset value, end of period | $15.88 | $15.14 | $11.16 | $11.27 | $14.96 |
Total Return A, B | 6.71% | 37.91% | .23% | (21.82)% | 6.77% |
Ratios to Average Net Assets D | | | | | |
Expenses before expense reductions | 1.22% | 1.30% | 1.32% | 1.32% | 1.22% |
Expenses net of voluntary waivers, if any | 1.22% | 1.30% | 1.32% | 1.32% | 1.22% |
Expenses net of all reductions | 1.22% | 1.30% | 1.31% | 1.30% | 1.21% |
Net investment income (loss) | 1.64% | 2.07% | 1.52% | 1.03% | .55% |
Supplemental Data | | | | | |
Net assets, end of period (000 omitted) | $296,004 | $231,654 | $110,359 | $116,754 | $179,709 |
Portfolio turnover rate | 101% | 39% | 53% | 75% | 103% |
A Total returns would have been lower had certain expenses not been reduced during the periods shown. B Total returns do not include the effect of the former sales charges. C Calculated based on average shares outstanding during the period. D Expense ratios reflect operating expenses of the fund. Expenses before reductions do not reflect amounts reimbursed by the investment adviser or reductions from brokerage service arrangements or other expense offset arrangements and do not represent the amount paid by the fund during periods when reimbursements or reductions occur. Expenses net of any voluntary waivers reflect expenses after reimbursement by the investment adviser but prior to reductions from brokerage service arrangements or other expense offset arrangements. Expenses net of all reductions represent the net expenses paid by the fund. |
See accompanying notes which are an integral part of the financial statements.
Annual Report
Emerging Markets
Performance: The Bottom Line
Average annual total return reflects the change in the value of an investment, assuming reinvestment of the fund's dividend income and capital gains (the profits earned upon the sale of securities that have grown in value) and assuming a constant rate of performance each year. The $10,000 table and the fund's returns do not reflect the deduction of taxes that a shareholder would pay on fund distributions or the redemption of fund shares. During periods of reimbursement by Fidelity, a fund's total returns will be greater than it would be had the reimbursement not occurred. How a fund did yesterday is no guarantee of how it will do tomorrow.
Average Annual Total Returns
Periods ended
October 31, 2004 | Past 1
year | Past 5
years | Past 10
years |
Fidelity Emerging Markets Fund | 16.48% | 4.39% | -4.37% |
$10,000 Over 10 Years
Let's say hypothetically that $10,000 was invested in Fidelity Emerging Markets Fund on October 31, 1994. The chart shows how the value of your investment would have changed, and also shows how the MSCI Emerging Markets Index performed over the same period.
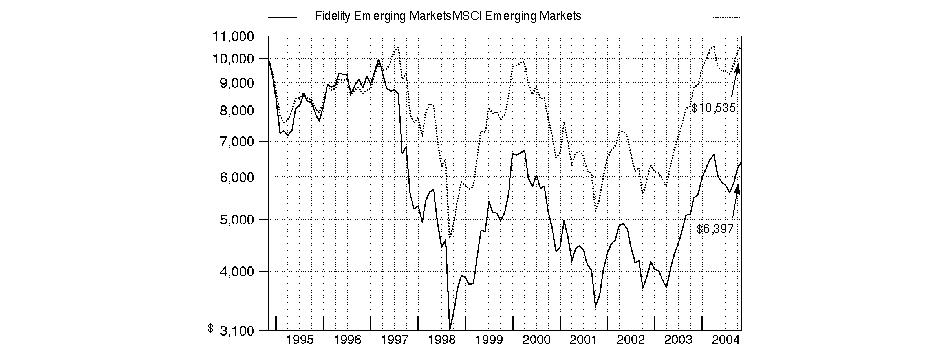
Annual Report
Emerging Markets
Management's Discussion of Fund Performance
Comments from Bob von Rekowsky, Portfolio Manager of Fidelity® Emerging Markets Fund
Most of the world's major stock markets posted solid gains for the year ending October 31, 2004. The Morgan Stanley Capital InternationalSM Europe, Australasia, Far East (MSCI® EAFE®) Index - designed to represent the performance of developed stock markets outside the United States and Canada - gained 19.00%, compared to 9.42% for the Standard & Poor's 500SM Index. A weak U.S. dollar relative to most foreign currencies was partly responsible for the performance disparity. On a regional basis, Europe was one of the top performers. Latin American countries, many of which are exporters of oil and materials that received strong support from high commodity prices, also did well. Conversely, Japan significantly underperformed, as early optimism was eroded by disappointing economic indicators and concerns about the impact of China's economic slowdown on exports. Meanwhile, technology-focused Asian emerging markets suffered due to a deceleration in corporate capital spending.
Fidelity Emerging Markets Fund returned 16.48% during the 12-month period. This result lagged the fund's benchmark, the Morgan Stanley Capital International Emerging Markets Index, which returned 19.40%, and the LipperSM Emerging Markets Funds Average, which returned 19.50%. Unfavorable security selection in South Korea and an overweighted position there were significant detractors from performance. The country remained in a prolonged recession, so we focused largely on exporters. In that group, an overweighted position in Korea's largest company, Samsung Electronics, detracted. The market became concerned the company's exceptional earnings growth in 2004 could not be topped in 2005. A position in South Korean oil refiner Honam Petrochemical also hurt as investors speculated that profit margins could weaken if Chinese demand waned. The fund no longer held this position at period end. In Brazil, security selection and an overweighted position made the country a top contributor to performance. Top-performing holdings included two steel producers, Gerdau and Usiminas. With favorable valuations and positive earnings outlooks, our analysis concluded that these companies could rely on a domestic recovery in Brazil to generate revenue growth should China's demand for steel waver.
The views expressed in this statement reflect those of the portfolio manager only through the end of the period of the report as stated on the cover and do not necessarily represent the views of Fidelity or any other person in the Fidelity organization. Any such views are subject to change at any time based upon market or other conditions and Fidelity disclaims any responsibility to update such views. These views may not be relied on as investment advice and, because investment decisions for a Fidelity fund are based on numerous factors, may not be relied on as an indication of trading intent on behalf of any Fidelity fund.
Annual Report
Emerging Markets
Investment Changes
Geographic Diversification (% of fund's net assets) |
As of October 31, 2004 |
| Korea (South) | 19.9% | |
| Brazil | 10.2% | |
| South Africa | 10.0% | |
| Taiwan | 8.3% | |
| Mexico | 7.8% | |
| Russia | 6.3% | |
| United States of America | 4.7% | |
| Indonesia | 3.5% | |
| Turkey | 3.5% | |
| Other | 25.8% | |

Percentages are adjusted for the effect of futures contracts, if applicable. |
|
As of April 30, 2004 |
| Korea (South) | 23.9% | |
| Taiwan | 10.0% | |
| Brazil | 9.0% | |
| Mexico | 7.4% | |
| Russia | 7.2% | |
| India | 6.9% | |
| Indonesia | 4.1% | |
| United States of America | 3.9% | |
| United Kingdom | 3.9% | |
| Other | 23.7% | |

Percentages are adjusted for the effect of futures contracts, if applicable. |
Asset Allocation |
| % of fund's
net assets | % of fund's net assets
6 months ago |
Stocks | 96.7 | 97.2 |
Short-Term Investments and Net Other Assets | 3.3 | 2.8 |
Top Ten Stocks as of October 31, 2004 |
| % of fund's
net assets | % of fund's net assets
6 months ago |
Samsung Electronics Co. Ltd. (Korea (South), Semiconductors & Semiconductor Equipment) | 6.9 | 8.7 |
America Movil SA de CV sponsored ADR (Mexico, Wireless Telecommunication Services) | 3.0 | 2.8 |
Anglo American PLC (South Africa) (United Kingdom, Metals & Mining) | 2.7 | 3.9 |
Lukoil Oil Co. sponsored ADR (Russia, Oil & Gas) | 2.0 | 1.3 |
LG Electronics, Inc. (Korea (South), Household Durables) | 2.0 | 1.4 |
Petroleo Brasileiro SA Petrobras sponsored ADR (non-vtg.) (Brazil, Oil & Gas) | 1.8 | 1.1 |
Companhia Vale do Rio Doce sponsored ADR (non-vtg.) (Brazil, Metals & Mining) | 1.7 | 1.6 |
MTN Group Ltd. (South Africa, Wireless Telecommunication Services) | 1.5 | 1.0 |
Hyundai Motor Co. (Korea (South), Automobiles) | 1.4 | 0.0 |
Cemex SA de CV sponsored ADR (Mexico, Construction Materials) | 1.3 | 1.6 |
| 24.3 | |
Market Sectors as of October 31, 2004 |
| % of fund's
net assets | % of fund's net assets
6 months ago |
Financials | 17.2 | 21.0 |
Materials | 16.2 | 15.6 |
Information Technology | 14.7 | 19.9 |
Telecommunication Services | 14.3 | 14.3 |
Consumer Discretionary | 11.2 | 7.3 |
Energy | 11.1 | 9.1 |
Consumer Staples | 5.4 | 3.4 |
Industrials | 3.8 | 2.3 |
Utilities | 1.8 | 1.7 |
Health Care | 1.0 | 2.6 |
Annual Report
Emerging Markets
Investments October 31, 2004
Showing Percentage of Net Assets
Common Stocks - 96.2% |
| Shares | | Value (Note 1) |
Argentina - 0.2% |
Inversiones y Representaciones SA sponsored GDR (a) | 102,700 | | $976,677 |
Austria - 0.9% |
Bank Austria Creditanstalt AG | 70,018 | | 5,197,814 |
Bermuda - 1.3% |
Central European Media Enterprises Ltd. Class A (a) | 169,700 | | 6,005,683 |
Skyworth Digital Holdings Ltd. | 5,986,000 | | 2,057,190 |
TOTAL BERMUDA | | 8,062,873 |
Brazil - 10.2% |
Banco Bradesco SA (PN) | 102,500 | | 6,191,047 |
Banco Itau Holding Financeira SA (PN) | 50,510 | | 6,103,420 |
Caemi Mineracao E Metalurgia SA (PN) (a) | 4,896,000 | | 2,928,097 |
Centrais Electricas Brasileiras (Electrobras) SA (PN-B) | 285,012,900 | | 4,225,478 |
Companhia Vale do Rio Doce sponsored: | | | |
ADR | 14,100 | | 298,356 |
ADR (non-vtg.) | 577,100 | | 10,503,220 |
Gerdau SA sponsored ADR | 210,440 | | 3,106,094 |
Natura Cosmeticos SA | 137,000 | | 2,779,050 |
Petroleo Brasileiro SA Petrobras: | | | |
(PN) | 165,300 | | 5,399,675 |
sponsored: | | | |
ADR | 35,400 | | 1,257,054 |
ADR (non-vtg.) | 324,600 | | 10,581,960 |
Usinas Siderurgicas de Minas Gerais SA (Usiminas) (PN-A) | 238,100 | | 3,601,583 |
Votorantim Celulose e Papel SA sponsored ADR | 140,400 | | 4,850,820 |
TOTAL BRAZIL | | 61,825,854 |
Canada - 0.4% |
PetroKazakhstan, Inc. Class A | 58,800 | | 2,172,681 |
China - 0.5% |
China Telecom Corp. Ltd. (H Shares) | 9,213,200 | | 2,951,909 |
Czech Republic - 1.0% |
Ceske Energeticke Zavody AS | 331,800 | | 3,693,484 |
Philip Morris CR AS | 4,122 | | 2,427,416 |
TOTAL CZECH REPUBLIC | | 6,120,900 |
Egypt - 1.5% |
Orascom Construction Industries SAE unit | 112,634 | | 2,661,541 |
Orascom Telecom SAE unit (a) | 371,398 | | 6,350,906 |
TOTAL EGYPT | | 9,012,447 |
Hong Kong - 1.5% |
China Overseas Land & Investment Ltd. | 19,348,500 | | 4,225,812 |
Henderson Land Development Co. Ltd. | 357,000 | | 1,655,729 |
Sun Hung Kai Properties Ltd. | 177,000 | | 1,637,268 |
Television Broadcasts Ltd. | 395,000 | | 1,689,878 |
TOTAL HONG KONG | | 9,208,687 |
|
| Shares | | Value (Note 1) |
Hungary - 1.7% |
BorsodChem Rt | 185,200 | | $1,851,662 |
MOL Magyar Olay-es Gazipari RT Series A (For. Reg.) | 83,600 | | 4,692,936 |
OTP Bank Rt. | 149,200 | | 3,783,706 |
TOTAL HUNGARY | | 10,328,304 |
India - 3.2% |
Bank of India | 1,873,600 | | 2,103,590 |
ICICI Bank Ltd. | 427,572 | | 2,820,457 |
ITC Ltd. | 100 | | 2,399 |
Larsen & Toubro Ltd. | 139,081 | | 2,547,083 |
National Thermal Power Corp. | 52,500 | | 71,799 |
Oil & Natural Gas Corp. Ltd. | 249,418 | | 4,343,565 |
State Bank of India | 316,715 | | 3,313,090 |
Wipro Ltd. | 291,014 | | 4,220,618 |
TOTAL INDIA | | 19,422,601 |
Indonesia - 3.5% |
PT Astra International Tbk | 2,063,700 | | 1,782,669 |
PT Bank Central Asia Tbk | 8,418,600 | | 2,223,339 |
PT Bumi Resources Tbk | 31,816,600 | | 2,538,320 |
PT Hanjaya Mandala Sampoerna Tbk | 3,821,000 | | 2,522,800 |
PT Indosat Tbk | 9,488,500 | | 4,933,486 |
PT Telkomunikasi Indonesia Tbk Series B | 15,206,800 | | 7,279,166 |
TOTAL INDONESIA | | 21,279,780 |
Israel - 3.2% |
Bank Hapoalim BM (Reg.) | 1,306,545 | | 3,547,592 |
ECtel Ltd. (a) | 122,700 | | 278,529 |
M-Systems Flash Disk Pioneers Ltd. (a)(d) | 375,200 | | 5,275,312 |
Nice Systems Ltd. sponsored ADR (a) | 54,000 | | 1,142,640 |
RADWARE Ltd. (a) | 128,800 | | 3,181,360 |
Teva Pharmaceutical Industries Ltd. sponsored ADR | 224,100 | | 5,826,600 |
TOTAL ISRAEL | | 19,252,033 |
Korea (South) - 19.4% |
AmorePacific Corp. | 11,420 | | 2,234,015 |
Asiana Airlines, Inc. (a) | 786,600 | | 1,960,352 |
CJ Home Shopping | 30,700 | | 1,261,456 |
Daegu Bank Co. Ltd. | 380,110 | | 2,274,888 |
Daelim Industrial Co. | 133,420 | | 5,720,554 |
Daewoo Shipbuilding & Marine Engineering Co. Ltd. | 375,110 | | 5,528,643 |
Hyundai Department Store Co. Ltd. | 76,000 | | 2,206,342 |
Hyundai Motor Co. | 174,690 | | 8,473,129 |
Hyundai Securities Co. Ltd. (a) | 603,780 | | 2,103,387 |
Industrial Bank of Korea | 378,750 | | 2,395,311 |
Interflex Co. Ltd. | 123,872 | | 1,941,897 |
Kia Motors Corp. | 511,190 | | 4,794,547 |
LG Electronics, Inc. | 210,440 | | 11,880,133 |
LG Petrochemical Co. Ltd. | 170,530 | | 4,143,293 |
NCsoft Corp. (a) | 26,400 | | 2,523,270 |
POSCO | 31,770 | | 4,753,439 |
Common Stocks - continued |
| Shares | | Value (Note 1) |
Korea (South) - continued |
S-Oil Corp. | 55,080 | | $2,779,831 |
Samsung Electronics Co. Ltd. | 105,645 | | 41,474,743 |
Samsung SDI Co. Ltd. | 20,300 | | 1,831,443 |
Shinhan Financial Group Co. Ltd. | 186,930 | | 3,681,828 |
Shinsegae Co. Ltd. | 11,000 | | 3,095,132 |
TOTAL KOREA (SOUTH) | | 117,057,633 |
Luxembourg - 0.8% |
Millicom International Cellular SA (a) | 62,700 | | 1,245,849 |
Tenaris SA sponsored ADR | 81,600 | | 3,653,232 |
TOTAL LUXEMBOURG | | 4,899,081 |
Malaysia - 2.9% |
AirAsia BHD (a) | 2,702,700 | | 889,053 |
IOI Corp. BHD | 990,300 | | 2,475,750 |
Malakoff BHD | 806,300 | | 1,411,025 |
Malayan Banking BHD | 1,580,200 | | 4,574,263 |
Maxis Communications BHD | 764,400 | | 1,729,958 |
Public Bank BHD (For. Reg.) | 1,713,600 | | 3,134,084 |
Telekom Malaysia BHD | 1,191,600 | | 3,606,158 |
TOTAL MALAYSIA | | 17,820,291 |
Mexico - 7.8% |
America Movil SA de CV sponsored ADR | 412,800 | | 18,163,200 |
Cemex SA de CV sponsored ADR | 276,100 | | 8,001,378 |
Consorcio ARA SA de CV (a) | 398,000 | | 1,064,070 |
Fomento Economico Mexicano SA de CV sponsored ADR | 39,500 | | 1,741,950 |
Grupo Mexico SA de CV Series B (a) | 510,638 | | 2,109,109 |
Grupo Televisa SA de CV sponsored ADR | 105,700 | | 5,813,500 |
Industrias Penoles SA de CV | 388,100 | | 1,772,836 |
Urbi, Desarrollos Urbanos, SA de CV | 549,500 | | 2,047,232 |
Wal-Mart de Mexico SA de CV Series V | 1,971,200 | | 6,448,808 |
TOTAL MEXICO | | 47,162,083 |
Netherlands - 0.1% |
Efes Breweries International NV unit (a)(e) | 25,781 | | 715,423 |
Philippines - 1.3% |
Globe Telecom, Inc. | 46,000 | | 837,775 |
Philippine Long Distance Telephone Co. (a) | 270,500 | | 6,752,887 |
TOTAL PHILIPPINES | | 7,590,662 |
Poland - 0.8% |
Agora SA (a) | 163,241 | | 2,274,666 |
KGHM Polska Miedz SA (Bearer) (a) | 268,365 | | 2,646,176 |
TOTAL POLAND | | 4,920,842 |
Russia - 6.3% |
JSC MMC 'Norilsk Nickel' sponsored ADR | 79,708 | | 4,949,867 |
Lukoil Oil Co. sponsored ADR | 98,700 | | 12,312,825 |
|
| Shares | | Value (Note 1) |
Mechel Steel Group OAO ADR | 45,200 | | $926,600 |
Mobile TeleSystems OJSC sponsored ADR | 23,000 | | 3,337,760 |
OAO Gazprom sponsored ADR (d) | 99,700 | | 3,724,792 |
Surgutneftegaz JSC sponsored ADR | 139,061 | | 7,283,320 |
Unified Energy System of Russia (RAO UESR) sponsored ADR | 66,520 | | 2,100,702 |
Vimpel Communications sponsored ADR (a) | 16,300 | | 1,858,200 |
YUKOS Corp. sponsored ADR (d) | 91,039 | | 1,515,799 |
TOTAL RUSSIA | | 38,009,865 |
South Africa - 10.0% |
ABSA Group Ltd. | 628,095 | | 6,902,992 |
African Bank Investments Ltd. | 2,287,626 | | 5,362,342 |
Edgars Consolidated Stores Ltd. | 126,939 | | 4,456,009 |
Gold Fields Ltd. | 233,800 | | 3,371,396 |
Harmony Gold Mining Co. Ltd. | 218,130 | | 2,556,553 |
Impala Platinum Holdings Ltd. | 54,566 | | 4,414,509 |
Ispat Iscor Ltd. | 267,900 | | 2,373,033 |
JD Group Ltd. | 268,500 | | 2,510,478 |
Massmart Holdings Ltd. | 499,655 | | 3,507,933 |
MTN Group Ltd. | 1,618,100 | | 8,838,668 |
Sanlam Ltd. | 3,863,322 | | 6,831,513 |
Sasol Ltd. | 354,575 | | 7,066,781 |
Telkom SA Ltd. | 177,814 | | 2,528,845 |
TOTAL SOUTH AFRICA | | 60,721,052 |
Taiwan - 8.3% |
Cathay Financial Holding Co. Ltd. | 2,302,000 | | 4,405,083 |
China Steel Corp. | 1,431,000 | | 1,437,632 |
Chinatrust Financial Holding Co. | 3,423,804 | | 3,900,342 |
Delta Electronics, Inc. | 2,358,800 | | 3,561,651 |
Far Eastern Textile Ltd. | 4,739,477 | | 3,160,124 |
Far EasTone Telecommunications Co. Ltd. | 2,469,500 | | 2,636,004 |
First Financial Holding Co. Ltd. (a) | 2,199,000 | | 1,768,668 |
Formosa Chemicals & Fibre Corp. | 1,573,000 | | 2,657,333 |
Hon Hai Precision Industries Co. Ltd. | 1,324,797 | | 4,872,179 |
Mega Financial Holding Co. Ltd. | 3,678,000 | | 2,452,367 |
Polaris Securities Co. Ltd. | 5,713,971 | | 2,921,480 |
Powerchip Semiconductor Corp. (a) | 2,212,000 | | 1,686,530 |
President Chain Store Corp. | 348,000 | | 520,257 |
Quanta Computer, Inc. | 1,168,970 | | 1,887,409 |
Taiwan Cellular Co. Ltd. | 2,597,000 | | 2,593,506 |
Taiwan Semiconductor Manufacturing Co. Ltd. | 5,661,699 | | 7,414,634 |
United Microelectronics Corp. (a) | 4,089,840 | | 2,470,168 |
TOTAL TAIWAN | | 50,345,367 |
Thailand - 1.8% |
Advanced Info Service PCL (For. Reg.) | 1,662,600 | | 3,785,999 |
Siam Cement PCL (For. Reg.) | 1,075,400 | | 6,704,881 |
Thai Oil PCL (a) | 123,500 | | 124,071 |
TOTAL THAILAND | | 10,614,951 |
Common Stocks - continued |
| Shares | | Value (Note 1) |
Turkey - 3.5% |
Arcelik AS (a) | 346,564,500 | | $2,099,886 |
Denizbank AS | 469,711,000 | | 915,824 |
Dogan Yayin Holding AS (a) | 1,310,969,332 | | 4,659,513 |
Enka Insaat ve Sanayi AS | 83,557,788 | | 2,093,039 |
Koytas Tekstil Sanayi ve Ticaret AS (a) | 26,770,000 | | 5 |
Tofas Turk Otomobil Fabrikasi AS (a) | 849,511,453 | | 2,058,927 |
Turkcell Iletisim Hizmet AS sponsored ADR | 251,422 | | 3,846,757 |
Turkiye Is Bankasi AS Series C unit | 804,890,552 | | 3,323,957 |
Yapi ve Kredi Bankasi AS (a) | 949,429,000 | | 2,133,975 |
TOTAL TURKEY | | 21,131,883 |
United Kingdom - 2.7% |
Anglo American PLC (South Africa) | 749,716 | | 16,467,004 |
United States of America - 1.4% |
Central European Distribution Corp. (a)(d) | 131,296 | | 3,323,102 |
DSP Group, Inc. (a) | 19,800 | | 392,634 |
NII Holdings, Inc. (a) | 58,500 | | 2,589,795 |
Zoran Corp. (a) | 208,900 | | 2,107,801 |
TOTAL UNITED STATES OF AMERICA | | 8,413,332 |
TOTAL COMMON STOCKS (Cost $514,213,641) | 581,682,029 |
Nonconvertible Preferred Stocks - 0.5% |
| | | |
Korea (South) - 0.5% |
Samsung Electronics Co. Ltd.
(Cost $3,528,399) | 11,000 | | 2,947,745 |
Money Market Funds - 5.5% |
| Shares | | Value (Note 1) |
Fidelity Cash Central Fund, 1.79% (b) | 20,758,662 | | $20,758,662 |
Fidelity Securities Lending Cash Central Fund, 1.77% (b)(c) | 12,207,500 | | 12,207,500 |
TOTAL MONEY MARKET FUNDS (Cost $32,966,162) | 32,966,162 |
TOTAL INVESTMENT PORTFOLIO - 102.2% (Cost $550,708,202) | 617,595,936 |
NET OTHER ASSETS - (2.2)% | (13,045,534) |
NET ASSETS - 100% | $604,550,402 |
Legend |
(a)Non-income producing |
(b)Affiliated fund that is available only to investment companies and other accounts managed by Fidelity Investments. The rate quoted is the annualized seven-day yield of the fund at period end. A complete listing of the fund's holdings as of its most recent fiscal year end is available upon request. |
(c)Includes investment made with cash collateral received from securities on loan. |
(d)Security or a portion of the security is on loan at period end. |
(e)Security exempt from registration under Rule 144A of the Securities Act of 1933. These securities may be resold in transactions exempt from registration, normally to qualified institutional buyers. At the period end, the value of these securities amounted to $715,423 or 0.1% of net assets. |
Income Tax Information |
At September 30, 2004, the fund had a capital loss carryforward of approximately $427,327,000 of which $19,326,000, $309,416,000, $46,041,000, $40,041,000 and $12,503,000 will expire on September 30, 2006, 2007, 2008, 2010 and 2011, respectively. |
See accompanying notes which are an integral part of the financial statements.
Annual Report
Emerging Markets
Financial Statements
Statement of Assets and Liabilities
| October 31, 2004 |
| | |
Assets | | |
Investment in securities, at value (including securities loaned of $11,982,695) (cost $550,708,202) - See accompanying schedule | | $617,595,936 |
Cash | | 999,757 |
Foreign currency held at value (cost $1,892,875) | | 1,911,868 |
Receivable for investments sold | | 5,059,105 |
Receivable for fund shares sold | | 1,160,891 |
Dividends receivable | | 1,494,670 |
Interest receivable | | 18,793 |
Other affiliated receivables | | 4,915 |
Other receivables | | 136,299 |
Total assets | | 628,382,234 |
| | |
Liabilities | | |
Payable for investments purchased | $7,211,303 | |
Payable for fund shares redeemed | 3,665,333 | |
Accrued management fee | 360,756 | |
Other affiliated payables | 168,540 | |
Other payables and accrued expenses | 218,400 | |
Collateral on securities loaned, at value | 12,207,500 | |
Total liabilities | | 23,831,832 |
| | |
Net Assets | | $604,550,402 |
Net Assets consist of: | | |
Paid in capital | | $976,398,839 |
Undistributed net investment income | | 3,365,820 |
Accumulated undistributed net realized gain (loss) on investments and foreign currency transactions | | (442,128,228) |
Net unrealized appreciation (depreciation) on investments and assets and liabilities in foreign currencies | | 66,913,971 |
Net Assets, for 53,480,209 shares outstanding | | $604,550,402 |
Net Asset Value, offering price and redemption price per share ($604,550,402 ÷ 53,480,209 shares) | | $11.30 |
Statement of Operations
| Year ended October 31, 2004 |
| | |
Investment Income | | |
Dividends | | $15,457,157 |
Interest | | 190,389 |
Security lending | | 90,758 |
| | 15,738,304 |
Less foreign taxes withheld | | (1,843,383) |
Total income | | 13,894,921 |
| | |
Expenses | | |
Management fee | $4,116,327 | |
Transfer agent fees | 1,697,922 | |
Accounting and security lending fees | 285,594 | |
Non-interested trustees' compensation | 3,533 | |
Custodian fees and expenses | 677,243 | |
Registration fees | 45,537 | |
Audit | 87,361 | |
Legal | 5,862 | |
Interest | 1,124 | |
Miscellaneous | 68,612 | |
Total expenses before reductions | 6,989,115 | |
Expense reductions | (281,085) | 6,708,030 |
Net investment income (loss) | | 7,186,891 |
Realized and Unrealized Gain (Loss) Net realized gain (loss) on: | | |
Investment securities (net of foreign taxes of $777,786) | 74,177,675 | |
Foreign currency transactions | (1,219,865) | |
Total net realized gain (loss) | | 72,957,810 |
Change in net unrealized appreciation (depreciation) on: Investment securities (net of decrease in deferred foreign taxes of $646,762) | (19,599,158) | |
Assets and liabilities in foreign currencies | 39,487 | |
Total change in net unrealized appreciation (depreciation) | | (19,559,671) |
Net gain (loss) | | 53,398,139 |
Net increase (decrease) in net assets resulting from operations | | $60,585,030 |
See accompanying notes which are an integral part of the financial statements.
Annual Report
Emerging Markets
Financial Statements - continued
Statement of Changes in Net Assets
| Year ended
October 31,
2004 | Year ended
October 31,
2003 |
Increase (Decrease) in Net Assets | | |
Operations | | |
Net investment income (loss) | $7,186,891 | $3,893,429 |
Net realized gain (loss) | 72,957,810 | 14,757,151 |
Change in net unrealized appreciation (depreciation) | (19,559,671) | 87,760,059 |
Net increase (decrease) in net assets resulting from operations | 60,585,030 | 106,410,639 |
Distributions to shareholders from net investment income | (5,261,351) | (1,836,578) |
Share transactions
Proceeds from sales of shares | 349,686,058 | 144,659,629 |
Reinvestment of distributions | 4,973,151 | 1,776,667 |
Cost of shares redeemed | (237,151,194) | (83,990,232) |
Net increase (decrease) in net assets resulting from share transactions | 117,508,015 | 62,446,064 |
Redemption fees | 790,209 | 179,613 |
Total increase (decrease) in net assets | 173,621,903 | 167,199,738 |
| | |
Net Assets | | |
Beginning of period | 430,928,499 | 263,728,761 |
End of period (including undistributed net investment income of $3,365,820 and undistributed net investment income of $2,401,192, respectively) | $604,550,402 | $430,928,499 |
Other Information Shares | | |
Sold | 31,618,832 | 17,006,473 |
Issued in reinvestment of distributions | 482,623 | 243,379 |
Redeemed | (22,532,170) | (10,837,670) |
Net increase (decrease) | 9,569,285 | 6,412,182 |
Financial Highlights
Years ended October 31, | 2004 | 2003 | 2002 | 2001 | 2000 |
Selected Per-Share Data | | | | | |
Net asset value, beginning of period | $9.81 | $7.03 | $6.52 | $8.71 | $9.35 |
Income from Investment Operations | | | | | |
Net investment income (loss) C | .14 | .10 | .06 E | .06 | .02 D |
Net realized and unrealized gain (loss) | 1.46 | 2.73 | .47 | (2.22) | (.68) |
Total from investment operations | 1.60 | 2.83 | .53 | (2.16) | (.66) |
Distributions from net investment income | (.12) | (.05) | (.03) | (.03) | - |
Redemption fees added to paid in capital C | .01 | - G | .01 | - G | .02 |
Net asset value, end of period | $11.30 | $9.81 | $7.03 | $6.52 | $8.71 |
Total Return A, B | 16.48% | 40.50% | 8.25% | (24.87)% | (6.84)% |
Ratios to Average Net Assets F | | | | | |
Expenses before expense reductions | 1.23% | 1.36% | 1.44% | 1.54% | 1.39% |
Expenses net of voluntary waivers, if any | 1.23% | 1.36% | 1.44% | 1.54% | 1.39% |
Expenses net of all reductions | 1.18% | 1.36% | 1.39% | 1.45% | 1.35% |
Net investment income (loss) | 1.27% | 1.31% | .73% | .78% | .15% |
Supplemental Data | | | | | |
Net assets, end of period (000 omitted) | $604,550 | $430,928 | $263,729 | $204,164 | $304,445 |
Portfolio turnover rate | 112% | 105% | 120% | 113% | 100% |
A Total returns would have been lower had certain expenses not been reduced during the periods shown. B Total returns do not include the effect of the former sales charges. C Calculated based on average shares outstanding during the period. D Investment income per share reflects a special dividend which amounted to $.02 per share. E Investment income per share reflects a special dividend which amounted to $.01 per share. F Expense ratios reflect operating expenses of the fund. Expenses before reductions do not reflect amounts reimbursed by the investment adviser or reductions from brokerage service arrangements or other expense offset arrangements and do not represent the amount paid by the fund during periods when reimbursements or reductions occur. Expenses net of any voluntary waivers reflect expenses after reimbursement by the investment adviser but prior to reductions from brokerage service arrangements or other expense offset arrangements. Expenses net of all reductions represent the net expenses paid by the fund. G Amount represents less than $.01 per share. |
See accompanying notes which are an integral part of the financial statements.
Annual Report
Europe
Performance: The Bottom Line
Average annual total return reflects the change in the value of an investment, assuming reinvestment of the fund's dividend income and capital gains (the profits earned upon the sale of securities that have grown in value) and assuming a constant rate of performance each year. The $10,000 table and the fund's returns do not reflect the deduction of taxes that a shareholder would pay on fund distributions or the redemption of fund shares. During periods of reimbursement by Fidelity, a fund's total returns will be greater than it would be had the reimbursement not occurred. How a fund did yesterday is no guarantee of how it will do tomorrow.
Average Annual Total Returns
Periods ended
October 31, 2004 | Past 1
year | Past 5
years | Past 10
years |
Fidelity Europe Fund | 26.20% | 2.16% | 9.19% |
$10,000 Over 10 Years
Let's say hypothetically that $10,000 was invested in Fidelity Europe Fund on October 31, 1994. The chart shows how the value of your investment would have grown, and also shows how the MSCI Europe Index did over the same period.
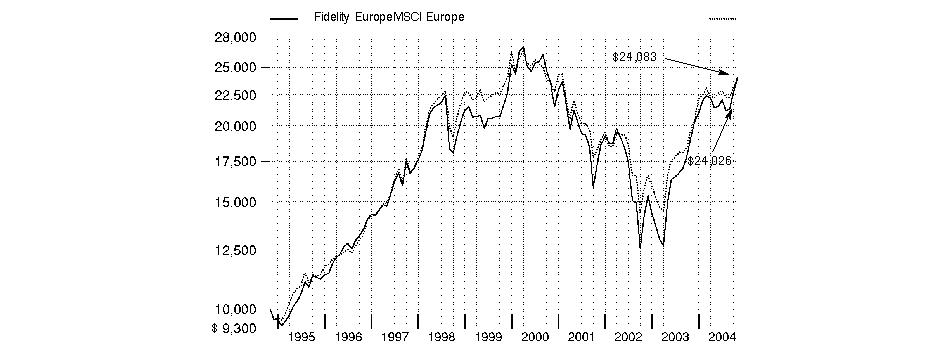
Annual Report
Europe
Management's Discussion of Fund Performance
Comments from David Baverez, Portfolio Manager of Fidelity® Europe Fund
Most of the world's major stock markets posted solid gains for the year ending October 31, 2004. The Morgan Stanley Capital InternationalSM Europe, Australasia, Far East (MSCI® EAFE®) Index - designed to represent the performance of developed stock markets outside the United States and Canada - gained 19.00%, compared to 9.42% for the Standard & Poor's 500SM Index. A weak U.S. dollar relative to most foreign currencies was partly responsible for the performance disparity. On a regional basis, Europe was one of the top performers. Many investors felt European stocks offered better valuations and brighter earnings prospects than U.S. equities. Latin American countries, many of which are exporters of oil and materials that received strong support from high commodity prices, also did well. Conversely, Japan significantly underperformed, as early optimism was eroded by disappointing economic indicators and concerns about the impact of China's economic slowdown on exports. Meanwhile, technology-focused Asian emerging markets suffered due to a deceleration in corporate capital spending.
Fidelity Europe Fund performed well amid generally rising stock prices and an environment of uncertainty that created attractive buying opportunities. For the 12-month period ending October 31, 2004, the fund gained 26.20%, outperforming both the 22.09% return of the Morgan Stanley Capital International Europe Index and the 21.59% return of the LipperSM European Region Funds Average. Relative to the index, the fund's performance was helped primarily by its holdings in the banking, media and wireless telecommunications groups. Hungarian-based OTP Bank, Bank Austria Creditanstalt, Russian-based wireless company Vimpel and MTN Group, a South African wireless firm, all made strong contributions. Spain-based Antena 3 Television also performed well. Detracting from the fund's performance were YUKOS, a Russian oil company involved in a tax dispute with the government; Tiscali, an Italian Internet firm with disappointing financial results; Business Objects, a software company co-headquartered in Paris and California that underwent a difficult merger; and Italian dairy conglomerate Parmalat, which was involved in a fraud scandal. Several of the holdings mentioned here were sold before period end.
The views expressed in this statement reflect those of the portfolio manager only through the end of the period of the report as stated on the cover and do not necessarily represent the views of Fidelity or any other person in the Fidelity organization. Any such views are subject to change at any time based upon market or other conditions and Fidelity disclaims any responsibility to update such views. These views may not be relied on as investment advice and, because investment decisions for a Fidelity fund are based on numerous factors, may not be relied on as an indication of trading intent on behalf of any Fidelity fund.
Annual Report
Europe
Investment Changes
Geographic Diversification (% of fund's net assets) |
As of October 31, 2004 |
| France | 23.0% | |
| Italy | 12.9% | |
| Switzerland | 11.9% | |
| Germany | 7.8% | |
| Russia | 7.7% | |
| United States of America | 6.4% | |
| Netherlands | 5.4% | |
| South Africa | 4.9% | |
| Spain | 4.5% | |
| Other | 15.5% | |

Percentages are adjusted for the effect of futures contracts, if applicable. |
|
As of April 30, 2004 |
| France | 16.1% | |
| Germany | 15.8% | |
| Italy | 12.5% | |
| Switzerland | 11.9% | |
| Russia | 11.0% | |
| United States of America | 5.5% | |
| Netherlands | 4.7% | |
| Spain | 4.2% | |
| United Kingdom | 4.1% | |
| Other | 14.2% | |

Percentages are adjusted for the effect of futures contracts, if applicable. |
Asset Allocation |
| % of fund's
net assets | % of fund's net assets
6 months ago |
Stocks | 97.0 | 98.4 |
Short-Term Investments and Net Other Assets | 3.0 | 1.6 |
Top Ten Stocks as of October 31, 2004 |
| % of fund's
net assets | % of fund's net assets
6 months ago |
MTN Group Ltd. (South Africa, Wireless Telecommunication Services) | 4.9 | 3.4 |
Antena 3 Television SA (Spain, Media) | 4.5 | 4.2 |
Surgutneftegaz JSC sponsored ADR (Russia, Oil & Gas) | 4.0 | 2.7 |
UBS AG (Reg.) (Switzerland, Capital Markets) | 3.9 | 3.1 |
Compagnie Financiere Richemont unit (Switzerland, Textiles Apparel & Luxury Goods) | 3.8 | 3.3 |
Synthes, Inc. (United States of America, Health Care Equipment & Supplies) | 3.4 | 3.9 |
Publicis Groupe SA (France, Media) | 3.3 | 0.0 |
Air France KLM (Reg.) (France, Airlines) | 3.3 | 3.1 |
Vivendi Universal SA (France, Media) | 3.1 | 2.9 |
Bank Austria Creditanstalt AG (Austria, Commercial Banks) | 3.0 | 2.9 |
| 37.2 | |
Market Sectors as of October 31, 2004 |
| % of fund's
net assets | % of fund's net assets
6 months ago |
Consumer Discretionary | 26.8 | 22.1 |
Financials | 26.2 | 31.1 |
Industrials | 8.8 | 3.1 |
Health Care | 8.4 | 10.1 |
Telecommunication Services | 7.8 | 9.4 |
Energy | 7.7 | 12.0 |
Information Technology | 5.8 | 7.5 |
Utilities | 2.9 | 3.0 |
Consumer Staples | 2.6 | 0.1 |
Annual Report
Europe
Investments October 31, 2004
Showing Percentage of Net Assets
Common Stocks - 92.9% |
| Shares | | Value (Note 1) |
Austria - 3.0% |
Bank Austria Creditanstalt AG | 756,268 | | $56,141,855 |
Belgium - 2.9% |
Belgacom SA | 1,466,500 | | 54,048,385 |
France - 23.0% |
Air France KLM (Reg.) (d) | 3,462,224 | | 60,477,800 |
Carrefour SA | 1,038,000 | | 45,601,521 |
Dassault Systemes SA | 1,049,506 | | 53,426,641 |
Financiere Marc de Lacharriere SA (Fimalac) | 467,981 | | 19,164,009 |
Lagardere S.C.A. (Reg.) | 562,136 | | 36,327,955 |
Publicis Groupe SA | 2,050,451 | | 61,348,235 |
Sanofi-Aventis | 741,948 | | 54,162,204 |
Total SA Series B | 174,500 | | 36,393,720 |
Vivendi Universal SA (a) | 2,094,278 | | 57,446,045 |
TOTAL FRANCE | | 424,348,130 |
Germany - 5.8% |
RWE AG | 983,555 | | 52,259,369 |
SAP AG | 315,500 | | 53,824,300 |
TOTAL GERMANY | | 106,083,669 |
Greece - 2.0% |
Alpha Bank AE | 1,295,100 | | 37,223,845 |
Ireland - 2.6% |
DEPFA BANK PLC | 3,117,361 | | 47,871,442 |
Italy - 10.8% |
Autostrade Spa | 1,985,224 | | 43,569,423 |
Bulgari Spa | 3,248,532 | | 33,714,457 |
Lottomatica Spa New | 1,215,500 | | 36,693,664 |
Mediobanca Spa (d) | 2,822,098 | | 39,223,837 |
Pirelli & C. Real Estate Spa | 1,045,757 | | 45,902,154 |
TOTAL ITALY | | 199,103,535 |
Netherlands - 5.4% |
Efes Breweries International NV unit | 112,800 | | 3,130,200 |
Euronext NV | 1,889,744 | | 54,895,533 |
Wolters Kluwer NV (Certificaten Van Aandelen) | 2,291,000 | | 41,895,318 |
TOTAL NETHERLANDS | | 99,921,051 |
Russia - 7.7% |
Sberbank RF unit (a) | 785,147 | | 37,154,381 |
Sibneft sponsored ADR | 834,700 | | 31,075,881 |
Surgutneftegaz JSC sponsored ADR | 1,857,700 | | 74,122,230 |
TOTAL RUSSIA | | 142,352,492 |
South Africa - 4.9% |
MTN Group Ltd. | 16,373,948 | | 89,440,634 |
Spain - 4.5% |
Antena 3 Television SA (a) | 1,297,180 | | 83,581,063 |
|
| Shares | | Value (Note 1) |
Sweden - 1.1% |
Skandia Foersaekrings AB | 5,591,500 | | $20,865,281 |
Switzerland - 11.9% |
Compagnie Financiere Richemont unit | 2,454,715 | | 69,808,657 |
Roche Holding AG (participation certificate) | 375,250 | | 38,474,284 |
Societe Generale de Surveillance Holding SA (SGS) (Reg.) | 60,021 | | 38,361,554 |
UBS AG (Reg.) | 1,010,998 | | 73,287,245 |
TOTAL SWITZERLAND | | 219,931,740 |
Turkey - 1.9% |
Turkiye Garanti Bankasi AS | 12,983,307,106 | | 34,631,414 |
United Kingdom - 2.0% |
Signet Group PLC | 19,166,405 | | 37,422,466 |
United States of America - 3.4% |
Synthes, Inc. | 581,875 | | 62,194,044 |
TOTAL COMMON STOCKS (Cost $1,453,211,581) | 1,715,161,046 |
Nonconvertible Preferred Stocks - 4.1% |
| | | |
Germany - 2.0% |
Porsche AG (non-vtg.) | 56,994 | | 36,391,758 |
Italy - 2.1% |
Banca Intesa Spa (Risp) | 11,357,397 | | 38,384,455 |
TOTAL NONCONVERTIBLE
PREFERRED STOCKS (Cost $49,610,803) | 74,776,213 |
Money Market Funds - 8.5% |
| | | |
Fidelity Cash Central Fund, 1.79% (b) | 79,588,223 | | 79,588,223 |
Fidelity Securities Lending Cash Central Fund, 1.77% (b)(c) | 76,509,456 | | 76,509,456 |
TOTAL MONEY MARKET FUNDS (Cost $156,097,679) | 156,097,679 |
TOTAL INVESTMENT PORTFOLIO - 105.5% (Cost $1,658,920,063) | 1,946,034,938 |
NET OTHER ASSETS - (5.5)% | (100,594,513) |
NET ASSETS - 100% | $1,845,440,425 |
Legend |
(a)Non-income producing |
(b)Affiliated fund that is available only to investment companies and other accounts managed by Fidelity Investments. The rate quoted is the annualized seven-day yield of the fund at period end. A complete listing of the fund's holdings as of its most recent fiscal year end is available upon request. |
(c)Includes investment made with cash collateral received from securities on loan. |
(d)Security or a portion of the security is on loan at period end. |
Income Tax Information |
At October 31, 2004, the fund had a capital loss carryforward of approximately $93,906,000 all of which will expire on October 31, 2011. |
See accompanying notes which are an integral part of the financial statements.
Annual Report
Europe
Financial Statements
Statement of Assets and Liabilities
| October 31, 2004 |
| | |
Assets | | |
Investment in securities, at value (including securities loaned of $72,937,803) (cost $1,658,920,063) - See accompanying schedule | | $1,946,034,938 |
Receivable for fund shares sold | | 14,197,497 |
Dividends receivable | | 666,119 |
Interest receivable | | 108,467 |
Other affiliated receivables | | 24 |
Other receivables | | 334,466 |
Total assets | | 1,961,341,511 |
| | |
Liabilities | | |
Payable for investments purchased | $36,462,204 | |
Payable for fund shares redeemed | 1,081,559 | |
Accrued management fee | 1,179,979 | |
Other affiliated payables | 437,685 | |
Other payables and accrued expenses | 230,203 | |
Collateral on securities loaned, at value | 76,509,456 | |
Total liabilities | | 115,901,086 |
| | |
Net Assets | | $1,845,440,425 |
Net Assets consist of: | | |
Paid in capital | | $1,649,339,575 |
Undistributed net investment income | | 5,169,708 |
Accumulated undistributed net realized gain (loss) on investments and foreign currency transactions | | (96,280,699) |
Net unrealized appreciation (depreciation) on investments and assets and liabilities in foreign currencies | | 287,211,841 |
Net Assets, for 60,674,746 shares outstanding | | $1,845,440,425 |
Net Asset Value, offering price and redemption price per share ($1,845,440,425 ÷ 60,674,746 shares) | | $30.42 |
Statement of Operations
| Year ended October 31, 2004 |
| | |
Investment Income | | |
Dividends | | $21,274,499 |
Interest | | 726,257 |
Security lending | | 2,380,006 |
| | 24,380,762 |
Less foreign taxes withheld | | (2,950,777) |
Total income | | 21,429,985 |
| | |
Expenses | | |
Management fee
Basic fee | $11,369,728 | |
Performance adjustment | 527,174 | |
Transfer agent fees | 4,154,316 | |
Accounting and security lending fees | 711,698 | |
Non-interested trustees' compensation | 9,792 | |
Custodian fees and expenses | 506,387 | |
Registration fees | 61,960 | |
Audit | 63,288 | |
Legal | 5,461 | |
Interest | 202 | |
Miscellaneous | 80,118 | |
Total expenses before reductions | 17,490,124 | |
Expense reductions | (1,095,983) | 16,394,141 |
Net investment income (loss) | | 5,035,844 |
Realized and Unrealized Gain (Loss) Net realized gain (loss) on: | | |
Investment securities | 289,553,218 | |
Foreign currency transactions | 165,555 | |
Total net realized gain (loss) | | 289,718,773 |
Change in net unrealized appreciation (depreciation) on: Investment securities | 61,183,339 | |
Assets and liabilities in foreign currencies | 66,507 | |
Total change in net unrealized appreciation (depreciation) | | 61,249,846 |
Net gain (loss) | | 350,968,619 |
Net increase (decrease) in net assets resulting from operations | | $356,004,463 |
See accompanying notes which are an integral part of the financial statements.
Annual Report
Europe
Financial Statements - continued
Statement of Changes in Net Assets
| Year ended
October 31,
2004 | Year ended
October 31,
2003 |
Increase (Decrease) in Net Assets | | |
Operations | | |
Net investment income (loss) | $5,035,844 | $14,700,161 |
Net realized gain (loss) | 289,718,773 | (124,632,894) |
Change in net unrealized appreciation (depreciation) | 61,249,846 | 432,602,333 |
Net increase (decrease) in net assets resulting from operations | 356,004,463 | 322,669,600 |
Distributions to shareholders from net investment income | (15,656,206) | (6,786,170) |
Share transactions
Proceeds from sales of shares | 423,185,947 | 298,317,243 |
Reinvestment of distributions | 15,242,825 | 6,549,345 |
Cost of shares redeemed | (216,598,289) | (213,672,148) |
Net increase (decrease) in net assets resulting from share transactions | 221,830,483 | 91,194,440 |
Redemption fees | 70,412 | 118,259 |
Total increase (decrease) in net assets | 562,249,152 | 407,196,129 |
| | |
Net Assets | | |
Beginning of period | 1,283,191,273 | 875,995,144 |
End of period (including undistributed net investment income of $5,169,708 and undistributed net investment income of $15,679,314, respectively) | $1,845,440,425 | $1,283,191,273 |
Other Information Shares | | |
Sold | 15,357,591 | 15,032,139 |
Issued in reinvestment of distributions | 579,135 | 347,815 |
Redeemed | (7,925,889) | (10,560,777) |
Net increase (decrease) | 8,010,837 | 4,819,177 |
Financial Highlights
Years ended October 31, | 2004 | 2003 | 2002 | 2001 | 2000 |
Selected Per-Share Data | | | | | |
Net asset value, beginning of period | $24.37 | $18.31 | $22.68 | $34.88 | $34.09 |
Income from Investment Operations | | | | | |
Net investment income (loss) D | .09 | .29 | .12 E | .12 | .20 |
Net realized and unrealized gain (loss) | 6.25 | 5.91 | (4.25) | (8.11) | 2.70 |
Total from investment operations | 6.34 | 6.20 | (4.13) | (7.99) | 2.90 |
Distributions from net investment income | (.29) | (.14) | (.24) | (.12) | (.18) |
Distributions from net realized gain | - | - | - | (4.09) | (1.94) |
Total distributions | (.29) | (.14) | (.24) | (4.21) | (2.12) |
Redemption fees added to paid in capital D | - H | - H | - H | - H | .01 |
Net asset value, end of period | $30.42 | $24.37 | $18.31 | $22.68 | $34.88 |
Total Return A, B, C | 26.20% | 34.09% | (18.49)% | (25.64)% | 8.51% |
Ratios to Average Net Assets F | | | | | |
Expenses before expense reductions | 1.11% | 1.03% | 1.20% | 1.06% | 1.09% |
Expenses net of voluntary waivers, if any | 1.11% | 1.03% | 1.20% | 1.06% | 1.09% |
Expenses net of all reductions | 1.05% | .98% | 1.13% | .99% | 1.05% |
Net investment income (loss) | .32% | 1.44% | .52% | .45% | .54% |
Supplemental Data | | | | | |
Net assets, end of period (000 omitted) | $1,845,440 | $1,283,191 | $875,995 | $1,059,368 | $1,425,092 |
Portfolio turnover rate | 106% | 162% | 127% | 123% | 144% G |
A Total returns would have been lower had certain expenses not been reduced during the periods shown. B Total returns do not include the effect of the former sales charges. C Total returns do not include the effect of the contingent deferred sales charge. D Calculated based on average shares outstanding during the period. E Investment income per share reflects a special dividend which amounted to $.05 per share. F Expense ratios reflect operating expenses of the fund. Expenses before reductions do not reflect amounts reimbursed by the investment adviser or reductions from brokerage service arrangements or other expense offset arrangements and do not represent the amount paid by the fund during periods when reimbursements or reductions occur. Expenses net of any voluntary waivers reflect expenses after reimbursement by the investment adviser but prior to reductions from brokerage service arrangements or other expense offset arrangements. Expenses net of all reductions represent the net expenses paid by the fund. G The portfolio turnover rate does not include the assets acquired in the merger of Fidelity France, Fidelity Germany and Fidelity United Kingdom Funds. H Amount represents less than $.01 per share. |
See accompanying notes which are an integral part of the financial statements.
Annual Report
Europe Capital Appreciation
Performance: The Bottom Line
Average annual total return reflects the change in the value of an investment, assuming reinvestment of the fund's dividend income and capital gains (the profits earned upon the sale of securities that have grown in value) and assuming a constant rate of performance each year. The $10,000 table and the fund's returns do not reflect the deduction of taxes that a shareholder would pay on fund distributions or the redemption of fund shares. During periods of reimbursement by Fidelity, a fund's total returns will be greater than it would be had the reimbursement not occurred. How a fund did yesterday is no guarantee of how it will do tomorrow.
Average Annual Total Returns
Periods ended
October 31, 2004 | Past 1
year | Past 5
years | Past 10
years |
Fidelity Europe Capital Appreciation Fund | 15.13% | 3.46% | 9.88% |
$10,000 Over 10 Years
Let's say hypothetically that $10,000 was invested in Fidelity Europe Capital Appreciation Fund on October 31, 1994. The chart shows how the value of your investment would have grown, and also shows how the MSCI Europe Index did over the same period.
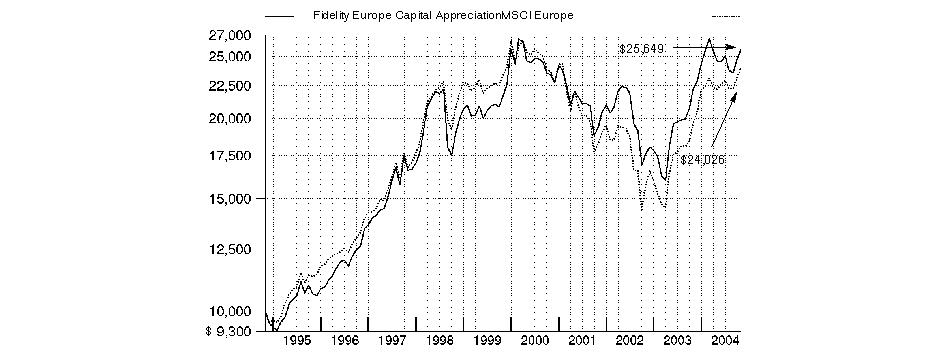
Annual Report
Europe Capital Appreciation
Management's Discussion of Fund Performance
Comments from Ian Hart, Portfolio Manager of Fidelity® Europe Capital Appreciation Fund
Most of the world's major stock markets posted solid gains for the year ending October 31, 2004. The Morgan Stanley Capital InternationalSM Europe, Australasia, Far East (MSCI® EAFE®) Index - designed to represent the performance of developed stock markets outside the United States and Canada - gained 19.00%, compared to 9.42% for the Standard & Poor's 500SM Index. A weak U.S. dollar relative to most foreign currencies was partly responsible for the performance disparity. On a regional basis, Europe was one of the top performers. Many investors felt European stocks offered better valuations and brighter earnings prospects than U.S. equities. Latin American countries, many of which are exporters of oil and materials that received strong support from high commodity prices, also did well. Conversely, Japan significantly underperformed, as early optimism was eroded by disappointing economic indicators and concerns about the impact of China's economic slowdown on exports. Meanwhile, technology-focused Asian emerging markets suffered due to a deceleration in corporate capital spending.
For the 12-month period that ended on October 31, 2004, Fidelity Europe Capital Appreciation Fund returned 15.13%, compared with returns of 22.09% for the Morgan Stanley Capital International (MSCI) Europe Index and 21.59% for the LipperSM European Region Funds Average. The fund lagged the benchmark mainly as a result of poor stock selection in the diversified financials industry and underweightings in both the energy and utilities sectors, where stock prices appreciated significantly during the period. Deutsche Boerse, the German stock exchange, and DAB Bank, the German online broker, both experienced slowdowns in their businesses and their stock prices declined. One of the fund's large positions during the period, Deutsche Boerse was the single biggest detractor from relative and absolute performance. Business Objects, a French software company that the fund no longer holds, also disappointed by delivering lackluster earnings. The fund was helped by TANDBERG Television, the Norwegian maker of infrastructure for the cable and satellite TV industries, and Turkcell, the Turkish mobile phone operator.
The views expressed in this statement reflect those of the portfolio manager only through the end of the period of the report as stated on the cover and do not necessarily represent the views of Fidelity or any other person in the Fidelity organization. Any such views are subject to change at any time based upon market or other conditions and Fidelity disclaims any responsibility to update such views. These views may not be relied on as investment advice and, because investment decisions for a Fidelity fund are based on numerous factors, may not be relied on as an indication of trading intent on behalf of any Fidelity fund.
Annual Report
Europe Capital Appreciation
Investment Changes
Geographic Diversification (% of fund's net assets) |
As of October 31, 2004 |
| United Kingdom | 29.6% | |
| France | 12.0% | |
| Germany | 9.2% | |
| United States of America | 8.6% | |
| Netherlands | 6.6% | |
| Italy | 6.3% | |
| Turkey | 3.8% | |
| Switzerland | 3.4% | |
| Norway | 2.8% | |
| Other | 17.7% | |

Percentages are adjusted for the effect of futures contracts, if applicable. |
|
As of April 30, 2004 |
| United Kingdom | 32.1% | |
| Germany | 13.2% | |
| France | 10.2% | |
| Netherlands | 7.7% | |
| Switzerland | 7.2% | |
| United States of America | 4.8% | |
| Italy | 4.5% | |
| Sweden | 4.4% | |
| Spain | 4.2% | |
| Other | 11.7% | |

Percentages are adjusted for the effect of futures contracts, if applicable. |
Asset Allocation |
| % of fund's
net assets | % of fund's net assets
6 months ago |
Stocks | 93.1 | 95.2 |
Bonds | 0.0 | 1.1 |
Short-Term Investments and
Net Other Assets | 6.9 | 3.7 |
Top Ten Stocks as of October 31, 2004 |
| % of fund's
net assets | % of fund's net assets
6 months ago |
Total SA sponsored ADR (France, Oil & Gas) | 4.9 | 0.0 |
BP PLC (United Kingdom, Oil & Gas) | 4.6 | 1.0 |
Turkcell Iletisim Hizmet AS sponsored ADR (Turkey, Wireless Telecommunication Services) | 2.9 | 0.8 |
TANDBERG Television ASA (Norway, Communications Equipment) | 2.8 | 2.2 |
Royal Dutch Petroleum Co.
(Hague Registry) (Netherlands, Oil & Gas) | 2.7 | 1.7 |
Vodafone Group PLC
(United Kingdom, Wireless Telecommunication Services) | 2.5 | 3.9 |
GlaxoSmithKline PLC sponsored ADR (United Kingdom, Pharmaceuticals) | 2.0 | 0.0 |
HSBC Holdings PLC sponsored ADR (United Kingdom, Commercial Banks) | 2.0 | 0.0 |
Shell Transport & Trading Co. PLC (United Kingdom, Oil & Gas) | 2.0 | 0.0 |
BAE Systems PLC (United Kingdom, Aerospace & Defense) | 2.0 | 0.0 |
| 28.4 | |
Market Sectors as of October 31, 2004 |
| % of fund's
net assets | % of fund's net assets
6 months ago |
Energy | 17.8 | 4.1 |
Financials | 17.4 | 13.8 |
Telecommunication Services | 14.7 | 18.4 |
Consumer Discretionary | 13.2 | 23.3 |
Health Care | 9.6 | 14.3 |
Information Technology | 6.5 | 10.2 |
Materials | 4.2 | 0.6 |
Industrials | 3.8 | 4.1 |
Utilities | 3.2 | 0.7 |
Consumer Staples | 2.7 | 6.8 |
Annual Report
Europe Capital Appreciation
Investments October 31, 2004
Showing Percentage of Net Assets
Common Stocks - 91.7% |
| Shares | | Value (Note 1) |
Belgium - 1.9% |
Belgacom SA | 97,100 | | $3,578,655 |
Fortis | 169,900 | | 4,328,853 |
TOTAL BELGIUM | | 7,907,508 |
Canada - 1.3% |
Cognos, Inc. (a) | 71,500 | | 2,838,630 |
Eldorado Gold Corp. (a) | 710,900 | | 2,276,561 |
TOTAL CANADA | | 5,115,191 |
Denmark - 2.5% |
Coloplast AS Series B (d) | 26,700 | | 2,657,357 |
Novo Nordisk AS Series B | 60,300 | | 3,005,915 |
TDC AS | 124,690 | | 4,626,895 |
TOTAL DENMARK | | 10,290,167 |
Finland - 1.2% |
F-Secure Oyj (a)(d) | 913,500 | | 1,963,930 |
Fortum Oyj | 192,200 | | 2,951,500 |
TOTAL FINLAND | | 4,915,430 |
France - 12.0% |
BNP Paribas SA | 66,300 | | 4,526,433 |
France Telecom SA | 71,672 | | 2,060,570 |
NRJ Group | 184,055 | | 3,825,091 |
Pernod-Ricard | 55,775 | | 7,744,217 |
Renault SA | 30,700 | | 2,577,213 |
Rhodia SA (a)(d) | 934,900 | | 1,686,912 |
Sanofi-Aventis | 39,900 | | 2,912,700 |
Total SA sponsored ADR | 190,600 | | 19,875,769 |
Vivendi Universal SA (a) | 135,000 | | 3,703,050 |
TOTAL FRANCE | | 48,911,955 |
Germany - 7.8% |
Adidas-Salomon AG | 22,500 | | 3,153,725 |
BASF AG | 85,200 | | 5,353,116 |
DAB Bank AG (a)(d) | 395,234 | | 2,422,691 |
Deutsche Boerse AG | 96,310 | | 4,825,156 |
Deutsche Telekom AG (Reg.) (a) | 200,100 | | 3,855,927 |
Fresenius Medical Care AG | 47,600 | | 3,654,823 |
RWE AG | 108,600 | | 5,770,259 |
Siemens AG (Reg.) | 37,644 | | 2,813,513 |
TOTAL GERMANY | | 31,849,210 |
Greece - 2.5% |
Alpha Bank AE | 154,800 | | 4,449,271 |
Greek Organization of Football Prognostics SA | 149,080 | | 3,048,627 |
Hellenic Petroleum SA | 296,250 | | 2,843,333 |
TOTAL GREECE | | 10,341,231 |
Ireland - 0.2% |
C&C Group PLC | 217,500 | | 712,537 |
Israel - 0.5% |
Emblaze Ltd. (a) | 770,300 | | 1,981,759 |
|
| Shares | | Value (Note 1) |
Italy - 6.3% |
Banca Intesa Spa | 753,003 | | $3,093,214 |
Bulgari Spa | 477,100 | | 4,951,519 |
Capitalia Spa | 677,900 | | 2,611,201 |
ENI Spa | 318,681 | | 7,293,333 |
Mediaset Spa | 212,200 | | 2,427,678 |
Mediobanca Spa | 87,400 | | 1,214,757 |
Telecom Italia Mobile Spa (TIM) | 664,300 | | 3,929,184 |
TOTAL ITALY | | 25,520,886 |
Luxembourg - 1.7% |
Millicom International Cellular SA unit (a) | 330,200 | | 6,697,627 |
Netherlands - 6.6% |
ABN-AMRO Holding NV | 190,800 | | 4,590,648 |
Completel Europe NV (a) | 85,900 | | 2,830,600 |
Hagemeyer NV (a) | 1,358,700 | | 2,486,382 |
ING Groep NV (Certificaten Van Aandelen) | 151,398 | | 4,031,729 |
Royal Dutch Petroleum Co.
(Hague Registry) | 202,100 | | 10,961,904 |
Wolters Kluwer NV (Certificaten
Van Aandelen) | 112,400 | | 2,055,449 |
TOTAL NETHERLANDS | | 26,956,712 |
Norway - 2.8% |
TANDBERG Television ASA (a) | 1,578,900 | | 11,471,262 |
Poland - 0.7% |
Bank Zachodni WBK SA | 13,400 | | 338,234 |
Polski Koncern Naftowy Orlen SA | 225,100 | | 2,432,220 |
TOTAL POLAND | | 2,770,454 |
Portugal - 0.9% |
Portugal Telecom SGPS SA sponsored ADR | 186,500 | | 2,111,180 |
PT Multimedia SGPS SA | 61,200 | | 1,431,646 |
TOTAL PORTUGAL | | 3,542,826 |
Russia - 0.5% |
Surgutneftegaz JSC sponsored ADR | 52,900 | | 2,110,710 |
South Africa - 0.8% |
MTN Group Ltd. | 339,500 | | 1,854,476 |
Steinhoff International Holdings Ltd. | 831,400 | | 1,455,163 |
TOTAL SOUTH AFRICA | | 3,309,639 |
Spain - 1.3% |
Banco Bilbao Vizcaya Argentaria SA | 337,000 | | 5,307,750 |
Sweden - 1.7% |
Modern Times Group AB (MTG)
(B Shares) (a) | 59,200 | | 1,317,936 |
Nordea Bank AB | 178,900 | | 1,548,847 |
Skandia Foersaekrings AB | 508,500 | | 1,897,522 |
Telefonaktiebolaget LM Ericsson
(B Shares) (a) | 805,100 | | 2,327,544 |
TOTAL SWEDEN | | 7,091,849 |
Common Stocks - continued |
| Shares | | Value (Note 1) |
Switzerland - 3.4% |
Credit Suisse Group (Reg.) | 41,600 | | $1,425,632 |
Phonak Holding AG | 113,875 | | 3,577,075 |
Roche Holding AG (participation certificate) | 50,400 | | 5,167,499 |
Syngenta AG (Switzerland) | 17,200 | | 1,645,368 |
UBS AG (NY Shares) | 29,200 | | 2,116,708 |
TOTAL SWITZERLAND | | 13,932,282 |
Turkey - 3.8% |
Turkcell Iletisim Hizmet AS sponsored ADR (d) | 779,553 | | 11,927,161 |
Turkiye Garanti Bankasi AS | 1,340,497,201 | | 3,575,615 |
TOTAL TURKEY | | 15,502,776 |
United Kingdom - 29.6% |
Amlin PLC | 1,962,000 | | 5,245,958 |
Axis Shield PLC (a) | 385,175 | | 1,422,712 |
BAE Systems PLC | 1,821,700 | | 7,975,769 |
BHP Billiton PLC | 339,700 | | 3,455,222 |
BP PLC | 124,700 | | 1,210,629 |
BP PLC sponsored ADR | 297,200 | | 17,311,900 |
BT Group PLC | 1,147,500 | | 3,955,432 |
Chaucer Holdings PLC | 1,573,900 | | 1,272,602 |
Corin Group PLC | 422,200 | | 2,657,306 |
Dixons Group PLC | 1,228,100 | | 3,876,085 |
Easynet Group PLC (a) | 818,400 | | 992,596 |
GlaxoSmithKline PLC sponsored ADR | 196,000 | | 8,310,400 |
HSBC Holdings PLC sponsored ADR (d) | 102,200 | | 8,281,266 |
Imperial Chemical Industries PLC | 721,400 | | 2,780,997 |
Invensys PLC (a) | 7,991,200 | | 2,239,467 |
ITV PLC | 1,326,959 | | 2,609,180 |
Maiden Group PLC | 175,500 | | 733,705 |
NDS Group PLC sponsored ADR (a) | 109,400 | | 2,862,998 |
Next PLC | 127,800 | | 3,922,023 |
Reuters Group PLC | 299,579 | | 2,041,058 |
Royal Bank of Scotland Group PLC | 145,100 | | 4,279,620 |
Scottish Power PLC | 549,900 | | 4,443,778 |
Shell Transport & Trading Co. PLC: | | | |
ADR | 148,000 | | 6,994,480 |
(Reg.) | 133,500 | | 1,051,535 |
Shire Pharmaceuticals Group PLC | 224,000 | | 2,120,533 |
Ted Baker PLC | 520,400 | | 4,719,405 |
Vodafone Group PLC | 4,012,200 | | 10,347,463 |
William Hill PLC | 237,700 | | 2,135,998 |
Wyevale Garden Centres PLC | 187,800 | | 1,223,417 |
TOTAL UNITED KINGDOM | | 120,473,534 |
United States of America - 1.7% |
Archer-Daniels-Midland Co. | 125,800 | | 2,436,746 |
|
| Shares | | Value (Note 1) |
Microsoft Corp. | 75,900 | | $2,124,441 |
Telewest Global, Inc. (a) | 180,461 | | 2,219,670 |
TOTAL UNITED STATES OF AMERICA | | 6,780,857 |
TOTAL COMMON STOCKS (Cost $327,896,747) | 373,494,152 |
Preferred Stocks - 1.4% |
| | | |
Convertible Preferred Stocks - 0.0% |
United Kingdom - 0.0% |
ITV PLC (a) | 193,482 | | 122,666 |
Nonconvertible Preferred Stocks - 1.4% |
Germany - 1.4% |
Fresenius AG | 24,700 | | 2,095,650 |
Fresenius Medical Care AG | 31,000 | | 1,696,716 |
Porsche AG (non-vtg.) | 2,832 | | 1,808,286 |
TOTAL GERMANY | | 5,600,652 |
TOTAL PREFERRED STOCKS (Cost $4,459,661) | 5,723,318 |
Money Market Funds - 10.7% |
| | | |
Fidelity Cash Central Fund, 1.79% (b) | 31,330,476 | | 31,330,476 |
Fidelity Securities Lending Cash Central Fund, 1.77% (b)(c) | 12,226,289 | | 12,226,289 |
TOTAL MONEY MARKET FUNDS (Cost $43,556,765) | 43,556,765 |
TOTAL INVESTMENT PORTFOLIO - 103.8% (Cost $375,913,173) | | 422,774,235 |
NET OTHER ASSETS - (3.8)% | | (15,412,343) |
NET ASSETS - 100% | $407,361,892 |
Legend |
(a)Non-income producing |
(b)Affiliated fund that is available only to investment companies and other accounts managed by Fidelity Investments. The rate quoted is the annualized seven-day yield of the fund at period end. A complete listing of the fund's holdings as of its most recent fiscal year end is available upon request. |
(c)Includes investment made with cash collateral received from securities on loan. |
(d)Security or a portion of the security is on loan at period end. |
Income Tax Information |
At October 31, 2004, the fund had a capital loss carryforward of approximately $18,785,000, all of which will expire on October 31, 2010. |
See accompanying notes which are an integral part of the financial statements.
Annual Report
Europe Capital Appreciation
Financial Statements
Statement of Assets and Liabilities
| October 31, 2004 |
| | |
Assets | | |
Investment in securities, at value (including securities loaned of $11,780,529) (cost $375,913,173) - See accompanying schedule | | $422,774,235 |
Receivable for investments sold | | 1,173,026 |
Receivable for fund shares sold | | 179,721 |
Dividends receivable | | 316,639 |
Interest receivable | | 25,736 |
Other affiliated receivables | | 94 |
Other receivables | | 170,626 |
Total assets | | 424,640,077 |
| | |
Liabilities | | |
Payable for investments purchased | $4,281,844 | |
Payable for fund shares redeemed | 335,322 | |
Accrued management fee | 239,917 | |
Other affiliated payables | 99,023 | |
Other payables and accrued expenses | 95,790 | |
Collateral on securities loaned, at value | 12,226,289 | |
Total liabilities | | 17,278,185 |
| | |
Net Assets | | $407,361,892 |
Net Assets consist of: | | |
Paid in capital | | $375,393,071 |
Undistributed net investment income | | 3,982,510 |
Accumulated undistributed net realized gain (loss) on investments and foreign currency transactions | | (18,882,220) |
Net unrealized appreciation (depreciation) on investments and assets and liabilities in foreign currencies | | 46,868,531 |
Net Assets, for 20,752,854 shares outstanding | | $407,361,892 |
Net Asset Value, offering price and redemption price per share ($407,361,892 ÷ 20,752,854 shares) | | $19.63 |
Statement of Operations
| Year ended October 31, 2004 |
| | |
Investment Income | | |
Dividends | | $7,713,784 |
Interest | | 503,160 |
Security lending | | 383,519 |
| | 8,600,463 |
Less foreign taxes withheld | | (903,918) |
Total income | | 7,696,545 |
| | |
Expenses | | |
Management fee
Basic fee | $3,037,679 | |
Performance adjustment | 531,955 | |
Transfer agent fees | 1,029,983 | |
Accounting and security lending fees | 222,451 | |
Non-interested trustees' compensation | 2,560 | |
Custodian fees and expenses | 175,603 | |
Registration fees | 24,662 | |
Audit | 48,602 | |
Legal | 1,138 | |
Miscellaneous | 28,327 | |
Total expenses before reductions | 5,102,960 | |
Expense reductions | (293,878) | 4,809,082 |
Net investment income (loss) | | 2,887,463 |
Realized and Unrealized Gain (Loss) Net realized gain (loss) on: | | |
Investment securities | 67,648,131 | |
Foreign currency transactions | 31,399 | |
Total net realized gain (loss) | | 67,679,530 |
Change in net unrealized appreciation (depreciation) on: Investment securities | (16,276,068) | |
Assets and liabilities in foreign currencies | (22,928) | |
Total change in net unrealized appreciation (depreciation) | | (16,298,996) |
Net gain (loss) | | 51,380,534 |
Net increase (decrease) in net assets resulting from operations | | $54,267,997 |
See accompanying notes which are an integral part of the financial statements.
Annual Report
Europe Capital Appreciation
Financial Statements - continued
Statement of Changes in Net Assets
| Year ended
October 31,
2004 | Year ended
October 31,
2003 |
Increase (Decrease) in Net Assets | | |
Operations | | |
Net investment income (loss) | $2,887,463 | $3,602,232 |
Net realized gain (loss) | 67,679,530 | 16,603,284 |
Change in net unrealized appreciation (depreciation) | (16,298,996) | 68,101,071 |
Net increase (decrease) in net assets resulting from operations | 54,267,997 | 88,306,587 |
Distributions to shareholders from net investment income | (4,908,750) | (5,760,355) |
Share transactions
Proceeds from sales of shares | 89,528,778 | 48,361,547 |
Reinvestment of distributions | 4,561,606 | 5,388,395 |
Cost of shares redeemed | (130,168,755) | (166,305,284) |
Net increase (decrease) in net assets resulting from share transactions | (36,078,371) | (112,555,342) |
Redemption fees | 65,769 | 18,274 |
Total increase (decrease) in net assets | 13,346,645 | (29,990,836) |
| | |
Net Assets | | |
Beginning of period | 394,015,247 | 424,006,083 |
End of period (including undistributed net investment income of $3,982,510 and undistributed net investment income of $3,962,064, respectively) | $407,361,892 | $394,015,247 |
Other Information Shares | | |
Sold | 4,555,418 | 3,432,677 |
Issued in reinvestment of distributions | 254,554 | 395,914 |
Redeemed | (6,880,267) | (11,609,649) |
Net increase (decrease) | (2,070,295) | (7,781,058) |
Financial Highlights
Years ended October 31, | 2004 | 2003 | 2002 | 2001 | 2000 |
Selected Per-Share Data | | | | | |
Net asset value, beginning of period | $17.26 | $13.85 | $15.43 | $19.58 | $18.64 |
Income from Investment Operations | | | | | |
Net investment income (loss) C | .13F | .14 | .19 | .16 | .14 |
Net realized and unrealized gain (loss) | 2.46 | 3.46 | (1.60) | (3.33) | 1.39 |
Total from investment operations | 2.59 | 3.60 | (1.41) | (3.17) | 1.53 |
Distributions from net investment income | (.22) | (.19) | (.17) | (.11) | (.13) |
Distributions from net realized gain | - | - | - | (.87) | (.47) |
Total distributions | (.22) | (.19) | (.17) | (.98) | (.60) |
Redemption fees added to paid in capital C | - E | - E | - E | - E | .01 |
Net asset value, end of period | $19.63 | $17.26 | $13.85 | $15.43 | $19.58 |
Total Return A, B | 15.13% | 26.36% | (9.29)% | (16.97)% | 8.19% |
Ratios to Average Net Assets D | | | | | |
Expenses before expense reductions | 1.22% | 1.39% | 1.37% | 1.26% | 1.09% |
Expenses net of voluntary waivers, if any | 1.22% | 1.39% | 1.37% | 1.26% | 1.09% |
Expenses net of all reductions | 1.15% | 1.32% | 1.32% | 1.21% | 1.04% |
Net investment income (loss) | .69%F | .94% | 1.18% | .90% | .68% |
Supplemental Data | | | | | |
Net assets, end of period (000 omitted) | $407,362 | $394,015 | $424,006 | $406,771 | $643,150 |
Portfolio turnover rate | 119% | 184% | 121% | 67% | 156% |
A Total returns would have been lower had certain expenses not been reduced during the periods shown. B Total returns do not include the effect of the former sales charges. C Calculated based on average shares outstanding during the period. D Expense ratios reflect operating expenses of the fund. Expenses before reductions do not reflect amounts reimbursed by the investment adviser or reductions from brokerage service arrangements or other expense offset arrangements and do not represent the amount paid by the fund during periods when reimbursements or reductions occur. Expenses net of any voluntary waivers reflect expenses after reimbursement by the investment adviser but prior to reductions from brokerage service arrangements or other expense offset arrangements. Expenses net of all reductions represent the net expenses paid by the fund. E Amount represents less than $.01 per share. F Net investment income per share includes approximately $.01 per share received as a result of a reorganization of an issuer that was in bankruptcy. Excluding this non-recurring amount, the ratio of net investment income to average net assets would have been .65%. |
See accompanying notes which are an integral part of the financial statements.
Annual Report
Japan
Performance: The Bottom Line
Average annual total return reflects the change in the value of an investment, assuming reinvestment of the fund's dividend income and capital gains (the profits earned upon the sale of securities that have grown in value) and assuming a constant rate of performance each year. The $10,000 table and the fund's returns do not reflect the deduction of taxes that a shareholder would pay on fund distributions or the redemption of fund shares. During periods of reimbursement by Fidelity, a fund's total returns will be greater than it would be had the reimbursement not occurred. How a fund did yesterday is no guarantee of how it will do tomorrow.
Average Annual Total Returns
Periods ended
October 31, 2004 | Past 1
year | Past 5
years | Past 10
years |
Fidelity Japan Fund | 4.03% | -7.24% | 0.96% |
$10,000 Over 10 Years
Let's say hypothetically that $10,000 was invested in Fidelity Japan Fund on October 31, 1994. The chart shows how the value of your investment would have grown, and also shows how the TOPIX did over the same period.
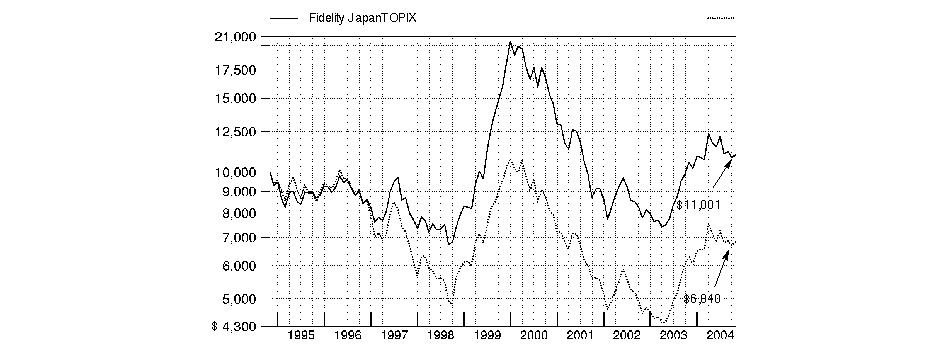
Annual Report
Japan
Management's Discussion of Fund Performance
Comments from Yoko Ishibashi, Portfolio Manager of Fidelity® Japan Fund
Most of the world's major stock markets posted solid gains for the year ending October 31, 2004. The Morgan Stanley Capital InternationalSM Europe, Australasia, Far East (MSCI® EAFE®) Index - designed to represent the performance of developed stock markets outside the United States and Canada - gained 19.00%, compared to 9.42% for the Standard & Poor's 500SM Index. A weak U.S. dollar relative to most foreign currencies was partly responsible for the performance disparity. On a regional basis, Europe was one of the top performers. Many investors felt European stocks offered better valuations and brighter earnings prospects than U.S. equities. Latin American countries, many of which are exporters of oil and materials that received strong support from high commodity prices, also did well. Conversely, Japan significantly underperformed, as early optimism was eroded by disappointing economic indicators and concerns about the impact of China's economic slowdown on exports. Meanwhile, technology-focused Asian emerging markets suffered due to a deceleration in corporate capital spending.
For the 12 months ending October 31, 2004, the fund returned 4.03%, trailing the 8.84% return of the Tokyo Stock Exchange Stock Price Index (TOPIX) and the 6.54% return of the LipperSM Japanese Funds Average. Holdings in the electrical machinery, transportation equipment and chemical industries detracted from performance compared with the index. For example, JSR - a manufacturer of synthetic rubber, resins and electronic materials - was a significant detractor compared with the index, as concerns about the outlook for the liquid crystal display (LCD) market mounted. Convenience store chain Lawson also struggled. Although Lawson fully committed itself to a restructuring program, the pace of execution failed to meet investors' expectations, and the company also lowered its mid-year earnings target. On the positive side, two banks - Mizuho Financial Group and Sumitomo Mitsui Financial Group - topped the list of contributors in absolute terms and also did well compared with the index. During the first half of the period, the banking sector was one of the strongest performers, supported by receding credit costs and improving profitability.
The views expressed in this statement reflect those of the portfolio manager only through the end of the period of the report as stated on the cover and do not necessarily represent the views of Fidelity or any other person in the Fidelity organization. Any such views are subject to change at any time based upon market or other conditions and Fidelity disclaims any responsibility to update such views. These views may not be relied on as investment advice and, because investment decisions for a Fidelity fund are based on numerous factors, may not be relied on as an indication of trading intent on behalf of any Fidelity fund.
Annual Report
Japan
Investment Changes
Geographic Diversification (% of fund's net assets) |
As of October 31, 2004 |
| Japan | 98.7% | |
| United States of America | 1.3% | |

Percentages are adjusted for the effect of futures contracts, if applicable. |
|
As of April 30, 2004 |
 | Japan | 97.7% | |
 | United States of America | 2.3% | |

Percentages are adjusted for the effect of futures contracts, if applicable. |
Asset Allocation |
| % of fund's
net assets | % of fund's net assets
6 months ago |
Stocks | 98.7 | 97.7 |
Short-Term Investments and Net Other Assets | 1.3 | 2.3 |
Top Ten Stocks as of October 31, 2004 |
| % of fund's
net assets | % of fund's net assets
6 months ago |
Toyota Motor Corp. (Automobiles) | 5.3 | 4.7 |
UFJ Holdings, Inc. (Commercial Banks) | 4.3 | 5.4 |
Sumitomo Mitsui Financial Group, Inc. (Commercial Banks) | 4.2 | 4.2 |
Mizuho Financial Group, Inc. (Commercial Banks) | 3.6 | 5.8 |
Konica Minolta Holdings, Inc. (Office Electronics) | 3.1 | 3.2 |
Casio Computer Co. Ltd. (Household Durables) | 2.9 | 1.7 |
Nintendo Co. Ltd. (Software) | 2.8 | 0.5 |
Ricoh Co. Ltd. (Office Electronics) | 2.6 | 2.2 |
Koyo Seiko Co. Ltd. (Machinery) | 2.5 | 2.1 |
Mitsubishi Heavy Industries Ltd. (Machinery) | 2.3 | 0.0 |
| 33.6 | |
Market Sectors as of October 31, 2004 |
| % of fund's
net assets | % of fund's net assets
6 months ago |
Consumer Discretionary | 32.2 | 28.6 |
Financials | 17.5 | 20.5 |
Information Technology | 16.1 | 17.2 |
Industrials | 13.3 | 12.4 |
Materials | 8.9 | 8.5 |
Energy | 4.5 | 1.5 |
Health Care | 4.4 | 4.9 |
Consumer Staples | 1.8 | 3.3 |
Telecommunication Services | 0.0 | 0.8 |
Annual Report
Japan
Investments October 31, 2004
Showing Percentage of Net Assets
Common Stocks - 98.7% |
| Shares | | Value (Note 1) |
CONSUMER DISCRETIONARY - 32.2% |
Auto Components - 2.7% |
Aisin Seiki Co. Ltd. | 175,000 | | $3,927,103 |
Bridgestone Corp. | 150,000 | | 2,721,217 |
Exedy Corp. | 213,500 | | 3,608,934 |
NOK Corp. | 73,400 | | 2,233,174 |
Press Kogyo Co. Ltd. (a)(d) | 555,000 | | 2,076,629 |
Riken Corp. | 232,000 | | 905,334 |
Stanley Electric Co. Ltd. (d) | 66,000 | | 1,019,606 |
Toyoda Gosei Co. Ltd. | 42,900 | | 818,803 |
| | 17,310,800 |
Automobiles - 9.0% |
Daihatsu Motor Co. Ltd. | 1,255,000 | | 9,367,884 |
Fuji Heavy Industries Ltd. (d) | 288,000 | | 1,401,427 |
Honda Motor Co. Ltd. | 1,300 | | 63,154 |
Mazda Motor Corp. (d) | 3,710,000 | | 11,007,134 |
Toyota Motor Corp. | 887,700 | | 34,438,316 |
Yamaha Motor Co. Ltd. | 132,800 | | 2,023,966 |
| | 58,301,881 |
Distributors - 0.3% |
VT Holdings Co. Ltd. (d) | 32,700 | | 330,600 |
VT Holdings Co. Ltd. New (a)(d) | 130,800 | | 1,340,936 |
| | 1,671,536 |
Hotels, Restaurants & Leisure - 0.6% |
Denny's Japan Co. Ltd. | 7,400 | | 131,310 |
H.I.S. Co. Ltd. | 58,800 | | 1,136,165 |
H.I.S. Co. Ltd. New (a) | 25,650 | | 484,717 |
Yoshinoya D&C Co. Ltd. (d) | 1,506 | | 2,390,589 |
| | 4,142,781 |
Household Durables - 6.9% |
Casio Computer Co. Ltd. (d) | 1,572,300 | | 18,703,885 |
Matsushita Electric Industrial Co. Ltd. | 853,000 | | 12,377,030 |
Sekisui Chemical Co. Ltd. | 1,504,000 | | 9,578,079 |
Sony Corp. | 1,500 | | 52,275 |
Sumitomo Forestry Co. Ltd. | 435,000 | | 4,126,612 |
| | 44,837,881 |
Internet & Catalog Retail - 1.1% |
Nissen Co. Ltd. | 67,700 | | 1,260,160 |
Rakuten, Inc. (d) | 732 | | 5,498,559 |
| | 6,758,719 |
Leisure Equipment & Products - 2.1% |
Fuji Photo Film Co. Ltd. | 295,700 | | 10,114,178 |
Mizuno Corp. | 433,000 | | 1,648,783 |
Nidec Copal Corp. (d) | 141,400 | | 1,889,163 |
| | 13,652,124 |
Multiline Retail - 3.8% |
Don Quijote Co. Ltd. (d) | 167,800 | | 10,083,696 |
|
| Shares | | Value (Note 1) |
Marui Co. Ltd. | 108,200 | | $1,358,698 |
The Daimaru, Inc. (d) | 1,798,000 | | 13,387,102 |
| | 24,829,496 |
Specialty Retail - 3.6% |
Autobacs Seven Co. Ltd. (d) | 56,100 | | 1,510,701 |
Fast Retailing Co. Ltd. | 11,500 | | 732,366 |
Homac Corp. | 63,100 | | 431,061 |
Nishimatsuya Chain Co. Ltd. | 5,000 | | 172,911 |
Otsuka Kagu Ltd. (d) | 308,300 | | 6,991,260 |
Toys R Us Japan Ltd. (d) | 224,300 | | 3,814,806 |
United Arrows Ltd. | 29,000 | | 675,438 |
Yamada Denki Co. Ltd. | 249,100 | | 8,849,776 |
| | 23,178,319 |
Textiles Apparel & Luxury Goods - 2.1% |
Onward Kashiyama Co. Ltd. | 912,000 | | 11,891,718 |
Renown D'urban Holdings, Inc. (a)(d) | 194,900 | | 1,758,676 |
| | 13,650,394 |
TOTAL CONSUMER DISCRETIONARY | | 208,333,931 |
CONSUMER STAPLES - 1.8% |
Food & Staples Retailing - 1.3% |
Matsumotokiyoshi Co. Ltd. (d) | 325,700 | | 8,201,356 |
Food Products - 0.3% |
Kibun Food Chemifa Co. Ltd. (d) | 96,300 | | 1,878,958 |
Household Products - 0.2% |
Uni-Charm Corp. | 25,800 | | 1,306,638 |
TOTAL CONSUMER STAPLES | | 11,386,952 |
ENERGY - 4.5% |
Oil & Gas - 4.5% |
Nippon Mining Holdings, Inc. | 3,064,500 | | 14,593,546 |
Nippon Oil Corp. | 2,321,000 | | 14,759,134 |
| | 29,352,680 |
FINANCIALS - 17.5% |
Capital Markets - 1.2% |
Mitsubishi Securities Co. Ltd. (d) | 858,000 | | 7,985,355 |
Commercial Banks - 13.8% |
Mitsui Trust Holdings, Inc. | 146,000 | | 1,005,660 |
Mizuho Financial Group, Inc. | 5,921 | | 22,881,740 |
Nishi-Nippon City Bank Ltd. (d) | 1,625,200 | | 7,232,666 |
Sumitomo Mitsui Financial Group, Inc. (d) | 4,210 | | 27,407,663 |
Tokyo Tomin Bank Ltd. | 125,200 | | 2,774,073 |
UFJ Holdings, Inc. (a) | 6,013 | | 27,952,908 |
| | 89,254,710 |
Consumer Finance - 0.6% |
SFCG Co. Ltd. | 18,610 | | 3,917,710 |
Common Stocks - continued |
| Shares | | Value (Note 1) |
FINANCIALS - continued |
Real Estate - 1.9% |
Mitsui Fudosan Co. Ltd. | 458,000 | | $4,868,427 |
Sumitomo Realty & Development Co. Ltd. | 678,000 | | 7,463,221 |
| | 12,331,648 |
TOTAL FINANCIALS | | 113,489,423 |
HEALTH CARE - 4.4% |
Health Care Equipment & Supplies - 0.0% |
Hogy Medical Co. | 4,100 | | 168,130 |
Terumo Corp. | 9,000 | | 224,500 |
| | 392,630 |
Pharmaceuticals - 4.4% |
Chugai Pharmaceutical Co. Ltd. | 4,200 | | 65,876 |
Fujisawa Pharmaceutical Co. Ltd. | 213,300 | | 5,582,662 |
Sankyo Co. Ltd. | 491,200 | | 10,210,611 |
Takeda Pharamaceutical Co. Ltd. | 98,500 | | 4,765,153 |
Yamanouchi Pharmaceutical Co. Ltd. | 211,900 | | 7,788,454 |
| | 28,412,756 |
TOTAL HEALTH CARE | | 28,805,386 |
INDUSTRIALS - 13.3% |
Building Products - 2.3% |
Asahi Glass Co. Ltd. | 61,000 | | 561,383 |
Daikin Industries Ltd. | 259,200 | | 6,318,666 |
Js Group Corp. | 247,700 | | 4,414,061 |
Toto Ltd. | 380,000 | | 3,410,970 |
| | 14,705,080 |
Commercial Services & Supplies - 1.3% |
Diamond Lease Co. Ltd. | 140,300 | | 5,024,207 |
Riso Kyoiku Co. Ltd. (d) | 2,141 | | 1,136,904 |
Riso Kyoiku Co. Ltd. New (a)(d) | 4,282 | | 2,103,879 |
| | 8,264,990 |
Construction & Engineering - 0.5% |
Kajima Corp. | 838,000 | | 3,167,194 |
Electrical Equipment - 0.0% |
Fujikura Ltd. | 15,000 | | 66,046 |
Machinery - 7.5% |
Hino Motors Ltd. (d) | 1,644,000 | | 10,966,731 |
Koyo Seiko Co. Ltd. (d) | 1,408,000 | | 15,911,258 |
Kubota Corp. | 1,453,000 | | 6,631,067 |
Mitsubishi Heavy Industries Ltd. | 5,335,000 | | 15,021,779 |
Nikkiso Co. Ltd. | 36,000 | | 180,281 |
| | 48,711,116 |
Marine - 0.4% |
Mitsui O.S.K. Lines Ltd. | 435,000 | | 2,581,188 |
|
| Shares | | Value (Note 1) |
Road & Rail - 0.3% |
East Japan Railway Co. | 219 | | $1,152,577 |
Fukuyama Transporting Co. Ltd. | 210,000 | | 839,325 |
| | 1,991,902 |
Trading Companies & Distributors - 1.0% |
Itochu Corp. (a) | 1,439,000 | | 6,200,066 |
Transportation Infrastructure - 0.0% |
Kamigumi Co. Ltd. | 45,000 | | 319,743 |
TOTAL INDUSTRIALS | | 86,007,325 |
INFORMATION TECHNOLOGY - 16.1% |
Communications Equipment - 0.4% |
Japan Radio Co. Ltd. (a)(d) | 660,000 | | 2,587,991 |
Computers & Peripherals - 1.5% |
Fujitsu Ltd. | 1,684,000 | | 10,040,195 |
Electronic Equipment & Instruments - 4.1% |
Hoya Corp. | 12,000 | | 1,233,618 |
Murata Manufacturing Co. Ltd. | 12,700 | | 605,990 |
Nidec Corp. | 23,400 | | 2,538,215 |
Nippon Chemi-con Corp. | 279,000 | | 1,365,541 |
Nippon Electric Glass Co. Ltd. | 456,000 | | 10,189,824 |
Omron Corp. | 7,600 | | 172,703 |
Yokogawa Electric Corp. | 806,000 | | 10,524,798 |
| | 26,630,689 |
Office Electronics - 5.8% |
Canon, Inc. | 12,700 | | 628,650 |
Konica Minolta Holdings, Inc. | 1,521,000 | | 20,321,198 |
Ricoh Co. Ltd. | 889,000 | | 16,631,738 |
| | 37,581,586 |
Semiconductors & Semiconductor Equipment - 1.5% |
Rohm Co. Ltd. | 9,000 | | 925,214 |
Sanken Electric Co. Ltd. | 726,000 | | 8,492,351 |
| | 9,417,565 |
Software - 2.8% |
Nintendo Co. Ltd. | 160,400 | | 18,126,177 |
TOTAL INFORMATION TECHNOLOGY | | 104,384,203 |
MATERIALS - 8.9% |
Chemicals - 5.5% |
JSR Corp. | 19,500 | | 355,232 |
Kaneka Corp. | 197,000 | | 2,056,834 |
Mitsubishi Gas Chemical Co., Inc. | 1,612,000 | | 6,914,990 |
Nissan Chemical Industries Co. Ltd. | 413,000 | | 3,359,881 |
Nitto Denko Corp. | 28,100 | | 1,335,503 |
Teijin Ltd. | 3,839,000 | | 14,944,659 |
Toray Industries, Inc. | 1,381,000 | | 6,459,064 |
| | 35,426,163 |
Containers & Packaging - 0.3% |
Fuji Seal International, Inc. | 45,700 | | 1,964,709 |
Common Stocks - continued |
| Shares | | Value (Note 1) |
MATERIALS - continued |
Metals & Mining - 3.1% |
Nippon Steel Corp. | 1,393,000 | | $3,264,175 |
Sumitomo Metal Industries Ltd. | 9,274,000 | | 11,216,252 |
Sumitomo Titanium Corp. | 37,300 | | 1,783,323 |
Toho Titanium Co. Ltd. | 163,000 | | 3,665,517 |
| | 19,929,267 |
TOTAL MATERIALS | | 57,320,139 |
TELECOMMUNICATION SERVICES - 0.0% |
Wireless Telecommunication Services - 0.0% |
KDDI Corp. | 13 | | 62,645 |
NTT DoCoMo, Inc. | 5 | | 8,835 |
NTT DoCoMo, Inc. (e) | 28 | | 49,473 |
| | 120,953 |
TOTAL COMMON STOCKS (Cost $609,354,185) | 639,200,992 |
Money Market Funds - 14.7% |
| | | |
Fidelity Cash Central Fund, 1.79% (b) | 1,527,099 | | 1,527,099 |
Fidelity Securities Lending Cash Central Fund, 1.77% (b)(c) | 93,173,088 | | 93,173,088 |
TOTAL MONEY MARKET FUNDS (Cost $94,700,187) | 94,700,187 |
TOTAL INVESTMENT PORTFOLIO - 113.4% (Cost $704,054,372) | | 733,901,179 |
NET OTHER ASSETS - (13.4)% | | (86,448,257) |
NET ASSETS - 100% | $647,452,922 |
Legend |
(a)Non-income producing |
(b)Affiliated fund that is available only to investment companies and other accounts managed by Fidelity Investments. The rate quoted is the annualized seven-day yield of the fund at period end. A complete listing of the fund's holdings as of its most recent fiscal year end is available upon request. |
(c)Includes investment made with cash collateral received from securities on loan. |
(d)Security or a portion of the security is on loan at period end. |
(e)Security exempt from registration under Rule 144A of the Securities Act of 1933. These securities may be resold in transactions exempt from registration, normally to qualified institutional buyers. At the period end, the value of these securities amounted to $49,473 or 0.0% of net assets. |
Income Tax Information |
At October 31, 2004, the fund had a capital loss carryforward of approximately $72,544,000 of which $60,133,000 and $12,411,000 will expire on October 31, 2010 and 2011, respectively. |
See accompanying notes which are an integral part of the financial statements.
Annual Report
Japan
Financial Statements
Statement of Assets and Liabilities
| October 31, 2004 |
| | |
Assets | | |
Investment in securities, at value (including securities loaned of $88,264,212) (cost $704,054,372) - See accompanying schedule | | $733,901,179 |
Receivable for investments sold | | 5,231,640 |
Receivable for fund shares sold | | 3,495,317 |
Dividends receivable | | 1,822,604 |
Interest receivable | | 9,024 |
Other affiliated receivables | | 8,084 |
Other receivables | | 123,293 |
Total assets | | 744,591,141 |
| | |
Liabilities | | |
Payable for investments purchased | $2,667,228 | |
Payable for fund shares redeemed | 643,322 | |
Accrued management fee | 379,788 | |
Other affiliated payables | 160,394 | |
Other payables and accrued expenses | 114,399 | |
Collateral on securities loaned, at value | 93,173,088 | |
Total liabilities | | 97,138,219 |
| | |
Net Assets | | $647,452,922 |
Net Assets consist of: | | |
Paid in capital | | $691,330,645 |
Accumulated net investment loss | | (826,233) |
Accumulated undistributed net realized gain (loss) on investments and foreign currency transactions | | (72,975,057) |
Net unrealized appreciation (depreciation) on investments and assets and liabilities in foreign currencies | | 29,923,567 |
Net Assets, for 55,651,737 shares outstanding | | $647,452,922 |
Net Asset Value, offering price and redemption price per share ($647,452,922 ÷ 55,651,737 shares) | | $11.63 |
Statement of Operations
| Year ended October 31, 2004 |
| | |
Investment Income | | |
Dividends | | $5,144,768 |
Interest | | 95,823 |
Security lending | | 1,246,310 |
| | 6,486,901 |
Less foreign taxes withheld | | (360,927) |
Total income | | 6,125,974 |
| | |
Expenses | | |
Management fee
Basic fee | $4,450,371 | |
Performance adjustment | (319,897) | |
Transfer agent fees | 1,561,992 | |
Accounting and security lending fees | 323,062 | |
Non-interested trustees' compensation | 3,733 | |
Custodian fees and expenses | 246,347 | |
Registration fees | 44,237 | |
Audit | 54,325 | |
Legal | 2,144 | |
Miscellaneous | 31,322 | |
Total expenses before reductions | 6,397,636 | |
Expense reductions | (2,096) | 6,395,540 |
Net investment income (loss) | | (269,566) |
Realized and Unrealized Gain (Loss) Net realized gain (loss) on: | | |
Investment securities | 78,634,703 | |
Foreign currency transactions | (142,700) | |
Total net realized gain (loss) | | 78,492,003 |
Change in net unrealized appreciation (depreciation) on: Investment securities | (67,374,778) | |
Assets and liabilities in foreign currencies | 41,294 | |
Total change in net unrealized appreciation (depreciation) | | (67,333,484) |
Net gain (loss) | | 11,158,519 |
Net increase (decrease) in net assets resulting from operations | | $10,888,953 |
See accompanying notes which are an integral part of the financial statements.
Annual Report
Japan
Financial Statements - continued
Statement of Changes in Net Assets
| Year ended
October 31,
2004 | Year ended
October 31,
2003 |
Increase (Decrease) in Net Assets | | |
Operations | | |
Net investment income (loss) | $(269,566) | $(149,235) |
Net realized gain (loss) | 78,492,003 | (11,585,942) |
Change in net unrealized appreciation (depreciation) | (67,333,484) | 138,486,482 |
Net increase (decrease) in net assets resulting from operations | 10,888,953 | 126,751,305 |
Distributions to shareholders from net investment income | (461,710) | - |
Share transactions
Proceeds from sales of shares | 285,965,451 | 217,644,017 |
Reinvestment of distributions | 397,157 | - |
Cost of shares redeemed | (179,346,914) | (98,660,885) |
Net increase (decrease) in net assets resulting from share transactions | 107,015,694 | 118,983,132 |
Redemption fees | 658,140 | 324,669 |
Total increase (decrease) in net assets | 118,101,077 | 246,059,106 |
| | |
Net Assets | | |
Beginning of period | 529,351,845 | 283,292,739 |
End of period (including accumulated net investment loss of $826,233 and accumulated net investment loss of $121,904, respectively) | $647,452,922 | $529,351,845 |
Other Information Shares | | |
Sold | 23,920,101 | 23,290,337 |
Issued in reinvestment of distributions | 35,942 | - |
Redeemed | (15,630,288) | (10,323,638) |
Net increase (decrease) | 8,325,755 | 12,966,699 |
Financial Highlights
Years ended October 31, | 2004 | 2003 | 2002 | 2001 | 2000 |
Selected Per-Share Data | | | | | |
Net asset value, beginning of period | $11.19 | $8.25 | $9.67 | $20.43 | $21.77 |
Income from Investment Operations | | | | | |
Net investment income (loss) C | (.01) | - E | (.07) | (.07) | (.14) |
Net realized and unrealized gain (loss) | .45 | 2.93 | (1.37) | (6.64) | (.81) |
Total from investment operations | .44 | 2.93 | (1.44) | (6.71) | (.95) |
Distributions from net investment income | (.01) | - | - | - | (.30) |
Distributions in excess of net investment income | - | - | - | - | (.16) |
Distributions from net realized gain | - | - | - | (4.07) | - |
Total distributions | (.01) | - | - | (4.07) | (.46) |
Redemption fees added to paid in capital C | .01 | .01 | .02 | .02 | .07 |
Net asset value, end of period | $11.63 | $11.19 | $8.25 | $9.67 | $20.43 |
Total Return A, B | 4.03% | 35.64% | (14.68)% | (40.35)% | (4.35)% |
Ratios to Average Net Assets D | | | | | |
Expenses before expense reductions | 1.04% | 1.03% | 1.50% | 1.42% | 1.17% |
Expenses net of voluntary waivers, if any | 1.04% | 1.03% | 1.50% | 1.42% | 1.17% |
Expenses net of all reductions | 1.04% | 1.03% | 1.50% | 1.40% | 1.16% |
Net investment income (loss) | (.04)% | (.04)% | (.77)% | (.57)% | (.58)% |
Supplemental Data | | | | | |
Net assets, end of period (000 omitted) | $647,453 | $529,352 | $283,293 | $322,936 | $623,950 |
Portfolio turnover rate | 99% | 86% | 66% | 75% | 124% |
A Total returns would have been lower had certain expenses not been reduced during the periods shown. B Total returns do not include the effect of the former sales charges. C Calculated based on average shares outstanding during the period. D Expense ratios reflect operating expenses of the fund. Expenses before reductions do not reflect amounts reimbursed by the investment adviser or reductions from brokerage service arrangements or other expense offset arrangements and do not represent the amount paid by the fund during periods when reimbursements or reductions occur. Expenses net of any voluntary waivers reflect expenses after reimbursement by the investment adviser but prior to reductions from brokerage service arrangements or other expense offset arrangements. Expenses net of all reductions represent the net expenses paid by the fund. E Amount represents less than $.01 per share. |
See accompanying notes which are an integral part of the financial statements.
Annual Report
Japan Smaller Companies
Performance: The Bottom Line
Average annual total return reflects the change in the value of an investment, assuming reinvestment of the fund's dividend income and capital gains (the profits earned upon the sale of securities that have grown in value) and assuming a constant rate of performance each year. The $10,000 table and the fund's returns do not reflect the deduction of taxes that a shareholder would pay on fund distributions or the redemption of fund shares. During periods of reimbursement by Fidelity, a fund's total returns will be greater than it would be had the reimbursement not occurred. How a fund did yesterday is no guarantee of how it will do tomorrow.
Average Annual Total Returns
Periods ended
October 31, 2004 | Past 1
year | Past 5
years | Life of
fundA |
Fidelity Japan Smaller Companies Fund | 12.12% | -2.97% | 6.61% |
A From November 1, 1995
$10,000 Over Life of Fund
Let's say hypothetically that $10,000 was invested in Fidelity Japan Smaller Companies Fund on November 1, 1995, when the fund started. The chart shows how the value of your investment would have grown, and also shows how the Russell/Nomura Small Cap Index did over the same period.
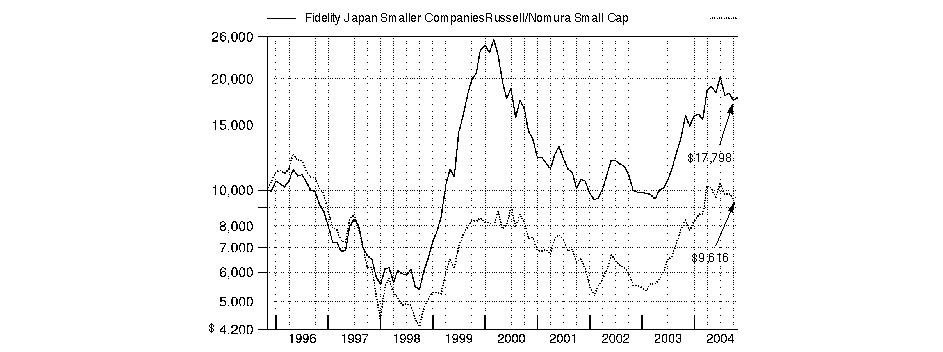
Annual Report
Japan Smaller Companies
Management's Discussion of Fund Performance
Comments from Kenichi Mizushita, Portfolio Manager of Fidelity® Japan Smaller Companies Fund
Most of the world's major stock markets posted solid gains for the year ending October 31, 2004. The Morgan Stanley Capital InternationalSM Europe, Australasia, Far East Index - designed to represent the performance of developed stock markets outside the United States and Canada - gained 19.00%, compared to 9.42% for the Standard & Poor's 500SM Index. A weak U.S. dollar relative to most foreign currencies was partly responsible for the performance disparity. On a regional basis, Europe was one of the top performers. Many investors felt European stocks offered better valuations and brighter earnings prospects than U.S. equities. Latin American countries, many of which are exporters of oil and materials that received strong support from high commodity prices, also did well. Conversely, Japan significantly underperformed, as early optimism was eroded by disappointing economic indicators and concerns about the impact of China's economic slowdown on exports. Meanwhile, technology-focused Asian emerging markets suffered due to a deceleration in corporate capital spending.
For the 12-month period ending October 31, 2004, the fund returned 12.12%. By comparison, the Russell/Nomura Small CapTM Index was up 15.81% and the LipperSM Japanese Funds Average rose 6.54%. The fund's underperformance versus its benchmark was due largely to unrewarding stock selection in the technology sector. I suspect its outperformance of its peer average reflected its bias toward small-cap stocks, which outperformed both the large-cap-oriented Lipper peer group and the broader market. Holdings contributing to performance included Matsushita Electric Works Information Systems, which provides systems solutions and packaged software. The company benefited from growing demand for enterprise resource planning and procurement systems from the manufacturing sector. I sold the stock to lock in profits. Telewave, which sells telephones and fax machines, also helped. The company's business model successfully targeted a niche market and generated stable cash flow. On the downside, Toyoda Gosei, a producer of light-emitting diodes for display panels for cellular phones and digital cameras, suffered from a deterioration in the pricing environment. NOK, the world's leading maker of oil seals for automobiles, also detracted. After diversifying into the production of flexible printed circuit boards used in digital cameras and cellular phones, NOK's share price fell as concerns about downward inventory adjustments made by mobile phone makers triggered a sell-off.
The views expressed in this statement reflect those of the portfolio manager only through the end of the period of the report as stated on the cover and do not necessarily represent the views of Fidelity or any other person in the Fidelity organization. Any such views are subject to change at any time based upon market or other conditions and Fidelity disclaims any responsibility to update such views. These views may not be relied on as investment advice and, because investment decisions for a Fidelity fund are based on numerous factors, may not be relied on as an indication of trading intent on behalf of any Fidelity fund.
Annual Report
Japan Smaller Companies
Investment Changes
Geographic Diversification (% of fund's net assets) |
As of October 31, 2004 |
| Japan | 94.9% | |
| United States of America | 5.1% | |

Percentages are adjusted for the effect of futures contracts, if applicable. |
|
As of April 30, 2004 |
| Japan | 91.7% | |
| United States of America | 8.3% | |

Percentages are adjusted for the effect of futures contracts, if applicable. |
Asset Allocation |
| % of fund's
net assets | % of fund's net assets
6 months ago |
Stocks | 94.9 | 91.7 |
Short-Term Investments and Net Other Assets | 5.1 | 8.3 |
Top Ten Stocks as of October 31, 2004 |
| % of fund's
net assets | % of fund's net assets
6 months ago |
USS Co. Ltd. (Specialty Retail) | 3.5 | 3.7 |
NOK Corp. (Auto Components) | 2.6 | 3.4 |
Hikari Tsushin, Inc. (Specialty Retail) | 2.3 | 0.0 |
Nexus Co. Ltd. (Wireless Telecommunication Services) | 2.3 | 0.0 |
Nippon Electric Glass Co. Ltd. (Electronic Equipment & Instruments) | 1.9 | 1.8 |
Tokyo Steel Manufacturing Co. Ltd. (Metals & Mining) | 1.9 | 1.8 |
Sammy NetWorks Co. Ltd. (Wireless Telecommunication Services) | 1.8 | 0.0 |
Reins International, Inc. (Hotels, Restaurants & Leisure) | 1.7 | 2.4 |
Koyo Seiko Co. Ltd. (Machinery) | 1.6 | 0.3 |
Nishimatsuya Chain Co. Ltd. (Specialty Retail) | 1.6 | 1.7 |
| 21.2 | |
Market Sectors as of October 31, 2004 |
| % of fund's
net assets | % of fund's net assets
6 months ago |
Consumer Discretionary | 22.8 | 27.1 |
Industrials | 20.9 | 15.8 |
Information Technology | 20.2 | 24.5 |
Materials | 12.6 | 12.2 |
Financials | 7.7 | 7.2 |
Telecommunication Services | 4.3 | 0.2 |
Health Care | 3.8 | 3.4 |
Consumer Staples | 1.8 | 1.1 |
Energy | 0.8 | 0.2 |
Annual Report
Japan Smaller Companies
Investments October 31, 2004
Showing Percentage of Net Assets
Common Stocks - 94.9% |
| Shares | | Value (Note 1) |
CONSUMER DISCRETIONARY - 22.8% |
Auto Components - 5.1% |
Alpha Corp. | 12,400 | | $480,370 |
Fine Sinter Co. Ltd. | 465,000 | | 1,476,260 |
Fuji Kiko Co. Ltd. | 1,664,000 | | 7,546,842 |
Imasen Electric Industrial Co. Ltd. | 109,700 | | 904,881 |
NHK Spring Co. Ltd. (c) | 1,683,000 | | 11,640,346 |
Nissin Kogyo Co. Ltd. | 104,600 | | 3,083,592 |
Nittan Valve Co. Ltd. | 57,000 | | 333,916 |
NOK Corp. | 1,106,600 | | 33,667,992 |
Pacific Industrial Co. Ltd. (c) | 293,000 | | 1,445,136 |
Suncall Corp. | 195,000 | | 1,022,582 |
Teikoku Piston Ring Co. Ltd. (c) | 272,000 | | 2,408,126 |
Unipres Corp. | 99,300 | | 786,256 |
| | 64,796,299 |
Automobiles - 0.5% |
Yamaha Motor Co. Ltd. | 401,700 | | 6,122,191 |
Distributors - 0.4% |
Crymson Co. Ltd. | 1,107 | | 2,614,919 |
Nippi, Inc. | 8,000 | | 39,231 |
Ohashi Technica, Inc. (c) | 97,700 | | 2,003,203 |
| | 4,657,353 |
Hotels, Restaurants & Leisure - 2.6% |
H.I.S. Co. Ltd. (c) | 349,900 | | 6,760,953 |
H.I.S. Co. Ltd. New (a) | 174,950 | | 3,306,090 |
Kazokutei Co. Ltd. | 94,000 | | 419,219 |
Kyoritsu Maintenance Co. Ltd. (c) | 31,800 | | 671,545 |
Reins International, Inc. (c) | 5,515 | | 21,625,407 |
| | 32,783,214 |
Household Durables - 0.6% |
Funai Electric Co. Ltd. | 21,000 | | 2,750,130 |
Japan General Estate Co. Ltd. (c) | 283,900 | | 2,956,090 |
Sanko Soflan Co., Inc. | 450,000 | | 2,287,523 |
| | 7,993,743 |
Internet & Catalog Retail - 0.6% |
Nissen Co. Ltd. | 169,300 | | 3,151,330 |
Prime Network, Inc. | 2,154 | | 2,320,178 |
Rakuten, Inc. (c) | 376 | | 2,824,396 |
| | 8,295,904 |
Leisure Equipment & Products - 0.6% |
Asahi Co. Ltd. (a) | 600 | | 22,677 |
Endo Manufacturing Co. Ltd. | 384,000 | | 2,031,842 |
Kimoto Co. Ltd. | 200,000 | | 2,078,707 |
Nidec Copal Corp. (c) | 224,400 | | 2,998,078 |
Pentax Corp. (c) | 80,000 | | 263,051 |
| | 7,394,355 |
Media - 0.6% |
Cyber Agent Ltd. New (a) | 17 | | 49,473 |
|
| Shares | | Value (Note 1) |
SKY Perfect Communications, Inc. | 1,958 | | $2,386,564 |
Usen Corp. (a)(c) | 304,995 | | 5,850,048 |
| | 8,286,085 |
Multiline Retail - 0.7% |
Don Quijote Co. Ltd. (c) | 140,600 | | 8,449,152 |
Specialty Retail - 10.7% |
Arc Land Sakamoto Co. Ltd. | 644,500 | | 8,702,135 |
Culture Convenience Club Co. Ltd. (c) | 989,400 | | 12,340,039 |
Hikari Tsushin, Inc. (c) | 485,600 | | 29,089,658 |
Ninety-Nine Plus, Inc. | 453 | | 8,004,063 |
Nishimatsuya Chain Co. Ltd. | 586,000 | | 20,265,129 |
Pal Co. Ltd. (c) | 139,100 | | 2,499,818 |
Top Culture Co. Ltd. | 424,200 | | 2,597,266 |
USS Co. Ltd. | 547,630 | | 44,344,395 |
Yamada Denki Co. Ltd. | 251,000 | | 8,917,277 |
| | 136,759,780 |
Textiles Apparel & Luxury Goods - 0.4% |
Fuji Spinning Co. Ltd. (a) | 2,287,000 | | 2,895,621 |
Seiren Co. Ltd. (c) | 198,000 | | 1,440,544 |
Workman Co. Ltd. | 72,000 | | 1,503,472 |
| | 5,839,637 |
TOTAL CONSUMER DISCRETIONARY | | 291,377,713 |
CONSUMER STAPLES - 1.8% |
Food & Staples Retailing - 0.7% |
Frente Co. Ltd. | 77,600 | | 3,534,105 |
Kraft, Inc. | 142,000 | | 2,160,155 |
Plant Co. Ltd. | 222,300 | | 3,045,637 |
| | 8,739,897 |
Food Products - 0.7% |
Kameda Seika Co. Ltd. | 56,000 | | 476,742 |
Kibun Food Chemifa Co. Ltd. (c) | 234,000 | | 4,565,692 |
Nippon Suisan Kaisha Co. Ltd. | 494,000 | | 1,572,996 |
Pickles Corp. | 216,000 | | 826,570 |
Warabeya Nichiyo Co. Ltd. | 120,000 | | 2,153,163 |
| | 9,595,163 |
Household Products - 0.2% |
Pigeon Corp. | 164,400 | | 2,494,698 |
Personal Products - 0.2% |
Fancl Corp. | 80,000 | | 2,947,985 |
TOTAL CONSUMER STAPLES | | 23,777,743 |
ENERGY - 0.8% |
Oil & Gas - 0.8% |
Itochu Enex Co. Ltd. | 200,000 | | 1,230,217 |
Nippon Mining Holdings, Inc. | 2,000,000 | | 9,524,259 |
| | 10,754,476 |
Common Stocks - continued |
| Shares | | Value (Note 1) |
FINANCIALS - 7.7% |
Capital Markets - 2.0% |
Kobayashi Yoko Co. Ltd. | 37,400 | | $742,098 |
Matsui Securities Co. Ltd. (c) | 263,400 | | 6,993,471 |
Mitsubishi Securities Co. Ltd. (c) | 1,172,000 | | 10,907,734 |
Okato Shoji Co. Ltd. | 49,000 | | 263,901 |
SMBC Friend Securities Co. Ltd. | 1,080,500 | | 6,850,432 |
| | 25,757,636 |
Commercial Banks - 3.4% |
Bank of Yokohama Ltd. | 2,133,000 | | 12,777,644 |
Chiba Bank Ltd. | 832,000 | | 5,353,541 |
Mitsui Trust Holdings, Inc. | 2,287,000 | | 15,753,040 |
Nishi-Nippon City Bank Ltd. | 2,205,000 | | 9,812,963 |
| | 43,697,188 |
Consumer Finance - 0.6% |
SFCG Co. Ltd. | 16,650 | | 3,505,098 |
STB Leasing Co. Ltd. (c) | 202,800 | | 4,273,104 |
| | 7,778,202 |
Diversified Financial Services - 0.1% |
ACE Koeki Co. Ltd. | 74,000 | | 393,650 |
Yutaka Shoji Co. Ltd. | 50,000 | | 314,168 |
| | 707,818 |
Real Estate - 1.6% |
Apamanshop Co. Ltd. (c) | 5,215 | | 3,882,856 |
Apamanshop Co. Ltd. New (a)(c) | 5,215 | | 3,882,856 |
Diamond City Co. Ltd. (c) | 237,000 | | 6,594,841 |
Kennedy-Wilson Japan Co. Ltd. (a)(c) | 394 | | 1,541,229 |
Relo Holdings Corp. | 187,100 | | 4,242,831 |
| | 20,144,613 |
TOTAL FINANCIALS | | 98,085,457 |
HEALTH CARE - 3.8% |
Health Care Equipment & Supplies - 2.0% |
A&T Corp. | 100,000 | | 542,354 |
Asahi Intecc Co. Ltd. | 48,300 | | 1,747,900 |
Hogy Medical Co. (c) | 396,300 | | 16,251,164 |
Japan Medical Dynamic Marketing, Inc. (c) | 266,300 | | 2,742,637 |
Nakanishi, Inc. | 65,200 | | 4,324,694 |
| | 25,608,749 |
Health Care Providers & Services - 0.2% |
AS One Corp. | 12,900 | | 374,196 |
Hoshiiryou Sanki Co. Ltd. | 78,000 | | 1,473,993 |
| | 1,848,189 |
Pharmaceuticals - 1.6% |
Fuji Pharmaceutical Co. Ltd. | 220,000 | | 2,743,894 |
|
| Shares | | Value (Note 1) |
Nihon Chouzai Co. Ltd. (a) | 236,200 | | $9,373,459 |
Sawai Pharmaceutical Co. Ltd. (c) | 285,700 | | 8,530,373 |
| | 20,647,726 |
TOTAL HEALTH CARE | | 48,104,664 |
INDUSTRIALS - 20.9% |
Air Freight & Logistics - 1.0% |
Kintetsu World Express, Inc. (c) | 330,000 | | 6,282,893 |
Yusen Air & Sea Service Co. Ltd. | 199,500 | | 6,691,784 |
| | 12,974,677 |
Commercial Services & Supplies - 4.4% |
AJIS Co. Ltd. | 33,500 | | 553,928 |
ARRK Corp. | 363,600 | | 13,536,014 |
Diamond Lease Co. Ltd. | 84,800 | | 3,036,727 |
Fullcast Co. Ltd. | 1,117 | | 2,311,362 |
Human Holdings Co. Ltd. (a) | 11 | | 42,614 |
IBJ Leasing Co. Ltd. (a) | 404,300 | | 5,997,553 |
Ichinen Co. Ltd. | 98,500 | | 744,555 |
Intelligence Ltd. (c) | 1,821 | | 1,806,633 |
Nisca Corp. | 100,000 | | 2,456,654 |
Okamura Corp. | 374,000 | | 2,639,751 |
Secom Techno Service Co. Ltd. (c) | 50,000 | | 1,771,626 |
Studio Alice Co. Ltd. | 506,600 | | 10,506,798 |
Sumisho Lease Co. Ltd. | 155,200 | | 6,012,378 |
Take & Give Needs Co. Ltd. New (a)(c) | 3,483 | | 3,488,430 |
Toppan Printing Co. Ltd. | 97,000 | | 938,518 |
| | 55,843,541 |
Construction & Engineering - 1.4% |
Token Corp. | 400,000 | | 17,914,678 |
Electrical Equipment - 2.2% |
Chiyoda Integre Co. Ltd. (d) | 801,960 | | 14,601,757 |
Endo Lighting Corp. | 294,000 | | 1,972,315 |
Fujikura Ltd. | 1,829,000 | | 8,053,234 |
Iwabuchi Corp. | 250,000 | | 1,414,938 |
Sansha Electric Manufacturing Co. Ltd. | 205,000 | | 1,359,758 |
Toyo Electric Manufacturing Co. Ltd. | 321,000 | | 982,699 |
| | 28,384,701 |
Machinery - 7.7% |
Harmonic Drive Systems, Inc. (c) | 130 | | 859,829 |
Ihara Science Corp. | 66,000 | | 548,779 |
Kitz Corp. (c) | 2,220,000 | | 12,774,413 |
Koyo Seiko Co. Ltd. (c) | 1,865,000 | | 21,075,636 |
Kubota Corp. | 2,155,000 | | 9,834,790 |
Nihon Trim Co. Ltd. (c) | 93,200 | | 6,437,303 |
Nitta Corp. | 800,000 | | 11,595,408 |
NTN Corp. (c) | 3,571,000 | | 18,793,849 |
Obara Corp. | 67,100 | | 1,445,533 |
Oiles Corp. | 37,700 | | 831,762 |
OSG Corp. Co. Ltd. | 77,600 | | 542,580 |
Shicoh Engineering Co. Ltd. (a)(c) | 82 | | 2,595,550 |
Common Stocks - continued |
| Shares | | Value (Note 1) |
INDUSTRIALS - continued |
Machinery - continued |
Tadano Ltd. | 500,000 | | $2,437,757 |
THK Co. Ltd. (c) | 508,000 | | 8,841,461 |
| | 98,614,650 |
Marine - 0.8% |
Mitsui O.S.K. Lines Ltd. | 1,608,000 | | 9,541,494 |
Road & Rail - 0.9% |
Hamakyorex Co. Ltd. | 345,000 | | 11,409,269 |
Trading Companies & Distributors - 2.5% |
Hanwa Co. Ltd. | 4,384,000 | | 17,314,801 |
JFE Shoji Holdings, Inc. (a)(c) | 3,000,000 | | 14,598,195 |
Shinwa Co. Ltd. | 27,240 | | 401,516 |
| | 32,314,512 |
TOTAL INDUSTRIALS | | 266,997,522 |
INFORMATION TECHNOLOGY - 20.2% |
Communications Equipment - 0.7% |
Japan Radio Co. Ltd. (a)(c) | 167,000 | | 654,840 |
Tamura Taiko Holdings, Inc. (a) | 1,548,000 | | 7,591,175 |
| | 8,246,015 |
Computers & Peripherals - 0.9% |
Meiko Electronics Co. Ltd. (c) | 505,900 | | 11,519,998 |
Electronic Equipment & Instruments - 9.3% |
A&D Co. Ltd. | 147,000 | | 1,444,513 |
Arisawa Manufacturing Co. Ltd. | 306,300 | | 13,312,987 |
CMK Corp. (c) | 580,000 | | 7,666,840 |
EM Systems Co. Ltd. | 227,000 | | 1,737,327 |
Enplas Corp. (c) | 210,100 | | 6,094,458 |
Excel Co. Ltd. | 251,400 | | 3,634,355 |
Honda Tsushin Kogyo Co. Ltd. (a) | 390,300 | | 1,766,464 |
Ibiden Co. Ltd. (c) | 200,000 | | 3,085,936 |
Iriso Electronics Co. Ltd. (c) | 12,600 | | 202,391 |
KAGA ELECTRONICS Co. Ltd. (c) | 1,001,600 | | 16,940,180 |
Nagano Keiki Co. Ltd. | 322,300 | | 5,359,739 |
Nippon Chemi-con Corp. (c) | 943,000 | | 4,615,430 |
Nippon Electric Glass Co. Ltd. | 1,089,000 | | 24,334,908 |
Okamoto Glass Co. Ltd. (c) | 219,000 | | 1,872,679 |
Shibaura Electronics Co. Ltd. | 134,500 | | 1,023,031 |
Showa Shinku Co. Ltd. | 27,600 | | 224,274 |
Siix Corp. | 277,600 | | 4,944,262 |
Sunx Ltd. (c) | 410,300 | | 7,168,183 |
Tietech Co. Ltd. | 327,000 | | 2,663,334 |
Tosei Engineering Corp. | 149,700 | | 1,913,772 |
Yokogawa Electric Corp. | 727,000 | | 9,493,211 |
| | 119,498,274 |
Internet Software & Services - 1.0% |
eAccess Ltd. (c) | 4,860 | | 4,321,122 |
For-side.com Co. Ltd. (c) | 450 | | 335,900 |
|
| Shares | | Value (Note 1) |
Image One Co. Ltd. (a) | 1 | | $1,899 |
Telewave, Inc. (c) | 1,174 | | 8,574,687 |
| | 13,233,608 |
IT Services - 2.1% |
Faith, Inc. (c) | 5,916 | | 16,210,516 |
Future System Consulting Corp. (c) | 2,471 | | 4,973,052 |
NEC Soft Ltd. (c) | 125,300 | | 3,113,705 |
Otsuka Corp. | 50,300 | | 2,732,792 |
| | 27,030,065 |
Office Electronics - 2.3% |
Canon Fintech, Inc. | 800,000 | | 14,097,416 |
Konica Minolta Holdings, Inc. | 599,500 | | 8,009,571 |
Riso Kagaku Corp. | 171,000 | | 7,012,236 |
| | 29,119,223 |
Semiconductors & Semiconductor Equipment - 1.1% |
AOI Electronics Co. Ltd. | 91,500 | | 1,305,476 |
Sanken Electric Co. Ltd. | 333,000 | | 3,895,252 |
Shinko Electric Industries Co.Ltd. | 308,000 | | 8,905,182 |
Techno Quartz, Inc. | 39,000 | | 219,256 |
| | 14,325,166 |
Software - 2.8% |
Core Corp. | 59,200 | | 1,118,723 |
Dwango Co. Ltd. New (a)(c) | 1,188 | | 6,286,011 |
Intelligent Wave, Inc. | 1,368 | | 2,262,012 |
Konami Computer Tokyo, Inc. | 236,500 | | 4,715,028 |
Nihon Falcom Corp. | 301 | | 844,683 |
VIC Tokai Corp. | 614,700 | | 3,879,809 |
Works Applications Co. Ltd. (a)(c) | 5,487 | | 16,953,267 |
| | 36,059,533 |
TOTAL INFORMATION TECHNOLOGY | | 259,031,882 |
MATERIALS - 12.6% |
Chemicals - 5.1% |
Asahi Denka Co. Ltd. (c) | 664,000 | | 5,859,838 |
C. Uyemura & Co. Ltd. (c) | 337,000 | | 10,030,236 |
Harima Chemicals, Inc. | 277,000 | | 1,782,369 |
JSP Corp. | 532,700 | | 5,536,637 |
Lintec Corp. (c) | 950,900 | | 12,947,011 |
Nanbu Plastics Co. Ltd. | 2,000 | | 26,078 |
Nifco, Inc. | 547,100 | | 8,028,028 |
Nihon Micro Coating Co. Ltd. (a) | 83,200 | | 904,049 |
Nippon Chemical Industrial Co. Ltd. (c) | 1,610,000 | | 5,719,847 |
Nissan Chemical Industries Co. Ltd. | 335,000 | | 2,725,327 |
NOF Corp. | 388,000 | | 1,341,787 |
Osaka Organic Chemical Industry Ltd. | 260,400 | | 3,776,766 |
Soken Chemical & Engineer Co. Ltd. (c) | 97,400 | | 1,555,308 |
T&K Toka Co. Ltd. | 7,900 | | 155,261 |
Taiyo Kagaku | 228,900 | | 4,541,881 |
| | 64,930,423 |
Containers & Packaging - 0.9% |
FP Corp. | 19,800 | | 366,684 |
Common Stocks - continued |
| Shares | | Value (Note 1) |
MATERIALS - continued |
Containers & Packaging - continued |
Fuji Seal International, Inc. | 226,400 | | $9,733,264 |
Sun A Kaken Co. Ltd. | 102,000 | | 1,040,865 |
| | 11,140,813 |
Metals & Mining - 6.4% |
Godo Steel Ltd. (c) | 1,805,000 | | 6,651,391 |
Hitachi Metals Ltd. | 20,000 | | 105,447 |
Kobe Steel Ltd. | 14,038,000 | | 19,630,784 |
Neturen Co. Ltd. (c) | 327,000 | | 2,057,750 |
Sumitomo Metal Mining Co. Ltd. | 1,641,000 | | 11,086,266 |
Sumitomo Titanium Corp. | 150,100 | | 7,176,322 |
Toho Titanium Co. Ltd. (c) | 310,000 | | 6,971,229 |
Tokyo Steel Manufacturing Co. Ltd. (c) | 1,509,000 | | 23,839,448 |
Tokyo Tekko Co. Ltd. (a)(c) | 1,095,000 | | 3,921,245 |
Yamato Kogyo Co. Ltd. | 70,000 | | 908,773 |
| | 82,348,655 |
Paper & Forest Products - 0.2% |
Hivic Co. Ltd. | 11,500 | | 184,722 |
Kokusai Chart Corp. | 204,400 | | 2,684,518 |
| | 2,869,240 |
TOTAL MATERIALS | | 161,289,131 |
TELECOMMUNICATION SERVICES - 4.3% |
Wireless Telecommunication Services - 4.3% |
Mitsui & Associates Telepark Corp. | 1,004 | | 3,102,074 |
Nexus Co. Ltd. (c) | 5,000 | | 28,818,443 |
Sammy NetWorks Co. Ltd. (a) | 621 | | 23,118,439 |
| | 55,038,956 |
TOTAL COMMON STOCKS (Cost $979,692,632) | 1,214,457,544 |
Money Market Funds - 21.8% |
| Shares | | Value (Note 1) |
Fidelity Cash Central Fund, 1.79% (b) | 49,284,828 | | $49,284,828 |
Fidelity Securities Lending Cash Central Fund, 1.77% (b)(e) | 229,127,631 | | 229,127,631 |
TOTAL MONEY MARKET FUNDS (Cost $278,412,459) | 278,412,459 |
TOTAL INVESTMENT PORTFOLIO - 116.7% (Cost $1,258,105,091) | 1,492,870,003 |
NET OTHER ASSETS - (16.7)% | (213,778,679) |
NET ASSETS - 100% | $1,279,091,324 |
Legend |
(a)Non-income producing |
(b)Affiliated fund that is available only to investment companies and other accounts managed by Fidelity Investments. The rate quoted is the annualized seven-day yield of the fund at period end. A complete listing of the fund's holdings as of its most recent fiscal year end is available upon request. |
(c)Security or a portion of the security is on loan at period end. |
(d)Affiliated company |
(e)Includes investment made with cash collateral received from securities on loan. |
Other Information |
An affiliated company is a company in which the fund has ownership of at least 5% of the voting securities. Companies which are affiliates of the fund at period-end are noted in the fund's Schedule of Investments. Transactions during the period with companies which are or were affiliates are as follows: |
Affiliate | Value, beginning
of period | Purchases | Sales Proceeds | Dividend Income | Value, end
of period |
Chiyoda Integre Co. Ltd. | $18,936,810 | $271,544 | $668,055 | $171,205 | $14,601,757 |
Nihon Aim Co. Ltd. | - | 5,274,830 | 8,520,269 | 24,522 | - |
Reins International, Inc. | 24,595,233 | 6,585,515 | 4,662,500 | 130,092 | - |
Telewave, Inc. | 6,267,782 | 10,280,943 | 17,769,399 | 28,201 | - |
Total | $49,799,825 | $22,412,832 | $31,620,223 | $354,020 | $14,601,757 |
Income Tax Information |
The fund hereby designates approximately $1,112,00 as a capital gain dividend for the purpose of the dividend paid deduction. |
See accompanying notes which are an integral part of the financial statements.
Annual Report
Japan Smaller Companies
Financial Statements
Statement of Assets and Liabilities
| October 31, 2004 |
| | |
Assets | | |
Investment in securities, at value (including securities loaned of $217,561,904) (cost $1,258,105,091) - See accompanying schedule | | $1,492,870,003 |
Receivable for investments sold | | 18,817,579 |
Receivable for fund shares sold | | 646,519 |
Dividends receivable | | 2,972,465 |
Interest receivable | | 56,487 |
Other affiliated receivables | | 47,675 |
Other receivables | | 415,326 |
Total assets | | 1,515,826,054 |
| | |
Liabilities | | |
Payable to custodian bank | $2,060,911 | |
Payable for investments purchased | 2,279,647 | |
Payable for fund shares redeemed | 2,083,976 | |
Accrued management fee | 790,943 | |
Other affiliated payables | 273,004 | |
Other payables and accrued expenses | 118,618 | |
Collateral on securities loaned, at value | 229,127,631 | |
Total liabilities | | 236,734,730 |
| | |
Net Assets | | $1,279,091,324 |
Net Assets consist of: | | |
Paid in capital | | $1,040,419,655 |
Undistributed net investment income | | 832,961 |
Accumulated undistributed net realized gain (loss) on investments and foreign currency transactions | | 2,915,945 |
Net unrealized appreciation (depreciation) on investments and assets and liabilities in foreign currencies | | 234,922,763 |
Net Assets, for 110,431,789 shares outstanding | | $1,279,091,324 |
Net Asset Value, offering price and redemption price per share ($1,279,091,324 ÷ 110,431,789 shares) | | $11.58 |
Statement of Operations
| Year ended October 31, 2004 |
| | |
Investment Income | | |
Dividends (including $354,020 received from affiliated issuers) | | $8,605,165 |
Interest | | 865,859 |
Security lending | | 4,582,712 |
| | 14,053,736 |
Less foreign taxes withheld | | (601,916) |
Total income | | 13,451,820 |
| | |
Expenses | | |
Management fee | $8,529,138 | |
Transfer agent fees | 2,428,169 | |
Accounting and security lending fees | 576,583 | |
Non-interested trustees' compensation | 6,643 | |
Custodian fees and expenses | 427,747 | |
Registration fees | 123,524 | |
Audit | 47,921 | |
Legal | 3,749 | |
Miscellaneous | 55,586 | |
Total expenses before reductions | 12,199,060 | |
Expense reductions | (904) | 12,198,156 |
Net investment income (loss) | | 1,253,664 |
Realized and Unrealized Gain (Loss) Net realized gain (loss) on: | | |
Investment securities (Including realized gain (loss) of $10,566,358 from affiliated issuers) | 77,453,391 | |
Foreign currency transactions | 200,613 | |
Total net realized gain (loss) | | 77,654,004 |
Change in net unrealized appreciation (depreciation) on: Investment securities | (20,534,239) | |
Assets and liabilities in foreign currencies | 138,708 | |
Total change in net unrealized appreciation (depreciation) | | (20,395,531) |
Net gain (loss) | | 57,258,473 |
Net increase (decrease) in net assets resulting from operations | | $58,512,137 |
See accompanying notes which are an integral part of the financial statements.
Annual Report
Japan Smaller Companies
Financial Statements - continued
Statement of Changes in Net Assets
| Year ended
October 31,
2004 | Year ended
October 31,
2003 |
Increase (Decrease) in Net Assets | | |
Operations | | |
Net investment income (loss) | $1,253,664 | $839,613 |
Net realized gain (loss) | 77,654,004 | 18,670,060 |
Change in net unrealized appreciation (depreciation) | (20,395,531) | 240,994,799 |
Net increase (decrease) in net assets resulting from operations | 58,512,137 | 260,504,472 |
Distributions to shareholders from net investment income | (1,684,858) | - |
Share transactions
Proceeds from sales of shares | 1,097,920,415 | 429,276,957 |
Reinvestment of distributions | 1,313,116 | - |
Cost of shares redeemed | (812,920,279) | (167,399,388) |
Net increase (decrease) in net assets resulting from share transactions | 286,313,252 | 261,877,569 |
Redemption fees | 4,222,862 | 735,185 |
Total increase (decrease) in net assets | 347,363,393 | 523,117,226 |
| | |
Net Assets | | |
Beginning of period | 931,727,931 | 408,610,705 |
End of period (including undistributed net investment income of $832,961 and undistributed net investment income of $1,029,068, respectively) | $1,279,091,324 | $931,727,931 |
Other Information Shares | | |
Sold | 94,304,368 | 50,915,768 |
Issued in reinvestment of distributions | 136,641 | - |
Redeemed | (74,002,513) | (23,613,194) |
Net increase (decrease) | 20,438,496 | 27,302,574 |
Financial Highlights
Years ended October 31, | 2004 | 2003 | 2002 | 2001 | 2000 |
Selected Per-Share Data | | | | | |
Net asset value, beginning of period | $10.35 | $6.52 | $6.97 | $14.25 | $20.56 |
Income from Investment Operations | | | | | |
Net investment income (loss) C | .01 | .01 | - E | (.03) | (.12) |
Net realized and unrealized gain (loss) | 1.20 | 3.81 | (.47) | (2.80) | (6.13) |
Total from investment operations | 1.21 | 3.82 | (.47) | (2.83) | (6.25) |
Distributions from net investment income | (.02) | - | - | - | - |
Distributions in excess of net investment income | - | - | - | - | (.15) |
Distributions from net realized gain | - | - | - | (4.46) | - |
Total distributions | (.02) | - | - | (4.46) | (.15) |
Redemption fees added to paid in capital C | .04 | .01 | .02 | .01 | .09 |
Net asset value, end of period | $11.58 | $10.35 | $6.52 | $6.97 | $14.25 |
Total Return A, B | 12.12% | 58.74% | (6.46)% | (25.96)% | (30.24)% |
Ratios to Average Net Assets D | | | | | |
Expenses before expense reductions | 1.04% | 1.12% | 1.19% | 1.21% | 1.07% |
Expenses net of voluntary waivers, if any | 1.04% | 1.12% | 1.19% | 1.21% | 1.07% |
Expenses net of all reductions | 1.04% | 1.12% | 1.19% | 1.19% | 1.06% |
Net investment income (loss) | .11% | .19% | (.06)% | (.40)% | (.57)% |
Supplemental Data | | | | | |
Net assets, end of period (000 omitted) | $1,279,091 | $931,728 | $408,611 | $339,130 | $559,577 |
Portfolio turnover rate | 57% | 43% | 50% | 52% | 39% |
A Total returns would have been lower had certain expenses not been reduced during the periods shown. B Total returns do not include the effect of the former sales charges. C Calculated based on average shares outstanding during the period. D Expense ratios reflect operating expenses of the fund. Expenses before reductions do not reflect amounts reimbursed by the investment adviser or reductions from brokerage service arrangements or other expense offset arrangements and do not represent the amount paid by the fund during periods when reimbursements or reductions occur. Expenses net of any voluntary waivers reflect expenses after reimbursement by the investment adviser but prior to reductions from brokerage service arrangements or other expense offset arrangements. Expenses net of all reductions represent the net expenses paid by the fund. E Amount represents less than $.01 per share. |
See accompanying notes which are an integral part of the financial statements.
Annual Report
Latin America
Performance: The Bottom Line
Average annual total return reflects the change in the value of an investment, assuming reinvestment of the fund's dividend income and capital gains (the profits earned upon the sale of securities that have grown in value) and assuming a constant rate of performance each year. The $10,000 table and the fund's returns do not reflect the deduction of taxes that a shareholder would pay on fund distributions or the redemption of fund shares. During periods of reimbursement by Fidelity, a fund's total returns will be greater than it would be had the reimbursement not occurred. How a fund did yesterday is no guarantee of how it will do tomorrow.
Average Annual Total Returns
Periods ended
October 31, 2004 | Past 1
year | Past 5
years | Past 10
years |
Fidelity Latin America Fund | 37.47% | 9.57% | 2.50% |
$10,000 Over 10 Years
Let's say hypothetically that $10,000 was invested in Fidelity Latin America Fund on October 31, 1994. The chart shows how the value of your investment would have changed, and also shows how the MSCI EM - Latin America Index performed over the same period.
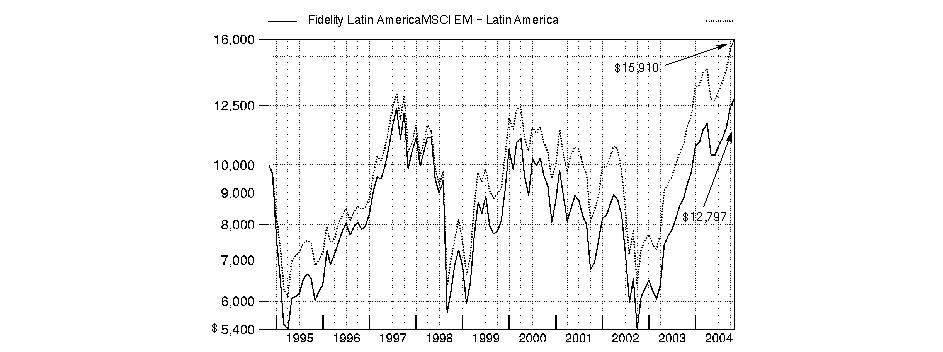
Annual Report
Latin America
Management's Discussion of Fund Performance
Comments from Claudio Brocado, Portfolio Manager of Fidelity® Latin America Fund
Most of the world's major stock markets posted solid gains for the year ending October 31, 2004. The Morgan Stanley Capital InternationalSM Europe, Australasia, Far East (MSCI® EAFE®) Index - designed to represent the performance of developed stock markets outside the United States and Canada - gained 19.00%, compared to 9.42% for the Standard & Poor's 500SM Index. A weak U.S. dollar relative to most foreign currencies was partly responsible for the performance disparity. On a regional basis, Europe was one of the top performers. Many investors felt European stocks offered better valuations and brighter earnings prospects than U.S. equities. Latin American countries, many of which are exporters of oil and materials that received strong support from high commodity prices, also did well. Conversely, Japan significantly underperformed, as early optimism was eroded by disappointing economic indicators and concerns about the impact of China's economic slowdown on exports. Meanwhile, technology-focused Asian emerging markets suffered due to a deceleration in corporate capital spending.
For the 12-month period that ended October 31, 2004, the fund returned 37.47%, outperforming both the Morgan Stanley Capital International Emerging Markets - Latin America Index and the LipperSM Latin American Funds Average, which gained 36.86% and 34.21%, respectively. It was a generally favorable environment for investing in Latin American stocks. Valuations continued to be extremely attractive, and earnings growth was robust. Favorable stock selection - especially in the raw materials area, a very important sector in the region's economy - was the biggest factor in the fund's outperformance. The two biggest contributors to performance relative to the index were Usiminas and Caemi Mineracao, both Brazilian materials companies. Hylsamex, Mexico's leading steel company, also contributed nicely to performance. Valuations for telecommunication services companies were under pressure during the period, hurting such stocks as Brazil's Telebras and Telefonos de Mexico.
Note to shareholders: Fidelity Latin America Fund may invest up to 35% of its total assets in any industry that represents more than 20% of the Latin American market. As of October 31, 2004, the fund did not have more than 25% of its total assets invested in any one industry.
The views expressed in this statement reflect those of the portfolio manager only through the end of the period of the report as stated on the cover and do not necessarily represent the views of Fidelity or any other person in the Fidelity organization. Any such views are subject to change at any time based upon market or other conditions and Fidelity disclaims any responsibility to update such views. These views may not be relied on as investment advice and, because investment decisions for a Fidelity fund are based on numerous factors, may not be relied on as an indication of trading intent on behalf of any Fidelity fund.
Annual Report
Latin America
Investment Changes
Geographic Diversification (% of fund's net assets) |
As of October 31, 2004 |
| Brazil | 50.4% | |
| Mexico | 38.2% | |
| United States of America | 3.2% | |
| Chile | 2.9% | |
| Peru | 1.9% | |
| Luxembourg | 1.8% | |
 | Argentina | 1.1% | |
| United Kingdom | 0.5% | |

Percentages are adjusted for the effect of futures contracts, if applicable. |
|
As of April 30, 2004 |
| Brazil | 46.1% | |
| Mexico | 44.0% | |
| Chile | 2.4% | |
| United States of America | 2.3% | |
| Peru | 1.4% | |
| Argentina | 1.4% | |
| Luxembourg | 1.0% | |
| Venezuela | 0.7% | |
| United Kingdom | 0.4% | |
| Other | 0.3% | |

Percentages are adjusted for the effect of futures contracts, if applicable. |
Asset Allocation |
| % of fund's
net assets | % of fund's net assets
6 months ago |
Stocks | 96.8 | 99.3 |
Short-Term Investments and Net Other Assets | 3.2 | 0.7 |
Top Ten Stocks as of October 31, 2004 |
| % of fund's
net assets | % of fund's net assets
6 months ago |
America Movil SA de CV sponsored ADR (Mexico, Wireless Telecommunication Services) | 10.6 | 10.9 |
Petroleo Brasileiro SA Petrobras (Brazil, Oil & Gas) | 9.1 | 9.6 |
Telefonos de Mexico SA de CV sponsored ADR (Mexico, Diversified Telecommunication Services) | 7.8 | 10.2 |
Grupo Televisa SA de CV sponsored ADR (Mexico, Media) | 4.4 | 4.5 |
Cemex SA de CV sponsored ADR (Mexico, Construction Materials) | 3.8 | 5.4 |
Banco Itau Holding Financeira SA (PN) (Brazil, Commercial Banks) | 3.7 | 2.9 |
Companhia Vale do Rio Doce (PN-A) (Brazil, Metals & Mining) | 3.3 | 2.6 |
Wal-Mart de Mexico SA de CV Series V (Mexico, Food & Staples Retailing) | 3.2 | 4.0 |
Companhia de Bebidas das Americas (AmBev) sponsored ADR (Brazil, Beverages) | 3.1 | 1.7 |
Fomento Economico Mexicano SA de CV sponsored ADR (Mexico, Beverages) | 2.8 | 3.6 |
| 51.8 | |
Market Sectors as of October 31, 2004 |
| % of fund's
net assets | % of fund's net assets
6 months ago |
Materials | 25.1 | 21.3 |
Telecommunication Services | 22.8 | 30.3 |
Energy | 13.0 | 14.3 |
Consumer Staples | 12.4 | 12.5 |
Financials | 10.4 | 8.3 |
Consumer Discretionary | 6.1 | 5.8 |
Utilities | 5.2 | 4.0 |
Industrials | 1.8 | 2.8 |
Annual Report
Latin America
Investments October 31, 2004
Showing Percentage of Net Assets
Common Stocks - 96.4% |
| Shares | | Value (Note 1) |
Argentina - 1.1% |
Inversiones y Representaciones SA sponsored GDR (a) | 23,700 | | $225,387 |
Petrobras Energia Participaciones SA sponsored ADR (a) | 174,654 | | 1,982,323 |
Telecom Argentina SA sponsored ADR (a) | 169,500 | | 1,803,480 |
TOTAL ARGENTINA | | 4,011,190 |
Brazil - 50.0% |
Aracruz Celulose SA sponsored ADR | 96,800 | | 3,260,224 |
Banco Bradesco SA: | | | |
(PN) | 96,829 | | 5,848,516 |
sponsored ADR | 64,850 | | 3,947,420 |
Banco do Brasil SA | 183,600 | | 1,836,482 |
Banco Itau Holding Financeira SA: | | | |
(PN) | 106,604 | | 12,881,588 |
sponsored ADR | 6,600 | | 399,300 |
Braskem SA Series A (a) | 103,900,000 | | 3,815,511 |
Caemi Mineracao E Metalurgia SA (PN) (a) | 12,791,200 | | 7,649,891 |
Centrais Electricas Brasileiras (Electrobras) SA (PN-B) | 357,530,200 | | 5,300,588 |
Companhia Brasileira de Distribuicao Grupo Pao de Acucar sponsored ADR | 57,900 | | 1,378,020 |
Companhia de Bebidas das Americas (AmBev) sponsored ADR | 443,226 | | 10,992,005 |
Companhia Energetica Minas Gerais (CEMIG) (PN) | 213,733,654 | | 4,933,609 |
Companhia Paranaense de Energia-Copel sponsored ADR | 196,000 | | 701,680 |
Companhia Vale do Rio Doce: | | | |
(PN-A) | 204,000 | | 3,695,794 |
sponsored: | | | |
ADR | 382,600 | | 8,095,816 |
ADR (non-vtg.) | 429,100 | | 7,809,620 |
Compania de Saneamento Basico do Estado de Sao Paulo (SABESP) ADR | 177,300 | | 1,781,865 |
Embraer - Empresa Brasileira de Aeronautica SA | 80,100 | | 389,119 |
Embraer - Empresa Brasileira de Aeronautica SA sponsored ADR | 224,043 | | 5,946,101 |
Empresa Nacional de Comercio Redito e Participacoes SA (PN) (a) | 11,465,310 | | 43,908 |
Gerdau SA sponsored ADR (d) | 337,620 | | 4,983,271 |
Grendene SA | 130,000 | | 1,575,413 |
Natura Cosmeticos SA | 122,700 | | 2,488,974 |
Petroleo Brasileiro SA Petrobras: | | | |
(PN) | 306,570 | | 10,014,388 |
sponsored: | | | |
ADR | 171,900 | | 6,104,169 |
ADR (non-vtg.) | 689,900 | | 22,490,740 |
Sadia SA | 965,200 | | 1,745,242 |
Siderurgica Nacional Compania ADR | 364,100 | | 5,370,475 |
Suzano Bahia Sul Papel e Celulose SA | 301,901 | | 1,280,776 |
|
| Shares | | Value (Note 1) |
Tele Centro Oeste Celular Participacoes SA ADR (a) | 67,088 | | $618,551 |
Tele Leste Celular Participacoes SA sponsored ADR (a) | 2,047 | | 23,438 |
Tele Norte Leste Participacoes SA ADR | 498,400 | | 6,519,072 |
Telebras sponsored ADR | 178,000 | | 4,692,080 |
TIM Participacoes SA sponsored ADR | 16,484 | | 233,908 |
Uniao de Bancos Brasileiros SA (Unibanco) GDR (d) | 232,900 | | 6,160,205 |
Usinas Siderurgicas de Minas Gerais SA (Usiminas) (PN-A) | 653,300 | | 9,882,041 |
Votorantim Celulose e Papel SA: | | | |
(PN) | 16,513,199 | | 1,142,944 |
sponsored ADR | 74,700 | | 2,580,885 |
TOTAL BRAZIL | | 178,613,629 |
Chile - 2.9% |
Banco Santander Chile sponsored ADR | 89,428 | | 2,500,407 |
CorpBanca SA sponsored ADR (e) | 52,200 | | 1,383,488 |
Empresa Nacional de Electricidad SA sponsored ADR | 105,200 | | 1,756,840 |
Enersis SA sponsored ADR | 504,400 | | 3,813,264 |
Vina Concha y Toro SA sponsored ADR | 14,900 | | 954,345 |
TOTAL CHILE | | 10,408,344 |
Luxembourg - 1.8% |
Millicom International Cellular SA (a) | 24,600 | | 488,802 |
Tenaris SA sponsored ADR | 133,069 | | 5,957,499 |
TOTAL LUXEMBOURG | | 6,446,301 |
Mexico - 38.2% |
America Movil SA de CV sponsored ADR | 862,700 | | 37,958,801 |
Cemex SA de CV sponsored ADR | 466,773 | | 13,527,082 |
Consorcio ARA SA de CV (a) | 577,900 | | 1,545,040 |
Fomento Economico Mexicano SA de CV sponsored ADR | 226,600 | | 9,993,060 |
Grupo Bimbo SA de CV Series A | 451,000 | | 1,015,815 |
Grupo Financiero Inbursa SA de CV Series O | 1,283,700 | | 2,145,990 |
Grupo Mexico SA de CV Series B (a) | 829,200 | | 3,424,878 |
Grupo Modelo SA de CV Series C | 1,686,800 | | 4,322,617 |
Grupo Televisa SA de CV sponsored ADR | 286,900 | | 15,779,500 |
Hylsamex SA de CV Series B (a) | 1,516,600 | | 3,317,357 |
Industrias Penoles SA de CV | 206,100 | | 941,462 |
Telefonos de Mexico SA de CV sponsored ADR | 813,100 | | 27,840,544 |
TV Azteca SA de CV sponsored ADR | 155,700 | | 1,560,114 |
Urbi, Desarrollos Urbanos, SA de CV | 464,300 | | 1,729,808 |
Wal-Mart de Mexico SA de CV Series V | 3,458,155 | | 11,313,402 |
TOTAL MEXICO | | 136,415,470 |
Peru - 1.9% |
Compania de Minas Buenaventura SA sponsored ADR | 275,700 | | 6,848,388 |
Common Stocks - continued |
| Shares | | Value (Note 1) |
United Kingdom - 0.5% |
Antofagasta PLC | 95,900 | | $1,758,782 |
TOTAL COMMON STOCKS (Cost $228,247,731) | 344,502,104 |
Nonconvertible Preferred Stocks - 0.4% |
| | | |
Brazil - 0.4% |
Telemar Norte Leste SA (PN-A)
(Cost $1,733,400) | 73,302 | | 1,353,366 |
Money Market Funds - 4.5% |
| | | |
Fidelity Cash Central Fund, 1.79% (b) | 14,466,187 | | 14,466,187 |
Fidelity Securities Lending Cash Central Fund, 1.77% (b)(c) | 1,520,400 | | 1,520,400 |
TOTAL MONEY MARKET FUNDS (Cost $15,986,587) | 15,986,587 |
TOTAL INVESTMENT PORTFOLIO - 101.3% (Cost $245,967,718) | 361,842,057 |
NET OTHER ASSETS - (1.3)% | (4,507,388) |
NET ASSETS - 100% | $357,334,669 |
Legend |
(a)Non-income producing |
(b)Affiliated fund that is available only to investment companies and other accounts managed by Fidelity Investments. The rate quoted is the annualized seven-day yield of the fund at period end. A complete listing of the fund's holdings as of its most recent fiscal year end is available upon request. |
(c)Includes investment made with cash collateral received from securities on loan. |
(d)Security or a portion of the security is on loan at period end. |
(e)Security exempt from registration under Rule 144A of the Securities Act of 1933. These securities may be resold in transactions exempt from registration, normally to qualified institutional buyers. At the period end, the value of these securities amounted to $1,383,488 or 0.4% of net assets. |
Income Tax Information |
At October 31, 2004, the fund had a capital loss carryforward of approximately $61,123,000 of which $22,657,000, $11,150,000, $7,286,000, $11,980,000 and $8,050,000 will expire on October 31, 2007, 2008, 2009, 2010 and 2011, respectively. |
See accompanying notes which are an integral part of the financial statements.
Annual Report
Latin America
Financial Statements
Statement of Assets and Liabilities
| October 31, 2004 |
| | |
Assets | | |
Investment in securities, at value (including securities loaned of $1,493,631) (cost $245,967,718) - See accompanying schedule | | $361,842,057 |
Foreign currency held at value (cost $7) | | 7 |
Receivable for fund shares sold | | 1,330,207 |
Dividends receivable | | 2,350,720 |
Interest receivable | | 17,987 |
Other affiliated receivables | | 1,367 |
Other receivables | | 15,202 |
Total assets | | 365,557,547 |
| | |
Liabilities | | |
Payable for investments purchased | $5,673,538 | |
Payable for fund shares redeemed | 637,238 | |
Accrued management fee | 207,866 | |
Other affiliated payables | 86,056 | |
Other payables and accrued expenses | 97,780 | |
Collateral on securities loaned, at value | 1,520,400 | |
Total liabilities | | 8,222,878 |
| | |
Net Assets | | $357,334,669 |
Net Assets consist of: | | |
Paid in capital | | $299,109,204 |
Undistributed net investment income | | 5,894,558 |
Accumulated undistributed net realized gain (loss) on investments and foreign currency transactions | | (63,537,710) |
Net unrealized appreciation (depreciation) on investments and assets and liabilities in foreign currencies | | 115,868,617 |
Net Assets, for 19,743,867 shares outstanding | | $357,334,669 |
Net Asset Value, offering price and redemption price per share ($357,334,669 ÷ 19,743,867 shares) | | $18.10 |
Statement of Operations
| Year ended October 31, 2004 |
| | |
Investment Income | | |
Dividends | | $11,828,479 |
Interest | | 53,953 |
Security lending | | 16,851 |
| | 11,899,283 |
Less foreign taxes withheld | | (1,081,730) |
Total income | | 10,817,553 |
| | |
Expenses | | |
Management fee | $2,106,523 | |
Transfer agent fees | 802,473 | |
Accounting and security lending fees | 150,314 | |
Non-interested trustees' compensation | 2,110 | |
Custodian fees and expenses | 171,114 | |
Registration fees | 30,415 | |
Audit | 73,221 | |
Legal | 644 | |
Interest | 402 | |
Miscellaneous | 109,140 | |
Total expenses before reductions | 3,446,356 | |
Expense reductions | (60,987) | 3,385,369 |
Net investment income (loss) | | 7,432,184 |
Realized and Unrealized Gain (Loss) Net realized gain (loss) on: | | |
Investment securities | 21,528,042 | |
Foreign currency transactions | (108,901) | |
Total net realized gain (loss) | | 21,419,141 |
Change in net unrealized appreciation (depreciation) on: Investment securities | 53,174,461 | |
Assets and liabilities in foreign currencies | (18,206) | |
Total change in net unrealized appreciation (depreciation) | | 53,156,255 |
Net gain (loss) | | 74,575,396 |
Net increase (decrease) in net assets resulting from operations | | $82,007,580 |
See accompanying notes which are an integral part of the financial statements.
Annual Report
Latin America
Financial Statements - continued
Statement of Changes in Net Assets
| Year ended
October 31,
2004 | Year ended
October 31,
2003 |
Increase (Decrease) in Net Assets | | |
Operations | | |
Net investment income (loss) | $7,432,184 | $3,242,149 |
Net realized gain (loss) | 21,419,141 | (7,547,156) |
Change in net unrealized appreciation (depreciation) | 53,156,255 | 78,116,337 |
Net increase (decrease) in net assets resulting from operations | 82,007,580 | 73,811,330 |
Distributions to shareholders from net investment income | (3,905,133) | (2,628,539) |
Share transactions
Proceeds from sales of shares | 169,215,930 | 47,805,000 |
Reinvestment of distributions | 3,746,651 | 2,504,746 |
Cost of shares redeemed | (113,691,284) | (42,599,039) |
Net increase (decrease) in net assets resulting from share transactions | 59,271,297 | 7,710,707 |
Redemption fees | 442,226 | 226,141 |
Total increase (decrease) in net assets | 137,815,970 | 79,119,639 |
| | |
Net Assets | | |
Beginning of period | 219,518,699 | 140,399,060 |
End of period (including undistributed net investment income of $5,894,558 and undistributed net investment income of $2,476,408, respectively) | $357,334,669 | $219,518,699 |
Other Information Shares | | |
Sold | 10,428,289 | 4,368,834 |
Issued in reinvestment of distributions | 264,221 | 277,688 |
Redeemed | (7,355,849) | (3,973,164) |
Net increase (decrease) | 3,336,661 | 673,358 |
Financial Highlights
Years ended October 31, | 2004 | 2003 | 2002 | 2001 | 2000 |
Selected Per-Share Data | | | | | |
Net asset value, beginning of period | $13.38 | $8.92 | $10.40 | $13.87 | $12.31 |
Income from Investment Operations | | | | | |
Net investment income (loss) C | .40 | .20 | .17 | .27 D | .07 |
Net realized and unrealized gain (loss) | 4.53 | 4.42 | (1.41) | (3.68) | 1.61 |
Total from investment operations | 4.93 | 4.62 | (1.24) | (3.41) | 1.68 |
Distributions from net investment income | (.23) | (.17) | (.25) | (.07) | (.14) |
Redemption fees added to paid in capital C | .02 | .01 | .01 | .01 | .02 |
Net asset value, end of period | $18.10 | $13.38 | $8.92 | $10.40 | $13.87 |
Total Return A, B | 37.47% | 52.83% | (12.37)% | (24.61)% | 13.76% |
Ratios to Average Net AssetsE | | | | | |
Expenses before expense reductions | 1.19% | 1.31% | 1.44% | 1.41% | 1.25% |
Expenses net of voluntary waivers, if any | 1.19% | 1.31% | 1.44% | 1.41% | 1.25% |
Expenses net of all reductions | 1.16% | 1.31% | 1.41% | 1.35% | 1.23% |
Net investment income (loss) | 2.56% | 1.89% | 1.57% | 2.14% | .44% |
Supplemental Data | | | | | |
Net assets, end of period (000 omitted) | $357,335 | $219,519 | $140,399 | $184,457 | $297,265 |
Portfolio turnover rate | 25% | 28% | 128% | 96% | 51% |
A Total returns would have been lower had certain expenses not been reduced during the periods shown. B Total returns do not include the effect of the former sales charges. C Calculated based on average shares outstanding during the period. D Investment income per share reflects a special dividend which amounted to $.07 per share. E Expense ratios reflect operating expenses of the fund. Expenses before reductions do not reflect amounts reimbursed by the investment adviser or reductions from brokerage service arrangements or other expense offset arrangements and do not represent the amount paid by the fund during periods when reimbursements or reductions occur. Expenses net of any voluntary waivers reflect expenses after reimbursement by the investment adviser but prior to reductions from brokerage service arrangements or other expense offset arrangements. Expenses net of all reductions represent the net expenses paid by the fund. |
See accompanying notes which are an integral part of the financial statements.
Annual Report
Nordic
Performance: The Bottom Line
Average annual total return reflects the change in the value of an investment, assuming reinvestment of the fund's dividend income and capital gains (the profits earned upon the sale of securities that have grown in value) and assuming a constant rate of performance each year. The $10,000 table and the fund's returns do not reflect the deduction of taxes that a shareholder would pay on fund distributions or the redemption of fund shares. During periods of reimbursement by Fidelity, a fund's total returns will be greater than it would be had the reimbursement not occurred. How a fund did yesterday is no guarantee of how it will do tomorrow.
Average Annual Total Returns
Periods ended
October 31, 2004 | Past 1
year | Past 5
years | Life of
fundA |
Fidelity Nordic Fund | 26.31% | 2.63% | 12.19% |
A From November 1, 1995
$10,000 Over Life of Fund
Let's say hypothetically that $10,000 was invested in Fidelity Nordic Fund on November 1, 1995, when the fund started. The chart shows how the value of your investment would have grown, and also shows how the FTSE World Nordic Index did over the same period.
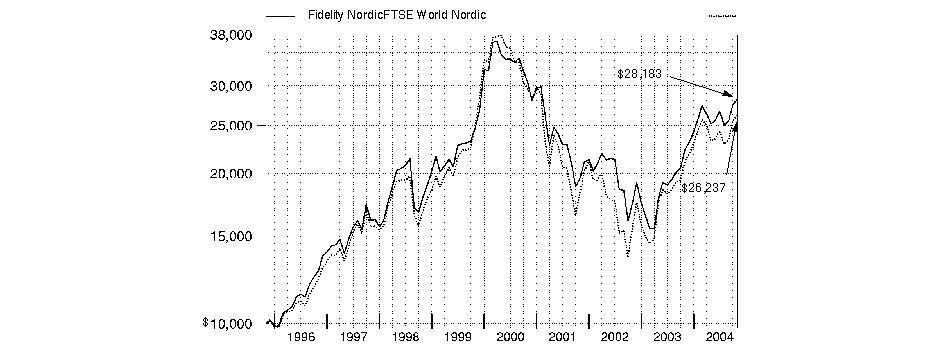
Annual Report
Nordic
Management's Discussion of Fund Performance
Comments from Trygve Toraasen, Portfolio Manager of Fidelity® Nordic Fund
Most of the world's major stock markets posted solid gains for the year ending October 31, 2004. The Morgan Stanley Capital InternationalSM Europe, Australasia, Far East (MSCI® EAFE®) Index - designed to represent the performance of developed stock markets outside the United States and Canada - gained 19.00%, compared to 9.42% for the Standard & Poor's 500SM Index. A weak U.S. dollar relative to most foreign currencies was partly responsible for the performance disparity. On a regional basis, Europe was one of the top performers. Many investors felt European stocks offered better valuations and brighter earnings prospects than U.S. equities. Latin American countries, many of which are exporters of oil and materials that received strong support from high commodity prices, also did well. Conversely, Japan significantly underperformed, as early optimism was eroded by disappointing economic indicators and concerns about the impact of China's economic slowdown on exports. Meanwhile, technology-focused Asian emerging markets suffered due to a deceleration in corporate capital spending.
For the 12 months ending October 31, 2004, Fidelity Nordic Fund returned 26.31%, outdistancing both the Financial Times-Stock Exchange (FTSE) World Nordic Index, which gained 23.98%, and the LipperSM European Region Funds Average, which returned 21.59%. During a period of rapidly rising oil prices, performance was helped substantially by my emphasis on energy companies, including large integrated oil corporations, shipping operators and energy services companies. My focus on growth stocks, including small- and mid-cap stocks across many sectors, also helped. Oil shipping company Frontline was a major contributor to performance relative to the index as demand for its ships on the spot market increased with rising oil prices. Investments in dental implant company Biocare, tire company Nokian and Hansabank, a major bank in the Baltic region, also added to returns. Pharmaceutical company AstraZeneca was a major disappointment, as it ran into product problems. Orc Software also detracted, due to slowing sales to financial companies, while my decision to reduce the position in Volvo hurt performance as that company's earnings continued to grow after I thought they may have peaked.
Note to shareholders: Fidelity Nordic Fund may invest up to 35% of its total assets in any industry that represents more than 20% of the Nordic market. As of October 31, 2004, the fund did not have more than 25% of its total assets invested in any one industry.
The views expressed in this statement reflect those of the portfolio manager only through the end of the period of the report as stated on the cover and do not necessarily represent the views of Fidelity or any other person in the Fidelity organization. Any such views are subject to change at any time based upon market or other conditions and Fidelity disclaims any responsibility to update such views. These views may not be relied on as investment advice and, because investment decisions for a Fidelity fund are based on numerous factors, may not be relied on as an indication of trading intent on behalf of any Fidelity fund.
Annual Report
Nordic
Investment Changes
Geographic Diversification (% of fund's net assets) |
As of October 31, 2004 |
| Sweden | 38.9% | |
| Norway | 21.7% | |
| Finland | 16.9% | |
| Denmark | 8.5% | |
| Switzerland | 3.6% | |
| Bermuda | 2.8% | |
| United States of America | 2.7% | |
| Luxembourg | 2.1% | |
| Estonia | 2.1% | |
| Other | 0.7% | |

Percentages are adjusted for the effect of futures contracts, if applicable. |
|
As of April 30, 2004 |
| Sweden | 37.5% | |
| Finland | 17.3% | |
| Norway | 16.3% | |
| Denmark | 12.3% | |
| United States of America | 5.3% | |
| Switzerland | 3.7% | |
| United Kingdom | 2.6% | |
| Estonia | 2.1% | |
| Luxembourg | 1.9% | |
| Other | 1.0% | |

Percentages are adjusted for the effect of futures contracts, if applicable. |
Asset Allocation |
| % of fund's
net assets | % of fund's net assets
6 months ago |
Stocks | 98.3 | 98.3 |
Short-Term Investments and Net Other Assets | 1.7 | 1.7 |
Top Ten Stocks as of October 31, 2004 |
| % of fund's
net assets | % of fund's net assets
6 months ago |
Nokia Corp. (Finland, Communications Equipment) | 9.5 | 5.4 |
Telefonaktiebolaget LM Ericsson
(B Shares) (Sweden, Communications Equipment) | 6.2 | 10.6 |
Nordea Bank AB
(Sweden, Commercial Banks) | 5.4 | 3.4 |
Volvo AB (B Shares)
(Sweden, Machinery) | 4.1 | 3.2 |
Hennes & Mauritz AB (H&M)
(B Shares) (Sweden, Specialty Retail) | 3.8 | 0.7 |
Norsk Hydro ASA
(Norway, Oil & Gas) | 3.7 | 3.6 |
Nobel Biocare Holding AG (Switzerland) (Switzerland, Health Care Equipment & Supplies) | 3.6 | 3.7 |
Danske Bank AS (Denmark, Commercial Banks) | 3.2 | 3.2 |
Tandberg ASA (Norway, Communications Equipment) | 3.2 | 2.4 |
Svenska Handelsbanken AB
(A Shares) (Sweden, Commercial Banks) | 3.2 | 2.6 |
| 45.9 | |
Market Sectors as of October 31, 2004 |
| % of fund's
net assets | % of fund's net assets
6 months ago |
Information Technology | 21.3 | 22.9 |
Financials | 20.7 | 15.8 |
Industrials | 14.7 | 16.9 |
Energy | 12.1 | 6.9 |
Health Care | 10.1 | 13.1 |
Consumer Discretionary | 9.3 | 7.5 |
Materials | 4.5 | 6.9 |
Telecommunication Services | 2.8 | 5.6 |
Consumer Staples | 1.7 | 1.9 |
Utilities | 1.1 | 0.8 |
Annual Report
Nordic
Investments October 31, 2004
Showing Percentage of Net Assets
Common Stocks - 98.3% |
| Shares | | Value (Note 1) |
Bermuda - 2.8% |
Frontline Ltd. | 33,300 | | $1,644,328 |
Golar LNG Ltd. (a) | 99,300 | | 1,577,194 |
Ship Finance International Ltd. | 1,875 | | 37,688 |
TOTAL BERMUDA | | 3,259,210 |
Denmark - 8.5% |
Coloplast AS Series B | 8,300 | | 826,070 |
Danske Bank AS | 135,420 | | 3,795,025 |
GN Store Nordic AS | 115,100 | | 1,169,333 |
Kobenhaven Lufthave AS | 1,100 | | 185,054 |
Novo Nordisk AS Series B | 60,195 | | 3,000,681 |
Novozymes AS Series B | 21,100 | | 941,007 |
TOTAL DENMARK | | 9,917,170 |
Estonia - 2.1% |
Hansabank SA | 240,500 | | 2,431,366 |
Finland - 16.9% |
Fortum Oyj | 83,800 | | 1,286,866 |
Marimekko Oyj | 16,700 | | 270,557 |
Nokia Corp. | 718,545 | | 11,079,965 |
Nokian Tyres Ltd. | 10,070 | | 1,094,586 |
Stora Enso Oyj (R Shares) | 121,500 | | 1,739,861 |
TietoEnator Oyj | 30,600 | | 861,494 |
UPM-Kymmene Corp. | 115,900 | | 2,298,917 |
Vacon Oyj | 70,900 | | 996,223 |
TOTAL FINLAND | | 19,628,469 |
Iceland - 0.4% |
Ossur Hf (a) | 316,142 | | 412,748 |
Luxembourg - 2.1% |
Millicom International Cellular SA unit (a) | 38,360 | | 778,077 |
SBS Broadcasting SA (a) | 16,200 | | 557,928 |
Stolt Offshore SA (a) | 44,800 | | 228,032 |
Stolt-Nielsen SA (a) | 41,700 | | 875,451 |
TOTAL LUXEMBOURG | | 2,439,488 |
Norway - 21.7% |
Camillo Eitzen & Co. ASA | 132,000 | | 954,875 |
DnB NOR ASA | 296,400 | | 2,517,019 |
Farstad Shipping ASA (a) | 23,600 | | 244,018 |
Fred Olsen Energy ASA (a) | 42,300 | | 439,035 |
Norsk Hydro ASA | 58,420 | | 4,308,727 |
Ocean RIG ASA (a)(d) | 304,300 | | 1,057,569 |
Olav Thon Eiendomsselskap AS (a) | 2,100 | | 113,934 |
Orkla ASA (A Shares) | 38,785 | | 1,107,019 |
Schibsted AS (B Shares) | 51,700 | | 1,130,108 |
Solstad Offshore ASA (a) | 63,000 | | 554,809 |
Statoil ASA | 229,200 | | 3,325,030 |
|
| Shares | | Value (Note 1) |
Steen & Stroem ASA (a) | 4,800 | | $92,091 |
Storebrand ASA (A Shares) | 443,700 | | 3,384,120 |
Tandberg ASA (d) | 394,800 | | 3,725,143 |
TANDBERG Television ASA (a) | 79,800 | | 579,775 |
Telenor ASA | 216,700 | | 1,729,456 |
TOTAL NORWAY | | 25,262,728 |
Sweden - 38.9% |
Assa Abloy AB (B Shares) | 83,402 | | 1,128,775 |
Atlas Copco AB (A Shares) | 20,300 | | 842,163 |
Axfood AB | 29,400 | | 895,543 |
Boliden AB (a) | 63,500 | | 246,830 |
Concordia Maritime AB (B Shares) | 171,700 | | 645,571 |
Elekta AB (B Shares) (a)(d) | 39,300 | | 1,049,896 |
Getinge AB (B Shares) | 66,760 | | 747,838 |
Hennes & Mauritz AB (H&M) (B Shares) | 153,590 | | 4,483,064 |
Hexagon AB (B Shares) | 24,700 | | 911,233 |
Intrum Justitia AB (a) | 163,500 | | 961,398 |
Mekonomen AB | 46,000 | | 1,222,384 |
Modern Times Group AB (MTG)
(B Shares) (a) | 43,300 | | 963,963 |
NCC AB Series B | 49,800 | | 559,614 |
NeoNet AB (a) | 112,000 | | 101,319 |
Nordea Bank AB | 723,600 | | 6,264,647 |
Observer AB | 200,383 | | 793,069 |
OMX AB (a) | 39,900 | | 472,335 |
ORC Software AB | 80,300 | | 646,967 |
Peab AB | 18,400 | | 145,646 |
POOLiA AB (B Shares) | 57,900 | | 234,883 |
Readsoft AB (B Shares) (a) | 388,556 | | 749,684 |
Sandvik AB | 27,900 | | 1,047,034 |
Sectra AB (B Shares) | 48,300 | | 341,357 |
Securitas AB (B Shares) | 74,100 | | 1,015,972 |
Skandia Foersaekrings AB | 242,900 | | 906,407 |
Skanska AB (B Shares) | 51,500 | | 562,338 |
SKF AB (B Shares) | 18,000 | | 699,676 |
Svenska Handelsbanken AB (A Shares) | 169,616 | | 3,680,164 |
Tele2 AB (B Shares) (d) | 21,100 | | 702,369 |
Telefonaktiebolaget LM Ericsson
(B Shares) (a) | 2,518,200 | | 7,280,116 |
Volvo AB (B Shares) | 125,800 | | 4,774,379 |
Wihlborgs Fastigheter AB | 16,300 | | 282,238 |
TOTAL SWEDEN | | 45,358,872 |
Switzerland - 3.6% |
Nobel Biocare Holding AG (Switzerland) | 25,790 | | 4,229,923 |
United Kingdom - 0.3% |
Group 4 Securicor PLC (a) | 184,418 | | 403,290 |
United States of America - 1.0% |
Royal Caribbean Cruises Ltd. | 23,900 | | 1,112,511 |
TOTAL COMMON STOCKS (Cost $97,407,738) | 114,455,775 |
Money Market Funds - 4.8% |
| Shares | | Value (Note 1) |
Fidelity Cash Central Fund, 1.79% (b) | 1,566,599 | | $1,566,599 |
Fidelity Securities Lending Cash Central Fund, 1.77% (b)(c) | 4,070,700 | | 4,070,700 |
TOTAL MONEY MARKET FUNDS (Cost $5,637,299) | 5,637,299 |
TOTAL INVESTMENT PORTFOLIO - 103.1% (Cost $103,045,037) | 120,093,074 |
NET OTHER ASSETS - (3.1)% | (3,600,431) |
NET ASSETS - 100% | $116,492,643 |
Legend |
(a)Non-income producing |
(b)Affiliated fund that is available only to investment companies and other accounts managed by Fidelity Investments. The rate quoted is the annualized seven-day yield of the fund at period end. A complete listing of the fund's holdings as of its most recent fiscal year end is available upon request. |
(c)Includes investment made with cash collateral received from securities on loan. |
(d)Security or a portion of the security is on loan at period end. |
Income Tax Information |
At October 31, 2004, the fund had a capital loss carryforward of approximately $6,515,000 of which $4,587,000 and $1,928,000 will expire on October 31, 2010 and 2011, respectively. |
See accompanying notes which are an integral part of the financial statements.
Annual Report
Nordic
Financial Statements
Statement of Assets and Liabilities
| October 31, 2004 |
| | |
Assets | | |
Investment in securities, at value (including securities loaned of $3,763,792) (cost $103,045,037) - See accompanying schedule | | $120,093,074 |
Receivable for investments sold | | 505,829 |
Receivable for fund shares sold | | 216,283 |
Dividends receivable | | 13,103 |
Interest receivable | | 5,144 |
Other receivables | | 12,421 |
Total assets | | 120,845,854 |
| | |
Liabilities | | |
Payable for investments purchased | $15,664 | |
Payable for fund shares redeemed | 104,880 | |
Accrued management fee | 68,066 | |
Other affiliated payables | 33,082 | |
Other payables and accrued expenses | 60,819 | |
Collateral on securities loaned, at value | 4,070,700 | |
Total liabilities | | 4,353,211 |
| | |
Net Assets | | $116,492,643 |
Net Assets consist of: | | |
Paid in capital | | $106,134,125 |
Undistributed net investment income | | 1,106,605 |
Accumulated undistributed net realized gain (loss) on investments and foreign currency transactions | | (7,798,408) |
Net unrealized appreciation (depreciation) on investments and assets and liabilities in foreign currencies | | 17,050,321 |
Net Assets, for 4,766,147 shares outstanding | | $116,492,643 |
Net Asset Value, offering price and redemption price per share ($116,492,643 ÷ 4,766,147 shares) | | $24.44 |
Statement of Operations
| Year ended October 31, 2004 |
| | |
Investment Income | | |
Dividends | | $2,690,684 |
Interest | | 25,365 |
Security lending | | 113,977 |
| | 2,830,026 |
Less foreign taxes withheld | | (383,526) |
Total income | | 2,446,500 |
| | |
Expenses | | |
Management fee | $736,527 | |
Transfer agent fees | 325,725 | |
Accounting and security lending fees | 54,632 | |
Non-interested trustees' compensation | 574 | |
Custodian fees and expenses | 113,588 | |
Registration fees | 17,502 | |
Audit | 43,434 | |
Legal | 374 | |
Miscellaneous | 11,138 | |
Total expenses before reductions | 1,303,494 | |
Expense reductions | (38,771) | 1,264,723 |
Net investment income (loss) | | 1,181,777 |
Realized and Unrealized Gain (Loss) Net realized gain (loss) on: | | |
Investment securities | 18,398,867 | |
Foreign currency transactions | (49,765) | |
Total net realized gain (loss) | | 18,349,102 |
Change in net unrealized appreciation (depreciation) on: Investment securities | 918,238 | |
Assets and liabilities in foreign currencies | 34 | |
Total change in net unrealized appreciation (depreciation) | | 918,272 |
Net gain (loss) | | 19,267,374 |
Net increase (decrease) in net assets resulting from operations | | $20,449,151 |
See accompanying notes which are an integral part of the financial statements.
Annual Report
Nordic
Financial Statements - continued
Statement of Changes in Net Assets
| Year ended
October 31,
2004 | Year ended
October 31,
2003 |
Increase (Decrease) in Net Assets | | |
Operations | | |
Net investment income (loss) | $1,181,777 | $489,531 |
Net realized gain (loss) | 18,349,102 | 4,046,076 |
Change in net unrealized appreciation (depreciation) | 918,272 | 13,723,401 |
Net increase (decrease) in net assets resulting from operations | 20,449,151 | 18,259,008 |
Distributions to shareholders from net investment income | (633,291) | (575,077) |
Share transactions
Proceeds from sales of shares | 51,430,152 | 5,971,305 |
Reinvestment of distributions | 613,718 | 556,144 |
Cost of shares redeemed | (36,891,811) | (16,879,816) |
Net increase (decrease) in net assets resulting from share transactions | 15,152,059 | (10,352,367) |
Redemption fees | 187,429 | 13,366 |
Total increase (decrease) in net assets | 35,155,348 | 7,344,930 |
| | |
Net Assets | | |
Beginning of period | 81,337,295 | 73,992,365 |
End of period (including undistributed net investment income of $1,106,605 and undistributed net investment income of $607,884, respectively) | $116,492,643 | $81,337,295 |
Other Information Shares | | |
Sold | 2,222,711 | 368,565 |
Issued in reinvestment of distributions | 29,807 | 35,973 |
Redeemed | (1,659,315) | (1,047,699) |
Net increase (decrease) | 593,203 | (643,161) |
Financial Highlights
Years ended October 31, | 2004 | 2003 | 2002 | 2001 | 2000 |
Selected Per-Share Data | | | | | |
Net asset value, beginning of period | $19.49 | $15.36 | $17.31 | $27.19 | $22.49 |
Income from Investment Operations | | | | | |
Net investment income (loss) C | .26 | .11 | .10 | .07 | .05 |
Net realized and unrealized gain (loss) | 4.80 | 4.14 | (1.99) | (9.71) | 5.10 |
Total from investment operations | 5.06 | 4.25 | (1.89) | (9.64) | 5.15 |
Distributions from net investment income | (.15) | (.12) | (.06) | (.03) | (.06) |
Distributions from net realized gain | - | - | - | (.22) | (.45) |
Total distributions | (.15) | (.12) | (.06) | (.25) | (.51) |
Redemption fees added to paid in capital C | .04 | - E | - E | .01 | .06 |
Net asset value, end of period | $24.44 | $19.49 | $15.36 | $17.31 | $27.19 |
Total Return A, B | 26.31% | 27.87% | (10.97)% | (35.72)% | 23.21% |
Ratios to Average Net Assets D | | | | | |
Expenses before expense reductions | 1.28% | 1.43% | 1.35% | 1.26% | 1.17% |
Expenses net of voluntary waivers, if any | 1.28% | 1.43% | 1.35% | 1.26% | 1.17% |
Expenses net of all reductions | 1.24% | 1.40% | 1.30% | 1.20% | 1.15% |
Net investment income (loss) | 1.16% | .67% | .57% | .34% | .18% |
Supplemental Data | | | | | |
Net assets, end of period (000 omitted) | $116,493 | $81,337 | $73,992 | $98,434 | $200,872 |
Portfolio turnover rate | 90% | 96% | 106% | 88% | 80% |
A Total returns would have been lower had certain expenses not been reduced during the periods shown. B Total returns do not include the effect of the former sales charges. C Calculated based on average shares outstanding during the period. D Expense ratios reflect operating expenses of the fund. Expenses before reductions do not reflect amounts reimbursed by the investment adviser or reductions from brokerage service arrangements or other expense offset arrangements and do not represent the amount paid by the fund during periods when reimbursements or reductions occur. Expenses net of any voluntary waivers reflect expenses after reimbursement by the investment adviser but prior to reductions from brokerage service arrangements or other expense offset arrangements. Expenses net of all reductions represent the net expenses paid by the fund. E Amount represents less than $.01 per share. |
See accompanying notes which are an integral part of the financial statements.
Annual Report
Pacific Basin
Performance: The Bottom Line
Average annual total return reflects the change in the value of an investment, assuming reinvestment of the fund's dividend income and capital gains (the profits earned upon the sale of securities that have grown in value) and assuming a constant rate of performance each year. The $10,000 table and the fund's returns do not reflect the deduction of taxes that a shareholder would pay on fund distributions or the redemption of fund shares. During periods of reimbursement by Fidelity, a fund's total returns will be greater than it would be had the reimbursement not occurred. How a fund did yesterday is no guarantee of how it will do tomorrow.
Average Annual Total Returns
Periods ended
October 31, 2004 | Past 1
year | Past 5
years | Past 10
years |
Fidelity Pacific Basin Fund | 5.98% | -2.67% | 1.33% |
$10,000 Over 10 Years
Let's say hypothetically that $10,000 was invested in Fidelity Pacific Basin Fund on October 31, 1994. The chart shows how the value of your investment would have grown, and also shows how the MSCI All Country Pacific Index did over the same period.
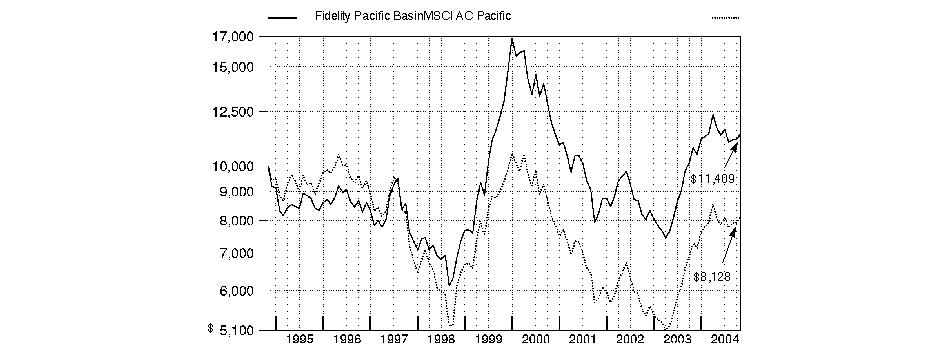
Annual Report
Pacific Basin
Management's Discussion of Fund Performance
Comments from William Kennedy, Portfolio Manager of Fidelity® Pacific Basin Fund
Most of the world's major stock markets posted solid gains for the year ending October 31, 2004. The Morgan Stanley Capital InternationalSM Europe, Australasia, Far East (MSCI® EAFE®) Index - designed to represent the performance of developed stock markets outside the United States and Canada - gained 19.00%, compared to 9.42% for the Standard & Poor's 500SM Index. A weak U.S. dollar relative to most foreign currencies was partly responsible for the performance disparity. On a regional basis, Europe was one of the top performers. Many investors felt European stocks offered better valuations and brighter earnings prospects than U.S. equities. Latin American countries, many of which are exporters of oil and materials that received strong support from high commodity prices, also did well. Conversely, Japan significantly underperformed, as early optimism was eroded by disappointing economic indicators and concerns about the impact of China's economic slowdown on exports. Meanwhile, technology-focused Asian emerging markets suffered due to a deceleration in corporate capital spending.
For the 12 months ending October 31, 2004, the fund returned 5.98%, trailing the 11.33% return of the Morgan Stanley Capital International All Country Pacific Index and the 8.61% return of the LipperSM Pacific Region Funds Average. Stock selection in the banking industry was particularly detrimental, with most of the damage confined to emerging-markets banks in India and elsewhere. My picks in Japanese diversified financials stocks also held back performance. JAFCO, a Japanese venture capital company with extensive investments in smaller companies, was hurt by a sharp correction in small-cap stocks. Japan-based stock brokerage Mitsubishi Securities declined due in part to a deceleration in trading volume. Counterbalancing these negative influences to some extent was solid stock picking in telecommunication services and in commercial services and supplies. Toyota Motor was the fund's biggest contributor in absolute terms as well as its largest holding at period end, as the company continued to grow its market share. Another strong performer was Esprit Holdings, a Hong Kong-based retailer with extensive operations in Europe. The marketer of casual apparel did a great job of executing its business plan and looked to ramp up operations in the United States.
Note to shareholders: Dale Nicholls became Portfolio Manager of Fidelity Pacific Basin Fund on October 4, 2004.
The views expressed in this statement reflect those of the portfolio manager only through the end of the period of the report as stated on the cover and do not necessarily represent the views of Fidelity or any other person in the Fidelity organization. Any such views are subject to change at any time based upon market or other conditions and Fidelity disclaims any responsibility to update such views. These views may not be relied on as investment advice and, because investment decisions for a Fidelity fund are based on numerous factors, may not be relied on as an indication of trading intent on behalf of any Fidelity fund.
Annual Report
Pacific Basin
Investment Changes
Geographic Diversification (% of fund's net assets) |
As of October 31, 2004 |
| Japan | 50.2% | |
| Australia | 12.8% | |
| Hong Kong | 8.6% | |
| Korea (South) | 8.5% | |
| China | 3.0% | |
| India | 2.9% | |
| Taiwan | 2.7% | |
| Singapore | 2.2% | |
| Indonesia | 1.7% | |
| Other | 7.4% | |

Percentages are adjusted for the effect of futures contracts, if applicable. |
|
As of April 30, 2004 |
| Japan | 57.0% | |
| Korea (South) | 11.3% | |
| Australia | 8.8% | |
| Hong Kong | 5.8% | |
| United States of America | 4.1% | |
| Taiwan | 4.1% | |
| India | 2.3% | |
| Indonesia | 1.7% | |
| Thailand | 1.3% | |
| Other | 3.6% | |

Percentages are adjusted for the effect of futures contracts, if applicable. |
Asset Allocation |
| % of fund's
net assets | % of fund's net assets
6 months ago |
Stocks | 98.6 | 95.9 |
Short-Term Investments and Net Other Assets | 1.4 | 4.1 |
Top Ten Stocks as of October 31, 2004 |
| % of fund's
net assets | % of fund's net assets
6 months ago |
Toyota Motor Corp. (Japan, Automobiles) | 3.9 | 3.4 |
BHP Billiton Ltd. (Australia, Metals & Mining) | 1.7 | 1.0 |
East Japan Railway Co. (Japan, Road & Rail) | 1.6 | 0.5 |
Fuji Photo Film Co. Ltd. (Japan, Leisure Equipment & Products) | 1.5 | 0.4 |
Techtronic Industries Co. Ltd. (Hong Kong, Household Durables) | 1.5 | 0.6 |
Honda Motor Co. Ltd. (Japan, Automobiles) | 1.5 | 0.5 |
Esprit Holdings Ltd. (Hong Kong, Specialty Retail) | 1.3 | 0.9 |
Canon, Inc. (Japan, Office Electronics) | 1.3 | 2.2 |
Yamanouchi Pharmaceutical Co. Ltd. (Japan, Pharmaceuticals) | 1.3 | 1.0 |
Konica Minolta Holdings, Inc. (Japan, Office Electronics) | 1.2 | 0.4 |
| 16.8 | |
Market Sectors as of October 31, 2004 |
| % of fund's
net assets | % of fund's net assets
6 months ago |
Consumer Discretionary | 28.9 | 26.0 |
Financials | 20.8 | 26.4 |
Industrials | 12.7 | 5.9 |
Information Technology | 10.6 | 20.1 |
Health Care | 6.8 | 3.6 |
Materials | 6.6 | 4.0 |
Telecommunication Services | 5.1 | 6.6 |
Consumer Staples | 4.2 | 3.2 |
Energy | 2.5 | 0.1 |
Utilities | 0.4 | 0.0 |
Annual Report
Pacific Basin
Investments October 31, 2004
Showing Percentage of Net Assets
Common Stocks - 98.4% |
| Shares | | Value (Note 1) |
Australia - 12.8% |
ABC Learning Centres Ltd. (d) | 572,818 | | $2,058,708 |
Adsteam Marine Ltd. | 812,416 | | 1,015,855 |
Amcor Ltd. | 191,000 | | 1,091,176 |
AMP Ltd. | 325,806 | | 1,553,944 |
BHP Billiton Ltd. | 726,230 | | 7,505,590 |
Billabong International Ltd. | 330,967 | | 2,602,021 |
Bradken Ltd. | 564,214 | | 1,301,162 |
CSL Ltd. | 192,569 | | 4,152,558 |
DCA Group Ltd. (d) | 1,060,000 | | 2,508,013 |
Downer EDI Ltd. | 896,514 | | 3,047,542 |
Fosters Group Ltd. | 774,660 | | 2,929,135 |
JB Hi-Fi Ltd. | 241,389 | | 647,049 |
Macquarie Airports Fund | 1,470,938 | | 3,116,862 |
Macquarie Bank Ltd. | 90,548 | | 2,684,116 |
Newcrest Mining Ltd. | 269,887 | | 3,366,618 |
News Corp. Ltd. | 1,010 | | 8,146 |
PaperlinX Ltd. | 400,000 | | 1,443,590 |
Promina Group Ltd. | 762,821 | | 2,593,077 |
QBE Insurance Group Ltd. | 260,135 | | 2,674,276 |
Ramsay Health Care Ltd. | 250,588 | | 1,168,921 |
Sonic Healthcare Ltd. | 220,899 | | 1,678,791 |
United Group Ltd. | 705,300 | | 3,580,473 |
Wesfarmers Ltd. | 37,862 | | 985,134 |
Westfield Group unit (a) | 284,478 | | 3,195,044 |
TOTAL AUSTRALIA | | 56,907,801 |
Bermuda - 0.1% |
Skyworth Digital Holdings Ltd. | 1,878,000 | | 645,406 |
Cayman Islands - 0.4% |
Hutchison Telecommunications International Ltd. (a) | 1,380,000 | | 948,521 |
Kingboard Chemical Holdings Ltd. warrants 12/31/06 (a) | 53,400 | | 24,698 |
Lifestyle International Holdings Ltd. | 639,500 | | 903,748 |
TOTAL CAYMAN ISLANDS | | 1,876,967 |
China - 3.0% |
China Petroleum & Chemical Corp.
(H Shares) | 5,086,000 | | 1,951,498 |
China Telecom Corp. Ltd. sponsored ADR | 55,940 | | 1,792,318 |
Global Bio-Chem Technology Group Co. Ltd. | 4,072,000 | | 3,191,182 |
Global Bio-Chem Technology Group Co. Ltd. warrants 5/31/07 (a) | 221,500 | | 15,367 |
Li Ning Co. Ltd. | 1,858,000 | | 734,015 |
People's Food Holdings Ltd. | 2,420,000 | | 1,688,084 |
Ping An Insurance Co. Ltd. | 1,111,500 | | 1,749,281 |
Tong Ren Tang Technologies Co. Ltd.
(H Shares) | 567,000 | | 1,245,642 |
Wumart Stores, Inc. (H Shares) | 20,000 | | 34,174 |
Yanzhou Coal Mining Co. Ltd.
(H Shares) (a) | 856,000 | | 1,127,227 |
TOTAL CHINA | | 13,528,788 |
|
| Shares | | Value (Note 1) |
Hong Kong - 8.6% |
China Overseas Land & Investment Ltd. | 1,944,000 | | $424,580 |
CNOOC Ltd. sponsored ADR | 24,100 | | 1,248,380 |
Cosco Pacific Ltd. | 1,368,000 | | 2,363,863 |
Esprit Holdings Ltd. | 1,098,500 | | 5,870,935 |
Giordano International Ltd. | 2,930,000 | | 1,637,460 |
Henderson Land Development Co. Ltd. | 350,000 | | 1,623,264 |
Hengan International Group Co. Ltd. | 522,000 | | 278,312 |
Hong Kong & China Gas Co. Ltd. | 966,000 | | 1,861,583 |
Hutchison Whampoa Ltd. | 305,000 | | 2,341,271 |
Hutchison Whampoa Ltd. ADR | 41,000 | | 1,568,250 |
Kingboard Chemical Holdings Ltd. | 464,000 | | 971,672 |
Paul Y-ITC Construction Holdings Ltd. | 11,122,000 | | 1,643,216 |
PCCW Ltd. (a) | 1,783,000 | | 1,082,348 |
Shun Tak Holdings Ltd. | 3,544,000 | | 2,196,873 |
Solomon Systech Ltd. | 8,776,000 | | 2,221,144 |
Techtronic Industries Co. Ltd. | 3,330,000 | | 6,631,165 |
Television Broadcasts Ltd. | 511,000 | | 2,186,145 |
Wharf Holdings Ltd. | 582,000 | | 1,914,154 |
TOTAL HONG KONG | | 38,064,615 |
India - 2.9% |
Bank of Baroda | 400,000 | | 1,359,215 |
Cipla Ltd. | 195,923 | | 1,207,043 |
Crompton Greaves Ltd. | 109,301 | | 581,404 |
Geodesic Information Systems Ltd. | 54,310 | | 591,019 |
Housing Development Finance Corp. Ltd. | 150,000 | | 2,118,893 |
Infosys Technologies Ltd. | 98,772 | | 4,153,392 |
Kotak Mahindra Bank Ltd. | 217,829 | | 862,475 |
Larsen & Toubro Ltd. | 48,564 | | 889,385 |
National Thermal Power Corp. | 38,900 | | 53,200 |
Pantaloon Retail India Ltd. | 97,649 | | 1,058,663 |
TOTAL INDIA | | 12,874,689 |
Indonesia - 1.7% |
PT Astra International Tbk | 1,855,000 | | 1,602,390 |
PT Indosat Tbk | 4,913,285 | | 2,554,632 |
PT Panin Life Tbk (a) | 53,000,000 | | 758,182 |
PT Telkomunikasi Indonesia Tbk Series B | 5,140,000 | | 2,460,407 |
TOTAL INDONESIA | | 7,375,611 |
Japan - 50.2% |
Aisin Seiki Co. Ltd. | 203,300 | | 4,562,172 |
Asahi Broadcasting Corp. | 30 | | 1,930 |
Bookoff Corp. | 73,000 | | 1,109,812 |
Bridgestone Corp. | 261,000 | | 4,734,918 |
Canon, Inc. | 114,700 | | 5,677,650 |
Casio Computer Co. Ltd. | 153,000 | | 1,820,069 |
Chugai Pharmaceutical Co. Ltd. | 167,100 | | 2,620,929 |
Circle K Sunkus Co. Ltd. (a) | 74,800 | | 1,798,706 |
Cosmo Oil Co. Ltd. | 304,000 | | 858,846 |
Diamond Lease Co. Ltd. | 63,000 | | 2,256,059 |
Don Quijote Co. Ltd. (d) | 63,400 | | 3,809,931 |
East Japan Railway Co. | 1,323 | | 6,962,829 |
Common Stocks - continued |
| Shares | | Value (Note 1) |
Japan - continued |
Fast Retailing Co. Ltd. | 20,800 | | $1,324,628 |
Fuji Fire & Marine Insurance Co. Ltd. (d) | 318,000 | | 1,003,562 |
Fuji Photo Film Co. Ltd. | 200,000 | | 6,840,837 |
Fuji Seal International, Inc. | 52,300 | | 2,248,453 |
Fujitsu Ltd. | 364,000 | | 2,170,208 |
Fullcast Co. Ltd. (d) | 831 | | 1,719,554 |
H.I.S. Co. Ltd. (d) | 133,000 | | 2,569,897 |
H.I.S. Co. Ltd. New (a) | 66,000 | | 1,247,224 |
Hamakyorex Co. Ltd. | 37,200 | | 1,230,217 |
Hikari Tsushin, Inc. (d) | 85,000 | | 5,091,888 |
Honda Motor Co. Ltd. | 134,800 | | 6,548,584 |
Honeys Co. Ltd. | 1,800 | | 54,424 |
Hoya Corp. | 44,400 | | 4,564,388 |
Intelligent Wave, Inc. | 169 | | 279,444 |
Ito Yokado Ltd. | 80,700 | | 2,897,529 |
JAFCO Co. Ltd. | 37,300 | | 1,920,773 |
Japan Retail Fund Investment Corp. | 324 | | 2,592,980 |
Kadokawa Shoten Publishing Co. Ltd. (d) | 32,000 | | 1,248,736 |
Kaneka Corp. | 228,000 | | 2,380,498 |
KDDI Corp. | 228 | | 1,098,691 |
Keio Electric Railway Co. Ltd. | 328,000 | | 1,738,631 |
Konica Minolta Holdings, Inc. | 388,000 | | 5,183,843 |
Kose Corp. | 49,100 | | 1,920,669 |
Koyo Seiko Co. Ltd. | 131,000 | | 1,480,380 |
Mars Engineering Corp. | 10,700 | | 402,381 |
Matsushita Electric Industrial Co. Ltd. | 140,000 | | 2,031,400 |
Millea Holdings, Inc. | 386 | | 5,106,061 |
Mitsubishi Securities Co. Ltd. | 262,000 | | 2,438,418 |
Mitsui & Co. Ltd. | 275,000 | | 2,315,160 |
Mizuho Financial Group, Inc. | 818 | | 3,161,166 |
Nintendo Co. Ltd. | 38,000 | | 4,294,232 |
Nippon Chemi-con Corp. (d) | 439,000 | | 2,148,646 |
Nippon Electric Glass Co. Ltd. | 200,000 | | 4,469,221 |
Nippon Mining Holdings, Inc. | 542,500 | | 2,583,455 |
Nippon Shinpan Co. Ltd. | 532,000 | | 1,613,568 |
Nishi-Nippon City Bank Ltd. | 187,300 | | 833,546 |
Nishimatsuya Chain Co. Ltd. | 43,800 | | 1,514,697 |
Nitto Denko Corp. | 50,000 | | 2,376,341 |
NOK Corp. | 90,500 | | 2,753,437 |
NTT Urban Development Co. (a) | 9 | | 38,267 |
OMC Card, Inc. (a)(d) | 308,000 | | 3,466,037 |
ORIX Corp. | 38,300 | | 4,498,219 |
Ricoh Co. Ltd. | 242,000 | | 4,527,425 |
Rinnai Corp. | 65,200 | | 1,777,314 |
Riso Kyoiku Co. Ltd. (d) | 915 | | 485,879 |
Riso Kyoiku Co. Ltd. New (a)(d) | 1,830 | | 899,135 |
Ryohin Keikaku Co. Ltd. (d) | 72,100 | | 3,229,121 |
Sanden Corp. | 304,000 | | 1,987,698 |
SFCG Co. Ltd. | 22,780 | | 4,795,563 |
Softbank Corp. (d) | 68,300 | | 3,097,652 |
Stanley Electric Co. Ltd. | 179,900 | | 2,779,199 |
|
| Shares | | Value (Note 1) |
STB Leasing Co. Ltd. | 14,300 | | $301,308 |
Sumisho Lease Co. Ltd. | 34,300 | | 1,328,766 |
Sumitomo Forestry Co. Ltd. | 325,000 | | 3,083,101 |
Sumitomo Mitsui Financial Group, Inc. (d) | 633 | | 4,120,915 |
Sumitomo Rubber Industries Ltd. | 233,000 | | 1,987,991 |
T&D Holdings, Inc. (a) | 56,700 | | 2,507,261 |
Takeda Pharamaceutical Co. Ltd. | 71,400 | | 3,454,131 |
Teijin Ltd. | 351,000 | | 1,366,391 |
Terumo Corp. | 80,000 | | 1,995,559 |
Toray Industries, Inc. | 97,000 | | 453,678 |
Toyota Motor Corp. | 446,200 | | 17,310,322 |
Tv Asahi Corp. | 670 | | 1,392,734 |
UFJ Holdings, Inc. (a) | 977 | | 4,541,825 |
USS Co. Ltd. | 57,480 | | 4,654,449 |
Yamanouchi Pharmaceutical Co. Ltd. | 152,900 | | 5,619,889 |
Yamato Transport Co. Ltd. | 313,000 | | 4,226,173 |
TOTAL JAPAN | | 223,537,620 |
Korea (South) - 8.3% |
AmorePacific Corp. | 13,970 | | 2,732,854 |
GS Holdings Corp. (a) | 31,181 | | 662,892 |
Hana Bank | 69,910 | | 1,745,408 |
Hyundai Department Store Co. Ltd. | 65,950 | | 1,914,583 |
Hyundai Engineering & Construction Co. Ltd. (a) | 73,570 | | 1,025,183 |
Hyundai Mipo Dockyard Co. Ltd. (a) | 64,530 | | 1,729,254 |
Hyundai Motor Co. | 101,540 | | 4,925,076 |
Hyundai Securities Co. Ltd. (a) | 336,980 | | 1,173,937 |
Interflex Co. Ltd. | 76,043 | | 1,192,099 |
Kia Motors Corp. | 214,590 | | 2,012,680 |
Kookmin Bank (a) | 59,240 | | 1,979,077 |
Korea Exchange Bank (a) | 166,000 | | 1,104,690 |
Kumho Electric Co. Ltd. | 59,620 | | 1,347,375 |
LG Corp. | 57,908 | | 770,727 |
LG Electronics, Inc. | 30,000 | | 1,693,613 |
NCsoft Corp. (a) | 7,190 | | 687,209 |
Pulmuone Co. Ltd. | 37,530 | | 1,389,566 |
Shinhan Financial Group Co. Ltd. | 162,000 | | 3,190,800 |
Shinsegae Co. Ltd. | 9,510 | | 2,675,882 |
SK Corp. | 53,630 | | 2,802,461 |
TOTAL KOREA (SOUTH) | | 36,755,366 |
Malaysia - 0.9% |
Public Bank BHD (For. Reg.) | 1,342,556 | | 2,455,464 |
Telekom Malaysia BHD | 500,000 | | 1,513,158 |
TOTAL MALAYSIA | | 3,968,622 |
Netherlands - 0.5% |
James Hardie Industries NV | 478,104 | | 2,255,276 |
New Zealand - 1.0% |
Carter Holt Harvey Ltd. | 555,108 | | 817,058 |
Common Stocks - continued |
| Shares | | Value (Note 1) |
New Zealand - continued |
Telecom Corp. of New Zealand Ltd. | 674,200 | | $2,679,102 |
The Warehouse Group Ltd. | 375,000 | | 1,047,438 |
TOTAL NEW ZEALAND | | 4,543,598 |
Philippines - 1.1% |
Philippine Long Distance Telephone Co. (a) | 53,000 | | 1,323,117 |
Philippine Long Distance Telephone Co. sponsored ADR (a)(d) | 140,000 | | 3,514,000 |
TOTAL PHILIPPINES | | 4,837,117 |
Singapore - 2.2% |
Accord Customer Care Solutions Ltd. (a) | 2,634,000 | | 1,219,628 |
CapitaLand Ltd. | 1,145,000 | | 1,273,791 |
ComfortDelgro Corp. Ltd. | 1,376,000 | | 1,183,247 |
DBS Group Holdings Ltd. | 112,000 | | 1,050,663 |
Fortune Real Estate Investment Trust | 639,000 | | 496,673 |
Great Eastern Holdings Ltd. | 47,000 | | 330,677 |
HTL International Holdings Ltd. | 3,177,000 | | 2,254,343 |
Oversea-Chinese Banking Corp. Ltd. | 264,000 | | 2,190,805 |
TOTAL SINGAPORE | | 9,999,827 |
Taiwan - 2.7% |
Cathay Financial Holding Co. Ltd. | 530,000 | | 1,014,202 |
Chinatrust Financial Holding Co. | 1,715,494 | | 1,954,263 |
Far EasTone Telecommunications Co. Ltd. | 1,979,700 | | 2,113,180 |
Hon Hai Precision Industries Co. Ltd. | 114,599 | | 421,458 |
Merry Electronics Co. Ltd. | 969,892 | | 2,189,471 |
Taishin Financial Holdings Co. Ltd. | 2,544,026 | | 2,076,601 |
Taiwan Fertilizer Co. Ltd. | 1,056,000 | | 934,597 |
Yuen Foong Yu Paper Manufacturing Co. | 2,337,000 | | 1,090,064 |
TOTAL TAIWAN | | 11,793,836 |
Thailand - 1.0% |
Advanced Info Service PCL (For. Reg.) | 1,045,500 | | 2,380,766 |
Siam Cement PCL (For. Reg.) | 179,200 | | 1,117,272 |
Thai Oil PCL (a) | 992,000 | | 996,590 |
True Corp. PCL (a) | 1 | | 0 |
True Corp. PCL rights 4/30/08 (a) | 206,113 | | 0 |
TOTAL THAILAND | | 4,494,628 |
United Kingdom - 0.8% |
Astro All Asia Networks PLC | 988,800 | | 1,353,095 |
HSBC Holdings PLC (Hong Kong) (Reg.) | 136,344 | | 2,209,591 |
TOTAL UNITED KINGDOM | | 3,562,686 |
United States of America - 0.2% |
ResMed, Inc. CHESS Depositary Interests (a) | 207,151 | | 984,912 |
TOTAL COMMON STOCKS (Cost $399,800,222) | 438,007,365 |
Nonconvertible Preferred Stocks - 0.2% |
| Shares | | Value (Note 1) |
Korea (South) - 0.2% |
LG Electronics, Inc.
(Cost $845,811) | 26,450 | | $848,196 |
Money Market Funds - 6.6% |
| | | |
Fidelity Cash Central Fund, 1.79% (b) | 4,601,246 | | 4,601,246 |
Fidelity Securities Lending Cash Central Fund, 1.77% (b)(c) | 24,784,119 | | 24,784,119 |
TOTAL MONEY MARKET FUNDS (Cost $29,385,365) | 29,385,365 |
TOTAL INVESTMENT PORTFOLIO - 105.2% (Cost $430,031,398) | 468,240,926 |
NET OTHER ASSETS - (5.2)% | (23,113,744) |
NET ASSETS - 100% | $445,127,182 |
Legend |
(a)Non-income producing |
(b)Affiliated fund that is available only to investment companies and other accounts managed by Fidelity Investments. The rate quoted is the annualized seven-day yield of the fund at period end. A complete listing of the fund's holdings as of its most recent fiscal year end is available upon request. |
(c)Includes investment made with cash collateral received from securities on loan. |
(d)Security or a portion of the security is on loan at period end. |
Income Tax Information |
At October 31, 2004, the fund had a capital loss carryforward of approximately $43,208,000 of which $12,714,000 and $30,494,000 will expire on October 31, 2009 and 2010, respectively. |
See accompanying notes which are an integral part of the financial statements.
Annual Report
Pacific Basin
Financial Statements
Statement of Assets and Liabilities
| October 31, 2004 |
| | |
Assets | | |
Investment in securities, at value (including securities loaned of $23,468,024) (cost $430,031,398) - See accompanying schedule | | $468,240,926 |
Cash | | 36 |
Foreign currency held at value (cost $1,442,497) | | 1,460,505 |
Receivable for investments sold | | 6,094,976 |
Receivable for fund shares sold | | 446,776 |
Dividends receivable | | 944,914 |
Interest receivable | | 11,729 |
Other affiliated receivables | | 1,060 |
Other receivables | | 23,405 |
Total assets | | 477,224,327 |
| | |
Liabilities | | |
Payable for investments purchased | $5,425,459 | |
Payable for fund shares redeemed | 1,193,420 | |
Accrued management fee | 254,617 | |
Other affiliated payables | 127,215 | |
Other payables and accrued expenses | 312,315 | |
Collateral on securities loaned, at value | 24,784,119 | |
Total liabilities | | 32,097,145 |
| | |
Net Assets | | $445,127,182 |
Net Assets consist of: | | |
Paid in capital | | $449,819,769 |
Undistributed net investment income | | 1,854,449 |
Accumulated undistributed net realized gain (loss) on investments and foreign currency transactions | | (44,662,362) |
Net unrealized appreciation (depreciation) on investments and assets and liabilities in foreign currencies | | 38,115,326 |
Net Assets, for 24,856,506 shares outstanding | | $445,127,182 |
Net Asset Value, offering price and redemption price per share ($445,127,182 ÷ 24,856,506 shares) | | $17.91 |
Statement of Operations
| Year ended October 31, 2004 |
| | |
Investment Income | | |
Dividends | | $7,433,788 |
Interest | | 149,926 |
Security lending | | 188,446 |
| | 7,772,160 |
Less foreign taxes withheld | | (535,472) |
Total income | | 7,236,688 |
| | |
Expenses | | |
Management fee
Basic fee | $3,248,945 | |
Performance adjustment | 74,097 | |
Transfer agent fees | 1,302,494 | |
Accounting and security lending fees | 235,273 | |
Non-interested trustees' compensation | 2,937 | |
Custodian fees and expenses | 305,362 | |
Registration fees | 33,536 | |
Audit | 61,347 | |
Legal | 1,668 | |
Miscellaneous | 93,699 | |
Total expenses before reductions | 5,359,358 | |
Expense reductions | (12,447) | 5,346,911 |
Net investment income (loss) | | 1,889,777 |
Realized and Unrealized Gain (Loss) Net realized gain (loss) on: | | |
Investment securities (net of foreign taxes of $74) | 37,694,578 | |
Foreign currency transactions | (316,537) | |
Total net realized gain (loss) | | 37,378,041 |
Change in net unrealized appreciation (depreciation) on: Investment securities (net of increase in deferred foreign taxes of $142,747) | (19,766,922) | |
Assets and liabilities in foreign currencies | 46,006 | |
Total change in net unrealized appreciation (depreciation) | | (19,720,916) |
Net gain (loss) | | 17,657,125 |
Net increase (decrease) in net assets resulting from operations | | $19,546,902 |
See accompanying notes which are an integral part of the financial statements.
Annual Report
Pacific Basin
Financial Statements - continued
Statement of Changes in Net Assets
| Year ended
October 31,
2004 | Year ended
October 31,
2003 |
Increase (Decrease) in Net Assets | | |
Operations | | |
Net investment income (loss) | $1,889,777 | $1,265,331 |
Net realized gain (loss) | 37,378,041 | 17,361,391 |
Change in net unrealized appreciation (depreciation) | (19,720,916) | 74,374,239 |
Net increase (decrease) in net assets resulting from operations | 19,546,902 | 93,000,961 |
Distributions to shareholders from net investment income | (3,891,845) | - |
Share transactions
Proceeds from sales of shares | 173,753,484 | 143,881,790 |
Reinvestment of distributions | 3,503,557 | - |
Cost of shares redeemed | (167,584,200) | (124,105,198) |
Net increase (decrease) in net assets resulting from share transactions | 9,672,841 | 19,776,592 |
Redemption fees | 548,652 | 267,285 |
Total increase (decrease) in net assets | 25,876,550 | 113,044,838 |
| | |
Net Assets | | |
Beginning of period | 419,250,632 | 306,205,794 |
End of period (including undistributed net investment income of $1,854,449 and undistributed net investment income of $1,925,015, respectively) | $445,127,182 | $419,250,632 |
Other Information Shares | | |
Sold | 9,569,285 | 9,944,998 |
Issued in reinvestment of distributions | 207,801 | - |
Redeemed | (9,495,851) | (9,417,585) |
Net increase (decrease) | 281,235 | 527,413 |
Financial Highlights
Years ended October 31, | 2004 | 2003 | 2002 | 2001 | 2000 |
Selected Per-Share Data | | | | | |
Net asset value, beginning of period | $17.06 | $12.73 | $13.09 | $20.32 | $22.48 |
Income from Investment Operations | | | | | |
Net investment income (loss) D | .07 | .06 | (.02) | (.02) | (.10) |
Net realized and unrealized gain (loss) | .92 | 4.26 | (.36) | (5.91) | (1.86) |
Total from investment operations | .99 | 4.32 | (.38) | (5.93) | (1.96) |
Distributions from net investment income | (.16) | - | - | (1.10) | - |
Distributions in excess of net investment income | - | - | - | - | (.28) |
Distributions from net realized gain | - | - | - | (.23) | - |
Total distributions | (.16) | - | - | (1.33) | (.28) |
Redemption fees added to paid in capital D | .02 | .01 | .02 | .03 | .08 |
Net asset value, end of period | $17.91 | $17.06 | $12.73 | $13.09 | $20.32 |
Total Return A, B, C | 5.98% | 34.01% | (2.75)% | (30.79)% | (8.61)% |
Ratios to Average Net Assets E | | | | | |
Expenses before expense reductions | 1.20% | 1.17% | 1.51% | 1.48% | 1.25% |
Expenses net of voluntary waivers, if any | 1.20% | 1.17% | 1.51% | 1.48% | 1.25% |
Expenses net of all reductions | 1.19% | 1.17% | 1.50% | 1.45% | 1.22% |
Net investment income (loss) | .42% | .41% | (.15)% | (.11)% | (.42)% |
Supplemental Data | | | | | |
Net assets, end of period (000 omitted) | $445,127 | $419,251 | $306,206 | $303,672 | $516,769 |
Portfolio turnover rate | 145% | 97% | 98% | 123% | 144% |
A Total returns would have been lower had certain expenses not been reduced during the periods shown. B Total returns do not include the effect of the former sales charges. C Total returns do not include the effect of the contingent deferred sales charge. D Calculated based on average shares outstanding during the period. E Expense ratios reflect operating expenses of the fund. Expenses before reductions do not reflect amounts reimbursed by the investment adviser or reductions from brokerage service arrangements or other expense offset arrangements and do not represent the amount paid by the fund during periods when reimbursements or reductions occur. Expenses net of any voluntary waivers reflect expenses after reimbursement by the investment adviser but prior to reductions from brokerage service arrangements or other expense offset arrangements. Expenses net of all reductions represent the net expenses paid by the fund. |
See accompanying notes which are an integral part of the financial statements.
Annual Report
Southeast Asia
Performance: The Bottom Line
Average annual total return reflects the change in the value of an investment, assuming reinvestment of the fund's dividend income and capital gains (the profits earned upon the sale of securities that have grown in value) and assuming a constant rate of performance each year. The $10,000 table and the fund's returns do not reflect the deduction of taxes that a shareholder would pay on fund distributions or the redemption of fund shares. During periods of reimbursement by Fidelity, a fund's total returns will be greater than it would be had the reimbursement not occurred. How a fund did yesterday is no guarantee of how it will do tomorrow.
Average Annual Total Returns
Periods ended
October 31, 2004 | Past 1
year | Past 5
years | Past 10
years |
Fidelity Southeast Asia Fund | 9.39% | 4.56% | 1.01% |
$10,000 Over 10 Years
Let's say hypothetically that $10,000 was invested in Fidelity Southeast Asia Fund on October 31, 1994. The chart shows how the value of your investment would have changed, and also shows how the MSCI AC Far East ex Japan Index performed over the same period.
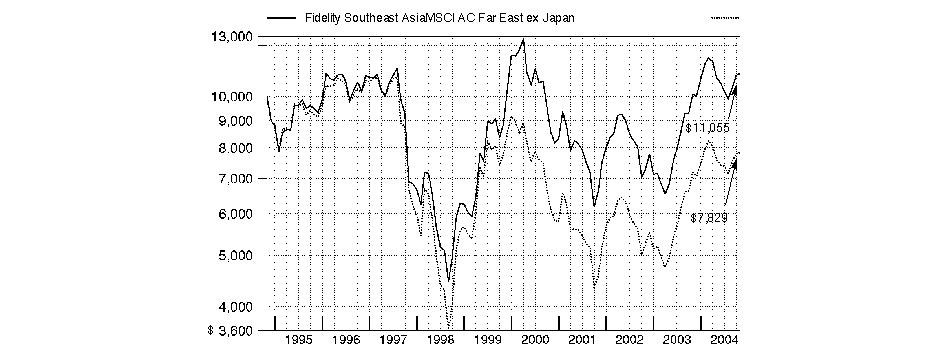
Annual Report
Southeast Asia
Management's Discussion of Fund Performance
Comments from Allan Liu, Portfolio Manager of Fidelity® Southeast Asia Fund
Most of the world's major stock markets posted solid gains for the year ending October 31, 2004. The Morgan Stanley Capital InternationalSM Europe, Australasia, Far East (MSCI® EAFE®) Index - designed to represent the performance of developed stock markets outside the United States and Canada - gained 19.00%, compared to 9.42% for the Standard & Poor's 500SM Index. A weak U.S. dollar relative to most foreign currencies was partly responsible for the performance disparity. On a regional basis, Europe was one of the top performers. Many investors felt European stocks offered better valuations and brighter earnings prospects than U.S. equities. Latin American countries, many of which are exporters of oil and materials that received strong support from high commodity prices, also did well. Conversely, Japan significantly underperformed, as early optimism was eroded by disappointing economic indicators and concerns about the impact of China's economic slowdown on exports. Meanwhile, technology-focused Asian emerging markets suffered due to a deceleration in corporate capital spending.
For the 12 months ending October 31, 2004, the fund returned 9.39%, edging the 9.00% return of the Morgan Stanley Capital International All Country Far East ex Japan Index. However, the fund trailed the 10.96% return of the LipperSM Pacific Region ex Japan Funds Average. Stock picking in semiconductors, transportation, real estate and energy added to performance compared with the index, while my picks in capital goods, an underweighting in utilities, and an overweighting in consumer durables and apparel detracted from performance. South Korea-based oil refiner SK Corp. was a top contributor both in absolute terms and compared with the index. Tight refining capacity due to underinvestment in the industry during the past decade or so enabled the company to enjoy improving profit margins. Korea Line - a shipping company - benefited from an inexpensive valuation and active commerce throughout the Pacific Basin. Conversely, LG Electronics - a leading Korean maker of thin-film-transistor liquid crystal displays (TFT-LCDs), wireless handsets and electrical appliances - suffered weakness in its display division and was a major detractor. In China, automaker Geely Auto Holdings declined following news of the government's credit-tightening measures.
The views expressed in this statement reflect those of the portfolio manager only through the end of the period of the report as stated on the cover and do not necessarily represent the views of Fidelity or any other person in the Fidelity organization. Any such views are subject to change at any time based upon market or other conditions and Fidelity disclaims any responsibility to update such views. These views may not be relied on as investment advice and, because investment decisions for a Fidelity fund are based on numerous factors, may not be relied on as an indication of trading intent on behalf of any Fidelity fund.
Annual Report
Southeast Asia
Investment Changes
Geographic Diversification (% of fund's net assets) |
As of October 31, 2004 |
| Korea (South) | 29.0% | |
| Hong Kong | 21.8% | |
| Taiwan | 12.3% | |
| China | 11.3% | |
| Indonesia | 5.8% | |
| Singapore | 5.8% | |
| Thailand | 4.7% | |
| Malaysia | 4.0% | |
| United Kingdom | 1.5% | |
| Other | 3.8% | |

Percentages are adjusted for the effect of futures contracts, if applicable. |
|
As of April 30, 2004 |
| Korea (South) | 33.3% | |
| Hong Kong | 20.2% | |
| Taiwan | 14.9% | |
| China | 6.1% | |
| Malaysia | 5.9% | |
| Thailand | 4.6% | |
| Singapore | 4.0% | |
| Indonesia | 2.9% | |
| United Kingdom | 2.1% | |
| Other | 6.0% | |

Percentages are adjusted for the effect of futures contracts, if applicable. |
Asset Allocation |
| % of fund's
net assets | % of fund's net assets
6 months ago |
Stocks | 98.6 | 98.1 |
Short-Term Investments and Net Other Assets | 1.4 | 1.9 |
Top Ten Stocks as of October 31, 2004 |
| % of fund's
net assets | % of fund's net assets
6 months ago |
Samsung Electronics Co. Ltd. (Korea (South), Semiconductors & Semiconductor Equipment) | 6.1 | 9.7 |
Hutchison Whampoa Ltd. (Hong Kong, Industrial Conglomerates) | 2.8 | 0.0 |
Shinhan Financial Group Co. Ltd. (Korea (South), Commercial Banks) | 2.4 | 2.0 |
Cheung Kong Holdings Ltd.
(Hong Kong, Real Estate) | 2.0 | 1.8 |
POSCO (Korea (South), Metals & Mining) | 1.9 | 0.0 |
Hana Bank (Korea (South), Commercial Banks) | 1.7 | 1.5 |
Esprit Holdings Ltd. (Hong Kong, Specialty Retail) | 1.6 | 1.2 |
PetroChina Co. Ltd. (H Shares) (China, Oil & Gas) | 1.6 | 0.5 |
HSBC Holdings PLC (Hong Kong) (Reg.) (United Kingdom, Commercial Banks) | 1.5 | 2.1 |
Sun Hung Kai Properties Ltd. (Hong Kong, Real Estate) | 1.4 | 1.8 |
| 23.0 | |
Market Sectors as of October 31, 2004 |
| % of fund's
net assets | % of fund's net assets
6 months ago |
Financials | 25.3 | 26.8 |
Materials | 16.5 | 13.1 |
Information Technology | 14.2 | 23.8 |
Industrials | 11.6 | 5.4 |
Consumer Discretionary | 10.7 | 15.0 |
Energy | 7.1 | 4.9 |
Telecommunication Services | 6.5 | 3.6 |
Consumer Staples | 4.5 | 3.9 |
Utilities | 1.3 | 0.5 |
Health Care | 0.9 | 1.1 |
Annual Report
Southeast Asia
Investments October 31, 2004
Showing Percentage of Net Assets
Common Stocks - 95.5% |
| Shares | | Value (Note 1) |
Australia - 1.0% |
Adsteam Marine Ltd. | 1,055,000 | | $1,319,185 |
Bradken Ltd. | 500,803 | | 1,154,927 |
Caltex Australia Ltd. | 345,000 | | 2,306,786 |
TOTAL AUSTRALIA | | 4,780,898 |
Bermuda - 0.1% |
GOME Electrical Appliances Holdings Ltd. (a) | 359,000 | | 288,263 |
Ports Design Ltd. | 24,500 | | 46,585 |
TOTAL BERMUDA | | 334,848 |
Cayman Islands - 0.1% |
Kingboard Chemical Holdings Ltd. warrants 12/31/06 (a) | 175,000 | | 80,938 |
Lifestyle International Holdings Ltd. | 300,000 | | 423,963 |
TOTAL CAYMAN ISLANDS | | 504,901 |
China - 11.3% |
Angang New Steel Co. Ltd. (H Shares) | 1,000,000 | | 404,692 |
Anhui Expressway Co. Ltd. (H Shares) | 4,200,000 | | 2,023,459 |
China Mengniu Dairy Co. Ltd. | 2,036,000 | | 1,687,141 |
China Petroleum & Chemical Corp. (H Shares) | 13,940,000 | | 5,348,778 |
China Shipping Container Lines Co. Ltd. (H Shares) | 2,200,000 | | 918,586 |
China Shipping Development Co. Ltd. (H Shares) | 3,540,000 | | 2,956,178 |
China Telecom Corp. Ltd. (H Shares) | 12,520,000 | | 4,011,408 |
Global Bio-Chem Technology Group Co. Ltd. | 5,440,000 | | 4,263,268 |
Global Bio-Chem Technology Group Co. Ltd. warrants 5/31/07 (a) | 665,000 | | 46,135 |
Jiangxi Copper Co. Ltd. (H Shares) | 2,500,000 | | 1,324,884 |
Li Ning Co. Ltd. | 4,148,000 | | 1,638,694 |
Maanshan Iron & Steel Co. Ltd. (H Shares) | 5,800,000 | | 2,030,525 |
PetroChina Co. Ltd. (H Shares) | 13,880,000 | | 7,303,656 |
Ping An Insurance Co. Ltd. | 3,221,085 | | 5,069,349 |
Sinopec Beijing Yanhua Petrochemical Co. Ltd. (H Shares) | 7,300,000 | | 2,649,447 |
Sinopec Shanghai Petrochemical Co. Ltd. (H Shares) | 9,100,000 | | 3,185,824 |
Sinopec Zhenhai Refining & Chemical Co. Ltd. (H Shares) | 2,838,000 | | 2,716,330 |
Wumart Stores, Inc. (H Shares) | 979,000 | | 1,672,816 |
Yanzhou Coal Mining Co. Ltd. (H Shares) (a) | 2,560,000 | | 3,371,147 |
TOTAL CHINA | | 52,622,317 |
Hong Kong - 21.8% |
Cheung Kong Holdings Ltd. | 1,142,000 | | 9,463,237 |
CNOOC Ltd. | 6,190,000 | | 3,206,420 |
Dah Sing Banking Group Ltd. | 1,848,400 | | 3,728,289 |
Dickson Concepts International Ltd. | 289,300 | | 241,588 |
Esprit Holdings Ltd. | 1,432,000 | | 7,653,327 |
|
| Shares | | Value (Note 1) |
Giordano International Ltd. | 4,080,000 | | $2,280,150 |
Great Eagle Holdings Ltd. | 2,020,000 | | 4,126,315 |
Henderson Land Development Co. Ltd. | 729,000 | | 3,381,027 |
Hong Kong & China Gas Co. Ltd. | 1,680,000 | | 3,237,535 |
Hong Kong Electric Holdings Ltd. | 368,000 | | 1,645,284 |
Hutchison Whampoa Ltd. | 1,694,000 | | 13,003,649 |
Hysan Development Co. Ltd. | 1,204,917 | | 1,996,920 |
Kerry Properties Ltd. | 1,034,864 | | 1,994,291 |
Kingboard Chemical Holdings Ltd. | 2,330,000 | | 4,879,299 |
Midland Realty Holdings Ltd. | 4,160,000 | | 1,843,853 |
New World Development Co. Ltd. | 3,945,987 | | 3,447,295 |
Next Media Ltd. (a) | 4,232,000 | | 1,658,286 |
Shanghai Forte Land Co. Ltd. (H Shares) | 9,100,000 | | 2,805,864 |
Shun Tak Holdings Ltd. | 3,580,000 | | 2,219,189 |
Sina Corp. (a) | 76,000 | | 2,546,000 |
Sino Land Co. | 1,800,000 | | 1,537,829 |
Solomon Systech Ltd. | 7,070,000 | | 1,789,368 |
Sun Hung Kai Properties Ltd. | 728,310 | | 6,736,940 |
Swire Pacific Ltd. (A Shares) | 712,000 | | 5,031,026 |
Techtronic Industries Co. Ltd. | 2,408,000 | | 4,795,149 |
Wharf Holdings Ltd. | 924,000 | | 3,038,966 |
Wing Hang Bank Ltd. | 256,000 | | 1,751,352 |
Wing Lung Bank Ltd. | 184,000 | | 1,418,349 |
TOTAL HONG KONG | | 101,456,797 |
Indonesia - 5.8% |
Energi Mega Persada Tbk PT | 12,000,000 | | 726,271 |
PT Bank Danamon Indonesia Tbk | 1,900,000 | | 747,454 |
PT Bank Mandiri Persero Tbk | 34,600,000 | | 5,996,684 |
PT Berlian Laju Tanker Tbk | 3,500,000 | | 481,429 |
PT Bumi Resources Tbk | 64,496,000 | | 5,145,473 |
PT Hanjaya Mandala Sampoerna Tbk | 5,150,000 | | 3,400,267 |
PT Indosat Tbk | 6,500,000 | | 3,379,634 |
PT International Nickel Indonesia Tbk | 1,120,000 | | 1,300,244 |
PT Telkomunikasi Indonesia Tbk Series B | 9,500,000 | | 4,547,444 |
Tambang Batubbara Bukit Asam Tbk PT | 8,200,000 | | 834,661 |
United Tractors TBK PT (a) | 3,000,000 | | 610,728 |
TOTAL INDONESIA | | 27,170,289 |
Korea (South) - 25.9% |
Ace Digitech Co. Ltd. (a) | 202,047 | | 1,303,063 |
Daewoo Heavy Industries & Machinery Ltd. (a) | 420,790 | | 3,318,960 |
Hana Bank | 310,240 | | 7,745,609 |
Hanjin Shipping Co. Ltd. | 52,260 | | 1,005,988 |
Hanshin Construction Co. Ltd. | 109,330 | | 788,114 |
Hanwha Chemical Corp. | 535,000 | | 4,253,238 |
Honam Petrochemical Corp. | 79,250 | | 3,100,626 |
Hyundai Department Store Co. Ltd. | 96,000 | | 2,786,959 |
Hyundai Mobis | 60,500 | | 3,102,010 |
Hyundai Motor Co. | 58,948 | | 2,859,202 |
INI Steel Co. | 98,000 | | 1,037,338 |
Interflex Co. Ltd. | 4,903 | | 76,863 |
INTOPS Co. Ltd. | 53,000 | | 740,911 |
Common Stocks - continued |
| Shares | | Value (Note 1) |
Korea (South) - continued |
Korea Line Corp. | 106,810 | | $3,339,304 |
Kumho Electric Co. Ltd. | 46,650 | | 1,054,261 |
Kyeryong Construction Industrial Co. Ltd. | 67,900 | | 849,129 |
LG Electronics, Inc. | 95,880 | | 5,412,788 |
LG Petrochemical Co. Ltd. | 90,000 | | 2,186,691 |
LG.Philips LCD Co. Ltd. ADR (d) | 182,000 | | 2,466,100 |
Lightron Fiber-Optic Devices, Inc. | 50,000 | | 408,665 |
NCsoft Corp. (a) | 34,380 | | 3,285,985 |
NHN Corp. | 7,000 | | 543,368 |
POSCO | 60,000 | | 8,977,223 |
Pulmuone Co. Ltd. | 23,000 | | 851,586 |
S-Oil Corp. | 36,000 | | 1,816,883 |
Samsung Corp. | 70,000 | | 981,688 |
Samsung Electronics Co. Ltd. | 71,874 | | 28,216,726 |
Samsung SDI Co. Ltd. | 53,340 | | 4,812,274 |
Shinhan Financial Group Co. Ltd. | 579,670 | | 11,417,351 |
Shinsegae Co. Ltd. | 23,000 | | 6,471,640 |
SK Corp. | 90,500 | | 4,729,121 |
Ssangyong Engineering & Construction Co. Ltd. (a) | 70,000 | | 564,627 |
TOTAL KOREA (SOUTH) | | 120,504,291 |
Malaysia - 4.0% |
Bintulu Port Holdings BHD | 500,000 | | 463,158 |
British American Tobacco (Malaysia) BHD | 180,000 | | 2,155,263 |
IOI Corp. BHD | 890,000 | | 2,225,000 |
Kuala Lumpur Kepong BHD | 500,000 | | 875,000 |
Lion Industries Corp. BHD | 2,500,000 | | 875,000 |
Malayan Banking BHD | 680,000 | | 1,968,421 |
Malaysian International Shipping Corp. BHD (For. Reg.) | 140,000 | | 497,368 |
Public Bank BHD (For. Reg.) | 2,450,625 | | 4,482,064 |
Sunrise BHD | 1,637,280 | | 745,393 |
Sunway Holdings, Inc. BHD warrants 9/28/08 (a) | 53,235 | | 0 |
Telekom Malaysia BHD | 1,050,000 | | 3,177,632 |
Tenaga Nasional BHD | 390,000 | | 1,139,211 |
TOTAL MALAYSIA | | 18,603,510 |
New Zealand - 0.5% |
Telecom Corp. of New Zealand Ltd. | 537,229 | | 2,134,814 |
Philippines - 0.7% |
Philippine Long Distance Telephone Co. (a) | 132,000 | | 3,295,309 |
Singapore - 5.8% |
Ascendas Real Estate Investment Trust (A-REIT) | 1,950,000 | | 1,829,279 |
CapitaCommercial Trust (a) | 670,000 | | 503,623 |
CapitaLand Ltd. | 700,000 | | 778,737 |
ComfortDelgro Corp. Ltd. | 1,750,000 | | 1,504,856 |
Cosco Investment (Singapore) Ltd. | 1,600,000 | | 1,010,253 |
|
| Shares | | Value (Note 1) |
DBS Group Holdings Ltd. | 110,000 | | $1,031,901 |
Fortune Real Estate Investment Trust | 1,200,000 | | 932,718 |
Jaya Holdings Ltd. | 2,000,000 | | 1,238,762 |
Keppel Corp. Ltd. | 840,000 | | 4,041,011 |
Oversea-Chinese Banking Corp. Ltd. | 325,000 | | 2,697,014 |
Singapore Airlines Ltd. | 205,000 | | 1,319,041 |
Singapore Petroleum Co. Ltd. | 2,200,000 | | 4,947,834 |
United Overseas Bank Ltd. | 403,280 | | 3,273,869 |
Wing Tai Holdings Ltd. | 3,068,543 | | 1,679,169 |
TOTAL SINGAPORE | | 26,788,067 |
Taiwan - 12.3% |
Advanced Semiconductor Engineering, Inc. (a) | 2,004,288 | | 1,378,341 |
Asia Optical Co., Inc. | 454,861 | | 2,162,443 |
AU Optronics Corp. | 2,550,000 | | 2,714,307 |
AU Optronics Corp. sponsored ADR | 72,200 | | 758,100 |
Cathay Financial Holding Co. Ltd. | 661,000 | | 1,264,883 |
China Steel Corp. | 4,554,000 | | 4,575,105 |
Chinatrust Financial Holding Co. | 1,928,806 | | 2,197,264 |
E.Sun Financial Holdings Co. Ltd. | 3,655,847 | | 2,492,250 |
EVA Airways Corp. | 4,236,792 | | 1,678,502 |
Far EasTone Telecommunications Co. Ltd. | 3,816,000 | | 4,073,291 |
Formosa Chemicals & Fibre Corp. | 3,370,000 | | 5,693,078 |
Formosa Plastics Corp. | 3,382,301 | | 5,208,208 |
Giant Manufacturing Co. Ltd. (a) | 581,000 | | 844,270 |
Hon Hai Precision Industries Co. Ltd. | 710,095 | | 2,611,502 |
King Yuan Electronics Co. Ltd. (a) | 2,000,000 | | 1,441,172 |
Nan Ya Plastics Corp. | 3,963,400 | | 5,510,483 |
Nien Made Enterprise Co. Ltd. | 2,220,492 | | 3,166,915 |
Siliconware Precision Industries Co. Ltd. | 2,250,000 | | 1,702,048 |
Tainan Enterprises Co. Ltd. | 1,250,000 | | 1,513,679 |
Wan Hai Lines Ltd. | 2,460,000 | | 2,361,070 |
Yang Ming Marine Trnsport Corp. | 4,346,378 | | 3,755,728 |
TOTAL TAIWAN | | 57,102,639 |
Thailand - 4.7% |
Advanced Info Service PCL (For. Reg.) | 2,020,000 | | 4,599,854 |
Aromatics (Thailand) PCL (a) | 2,780,000 | | 4,299,318 |
Banpu PCL (For. Reg.) | 940,000 | | 3,342,426 |
National Petrochemical PCL (For. Reg.) | 1,030,000 | | 2,558,695 |
Siam Cement PCL (For. Reg.) | 462,000 | | 2,880,468 |
Thai Oil PCL (a) | 97,500 | | 97,951 |
Thai Olefins PCL (a) | 1,100,000 | | 1,741,354 |
Thoresen Thai Agencies PCL (For. Reg.) | 2,700,000 | | 2,252,192 |
TOTAL THAILAND | | 21,772,258 |
United Kingdom - 1.5% |
HSBC Holdings PLC (Hong Kong) (Reg.) | 422,455 | | 6,846,306 |
TOTAL COMMON STOCKS (Cost $377,192,207) | 443,917,244 |
Preferred Stocks - 3.1% |
| Shares | | Value (Note 1) |
Convertible Preferred Stocks - 0.2% |
Korea (South) - 0.2% |
Shinsegae Co. Ltd. | 3,800 | | $1,021,706 |
Nonconvertible Preferred Stocks - 2.9% |
Korea (South) - 2.9% |
Hyundai Motor Co. | 201,170 | | 5,570,586 |
LG Electronics, Inc. | 121,430 | | 3,894,004 |
Samsung Electronics Co. Ltd. | 15,370 | | 4,118,803 |
TOTAL KOREA (SOUTH) | | 13,583,393 |
TOTAL PREFERRED STOCKS (Cost $9,025,112) | 14,605,099 |
Money Market Funds - 1.2% |
| | | |
Fidelity Cash Central Fund, 1.79% (b) | 3,632,168 | | 3,632,168 |
Fidelity Securities Lending Cash Central Fund, 1.77% (b)(c) | 1,771,000 | | 1,771,000 |
TOTAL MONEY MARKET FUNDS (Cost $5,403,168) | 5,403,168 |
TOTAL INVESTMENT PORTFOLIO - 99.8% (Cost $391,620,487) | 463,925,511 |
NET OTHER ASSETS - 0.2% | 948,346 |
NET ASSETS - 100% | $464,873,857 |
Legend |
(a)Non-income producing |
(b)Affiliated fund that is available only to investment companies and other accounts managed by Fidelity Investments. The rate quoted is the annualized seven-day yield of the fund at period end. A complete listing of the fund's holdings as of its most recent fiscal year end is available upon request. |
(c)Includes investment made with cash collateral received from securities on loan. |
(d)Security or a portion of the security is on loan at period end. |
Income Tax Information |
At October 31, 2004, the fund had a capital loss carryforward of approximately $41,732,000 of which $12,017,000, $324,000 and $29,391,000 will expire on October 31, 2006, 2007 and 2009, respectively. |
See accompanying notes which are an integral part of the financial statements.
Annual Report
Southeast Asia
Financial Statements
Statement of Assets and Liabilities
| October 31, 2004 |
| | |
Assets | | |
Investment in securities, at value (including securities loaned of $1,714,075) (cost $391,620,487) - See accompanying schedule | | $463,925,511 |
Foreign currency held at value (cost $1,424,122) | | 1,441,362 |
Receivable for investments sold | | 276,584 |
Receivable for fund shares sold | | 2,755,073 |
Dividends receivable | | 95,476 |
Interest receivable | | 4,124 |
Other affiliated receivables | | 944 |
Other receivables | | 58,942 |
Total assets | | 468,558,016 |
| | |
Liabilities | | |
Payable for investments purchased | $850,063 | |
Payable for fund shares redeemed | 485,953 | |
Accrued management fee | 259,991 | |
Other affiliated payables | 122,850 | |
Other payables and accrued expenses | 194,302 | |
Collateral on securities loaned, at value | 1,771,000 | |
Total liabilities | | 3,684,159 |
| | |
Net Assets | | $464,873,857 |
Net Assets consist of: | | |
Paid in capital | | $433,167,648 |
Undistributed net investment income | | 1,979,507 |
Accumulated undistributed net realized gain (loss) on investments and foreign currency transactions | | (42,605,383) |
Net unrealized appreciation (depreciation) on investments and assets and liabilities in foreign currencies | | 72,332,085 |
Net Assets, for 31,252,118 shares outstanding | | $464,873,857 |
Net Asset Value, offering price and redemption price per share ($464,873,857 ÷ 31,252,118 shares) | | $14.87 |
Statement of Operations
| Year ended October 31, 2004 |
| | |
Investment Income | | |
Dividends | | $12,329,800 |
Interest | | 100,024 |
Security lending | | 2,070 |
| | 12,431,894 |
Less foreign taxes withheld | | (1,620,495) |
Total income | | 10,811,399 |
| | |
Expenses | | |
Management fee
Basic fee | $3,385,553 | |
Performance adjustment | (62,265) | |
Transfer agent fees | 1,222,510 | |
Accounting and security lending fees | 239,188 | |
Non-interested trustees' compensation | 2,948 | |
Custodian fees and expenses | 677,636 | |
Registration fees | 42,471 | |
Audit | 85,599 | |
Legal | 1,707 | |
Interest | 630 | |
Miscellaneous | 31,548 | |
Total expenses before reductions | 5,627,525 | |
Expense reductions | (17,457) | 5,610,068 |
Net investment income (loss) | | 5,201,331 |
Realized and Unrealized Gain (Loss) Net realized gain (loss) on: | | |
Investment securities (net of foreign taxes of $1,363,330) | 56,728,550 | |
Foreign currency transactions | (603,792) | |
Total net realized gain (loss) | | 56,124,758 |
Change in net unrealized appreciation (depreciation) on: Investment securities (net of decrease in deferred foreign taxes of $1,039,225) | (34,442,688) | |
Assets and liabilities in foreign currencies | 31,945 | |
Total change in net unrealized appreciation (depreciation) | | (34,410,743) |
Net gain (loss) | | 21,714,015 |
Net increase (decrease) in net assets resulting from operations | | $26,915,346 |
See accompanying notes which are an integral part of the financial statements.
Annual Report
Southeast Asia
Financial Statements - continued
Statement of Changes in Net Assets
| Year ended
October 31,
2004 | Year ended
October 31,
2003 |
Increase (Decrease) in Net Assets | | |
Operations | | |
Net investment income (loss) | $5,201,331 | $3,767,890 |
Net realized gain (loss) | 56,124,758 | 18,709,030 |
Change in net unrealized appreciation (depreciation) | (34,410,743) | 79,807,436 |
Net increase (decrease) in net assets resulting from operations | 26,915,346 | 102,284,356 |
Distributions to shareholders from net investment income | (3,836,810) | (1,964,939) |
Share transactions
Proceeds from sales of shares | 224,915,681 | 125,005,217 |
Reinvestment of distributions | 3,688,981 | 1,889,991 |
Cost of shares redeemed | (182,949,102) | (77,651,168) |
Net increase (decrease) in net assets resulting from share transactions | 45,655,560 | 49,244,040 |
Redemption fees | 585,457 | 339,680 |
Total increase (decrease) in net assets | 69,319,553 | 149,903,137 |
| | |
Net Assets | | |
Beginning of period | 395,554,304 | 245,651,167 |
End of period (including undistributed net investment income of $1,979,507 and undistributed net investment income of $2,419,271, respectively) | $464,873,857 | $395,554,304 |
Other Information Shares | | |
Sold | 14,904,527 | 11,009,396 |
Issued in reinvestment of distributions | 264,130 | 181,730 |
Redeemed | (12,752,681) | (7,021,142) |
Net increase (decrease) | 2,415,976 | 4,169,984 |
Financial Highlights
Years ended October 31, | 2004 | 2003 | 2002 | 2001 | 2000 |
Selected Per-Share Data | | | | | |
Net asset value, beginning of period | $13.72 | $9.96 | $9.10 | $11.74 | $12.15 |
Income from Investment Operations | | | | | |
Net investment income (loss) C | .16 | .15 | .06 | .03 | (.04) |
Net realized and unrealized gain (loss) | 1.10 | 3.68 | .81 | (2.68) | (.38) |
Total from investment operations | 1.26 | 3.83 | .87 | (2.65) | (.42) |
Distributions from net investment income | (.13) | (.08) | (.03) | - | (.02) |
Redemption fees added to paid in capital C | .02 | .01 | .02 | .01 | .03 |
Net asset value, end of period | $14.87 | $13.72 | $9.96 | $9.10 | $11.74 |
Total Return A, B | 9.39% | 38.81% | 9.75% | (22.49)% | (3.24)% |
Ratios to Average Net Assets D | | | | | |
Expenses before expense reductions | 1.21% | 1.32% | 1.54% | 1.55% | 1.37% |
Expenses net of voluntary waivers, if any | 1.21% | 1.32% | 1.54% | 1.55% | 1.37% |
Expenses net of all reductions | 1.20% | 1.32% | 1.50% | 1.52% | 1.35% |
Net investment income (loss) | 1.11% | 1.35% | .54% | .24% | (.23)% |
Supplemental Data | | | | | |
Net assets, end of period (000 omitted) | $464,874 | $395,554 | $245,651 | $206,012 | $290,998 |
Portfolio turnover rate | 131% | 115% | 131% | 91% | 88% |
A Total returns would have been lower had certain expenses not been reduced during the periods shown. B Total returns do not include the effect of the former sales charges. C Calculated based on average shares outstanding during the period. D Expense ratios reflect operating expenses of the fund. Expenses before reductions do not reflect amounts reimbursed by the investment adviser or reductions from brokerage service arrangements or other expense offset arrangements and do not represent the amount paid by the fund during periods when reimbursements or reductions occur. Expenses net of any voluntary waivers reflect expenses after reimbursement by the investment adviser but prior to reductions from brokerage service arrangements or other expense offset arrangements. Expenses net of all reductions represent the net expenses paid by the fund. |
See accompanying notes which are an integral part of the financial statements.
Annual Report
Notes to Financial Statements
For the period ended October 31, 2004
1. Significant Accounting Policies.
Fidelity Canada Fund, Fidelity China Region Fund, Fidelity Emerging Markets Fund, Fidelity Europe Fund, Fidelity Europe Capital Appreciation Fund, Fidelity Japan Fund, Fidelity Japan Smaller Companies Fund, Fidelity Latin America Fund, Fidelity Nordic Fund, Fidelity Pacific Basin Fund, and Fidelity Southeast Asia Fund (the funds) are funds of Fidelity Investment Trust (the trust). The trust is registered under the Investment Company Act of 1940, as amended (the 1940 Act), as an open-end management investment company organized as a Massachusetts business trust. Each fund is authorized to issue an unlimited number of shares. Certain funds' investments in emerging markets can be subject to social, economic, regulatory and political uncertainties and can be extremely volatile. The financial statements have been prepared in conformity with accounting principles generally accepted in the United States of America, which require management to make certain estimates and assumptions at the date of the financial statements. The following summarizes the significant accounting policies of the funds:
Security Valuation. Net asset value per share (NAV calculation) is calculated as of the close of business of the New York Stock Exchange, normally 4:00 p.m. Eastern time. Equity securities, including restricted securities, for which market quotations are available are valued at the last sale price or official closing price (closing bid price or last evaluated quote if no sale has occurred) on the primary market or exchange on which they trade. If prices are not readily available or do not accurately reflect fair value for a security, or if a security's value has been materially affected by events occurring after the close of the exchange or market on which the security is principally traded, that security may be valued by another method that the Board of Trustees believes accurately reflects fair value. A security's valuation may differ depending on the method used for determining value. Price movements in futures contracts and ADRs, market and trading trends, the bid/ask quotes of brokers and off-exchange institutional trading may be reviewed in the course of making a good faith determination of a security's fair value. Short-term securities with remaining maturities of sixty days or less for which quotations are not readily available are valued on the basis of amortized cost. Investments in open-end investment companies are valued at their net asset value each business day.
Foreign Currency. Certain funds may use foreign currency contracts to facilitate transactions in foreign-denominated securities. Losses from these transactions may arise from changes in the value of the foreign currency or if the counterparties do not perform under the contracts' terms.
Foreign-denominated assets, including investment securities, and liabilities are translated into U.S. dollars at the exchange rate at period end. Purchases and sales of investment securities, income and dividends received and expenses denominated in foreign currencies are translated into U.S. dollars at the exchange rate in effect on the transaction date.
The effects of exchange rate fluctuations on investments are included with the net realized and unrealized gain (loss) on investment securities. Other foreign currency transactions resulting in realized and unrealized gain (loss) are disclosed separately.
Investment Transactions and Income. Security transactions are accounted for as of trade date. Gains and losses on securities sold are determined on the basis of identified cost and may include proceeds received from litigation. Dividend income is recorded on the ex-dividend date, except for certain dividends from foreign securities where the ex-dividend date may have passed, which are recorded as soon as the funds are informed of the ex-dividend date. Non-cash dividends included in dividend income, if any, are recorded at the fair market value of the securities received. Distributions received on securities that represent a return of capital or capital gain are recorded as a reduction of cost of investments and/or as a realized gain. The funds estimate the components of distributions received that may be considered return of capital distributions or capital gain distributions. Interest income is accrued as earned. Interest income includes coupon interest and amortization of premium and accretion of discount on debt securities.
Expenses. Most expenses of the trust can be directly attributed to a fund. Expenses which cannot be directly attributed are apportioned among the funds in the trust.
Income Tax Information and Distributions to Shareholders. Each year, each fund intends to qualify as a regulated investment company by distributing all of its taxable income and realized gains under Subchapter M of the Internal Revenue Code. As a result, no provision for income taxes is required in the accompanying financial statements. Foreign taxes are provided for based on each fund's understanding of the tax rules and rates that exist in the foreign markets in which it invests. Distributions are recorded on the ex-dividend date.
Income and capital gain distributions are determined in accordance with income tax regulations, which may differ from generally accepted accounting principles. In addition, certain funds will claim a portion of the payment made to redeeming shareholders as a distribution for income tax purposes. Capital accounts within the financial statements are adjusted for permanent book-tax differences. These adjustments have no impact on net assets or the results of operations. Temporary book-tax differences will reverse in a subsequent period.
Book-tax differences are primarily due to short-term capital gains, foreign currency transactions, passive foreign investment companies (PFIC), market discount, capital loss carryforwards and losses deferred due to wash sales.
Annual Report
Notes to Financial Statements - continued
1. Significant Accounting Policies - continued
Income Tax Information and Distributions to Shareholders - continued
The tax-basis components of distributable earnings and the federal tax cost as of period end were as follows for each fund:
| Cost for Federal
Income Tax Purposes | Unrealized
Appreciation | Unrealized
Depreciation | Net Unrealized
Appreciation/
(Depreciation) |
Canada | $326,861,988 | $100,840,062 | $(4,516,507) | $96,323,555 |
China Region | 264,367,485 | 39,039,846 | (8,392,846) | 30,647,000 |
Emerging MarketsA | 531,234,738 | 80,685,683 | (24,803,236) | 55,882,447 |
Europe | 1,666,136,781 | 291,900,993 | (12,002,836) | 279,898,157 |
Europe Capital Appreciation | 376,049,052 | 51,779,429 | (5,054,246) | 46,725,183 |
Japan | 705,233,783 | 56,910,869 | (28,243,473) | 28,667,396 |
Japan Smaller Companies | 1,260,006,058 | 282,909,473 | (50,045,528) | 232,863,945 |
Latin America | 248,389,667 | 117,700,569 | (4,248,179) | 113,452,390 |
Nordic | 104,325,753 | 21,688,207 | (5,920,886) | 15,767,321 |
Pacific Basin | 434,412,941 | 51,675,140 | (17,847,155) | 33,827,985 |
Southeast Asia | 392,555,144 | 83,942,970 | (12,572,603) | 71,370,367 |
| Undistributed
Ordinary Income | Undistributed
Long-term Capital Gain | Capital Loss
Carryforward |
Canada | $604,553 | $- | $(16,889,215) |
China Region | 4,125,508 | - | (21,989,888) |
Emerging MarketsA | 3,125,593 | - | (427,327,186) |
Europe | 10,108,884 | - | (93,906,199) |
Europe Capital Appreciation | 4,029,176 | - | (18,785,243) |
Japan | - | - | (72,544,615) |
Japan Smaller Companies | 1,783,089 | 3,981,793 | - |
Latin America | 5,896,049 | - | (61,123,042) |
Nordic | 1,106,657 | - | (6,515,410) |
Pacific Basin | 4,687,361 | - | (43,207,928) |
Southeast Asia | 2,067,876 | - | (41,732,035) |
ATax information based on the fund's tax year end of September 30, 2004.
The tax character of distributions paid was as follows:
October 31, 2004 | Ordinary Income | Long-term
Capital Gains | Return of Capital | Total |
Canada | $959,083 | $- | $- | $959,083 |
China Region | 4,174,789 | - | - | 4,174,789 |
Emerging Markets | 5,261,351 | - | - | 5,261,351 |
Europe | 15,656,206 | - | - | 15,656,206 |
Europe Capital Appreciation | 4,908,750 | - | - | 4,908,750 |
Japan | 461,710 | - | - | 461,710 |
Japan Smaller Companies | 1,684,858 | - | - | 1,684,858 |
Latin America | 3,905,133 | - | - | 3,905,133 |
Nordic | 633,291 | - | - | 633,291 |
Pacific Basin | 3,891,845 | - | - | 3,891,845 |
Southeast Asia | 3,836,810 | - | - | 3,836,810 |
Annual Report
1. Significant Accounting Policies - continued
Income Tax Information and Distributions to Shareholders - continued
October 31, 2003 | Ordinary Income | Long-term
Capital Gains | Return of Capital | Total |
Canada | $173,335 | $- | $- | $173,335 |
China Region | 1,902,675 | - | - | 1,902,675 |
Emerging Markets | 1,836,578 | - | - | 1,836,578 |
Europe | 6,786,170 | - | - | 6,786,170 |
Europe Capital Appreciation | 5,760,355 | - | - | 5,760,355 |
Japan | - | - | - | - |
Japan Smaller Companies | - | - | - | - |
Latin America | 2,628,539 | - | - | 2,628,539 |
Nordic | 575,077 | - | - | 575,077 |
Pacific Basin | - | - | - | - |
Southeast Asia | 1,964,939 | - | - | 1,964,939 |
Short-Term Trading (Redemption) Fees. Shares held in Canada, China Region, Emerging Markets, Japan, Japan Smaller Companies, Latin America, Nordic, Pacific Basin and Southeast Asia less than 90 days are subject to a redemption fee equal to 1.50% of the proceeds of the redeemed shares. Shares held in Europe and Europe Capital Appreciation less than 30 days are subject to a redemption fee equal to 1.00% of the proceeds of the redeemed shares. All redemption fees, including any estimated redemption fees paid by Fidelity Management & Research Company (FMR), are retained by the funds and accounted for as an addition to paid in capital.
2. Operating Policies.
Repurchase Agreements. FMR has received an Exemptive Order from the Securities and Exchange Commission (the SEC) which permits the funds and other affiliated entities of FMR to transfer uninvested cash balances into joint trading accounts. These accounts are then invested in repurchase agreements that are collateralized by U.S. Treasury or Government obligations. Certain funds may also invest directly with institutions, in repurchase agreements that are collateralized by commercial paper obligations and corporate obligations. Collateral is held in segregated accounts with custodian banks and may be obtained in the event of a default of the counterparty. Collateral is marked-to-market daily and maintained at a value at least equal to the principal amount of the repurchase agreement (including accrued interest).
Restricted Securities. Certain funds may invest in securities that are subject to legal or contractual restrictions on resale. These securities generally may be resold in transactions exempt from registration or to the public if the securities are registered. Disposal of these securities may involve time-consuming negotiations and expense, and prompt sale at an acceptable price may be difficult. Information regarding restricted securities is included at the end of each applicable fund's Schedule of Investments.
Delayed Delivery Transactions and When-Issued Securities. Each fund may purchase or sell securities on a delayed delivery or when-issued basis. Payment and delivery may take place after the customary settlement period for that security. The price of the underlying securities and the date when the securities will be delivered and paid for are fixed at the time the transaction is negotiated. During the time a delayed delivery sell is outstanding, the contract is marked-to-market daily and equivalent deliverable securities are held for the transaction. The value of the securities purchased on a delayed delivery or when-issued basis are identified as such in each applicable fund's Schedule of Investments. Each fund may receive compensation for interest forgone in the purchase of a delayed delivery or when-issued security. With respect to purchase commitments, each fund identifies securities as segregated in its records with a value at least equal to the amount of the commitment. The payables and receivables associated with the purchases and sales of delayed delivery securities having the same coupon, settlement date and broker are offset. Delayed delivery or when-issued securities that have been purchased from and sold to different brokers are reflected as both payables and receivables in each applicable fund's Statements of Assets and Liabilities under the caption "Delayed delivery." Losses may arise due to changes in the value of the underlying securities or if the counterparty does not perform under the contract's terms, or if the issuer does not issue the securities due to political, economic, or other factors.
Annual Report
Notes to Financial Statements - continued
3. Purchases and Sales of Investments.
Purchases and sales of securities, other than short-term securities and U.S. government securities, are noted in the table below:
| Purchases ($) | Sales ($) |
Canada | 300,123,982 | 130,970,087 |
China Region | 354,365,733 | 288,173,912 |
Emerging Markets | 728,714,156 | 610,261,944 |
Europe | 1,803,852,671 | 1,612,506,633 |
Europe Capital Appreciation | 463,665,219 | 520,688,769 |
Japan | 706,071,465 | 600,232,066 |
Japan Smaller Companies | 969,786,668 | 634,194,523 |
Latin America | 124,742,723 | 69,695,527 |
Nordic | 104,229,999 | 89,692,378 |
Pacific Basin | 646,415,332 | 625,224,656 |
Southeast Asia | 643,530,017 | 599,081,016 |
4. Fees and Other Transactions with Affiliates.
Management Fee. FMR and its affiliates provide the funds with investment management related services for which the funds pay a monthly management fee. The management fee is the sum of an individual fund fee rate and a group fee rate. The individual fund fee rate is applied to each fund's average net assets. The group fee rate is based upon the average net assets of all the mutual funds advised by FMR. The group fee rate decreases as assets under management increase and increases as assets under management decrease. In addition, the management fee for Canada, Europe, Europe Capital Appreciation, Japan, Pacific Basin, and Southeast Asia is subject to a performance adjustment (up to a maximum ±.20% of each applicable fund's average net assets over a 36 month performance period). The upward or downward adjustment to the management fee is based on each fund's relative investment performance as compared to an appropriate benchmark index. For the period, each fund's annual management fee rate expressed as a percentage of each fund's average net assets, including the performance adjustment, if applicable was as follows:
| Individual Rate | Group Rate | Total |
Canada | .45% | .28% | .81% |
China Region | .45% | .28% | .73% |
Emerging Markets | .45% | .28% | .72% |
Europe | .45% | .28% | .76% |
Europe Capital Appreciation | .45% | .28% | .85% |
Japan | .45% | .28% | .67% |
Japan Smaller Companies | .45% | .28% | .72% |
Latin America | .45% | .28% | .72% |
Nordic | .45% | .28% | .72% |
Pacific Basin | .45% | .28% | .74% |
Southeast Asia | .45% | .28% | .71% |
Sales Load. Shares of Canada, Europe, and Pacific Basin purchased prior to October 12, 1990, are subject to a 1% deferred sales charge upon redemption. For the period, sales charge amounts retained by Fidelity Distributors Corporation (FDC), an affiliate of FMR, were as follows:
| Retained
by FDC | |
Canada | $959 | |
Europe | 19,308 | |
Pacific Basin | 4,494 | |
Annual Report
4. Fees and Other Transactions with Affiliates - continued
Transfer Agent Fees. Fidelity Service Company, Inc. (FSC), an affiliate of FMR, is the funds' transfer, dividend disbursing and shareholder servicing agent. FSC receives account fees and asset-based fees that vary according to account size and type of account. FSC pays for typesetting, printing and mailing of shareholder reports, except proxy statements. For the period, the transfer agent fees were equivalent to the following annual rates expressed as a percentage of average net assets:
Canada | .27% | |
China Region | .28% | |
Emerging Markets | .30% | |
Europe | .26% | |
Europe Capital Appreciation | .25% | |
Japan | .25% | |
Japan Smaller Companies | .21% | |
Latin America | .28% | |
Nordic | .32% | |
Pacific Basin | .29% | |
Southeast Asia | .26% | |
Accounting and Security Lending Fees. FSC maintains each fund's accounting records. The accounting fee is based on the level of average net assets for the month. Under a separate contract, FSC administers the security lending program. The security lending fee is based on the number and duration of lending transactions.
Central Funds. The funds may invest in affiliated Central Funds managed by Fidelity Investments Money Management, Inc. (FIMM), an affiliate of FMR. The Central Funds are open-end investment companies available only to investment companies and other accounts managed by FMR and its affiliates. The Central Funds seek preservation of capital and current income and do not pay a management fee. Income distributions earned by the funds are recorded as income in the accompanying financial statements. Distributions from the Central Funds are noted in the table below:
| Income
Distributions | |
Canada | $90,954 | |
China Region | 103,912 | |
Emerging Markets | 182,575 | |
Europe | 721,923 | |
Europe Capital Appreciation | 308,781 | |
Japan | 95,717 | |
Japan Smaller Companies | 865,858 | |
Latin America | 53,882 | |
Nordic | 25,350 | |
Pacific Basin | 148,399 | |
Southeast Asia | 66,844 | |
Brokerage Commissions. Certain funds placed a portion of their portfolio transactions with brokerage firms which are affiliates of the investment adviser. The commissions paid to these affiliated firms were as follows:
| Amount | |
Canada | $333 | |
Emerging Markets | 1,971 | |
Europe Capital Appreciation | 1,840 | |
Latin America | 3,457 | |
Annual Report
Notes to Financial Statements - continued
4. Fees and Other Transactions with Affiliates - continued
Interfund Lending Program. Pursuant to an Exemptive Order issued by the SEC, the funds, along with other registered investment companies having management contracts with FMR, may participate in an interfund lending program. This program provides an alternative credit facility allowing the funds to borrow from, or lend money to, other participating funds. At period end, there were no interfund loans outstanding. Each applicable fund's activity in this program during the period was as follows:
| Borrower or Lender | Average Daily Loan Balance | Weighted
Average
Interest Rate | Interest Expense |
China Region | Borrower | $4,396,400 | 1.17% | $716 |
Emerging Markets | Borrower | 5,039,000 | 1.34% | 1,124 |
Europe | Borrower | 6,484,000 | 1.12% | 202 |
Latin America | Borrower | 2,153,667 | 1.12% | 402 |
Southeast Asia | Borrower | 4,990,000 | 1.14% | 630 |
5. Committed Line of Credit.
Certain funds participate with other funds managed by FMR in a $4.2 billion credit facility (the "line of credit") to be utilized for temporary or emergency purposes to fund shareholder redemptions or for other short-term liquidity purposes. The participating funds have agreed to pay commitment fees on their pro rata portion of the line of credit. During the period, there were no borrowings on this line of credit.
6. Security Lending.
Certain funds lend portfolio securities from time to time in order to earn additional income. Each applicable fund receives collateral (in the form of U.S. Treasury obligations, letters of credit and/or cash) against the loaned securities and maintains collateral in an amount not less than 100% of the market value of the loaned securities during the period of the loan. The market value of the loaned securities is determined at the close of business of the funds and any additional required collateral is delivered to the funds on the next business day. If the borrower defaults on its obligation to return the securities loaned because of insolvency or other reasons, a fund could experience delays and costs in recovering the securities loaned or in gaining access to the collateral. Cash collateral is invested in cash equivalents. The value of loaned securities and cash collateral at period end are disclosed on each applicable fund's Statement of Assets and Liabilities.
7. Expense Reductions.
Many of the brokers with whom FMR places trades on behalf of certain funds provided services to these funds in addition to trade execution. These services included payments of expenses on behalf of each applicable fund. In addition,through arrangements with each applicable fund's custodian and transfer agent, credits realized as a result of uninvested cash balances were used to reduce each applicable fund's expenses. All of the applicable expense reductions are noted in the table below.
| Brokerage
Service
Arrangements | Custody
expense
reduction | Transfer
Agent
expense
reduction |
| | | |
Canada | $163,340 | $4,786 | $973 |
China Region | 13,072 | 439 | - |
Emerging Markets | 280,177 | - | 908 |
Europe | 1,085,629 | 1,348 | 9,006 |
Europe Capital Appreciation | 293,878 | - | - |
Japan | - | - | 2,096 |
Japan Smaller Companies | - | 112 | 792 |
Latin America | 60,987 | - | - |
Nordic | 37,074 | 1,697 | - |
Pacific Basin | 11,420 | 351 | 676 |
Southeast Asia | 17,312 | - | 145 |
Annual Report
8. Other Information.
At the end of the period, FMR or its affiliates and certain otherwise unaffiliated shareholders were owners of record of more than 10% of the outstanding shares of the following funds:
| Affiliated % | Number of
Unaffiliated
Shareholders | Unaffiliated
Shareholders % |
Canada | - | 1 | 11% |
Japan Smaller Companies | 17% | - | - |
Pacific Basin | - | 1 | 12% |
At the end of the period, Fidelity Freedom Fund 2020 was the owner of record of approximately 19% and 13% of the total outstanding shares of Europe and Japan, respectively. Fidelity Freedom Fund 2030 was the owner of record of approximately 14% of the total outstanding shares of Europe. The Fidelity Freedom Funds were the owners of record, in the aggregate, of approximately 49%, 33% and 25% of the total outstanding shares of Europe, Japan and Southeast Asia, respectively.
Annual Report
Report of Independent Registered Public Accounting Firm
To the Trustees of Fidelity Investment Trust and the Shareholders of:
Fidelity Canada Fund,
Fidelity China Region Fund,
Fidelity Emerging Markets Fund,
Fidelity Europe Fund,
Fidelity Japan Fund,
Fidelity Japan Smaller Companies Fund,
Fidelity Latin America Fund,
Fidelity Nordic Fund,
Fidelity Pacific Basin Fund,
Fidelity Southeast Asia Fund
In our opinion, the accompanying statements of assets and liabilities, including the schedules of investments, and the related statements of operations and of changes in net assets and the financial highlights present fairly, in all material respects, the financial position of Fidelity Canada Fund, Fidelity China Region Fund, Fidelity Emerging Markets Fund, Fidelity Europe Fund, Fidelity Japan Fund, Fidelity Japan Smaller Companies Fund, Fidelity Latin America Fund, Fidelity Nordic Fund, Fidelity Pacific Basin Fund and Fidelity Southeast Asia Fund (funds of Fidelity Investment Trust) at October 31, 2004 and the results of their operations, the changes in their net assets and the financial highlights for the periods indicated, in conformity with accounting principles generally accepted in the United States of America. These financial statements and financial highlights (hereafter referred to as "financial statements") are the responsibility of the Fidelity Investment Trust's management; our responsibility is to express an opinion on these financial statements based on our audits. We conducted our audits of these financial statements in accordance with the standards of the Public Company Accounting Oversight Board (United States). Those standards require that we plan and perform the audit to obtain reasonable assurance about whether the financial statements are free of material misstatement. An audit includes examining, on a test basis, evidence supporting the amounts and disclosures in the financial statements, assessing the accounting principles used and significant estimates made by management, and evaluating the overall financial statement presentation. We believe that our audits, which included confirmation of securities at October 31, 2004, by correspondence with the custodian and brokers, provide a reasonable basis for our opinion.
/s/PricewaterhouseCoopers LLP
PricewaterhouseCoopers LLP
Boston, Massachusetts
December 17, 2004
Annual Report
Report of Independent Registered Public Accounting Firm
To the Trustees of Fidelity Investment Trust and Shareholders of Fidelity Europe Capital Appreciation Fund:
We have audited the accompanying statement of assets and liabilities of Fidelity Europe Capital Appreciation Fund (the Fund), a fund of Fidelity Investment Trust (the Trust) including the portfolio of investments, as of October 31, 2004, and the related statement of operations for the year then ended, the statement of changes in net assets for each of the two years in the period then ended, and the financial highlights for each of the five years in the period then ended. These financial statements and financial highlights are the responsibility of the Fund's management. Our responsibility is to express an opinion on these financial statements and financial highlights based on our audits.
We conducted our audits in accordance with standards of the Public Company Accounting Oversight Board (United States). Those standards require that we plan and perform the audit to obtain reasonable assurance about whether the financial statements and financial highlights are free of material misstatement. An audit includes examining, on a test basis, evidence supporting the amounts and disclosures in the financial statements. Our procedures included confirmation of securities owned as of October 31, 2004, by correspondence with the custodian and brokers; where replies were not received from brokers, we performed other auditing procedures. An audit also includes assessing the accounting principles used and significant estimates made by management, as well as evaluating the overall financial statement presentation. We believe that our audits provide a reasonable basis for our opinion.
In our opinion, the financial statements and financial highlights referred to above present fairly, in all material respects, the financial position of Fidelity Europe Capital Appreciation Fund as of October 31, 2004, the results of its operations for the year then ended, the changes in its net assets for each of the two years in the period then ended, and its financial highlights for each of the five years in the period then ended, in conformity with accounting principles generally accepted in the United States of America.
/s/DELOITTE & TOUCHE LLP
DELOITTE & TOUCHE LLP
Boston, Massachusetts
December 17, 2004
Annual Report
Trustees and Officers
The Trustees, Members of the Advisory Board, and executive officers of the trust and funds, as applicable, are listed below. The Board of Trustees governs each fund and is responsible for protecting the interests of shareholders. The Trustees are experienced executives who meet periodically throughout the year to oversee each fund's activities, review contractual arrangements with companies that provide services to each fund, and review each fund's performance. Except for William O. McCoy, each of the Trustees oversees 300 funds advised by FMR or an affiliate. Mr. McCoy oversees 302 funds advised by FMR or an affiliate.
The Trustees hold office without limit in time except that (a) any Trustee may resign; (b) any Trustee may be removed by written instrument, signed by at least two-thirds of the number of Trustees prior to such removal; (c) any Trustee who requests to be retired or who has become incapacitated by illness or injury may be retired by written instrument signed by a majority of the other Trustees; and (d) any Trustee may be removed at any special meeting of shareholders by a two-thirds vote of the outstanding voting securities of the trust. In any event, each non-interested Trustee shall retire not later than the last day of the calendar year in which his or her 72nd birthday occurs. The executive officers and Advisory Board Members hold office without limit in time, except that any officer and Advisory Board Member may resign or may be removed by a vote of a majority of the Trustees at any regular meeting or any special meeting of the Trustees. Except as indicated, each individual has held the office shown or other offices in the same company for the past five years.
The funds' Statement of Additional Information (SAI) includes more informtation about the Trustees. To request a free copy, call Fidelity at 1-800-544-8544.
Interested Trustees*:
Correspondence intended for each Trustee who is an "interested person" (as defined in the 1940 Act) may be sent to Fidelity Investments, 82 Devonshire Street, Boston, Massachusetts 02109.
Name, Age; Principal Occupation |
Edward C. Johnson 3d (74)** |
| Year of Election or Appointment: 1984 Mr. Johnson is Chairman of the Board of Trustees. Mr. Johnson serves as Chief Executive Officer, Chairman, and a Director of FMR Corp.; a Director and Chairman of the Board and of the Executive Committee of FMR; Chairman and a Director of Fidelity Management & Research (Far East) Inc.; Chairman (1998) and a Director of Fidelity Investments Money Management, Inc.; and Chairman (2001) and a Director (2000) of FMR Co., Inc. |
Abigail P. Johnson (42)** |
| Year of Election or Appointment: 2001 Senior Vice President of Canada (2001), China Region (2001), Emerging Markets (2001), Europe (2001), Europe Capital Appreciation (2001), Japan (2001), Japan Smaller Companies (2001), Latin America (2001), Nordic (2001), Pacific Basin (2001), and Southeast Asia (2001). Ms. Johnson also serves as Senior Vice President of other Fidelity funds (2001). She is President and a Director of FMR (2001), Fidelity Investments Money Management, Inc. (2001), FMR Co., Inc. (2001), and a Director of FMR Corp. Previously, Ms. Johnson managed a number of Fidelity funds. |
Laura B. Cronin (50) |
| Year of Election or Appointment: 2003 Ms. Cronin is an Executive Vice President (2002) and Chief Financial Officer (2002) of FMR Corp. and is a member of the Fidelity Management Committee (2003). Previously, Ms. Cronin served as Vice President of Finance of FMR (1997-1999), and Chief Financial Officer of FMR (1999-2001), Fidelity Personal Investments (2001), and Fidelity Brokerage Company (2001-2002). |
Robert L. Reynolds (52) |
| Year of Election or Appointment: 2003 Mr. Reynolds is a Director (2003) and Chief Operating Officer (2002) of FMR Corp. and is the head of the Fidelity Management Committee (2003). He also serves on the Board at Fidelity Investments Canada, Ltd. (2000). Previously, Mr. Reynolds served as President of Fidelity Investments Institutional Retirement Group (1996-2000). |
*Trustees have been determined to be "Interested Trustees" by virtue of, among other things, their affiliation with the trust or various entities under common control with FMR.
**Edward C. Johnson 3d, Trustee, is Abigail P. Johnson's father.
Annual Report
Trustees and Officers - continued
Non-Interested Trustees:
Correspondence intended for each non-interested Trustee (that is, the Trustees other than the Interested Trustees) may be sent to Fidelity Investments, P.O. Box 55235, Boston, Massachusetts 02205-5235.
Name, Age; Principal Occupation |
J. Michael Cook (62) |
| Year of Election or Appointment: 2001 Prior to Mr. Cook's retirement in May 1999, he served as Chairman and Chief Executive Officer of Deloitte & Touche LLP (accounting/consulting), Chairman of the Deloitte & Touche Foundation, and a member of the Board of Deloitte Touche Tohmatsu. He currently serves as a Director of Comcast (telecommunications, 2002), International Flavors & Fragrances, Inc. (2000), The Dow Chemical Company (2000), and Northrop Grumman Corporation (global defense technology, 2003). He is a Member of the Diversity Advisory Council of Marakon (2003) and the Advisory Council of the Public Company Accounting Oversight Board (PCAOB), Chairman Emeritus of the Board of Catalyst (a leading organization for the advancement of women in business), and is Chairman of the Accountability Advisory Council to the Comptroller General of the United States. He also serves as a Member of the Advisory Board of the Graduate School of Business of the University of Florida, his alma mater. |
Ralph F. Cox (72) |
| Year of Election or Appointment: 1991 Mr. Cox is President of RABAR Enterprises (management consulting for the petroleum industry). Prior to February 1994, he was President of Greenhill Petroleum Corporation (petroleum exploration and production). Until March 1990, Mr. Cox was President and Chief Operating Officer of Union Pacific Resources Company (exploration and production). He is a Director of CH2M Hill Companies (engineering), and Abraxas Petroleum (petroleum exploration and production, 1999). In addition, he is a member of advisory boards of Texas A&M University and the University of Texas at Austin. |
Robert M. Gates (61) |
| Year of Election or Appointment: 1997 Dr. Gates is President of Texas A&M University (2002). He was Director of the Central Intelligence Agency (CIA) from 1991 to 1993. From 1989 to 1991, Dr. Gates served as Assistant to the President of the United States and Deputy National Security Advisor. Dr. Gates is a Director of NACCO Industries, Inc. (mining and manufacturing), Parker Drilling Co., Inc. (drilling and rental tools for the energy industry, 2001), and Brinker International (restaurant management, 2003). He also serves as a member of the Advisory Board of VoteHere.net (secure Internet voting, 2001). Previously, Dr. Gates served as a Director of LucasVarity PLC (automotive components and diesel engines), a Director of TRW Inc. (automotive, space, defense, and information technology), and Dean of the George Bush School of Government and Public Service at Texas A&M University (1999-2001). Dr. Gates also is a Trustee of the Forum for International Policy. |
George H. Heilmeier (68) |
| Year of Election or Appointment: 2004 Dr. Heilmeier is Chairman Emeritus of Telcordia Technologies (communication software and systems), where prior to his retirement, he served as company Chairman and Chief Executive Officer. He currently serves on the Boards of Directors of The Mitre Corporation (systems engineering and information technology support for the government), INET Technologies Inc. (telecommunications network surveillance, 2001), and Teletech Holdings (customer management services), and HRL Laboratories (private research and development, 2004). He is Chairman of the General Motors Technology Advisory Committee and a Life Fellow of the Institute of Electrical and Electronics Engineers (IEEE) (2000). Dr. Heilmeier is a member of the Defense Science Board and the National Security Agency Advisory Board. He is also a member of the National Academy of Engineering, the American Academy of Arts and Sciences, and the Board of Overseers of the School of Engineering and Applied Science of the University of Pennsylvania. Previously, Dr. Heilmeier served as a Director of TRW Inc. (automotive, space, defense, and information technology, 1992-2002), Compaq (1994-2002), and Automatic Data Processing, Inc. (ADP) (technology-based business outsourcing, 1995-2002). |
Donald J. Kirk (71) |
| Year of Election or Appointment: 1987 Mr. Kirk is a Governor of the American Stock Exchange (2001), a Trustee and former Chairman of the Board of Trustees of the Greenwich Hospital Association, a Director of the Yale-New Haven Health Services Corp. (1998), and a Director Emeritus and former Chairman of the Board of Directors of National Arts Strategies Inc. (leadership education for arts and culture). Mr. Kirk was an Executive-in-Residence (1995-2000) and a Professor (1987-1995) at Columbia University Graduate School of Business. Prior to 1987, he was Chairman of the Financial Accounting Standards Board. Previously, Mr. Kirk served as a Governor of the National Association of Securities Dealers, Inc. (1996-2002), a member and Vice Chairman of the Public Oversight Board of the American Institute of Certified Public Accountants' SEC Practice Section (1995-2002), a Director of General Re Corporation (reinsurance, 1987-1998) and as a Director of Valuation Research Corp. (appraisals and valuations). |
Marie L. Knowles (58) |
| Year of Election or Appointment: 2001 Prior to Ms. Knowles' retirement in June 2000, she served as Executive Vice President and Chief Financial Officer of Atlantic Richfield Company (ARCO) (diversified energy, 1996-2000). From 1993 to 1996, she was a Senior Vice President of ARCO and President of ARCO Transportation Company. She served as a Director of ARCO from 1996 to 1998. She currently serves as a Director of Phelps Dodge Corporation (copper mining and manufacturing) and McKesson Corporation (healthcare service, 2002). Ms. Knowles is a Trustee of the Brookings Institution and the Catalina Island Conservancy and also serves as a member of the Advisory Board for the School of Engineering of the University of Southern California. |
Ned C. Lautenbach (60) |
| Year of Election or Appointment: 2000 Mr. Lautenbach has been a partner of Clayton, Dubilier & Rice, Inc. (private equity investment firm) since September 1998. Previously, Mr. Lautenbach was with the International Business Machines Corporation (IBM) from 1968 until his retirement in 1998. He was most recently Senior Vice President and Group Executive of Worldwide Sales and Services. From 1993 to 1995, he was Chairman of IBM World Trade Corporation, and from 1994 to 1998 was a member of IBM's Corporate Executive Committee. Mr. Lautenbach serves as Co-Chairman and a Director of Covansys, Inc. (global provider of business and technology solutions, 2000). In addition, he is a Director of Italtel Holding S.p.A. (telecommunications (Milan, Italy), 2004) and Eaton Corporation (diversified industrial) as well as the Philharmonic Center for the Arts in Naples, Florida (1999). He also is a member of the Council on Foreign Relations. |
Marvin L. Mann (71) |
| Year of Election or Appointment: 1993 Mr. Mann is Chairman of the non-interested Trustees (2001). He is Chairman Emeritus of Lexmark International, Inc. (computer peripherals), where he served as CEO until April 1998, retired as Chairman May 1999, and remains a member of the Board. Prior to 1991, he held the positions of Vice President of International Business Machines Corporation (IBM) and President and General Manager of various IBM divisions and subsidiaries. He is a member of the Executive Committee of the Independent Director's Council of the Investment Company Institute. In addition, Mr. Mann is a member of the President's Cabinet at the University of Alabama and the Board of Visitors of the Culverhouse College of Commerce and Business Administration at the University of Alabama. |
William O. McCoy (71) |
| Year of Election or Appointment: 1997 Prior to his retirement in December 1994, Mr. McCoy was Vice Chairman of the Board of BellSouth Corporation (telecommunications) and President of BellSouth Enterprises. He is currently a Director of Liberty Corporation (holding company), Duke Realty Corporation (real estate), and Progress Energy, Inc. (electric utility). He is also a partner of Franklin Street Partners (private investment management firm) and a member of the Research Triangle Foundation Board. In addition, Mr. McCoy served as the Interim Chancellor (1999-2000) and a member of the Board of Visitors (1994-1998) for the University of North Carolina at Chapel Hill and currently serves on the Board of Directors of the University of North Carolina Health Care System and the Board of Visitors of the Kenan-Flagler Business School (University of North Carolina at Chapel Hill). He also served as Vice President of Finance for the University of North Carolina (16-school system, 1995-1998). |
William S. Stavropoulos (65) |
| Year of Election or Appointment: 2001 Mr. Stavropoulos is Chairman of the Board (2000), CEO (2002), a position he previously held from 1995-2000, Chairman of the Executive Committee (2000), and a Member of the Board of Directors of The Dow Chemical Company. Since joining The Dow Chemical Company in 1967, Mr. Stavropoulos served in numerous senior management positions, including President (1993-2000; 2002-2003). Currently, he is a Director of NCR Corporation (data warehousing and technology solutions), BellSouth Corporation (telecommunications), Chemical Financial Corporation, and Maersk Inc. (industrial conglomerate, 2002). He also serves as a member of the Board of Trustees of the American Enterprise Institute for Public Policy Research. In addition, Mr. Stavropoulos is a member of The Business Council, J.P. Morgan International Council and the University of Notre Dame Advisory Council for the College of Science. |
Annual Report
Trustees and Officers - continued
Advisory Board Members and Executive Officers:
Correspondence intended for Mr. Dirks, Ms. Small, and Mr. Wolfe may be sent to Fidelity Investments, P.O. Box 55235, Boston, Massachusetts 02205-5235. Correspondence intended for each executive officer and Mr. Lynch may be sent to Fidelity Investments, 82 Devonshire Street, Boston, Massachusetts 02109.
Name, Age; Principal Occupation |
Dennis J. Dirks (56) |
| Year of Election or Appointment: 2004 Member of the Advisory Board of Fidelity Investment Trust. Prior to his retirement in May 2003, Mr. Dirks was Chief Operating Officer and a member of the Board of The Depository Trust & Clearing Corporation (DTCC) (1999-2003). He also served as President, Chief Operating Officer, and Board member of The Depository Trust Company (DTC) (1999-2003) and President and Board member of the National Securities Clearing Corporation (NSCC) (1999-2003). In addition, Mr. Dirks served as Chief Executive Officer and Board member of the Government Securities Clearing Corporation (2001-2003) and Chief Executive Officer and Board member of the Mortgage-Backed Securities Clearing Corporation (2001-2003). |
Peter S. Lynch (61) |
| Year of Election or Appointment: 2003 Member of the Advisory Board of Fidelity Investment Trust. Vice Chairman and a Director of FMR, and Vice Chairman (2001) and a Director (2000) of FMR Co., Inc. Previously, Mr. Lynch served as a Trustee of the Fidelity funds (1990-2003). Prior to May 31, 1990, he was a Director of FMR and Executive Vice President of FMR (a position he held until March 31, 1991), Vice President of Fidelity Magellan Fund and FMR Growth Group Leader, and Managing Director of FMR Corp. Mr. Lynch was also Vice President of Fidelity Investments Corporate Services. In addition, he serves as a Trustee of Boston College, Massachusetts Eye & Ear Infirmary, Historic Deerfield, John F. Kennedy Library, and the Museum of Fine Arts of Boston. |
Cornelia M. Small (60) |
| Year of Election or Appointment: 2004 Member of the Advisory Board of Fidelity Investment Trust. Ms. Small is a member (2000) and Chairperson (2002) of the Investment Committee, and a member (2002) of the Board of Trustees of Smith College. Previously, she served as Chief Investment Officer (1999-2000), Director of Global Equity Investments (1996-1999), and a member of the Board of Directors of Scudder, Stevens & Clark (1990-1997) and Scudder Kemper Investments (1997-1998). In addition, Ms. Small served as Co-Chair (2000-2003) of the Annual Fund for the Fletcher School of Law and Diplomacy. |
Kenneth L. Wolfe (65) |
| Year of Election or Appointment: 2004 Member of the Advisory Board of Fidelity Investment Trust. Prior to his retirement in 2001, Mr. Wolfe was Chairman and Chief Executive Officer of Hershey Foods Corporation (1993-2001). He currently serves as a member of the boards of Adelphia Communications Corporation (2003), Bausch & Lomb, Inc., and Revlon Inc. (2004). |
Philip L. Bullen (45) |
| Year of Election or Appointment: 2001 Vice President of Canada, China Region, Emerging Markets, Europe, Europe Capital Appreciation, Japan, Japan Smaller Companies, Latin America, Nordic, Pacific Basin, and Southeast Asia. Mr. Bullen also serves as Vice President of certain Equity Funds (2001) and certain High Income Funds (2001). He is Senior Vice President of FMR (2001) and FMR Co., Inc. (2001), President and a Director of Fidelity Management & Research (Far East) Inc. (2001), President and a Director of Fidelity Management & Research (U.K.) Inc. (2002), and a Director of Strategic Advisers, Inc. (2002). Before joining Fidelity Investments, Mr. Bullen was President and Chief Investment Officer of Santander Global Advisors (1997-2000) and President and Chief Executive Officer of Boston's Baring Asset Management Inc. (1994-1997). |
Ian R. Hart (37) |
| Year of Election or Appointment: 2001 Vice President of Europe Capital Appreciation. Prior to his current responsibilities, Mr. Hart served as as an equity analyst covering international securities for FMR. |
Maxime Lemieux (30) |
| Year of Election or Appointment: 2002 Vice President of Canada. Prior to his current responsibilities, Mr. Lemieux managed a variety of Fidelity funds. Mr. Lemieux also serves as Vice President of FMR (2002) and FMR Co., Inc. (2002). |
Allan Liu (43) |
| Year of Election or Appointment: 1995 Vice President of Southeast Asia. Prior to his current responsibilities, Mr. Liu managed a variety of Fidelity funds. |
Eric D. Roiter (55) |
| Year of Election or Appointment: 1998 Secretary of Canada, China Region, Emerging Markets, Europe, Europe Capital Appreciation, Japan, Japan Smaller Companies, Latin America, Nordic, Pacific Basin, and Southeast Asia. He also serves as Secretary of other Fidelity funds (1998); Vice President, General Counsel, and Clerk of FMR Co., Inc. (2001) and FMR (1998); Vice President and Clerk of FDC (1998); Assistant Clerk of Fidelity Management & Research (U.K.) Inc. (2001) and Fidelity Management & Research (Far East) Inc. (2001); and Assistant Secretary of Fidelity Investments Money Management, Inc. (2001). Prior to joining Fidelity, Mr. Roiter was with the law firm of Debevoise & Plimpton, as an associate (1981-1984) and as a partner (1985-1997), and served as an Assistant General Counsel of the U.S. Securities and Exchange Commission (1979-1981). Mr. Roiter is an Adjunct Member, Faculty of Law, at Boston College Law School (2003). |
Stuart Fross (45) |
| Year of Election or Appointment: 2003 Assistant Secretary of Canada, China Region, Emerging Markets, Europe, Europe Capital Appreciation, Japan, Japan Smaller Companies, Latin America, Nordic, Pacific Basin, and Southeast Asia. Mr. Fross also serves as Assistant Secretary of other Fidelity funds (2003) and is an employee of FMR. |
Christine Reynolds (46) |
| Year of Election or Appointment: 2004 President, Treasurer, and Anti-Money Laundering (AML) officer of Canada, China Region, Emerging Markets, Europe, Europe Capital Appreciation, Japan, Japan Smaller Companies, Latin America, Nordic, Pacific Basin, and Southeast Asia. Ms. Reynolds also serves as President, Treasurer, and AML officer of other Fidelity funds (2004) and is a Vice President (2003) and an employee (2002) of FMR. Before joining Fidelity Investments, Ms. Reynolds worked at PricewaterhouseCoopers LLP (PwC) (1980-2002), where she was most recently an audit partner with PwC's investment management practice. |
Timothy F. Hayes (53) |
| Year of Election or Appointment: 2002 Chief Financial Officer of Canada, China Region, Emerging Markets, Europe, Europe Capital Appreciation, Japan, Japan Smaller Companies, Latin America, Nordic, Pacific Basin, and Southeast Asia. Mr. Hayes also serves as Chief Financial Officer of other Fidelity funds (2002). Recently he was appointed President of Fidelity Service Company (2003) where he also serves as a Director. Mr. Hayes also serves as President of Fidelity Investments Operations Group (FIOG, 2002), which includes Fidelity Pricing and Cash Management Services Group (FPCMS), where he was appointed President in 1998. Previously, Mr. Hayes served as Chief Financial Officer of Fidelity Investments Corporate Systems and Service Group (1998) and Fidelity Systems Company (1997-1998). |
Kenneth A. Rathgeber (57) |
| Year of Election or Appointment: 2004 Chief Compliance Officer of Canada, China Region, Emerging Markets, Europe, Europe Capital Appreciation, Japan, Japan Smaller Companies, Latin America, Nordic, Pacific Basin, and Southeast Asia. Mr. Rathgeber also serves as Chief Compliance Officer of other Fidelity funds (2004) and Executive Vice President of Risk Oversight for Fidelity Investments (2002). Previously, he served as Executive Vice President and Chief Operating Officer for Fidelity Investments Institutional Services Company, Inc. (1998-2002). |
John R. Hebble (46) |
| Year of Election or Appointment: 2003 Deputy Treasurer of Canada, China Region, Emerging Markets, Europe, Europe Capital Appreciation, Japan, Japan Smaller Companies, Latin America, Nordic, Pacific Basin, and Southeast Asia. Mr. Hebble also serves as Deputy Treasurer of other Fidelity funds (2003), and is an employee of FMR. Before joining Fidelity Investments, Mr. Hebble worked at Deutsche Asset Management where he served as Director of Fund Accounting (2002-2003) and Assistant Treasurer of the Scudder Funds (1998-2003). |
Kimberley H. Monasterio (40) |
| Year of Election or Appointment: 2004 Deputy Treasurer of Canada, China Region, Emerging Markets, Europe, Europe Capital Appreciation, Japan, Japan Smaller Companies, Latin America, Nordic, Pacific Basin, and Southeast Asia. Ms. Monasterio also serves as Deputy Treasurer of other Fidelity funds (2004) and is an employee of FMR (2004). Before joining Fidelity Investments, Ms. Monasterio served as Treasurer (2000-2004) and Chief Financial Officer (2002-2004) of the Franklin Templeton Funds and Senior Vice President of Franklin Templeton Services, LLC (2000-2004). |
John H. Costello (58) |
| Year of Election or Appointment: 1986, 1987, 1990, 1992, 1993, or 1995 Assistant Treasurer of Canada (1987), China Region (1995), Emerging Markets (1990), Europe (1986), Europe Capital Appreciation (1993), Japan (1992), Japan Smaller Companies (1995), Latin America (1993), Nordic (1995), Pacific Basin (1986), and Southeast Asia (1993). Mr. Costello also serves as Assistant Treasurer of other Fidelity funds and is an employee of FMR. |
Francis V. Knox, Jr. (57) |
| Year of Election or Appointment: 2002 Assistant Treasurer of Canada, China Region, Emerging Markets, Europe, Europe Capital Appreciation, Japan, Japan Smaller Companies, Latin America, Nordic, Pacific Basin, and Southeast Asia. Mr. Knox also serves as Assistant Treasurer of other Fidelity funds (2002), and is a Vice President and an employee of FMR. Previously, Mr. Knox served as Vice President of Investment & Advisor Compliance (1990-2001), and Compliance Officer of Fidelity Management & Research (U.K.) Inc. (1992-2002), Fidelity Management & Research (Far East) Inc. (1991-2002), and FMR Corp. (1995-2002). |
Peter L. Lydecker (50) |
| Year of Election or Appointment: 2004 Assistant Treasurer of Canada, China Region, Emerging Markets, Europe, Europe Capital Appreciation, Japan, Japan Smaller Companies, Latin America, Nordic, Pacific Basin, and Southeast Asia. Mr. Lydecker also serves as Assistant Treasurer of other Fidelity funds (2004) and is an employee of FMR. |
Mark Osterheld (49) |
| Year of Election or Appointment: 2002 Assistant Treasurer of Canada, China Region, Emerging Markets, Europe, Europe Capital Appreciation, Japan, Japan Smaller Companies, Latin America, Nordic, Pacific Basin, and Southeast Asia. Mr. Osterheld also serves as Assistant Treasurer of other Fidelity funds (2002) and is an employee of FMR. |
Kenneth B. Robins (35) |
| Year of Election or Appointment: 2004 Assistant Treasurer of Canada, China Region, Emerging Markets, Europe, Europe Capital Appreciation, Japan, Japan Smaller Companies, Latin America, Nordic, Pacific Basin, and Southeast Asia. Mr. Robins also serves as Assistant Treasurer of other Fidelity funds (2004) and is an employee of FMR (2004). Before joining Fidelity Investments, Mr. Robins worked at KPMG LLP, where he was a partner in KPMG's department of professional practice (2002-2004) and a Senior Manager (1999-2000). In addition, Mr. Robins served as Assistant Chief Accountant, United States Securities and Exchange Commission (2000-2002). |
Thomas J. Simpson (46) |
| Year of Election or Appointment: 2000 Assistant Treasurer of Canada, China Region, Emerging Markets, Europe, Europe Capital Appreciation, Japan, Japan Smaller Companies, Latin America, Nordic, Pacific Basin, and Southeast Asia. Mr. Simpson is Assistant Treasurer of other Fidelity funds (2000) and an employee of FMR (1996). Prior to joining FMR, Mr. Simpson was Vice President and Fund Controller of Liberty Investment Services (1987-1995). |
Annual Report
Distributions
The Board of Trustees of each fund voted to pay to shareholders of record at the opening of business on record date, the following distributions per share derived from capital gains realized from sales of portfolio securities, and dividends derived from net investment income:
Fund | Pay Date | Record Date | Dividends | Capital Gains |
Europe | 12/06/04 | 12/03/04 | $.09 | $.08 |
Europe Capital Appreciation | 12/13/04 | 12/10/04 | $.17 | $.06 |
Japan Smaller Companies | 12/13/04 | 12/10/04 | $.01 | $.05 |
Pacific Basin | 12/13/04 | 12/10/04 | $.08 | $.13 |
A percentange of the dividends distributed in December during the fiscal year for the following funds may be taken into account as a dividend for purposes of the maximum rate under section 1(h)(11) of the Internal Revenue Code.
Canada | 100% |
China Region | 43% |
Emerging Markets | 89% |
Europe | 95% |
Europe Capital Appreciation | 100% |
Japan | 100% |
Japan Smaller Companies | 100% |
Latin America | 100% |
Nordic | 84% |
Pacific Basin | 82% |
Southeast Asia | 100% |
The amounts per share which represent income derived from sources within, and taxes paid to, foreign countries or possessions of the United States are as follows:
Fund | Pay Date | Income | Taxes |
Canada | 12/08/03 | $.073 | $.015 |
China Region | 12/08/03 | $.166 | $.011 |
Emerging Markets | 12/15/03 | $.058 | $.020 |
Europe | 12/08/03 | $.187 | $.028 |
Europe Capital Appreciation | 12/15/03 | $.139 | $.034 |
Japan | 12/08/03 | $.007 | $.005 |
Japan Smaller Companies | 12/15/03 | $.006 | $.004 |
Latin America | 12/15/03 | $.144 | $.023 |
Nordic | 12/15/03 | $.117 | $.019 |
Pacific Basin | 12/15/03 | $.071 | $.014 |
Southeast Asia | 12/08/03 | $.105 | $.052 |
The funds will notify shareholders in January 2005 of amounts for use in preparing 2004 income tax returns.
Annual Report
Proxy Voting Results
A special meeting of each fund's shareholders was held on October 14, 2004. The results of votes taken among shareholders on proposals before them are reported below. Each vote reported represents one dollar of net asset value held on the record date for the meeting.
PROPOSAL 1 |
To amend the Declaration of Trust to allow the Board of Trustees, if permitted by applicable law, to authorize fund mergers without shareholder approval. A |
| # of
Votes | % of
Votes |
Affirmative | 15,718,325,709.37 | 74.142 |
Against | 3,816,318,151.70 | 18.001 |
Abstain | 840,597,158.37 | 3.965 |
Broker
Non-Votes | 825,022,241.94 | 3.892 |
TOTAL | 21,200,263,261.38 | 100.000 |
PROPOSAL 2 |
To elect a Board of Trustees. A |
| # of
Votes | % of
Votes |
J. Michael Cook |
Affirmative | 20,046,954,592.62 | 94.560 |
Withheld | 1,153,308,668.76 | 5.440 |
TOTAL | 21,200,263,261.38 | 100.000 |
Ralph F. Cox |
Affirmative | 20,022,775,321.09 | 94.446 |
Withheld | 1,177,487,940.29 | 5.554 |
TOTAL | 21,200,263,261.38 | 100.000 |
Laura B. Cronin |
Affirmative | 20,020,502,157.24 | 94.435 |
Withheld | 1,179,761,104.14 | 5.565 |
TOTAL | 21,200,263,261.38 | 100.000 |
Dennis J. Dirks B |
Affirmative | 20,051,128,100.47 | 94.580 |
Withheld | 1,149,135,160.91 | 5.420 |
TOTAL | 21,200,263,261.38 | 100.000 |
Robert M. Gates |
Affirmative | 20,029,013,552.52 | 94.475 |
Withheld | 1,171,249,708.86 | 5.525 |
TOTAL | 21,200,263,261.38 | 100.000 |
George H. Heilmeier |
Affirmative | 20,064,274,525.78 | 94.642 |
Withheld | 1,135,988,735.60 | 5.358 |
TOTAL | 21,200,263,261.38 | 100.000 |
Abigail P. Johnson |
Affirmative | 19,965,491,863.72 | 94.176 |
Withheld | 1,234,771,397.66 | 5.824 |
TOTAL | 21,200,263,261.38 | 100.000 |
Edward C. Johnson 3d |
Affirmative | 19,910,643,140.70 | 93.917 |
Withheld | 1,289,620,120.68 | 6.083 |
TOTAL | 21,200,263,261.38 | 100.000 |
| # of
Votes | % of
Votes |
Donald J. Kirk |
Affirmative | 20,034,697,704.85 | 94.502 |
Withheld | 1,165,565,556.53 | 5.498 |
TOTAL | 21,200,263,261.38 | 100.000 |
Marie L. Knowles |
Affirmative | 20,071,617,016.84 | 94.676 |
Withheld | 1,128,646,244.54 | 5.324 |
TOTAL | 21,200,263,261.38 | 100.000 |
Ned C. Lautenbach |
Affirmative | 20,069,374,137.98 | 94.666 |
Withheld | 1,130,889,123.40 | 5.334 |
TOTAL | 21,200,263,261.38 | 100.000 |
Marvin L. Mann |
Affirmative | 20,034,126,102.77 | 94.499 |
Withheld | 1,166,137,158.61 | 5.501 |
TOTAL | 21,200,263,261.38 | 100.000 |
William O. McCoy |
Affirmative | 20,046,749,092.57 | 94.559 |
Withheld | 1,153,514,168.81 | 5.441 |
TOTAL | 21,200,263,261.38 | 100.000 |
Robert L. Reynolds |
Affirmative | 20,051,009,814.32 | 94.579 |
Withheld | 1,149,253,447.06 | 5.421 |
TOTAL | 21,200,263,261.38 | 100.000 |
Cornelia M. Small B |
Affirmative | 20,037,030,750.74 | 94.513 |
Withheld | 1,163,232,510.64 | 5.487 |
TOTAL | 21,200,263,261.38 | 100.000 |
William S. Stavropoulos |
Affirmative | 20,037,089,868.63 | 94.513 |
Withheld | 1,163,173,392.75 | 5.487 |
TOTAL | 21,200,263,261.38 | 100.000 |
PROPOSAL 4 |
To amend each fund's fundamental investment limitation concerning lending. |
Fidelity Canada Fund |
| # of
Votes | % of
Votes |
Affirmative | 116,626,084.84 | 72.757 |
Against | 28,003,217.91 | 17.469 |
Abstain | 10,310,731.96 | 6.433 |
Broker
Non-Votes | 5,356,159.29 | 3.341 |
TOTAL | 160,296,194.00 | 100.000 |
Fidelity China Region Fund |
| # of
Votes | % of
Votes |
Affirmative | 105,066,437.03 | 72.908 |
Against | 21,007,265.22 | 14.577 |
Abstain | 8,477,111.56 | 5.883 |
Broker
Non-Votes | 9,557,444.88 | 6.632 |
TOTAL | 144,108,258.69 | 100.000 |
Fidelity Emerging Markets Fund |
| # of
Votes | % of
Votes |
Affirmative | 242,993,497.88 | 81.492 |
Against | 29,252,850.19 | 9.810 |
Abstain | 16,161,277.38 | 5.421 |
Broker
Non-Votes | 9,770,232.56 | 3.277 |
TOTAL | 298,177,858.01 | 100.000 |
Fidelity Europe Fund |
| # of
Votes | % of
Votes |
Affirmative | 883,037,285.97 | 76.070 |
Against | 185,896,638.38 | 16.015 |
Abstain | 75,320,141.59 | 6.488 |
Broker
Non-Votes | 16,564,035.20 | 1.427 |
TOTAL | 1,160,818,101.14 | 100.000 |
Fidelity Europe Capital Appreciation Fund |
| # of
Votes | % of
Votes |
Affirmative | 178,277,625.62 | 76.598 |
Against | 31,385,095.21 | 13.485 |
Abstain | 13,324,009.05 | 5.724 |
Broker
Non-Votes | 9,759,742.50 | 4.193 |
TOTAL | 232,746,472.38 | 100.000 |
Fidelity Japan Fund |
| # of
Votes | % of
Votes |
Affirmative | 381,446,885.43 | 82.548 |
Against | 49,657,975.92 | 10.746 |
Abstain | 16,443,259.29 | 3.559 |
Broker
Non-Votes | 14,543,280.04 | 3.147 |
TOTAL | 462,091,400.68 | 100.000 |
Fidelity Japan Smaller Companies Fund |
| # of
Votes | % of
Votes |
Affirmative | 656,550,099.35 | 74.073 |
Against | 105,458,504.16 | 11.898 |
Abstain | 27,013,266.47 | 3.048 |
Broker
Non-Votes | 97,328,947.82 | 10.981 |
TOTAL | 886,350,817.80 | 100.000 |
Fidelity Latin America Fund |
| # of
Votes | % of
Votes |
Affirmative | 112,504,025.28 | 71.851 |
Against | 27,339,058.20 | 17.460 |
Abstain | 7,639,966.38 | 4.880 |
Broker
Non-Votes | 9,095,057.40 | 5.809 |
TOTAL | 156,578,107.26 | 100.000 |
Fidelity Nordic Fund |
| # of
Votes | % of
Votes |
Affirmative | 43,674,584.03 | 73.204 |
Against | 9,878,293.73 | 16.557 |
Abstain | 3,736,610.46 | 6.263 |
Broker
Non-Votes | 2,372,359.50 | 3.976 |
TOTAL | 59,661,847.72 | 100.000 |
Fidelity Pacific Basin Fund |
| # of
Votes | % of
Votes |
Affirmative | 179,950,432.38 | 77.050 |
Against | 30,533,507.02 | 13.074 |
Abstain | 12,009,294.04 | 5.142 |
Broker
Non-Votes | 11,056,307.10 | 4.734 |
TOTAL | 233,549,540.54 | 100.000 |
Fidelity Southeast Asia Fund |
| # of
Votes | % of
Votes |
Affirmative | 208,314,049.23 | 76.411 |
Against | 37,751,579.24 | 13.848 |
Abstain | 14,524,544.67 | 5.327 |
Broker
Non-Votes | 12,032,725.50 | 4.414 |
TOTAL | 272,622,898.64 | 100.000 |
ADenotes trust-wide proposals and voting results. BEffective January 1, 2005. |
Annual Report
Annual Report
Investment Adviser
Fidelity Management & Research Company
Boston, MA
Investment Sub-Advisers
FMR Co., Inc.
Fidelity Management & Research (U.K.) Inc.
Fidelity Management & Research (Far East) Inc.
Fidelity Investments Japan Limited
Fidelity International Investment Advisors
Fidelity International Investment Advisors
(U.K.) Limited
Fidelity Gestion (FIGEST)
Europe Fund
General Distributor
Fidelity Distributors Corporation
Boston, MA
Transfer and Shareholder Servicing Agent
Fidelity Service Company, Inc.
Boston, MA
Custodians
JPMorgan Chase Bank
New York, NY
Emerging Markets Fund, Europe Fund, Europe Capital Appreciation Fund, Japan Fund, Pacific Basin Fund, Southeast Asia Fund
Brown Brothers Harriman & Co.
Boston, MA
Canada Fund, China Region Fund, Japan Smaller Companies Fund, Latin America Fund, Nordic Fund
Fidelity's International Equity Funds
Aggressive International Fund
Canada Fund
China Region Fund
Diversified International Fund
Emerging Markets Fund
Europe Fund
Europe Capital Appreciation Fund
Global Balanced Fund
International Discovery Fund
International Small Cap Fund
Japan Fund
Japan Smaller Companies Fund
Latin America Fund
Nordic Fund
Overseas Fund
Pacific Basin Fund
Southeast Asia Fund
Worldwide Fund
Corporate Headquarters
82 Devonshire Street
Boston, MA 02109
www.fidelity.com
The Fidelity Telephone Connection
Mutual Fund 24-Hour Service
Exchanges/Redemptions
and Account Assistance1-800-544-6666
Product Information1-800-544-6666
Retirement Accounts1-800-544-4774
(8 a.m. - 9 p.m.)
TDD Service1-800-544-0118
for the deaf and hearing impaired
(9 a.m. - 9 p.m. Eastern time)
Fidelity Automated Service
Telephone (FAST®) (automated graphic) 1-800-544-5555
(automated graphic) Automated line for quickest service
Please carefully consider the funds' investment objectives, risks, charges and expenses before investing. For this and other information, call 1-800-544-6666 for a free prospectus. Read it carefully before you invest or send money.
(fidelity_logo)
Fidelity Investments
P.O. Box 193
Boston, MA 02101
(postage_prepaid_logo)
TIF-UANNPRO-1204
1.784781.101
Printed on Recycled Paper
Fidelity®
International Discovery Fund
Fund
(formerly Fidelity®
International Growth & Income Fund)
Annual Report
October 31, 2004
(2_fidelity_logos) (Registered_Trademark)
Contents
Chairman's Message | 4 | Ned Johnson's message to shareholders. |
Performance | 6 | How the fund has done over time. |
Management's Discussion | 7 | The manager's review of fund performance, strategy and outlook. |
Shareholder Expense Example | 9 | An example of shareholder expenses. |
Investment Changes | 11 | A summary of major shifts in the fund's investments over the past six months. |
Investments | 13 | A complete list of the fund's investments with their market values. |
Financial Statements | 24 | Statements of assets and liabilities, operations, and changes in net assets,
as well as financial highlights. |
Notes | 30 | Notes to the financial statements. |
Report of Independent Registered Public Accounting Firm | 38 | |
Trustees and Officers | 39 | |
Distributions | 51 | |
Proxy Voting Results | 52 | |
To view a fund's proxy voting guidelines and proxy voting record for the 12-month period ended June 30, visit www.fidelity.com/proxyvotingresults or visit the Securities and Exchange Commission's (SEC) web site at www.sec.gov. You may also call 1-800-544-8544 to request a free copy of the proxy voting guidelines.
Standard & Poor's, S&P and S&P 500 are registered service marks of The McGraw-Hill Companies, Inc. and have been licensed for use by Fidelity Distributors Corporation.
Other third party marks appearing herein are the property of their respective owners.
All other marks appearing herein are registered or unregistered trademarks or service marks of FMR Corp. or an affiliated company.
(Recycle graphic) This report is printed on recycled paper using soy-based inks.
Annual Report
This report and the financial statements contained herein are submitted for the general information of the shareholders of the fund. This report is not authorized for distribution to prospective investors in the fund unless preceded or accompanied by an effective prospectus.
The fund files its complete schedule of portfolio holdings with the SEC for the first and third quarters of each fiscal year on Form N-Q. Forms N-Q are available on the SEC's web site at http://www.sec.gov. The fund's Forms N-Q may be reviewed and copied at the SEC's Public Reference Room in Washington, DC. Information regarding the operation of the SEC's Public Reference Room may be obtained by calling 1-800-SEC-0330. For a complete list of the fund's portfolio holdings, view the fund's most recent quarterly holdings report, semiannual report, or annual report on Fidelity's web site at http://www.fidelity.com/holdings.
NOT FDIC INSURED ·MAY LOSE VALUE ·NO BANK GUARANTEE
Neither the fund nor Fidelity Distributors Corporation is a bank.
Annual Report
Chairman's Message
(photo_of_Edward_C_Johnson_3d)
Dear Shareholder:
During the past year or so, much has been reported about the mutual fund industry, and much of it has been more critical than I believe is warranted. Allegations that some companies have been less than forthright with their shareholders have cast a shadow on the entire industry. I continue to find these reports disturbing, and assert that they do not create an accurate picture of the industry overall. Therefore, I would like to remind everyone where Fidelity stands on these issues. I will say two things specifically regarding allegations that some mutual fund companies were in violation of the Securities and Exchange Commission's forward pricing rules or were involved in so-called "market timing" activities.
First, Fidelity has no agreements that permit customers who buy fund shares after 4 p.m. to obtain the 4 p.m. price. This is not a new policy. This is not to say that someone could not deceive the company through fraudulent acts. However, we are extremely diligent in preventing fraud from occurring in this manner - and in every other. But I underscore again that Fidelity has no so-called "agreements" that sanction illegal practices.
Second, Fidelity continues to stand on record, as we have for years, in opposition to predatory short-term trading that adversely affects shareholders in a mutual fund. Back in the 1980s, we initiated a fee - which is returned to the fund and, therefore, to investors - to discourage this activity. Further, we took the lead several years ago in developing a Fair Value Pricing Policy to prevent market timing on foreign securities in our funds. I am confident we will find other ways to make it more difficult for predatory traders to operate. However, this will only be achieved through close cooperation among regulators, legislators and the industry.
Yes, there have been unfortunate instances of unethical and illegal activity within the mutual fund industry from time to time. That is true of any industry. When this occurs, confessed or convicted offenders should be dealt with appropriately. But we are still concerned about the risk of over-regulation and the quick application of simplistic solutions to intricate problems. Every system can be improved, and we support and applaud well thought out improvements by regulators, legislators and industry representatives that achieve the common goal of building and protecting the value of investors' holdings.
For nearly 60 years, Fidelity has worked very hard to improve its products and service to justify your trust. When our family founded this company in 1946, we had only a few hundred customers. Today, we serve more than 18 million customers including individual investors and participants in retirement plans across America.
Let me close by saying that we do not take your trust in us for granted, and we realize that we must always work to improve all aspects of our service to you. In turn, we urge you to continue your active participation with your financial matters, so that your interests can be well served.
Best regards,
/s/Edward C. Johnson 3d
Edward C. Johnson 3d
Annual Report
Performance: The Bottom Line
Average annual total return reflects the change in the value of an investment, assuming reinvestment of the fund's dividend income and capital gains (the profits earned upon the sale of securities that have grown in value) and assuming a constant rate of performance each year. The $10,000 table and the fund's returns do not reflect the deduction of taxes that a shareholder would pay on fund distributions or the redemption of fund shares. During periods of reimbursement by Fidelity, a fund's total return will be greater than it would be had the reimbursement not occurred. How a fund did yesterday is no guarantee of how it will do tomorrow.
Average Annual Total Returns
Periods ended October 31, 2004 | Past 1
year | Past 5
years | Past 10
years |
Fidelity® International Discovery Fund | 16.65% | 3.68% | 8.01% |
$10,000 Over 10 Years
Let's say hypothetically that $10,000 was invested in Fidelity® International Discovery Fund on October 31, 1994. The chart shows how the value of your investment would have grown, and also shows how the Morgan Stanley Capital InternationalSM EAFE Index did over the same period.
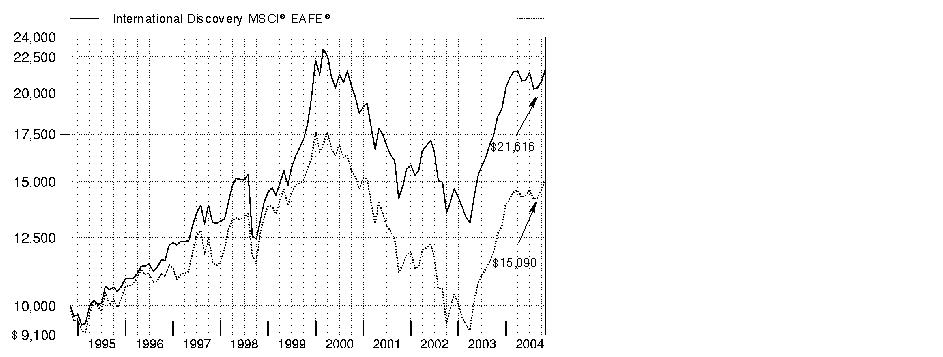
Annual Report
Management's Discussion of Fund Performance
Comments from Bill Kennedy, who became Portfolio Manager of Fidelity® International Discovery Fund on October 4, 2004
Most of the world's major stock markets posted solid gains for the year ending October 31, 2004. The Morgan Stanley Capital InternationalSM Europe, Australasia, Far East (MSCI® EAFE®) Index - designed to represent the performance of developed stock markets outside the United States and Canada - gained 19.00%, compared to 9.42% for the Standard & Poor's 500SM Index. A weak U.S. dollar relative to most foreign currencies was partly responsible for the performance disparity. On a regional basis, Europe was one of the top performers. Many investors felt European stocks offered better valuations and brighter earnings prospects than U.S. equities. Latin American countries, many of which are exporters of oil and materials that received strong support from high commodity prices, also did well. Conversely, Japan significantly underperformed, as early optimism was eroded by disappointing economic indicators and concerns about the impact of China's economic slowdown on exports. Meanwhile, technology-focused Asian emerging markets suffered due to a deceleration in corporate capital spending.
For the 12 months ending October 31, 2004, Fidelity International Discovery Fund was up 16.65%, trailing the MSCI EAFE index, but outperforming the 16.12% gain of the LipperSM International Funds Average. Overweighting technology and Japanese financial stocks caused a significant portion of the fund's performance shortfall relative to its index. More specifically, semiconductor company UMC Japan and Japanese brokerage firm Nikko Cordial performed poorly. From a geographical perspective, the fund lost ground in Switzerland due to an overweighting in two insurance companies, Swiss Life and Converium. On the positive side, the fund was pretty successful in owning strong-performing stocks not included in the index, such as India-based software company Infosys Technologies, South African telecommunication services provider MTN Group and Banco Itau Holding Financeira, a Brazilian private banking firm. Good security selection in the banking industry relative to the index was the fund's biggest bright spot; a notable contribution came from holdings in Danske Bank, Denmark's largest bank. The fund's European positions outperformed those in the index by more than one percentage point.
Note to shareholders: On October 1, 2004, Fidelity International Growth & Income Fund was renamed Fidelity International Discovery Fund.
The views expressed in this statement reflect those of the portfolio manager only through the end of the period of the report as stated on the cover and do not necessarily represent the views of Fidelity or any other person in the Fidelity organization. Any such views are subject to change at any time based upon market or other conditions and Fidelity disclaims any responsibility to update such views. These views may not be relied on as investment advice and, because investment decisions for a Fidelity fund are based on numerous factors, may not be relied on as an indication of trading intent on behalf of any Fidelity fund.
Annual Report
Shareholder Expense Example
As a shareholder of the Fund, you incur two types of costs: (1) transaction costs, including sales charges (loads) on redemptions of shares purchased prior to October 12, 1990, and redemption fees, and (2) ongoing costs, including management fees and other Fund expenses. This Example is intended to help you understand your ongoing costs (in dollars) of investing in the Fund and to compare these costs with the ongoing costs of investing in other mutual funds.
The Example is based on an investment of $1,000 invested at the beginning of the period and held for the entire period (May 1, 2004 to October 31, 2004).
Actual Expenses
The first line of the table below provides information about actual account values and actual expenses. You may use the information in this line, together with the amount you invested, to estimate the expenses that you paid over the period. Simply divide your account value by $1,000.00 (for example, an $8,600 account value divided by $1,000.00 = 8.6), then multiply the result by the number in the first line under the heading entitled "Expenses Paid During Period" to estimate the expenses you paid on your account during this period. A small balance maintenance fee of $12.00 that is charged once a year may apply for certain accounts with a value of less than $2,000. This fee is not included in the table below. If it was, the estimate of expenses you paid during the period would be higher, and your ending account value lower, by this amount.
Hypothetical Example for Comparison Purposes
The second line of the table below provides information about hypothetical account values and hypothetical expenses based on the Fund's actual expense ratio and an assumed rate of return of 5% per year before expenses, which is not the Fund's actual return. The hypothetical account values and expenses may not be used to estimate the actual ending account balance or expenses you paid for the period. You may use this information to compare the ongoing costs of investing in the Fund and other funds. To do so, compare this 5% hypothetical example with the 5% hypothetical examples that appear in the shareholder reports of the other funds. A small balance maintenance fee of $12.00 that is charged once a year may apply for certain accounts with a value of less than $2,000. This fee is not included in the table below. If it was, the estimate of expenses you paid during the period would be higher, and your ending account value lower, by this amount.
Please note that the expenses shown in the table are meant to highlight your ongoing costs only and do not reflect any transaction costs. Therefore, the second line of the table is useful in comparing ongoing costs only, and will not help you determine the relative total costs of owning different funds. In addition, if these transactional costs were included, your costs would have been higher.
| Beginning
Account Value
May 1, 2004 | Ending
Account Value
October 31, 2004 | Expenses Paid
During Period*
May 1, 2004
to October 31, 2004 |
Actual | $1,000.00 | $1,038.10 | $5.74 |
Hypothetical (5% return per year before expenses) | $1,000.00 | $1,019.30 | $5.70 |
*Expenses are equal to the Fund's annualized expense ratio of 1.12%; multiplied by the average account value over the period, multiplied by 184/366 (to reflect the one-half year period).
Annual Report
Investment Changes
Geographic Diversification (% of fund's net assets) |
As of October 31, 2004 |
| United Kingdom16.6% | |
| Japan15.0% | |
| France11.5% | |
| Germany10.6% | |
| Switzerland7.0% | |
| United States of America5.0% | |
| Italy4.9% | |
| Hong Kong3.4% | |
| Netherlands3.4% | |
| Other22.6% | |

Percentages are adjusted for the effect of futures contracts, if applicable. |
As of April 30, 2004 |
| Japan20.2% | |
| United Kingdom16.1% | |
| France11.1% | |
| Switzerland9.2% | |
| Germany7.9% | |
| Netherlands5.5% | |
| United States of America4.5% | |
| Italy3.7% | |
| Spain2.5% | |
| Other19.3% | |

Percentages are adjusted for the effect of futures contracts, if applicable. |
Asset Allocation |
| % of fund's
net assets | % of fund's net assets
6 months ago |
Stocks and Equity Futures | 96.2 | 97.5 |
Bonds | 0.0 | 0.6 |
Short-Term Investments and Net Other Assets | 3.8 | 1.9 |
Top Ten Stocks as of October 31, 2004 |
| % of fund's
net assets | % of fund's net assets
6 months ago |
BP PLC sponsored ADR (United Kingdom, Oil & Gas) | 2.9 | 2.2 |
Total SA Series B (France, Oil & Gas) | 2.3 | 2.3 |
Vodafone Group PLC (United Kingdom, Wireless Telecommunication Services) | 2.2 | 2.5 |
HSBC Holdings PLC (Hong Kong) (Reg.) (United Kingdom, Commercial Banks) | 1.9 | 0.6 |
Allianz AG (Reg.) (Germany, Insurance) | 1.7 | 1.5 |
Deutsche Telekom AG sponsored ADR (Germany, Diversified Telecommunication Services) | 1.5 | 1.0 |
Shell Transport & Trading Co. PLC (Reg.) (United Kingdom, Oil & Gas) | 1.4 | 1.7 |
Roche Holding AG (participation certificate) (Switzerland, Pharmaceuticals) | 1.4 | 1.4 |
Novartis AG (Reg.) (Switzerland, Pharmaceuticals) | 1.3 | 1.5 |
ENI Spa sponsored ADR (Italy, Oil & Gas) | 1.1 | 0.9 |
| 17.7 | |
Market Sectors as of October 31, 2004 |
| % of fund's
net assets | % of fund's net assets
6 months ago |
Financials | 24.7 | 26.6 |
Consumer Discretionary | 17.4 | 14.7 |
Health Care | 9.5 | 10.0 |
Telecommunication Services | 9.3 | 9.7 |
Energy | 8.5 | 7.9 |
Industrials | 7.5 | 5.3 |
Consumer Staples | 6.9 | 5.3 |
Information Technology | 5.6 | 13.2 |
Materials | 3.0 | 2.1 |
Utilities | 2.7 | 1.8 |
Annual Report
Investments October 31, 2004
Showing Percentage of Net Assets
Common Stocks - 93.1% |
| Shares | | Value (Note 1) (000s) |
Australia - 3.3% |
BHP Billiton Ltd. | 1,731,800 | | $17,898 |
CSL Ltd. | 269,050 | | 5,802 |
Macquarie Airports Fund | 2,806,400 | | 5,947 |
Macquarie Bank Ltd. | 320,200 | | 9,492 |
News Corp. Ltd. ADR | 350,000 | | 11,291 |
Pacific Brands Ltd. | 2,969,390 | | 6,892 |
Publishing & Broadcasting Ltd. | 451,648 | | 4,947 |
Southcorp Ltd. (a) | 1,725,500 | | 4,651 |
Westfield Group unit (a) | 573,500 | | 6,441 |
TOTAL AUSTRALIA | | 73,361 |
Austria - 0.3% |
Bank Austria Creditanstalt AG | 77,275 | | 5,737 |
Belgium - 0.3% |
Delhaize Group | 106,870 | | 6,887 |
Bermuda - 0.2% |
Ship Finance International Ltd. | 256,900 | | 5,164 |
Brazil - 1.6% |
Banco Bradesco SA sponsored ADR | 157,500 | | 9,587 |
Banco Itau Holding Financeira SA (PN) | 102,307 | | 12,362 |
Tele Leste Celular Participacoes SA sponsored ADR (a) | 2,478 | | 28 |
Tele Norte Leste Participacoes SA ADR | 533,300 | | 6,976 |
Telebras sponsored ADR | 215,500 | | 5,681 |
TIM Participacoes SA sponsored ADR | 19,957 | | 283 |
TOTAL BRAZIL | | 34,917 |
China - 0.3% |
China Telecom Corp. Ltd.: | | | |
(H Shares) | 5,406,000 | | 1,732 |
sponsored ADR | 81,880 | | 2,623 |
Global Bio-Chem Technology Group Co. Ltd. | 3,216,000 | | 2,520 |
TOTAL CHINA | | 6,875 |
Denmark - 2.2% |
Danske Bank AS | 812,100 | | 22,758 |
GN Store Nordic AS | 1,206,400 | | 12,256 |
Novo Nordisk AS ADR | 193,000 | | 9,640 |
TDC AS | 83,300 | | 3,091 |
TOTAL DENMARK | | 47,745 |
Common Stocks - continued |
| Shares | | Value (Note 1) (000s) |
Estonia - 0.2% |
Hansabank SA | 348,949 | | $3,528 |
Finland - 0.8% |
Fortum Oyj | 378,200 | | 5,808 |
Nokia Corp. sponsored ADR | 449,100 | | 6,925 |
Sampo Oyj (A Shares) | 478,000 | | 5,713 |
TOTAL FINLAND | | 18,446 |
France - 11.5% |
Alcatel SA sponsored ADR (a) | 962,800 | | 14,067 |
Assurances Generales France SA (Bearer) | 71,665 | | 4,787 |
AXA SA | 460,400 | | 9,968 |
Bacou Dalloz | 70,199 | | 5,412 |
BNP Paribas SA | 334,727 | | 22,852 |
CNP Assurances | 232,900 | | 15,901 |
Credit Agricole SA | 471,308 | | 13,854 |
Dassault Systemes SA sponsored ADR | 111,400 | | 5,642 |
Eiffage SA | 73,862 | | 7,368 |
France Telecom SA sponsored ADR (c) | 698,107 | | 20,071 |
Medidep SA (a) | 212,874 | | 5,925 |
Orpea (a) | 249,764 | | 7,399 |
Pernod-Ricard | 89,500 | | 12,427 |
Renault SA | 54,600 | | 4,584 |
Rhodia SA ADR | 2,000,000 | | 3,540 |
Sanofi-Aventis sponsored ADR | 308,000 | | 11,242 |
Snecma (c) | 357,727 | | 7,645 |
Suez SA (France) | 369,045 | | 8,652 |
Total SA Series B | 243,444 | | 50,773 |
Vivendi Universal SA (a) | 75,000 | | 2,057 |
Vivendi Universal SA sponsored ADR (a) | 662,000 | | 18,159 |
TOTAL FRANCE | | 252,325 |
Germany - 9.7% |
Adidas-Salomon AG | 85,854 | | 12,034 |
Allianz AG (Reg.) | 342,930 | | 36,522 |
BASF AG sponsored ADR | 157,900 | | 9,921 |
Bijou Brigitte Modische Accessoires AG | 50,800 | | 5,987 |
Celesio AG | 131,900 | | 9,592 |
DAB Bank AG (a) | 535,292 | | 3,281 |
Deutsche Telekom AG sponsored ADR (a) | 1,726,600 | | 33,272 |
E.ON AG | 195,600 | | 15,951 |
Fielmann AG | 87,559 | | 5,506 |
Freenet.de AG (a)(c) | 157,707 | | 3,189 |
Common Stocks - continued |
| Shares | | Value (Note 1) (000s) |
Germany - continued |
Fresenius AG | 84,227 | | $7,825 |
HeidelbergCement AG | 178,160 | | 8,796 |
Hochtief AG | 294,207 | | 7,831 |
Hypo Real Estate Holding AG (a) | 477,068 | | 17,900 |
K&S AG | 75,900 | | 3,172 |
Pfleiderer AG (a) | 598,363 | | 5,306 |
RWE AG | 255,519 | | 13,577 |
Siemens AG sponsored ADR | 134,700 | | 10,067 |
United Internet AG | 133,282 | | 3,253 |
TOTAL GERMANY | | 212,982 |
Greece - 1.1% |
Cosmote Mobile Telecommunications SA | 135,300 | | 2,452 |
EFG Eurobank Ergasias SA | 228,750 | | 6,276 |
Greek Organization of Football Prognostics SA | 268,230 | | 5,485 |
Public Power Corp. of Greece | 365,050 | | 9,091 |
TOTAL GREECE | | 23,304 |
Hong Kong - 3.4% |
Cheung Kong Holdings Ltd. | 594,000 | | 4,922 |
CNOOC Ltd. sponsored ADR | 160,000 | | 8,288 |
Cosco Pacific Ltd. | 5,114,000 | | 8,837 |
Esprit Holdings Ltd. | 2,491,000 | | 13,313 |
Hengan International Group Co. Ltd. | 4,850,000 | | 2,586 |
Hutchison Whampoa Ltd. | 1,234,000 | | 9,473 |
Paul Y-ITC Construction Holdings Ltd. | 12,952,000 | | 1,914 |
Shun Tak Holdings Ltd. | 3,212,000 | | 1,991 |
Sino Land Co. | 7,398,000 | | 6,320 |
Techtronic Industries Co. Ltd. | 5,600,000 | | 11,152 |
Wharf Holdings Ltd. | 1,509,000 | | 4,963 |
TOTAL HONG KONG | | 73,759 |
India - 1.4% |
Bank of Baroda | 1,375,000 | | 4,672 |
Infosys Technologies Ltd. | 416,486 | | 17,513 |
State Bank of India | 721,022 | | 7,542 |
TOTAL INDIA | | 29,727 |
Common Stocks - continued |
| Shares | | Value (Note 1) (000s) |
Indonesia - 0.4% |
PT Indosat Tbk | 9,163,500 | | $4,765 |
PT Telkomunikasi Indonesia Tbk Series B | 9,329,000 | | 4,466 |
TOTAL INDONESIA | | 9,231 |
Ireland - 1.2% |
Allied Irish Banks PLC | 556,082 | | 9,720 |
C&C Group PLC | 1,151,300 | | 3,772 |
Independent News & Media PLC (Ireland) | 3,153,642 | | 9,201 |
Jurys Doyle Hotel Group PLC (Ireland) | 341,800 | | 4,566 |
TOTAL IRELAND | | 27,259 |
Italy - 3.8% |
Assicurazioni Generali Spa | 200,000 | | 5,956 |
Autostrade Spa | 345,500 | | 7,583 |
Banche Popolari Unite Scarl | 263,700 | | 4,704 |
Banco Popolare di Verona e Novara | 470,900 | | 8,376 |
Buzzi Unicem Spa (c) | 407,172 | | 5,574 |
Cassa Di Risparmio Di Firenze | 2,248,700 | | 4,400 |
Davide Campari-Milano Spa | 299,418 | | 17,036 |
ENI Spa sponsored ADR | 215,200 | | 24,625 |
Lottomatica Spa New | 63,987 | | 1,932 |
Telecom Italia Spa | 1,051,687 | | 3,513 |
TOTAL ITALY | | 83,699 |
Japan - 13.9% |
Aisin Seiki Co. Ltd. | 257,500 | | 5,778 |
Asahi Breweries Ltd. | 614,100 | | 6,336 |
Canon, Inc. | 229,000 | | 11,335 |
Circle K Sunkus Co. Ltd. (a) | 199,100 | | 4,788 |
Daiwa Securities Group, Inc. | 984,000 | | 6,043 |
Don Quijote Co. Ltd. | 41,400 | | 2,488 |
East Japan Railway Co. | 2,065 | | 10,868 |
FamilyMart Co. Ltd. | 183,000 | | 4,919 |
Fancl Corp. | 14,900 | | 549 |
Fuji Photo Film Co. Ltd. | 169,000 | | 5,781 |
Honda Motor Co. Ltd. | 200,100 | | 9,721 |
Ito Yokado Ltd. | 220,500 | | 7,917 |
JAFCO Co. Ltd. | 116,400 | | 5,994 |
Matsushita Electric Industrial Co. Ltd. | 474,000 | | 6,878 |
Millea Holdings, Inc. | 557 | | 7,368 |
Mitsubishi Tokyo Financial Group, Inc. (MTFG) | 1,304 | | 11,071 |
Mizuho Financial Group, Inc. | 2,704 | | 10,450 |
Common Stocks - continued |
| Shares | | Value (Note 1) (000s) |
Japan - continued |
Nichicon Corp. | 385,000 | | $4,449 |
Nikko Cordial Corp. | 2,172,000 | | 9,728 |
Nippon Chemi-con Corp. | 1,554,000 | | 7,606 |
Nippon Oil Corp. | 648,000 | | 4,121 |
Nishi-Nippon City Bank Ltd. | 1,416,300 | | 6,303 |
Nishimatsuya Chain Co. Ltd. | 59,100 | | 2,044 |
Nissan Motor Co. Ltd. | 540,700 | | 6,105 |
Nomura Holdings, Inc. | 490,000 | | 5,963 |
Ricoh Co. Ltd. | 610,000 | | 11,412 |
Sanden Corp. | 811,000 | | 5,303 |
Sanken Electric Co. Ltd. | 728,000 | | 8,516 |
SFCG Co. Ltd. | 67,670 | | 14,246 |
Shinko Electric Industries Co.Ltd. | 62,700 | | 1,813 |
Sumitomo Electric Industries Ltd. | 982,000 | | 9,325 |
Sumitomo Forestry Co. Ltd. | 448,000 | | 4,250 |
Sumitomo Mitsui Financial Group, Inc. (c) | 2,467 | | 16,060 |
Takeda Pharamaceutical Co. Ltd. | 90,300 | | 4,368 |
Toyo Ink Manufacturing Co. Ltd. | 829,000 | | 2,859 |
Toyota Motor Corp. | 573,200 | | 22,237 |
Toys R Us Japan Ltd. | 49,500 | | 842 |
UFJ Holdings, Inc. (a) | 2,868 | | 13,333 |
USS Co. Ltd. | 55,960 | | 4,531 |
Yamanouchi Pharmaceutical Co. Ltd. | 249,300 | | 9,163 |
Yamato Transport Co. Ltd. | 708,000 | | 9,560 |
York-Benimaru Co. Ltd. | 77,000 | | 1,943 |
TOTAL JAPAN | | 304,364 |
Korea (South) - 1.6% |
AmorePacific Corp. | 10,950 | | 2,142 |
Hyundai Motor Co. | 114,720 | | 5,564 |
LG Electronics, Inc. | 141,430 | | 7,984 |
NCsoft Corp. (a) | 77,410 | | 7,399 |
Shinhan Financial Group Co. Ltd. | 409,370 | | 8,063 |
Shinsegae Co. Ltd. | 15,900 | | 4,474 |
TOTAL KOREA (SOUTH) | | 35,626 |
Luxembourg - 0.4% |
Millicom International Cellular SA (a) | 249,800 | | 4,964 |
Stolt-Nielsen SA Class B sponsored ADR (a) | 195,300 | | 4,111 |
TOTAL LUXEMBOURG | | 9,075 |
Common Stocks - continued |
| Shares | | Value (Note 1) (000s) |
Netherlands - 3.4% |
EADS NV | 473,800 | | $13,551 |
Efes Breweries International NV unit | 6,200 | | 172 |
ING Groep NV (Certificaten Van Aandelen) | 530,444 | | 14,126 |
Koninklijke Numico NV (Certificaten Van Aandelen) (a) | 103,400 | | 3,496 |
Koninklijke Philips Electronics NV (NY Shares) | 286,500 | | 6,824 |
Randstad Holdings NV | 198,700 | | 6,715 |
Versatel Telecom International NV (a)(c) | 1,238,741 | | 2,600 |
VNU NV | 269,775 | | 7,391 |
Vopak NV | 377,284 | | 6,885 |
Wolters Kluwer NV (Certificaten Van Aandelen) | 651,756 | | 11,919 |
TOTAL NETHERLANDS | | 73,679 |
New Zealand - 0.3% |
The Warehouse Group Ltd. | 2,168,944 | | 6,058 |
Norway - 0.3% |
TANDBERG Television ASA (a) | 830,400 | | 6,033 |
Philippines - 0.4% |
Philippine Long Distance Telephone Co. sponsored ADR (a)(c) | 338,000 | | 8,484 |
Portugal - 0.8% |
Banco Comercial Portugues SA (Reg.) | 1,771,912 | | 4,195 |
Electricidade de Portugal SA | 2,537,763 | | 7,534 |
Portugal Telecom SGPS SA (Reg.) | 561,927 | | 6,350 |
TOTAL PORTUGAL | | 18,079 |
Singapore - 0.7% |
DBS Group Holdings Ltd. | 659,000 | | 6,182 |
HTL International Holdings Ltd. | 5,750,000 | | 4,080 |
Oversea-Chinese Banking Corp. Ltd. | 566,000 | | 4,697 |
TOTAL SINGAPORE | | 14,959 |
South Africa - 0.5% |
Massmart Holdings Ltd. | 512,106 | | 3,595 |
MTN Group Ltd. | 443,000 | | 2,420 |
Standard Bank Group Ltd. | 522,700 | | 4,613 |
TOTAL SOUTH AFRICA | | 10,628 |
Spain - 2.0% |
Altadis SA (Spain) | 310,500 | | 11,432 |
Antena 3 Television SA (a) | 138,689 | | 8,936 |
Gestevision Telecinco SA | 251,615 | | 4,820 |
Common Stocks - continued |
| Shares | | Value (Note 1) (000s) |
Spain - continued |
Inditex SA | 342,000 | | $8,718 |
Telefonica SA sponsored ADR | 220,976 | | 11,011 |
TOTAL SPAIN | | 44,917 |
Sweden - 1.8% |
Eniro AB | 897,500 | | 7,612 |
Gambro AB (A Shares) | 808,850 | | 9,461 |
Hennes & Mauritz AB (H&M) (B Shares) | 307,200 | | 8,967 |
OMX AB (a) | 658,700 | | 7,798 |
Telefonaktiebolaget LM Ericsson ADR (a) | 215,900 | | 6,242 |
TOTAL SWEDEN | | 40,080 |
Switzerland - 7.0% |
Actelion Ltd. (Reg.) (a) | 61,976 | | 7,112 |
Compagnie Financiere Richemont unit | 485,938 | | 13,819 |
Credit Suisse Group (Reg.) | 443,600 | | 15,202 |
Nestle SA (Reg.) | 83,404 | | 19,789 |
Nobel Biocare Holding AG (Switzerland) | 5,200 | | 853 |
Novartis AG (Reg.) | 601,520 | | 28,879 |
Phonak Holding AG | 339,311 | | 10,659 |
Roche Holding AG (participation certificate) | 288,465 | | 29,576 |
Sika AG (Bearer) | 12,200 | | 7,532 |
UBS AG (NY Shares) | 284,650 | | 20,634 |
TOTAL SWITZERLAND | | 154,055 |
Taiwan - 0.5% |
Far EasTone Telecommunications Co. Ltd. | 2,576,000 | | 2,750 |
Hon Hai Precision Industries Co. Ltd. | 1,053,498 | | 3,874 |
United Microelectronics Corp. (a) | 7,074,272 | | 4,273 |
TOTAL TAIWAN | | 10,897 |
Thailand - 0.0% |
Thai Oil PCL (a) | 444,300 | | 446 |
United Kingdom - 16.6% |
Aegis Group PLC | 2,000,700 | | 3,750 |
Allied Domecq PLC | 877,380 | | 7,816 |
AstraZeneca PLC sponsored ADR | 391,100 | | 16,113 |
BAE Systems PLC | 3,489,009 | | 15,276 |
BP PLC sponsored ADR | 1,110,700 | | 64,696 |
Bristol Water Group PLC | 88,690 | | 846 |
British Land Co. PLC | 627,900 | | 8,596 |
Carnival PLC | 106,600 | | 5,654 |
Common Stocks - continued |
| Shares | | Value (Note 1) (000s) |
United Kingdom - continued |
Enterprise Inns PLC | 505,225 | | $5,747 |
FirstGroup PLC | 826,900 | | 4,369 |
Hilton Group PLC | 1,687,900 | | 7,995 |
HSBC Holdings PLC (Hong Kong) (Reg.) | 2,555,800 | | 41,419 |
Invensys PLC (a) | 9,489,400 | | 2,659 |
Kesa Electricals PLC | 1,247,500 | | 6,236 |
Next PLC | 431,400 | | 13,239 |
Rank Group PLC | 1,748,307 | | 9,189 |
Reckitt Benckiser PLC | 221,900 | | 6,092 |
Reuters Group PLC sponsored ADR | 328,700 | | 13,444 |
Rio Tinto PLC sponsored ADR | 58,400 | | 6,208 |
Royal Bank of Scotland Group PLC | 477,300 | | 14,078 |
Shell Transport & Trading Co. PLC (Reg.) | 3,998,400 | | 31,494 |
Signet Group PLC | 3,059,800 | | 5,974 |
Ted Baker PLC | 97,891 | | 888 |
Tesco PLC | 2,887,000 | | 15,226 |
Vodafone Group PLC | 18,312,312 | | 47,227 |
William Hill PLC | 1,104,700 | | 9,927 |
TOTAL UNITED KINGDOM | | 364,158 |
United States of America - 1.2% |
Fox Entertainment Group, Inc. Class A (a) | 65,300 | | 1,937 |
Synthes, Inc. | 77,491 | | 8,283 |
Telewest Global, Inc. (a)(c) | 1,251,003 | | 15,387 |
TOTAL UNITED STATES OF AMERICA | | 25,607 |
TOTAL COMMON STOCKS (Cost $1,781,103) | 2,042,091 |
Nonconvertible Preferred Stocks - 2.0% |
| | | |
Germany - 0.9% |
Fresenius Medical Care AG | 222,475 | | 12,177 |
Porsche AG (non-vtg.) | 8,211 | | 5,243 |
Rheinmetall AG | 24,380 | | 998 |
TOTAL GERMANY | | 18,418 |
Nonconvertible Preferred Stocks - continued |
| Shares | | Value (Note 1) (000s) |
Italy - 1.1% |
Banca Intesa Spa (Risp) | 3,068,402 | | $10,370 |
Telecom Italia Spa (Risp) | 5,824,085 | | 14,556 |
TOTAL ITALY | | 24,926 |
TOTAL NONCONVERTIBLE PREFERRED STOCKS (Cost $32,344) | 43,344 |
Government Obligations - 0.1% |
| Principal Amount (000s) | | |
United States of America - 0.1% |
U.S. Treasury Bills, yield at date of purchase 1.44% to 1.65% 11/18/04 to 12/9/04 (d)
(Cost $1,697) | | $1,700 | | 1,697 |
Money Market Funds - 5.3% |
| Shares | | |
Fidelity Cash Central Fund, 1.79% (b) | 96,106,672 | | 96,107 |
Fidelity Securities Lending Cash Central Fund, 1.77% (b)(e) | 19,891,671 | | 19,892 |
TOTAL MONEY MARKET FUNDS (Cost $115,999) | 115,999 |
TOTAL INVESTMENT PORTFOLIO - 100.5% (Cost $1,931,143) | | 2,203,131 |
NET OTHER ASSETS - (0.5)% | | (10,469) |
NET ASSETS - 100% | $2,192,662 |
Futures Contracts |
| Expiration Date | | Underlying Face Amount at Value (000s) | | Unrealized Appreciation/
(Depreciation) (000s) |
Purchased |
Equity Index Contracts |
450 Nikkei 225 Index Contracts | Dec. 2004 | | $24,154 | | $(1,228) |
|
The face value of futures purchased as a percentage of net assets - 1.1% |
Legend |
(a)Non-income producing |
(b)Affiliated fund that is available only to investment companies and other accounts managed by Fidelity Investments. The rate quoted is the annualized seven-day yield of the fund at period end. A complete listing of the fund's holdings as of its most recent fiscal year end is available upon request. |
(c)Security or a portion of the security is on loan at period end. |
(d)Security or a portion of the security was pledged to cover margin requirements for futures contracts. At the period end, the value of securities pledged amounted to $1,697,000. |
(e)Includes investment made with cash collateral received from securities on loan. |
Income Tax Information |
The fund hereby designates approximately $4,854,000 as a capital gain dividend for the purpose of the dividend paid deduction. |
See accompanying notes which are an integral part of the financial statements.
Annual Report
Financial Statements
Statement of Assets and Liabilities
Amounts in thousands (except per-share amount) | October 31, 2004 |
| | |
Assets | | |
Investment in securities, at value (including securities loaned of $19,356) (cost $1,931,143) - See accompanying schedule | | $2,203,131 |
Foreign currency held at value (cost $22,385) | | 22,695 |
Receivable for investments sold | | 11,244 |
Receivable for fund shares sold | | 4,559 |
Dividends receivable | | 2,269 |
Interest receivable | | 103 |
Other affiliated receivables | | 6 |
Other receivables | | 279 |
Total assets | | 2,244,286 |
| | |
Liabilities | | |
Payable for investments purchased | $1,193 | |
Payable for fund shares redeemed | 27,406 | |
Accrued management fee | 1,309 | |
Payable for daily variation on futures contracts | 191 | |
Other affiliated payables | 560 | |
Other payables and accrued expenses | 1,073 | |
Collateral on securities loaned, at value | 19,892 | |
Total liabilities | | 51,624 |
| | |
Net Assets | | $2,192,662 |
Net Assets consist of: | | |
Paid in capital | | $1,895,917 |
Undistributed net investment income | | 15,147 |
Accumulated undistributed net realized gain (loss) on investments and foreign currency transactions | | 11,111 |
Net unrealized appreciation (depreciation) on investments and assets and liabilities in foreign currencies | | 270,487 |
Net Assets, for 86,642 shares outstanding | | $2,192,662 |
Net Asset Value, offering price and redemption price per share ($2,192,662 ÷ 86,642 shares) | | $25.31 |
See accompanying notes which are an integral part of the financial statements.
Annual Report
Financial Statements - continued
Statement of Operations
Amounts in thousands | Year ended October 31, 2004 |
| | |
Investment Income | | |
Dividends | | $35,950 |
Interest | | 2,002 |
Security lending | | 1,545 |
| | 39,497 |
Less foreign taxes withheld | | (4,023) |
Total income | | 35,474 |
| | |
Expenses | | |
Management fee | $12,956 | |
Transfer agent fees | 4,791 | |
Accounting and security lending fees | 800 | |
Non-interested trustees' compensation | 11 | |
Custodian fees and expenses | 690 | |
Registration fees | 165 | |
Audit | 75 | |
Legal | 9 | |
Miscellaneous | 209 | |
Total expenses before reductions | 19,706 | |
Expense reductions | (653) | 19,053 |
Net investment income (loss) | | 16,421 |
Realized and Unrealized Gain (Loss) Net realized gain (loss) on: | | |
Investment securities (net of foreign taxes of $691) | 91,175 | |
Foreign currency transactions | (112) | |
Futures contracts | 153 | |
Total net realized gain (loss) | | 91,216 |
Change in net unrealized appreciation (depreciation) on: Investment securities (net of increase in deferred foreign taxes of $209) | 128,226 | |
Assets and liabilities in foreign currencies | 397 | |
Futures contracts | (1,228) | |
Total change in net unrealized appreciation (depreciation) | | 127,395 |
Net gain (loss) | | 218,611 |
Net increase (decrease) in net assets resulting from operations | | $235,032 |
See accompanying notes which are an integral part of the financial statements.
Annual Report
Statement of Changes in Net Assets
Amounts in thousands | Year ended
October 31,
2004 | Year ended
October 31,
2003 |
Increase (Decrease) in Net Assets | | |
Operations | | |
Net investment income (loss) | $16,421 | $10,436 |
Net realized gain (loss) | 91,216 | 23,168 |
Change in net unrealized appreciation (depreciation) | 127,395 | 249,189 |
Net increase (decrease) in net assets resulting
from operations | 235,032 | 282,793 |
Distributions to shareholders from net investment income | (10,818) | (4,821) |
Share transactions
Proceeds from sales of shares | 1,135,828 | 324,768 |
Reinvestment of distributions | 9,888 | 4,359 |
Cost of shares redeemed | (420,362) | (254,429) |
Net increase (decrease) in net assets resulting from share transactions | 725,354 | 74,698 |
Redemption fees | 227 | 67 |
Total increase (decrease) in net assets | 949,795 | 352,737 |
| | |
Net Assets | | |
Beginning of period | 1,242,867 | 890,130 |
End of period (including undistributed net investment income of $15,147 and undistributed net investment income of $10,323, respectively) | $2,192,662 | $1,242,867 |
Other Information Shares | | |
Sold | 46,697 | 17,590 |
Issued in reinvestment of distributions | 436 | 257 |
Redeemed | (17,322) | (14,446) |
Net increase (decrease) | 29,811 | 3,401 |
See accompanying notes which are an integral part of the financial statements.
Annual Report
Financial Highlights
Years ended October 31, | 2004 | 2003 | 2002 | 2001 | 2000 |
Selected Per-Share Data | | | | | |
Net asset value, beginning of period | $21.87 | $16.66 | $17.61 | $26.70 | $26.02 |
Income from Investment Operations | | | | | |
Net investment income (loss) C | .22 | .19 | .11 | .19 E | .18 D |
Net realized and unrealized gain (loss) | 3.40 | 5.11 | (1.06) | (6.11) | 2.33 |
Total from investment operations | 3.62 | 5.30 | (.95) | (5.92) | 2.51 |
Distributions from net investment income | (.18) | (.09) | - | (.51) | (.33) |
Distributions from net realized gain | - | - | - | (2.66) | (1.50) |
Total distributions | (.18) | (.09) | - | (3.17) | (1.83) |
Redemption fees added to paid in capital C | - G | - G | - G | - G | - G |
Net asset value, end of period | $25.31 | $21.87 | $16.66 | $17.61 | $26.70 |
Total Return A,B | 16.65% | 31.97% | (5.39)% | (24.91)% | 9.57% |
Ratios to Average Net Assets F | | | | | |
Expenses before expense reductions | 1.10% | 1.14% | 1.14% | 1.14% | 1.07% |
Expenses net of voluntary waivers, if any | 1.10% | 1.14% | 1.14% | 1.14% | 1.07% |
Expenses net of all reductions | 1.06% | 1.11% | 1.12% | 1.09% | 1.05% |
Net investment income (loss) | .92% | 1.08% | .59% | .91% | .63% |
Supplemental Data | | | | | |
Net assets, end of period (in millions) | $2,193 | $1,243 | $890 | $882 | $1,253 |
Portfolio turnover rate | 87% | 81% | 63% | 81% | 104% |
ATotal returns would have been lower had certain expenses not been reduced during the periods shown.
BTotal returns do not include the effect of the contingent deferred sales charge.
CCalculated based on average shares outstanding during the period.
DInvestment income per share reflects a special dividend which amounted to $.07 per share.
EInvestment income per share reflects a special dividend which amounted to $.04 per share.
FExpense ratios reflect operating expenses of the fund. Expenses before reductions do not reflect amounts reimbursed by the investment adviser or reductions from brokerage service arrangements or other expense offset arrangements and do not represent the amount paid by the fund during periods when reimbursements or reductions occur. Expenses net of any voluntary waivers reflect expenses after reimbursement by the investment adviser but prior to reductions from brokerage service arrangements or other expense offset arrangements. Expenses net of all reductions represent the net expenses paid by the fund.
GAmount represents less than $.01 per share.
See accompanying notes which are an integral part of the financial statements.
Annual Report
Notes to Financial Statements
For the period ended October 31, 2004
(Amounts in thousands except ratios)
1. Significant Accounting Policies.
Fidelity International Discovery Fund (the fund) (formerly Fidelity International Growth & Income Fund) is a fund of Fidelity Investment Trust (the trust) and is authorized to issue an unlimited number of shares. The trust is registered under the Investment Company Act of 1940, as amended (the 1940 Act), as an open-end management investment company organized as a Massachusetts business trust. On October 21, 2004, the Board of Trustees approved the creation of additional classes of shares; Class A, Class T, Class B, Class C, and Institutional Class shares. Each class will differ with respect to its distribution and service plan, front-end sales charges and contingent deferred sales charges. Offering of these new classes will commence on or about January 6, 2005. The fund's investments in emerging markets can be subject to social, economic, regulatory, and political uncertainties and can be extremely volatile. The financial statements have been prepared in conformity with accounting principles generally accepted in the United States of America, which require management to make certain estimates and assumptions at the date of the financial statements. The following summarizes the significant accounting policies of the fund:
Security Valuation. Net asset value per share (NAV calculation) is calculated as of the close of business of the New York Stock Exchange, normally 4:00 p.m. Eastern time. Equity securities, including restricted securities, for which market quotations are available are valued at the last sale price or official closing price (closing bid price or last evaluated quote if no sale has occurred) on the primary market or exchange on which they trade. Debt securities, including restricted securities, for which quotations are readily available are valued at their most recent bid prices (sales prices if the principal market is an exchange) in the principal market in which such securities are normally traded, as determined by recognized dealers in such securities, or securities are valued on the basis of information provided by a pricing service. Pricing services use valuation matrices that incorporate both dealer-supplied valuations and valuation models. If prices are not readily available or do not accurately reflect fair value for a security, or if a security's value has been materially affected by events occurring after the close of the exchange or market on which the security is principally traded, that security may be valued by another method that the Board of Trustees believes accurately reflects fair value. A security's valuation may differ depending on the method used for determining value. Price movements in futures contracts and ADRs, market and trading trends, the bid/ask quotes of brokers and off-exchange institutional trading may be reviewed in the course of making a good faith determination of a security's fair value. Short-term securities with remaining maturities of sixty days or less for which quotations are not readily available are valued on the basis of amortized cost. Investments in open-end investment companies are valued at their net asset value each business day.
Foreign Currency. The fund uses foreign currency contracts to facilitate transactions in foreign-denominated securities. Losses from these transactions may arise from changes in the value of the foreign currency or if the counterparties do not perform under the contracts' terms.
Annual Report
Notes to Financial Statements - continued
(Amounts in thousands except ratios)
1. Significant Accounting Policies - continued
Foreign Currency - continued
Foreign-denominated assets, including investment securities, and liabilities are translated into U.S. dollars at the exchange rate at period end. Purchases and sales of investment securities, income and dividends received and expenses denominated in foreign currencies are translated into U.S. dollars at the exchange rate in effect on the transaction date.
The effects of exchange rate fluctuations on investments are included with the net realized and unrealized gain (loss) on investment securities. Other foreign currency transactions resulting in realized and unrealized gain (loss) are disclosed separately.
Investment Transactions and Income. Security transactions are accounted for as of trade date. Gains and losses on securities sold are determined on the basis of identified cost and may include proceeds received from litigation. Dividend income is recorded on the ex-dividend date, except for certain dividends from foreign securities where the ex-dividend date may have passed, which are recorded as soon as the fund is informed of the ex-dividend date. Non-cash dividends included in dividend income, if any, are recorded at the fair market value of the securities received. Interest income is accrued as earned. Interest income includes coupon interest and amortization of premium and accretion of discount on debt securities.
Expenses. Most expenses of the trust can be directly attributed to a fund. Expenses which cannot be directly attributed are apportioned among the funds in the trust.
Income Tax Information and Distributions to Shareholders. Each year, the fund intends to qualify as a regulated investment company by distributing all of its taxable income and realized gains under Subchapter M of the Internal Revenue Code. As a result, no provision for income taxes is required in the accompanying financial statements. Foreign taxes are provided for based on the fund's understanding of the tax rules and rates that exist in the foreign markets in which it invests.
Distributions are recorded on the ex-dividend date. Income and capital gain distributions are determined in accordance with income tax regulations, which may differ from generally accepted accounting principles. In addition, the fund will claim a portion of the payment made to redeeming shareholders as a distribution for income tax purposes.
Capital accounts within the financial statements are adjusted for permanent book-tax differences. These adjustments have no impact on net assets or the results of operations. Temporary book-tax differences will reverse in a subsequent period.
Book-tax differences are primarily due to futures transactions, foreign currency transactions, certain foreign taxes, passive foreign investment companies (PFIC), market discount, capital loss carryforwards, and losses deferred due to wash sales.
Annual Report
1. Significant Accounting Policies - continued
Income Tax Information and Distributions to Shareholders - continued
The tax-basis components of distributable earnings and the federal tax cost as of period end were as follows:
Unrealized appreciation | $312,184 | |
Unrealized depreciation | (45,130) | |
Net unrealized appreciation (depreciation) | 267,054 | |
Undistributed ordinary income | 11,222 | |
Undistributed long-term capital gain | 10,028 | |
Cost for federal income tax purposes | $1,936,077 | |
The tax character of distributions paid was as follows:
| October 31,
2004 | October 31,
2003 |
Ordinary Income | $10,818 | $4,821 |
Short-Term Trading (Redemption) Fees. Shares held in the fund less than 30 days are subject to a redemption fee equal to 1.00% of the proceeds of the redeemed shares. All redemption fees, including any estimated redemption fees paid by Fidelity Management & Research Company (FMR), are retained by the fund and accounted for as an addition to paid in capital.
2. Operating Policies.
Repurchase Agreements. FMR has received an Exemptive Order from the Securities and Exchange Commission (the SEC) which permits the fund and other affiliated entities of FMR to transfer uninvested cash balances into joint trading accounts. These accounts are then invested in repurchase agreements that are collateralized by U.S. Treasury or Government obligations. The fund may also invest directly with institutions, in repurchase agreements that are collateralized by commercial paper obligations and corporate obligations. Collateral is held in segregated accounts with custodian banks and may be obtained in the event of a default of the counterparty. Collateral is marked-to-market daily and maintained at a value at least equal to the principal amount of the repurchase agreement (including accrued interest).
Futures Contracts. The fund may use futures contracts to manage its exposure to the stock market and to fluctuations in currency values. Buying futures tends to increase the fund's exposure to the underlying instrument, while selling futures tends to decrease the fund's exposure to the underlying instrument or hedge other fund investments. Futures contracts involve, to varying degrees, risk of loss in excess of any futures variation margin reflected in the Statement of Assets and Liabilities. The underlying face amount at value
Annual Report
Notes to Financial Statements - continued
(Amounts in thousands except ratios)
2. Operating Policies - continued
Futures Contracts - continued
of any open futures contracts at period end is shown in the Schedule of Investments under the caption "Futures Contracts." This amount reflects each contract's exposure to the underlying instrument at period end. Losses may arise from changes in the value of the underlying instruments or if the counter-parties do not perform under the contracts' terms. Gains (losses) are realized upon the expiration or closing of the futures contracts. Futures contracts are valued at the settlement price established each day by the board of trade or exchange on which they are traded.
3. Purchases and Sales of Investments.
Purchases and sales of securities, other than short-term securities and U.S. government securities, aggregated $2,121,217 and $1,470,610, respectively.
4. Fees and Other Transactions with Affiliates.
Management Fee. FMR and its affiliates provide the fund with investment management related services for which the fund pays a monthly management fee. The management fee is the sum of an individual fund fee rate that is based on an annual rate of .45% of the fund's average net assets and a group fee rate that averaged .28% during the period. The group fee rate is based upon the average net assets of all the mutual funds advised by FMR. The group fee rate decreases as assets under management increase and increases as assets under management decrease. In addition, the management fee will be subject to a performance adjustment effective September 2005. The upward or downward adjustment to the management fee will be based on the fund's relative investment performance as compared to an appropriate benchmark index. For the period, the total annual management fee rate was .72% of the fund's average net assets.
Sales Load. Fidelity Distributors Corporation (FDC), an affiliate of FMR, is the general distributor of the fund. Shares purchased prior to October 12, 1990 are subject to a 1% deferred sales charge upon redemption. For the period, FDC received sales charges of $2 on redemption of shares of the fund.
Transfer Agent Fees. Fidelity Service Company, Inc. (FSC), an affiliate of FMR, is the fund's transfer, dividend disbursing and shareholder servicing agent. FSC receives account fees and asset-based fees that vary according to account size and type of account. FSC pays for typesetting, printing and mailing of shareholder reports, except proxy statements. For the period, the transfer agent fees were equivalent to an annual rate of ..27% of average net assets.
Annual Report
4. Fees and Other Transactions with Affiliates - continued
Accounting and Security Lending Fees. FSC maintains the fund's accounting records. The accounting fee is based on the level of average net assets for the month. Under a separate contract, FSC administers the security lending program. The security lending fee is based on the number and duration of lending transactions.
Central Funds. The fund may invest in affiliated Central Funds managed by Fidelity Investments Money Management, Inc. (FIMM), an affiliate of FMR. The Central Funds are open-end investment companies available only to investment companies and other accounts managed by FMR and its affiliates. The Central Funds seek preservation of capital and current income and do not pay a management fee. Income distributions earned by the fund are recorded as income in the accompanying financial statements and totaled $947 for the period.
Brokerage Commissions. The fund placed a portion of its portfolio transactions with brokerage firms which are affiliates of the investment adviser. The commissions paid to these affiliated firms were $6 for the period.
5. Committed Line of Credit.
The fund participates with other funds managed by FMR in a $4.2 billion credit facility (the "line of credit") to be utilized for temporary or emergency purposes to fund shareholder redemptions or for other short-term liquidity purposes. The fund has agreed to pay commitment fees on its pro rata portion of the line of credit. During the period, there were no borrowings on this line of credit.
6. Security Lending.
The fund lends portfolio securities from time to time in order to earn additional income. The fund receives collateral (in the form of U.S. Treasury obligations, letters of credit and/or cash) against the loaned securities and maintains collateral in an amount not less than 100% of the market value of the loaned securities during the period of the loan. The market value of the loaned securities is determined at the close of business of the fund and any additional required collateral is delivered to the fund on the next business day. If the borrower defaults on its obligation to return the securities loaned because of insolvency or other reasons, a fund could experience delays and costs in recovering the securities loaned or in gaining access to the collateral. Cash collateral is invested in cash equivalents. The value of loaned securities and cash collateral at period end are disclosed on the fund's Statement of Assets and Liabilities.
Annual Report
Notes to Financial Statements - continued
(Amounts in thousands except ratios)
7. Bank Borrowings.
The fund is permitted to have bank borrowings for temporary or emergency purposes to fund shareholder redemptions. The fund has established borrowing arrangements with certain banks. The interest rate on the borrowings is the bank's base rate, as revised from time to time. The average daily loan balance during the period amounted to $9,174. The weighted average interest rate was 1.31%. At period end, there were no bank borrowings outstanding.
8. Expense Reductions.
Many of the brokers with whom FMR places trades on behalf of the fund provided services to the fund in addition to trade execution. These services included payments of certain expenses on behalf of the fund totaling $638 for the period. In addition, through arrangements with the fund's custodian and transfer agent, credits realized as a result of uninvested cash balances were used to reduce the fund's expenses. During the period, these credits reduced the fund's custody and transfer agent expenses by $1 and $14, respectively.
Annual Report
Report of Independent Registered Public Accounting Firm
To the Trustees of Fidelity Investment Trust and the Shareholders of Fidelity International Discovery Fund (formerly Fidelity International Growth & Income Fund):
In our opinion, the accompanying statement of assets and liabilities, including the schedule of investments, and the related statements of operations and of changes in net assets and the financial highlights present fairly, in all material respects, the financial position of Fidelity International Discovery Fund (formerly Fidelity International Growth & Income Fund)(a fund of Fidelity Investment Trust) at October 31, 2004 and the results of its operations, the changes in its net assets and the financial highlights for the periods indicated, in conformity with accounting principles generally accepted in the United States of America. These financial statements and financial highlights (hereafter referred to as "financial statements") are the responsibility of the Fidelity International Discovery Fund's management; our responsibility is to express an opinion on these financial statements based on our audits. We conducted our audits of these financial statements in accordance with the standards of the Public Company Accounting Oversight Board (United States). Those standards require that we plan and perform the audit to obtain reasonable assurance about whether the financial statements are free of material misstatement. An audit includes examining, on a test basis, evidence supporting the amounts and disclosures in the financial statements, assessing the accounting principles used and significant estimates made by management, and evaluating the overall financial statement presentation. We believe that our audits, which included confirmation of securities at October 31, 2004 by correspondence with the custodian and brokers, provide a reasonable basis for our opinion.
/s/PricewaterhouseCoopers LLP
PricewaterhouseCoopers LLP
Boston, Massachusetts
December 17, 2004
Annual Report
Trustees and Officers
The Trustees, Members of the Advisory Board, and executive officers of the trust and fund, as applicable, are listed below. The Board of Trustees governs the fund and is responsible for protecting the interests of shareholders. The Trustees are experienced executives who meet periodically throughout the year to oversee the fund's activities, review contractual arrangements with companies that provide services to the fund, and review the fund's performance. Except for William O. McCoy, each of the Trustees oversees 298 funds advised by FMR or an affiliate. Mr. McCoy oversees 300 funds advised by FMR or an affiliate.
The Trustees hold office without limit in time except that (a) any Trustee may resign; (b) any Trustee may be removed by written instrument, signed by at least two-thirds of the number of Trustees prior to such removal; (c) any Trustee who requests to be retired or who has become incapacitated by illness or injury may be retired by written instrument signed by a majority of the other Trustees; and (d) any Trustee may be removed at any special meeting of shareholders by a two-thirds vote of the outstanding voting securities of the trust. In any event, each non-interested Trustee shall retire not later than the last day of the calendar year in which his or her 72nd birthday occurs. The executive officers and Advisory Board Members hold office without limit in time, except that any officer and Advisory Board Member may resign or may be removed by a vote of a majority of the Trustees at any regular meeting or any special meeting of the Trustees. Except as indicated, each individual has held the office shown or other offices in the same company for the past five years.
The fund's Statement of Additional Information (SAI) includes more information about the Trustees. To request a free copy, call Fidelity at 1-800-544-8544.
Interested Trustees*:
Correspondence intended for each Trustee who is an "interested person" (as defined in the 1940 Act) may be sent to Fidelity Investments, 82 Devonshire Street, Boston, Massachusetts 02109.
Name, Age; Principal Occupation |
Edward C. Johnson 3d (74)** |
| Year of Election or Appointment: 1984 Mr. Johnson is Chairman of the Board of Trustees. Mr. Johnson serves as Chief Executive Officer, Chairman, and a Director of FMR Corp.; a Director and Chairman of the Board and of the Executive Committee of FMR; Chairman and a Director of Fidelity Management & Research (Far East) Inc.; Chairman (1998) and a Director of Fidelity Investments Money Management, Inc.; and Chairman (2001) and a Director (2000) of FMR Co., Inc. |
Abigail P. Johnson (42)** |
| Year of Election or Appointment: 2001 Senior Vice President of International Discovery (2001). Ms. Johnson also serves as Senior Vice President of other Fidelity funds (2001). She is President and a Director of FMR (2001), Fidelity Investments Money Management, Inc. (2001), FMR Co., Inc. (2001), and a Director of FMR Corp. Previously, Ms. Johnson managed a number of Fidelity funds. |
Laura B. Cronin (50) |
| Year of Election or Appointment: 2003 Ms. Cronin is an Executive Vice President (2002) and Chief Financial Officer (2002) of FMR Corp. and is a member of the Fidelity Management Committee (2003). Previously, Ms. Cronin served as Vice President of Finance of FMR (1997-1999), and Chief Financial Officer of FMR (1999-2001), Fidelity Personal Investments (2001), and Fidelity Brokerage Company (2001-2002). |
Robert L. Reynolds (52) |
| Year of Election or Appointment: 2003 Mr. Reynolds is a Director (2003) and Chief Operating Officer (2002) of FMR Corp. and is the head of the Fidelity Management Committee (2003). He also serves on the Board at Fidelity Investments Canada, Ltd. (2000). Previously, Mr. Reynolds served as President of Fidelity Investments Institutional Retirement Group (1996-2000). |
*Trustees have been determined to be "Interested Trustees" by virtue of, among other things, their affiliation with the trust or various entities under common control with FMR.
**Edward C. Johnson 3d, Trustee, is Abigail P. Johnson's father.
Annual Report
Non-Interested Trustees:
Correspondence intended for each non-interested Trustee (that is, the Trustees other than the Interested Trustees) may be sent to Fidelity Investments, P.O. Box 55235, Boston, Massachusetts 02205-5235.
Name, Age; Principal Occupation |
J. Michael Cook (62) |
| Year of Election or Appointment: 2001 Prior to Mr. Cook's retirement in May 1999, he served as Chairman and Chief Executive Officer of Deloitte & Touche LLP (accounting/consulting), Chairman of the Deloitte & Touche Foundation, and a member of the Board of Deloitte Touche Tohmatsu. He currently serves as a Director of Comcast (telecommunications, 2002), International Flavors & Fragrances, Inc. (2000), The Dow Chemical Company (2000), and Northrop Grumman Corporation (global defense technology, 2003). He is a Member of the Diversity Advisory Council of Marakon (2003) and the Advisory Council of the Public Company Accounting Oversight Board (PCAOB), Chairman Emeritus of the Board of Catalyst (a leading organization for the advancement of women in business), and is Chairman of the Accountability Advisory Council to the Comptroller General of the United States. He also serves as a Member of the Advisory Board of the Graduate School of Business of the University of Florida, his alma mater. |
Ralph F. Cox (72) |
| Year of Election or Appointment: 1991 Mr. Cox is President of RABAR Enterprises (management consulting for the petroleum industry). Prior to February 1994, he was President of Greenhill Petroleum Corporation (petroleum exploration and production). Until March 1990, Mr. Cox was President and Chief Operating Officer of Union Pacific Resources Company (exploration and production). He is a Director of CH2M Hill Companies (engineering), and Abraxas Petroleum (petroleum exploration and production, 1999). In addition, he is a member of advisory boards of Texas A&M University and the University of Texas at Austin. |
Robert M. Gates (61) |
| Year of Election or Appointment: 1997 Dr. Gates is President of Texas A&M University (2002). He was Director of the Central Intelligence Agency (CIA) from 1991 to 1993. From 1989 to 1991, Dr. Gates served as Assistant to the President of the United States and Deputy National Security Advisor. Dr. Gates is a Director of NACCO Industries, Inc. (mining and manufacturing), Parker Drilling Co., Inc. (drilling and rental tools for the energy industry, 2001), and Brinker International (restaurant management, 2003). He also serves as a member of the Advisory Board of VoteHere.net (secure Internet voting, 2001). Previously, Dr. Gates served as a Director of LucasVarity PLC (automotive components and diesel engines), a Director of TRW Inc. (automotive, space, defense, and information technology), and Dean of the George Bush School of Government and Public Service at Texas A&M University (1999-2001). Dr. Gates also is a Trustee of the Forum for International Policy. |
George H. Heilmeier (68) |
| Year of Election or Appointment: 2004 Dr. Heilmeier is Chairman Emeritus of Telcordia Technologies (communication software and systems), where prior to his retirement, he served as company Chairman and Chief Executive Officer. He currently serves on the Boards of Directors of The Mitre Corporation (systems engineering and information technology support for the government), INET Technologies Inc. (telecommunications network surveillance, 2001), Teletech Holdings (customer management services), and HRL Laboratories (private research and development, 2004). He is Chairman of the General Motors Technology Advisory Committee and a Life Fellow of the Institute of Electrical and Electronics Engineers (IEEE) (2000). Dr. Heilmeier is a member of the Defense Science Board and the National Security Agency Advisory Board. He is also a member of the National Academy of Engineering, the American Academy of Arts and Sciences, and the Board of Overseers of the School of Engineering and Applied Science of the University of Pennsylvania. Previously, Dr. Heilmeier served as a Director of TRW Inc. (automotive, space, defense, and information technology, 1992-2002), Compaq (1994-2002), and Automatic Data Processing, Inc. (ADP) (technology-based business outsourcing, 1995-2002). |
Donald J. Kirk (71) |
| Year of Election or Appointment: 1987 Mr. Kirk is a Governor of the American Stock Exchange (2001), a Trustee and former Chairman of the Board of Trustees of the Greenwich Hospital Association, a Director of the Yale-New Haven Health Services Corp. (1998), and a Director Emeritus and former Chairman of the Board of Directors of National Arts Strategies Inc. (leadership education for arts and culture). Mr. Kirk was an Executive-in-Residence (1995-2000) and a Professor (1987-1995) at Columbia University Graduate School of Business. Prior to 1987, he was Chairman of the Financial Accounting Standards Board. Previously, Mr. Kirk served as a Governor of the National Association of Securities Dealers, Inc. (1996-2002), a member and Vice Chairman of the Public Oversight Board of the American Institute of Certified Public Accountants' SEC Practice Section (1995-2002), a Director of General Re Corporation (reinsurance, 1987-1998) and as a Director of Valuation Research Corp. (appraisals and valuations). |
Marie L. Knowles (58) |
| Year of Election or Appointment: 2001 Prior to Ms. Knowles' retirement in June 2000, she served as Executive Vice President and Chief Financial Officer of Atlantic Richfield Company (ARCO) (diversified energy, 1996-2000). From 1993 to 1996, she was a Senior Vice President of ARCO and President of ARCO Transportation Company. She served as a Director of ARCO from 1996 to 1998. She currently serves as a Director of Phelps Dodge Corporation (copper mining and manufacturing) and McKesson Corporation (healthcare service, 2002). Ms. Knowles is a Trustee of the Brookings Institution and the Catalina Island Conservancy and also serves as a member of the Advisory Board for the School of Engineering of the University of Southern California. |
Ned C. Lautenbach (60) |
| Year of Election or Appointment: 2000 Mr. Lautenbach has been a partner of Clayton, Dubilier & Rice, Inc. (private equity investment firm) since September 1998. Previously, Mr. Lautenbach was with the International Business Machines Corporation (IBM) from 1968 until his retirement in 1998. He was most recently Senior Vice President and Group Executive of Worldwide Sales and Services. From 1993 to 1995, he was Chairman of IBM World Trade Corporation, and from 1994 to 1998 was a member of IBM's Corporate Executive Committee. Mr. Lautenbach serves as Co-Chairman and a Director of Covansys, Inc. (global provider of business and technology solutions, 2000). In addition, he is a Director of Italtel Holding S.p.A. (telecommunications (Milan, Italy), 2004) and Eaton Corporation (diversified industrial) as well as the Philharmonic Center for the Arts in Naples, Florida (1999). He also is a member of the Council on Foreign Relations. |
Marvin L. Mann (71) |
| Year of Election or Appointment: 1993 Mr. Mann is Chairman of the non-interested Trustees (2001). He is Chairman Emeritus of Lexmark International, Inc. (computer peripherals), where he served as CEO until April 1998, retired as Chairman May 1999, and remains a member of the Board. Prior to 1991, he held the positions of Vice President of International Business Machines Corporation (IBM) and President and General Manager of various IBM divisions and subsidiaries. He is a member of the Executive Committee of the Independent Director's Council of the Investment Company Institute. In addition, Mr. Mann is a member of the President's Cabinet at the University of Alabama and the Board of Visitors of the Culverhouse College of Commerce and Business Administration at the University of Alabama. |
William O. McCoy (71) |
| Year of Election or Appointment: 1997 Prior to his retirement in December 1994, Mr. McCoy was Vice Chairman of the Board of BellSouth Corporation (telecommunications) and President of BellSouth Enterprises. He is currently a Director of Liberty Corporation (holding company), Duke Realty Corporation (real estate), and Progress Energy, Inc. (electric utility). He is also a partner of Franklin Street Partners (private investment management firm) and a member of the Research Triangle Foundation Board. In addition, Mr. McCoy served as the Interim Chancellor (1999-2000) and a member of the Board of Visitors (1994-1998) for the University of North Carolina at Chapel Hill and currently serves on the Board of Directors of the University of North Carolina Health Care System and the Board of Visitors of the Kenan-Flagler Business School (University of North Carolina at Chapel Hill). He also served as Vice President of Finance for the University of North Carolina (16-school system, 1995-1998). |
William S. Stavropoulos (65) |
| Year of Election or Appointment: 2001 Mr. Stavropoulos is Chairman of the Board (2000), CEO (2002), a position he previously held from 1995-2000, Chairman of the Executive Committee (2000), and a Member of the Board of Directors of The Dow Chemical Company. Since joining The Dow Chemical Company in 1967, Mr. Stavropoulos served in numerous senior management positions, including President (1993-2000; 2002-2003). Currently, he is a Director of NCR Corporation (data warehousing and technology solutions), BellSouth Corporation (telecommunications), Chemical Financial Corporation, and Maersk Inc. (industrial conglomerate, 2002). He also serves as a member of the Board of Trustees of the American Enterprise Institute for Public Policy Research. In addition, Mr. Stavropoulos is a member of The Business Council, J.P. Morgan International Council and the University of Notre Dame Advisory Council for the College of Science. |
Annual Report
Trustees and Officers - continued
Advisory Board Members and Executive Officers:
Correspondence intended for Mr. Dirks, Ms. Small, and Mr. Wolfe may be sent to Fidelity Investments, P.O. Box 55235, Boston, Massachusetts 02205-5235. Correspondence intended for each executive officer and Mr. Lynch may be sent to Fidelity Investments, 82 Devonshire Street, Boston, Massachusetts 02109.
Name, Age; Principal Occupation |
Dennis J. Dirks (56) |
| Year of Election or Appointment: 2004 Member of the Advisory Board of Fidelity Investment Trust. Prior to his retirement in May 2003, Mr. Dirks was Chief Operating Officer and a member of the Board of The Depository Trust & Clearing Corporation (DTCC) (1999-2003). He also served as President, Chief Operating Officer, and Board member of The Depository Trust Company (DTC) (1999-2003) and President and Board member of the National Securities Clearing Corporation (NSCC) (1999-2003). In addition, Mr. Dirks served as Chief Executive Officer and Board member of the Government Securities Clearing Corporation (2001-2003) and Chief Executive Officer and Board member of the Mortgage-Backed Securities Clearing Corporation (2001-2003). |
Peter S. Lynch (61) |
| Year of Election or Appointment: 2003 Member of the Advisory Board of Fidelity Investment Trust. Vice Chairman and a Director of FMR, and Vice Chairman (2001) and a Director (2000) of FMR Co., Inc. Previously, Mr. Lynch served as a Trustee of the Fidelity funds (1990-2003). Prior to May 31, 1990, he was a Director of FMR and Executive Vice President of FMR (a position he held until March 31, 1991), Vice President of Fidelity® Magellan® Fund and FMR Growth Group Leader, and Managing Director of FMR Corp. Mr. Lynch was also Vice President of Fidelity Investments Corporate Services. In addition, he serves as a Trustee of Boston College, Massachusetts Eye & Ear Infirmary, Historic Deerfield, John F. Kennedy Library, and the Museum of Fine Arts of Boston. |
Cornelia M. Small (60) |
| Year of Election or Appointment: 2004 Member of the Advisory Board of Fidelity Investment Trust. Ms. Small is a member (2000) and Chairperson (2002) of the Investment Committee, and a member (2002) of the Board of Trustees of Smith College. Previously, she served as Chief Investment Officer (1999-2000), Director of Global Equity Investments (1996-1999), and a member of the Board of Directors of Scudder, Stevens & Clark (1990-1997) and Scudder Kemper Investments (1997-1998). In addition, Ms. Small served as Co-Chair (2000-2003) of the Annual Fund for the Fletcher School of Law and Diplomacy. |
Kenneth L. Wolfe (65) |
| Year of Election or Appointment: 2004 Member of the Advisory Board of Fidelity Investment Trust. Prior to his retirement in 2001, Mr. Wolfe was Chairman and Chief Executive Officer of Hershey Foods Corporation (1993-2001). He currently serves as a member of the boards of Adelphia Communications Corporation (2003), Bausch & Lomb, Inc., and Revlon Inc. (2004). |
Philip L. Bullen (45) |
| Year of Election or Appointment: 2001 Vice President of International Discovery. Mr. Bullen also serves as Vice President of certain Equity Funds (2001) and certain High Income Funds (2001). He is Senior Vice President of FMR (2001) and FMR Co., Inc. (2001), President and a Director of Fidelity Management & Research (Far East) Inc. (2001), President and a Director of Fidelity Management & Research (U.K.) Inc. (2002), and a Director of Strategic Advisers, Inc. (2002). Before joining Fidelity Investments, Mr. Bullen was President and Chief Investment Officer of Santander Global Advisors (1997-2000) and President and Chief Executive Officer of Boston's Baring Asset Management Inc. (1994-1997). |
Eric D. Roiter (55) |
| Year of Election or Appointment: 1998 Secretary of International Discovery. He also serves as Secretary of other Fidelity funds (1998); Vice President, General Counsel, and Clerk of FMR Co., Inc. (2001) and FMR (1998); Vice President and Clerk of FDC (1998); Assistant Clerk of Fidelity Management & Research (U.K.) Inc. (2001) and Fidelity Management & Research (Far East) Inc. (2001); and Assistant Secretary of Fidelity Investments Money Management, Inc. (2001). Prior to joining Fidelity, Mr. Roiter was with the law firm of Debevoise & Plimpton, as an associate (1981-1984) and as a partner (1985-1997), and served as an Assistant General Counsel of the U.S. Securities and Exchange Commission (1979-1981). Mr. Roiter is an Adjunct Member, Faculty of Law, at Boston College Law School (2003). |
Stuart Fross (45) |
| Year of Election or Appointment: 2003 Assistant Secretary of International Discovery. Mr. Fross also serves as Assistant Secretary of other Fidelity funds (2003) and is an employee of FMR. |
Christine Reynolds (46) |
| Year of Election or Appointment: 2004 President, Treasurer, and Anti-Money Laundering (AML) officer of International Discovery. Ms. Reynolds also serves as President, Treasurer, and AML officer of other Fidelity funds (2004) and is a Vice President (2003) and an employee (2002) of FMR. Before joining Fidelity Investments, Ms. Reynolds worked at PricewaterhouseCoopers LLP (PwC) (1980-2002), where she was most recently an audit partner with PwC's investment management practice. |
Timothy F. Hayes (53) |
| Year of Election or Appointment: 2002 Chief Financial Officer of International Discovery. Mr. Hayes also serves as Chief Financial Officer of other Fidelity funds (2002). Recently he was appointed President of Fidelity Service Company (2003) where he also serves as a Director. Mr. Hayes also serves as President of Fidelity Investments Operations Group (FIOG, 2002), which includes Fidelity Pricing and Cash Management Services Group (FPCMS), where he was appointed President in 1998. Previously, Mr. Hayes served as Chief Financial Officer of Fidelity Investments Corporate Systems and Service Group (1998) and Fidelity Systems Company (1997-1998). |
Kenneth A. Rathgeber (57) |
| Year of Election or Appointment: 2004 Chief Compliance Officer of International Discovery. Mr. Rathgeber also serves as Chief Compliance Officer of other Fidelity funds (2004) and Executive Vice President of Risk Oversight for Fidelity Investments (2002). Previously, he served as Executive Vice President and Chief Operating Officer for Fidelity Investments Institutional Services Company, Inc. (1998-2002). |
John R. Hebble (46) |
| Year of Election or Appointment: 2003 Deputy Treasurer of International Discovery. Mr. Hebble also serves as Deputy Treasurer of other Fidelity funds (2003), and is an employee of FMR. Before joining Fidelity Investments, Mr. Hebble worked at Deutsche Asset Management where he served as Director of Fund Accounting (2002-2003) and Assistant Treasurer of the Scudder Funds (1998-2003). |
Kimberley H. Monasterio (40) |
| Year of Election or Appointment: 2004 Deputy Treasurer of International Discovery. Ms. Monasterio also serves as Deputy Treasurer of other Fidelity funds (2004) and is an employee of FMR (2004). Before joining Fidelity Investments, Ms. Monasterio served as Treasurer (2000-2004) and Chief Financial Officer (2002-2004) of the Franklin Templeton Funds and Senior Vice President of Franklin Templeton Services, LLC (2000-2004). |
John H. Costello (58) |
| Year of Election or Appointment: 1986 Assistant Treasurer of International Discovery. Mr. Costello also serves as Assistant Treasurer of other Fidelity funds and is an employee of FMR. |
Francis V. Knox, Jr. (57) |
| Year of Election or Appointment: 2002 Assistant Treasurer of International Discovery. Mr. Knox also serves as Assistant Treasurer of other Fidelity funds (2002), and is a Vice President and an employee of FMR. Previously, Mr. Knox served as Vice President of Investment & Advisor Compliance (1990-2001), and Compliance Officer of Fidelity Management & Research (U.K.) Inc. (1992-2002), Fidelity Management & Research (Far East) Inc. (1991-2002), and FMR Corp. (1995-2002). |
Peter L. Lydecker (50) |
| Year of Election or Appointment: 2004 Assistant Treasurer of International Discovery. Mr. Lydecker also serves as Assistant Treasurer of other Fidelity funds (2004) and is an employee of FMR. |
Mark Osterheld (49) |
| Year of Election or Appointment: 2002 Assistant Treasurer of International Discovery. Mr. Osterheld also serves as Assistant Treasurer of other Fidelity funds (2002) and is an employee of FMR. |
Kenneth B. Robins (35) |
| Year of Election or Appointment: 2004 Assistant Treasurer of International Discovery. Mr. Robins also serves as Assistant Treasurer of other Fidelity funds (2004) and is an employee of FMR (2004). Before joining Fidelity Investments, Mr. Robins worked at KPMG LLP, where he was a partner in KPMG's department of professional practice (2002-2004) and a Senior Manager (1999-2000). In addition, Mr. Robins served as Assistant Chief Accountant, United States Securities and Exchange Commission (2000-2002). |
Thomas J. Simpson (46) |
| Year of Election or Appointment: 2000 Assistant Treasurer of International Discovery. Mr. Simpson is Assistant Treasurer of other Fidelity funds (2000) and an employee of FMR (1996). Prior to joining FMR, Mr. Simpson was Vice President and Fund Controller of Liberty Investment Services (1987-1995). |
Annual Report
Distributions
The Board of Trustees of Fidelity International Discovery Fund voted to pay on December 6, 2004, to shareholders of record at the opening of business on December 3, 2004, a distribution of $.12 per share derived from capital gains realized from sales of portfolio securities and a dividend of $.15 per share from net investment income.
The fund designates 100% of the dividends distributed during the fiscal year as qualifying for the dividends-received deduction for corporate shareholders.
The fund designates 100% of the dividends distributed in December during the fiscal year as amounts which may be taken into account as a dividend for purposes of the maximum rate under section 1(h)(11) of the Internal Revenue Code.
The amounts per share which represent income derived from sources within, and taxes paid to, foreign countries or possessions of the United States are as follows:
| Pay Date | Income | Taxes |
International Discovery | 12/08/03 | $.123 | $.027 |
The fund will notify shareholders in January 2005 of amounts for use in preparing 2004 income tax returns.
Annual Report
Proxy Voting Results
A special meeting of Fidelity International Growth & Income Fund (currently known as Fidelity International Discovery Fund) shareholders was held on September 15, 2004. The results of votes taken among shareholders on proposals before them are reported below. Each vote reported represents one dollar of net asset value held on the record date for the meeting.
PROPOSAL 1 |
To amend the Declaration of Trust to allow the Board of Trustees, if permitted by applicable law, to authorize fund mergers without shareholder approval. A, B |
| # of
Votes | % of
Votes |
Affirmative | 15,718,325,709.37 | 74.142 |
Against | 3,816,318,151.70 | 18.001 |
Abstain | 840,597,158.37 | 3.965 |
Broker
Non-Votes | 825,022,241.94 | 3.892 |
TOTAL | 21,200,263,261.38 | 100.000 |
PROPOSAL 2 |
To elect a Board of Trustees. A, B |
| # of
Votes | % of
Votes |
J. Michael Cook |
Affirmative | 20,046,954,592.62 | 94.560 |
Withheld | 1,153,308,668.76 | 5.440 |
TOTAL | 21,200,263,261.38 | 100.000 |
Ralph F. Cox |
Affirmative | 20,022,775,321.09 | 94.446 |
Withheld | 1,177,487,940.29 | 5.554 |
TOTAL | 21,200,263,261.38 | 100.000 |
Laura B. Cronin |
Affirmative | 20,020,502,157.24 | 94.435 |
Withheld | 1,179,761,104.14 | 5.565 |
TOTAL | 21,200,263,261.38 | 100.000 |
Dennis J. Dirks C |
Affirmative | 20,051,128,100.47 | 94.580 |
Withheld | 1,149,135,160.91 | 5.420 |
TOTAL | 21,200,263,261.38 | 100.000 |
| # of
Votes | % of
Votes |
Robert M. Gates |
Affirmative | 20,029,013,552.52 | 94.475 |
Withheld | 1,171,249,708.86 | 5.525 |
TOTAL | 21,200,263,261.38 | 100.000 |
George H. Heilmeier |
Affirmative | 20,064,274,525.78 | 94.642 |
Withheld | 1,135,988,735.60 | 5.358 |
TOTAL | 21,200,263,261.38 | 100.000 |
Abigail P. Johnson |
Affirmative | 19,965,491,863.72 | 94.176 |
Withheld | 1,234,771,397.66 | 5.824 |
TOTAL | 21,200,263,261.38 | 100.000 |
Edward C. Johnson 3d |
Affirmative | 19,910,643,140.70 | 93.917 |
Withheld | 1,289,620,120.68 | 6.083 |
TOTAL | 21,200,263,261.38 | 100.000 |
Donald J. Kirk |
Affirmative | 20,034,697,704.85 | 94.502 |
Withheld | 1,165,565,556.53 | 5.498 |
TOTAL | 21,200,263,261.38 | 100.000 |
Marie L. Knowles |
Affirmative | 20,071,617,016.84 | 94.676 |
Withheld | 1,128,646,244.54 | 5.324 |
TOTAL | 21,200,263,261.38 | 100.000 |
Ned C. Lautenbach |
Affirmative | 20,069,374,137.98 | 94.666 |
Withheld | 1,130,889,123.40 | 5.334 |
TOTAL | 21,200,263,261.38 | 100.000 |
Marvin L. Mann |
Affirmative | 20,034,126,102.77 | 94.499 |
Withheld | 1,166,137,158.61 | 5.501 |
TOTAL | 21,200,263,261.38 | 100.000 |
| # of
Votes | % of
Votes |
William O. McCoy |
Affirmative | 20,046,749,092.57 | 94.559 |
Withheld | 1,153,514,168.81 | 5.441 |
TOTAL | 21,200,263,261.38 | 100.000 |
Robert L. Reynolds |
Affirmative | 20,051,009,814.32 | 94.579 |
Withheld | 1,149,253,447.06 | 5.421 |
TOTAL | 21,200,263,261.38 | 100.000 |
Cornelia M. Small C |
Affirmative | 20,037,030,750.74 | 94.513 |
Withheld | 1,163,232,510.64 | 5.487 |
TOTAL | 21,200,263,261.38 | 100.000 |
William S. Stavropoulos |
Affirmative | 20,037,089,868.63 | 94.513 |
Withheld | 1,163,173,392.75 | 5.487 |
TOTAL | 21,200,263,261.38 | 100.000 |
PROPOSAL 3a |
To modify the fundamental investment objective of the fund to remove the income component from the objective. |
| # of
Votes | % of
Votes |
Affirmative | 877,893,306.92 | 80.036 |
Against | 134,548,116.36 | 12.266 |
Abstain | 58,284,263.58 | 5.314 |
Broker
Non-Votes | 26,151,871.20 | 2.384 |
TOTAL | 1,096,877,558.06 | 100.000 |
PROPOSAL 3b |
To approve an amended management contract that includes adding a performance adjustment component to the management fee for the fund. |
| # of
Votes | % of
Votes |
Affirmative | 866,590,773.42 | 79.005 |
Against | 151,057,949.12 | 13.772 |
Abstain | 53,076,964.32 | 4.839 |
Broker
Non-Votes | 26,151,871.20 | 2.384 |
TOTAL | 1,096,877,558.06 | 100.000 |
PROPOSAL 4 |
To amend the fund's fundamental investment limitation concerning lending. |
| # of
Votes | % of
Votes |
Affirmative | 858,202,239.71 | 78.240 |
Against | 146,940,468.91 | 13.397 |
Abstain | 65,582,978.24 | 5.978 |
Broker
Non-Votes | 26,151,871.20 | 2.385 |
TOTAL | 1,096,877,558.06 | 100.000 |
ADenotes trust-wide proposals and voting results. BThe special meeting of shareholders reconvened on October 14, 2004 with respect to this proposal. CEffective January 1, 2005. |
Annual Report
Managing Your Investments
Fidelity offers several ways to conveniently manage your personal investments via your telephone or PC. You can access your account information, conduct trades and research your investments 24 hours a day.
By Phone
Fidelity Automated Service Telephone provides a single toll-free number to access account balances, positions, quotes and trading. It's easy to navigate the service, and on your first call, the system will help you create a personal identification number (PIN) for security.
(phone_graphic)
Fidelity Automated
Service Telephone (FAST®)
1-800-544-5555
Press
1 For mutual fund and brokerage trading.
2 For quotes.*
3 For account balances and holdings.
4 To review orders and mutual
fund activity.
5 To change your PIN.
*0 To speak to a Fidelity representative.
By PC
Fidelity's web site on the Internet provides a wide range of information, including daily financial news, fund performance, interactive planning tools and news about Fidelity products and services.
(computer_graphic)
Fidelity's Web Site
www.fidelity.com
* When you call the quotes line, please remember that a fund's yield and return will vary and, except for money market funds, share price will also vary. This means that you may have a gain or loss when you sell your shares. There is no assurance that money market funds will be able to maintain a stable $1 share price; an investment in a money market fund is not insured or guaranteed by the U.S. government. Total returns are historical and include changes in share price, reinvestment of dividends and capital gains, and the effects of any sales charges.
Annual Report
To Write Fidelity
We'll give your correspondence immediate attention and send you written confirmation upon completion of your request.
(letter_graphic)
Making Changes
To Your Account
(such as changing name, address, bank, etc.)
Fidelity Investments
P.O. Box 770001
Cincinnati, OH 45277-0002
(letter_graphic)
For Non-Retirement
Accounts
Buying shares
Fidelity Investments
P.O. Box 770001
Cincinnati, OH 45277-0003
Overnight Express
Fidelity Investments
Attn: Distribution Services
100 Crosby Parkway - KC1H
Covington, KY 41015
Selling shares
Fidelity Investments
P.O. Box 770001
Cincinnati, OH 45277-0035
Overnight Express
Fidelity Investments
Attn: Distribution Services
100 Crosby Parkway - KC1H
Covington, KY 41015
General Correspondence
Fidelity Investments
P.O. Box 500
Merrimack, NH 03054-0500
(letter_graphic)
For Retirement
Accounts
Buying shares
Fidelity Investments
P.O. Box 770001
Cincinnati, OH 45277-0003
Selling shares
Fidelity Investments
P.O. Box 770001
Cincinnati, OH 45277-0035
Overnight Express
Fidelity Investments
Attn: Distribution Services
100 Crosby Parkway - KC1H
Covington, KY 41015
General Correspondence
Fidelity Investments
P.O. Box 500
Merrimack, NH 03054-0500
Annual Report
Investment Adviser
Fidelity Management & Research Company
Boston, MA
Investment Sub-Advisers
FMR Co., Inc.
Fidelity Management & Research
(U.K.) Inc.
Fidelity Management & Research
(Far East) Inc.
Fidelity International Investment
Advisors
Fidelity Investments Japan Limited
Fidelity International Investment
Advisors (U.K.) Limited
General Distributor
Fidelity Distributors Corporation
Boston, MA
Transfer and Shareholder
Servicing Agent
Fidelity Service Company, Inc.
Boston, MA
Custodian
JPMorgan Chase Bank
New York, NY
Fidelity's International Equity Funds
Aggressive International Fund
Canada Fund
China Region Fund
Diversified International Fund
Emerging Markets Fund
Europe Fund
Europe Capital Appreciation Fund
Global Balanced Fund
International Discovery Fund
International Small Cap Fund
Japan Fund
Japan Smaller Companies Fund
Latin America Fund
Nordic Fund
Overseas Fund
Pacific Basin Fund
Southeast Asia Fund
Worldwide Fund
Please carefully consider the funds' investment objectives, risks, charges and expenses before investing. For this and other information, call 1-800-544-6666 for a free prospectus. Read it carefully before you invest or send money.
The Fidelity Telephone Connection
Mutual Fund 24-Hour Service
Exchanges/Redemptions
and Account Assistance1-800-544-6666
Product Information1-800-544-8888
Retirement Accounts1-800-544-4774
(8 a.m. - 9 p.m.)
TDD Service1-800-544-0118
for the deaf and hearing impaired
(9 a.m. - 9 p.m. Eastern time)
Fidelity Automated Service
Telephone (FAST®) (automated graphic) 1-800-544-5555
(automated graphic) Automated line for quickest service
IGI-UANN-1204
1.807257.100
(Fidelity Investment logo)(registered trademark)
Corporate Headquarters
82 Devonshire St., Boston, MA 02109
www.fidelity.com
Fidelity's
Broadly Diversified International Equity
Funds
Fidelity® Global Balanced Fund
Fidelity Diversified International Fund
Fidelity Aggressive International Fund
Fidelity Overseas Fund
Fidelity Worldwide Fund
Annual Report
October 31, 2004
(2_fidelity_logos) (Registered_Trademark)
Contents
Shareholder Expense Example | A-4 | An example of shareholder expenses. |
Global Balanced Fund | A-5 | Performance |
| A-6 | Management's Discussion |
| A-7 | Investment Changes |
| A-8 | Investments |
| A-14 | Financial Statements |
Diversified International Fund | A-16 | Performance |
| A-17 | Management's Discussion |
| A-18 | Investment Changes |
| A-19 | Investments |
| A-26 | Financial Statements |
Aggressive International Fund | A-28 | Performance |
| A-29 | Management's Discussion |
| A-30 | Investment Changes |
| A-31 | Investments |
| A-33 | Financial Statements |
Overseas Fund | A-35 | Performance |
| A-36 | Management's Discussion |
| A-37 | Investment Changes |
| A-38 | Investments |
| A-41 | Financial Statements |
Worldwide Fund | A-43 | Performance |
| A-44 | Management's Discussion |
| A-45 | Investment Changes |
| A-46 | Investments |
| A-51 | Financial Statements |
Notes to Financial Statements | A-53 | Notes to the Financial Statements |
Reports of Independent Registered Public Accounting Firms | A-27 | |
Trustees and Officers | A-59 | |
Distributions | A-65 | |
Proxy Voting Results | A-66 | |
Prospectus | P-1 | |
| | |
To view a fund's proxy voting guidelines and proxy voting record for the 12-month period ended June 30, visit www.fidelity.com/proxyvotingresults or visit the Securities and Exchange Commission's (SEC) web site at www.sec.gov. You may also call 1-800-544-8544 to request a free copy of the proxy voting guidelines.
Standard & Poor's, S&P and S&P 500 are registered service marks of The McGraw-Hill Companies, Inc. and have been licensed for use by
Fidelity Distributors Corporation.
Other third party marks appearing herein are the property of their respective owners.
All other marks appearing herein are registered or unregistered trademarks or service marks of FMR Corp. or an affiliated company.
(Recycle graphic) This report is printed on recycled paper using soy-based inks.
Annual Report
This report and the financial statements contained herein are submitted for the general information of the shareholders of the funds. This report is not authorized for distribution to prospective investors in the funds unless preceded or accompanied by an effective prospectus.
Each fund files its complete schedule of portfolio holdings with the SEC for the first and third quarters of each fiscal year on Form N-Q. Forms N-Q are available on the SEC's website at http://www.sec.gov. Each fund's Forms N-Q may be reviewed and copied at the SEC's Public Reference Room in Washington, DC. Information regarding the operation of the SEC's Public Reference Room may be obtained by calling 1-800-SEC-0330. For a complete list of each fund's portfolio holdings, view each fund's most recent quarterly holdings report, semiannual report, or annual report on Fidelity's website at http://www.fidelity.com/holdings.
NOT FDIC INSURED ·MAY LOSE VALUE ·NO BANK GUARANTEE
Neither the funds nor Fidelity Distributors Corporation is a bank.
Annual Report
Shareholder Expense Example
As a shareholder of a Fund, you incur two types of costs: (1) transaction costs, including sales charges (loads) on purchase payments or redemption proceeds, redemption fees, and (2) ongoing costs, including management fees and other Fund expenses. This Example is intended to help you understand your ongoing costs (in dollars) of investing in the Funds and to compare these costs with the ongoing costs of investing in other mutual funds.
The Example is based on an investment of $1,000 invested at the beginning of the period and held for the entire period (May 1, 2004 to October 31, 2004).
Actual Expenses
The first line of the table below for each fund provides information about actual account values and actual expenses. You may use the information in this line, together with the amount you invested, to estimate the expenses that you paid over the period. Simply divide your account value by $1,000.00 (for example, an $8,600 account value divided by $1,000.00 = 8.6), then multiply the result by the number in the first line for a fund under the heading entitled "Expenses Paid During Period" to estimate the expenses you paid on your account during this period. A small balance maintenance fee of $12.00 that is charged once a year may apply for certain accounts with a value of less than $2,000. This fee is not included in the table below. If it was, the estimate of expenses you paid during the period would be higher, and your ending account value lower, by this amount.
Hypothetical Example for Comparison Purposes
The second line of the table below for each fund provides information about hypothetical account values and hypothetical expenses based on a fund's actual expense ratio and an assumed rate of return of 5% per year before expenses, which is not the Fund's actual return. The hypothetical account values and expenses may not be used to estimate the actual ending account balance or expenses you paid for the period. You may use this information to compare the ongoing costs of investing in the Fund and other funds. To do so, compare this 5% hypothetical example with the 5% hypothetical examples that appear in the shareholder reports of the other funds. A small balance maintenance fee of $12.00 that is charged once a year may apply for certain accounts with a value of less than $2,000. This fee is not included in the table below. If it was, the estimate of expenses you paid during the period would be higher, and your ending account value lower, by this amount.
Please note that the expenses shown in the table are meant to highlight your ongoing costs only and do not reflect any transaction costs. Therefore, the second line of the table is useful in comparing ongoing costs only, and will not help you determine the relative total costs of owning different funds. In addition, if these transactional costs were included, your costs would have been higher.
| Beginning
Account Value
May 1, 2004 | Ending
Account Value
October 31, 2004 | Expenses Paid
During Period*
May 1, 2004
to October 31, 2004 |
Global Balanced | | | |
Actual | $1,000.00 | $1,033.10 | $6.13 |
Hypothetical A | $1,000.00 | $1,018.89 | $6.11 |
Diversified International | | | |
Actual | $1,000.00 | $1,048.20 | $5.97 |
Hypothetical A | $1,000.00 | $1,019.10 | $5.90 |
Aggressive International | | | |
Actual | $1,000.00 | $993.50 | $6.21 |
Hypothetical A | $1,000.00 | $1,018.69 | $6.31 |
Overseas | | | |
Actual | $1,000.00 | $1,009.40 | $5.20 |
Hypothetical A | $1,000.00 | $1,019.76 | $5.24 |
Worldwide | | | |
Actual | $1,000.00 | $1,018.30 | $6.24 |
Hypothetical A | $1,000.00 | $1,018.74 | $6.26 |
A5% return per year before expenses
*Expenses are equal to each Fund's annualized expense ratio (shown in the table below); multiplied by the average account value over the period, multiplied by 184/366 (to reflect the one-half year period).
| Annualized
Expense Ratio |
Global Balanced | 1.20% |
Diversified International | 1.16% |
Aggressive International | 1.24% |
Overseas | 1.03% |
Worldwide | 1.23% |
Annual Report
Global Balanced
Performance: The Bottom Line
Average annual total return reflects the change in the value of an investment, assuming reinvestment of the fund's dividend income and capital gains (the profits earned upon the sale of securities that have grown in value) and assuming a constant rate of performance each year. The $10,000 table and the fund's returns do not reflect the deduction of taxes that a shareholder would pay on fund distributions or the redemption of fund shares. During periods of reimbursement by Fidelity a fund's total returns will be greater than it would be had the reimbursement not occurred. How a fund did yesterday is no guarantee of how it will do tomorrow.
Average Annual Total Returns
Periods ended
October 31, 2004 | Past 1
year | Past 5
years | Past 10
years |
Fidelity Global Balanced | 10.93% | 3.95% | 7.52% |
$10,000 Over 10 Years
Let's say hypothetically that $10,000 was invested in Fidelity® Global Balanced Fund on October 31, 1994. The chart shows how the value of your investment would have grown, and also shows how the Morgan Stanley Capital International World Index did over the same period.
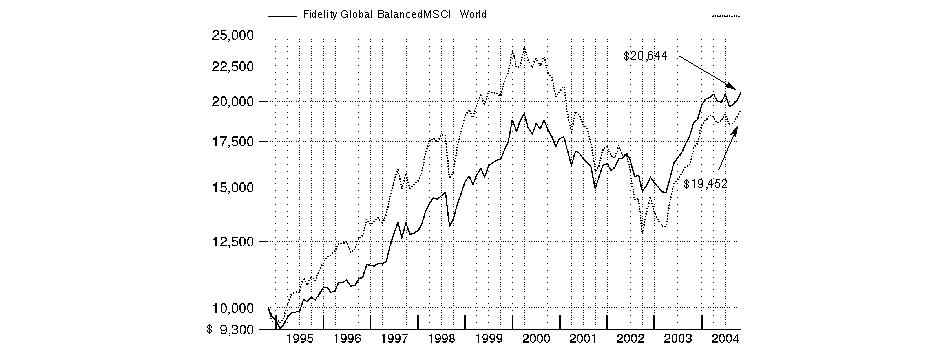
Annual Report
Global Balanced
Management's Discussion of Fund Performance
Comments from Rick Mace, Portfolio Manager of Fidelity® Global Balanced Fund
Most of the world's major stock markets posted solid gains for the year ending October 31, 2004. The Morgan Stanley Capital InternationalSM Europe, Australasia, Far East (MSCI® EAFE®) Index - designed to represent the performance of developed stock markets outside the United States and Canada - gained 19.00%, compared to 9.42% for the Standard & Poor's 500SM Index. A weak U.S. dollar relative to most foreign currencies was partly responsible for the performance disparity. On a regional basis, Europe was one of the top performers. Many investors felt European stocks offered better valuations and brighter earnings prospects than U.S. equities. Latin American countries, many of which are exporters of oil and materials that received strong support from high commodity prices, also did well. Conversely, Japan significantly underperformed, as early optimism was eroded by disappointing economic indicators and concerns about the impact of China's economic slowdown on exports. Meanwhile, technology-focused Asian emerging markets suffered due to a deceleration in corporate capital spending.
Fidelity Global Balanced Fund was up 10.93% during the one-year period ending October 31, 2004. This return trailed the 12.28% advance of the Fidelity Global Balanced Composite Index - a 60%/40% blend of the Morgan Stanley Capital International (MSCI) World Index and the Citigroup® World Government Bond Index - and the 11.27% gain of the LipperSM Global Flexible Portfolio Funds Average. My decision to own bonds that on average had a shorter duration than those in the index caused the majority of the fund's underperformance. As rates fell in several regions, the shorter-term bonds I emphasized didn't appreciate as significantly as the bonds with longer-durations held by the index. Turning to equities, good stock picking in the U.S. market helped the fund's domestic holdings outperform those in the index. Top performers included pharmaceutical company Forest Laboratories and industrial conglomerate Tyco International. Elsewhere, the fund fared well in the strong-performing European markets. Holdings in German fashion accessory retailer Bijou Brigitte and Spain-based media company Antena 3 Television rose sharply. However, overweighting Japanese stocks proved costly because the Japanese equity market trailed most others around the world. Among the fund's biggest detractors in Japan were semiconductor equipment manufacturer Tokyo Electron and telecommunication services provider KDDI.
The views expressed in this statement reflect those of the portfolio manager only through the end of the period of the report as stated on the cover and do not necessarily represent the views of Fidelity or any other person in the Fidelity organization. Any such views are subject to change at any time based upon market or other conditions and Fidelity disclaims any responsibility to update such views. These views may not be relied on as investment advice and, because investment decisions for a Fidelity fund are based on numerous factors, may not be relied on as an indication of trading intent on behalf of any Fidelity fund.
Annual Report
Global Balanced
Investment Changes
Geographic Diversification (% of fund's net assets) |
As of October 31, 2004 |
| United States of America | 46.7% | |
| Japan | 22.4% | |
| United Kingdom | 7.9% | |
| Germany | 6.5% | |
| Switzerland | 1.9% | |
| France | 1.9% | |
| Norway | 1.7% | |
| Canada | 1.5% | |
| Italy | 1.5% | |
| Other | 8.0% | |

Percentages are adjusted for the effect of futures contracts, if applicable. |
|
As of April 30, 2004 |
| United States of America | 43.8% | |
| Japan | 23.1% | |
| United Kingdom | 11.0% | |
| Germany | 5.6% | |
| Switzerland | 2.4% | |
| France | 1.6% | |
| Spain | 1.2% | |
| Canada | 1.2% | |
| Norway | 1.1% | |
| Other | 9.0% | |

Percentages are adjusted for the effect of futures contracts, if applicable. |
Asset Allocation |
| % of fund's
net assets | % of fund's net assets
6 months ago |
Stocks | 71.0 | 67.9 |
Bonds | 22.5 | 21.4 |
Short-Term Investments and Net Other Assets | 6.5 | 10.7 |
Top Five Stocks as of October 31, 2004 |
| % of fund's
net assets | % of fund's net assets
6 months ago |
Telewest Global, Inc. (United States of America) | 4.1 | 0.0 |
Microsoft Corp. (United States of America) | 1.7 | 1.1 |
Toyota Motor Corp. (Japan) | 1.1 | 1.0 |
General Electric Co. (United States of America) | 1.1 | 1.0 |
Exxon Mobil Corp. (United States of America) | 1.0 | 0.0 |
| 9.0 | |
Top Five Bond Issuers as of October 31, 2004 |
(with maturities greater than one year) | % of fund's
net assets | % of fund's net assets
6 months ago |
U.S. Treasury Obligations | 5.8 | 0.9 |
German Federal Republic | 4.9 | 2.0 |
Norway Kingdom of | 1.1 | 1.0 |
United Kingdom, Great Britain & Northern Ireland | 0.9 | 0.9 |
Italian Republic | 0.9 | 0.8 |
| 13.6 | |
Market Sectors as of October 31, 2004 |
| % of fund's
net assets | % of fund's net assets
6 months ago |
Consumer Discretionary | 13.0 | 17.1 |
Financials | 12.3 | 14.4 |
Information Technology | 9.3 | 10.3 |
Industrials | 8.2 | 7.2 |
Telecommunication Services | 7.3 | 5.2 |
Health Care | 6.1 | 7.1 |
Energy | 5.9 | 4.6 |
Consumer Staples | 4.8 | 4.5 |
Materials | 2.5 | 2.0 |
Utilities | 1.6 | 0.8 |
Annual Report
Global Balanced
Investments October 31, 2004
Showing Percentage of Net Assets
Common Stocks - 70.9% |
| Shares | | Value (Note 1) |
Australia - 0.8% |
Aristocrat Leisure Ltd. | 55,031 | | $353,946 |
BHP Billiton Ltd. | 19,134 | | 197,750 |
Macquarie Airports Fund | 128,053 | | 271,340 |
Newcrest Mining Ltd. | 17,080 | | 213,059 |
TOTAL AUSTRALIA | | 1,036,095 |
Belgium - 0.3% |
Belgacom SA | 3,400 | | 125,308 |
Mobistar SA (a) | 2,100 | | 158,017 |
Solvay SA | 700 | | 70,767 |
TOTAL BELGIUM | | 354,092 |
Bermuda - 0.2% |
Willis Group Holdings Ltd. | 8,800 | | 316,360 |
Brazil - 0.0% |
Uniao de Bancos Brasileiros SA (Unibanco) GDR | 1,650 | | 43,643 |
Canada - 1.5% |
Alcan, Inc. | 700 | | 32,389 |
Bro-X Minerals Ltd. (a) | 600 | | 0 |
EnCana Corp. | 16,300 | | 808,408 |
Newmont Mining Corp. of Canada Ltd. (exchangeable shares) | 400 | | 19,001 |
Talisman Energy, Inc. | 47,010 | | 1,262,247 |
TOTAL CANADA | | 2,122,045 |
Denmark - 0.6% |
Coloplast AS Series B | 1,400 | | 139,337 |
Danske Bank AS | 7,400 | | 207,378 |
GN Store Nordic AS | 13,500 | | 137,150 |
Novo Nordisk AS Series B | 3,950 | | 196,905 |
Novozymes AS Series B | 3,000 | | 133,793 |
TOTAL DENMARK | | 814,563 |
Egypt - 0.1% |
Orascom Telecom SAE unit (a) | 11,000 | | 188,100 |
Estonia - 0.1% |
Hansabank SA | 13,600 | | 137,491 |
Finland - 0.5% |
Fortum Oyj | 9,400 | | 144,350 |
Nokia Corp. sponsored ADR | 24,600 | | 379,332 |
Nokian Tyres Ltd. | 560 | | 60,871 |
Sampo Oyj (A Shares) | 7,200 | | 86,057 |
TOTAL FINLAND | | 670,610 |
France - 1.9% |
Accor SA | 3,300 | | 137,417 |
BNP Paribas SA | 5,100 | | 348,187 |
Clarins SA | 1,440 | | 82,003 |
CNP Assurances | 2,100 | | 143,371 |
JC Decaux SA (a) | 14,300 | | 356,661 |
|
| Shares | | Value (Note 1) |
NRJ Group | 3,300 | | $68,582 |
Orpea (a) | 4,934 | | 146,170 |
Pernod-Ricard | 665 | | 92,334 |
Sanofi-Aventis | 4,500 | | 328,500 |
Total SA Series B | 3,151 | | 657,173 |
Vivendi Universal SA sponsored ADR (a) | 7,200 | | 197,496 |
TOTAL FRANCE | | 2,557,894 |
Germany - 1.5% |
Adidas-Salomon AG | 470 | | 65,878 |
Allianz AG: | | | |
(Reg.) | 400 | | 42,600 |
sponsored ADR | 7,500 | | 79,875 |
BASF AG | 2,000 | | 125,660 |
Bijou Brigitte Modische Accessoires AG | 1,400 | | 165,005 |
Continental AG | 763 | | 41,790 |
Deutsche Telekom AG (Reg.) (a) | 19,300 | | 371,911 |
E.ON AG | 3,400 | | 277,270 |
Fielmann AG | 2,104 | | 132,309 |
Hypo Real Estate Holding AG (a) | 1,500 | | 56,281 |
K&S AG | 1,200 | | 50,154 |
Pfleiderer AG (a) | 21,890 | | 194,128 |
RWE AG | 4,336 | | 230,385 |
SAP AG sponsored ADR | 2,800 | | 119,420 |
Siemens AG (Reg.) | 1,900 | | 142,006 |
TOTAL GERMANY | | 2,094,672 |
Greece - 0.5% |
Cosmote Mobile Telecommunications SA | 6,600 | | 119,596 |
Folli Follie SA | 4,000 | | 122,851 |
Greek Organization of Football Prognostics SA | 9,450 | | 193,249 |
Public Power Corp. of Greece | 7,900 | | 196,733 |
TOTAL GREECE | | 632,429 |
Hong Kong - 1.1% |
Cheung Kong Holdings Ltd. | 31,000 | | 256,883 |
CLP Holdings Ltd. | 32,500 | | 186,640 |
Esprit Holdings Ltd. | 70,000 | | 374,115 |
Hong Kong & China Gas Co. Ltd. | 67,000 | | 129,116 |
Orient Overseas International Ltd. | 56,000 | | 203,605 |
Paul Y-ITC Construction Holdings Ltd. | 750,000 | | 110,808 |
Shun Tak Holdings Ltd. | 412,000 | | 255,393 |
TOTAL HONG KONG | | 1,516,560 |
Ireland - 0.6% |
Allied Irish Banks PLC | 10,300 | | 180,044 |
C&C Group PLC | 38,900 | | 127,438 |
DEPFA BANK PLC | 6,470 | | 99,356 |
IAWS Group PLC (Ireland) | 15,100 | | 201,157 |
Paddy Power PLC | 16,136 | | 214,546 |
TOTAL IRELAND | | 822,541 |
Italy - 0.6% |
Banca Intesa Spa | 30,400 | | 124,878 |
Common Stocks - continued |
| Shares | | Value (Note 1) |
Italy - continued |
Bulgari Spa | 14,200 | | $147,373 |
ENI Spa | 8,400 | | 192,242 |
ENI Spa sponsored ADR | 2,000 | | 228,860 |
Telecom Italia Spa | 31,800 | | 106,213 |
TOTAL ITALY | | 799,566 |
Japan - 13.5% |
Aeon Co. Ltd. | 10,900 | | 174,672 |
Aisin Seiki Co. Ltd. | 8,100 | | 181,769 |
ARRK Corp. | 2,500 | | 93,069 |
Asahi Glass Co. Ltd. | 36,000 | | 331,308 |
Bridgestone Corp. | 14,000 | | 253,980 |
Canon, Inc. | 13,000 | | 643,500 |
D&M Holdings, Inc. (a) | 25,000 | | 51,968 |
Daikin Industries Ltd. | 6,000 | | 146,265 |
Daito Trust Construction Co. | 2,200 | | 93,126 |
Daiwa House Industry Co. Ltd. | 17,000 | | 174,120 |
Daiwa Securities Group, Inc. | 41,000 | | 251,807 |
Don Quijote Co. Ltd. | 4,300 | | 258,402 |
Dowa Mining Co. Ltd. | 14,000 | | 84,660 |
East Japan Railway Co. | 58 | | 305,249 |
Fast Retailing Co. Ltd. | 3,300 | | 210,157 |
FCC Co. Ltd. | 700 | | 21,297 |
FCC Co. Ltd. New | 700 | | 21,297 |
Fuji Photo Film Co. Ltd. | 7,000 | | 239,429 |
Fujitsu Ltd. | 45,000 | | 268,295 |
H.I.S. Co. Ltd. | 4,100 | | 79,222 |
H.I.S. Co. Ltd. New (a) | 2,050 | | 38,740 |
Hitachi Cable Ltd. | 16,000 | | 62,739 |
Hokuhoku Financial Group, Inc. | 45,000 | | 102,471 |
Honda Motor Co. Ltd. | 8,700 | | 422,646 |
Hoya Corp. | 2,300 | | 236,444 |
Ito Yokado Ltd. | 5,100 | | 183,115 |
Japan Radio Co. Ltd. (a) | 15,000 | | 58,818 |
Kadokawa Shoten Publishing Co. Ltd. | 4,300 | | 167,799 |
Kamigumi Co. Ltd. | 17,000 | | 120,792 |
Kaneka Corp. | 14,000 | | 146,171 |
KDDI Corp. | 73 | | 351,774 |
Keio Electric Railway Co. Ltd. | 14,000 | | 74,210 |
Keyence Corp. | 700 | | 157,944 |
KOEI Co. Ltd. | 3,900 | | 89,729 |
Konica Minolta Holdings, Inc. | 41,500 | | 554,457 |
Mars Engineering Corp. | 2,100 | | 78,972 |
Matsushita Electric Industrial Co. Ltd. | 22,000 | | 319,220 |
Meitec Corp. | 2,900 | | 109,331 |
Millea Holdings, Inc. | 20 | | 264,563 |
Mitsubishi Rayon Co. Ltd. | 49,000 | | 156,489 |
Mitsubishi Securities Co. Ltd. | 19,000 | | 176,832 |
Mitsubishi Tokyo Financial Group, Inc. (MTFG) | 18 | | 152,820 |
Mitsui & Co. Ltd. | 30,000 | | 252,563 |
Mitsui Fudosan Co. Ltd. | 26,000 | | 276,374 |
Mizuho Financial Group, Inc. | 61 | | 235,735 |
|
| Shares | | Value (Note 1) |
NEC System Integration & Constuction Ltd. | 4,900 | | $39,354 |
Net One Systems Co. Ltd. | 29 | | 110,701 |
Nidec Copal Corp. | 4,800 | | 64,130 |
Nidec Corp. | 1,400 | | 151,859 |
Nippon Electric Glass Co. Ltd. | 9,000 | | 201,115 |
Nippon Oil Corp. | 28,000 | | 178,051 |
Nippon Steel Corp. | 91,000 | | 213,238 |
Nishi-Nippon City Bank Ltd. | 46,600 | | 207,385 |
Nissen Co. Ltd. | 5,700 | | 106,099 |
Nitto Denko Corp. | 8,400 | | 399,225 |
NOK Corp. | 6,900 | | 209,931 |
Nomura Research Institute Ltd. | 1,100 | | 96,244 |
NS Solutions Corp. | 3,200 | | 81,636 |
ORIX Corp. | 2,100 | | 246,639 |
Parco Co. Ltd. | 13,000 | | 76,525 |
Renown D'urban Holdings, Inc. (a) | 4,700 | | 42,410 |
Ricoh Co. Ltd. | 22,000 | | 411,584 |
Sanken Electric Co. Ltd. | 12,000 | | 140,369 |
Sanyo Electric Co. Ltd. | 27,000 | | 86,484 |
Senshukai Co. Ltd. | 4,000 | | 36,812 |
SFCG Co. Ltd. | 940 | | 197,885 |
Shinko Electric Industries Co.Ltd. | 2,600 | | 75,174 |
SKY Perfect Communications, Inc. | 127 | | 154,798 |
Skylark Co. Ltd. | 4,600 | | 76,323 |
SMC Corp. | 1,500 | | 160,864 |
Sony Corp. | 15,000 | | 522,750 |
Stanley Electric Co. Ltd. | 12,300 | | 190,017 |
STB Leasing Co. Ltd. | 4,800 | | 101,138 |
Sumisho Lease Co. Ltd. | 6,300 | | 244,059 |
Sumitomo Corp. | 21,000 | | 156,555 |
Sumitomo Electric Industries Ltd. | 16,000 | | 151,935 |
Sumitomo Forestry Co. Ltd. | 14,000 | | 132,810 |
Sumitomo Mitsui Financial Group, Inc. | 116 | | 755,175 |
Sumitomo Osaka Cement Co. Ltd. | 47,000 | | 103,472 |
T&D Holdings, Inc. (a) | 3,350 | | 148,136 |
Takeda Pharamaceutical Co. Ltd. | 6,600 | | 319,289 |
Telewave, Inc. | 15 | | 109,557 |
Tokyo Electric Power Co. | 14,300 | | 324,278 |
Toyota Motor Corp. | 39,400 | | 1,528,523 |
UFJ Holdings, Inc. (a) | 57 | | 264,979 |
Uniden Corp. | 7,000 | | 151,793 |
USS Co. Ltd. | 1,290 | | 104,458 |
Yamanouchi Pharmaceutical Co. Ltd. | 2,500 | | 91,888 |
Yamato Transport Co. Ltd. | 41,000 | | 553,588 |
Yokogawa Electric Corp. | 9,000 | | 117,523 |
York-Benimaru Co. Ltd. | 3,600 | | 90,821 |
TOTAL JAPAN | | 18,601,919 |
Liberia - 0.2% |
Royal Caribbean Cruises Ltd. | 6,100 | | 284,260 |
Luxembourg - 0.1% |
Millicom International Cellular SA (a) | 4,100 | | 81,467 |
Common Stocks - continued |
| Shares | | Value (Note 1) |
Netherlands - 0.8% |
ASML Holding NV (NY Shares) (a) | 6,000 | | $85,500 |
EADS NV | 6,800 | | 194,489 |
Efes Breweries International NV unit (a)(e) | 800 | | 22,200 |
ING Groep NV (Certificaten Van Aandelen) | 5,400 | | 143,802 |
Koninklijke Numico NV (Certificaten Van Aandelen) (a) | 3,370 | | 113,939 |
Koninklijke Philips Electronics NV | 2,600 | | 61,932 |
Royal Dutch Petroleum Co. (NY Shares) | 4,800 | | 260,352 |
Trader Classified Media NV (A Shares) | 7,900 | | 100,894 |
Unilever NV (NY Shares) | 710 | | 41,386 |
Wolters Kluwer NV (Certificaten Van Aandelen) | 6,200 | | 113,379 |
TOTAL NETHERLANDS | | 1,137,873 |
Netherlands Antilles - 0.1% |
Schlumberger Ltd. (NY Shares) | 3,000 | | 188,820 |
Norway - 0.6% |
ABG Sundal Collier ASA | 619,300 | | 486,951 |
Norsk Hydro ASA sponsored ADR | 1,900 | | 140,505 |
TANDBERG Television ASA (a) | 23,400 | | 170,009 |
TOTAL NORWAY | | 797,465 |
Portugal - 0.2% |
Impresa SGPS (a) | 10,100 | | 58,938 |
Media Capital SGPS SA | 18,700 | | 127,070 |
Portugal Telecom SGPS SA (Reg.) | 10,600 | | 119,777 |
TOTAL PORTUGAL | | 305,785 |
South Africa - 0.3% |
Massmart Holdings Ltd. | 19,400 | | 136,202 |
MTN Group Ltd. | 29,150 | | 159,228 |
Nedcor Ltd. | 6,300 | | 68,826 |
TOTAL SOUTH AFRICA | | 364,256 |
Spain - 0.9% |
Actividades de Construccion y Servicios SA (ACS) | 6,000 | | 116,632 |
Antena 3 Television SA (a) | 3,200 | | 206,185 |
Banco Bilbao Vizcaya Argentaria SA | 15,800 | | 248,850 |
Banco Espanol de Credito SA (Reg.) | 8,000 | | 101,045 |
Gestevision Telecinco SA | 1,608 | | 30,805 |
Grupo Auxiliar Metalurgico SA (Gamesa) | 10,872 | | 150,398 |
Telefonica SA sponsored ADR | 8,500 | | 423,555 |
TOTAL SPAIN | | 1,277,470 |
Sweden - 0.3% |
Gambro AB (A Shares) | 10,800 | | 126,323 |
Hennes & Mauritz AB (H&M) (B Shares) | 3,800 | | 110,916 |
|
| Shares | | Value (Note 1) |
Skandinaviska Enskilda Banken AB (A Shares) | 3,900 | | $65,049 |
Telefonaktiebolaget LM Ericsson ADR (a) | 3,400 | | 98,294 |
TOTAL SWEDEN | | 400,582 |
Switzerland - 1.9% |
Actelion Ltd. (Reg.) (a) | 800 | | 91,808 |
Compagnie Financiere Richemont unit | 9,740 | | 276,992 |
Credit Suisse Group sponsored ADR | 3,700 | | 126,799 |
Micronas Semiconductor Holding AG (a) | 1,800 | | 70,866 |
Nestle SA ADR | 2,400 | | 142,920 |
Nobel Biocare Holding AG (Switzerland) | 660 | | 108,249 |
Novartis AG (Reg.) | 12,620 | | 605,886 |
Phonak Holding AG | 2,723 | | 85,536 |
Roche Holding AG (participation certificate) | 5,170 | | 530,079 |
Societe Generale de Surveillance Holding SA (SGS) (Reg.) | 343 | | 219,223 |
UBS AG (NY Shares) | 4,400 | | 318,956 |
TOTAL SWITZERLAND | | 2,577,314 |
Taiwan - 0.3% |
Far EasTone Telecommunications Co. Ltd. | 188,000 | | 200,676 |
Formosa Chemicals & Fibre Corp. | 109,000 | | 184,138 |
TOTAL TAIWAN | | 384,814 |
United Kingdom - 7.0% |
Allied Domecq PLC ADR | 3,400 | | 122,366 |
AstraZeneca PLC (United Kingdom) | 7,600 | | 313,120 |
BAE Systems PLC | 50,410 | | 220,705 |
BG Group PLC | 23,700 | | 154,611 |
Blacks Leisure Group PLC | 16,600 | | 134,222 |
BP PLC sponsored ADR | 18,700 | | 1,089,275 |
BPB PLC | 12,300 | | 94,990 |
Brambles Industries PLC | 22,600 | | 109,226 |
British Airways PLC (a) | 35,800 | | 143,164 |
British Land Co. PLC | 13,200 | | 180,715 |
Brown & Jackson PLC (a) | 72,000 | | 82,694 |
Caffe Nero Group PLC (a) | 53,300 | | 97,947 |
Carphone Warehouse Group PLC | 35,882 | | 109,788 |
Corin Group PLC | 20,502 | | 129,039 |
Diageo PLC | 20,200 | | 271,589 |
Dixons Group PLC | 42,100 | | 132,875 |
Domino's Pizza UK & IRL PLC | 13,664 | | 51,726 |
Enterprise Inns PLC | 8,700 | | 98,963 |
Gallaher Group PLC | 6,200 | | 78,330 |
GlaxoSmithKline PLC | 2,600 | | 55,120 |
Hilton Group PLC | 29,100 | | 137,833 |
HSBC Holdings PLC (United Kingdom) (Reg.) | 58,347 | | 945,571 |
Intertek Group PLC | 9,900 | | 125,166 |
ITE Group PLC | 61,400 | | 88,291 |
Jessops PLC | 24,700 | | 68,085 |
Kesa Electricals PLC | 24,200 | | 120,961 |
London Clubs International PLC (a) | 65,511 | | 140,250 |
Common Stocks - continued |
| Shares | | Value (Note 1) |
United Kingdom - continued |
Luminar PLC | 8,231 | | $68,822 |
Man Group PLC | 6,400 | | 153,716 |
Moss Brothers Group PLC | 54,200 | | 105,577 |
N Brown Group PLC | 37,700 | | 89,024 |
Next PLC | 5,300 | | 162,650 |
Peacock Group PLC | 10,429 | | 49,541 |
Prudential PLC | 207 | | 1,523 |
Reckitt Benckiser PLC | 7,639 | | 209,725 |
Reed Elsevier PLC | 10,700 | | 95,660 |
Reuters Group PLC | 20,500 | | 139,668 |
Royal Bank of Scotland Group PLC | 11,972 | | 353,106 |
SABMiller PLC | 11,402 | | 164,585 |
Schroder Venture International Investment Trust PLC (a) | 5,400 | | 51,502 |
Schroders PLC | 10,300 | | 121,327 |
Shell Transport & Trading Co. PLC (Reg.) | 52,600 | | 414,313 |
Shire Pharmaceuticals Group PLC | 10,400 | | 98,453 |
Signet Group PLC | 52,000 | | 101,530 |
SkyePharma PLC (a) | 63,100 | | 61,746 |
St. James's Place Capital PLC | 26,900 | | 87,743 |
Standard Chartered PLC | 10,500 | | 187,840 |
Taylor Nelson Sofres PLC | 13,100 | | 55,609 |
Ted Baker PLC | 13,600 | | 123,336 |
Tesco PLC | 34,900 | | 184,065 |
Trinity Mirror PLC | 11,600 | | 137,493 |
Unilever PLC | 6,750 | | 57,527 |
Urbium PLC | 9,600 | | 86,002 |
Vodafone Group PLC sponsored ADR | 28,200 | | 727,278 |
W.H. Smith PLC | 12,100 | | 74,767 |
Wolseley PLC | 7,900 | | 136,609 |
Yell Group PLC | 12,200 | | 82,055 |
TOTAL UNITED KINGDOM | | 9,679,414 |
United States of America - 34.4% |
3M Co. | 4,700 | | 364,579 |
Altria Group, Inc. | 7,700 | | 373,142 |
AMBAC Financial Group, Inc. | 1,700 | | 132,702 |
American Express Co. | 5,200 | | 275,964 |
American International Group, Inc. | 7,687 | | 466,678 |
Amgen, Inc. (a) | 5,400 | | 306,720 |
Analog Devices, Inc. | 12,900 | | 519,354 |
Apollo Group, Inc. Class A (a) | 1,500 | | 99,000 |
Apple Computer, Inc. (a) | 5,000 | | 262,650 |
Asset Acceptance Capital Corp. | 13,500 | | 246,038 |
Avon Products, Inc. | 12,300 | | 486,465 |
Baker Hughes, Inc. | 4,100 | | 175,603 |
Bank of America Corp. | 25,200 | | 1,128,708 |
Baxter International, Inc. | 8,900 | | 273,764 |
Biogen Idec, Inc. (a) | 7,100 | | 412,936 |
Biomet, Inc. | 3,400 | | 158,712 |
Brunswick Corp. | 5,900 | | 276,828 |
Buffalo Wild Wings, Inc. | 13,700 | | 394,560 |
Capital One Financial Corp. | 3,700 | | 272,912 |
|
| Shares | | Value (Note 1) |
Central European Distribution Corp. (a) | 4,400 | | $111,364 |
Cintas Corp. | 7,100 | | 306,294 |
Crown Castle International Corp. (a) | 8,600 | | 131,666 |
CVS Corp. | 8,700 | | 378,102 |
Dade Behring Holdings, Inc. (a) | 2,300 | | 129,467 |
Dell, Inc. (a) | 21,800 | | 764,308 |
Dow Chemical Co. | 5,600 | | 251,664 |
DreamWorks Animation SKG, Inc. Class A | 300 | | 11,715 |
E*TRADE Financial Corp. (a) | 17,600 | | 227,040 |
East West Bancorp, Inc. | 6,800 | | 272,272 |
eBay, Inc. (a) | 4,890 | | 477,313 |
EMC Corp. (a) | 57,000 | | 733,590 |
Entergy Corp. | 5,600 | | 366,016 |
Exelon Corp. | 8,100 | | 320,922 |
Exxon Mobil Corp. | 27,300 | | 1,343,706 |
Fluor Corp. | 5,000 | | 232,200 |
Ford Motor Co. | 6,800 | | 88,604 |
Forest Laboratories, Inc. (a) | 2,800 | | 124,880 |
General Electric Co. | 42,900 | | 1,463,748 |
General Growth Properties, Inc. | 10,400 | | 343,096 |
General Growth Properties, Inc. warrants 11/9/04 (a) | 1,040 | | 790 |
Gillette Co. | 10,100 | | 418,948 |
Golden West Financial Corp., Delaware | 4,400 | | 514,448 |
Goldman Sachs Group, Inc. | 3,200 | | 314,816 |
Guidant Corp. | 6,200 | | 413,044 |
Halliburton Co. | 3,600 | | 133,344 |
Harley-Davidson, Inc. | 2,700 | | 155,439 |
Henry Schein, Inc. (a) | 3,400 | | 214,982 |
Home Depot, Inc. | 8,550 | | 351,234 |
Honeywell International, Inc. | 13,800 | | 464,784 |
Intel Corp. | 39,400 | | 877,044 |
Interface, Inc. Class A (a) | 18,100 | | 157,289 |
JCPenney Co., Inc. | 19,200 | | 664,128 |
Johnson & Johnson | 15,000 | | 875,700 |
KB Home | 5,800 | | 477,050 |
Lamar Advertising Co. Class A (a) | 4,700 | | 194,674 |
Lehman Brothers Holdings, Inc. | 4,100 | | 336,815 |
Lockheed Martin Corp. | 4,100 | | 225,869 |
Lyondell Chemical Co. | 10,800 | | 248,184 |
Marsh & McLennan Companies, Inc. | 4,700 | | 130,002 |
Massey Energy Co. | 4,500 | | 121,185 |
MBNA Corp. | 16,700 | | 428,021 |
Medtronic, Inc. | 11,300 | | 577,543 |
Merrill Lynch & Co., Inc. | 9,200 | | 496,248 |
MetLife, Inc. | 11,400 | | 437,190 |
MGIC Investment Corp. | 1,700 | | 109,327 |
Microsoft Corp. | 82,300 | | 2,303,577 |
Morgan Stanley | 11,440 | | 584,470 |
Nabors Industries Ltd. (a) | 2,800 | | 137,536 |
National Semiconductor Corp. (a) | 5,200 | | 86,840 |
New York Community Bancorp, Inc. | 10,600 | | 194,616 |
Nextel Communications, Inc. Class A (a) | 12,500 | | 331,125 |
Common Stocks - continued |
| Shares | | Value (Note 1) |
United States of America - continued |
NIKE, Inc. Class B | 2,500 | | $203,275 |
Nordstrom, Inc. | 8,500 | | 367,030 |
Norfolk Southern Corp. | 7,100 | | 241,045 |
Nucor Corp. | 600 | | 25,338 |
Occidental Petroleum Corp. | 7,100 | | 396,393 |
Oracle Corp. (a) | 33,400 | | 422,844 |
Peabody Energy Corp. | 4,700 | | 299,766 |
Pentair, Inc. | 7,600 | | 284,088 |
PepsiCo, Inc. | 14,690 | | 728,330 |
Praxair, Inc. | 7,700 | | 324,940 |
Procter & Gamble Co. | 17,900 | | 916,122 |
QUALCOMM, Inc. | 10,800 | | 451,548 |
Red Robin Gourmet Burgers, Inc. (a) | 5,000 | | 208,550 |
Robert Half International, Inc. | 7,700 | | 204,281 |
Ryland Group, Inc. | 1,500 | | 143,085 |
SBC Communications, Inc. | 18,500 | | 467,310 |
Solectron Corp. (a) | 16,500 | | 86,130 |
Southwest Airlines Co. | 48,150 | | 759,326 |
Sovereign Bancorp, Inc. | 10,100 | | 218,665 |
St. Jude Medical, Inc. (a) | 3,600 | | 275,652 |
Staples, Inc. | 1,920 | | 57,101 |
Sun Microsystems, Inc. (a) | 52,800 | | 239,184 |
Synthes, Inc. | 1,020 | | 109,023 |
Target Corp. | 7,800 | | 390,156 |
Telewest Global, Inc. (a)(d) | 453,262 | | 5,575,123 |
The Boeing Co. | 5,200 | | 259,480 |
The DIRECTV Group, Inc. (a) | 11,995 | | 201,156 |
Tyco International Ltd. | 17,600 | | 548,240 |
United Natural Foods, Inc. (a) | 12,400 | | 337,156 |
UnitedHealth Group, Inc. | 10,400 | | 752,960 |
Valero Energy Corp. | 10,000 | | 429,700 |
Verizon Communications, Inc. | 7,500 | | 293,250 |
Wachovia Corp. | 14,300 | | 703,703 |
Walt Disney Co. | 8,400 | | 211,848 |
Wendy's International, Inc. | 6,200 | | 206,894 |
Wm. Wrigley Jr. Co. | 5,000 | | 327,000 |
Wyeth | 8,300 | | 329,095 |
XM Satellite Radio Holdings, Inc. Class A (a) | 12,900 | | 416,928 |
Yahoo!, Inc. (a) | 36,100 | | 1,306,459 |
TOTAL UNITED STATES OF AMERICA | | 47,399,718 |
TOTAL COMMON STOCKS (Cost $82,108,272) | 97,587,818 |
Nonconvertible Preferred Stocks - 0.1% |
| | | |
Germany - 0.1% |
Fresenius Medical Care AG
(Cost $140,489) | 3,600 | | 197,038 |
Government Obligations - 22.5% |
| Principal Amount (f) | | Value
(Note 1) |
Germany - 4.9% |
German Federal Republic 4.5% 8/18/06 | EUR | 5,125,000 | | $6,798,122 |
Italy - 0.9% |
Italian Republic 4.25% 8/1/14 | EUR | 900,000 | | 1,176,300 |
Japan - 8.9% |
Japan Government: | | | | |
0.1% 8/20/05 | JPY | 466,000,000 | | 4,405,819 |
3% 9/20/05 | JPY | 810,000,000 | | 7,854,499 |
TOTAL JAPAN | | 12,260,318 |
Norway - 1.1% |
Norway Kingdom of 6.75% 1/15/07 | NOK | 8,500,000 | | 1,455,851 |
United Kingdom - 0.9% |
United Kingdom, Great Britain & Northern Ireland 8.5% 12/7/05 | GBP | 675,000 | | 1,293,224 |
United States of America - 5.8% |
U.S. Treasury Notes: | | | | |
2.5% 5/31/06 | | 3,950,000 | | 3,954,783 |
3.375% 12/15/08 | | 4,000,000 | | 4,040,000 |
TOTAL UNITED STATES OF AMERICA | | 7,994,783 |
TOTAL GOVERNMENT OBLIGATIONS (Cost $28,743,315) | 30,978,598 |
Money Market Funds - 6.0% |
| Shares | | |
Fidelity Cash Central Fund, 1.79% (b) | 8,066,714 | | 8,066,714 |
Fidelity Securities Lending Cash Central Fund, 1.77% (b)(c) | 113,750 | | 113,750 |
TOTAL MONEY MARKET FUNDS (Cost $8,180,464) | 8,180,464 |
TOTAL INVESTMENT PORTFOLIO - 99.5% (Cost $119,172,540) | | 136,943,918 |
NET OTHER ASSETS - 0.5% | | 674,884 |
NET ASSETS - 100% | $137,618,802 |
Currency Abbreviations |
EUR | - | European Monetary Unit |
GBP | - | British pound |
JPY | - | Japanese yen |
NOK | - | Norwegian krone |
Legend |
(a)Non-income producing |
(b)Affiliated fund that is available only to investment companies and other accounts managed by Fidelity Investments. The rate quoted is the annualized seven-day yield of the fund at period end. A complete listing of the fund's holdings as of its most recent fiscal year end is available upon request. |
(c)Includes investment made with cash collateral received from securities on loan. |
(d)Security or a portion of the security is on loan at period end. |
(e)Security exempt from registration under Rule 144A of the Securities Act of 1933. These securities may be resold in transactions exempt from registration, normally to qualified institutional buyers. At the period end, the value of these securities amounted to $22,200 or 0.0% of net assets. |
(f)Principal amount is stated in United States dollars unless otherwise noted. |
Other Information |
The composition of credit quality ratings as a percentage of net assets is as follows (ratings are unaudited): |
U.S.Government and U.S.Government Agency Obligations | 5.8% |
AAA,AA,A | 16.7% |
BBB | 0.0% |
BB | 0.0% |
B | 0.0% |
CCC,CC,C | 0.0% |
Equities | 71.0% |
Short-Term Investments and Net Other Assets | 6.5% |
| 100.0% |
We have used ratings from Moody's® Investors Services, Inc. Where Moody's ratings are not available, we have used S&P® ratings. Percentages are adjusted for the effect of futures contracts, if applicable. |
Income Tax Information |
The fund hereby designates approximately $262,000 as a capital gain dividend for the purpose of the dividend paid deduction. |
See accompanying notes which are an integral part of the financial statements.
Annual Report
Global Balanced
Financial Statements
Statement of Assets and Liabilities
| October 31, 2004 |
| | |
Assets | | |
Investment in securities, at value (including securities loaned of $111,930) (cost $119,172,540) - See accompanying schedule | | $136,943,918 |
Foreign currency held at value (cost $490,761) | | 499,271 |
Receivable for investments sold | | 1,783,356 |
Receivable for fund shares sold | | 477,845 |
Dividends receivable | | 125,166 |
Interest receivable | | 317,439 |
Other affiliated receivables | | 159 |
Other receivables | | 6,636 |
Total assets | | 140,153,790 |
| | |
Liabilities | | |
Payable for investments purchased | $2,189,384 | |
Payable for fund shares redeemed | 35,315 | |
Accrued management fee | 81,966 | |
Other affiliated payables | 36,402 | |
Other payables and accrued expenses | 78,171 | |
Collateral on securities loaned, at value | 113,750 | |
Total liabilities | | 2,534,988 |
| | |
Net Assets | | $137,618,802 |
Net Assets consist of: | | |
Paid in capital | | $116,681,920 |
Undistributed net investment income | | 1,969,601 |
Accumulated undistributed net realized gain (loss) on investments and foreign currency transactions | | 1,171,831 |
Net unrealized appreciation (depreciation) on investments and assets and liabilities in foreign currencies | | 17,795,450 |
Net Assets, for 6,989,349 shares outstanding | | $137,618,802 |
Net Asset Value, offering price and redemption price per share ($137,618,802 ÷ 6,989,349 shares) | | $19.69 |
Statement of Operations
| Year ended October 31, 2004 |
| | |
Investment Income | | |
Dividends | | $1,303,301 |
Interest | | 1,040,864 |
Security lending | | 4,415 |
| | 2,348,580 |
Less foreign taxes withheld | | (83,812) |
Total income | | 2,264,768 |
| | |
Expenses | | |
Management fee | $949,971 | |
Transfer agent fees | 349,210 | |
Accounting and security lending fees | 67,623 | |
Non-interested trustees' compensation | 861 | |
Custodian fees and expenses | 107,991 | |
Registration fees | 21,504 | |
Audit | 66,033 | |
Legal | 533 | |
Miscellaneous | 13,565 | |
Total expenses before reductions | 1,577,291 | |
Expense reductions | (19,951) | 1,557,340 |
Net investment income (loss) | | 707,428 |
Realized and Unrealized Gain (Loss) Net realized gain (loss) on: | | |
Investment securities | 10,309,194 | |
Foreign currency transactions | (77,202) | |
Total net realized gain (loss) | | 10,231,992 |
Change in net unrealized appreciation (depreciation) on: Investment securities | 1,938,073 | |
Assets and liabilities in foreign currencies | (16,635) | |
Total change in net unrealized appreciation (depreciation) | | 1,921,438 |
Net gain (loss) | | 12,153,430 |
Net increase (decrease) in net assets resulting from operations | | $12,860,858 |
See accompanying notes which are an integral part of the financial statements.
Annual Report
Fund Name
Financial Statements - continued
Statement of Changes in Net Assets
| Year ended
October 31,
2004 | Year ended
October 31,
2003 |
Increase (Decrease) in Net Assets | | |
Operations | | |
Net investment income (loss) | $707,428 | $925,605 |
Net realized gain (loss) | 10,231,992 | 3,180,488 |
Change in net unrealized appreciation (depreciation) | 1,921,438 | 16,613,655 |
Net increase (decrease) in net assets resulting from operations | 12,860,858 | 20,719,748 |
Distributions to shareholders from net investment income | (2,085,080) | (1,305,719) |
Share transactions
Proceeds from sales of shares | 43,116,007 | 25,393,629 |
Reinvestment of distributions | 1,937,941 | 1,224,318 |
Cost of shares redeemed | (34,092,066) | (18,441,176) |
Net increase (decrease) in net assets resulting from share transactions | 10,961,882 | 8,176,771 |
Redemption fees | 17,177 | 9,980 |
Total increase (decrease) in net assets | 21,754,837 | 27,600,780 |
| | |
Net Assets | | |
Beginning of period | 115,863,965 | 88,263,185 |
End of period (including undistributed net investment income of $1,969,601 and undistributed net investment income of $1,850,467, respectively) | $137,618,802 | $115,863,965 |
Other Information Shares | | |
Sold | 2,259,780 | 1,574,668 |
Issued in reinvestment of distributions | 105,592 | 82,114 |
Redeemed | (1,790,393) | (1,190,847) |
Net increase (decrease) | 574,979 | 465,935 |
Financial Highlights
Years ended October 31, | 2004 | 2003 | 2002 | 2001 | 2000 |
Selected Per-Share Data | | | | | |
Net asset value, beginning of period | $18.06 | $14.84 | $15.36 | $19.10 | $18.67 |
Income from Investment Operations | | | | | |
Net investment income (loss) B | .10 G | .15 | .17 E | .28 | .36 C |
Net realized and unrealized gain (loss) | 1.85 | 3.29 | (.66) E | (2.46) | .47 |
Total from investment operations | 1.95 | 3.44 | (.49) | (2.18) | .83 |
Distributions from net investment income | (.32) | (.22) | (.03) | (.32) | (.15) |
Distributions from net realized gain | - | - | - | (1.24) | (.25) |
Total distributions | (.32) | (.22) | (.03) | (1.56) | (.40) |
Redemption fees added to paid in capital B | - F | - F | - F | - F | - F |
Net asset value, end of period | $19.69 | $18.06 | $14.84 | $15.36 | $19.10 |
Total Return A | 10.93% | 23.49% | (3.20)% | (12.36)% | 4.45% |
Ratios to Average Net Assets D | | | | | |
Expenses before expense reductions | 1.20% | 1.29% | 1.29% | 1.29% | 1.26% |
Expenses net of voluntary waivers, if any | 1.20% | 1.29% | 1.29% | 1.29% | 1.26% |
Expenses net of all reductions | 1.19% | 1.28% | 1.27% | 1.27% | 1.25% |
Net investment income (loss) | .54% G | .98% | 1.07% E | 1.69% | 1.81% |
Supplemental Data | | | | | |
Net assets, end of period (000 omitted) | $137,619 | $115,864 | $88,263 | $88,809 | $104,820 |
Portfolio turnover rate | 94% | 113% | 126% | 102% | 62% |
A Total returns would have been lower had certain expenses not been reduced during the periods shown. B Calculated based on average shares outstanding during the period. C Investment income per share reflects a special dividend which amounted to $.04 per share. D Expense ratios reflect operating expenses of the fund. Expenses before reductions do not reflect amounts reimbursed by the investment adviser or reductions from brokerage service arrangements or other expense offset arrangements and do not represent the amount paid by the fund during periods when reimbursements or reductions occur. Expenses net of any voluntary waivers reflect expenses after reimbursement by the investment adviser but prior to reductions from brokerage service arrangements or other expense offset arrangements. Expenses net of all reductions represent the net expenses paid by the fund. E Effective November 1, 2001, the fund adopted the provisions of the AICPA Audit and Accounting Guide for Investment Companies and began amortizing premium and discount on all debt securities. Per-share data and ratios for periods prior to adoption have not been restated to reflect this change. F Amount represents less than $.01 per share. G Net investment income per share includes approximately $.05 per share received as a result of a reorganization of an issuer that was in bankruptcy. Excluding this non-recurring amount, the ratio of net investment income to average net assets would have been .26%. |
See accompanying notes which are an integral part of the financial statements.
Annual Report
Diversified International
Performance: The Bottom Line
Average annual total return reflects the change in the value of an investment, assuming reinvestment of the fund's dividend income and capital gains (the profits earned upon the sale of securities that have grown in value) and assuming a constant rate of performance each year. The $10,000 table and the fund's returns do not reflect the deduction of taxes that a shareholder would pay on fund distributions or the redemption of fund shares. During periods of reimbursement by Fidelity a fund's total returns will be greater than it would be had the reimbursement not occurred. How a fund did yesterday is no guarantee of how it will do tomorrow.
Average Annual Total Returns
Periods ended
October 31, 2004 | Past 1
year | Past 5
years | Past 10
years |
Fidelity Diversified International | 18.20% | 6.69% | 11.18% |
$10,000 Over 10 Years
Let's say hypothetically that $10,000 was invested in Fidelity Diversified International Fund on October 31, 1994. The chart shows how the value of your investment would have grown, and also shows how the Morgan Stanley Capital International EAFE Index did over the same period.
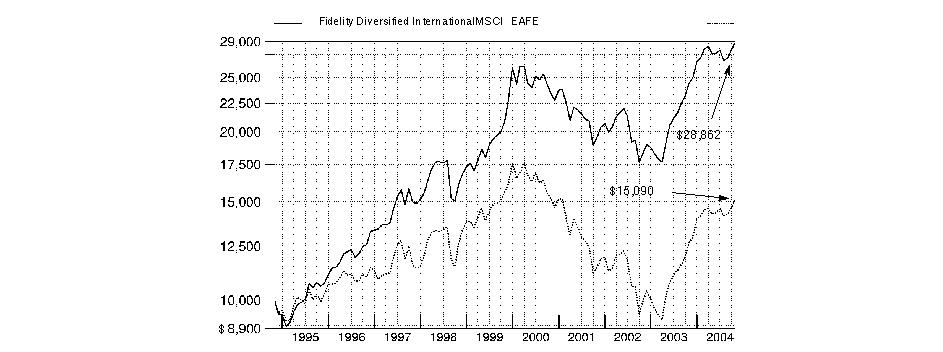
Annual Report
Diversified International
Management's Discussion of Fund Performance
Comments from Bill Bower, Portfolio Manager of Fidelity® Diversified International Fund
Most of the world's major stock markets posted solid gains for the year ending October 31, 2004. The Morgan Stanley Capital InternationalSM Europe, Australasia, Far East (MSCI® EAFE®) Index - designed to represent the performance of developed stock markets outside the United States and Canada - gained 19.00%, compared to 9.42% for the Standard & Poor's 500SM Index. A weak U.S. dollar relative to most foreign currencies was partly responsible for the performance disparity. On a regional basis, Europe was one of the top performers. Many investors felt European stocks offered better valuations and brighter earnings prospects than U.S. equities. Latin American countries, many of which are exporters of oil and materials that received strong support from high commodity prices, also did well. Conversely, Japan significantly underperformed, as early optimism was eroded by disappointing economic indicators and concerns about the impact of China's economic slowdown on exports. Meanwhile, technology-focused Asian emerging markets suffered due to a deceleration in corporate capital spending.
Fidelity Diversified International Fund was up 18.20% during the one-year period ending October 31, 2004, slightly underperforming the MSCI EAFE index, but outdistancing the 16.12% advance of the LipperSM International Funds Average. Emphasizing some of the more aggressive stocks in Japan, such as brokerage firms Nikko Cordial and Nomura Holdings, as well as semiconductor equipment company Tokyo Electron, was a main reason the fund underperformed its index. Having a significantly lower exposure to strong-performing utilities stocks than the MSCI EAFE, such as German electric power provider E.ON, also hurt the fund's relative return. The fund lost some additional ground by holding an average weighting of about 4% of its net assets in cash, which provided a head wind amid a rising equity market. From a geographic perspective, good stock picking in the European market - the largest regional component of the fund and its index - provided a considerable boost to the fund's relative results. Large positions in two strong-performing Switzerland-based health care stocks, namely dental implant provider Nobel Biocare and pharmaceutical firm Novartis, were particularly helpful. Elsewhere, owning a handful of Canadian energy stocks, such as EnCana and Talisman Energy that appreciated nicely due to the industry's supportive supply/demand profile, also worked out well.
Note to shareholders: Fidelity Diversified International Fund was closed to most new accounts on October 25, 2004.
The views expressed in this statement reflect those of the portfolio manager only through the end of the period of the report as stated on the cover and do not necessarily represent the views of Fidelity or any other person in the Fidelity organization. Any such views are subject to change at any time based upon market or other conditions and Fidelity disclaims any responsibility to update such views. These views may not be relied on as investment advice and, because investment decisions for a Fidelity fund are based on numerous factors, may not be relied on as an indication of trading intent on behalf of any Fidelity fund.
Annual Report
Diversified International
Investment Changes
Geographic Diversification (% of fund's net assets) |
As of October 31, 2004 |
| United Kingdom | 20.7% | |
| Japan | 12.5% | |
| Switzerland | 9.5% | |
| France | 8.6% | |
| United States of America | 8.2% | |
| Canada | 6.3% | |
| Germany | 5.5% | |
| Spain | 3.6% | |
| Netherlands | 3.6% | |
| Other | 21.5% | |

Percentages are adjusted for the effect of futures contracts, if applicable. |
|
As of April 30, 2004 |
| United Kingdom | 18.9% | |
| Japan | 15.7% | |
| United States of America | 8.9% | |
| Switzerland | 8.8% | |
| France | 7.8% | |
| Canada | 4.9% | |
| Spain | 4.1% | |
| Netherlands | 3.9% | |
| Germany | 3.6% | |
| Other | 23.4% | |

Percentages are adjusted for the effect of futures contracts, if applicable. |
Asset Allocation |
| % of fund's
net assets | % of fund's net assets
6 months ago |
Stocks and Investment Companies | 93.4 | 93.4 |
Bonds | 0.9 | 0.9 |
Short-Term Investments and Net Other Assets | 5.7 | 5.7 |
Top Ten Stocks as of October 31, 2004 |
| % of fund's
net assets | % of fund's net assets
6 months ago |
Vodafone Group PLC sponsored ADR (United Kingdom, Wireless Telecommunication Services) | 2.5 | 2.3 |
Novartis AG sponsored ADR (Switzerland, Pharmaceuticals) | 2.1 | 2.1 |
BP PLC sponsored ADR (United Kingdom, Oil & Gas) | 2.0 | 1.1 |
HSBC Holdings PLC sponsored ADR (United Kingdom, Commercial Banks) | 1.6 | 0.7 |
Total SA sponsored ADR (France, Oil & Gas) | 1.5 | 1.2 |
Roche Holding AG (participation certificate) (Switzerland, Pharmaceuticals) | 1.5 | 1.5 |
Sanofi-Aventis sponsored ADR (France, Pharmaceuticals) | 1.0 | 0.8 |
Toyota Motor Corp. ADR (Japan, Automobiles) | 1.0 | 1.0 |
UBS AG (NY Shares) (Switzerland, Capital Markets) | 1.0 | 0.9 |
Tesco PLC (United Kingdom, Food & Staples Retailing) | 1.0 | 0.8 |
| 15.2 | |
Market Sectors as of October 31, 2004 |
| % of fund's
net assets | % of fund's net assets
6 months ago |
Financials | 22.0 | 22.5 |
Consumer Discretionary | 14.2 | 14.0 |
Health Care | 12.1 | 13.8 |
Consumer Staples | 8.5 | 8.1 |
Information Technology | 8.2 | 9.2 |
Energy | 8.2 | 8.0 |
Industrials | 7.3 | 5.9 |
Telecommunication Services | 5.9 | 6.1 |
Materials | 5.3 | 4.7 |
Utilities | 1.8 | 1.5 |
Annual Report
Diversified International
Investments October 31, 2004
Showing Percentage of Net Assets
Common Stocks - 93.0% |
| Shares | | Value (Note 1) |
Australia - 2.8% |
Australia & New Zealand Banking Group Ltd. | 2,630,321 | | $40,176,838 |
Australian Gas Light Co. | 2,118,164 | | 20,776,276 |
Brambles Industries Ltd. (d) | 10,704,822 | | 56,828,019 |
CSL Ltd. | 8,022,774 | | 173,003,099 |
Hardman Resources Ltd. (a)(d) | 9,552,586 | | 15,377,872 |
Macquarie Bank Ltd. | 1,558,748 | | 46,205,986 |
News Corp. Ltd. sponsored ADR | 2,370,500 | | 74,528,520 |
Promina Group Ltd. | 10,274,227 | | 34,925,437 |
QBE Insurance Group Ltd. | 8,271,356 | | 85,032,331 |
Suncorp-Metway Ltd. | 956,355 | | 12,259,132 |
TOTAL AUSTRALIA | | 559,113,510 |
Austria - 0.1% |
Bank Austria Creditanstalt AG | 343,800 | | 25,522,130 |
Bermuda - 0.2% |
Aquarius Platinum Ltd. (Australia) | 3,069,696 | | 16,364,856 |
Clear Media Ltd. (a)(e) | 27,321,500 | | 26,325,687 |
TOTAL BERMUDA | | 42,690,543 |
Brazil - 0.5% |
Embraer - Empresa Brasileira de Aeronautica SA sponsored ADR | 1,684,400 | | 44,703,976 |
Petroleo Brasileiro SA Petrobras sponsored ADR | 916,600 | | 32,548,466 |
Usinas Siderurgicas de Minas Gerais SA (Usiminas) (PN-A) | 500,000 | | 7,563,172 |
Votorantim Celulose e Papel SA sponsored ADR | 453,400 | | 15,664,970 |
TOTAL BRAZIL | | 100,480,584 |
Canada - 6.3% |
Aber Diamond Corp. (a) | 552,300 | | 19,237,645 |
Astral Media, Inc. Class A (non-vtg.) | 856,500 | | 19,832,738 |
ATI Technologies, Inc. (a) | 1,822,600 | | 32,924,580 |
Barrick Gold Corp. | 829,900 | | 18,807,932 |
Brascan Corp. Class A (ltd. vtg.) (d) | 1,348,200 | | 48,023,087 |
Canadian Imperial Bank of Commerce | 494,400 | | 30,000,542 |
Canadian Natural Resources Ltd. | 1,088,900 | | 45,850,303 |
Canadian Western Bank, Edmonton | 200,000 | | 7,825,266 |
CGI Group, Inc. Class A (sub. vtg.) (a) | 3,210,700 | | 21,090,939 |
EnCana Corp. | 2,995,061 | | 148,541,844 |
ITF Optical Technologies, Inc. Series A (g) | 39,827 | | 49,784 |
Jean Coutu Group, Inc.: | | | |
Class A (f) | 1,656,600 | | 21,968,297 |
Class A (sub. vtg.) | 4,350,660 | | 57,694,428 |
Kinross Gold Corp. (a)(f) | 903,300 | | 6,764,459 |
Kinross Gold Corp. (a) | 2,774,865 | | 20,779,873 |
Loblaw Companies Ltd. | 782,100 | | 42,449,243 |
Meridian Gold, Inc. (a) | 519,000 | | 8,791,698 |
Metro, Inc. Class A (sub. vtg.) | 703,000 | | 11,146,635 |
National Bank of Canada | 1,098,000 | | 43,979,505 |
Novagold Resources, Inc. (a) | 263,200 | | 1,858,620 |
|
| Shares | | Value (Note 1) |
OZ Optics Ltd. unit (g) | 102,000 | | $1,504,500 |
Petro-Canada | 1,958,000 | | 106,883,311 |
Power Corp. of Canada (sub. vtg.) | 3,491,000 | | 84,046,574 |
Precision Drilling Corp. (a) | 1,835,400 | | 113,633,994 |
Research in Motion Ltd. (a) | 815,908 | | 71,919,960 |
Sun Life Financial, Inc. | 2,352,105 | | 72,348,691 |
Talisman Energy, Inc. | 2,793,800 | | 75,015,199 |
Tembec, Inc. (a) | 2,508,700 | | 16,355,937 |
TimberWest Forest Corp. unit | 3,062,600 | | 37,218,442 |
TransCanada Corp. | 814,600 | | 18,481,256 |
Wheaton River Minerals Ltd. (a) | 11,956,600 | | 39,172,997 |
TOTAL CANADA | | 1,244,198,279 |
Cayman Islands - 0.2% |
Apex Silver Mines Ltd. (a) | 1,870,000 | | 35,081,200 |
China - 1.0% |
BYD Co. Ltd. (H Shares) (e) | 9,773,000 | | 27,497,039 |
China Telecom Corp. Ltd. sponsored ADR | 1,086,820 | | 34,821,713 |
Global Bio-Chem Technology Group Co. Ltd. | 88,171,600 | | 69,099,112 |
Global Bio-Chem Technology Group Co. Ltd. warrants 5/31/07 (a) | 10,197,200 | | 707,438 |
People's Food Holdings Ltd. | 44,570,000 | | 31,090,051 |
Sinopec Shanghai Petrochemical Co. Ltd. sponsored ADR | 215,300 | | 7,587,172 |
Sinopec Zhenhai Refining & Chemical Co. Ltd. (H Shares) | 34,932,000 | | 33,434,408 |
TOTAL CHINA | | 204,236,933 |
Denmark - 2.1% |
Coloplast AS Series B | 466,500 | | 46,429,100 |
Danske Bank AS | 4,056,750 | | 113,686,795 |
GN Store Nordic AS | 1,008,500 | | 10,245,631 |
Novo Nordisk AS Series B | 2,600,872 | | 129,651,734 |
Novozymes AS Series B | 1,693,280 | | 75,516,060 |
TDC AS | 932,177 | | 34,590,468 |
TOTAL DENMARK | | 410,119,788 |
Finland - 0.4% |
Fortum Oyj | 2,591,200 | | 39,791,504 |
Nokia Corp. sponsored ADR | 2,750,000 | | 42,405,000 |
TOTAL FINLAND | | 82,196,504 |
France - 8.6% |
Accor SA | 1,241,400 | | 51,693,681 |
April Group | 384,874 | | 8,348,269 |
Areva (investment certificates) | 47,002 | | 17,376,890 |
AXA SA sponsored ADR (d) | 2,621,400 | | 56,753,310 |
Bacou Dalloz | 331,413 | | 25,552,580 |
BNP Paribas SA | 2,449,054 | | 167,201,802 |
Carrefour SA | 559,000 | | 24,558,044 |
CNP Assurances | 1,045,307 | | 71,365,194 |
Credit Agricole SA | 3,952,931 | | 116,195,256 |
Dassault Aviation SA | 35,265 | | 18,935,969 |
Common Stocks - continued |
| Shares | | Value (Note 1) |
France - continued |
Eiffage SA | 268,405 | | $26,774,101 |
Essilor International SA | 976,470 | | 66,478,117 |
Financiere Marc de Lacharriere SA (Fimalac) | 314,687 | | 12,886,559 |
Ipsos SA | 238,905 | | 22,409,769 |
L'Oreal SA | 1,382,279 | | 94,547,835 |
Lagardere S.C.A. (Reg.) | 1,452,218 | | 93,849,370 |
Medidep SA (a) | 386,497 | | 10,757,555 |
Neopost SA | 1,183,157 | | 82,366,279 |
NRJ Group | 713,954 | | 14,837,626 |
Pernod-Ricard | 650,731 | | 90,352,340 |
Sanofi-Aventis sponsored ADR | 5,630,400 | | 205,509,600 |
Total SA sponsored ADR | 2,940,700 | | 306,656,196 |
Vinci SA | 648,047 | | 77,415,691 |
Vivendi Universal SA sponsored ADR (a) | 1,784,600 | | 48,951,578 |
TOTAL FRANCE | | 1,711,773,611 |
Germany - 4.2% |
Adidas-Salomon AG | 277,273 | | 38,864,120 |
Allianz AG sponsored ADR (d) | 9,317,300 | | 99,229,245 |
BASF AG sponsored ADR | 333,700 | | 20,966,371 |
Celesio AG | 704,290 | | 51,219,737 |
Continental AG | 729,761 | | 39,969,857 |
Deutsche Boerse AG | 650,804 | | 32,605,446 |
Deutsche Telekom AG sponsored ADR (a) | 7,561,800 | | 145,715,886 |
E.ON AG sponsored ADR (d) | 635,300 | | 51,808,715 |
Fielmann AG | 169,873 | | 10,682,372 |
Fresenius Medical Care AG sponsored ADR | 2,079,500 | | 53,547,125 |
GFK AG | 883,551 | | 29,115,016 |
Hypo Real Estate Holding AG (a) | 905,060 | | 33,958,579 |
K&S AG | 588,273 | | 24,586,871 |
Metro AG | 1,069,857 | | 51,245,263 |
RWE AG | 2,110,774 | | 112,152,059 |
Wincor Nixdorf AG | 670,095 | | 44,702,547 |
TOTAL GERMANY | | 840,369,209 |
Greece - 0.4% |
Greek Organization of Football Prognostics SA | 2,231,590 | | 45,635,136 |
Public Power Corp. of Greece | 919,870 | | 22,907,488 |
TOTAL GREECE | | 68,542,624 |
Hong Kong - 1.2% |
Aeon Credit Service (Asia) Co. Ltd. | 6,062,000 | | 3,855,095 |
Cosco Pacific Ltd. | 11,082,000 | | 19,149,363 |
Hengan International Group Co. Ltd. | 19,752,000 | | 10,531,084 |
Hutchison Whampoa Ltd. | 3,345,000 | | 25,677,216 |
Li & Fung Ltd. | 5,000,000 | | 7,387,232 |
Shun Tak Holdings Ltd. | 19,332,000 | | 11,983,620 |
Techtronic Industries Co. Ltd. | 49,555,500 | | 98,681,893 |
Television Broadcasts Ltd. | 6,648,000 | | 28,441,281 |
|
| Shares | | Value (Note 1) |
Wharf Holdings Ltd. | 1,634,000 | | $5,374,102 |
Yue Yuen Industrial Holdings Ltd. | 14,011,947 | | 35,193,232 |
TOTAL HONG KONG | | 246,274,118 |
India - 2.0% |
ABB Ltd. India | 287,182 | | 4,833,349 |
Bajaj Auto Ltd. | 1,077,265 | | 22,854,605 |
Divi's Laboratories Ltd. | 213,156 | | 5,153,641 |
Housing Development Finance Corp. Ltd. | 4,929,483 | | 69,633,638 |
I-Flex Solutions Ltd. | 1,027,323 | | 13,504,647 |
Infosys Technologies Ltd. | 2,726,725 | | 114,659,585 |
Matrix Laboratories Ltd. | 71,515 | | 2,896,251 |
National Thermal Power Corp. | 1,695,900 | | 2,319,307 |
Ranbaxy Laboratories Ltd. | 1,021,165 | | 24,745,823 |
Reliance Industries Ltd. | 1,673,571 | | 19,533,917 |
Satyam Computer Services Ltd. | 5,198,821 | | 42,900,165 |
Siemens India Ltd. | 99,939 | | 2,525,755 |
State Bank of India | 6,579,405 | | 68,825,788 |
TOTAL INDIA | | 394,386,471 |
Ireland - 2.1% |
Allied Irish Banks PLC | 5,816,503 | | 101,672,472 |
Bank of Ireland | 2,391,277 | | 32,820,277 |
CRH PLC | 3,789,383 | | 90,923,877 |
DEPFA BANK PLC | 2,644,493 | | 40,609,892 |
Elan Corp. PLC sponsored ADR (a) | 1,771,900 | | 45,715,020 |
IAWS Group PLC (Ireland) | 3,716,027 | | 49,503,711 |
Independent News & Media PLC (Ireland) | 16,304,402 | | 47,571,615 |
TOTAL IRELAND | | 408,816,864 |
Italy - 2.1% |
Autostrade Spa | 2,103,684 | | 46,169,248 |
Banca Intesa Spa | 21,974,787 | | 90,268,843 |
Banco Popolare di Verona e Novara | 1,480,782 | | 26,339,898 |
Bulgari Spa | 1,807,404 | | 18,757,902 |
Cassa Di Risparmio Di Firenze | 4,251,975 | | 8,319,675 |
ENI Spa sponsored ADR | 1,477,900 | | 169,116,097 |
Telecom Italia Spa ADR | 1,791,019 | | 59,820,035 |
TOTAL ITALY | | 418,791,698 |
Japan - 11.7% |
Advantest Corp. | 361,100 | | 25,282,288 |
Aiful Corp. | 162,550 | | 16,249,624 |
Aruze Corp. | 200,000 | | 3,968,441 |
Asahi Glass Co. Ltd. | 4,679,000 | | 43,060,858 |
Canon, Inc. ADR | 2,215,800 | | 109,682,100 |
Credit Saison Co. Ltd. | 1,114,300 | | 35,692,134 |
Daiwa Securities Group, Inc. | 12,419,000 | | 76,272,971 |
East Japan Railway Co. | 10,421 | | 54,844,777 |
Fanuc Ltd. | 86,800 | | 5,248,925 |
Fuji Photo Film Co. Ltd. | 295,500 | | 10,107,337 |
Honda Motor Co. Ltd. | 2,048,900 | | 99,535,561 |
Hoya Corp. | 961,300 | | 98,823,110 |
Common Stocks - continued |
| Shares | | Value (Note 1) |
Japan - continued |
JAFCO Co. Ltd. | 271,500 | | $13,980,961 |
Kao Corp. | 602,000 | | 13,907,403 |
KDDI Corp. | 7,779 | | 37,485,614 |
Keyence Corp. | 238,100 | | 53,723,512 |
Millea Holdings, Inc. | 4,569 | | 60,439,363 |
Mitsubishi Electric Corp. | 4,052,000 | | 18,989,861 |
Mitsubishi Tokyo Financial Group, Inc. (MTFG) | 8,473 | | 71,935,769 |
Mizuho Financial Group, Inc. | 20,935 | | 80,903,434 |
Murata Manufacturing Co. Ltd. | 1,581,100 | | 75,443,425 |
Nikko Cordial Corp. | 20,414,000 | | 91,427,561 |
Nintendo Co. Ltd. | 247,800 | | 28,002,910 |
Nippon Electric Glass Co. Ltd. | 1,008,000 | | 22,524,873 |
Nitto Denko Corp. | 2,123,500 | | 100,923,181 |
Nomura Holdings, Inc. | 6,420,000 | | 78,131,399 |
OMC Card, Inc. (a) | 1,388,000 | | 15,619,672 |
ORIX Corp. | 943,500 | | 110,811,214 |
Rakuten, Inc. | 2,862 | | 21,498,464 |
Ricoh Co. Ltd. | 3,527,000 | | 65,984,409 |
Rohm Co. Ltd. | 734,500 | | 75,507,723 |
Seiyu Ltd. (a)(d) | 7,922,000 | | 18,413,681 |
SFCG Co. Ltd. | 82,310 | | 17,327,602 |
Shinko Electric Industries Co.Ltd. | 262,700 | | 7,595,427 |
Softbank Corp. (d) | 620,300 | | 28,132,848 |
Sumitomo Forestry Co. Ltd. | 748,000 | | 7,095,876 |
Sumitomo Mitsui Financial Group, Inc. (d) | 24,630 | | 160,344,591 |
T&D Holdings, Inc. (a) | 492,550 | | 21,780,450 |
Tokyo Electron Ltd. | 920,000 | | 49,983,464 |
Toyota Motor Corp. ADR (d) | 2,633,250 | | 204,313,868 |
UFJ Holdings, Inc. (a) | 24,583 | | 114,280,114 |
USS Co. Ltd. | 90,330 | | 7,314,481 |
Yahoo! Japan Corp. (a)(d) | 6,817 | | 30,853,148 |
Yahoo! Japan Corp. New (a)(d) | 5,706 | | 24,854,405 |
Yamato Transport Co. Ltd. | 1,415,000 | | 19,105,541 |
TOTAL JAPAN | | 2,327,404,370 |
Korea (South) - 2.9% |
AmorePacific Corp. | 255,950 | | 50,069,723 |
Hana Bank | 817,650 | | 20,413,863 |
Honam Petrochemical Corp. | 435,190 | | 17,026,640 |
Hyundai Motor Co. | 973,596 | | 47,223,106 |
Kookmin Bank sponsored ADR (a) | 2,055,190 | | 69,116,040 |
Korea Exchange Bank (a) | 3,211,310 | | 21,370,488 |
LG Electronics, Inc. | 1,768,270 | | 99,825,524 |
NCsoft Corp. (a) | 159,420 | | 15,237,107 |
Samsung Electronics Co. Ltd. | 462,500 | | 181,571,031 |
Shinhan Financial Group Co. Ltd. | 2,749,840 | | 54,161,659 |
TOTAL KOREA (SOUTH) | | 576,015,181 |
Mexico - 0.6% |
America Movil SA de CV sponsored ADR | 1,145,700 | | 50,410,800 |
|
| Shares | | Value (Note 1) |
Cemex SA de CV sponsored ADR | 310,763 | | $9,005,912 |
Fomento Economico Mexicano SA de CV sponsored ADR | 1,159,600 | | 51,138,360 |
TOTAL MEXICO | | 110,555,072 |
Netherlands - 3.6% |
ASML Holding NV (NY Shares) (a) | 7,549,433 | | 107,579,420 |
EADS NV | 3,583,153 | | 102,482,816 |
Efes Breweries International NV unit (a)(f) | 136,470 | | 3,787,043 |
Fugro NV (Certificaten Van Aandelen) | 530,900 | | 41,375,017 |
ING Groep NV sponsored ADR | 4,744,500 | | 126,346,035 |
Koninklijke Numico NV (Certificaten Van Aandelen) (a) | 2,963,357 | | 100,190,134 |
Nutreco Holding NV | 243,769 | | 5,970,746 |
OPG Groep NV (A Shares) | 495,000 | | 26,668,308 |
QIAGEN NV (a) | 3,147,382 | | 33,488,144 |
Reed Elsevier NV ADR | 2,794,100 | | 73,903,945 |
VNU NV | 2,010,947 | | 55,096,684 |
Wolters Kluwer NV (Certificaten Van Aandelen) | 2,106,671 | | 38,524,509 |
TOTAL NETHERLANDS | | 715,412,801 |
Netherlands Antilles - 0.2% |
Schlumberger Ltd. (NY Shares) | 499,800 | | 31,457,412 |
Norway - 0.9% |
DnB NOR ASA | 11,746,090 | | 99,747,421 |
Schibsted AS (B Shares) | 963,150 | | 21,053,452 |
Storebrand ASA (A Shares) | 7,051,661 | | 53,783,338 |
TOTAL NORWAY | | 174,584,211 |
Portugal - 0.3% |
Brisa Auto-Estradas de Portugal SA | 5,148,820 | | 42,235,137 |
Portugal Telecom SGPS SA sponsored ADR | 1,995,200 | | 22,585,664 |
TOTAL PORTUGAL | | 64,820,801 |
Singapore - 0.1% |
Want Want Holdings Ltd. | 18,018,000 | | 17,657,640 |
South Africa - 0.1% |
Anglogold Ashanti Ltd. sponsored ADR (d) | 307,700 | | 11,409,516 |
Massmart Holdings Ltd. | 1,954,145 | | 13,719,484 |
TOTAL SOUTH AFRICA | | 25,129,000 |
Spain - 3.6% |
Actividades de Construccion y Servicios SA (ACS) | 3,729,637 | | 72,499,082 |
Altadis SA (Spain) | 1,563,473 | | 57,562,337 |
Antena 3 Television SA (a) | 336,053 | | 21,652,868 |
Banco Bilbao Vizcaya Argentaria SA sponsored ADR (d) | 6,449,100 | | 101,573,325 |
Banco Santander Central Hispano SA ADR (d) | 2,232,100 | | 24,954,878 |
Compania de Distribucion Integral Logista SA | 647,820 | | 29,430,042 |
Common Stocks - continued |
| Shares | | Value (Note 1) |
Spain - continued |
Fomento Construcciones y Contratas SA (FOCSA) | 438,613 | | $16,771,437 |
Gestevision Telecinco SA | 2,023,860 | | 38,771,307 |
Grupo Auxiliar Metalurgico SA (Gamesa) | 3,302,932 | | 45,691,298 |
Grupo Ferrovial SA | 1,207,903 | | 53,653,103 |
Inditex SA | 2,375,131 | | 60,545,946 |
Prosegur Comp Securidad SA (Reg.) | 1,277,771 | | 22,074,708 |
Telefonica SA sponsored ADR | 3,371,100 | | 167,981,913 |
Vallehermoso SA | 500,000 | | 7,703,794 |
TOTAL SPAIN | | 720,866,038 |
Sweden - 1.0% |
Gambro AB (A Shares) | 3,049,500 | | 35,668,809 |
Hennes & Mauritz AB (H&M) (B Shares) | 1,676,950 | | 48,947,683 |
Skandinaviska Enskilda Banken AB (A Shares) | 1,222,000 | | 20,381,924 |
Tele2 AB (B Shares) (d) | 947,650 | | 31,545,023 |
Telefonaktiebolaget LM Ericsson ADR (a) | 2,307,100 | | 66,698,261 |
TOTAL SWEDEN | | 203,241,700 |
Switzerland - 9.5% |
ABB Ltd. (Reg.) (a) | 20,306,294 | | 117,707,786 |
Actelion Ltd. (Reg.) (a) | 329,985 | | 37,868,944 |
Alcon, Inc. | 914,900 | | 65,140,880 |
Compagnie Financiere Richemont unit | 2,642,856 | | 75,159,123 |
Credit Suisse Group sponsored ADR | 2,596,800 | | 88,992,336 |
INFICON Holding AG (a)(e) | 147,886 | | 9,662,513 |
Nestle SA (Reg.) | 763,830 | | 181,232,072 |
Nobel Biocare Holding AG (Switzerland) | 682,443 | | 111,930,256 |
Novartis AG sponsored ADR | 8,819,499 | | 423,424,147 |
Phonak Holding AG | 868,728 | | 27,288,742 |
Roche Holding AG (participation certificate) | 2,854,480 | | 292,669,084 |
Schindler Holding AG (Reg.) | 118,116 | | 42,050,008 |
SIG Holding AG | 158,547 | | 29,749,144 |
Societe Generale de Surveillance Holding SA (SGS) (Reg.) | 88,300 | | 56,435,668 |
Swiss Life Holding (a) | 217,662 | | 27,914,267 |
Syngenta AG sponsored ADR | 1,018,700 | | 19,396,048 |
Tecan Group AG (e) | 682,332 | | 15,117,843 |
The Swatch Group AG (Reg.) | 2,664,100 | | 73,643,240 |
UBS AG (NY Shares) | 2,758,753 | | 199,982,005 |
TOTAL SWITZERLAND | | 1,895,364,106 |
Taiwan - 0.2% |
Novatek Microelectronics Corp. | 2,154,000 | | 5,248,946 |
Taishin Financial Holdings Co. Ltd. | 22,697,288 | | 18,527,014 |
Yuen Foong Yu Paper Manufacturing Co. | 15,894,360 | | 7,413,725 |
TOTAL TAIWAN | | 31,189,685 |
Thailand - 0.0% |
Thai Oil PCL (a) | 3,959,500 | | 3,977,822 |
|
| Shares | | Value (Note 1) |
United Kingdom - 20.6% |
Allied Domecq PLC | 5,416,296 | | $48,248,410 |
Amdocs Ltd. (a) | 2,358,300 | | 59,311,245 |
AstraZeneca PLC sponsored ADR | 2,582,900 | | 106,415,480 |
BAE Systems PLC | 11,360,220 | | 49,737,328 |
BOC Group PLC | 4,018,363 | | 64,760,704 |
BP PLC sponsored ADR | 6,777,900 | | 394,812,675 |
British American Tobacco PLC sponsored ADR | 3,223,800 | | 97,036,380 |
British Land Co. PLC | 3,695,495 | | 50,593,147 |
Cadbury Schweppes PLC sponsored ADR | 2,626,500 | | 87,987,750 |
Capita Group PLC | 18,240,802 | | 117,907,338 |
Carnival PLC ADR | 1,542,300 | | 81,803,592 |
Carphone Warehouse Group PLC | 2,993,508 | | 9,159,198 |
Daily Mail & General Trust PLC Class A | 4,266,430 | | 56,802,286 |
Danka Business Systems PLC sponsored ADR (a)(d) | 1,877,700 | | 6,515,619 |
Enterprise Inns PLC | 7,032,132 | | 79,990,878 |
FKI PLC | 4,116,265 | | 9,039,284 |
French Connection Group PLC | 2,689,519 | | 15,766,239 |
George Wimpey PLC | 3,146,100 | | 20,235,007 |
Group 4 Securicor PLC (a) | 12,816,124 | | 28,026,651 |
GUS PLC | 308,500 | | 5,051,213 |
Hilton Group PLC | 16,783,453 | | 79,495,545 |
HSBC Holdings PLC sponsored ADR (d) | 3,900,600 | | 316,065,618 |
Inchcape PLC | 1,358,940 | | 36,909,445 |
Intertek Group PLC | 3,177,334 | | 40,171,135 |
ITV PLC | 25,000,024 | | 49,157,185 |
Johnston Press PLC | 1,005,927 | | 10,176,222 |
Kesa Electricals PLC | 5,320,074 | | 26,591,900 |
Maiden Group PLC | 1,585,000 | | 6,626,336 |
mmO2 PLC (a) | 4,566,587 | | 8,832,358 |
National Grid Transco PLC | 10,108,837 | | 87,959,748 |
Next PLC | 2,308,001 | | 70,829,677 |
Northern Rock PLC | 2,243,000 | | 30,563,510 |
PHS Group PLC | 4,354,392 | | 5,601,294 |
Provident Financial PLC | 4,523,707 | | 48,589,428 |
Prudential PLC | 2,441,118 | | 17,966,112 |
Punch Taverns Ltd. | 2,894,500 | | 29,414,501 |
Rank Group PLC | 9,138,973 | | 48,031,508 |
Reckitt Benckiser PLC | 5,403,762 | | 148,357,535 |
Reuters Group PLC sponsored ADR | 789,800 | | 32,302,820 |
Rio Tinto PLC (Reg.) | 2,592,061 | | 68,884,021 |
Royal Bank of Scotland Group PLC | 5,490,512 | | 161,938,712 |
SABMiller PLC | 3,960,669 | | 57,171,230 |
Serco Group PLC | 11,783,976 | | 47,207,515 |
Shire Pharmaceuticals Group PLC sponsored ADR | 1,516,000 | | 43,054,400 |
Signet Group PLC | 17,664,700 | | 34,490,382 |
SMG PLC | 6,338,443 | | 13,103,820 |
Smith & Nephew PLC | 15,371,105 | | 132,929,313 |
Standard Chartered PLC | 4,036,049 | | 72,202,990 |
Taylor Nelson Sofres PLC | 6,062,020 | | 25,733,102 |
Common Stocks - continued |
| Shares | | Value (Note 1) |
United Kingdom - continued |
Tesco PLC | 37,521,958 | | $197,892,889 |
Trinity Mirror PLC | 2,569,905 | | 30,460,679 |
Vodafone Group PLC sponsored ADR | 19,622,400 | | 506,061,703 |
VT Group PLC | 1,632,799 | | 8,153,894 |
W.H. Smith PLC | 2,324,088 | | 14,360,768 |
William Hill PLC | 4,671,790 | | 41,981,212 |
Xstrata PLC | 6,617,078 | | 102,750,930 |
Yell Group PLC | 9,132,830 | | 61,425,579 |
TOTAL UNITED KINGDOM | | 4,102,645,440 |
United States of America - 3.5% |
AFLAC, Inc. | 1,202,100 | | 43,131,348 |
Covance, Inc. (a) | 725,100 | | 28,800,972 |
Fox Entertainment Group, Inc. Class A (a) | 508,400 | | 15,079,144 |
Freeport-McMoRan Copper & Gold, Inc. Class B | 2,135,600 | | 77,351,432 |
Mettler-Toledo International, Inc. (a) | 1,003,900 | | 48,086,810 |
Newmont Mining Corp. | 730,380 | | 34,707,658 |
NTL, Inc. (a) | 1,035,928 | | 68,899,571 |
Orthofix International NV (a) | 512,400 | | 18,190,200 |
Phelps Dodge Corp. | 745,400 | | 65,252,316 |
Shaw Group, Inc. (a) | 1,397,900 | | 17,040,401 |
Stillwater Mining Co. (a) | 1,666,000 | | 20,591,760 |
Synthes, Inc. | 1,347,494 | | 144,027,672 |
Telewest Global, Inc. (a) | 6,177,222 | | 75,979,831 |
Transocean, Inc. (a) | 1,295,200 | | 45,655,800 |
TOTAL UNITED STATES OF AMERICA | | 702,794,915 |
TOTAL COMMON STOCKS (Cost $14,810,787,238) | 18,495,710,260 |
Preferred Stocks - 0.4% |
| | | |
Convertible Preferred Stocks - 0.0% |
Canada - 0.0% |
Metrophotonics, Inc. Series 2 (g) | 198,000 | | 851,400 |
Nonconvertible Preferred Stocks - 0.4% |
Germany - 0.3% |
Fresenius Medical Care AG | 536,400 | | 29,358,657 |
Porsche AG (non-vtg.) | 47,573 | | 30,376,270 |
TOTAL GERMANY | | 59,734,927 |
Italy - 0.1% |
Banca Intesa Spa (Risp) | 6,010,500 | | 20,313,613 |
TOTAL NONCONVERTIBLE PREFERRED STOCKS | | 80,048,540 |
TOTAL PREFERRED STOCKS (Cost $61,542,932) | 80,899,940 |
Nonconvertible Bonds - 0.1% |
| Principal
Amount | | Value
(Note 1) |
United Kingdom - 0.1% |
British Energy PLC: | | | | |
6.077% 3/25/06 | GBP | 2,461,000 | | $10,786,059 |
6.202% 3/25/16 | GBP | 1,439,000 | | 6,306,842 |
TOTAL NONCONVERTIBLE BONDS (Cost $11,786,292) | 17,092,901 |
Government Obligations - 1.8% |
|
Germany - 1.0% |
German Federal Republic 2.0028% to 2.0333% 11/17/04 | EUR | 152,600,000 | | 195,067,410 |
Japan - 0.8% |
Japan Government: | | | | |
0.1% 1/20/06 | JPY | 4,619,700,000 | | 43,689,568 |
0.1% 2/20/06 | JPY | 9,152,500,000 | | 86,542,168 |
0.2% 8/20/06 | JPY | 4,013,000,000 | | 37,982,352 |
TOTAL JAPAN | | 168,214,088 |
TOTAL GOVERNMENT OBLIGATIONS (Cost $353,132,368) | 363,281,498 |
Money Market Funds - 6.5% |
| Shares | | |
Fidelity Cash Central Fund, 1.79% (b) | 1,052,365,262 | | 1,052,365,262 |
Fidelity Securities Lending Cash Central Fund, 1.77% (b)(c) | 237,161,317 | | 237,161,317 |
TOTAL MONEY MARKET FUNDS (Cost $1,289,526,579) | 1,289,526,579 |
Cash Equivalents - 0.0% |
| Maturity
Amount | | |
Investments in repurchase agreements (Collateralized by U.S. Treasury Obligations, in a joint trading account at 1.79%, dated 10/29/04 due 11/1/04)
(Cost $6,488,000) | $6,488,968 | | 6,488,000 |
TOTAL INVESTMENT
PORTFOLIO - 101.8% (Cost $16,533,263,409) | | 20,252,999,178 |
NET OTHER ASSETS - (1.8)% | | (350,936,158) |
NET ASSETS - 100% | $19,902,063,020 |
Currency Abbreviations |
EUR | - | European Monetary Unit |
GBP | - | British pound |
JPY | - | Japanese yen |
Legend |
(a)Non-income producing |
(b)Affiliated fund that is available only to investment companies and other accounts managed by Fidelity Investments. The rate quoted is the annualized seven-day yield of the fund at period end. A complete listing of the fund's holdings as of its most recent fiscal year end is available upon request. |
(c)Includes investment made with cash collateral received from securities on loan. |
(d)Security or a portion of the security is on loan at period end. |
(e)Affiliated company |
(f)Security exempt from registration under Rule 144A of the Securities Act of 1933. These securities may be resold in transactions exempt from registration, normally to qualified institutional buyers. At the period end, the value of these securities amounted to $32,519,799 or 0.2% of net assets. |
(g)Restricted securities - Investment in securities not registered under the Securities Act of 1933 (excluding 144A issues). At the end of the period, the value of restricted securities (excluding 144A issues) amounted to $2,405,684 or 0.0% of net assets. |
Additional information on each holding is as follows: |
Security | Acquisition Date | Acquisition Cost |
ITF Optical Technologies, Inc. Series A | 10/11/00 | $1,999,935 |
Metrophotonics, Inc. Series 2 | 9/29/00 | $1,980,000 |
OZ Optics Ltd. unit | 8/18/00 | $1,505,520 |
Other Information |
An affiliated company is a company in which the fund has ownership of at least 5% of the voting securities. Companies which are affiliates of the fund at period-end are noted in the fund's Schedule of Investments. Transactions during the period with companies which are or were affiliates are as follows: |
Affiliate | Value, beginning
of period | Purchases | Sales
Proceeds | Dividend
Income | Value, end
of period |
Banco Latin Americano de Exporaciones SA (BLADEX) Series E | $27,404,760 | $- | $29,454,012 | $203,974 | $- |
Business Objects SA sponsored ADR | - | 21,249,034 | 15,908,311 | - | - |
BYD Co. Ltd. (H Shares) | 23,084,259 | 2,582,387 | - | 557,504 | 27,497,039 |
Clear Media Ltd. | 17,565,565 | 4,536,230 | 4,428,924 | - | 26,325,687 |
Grupo Radio Centro SA de CV sponsored ADR | 6,732,237 | 140,244 | 6,024,597 | - | - |
INFICON Holding AG | 14,630,912 | - | 4,074,364 | - | 9,662,513 |
Orthofix International NV | 26,298,250 | - | 7,798,092 | - | - |
Tecan Group AG | 14,116,998 | 16,295,348 | 3,566,823 | 226,536 | 15,117,843 |
Total | $129,832,981 | $44,803,243 | $71,255,123 | $988,014 | $78,603,082 |
Income Tax Information |
At October 31, 2004, the fund had a capital loss carryforward of approximately $179,438,000 all of which will expire on October 31, 2010. |
See accompanying notes which are an integral part of the financial statements.
Annual Report
Diversified International
Financial Statements
Statement of Assets and Liabilities
| October 31, 2004 |
| | |
Assets | | |
Investment in securities, at value (including securities loaned of $226,690,610 and repurchase agreements of $6,488,000)(cost $16,533,263,409) - See accompanying schedule | | $20,252,999,178 |
Cash | | 367 |
Foreign currency held at value (cost $32,480,725) | | 32,646,051 |
Receivable for investments sold | | 101,522,269 |
Receivable for fund shares sold | | 70,597,635 |
Dividends receivable | | 20,789,667 |
Interest receivable | | 1,560,278 |
Other affiliated receivables | | 38,400 |
Other receivables | | 2,203,998 |
Total assets | | 20,482,357,843 |
| | |
Liabilities | | |
Payable for investments purchased | $301,309,469 | |
Payable for fund shares redeemed | 14,981,715 | |
Accrued management fee | 13,416,529 | |
Other affiliated payables | 4,248,245 | |
Other payables and accrued expenses | 9,177,548 | |
Collateral on securities loaned, at value | 237,161,317 | |
Total liabilities | | 580,294,823 |
| | |
Net Assets | | $19,902,063,020 |
Net Assets consist of: | | |
Paid in capital | | $16,316,644,853 |
Undistributed net investment income | | 85,476,474 |
Accumulated undistributed net realized gain (loss) on investments and foreign currency transactions | | (214,920,232) |
Net unrealized appreciation (depreciation) on investments and assets and liabilities in foreign currencies | | 3,714,861,925 |
Net Assets, for 763,250,283 shares outstanding | | $19,902,063,020 |
Net Asset Value, offering price and redemption price per share ($19,902,063,020 ÷ 763,250,283 shares) | | $26.08 |
Statement of Operations
| Year ended October 31, 2004 |
| | |
Investment Income | | |
Dividends (including $988,014 received from affiliated issuers) | | $300,603,850 |
Interest | | 15,276,442 |
Security lending | | 4,420,622 |
| | 320,300,914 |
Less foreign taxes withheld | | (32,417,936) |
Total income | | 287,882,978 |
| | |
Expenses | | |
Management fee
Basic fee | $117,634,349 | |
Performance adjustment | 17,520,351 | |
Transfer agent fees | 42,184,221 | |
Accounting and security lending fees | 1,989,255 | |
Non-interested trustees' compensation | 90,107 | |
Appreciation in deferred trustee compensation account | 8,670 | |
Custodian fees and expenses | 4,395,877 | |
Registration fees | 1,375,661 | |
Audit | 139,941 | |
Legal | 25,618 | |
Miscellaneous | 1,868,534 | |
Total expenses before reductions | 187,232,584 | |
Expense reductions | (6,014,701) | 181,217,883 |
Net investment income (loss) | | 106,665,095 |
Realized and Unrealized Gain (Loss) Net realized gain (loss) on: | | |
Investment securities (net of foreign taxes of $1,360,601) (Including realized gain (loss) of $960,416 from affiliated issuers) | 681,201,723 | |
Foreign currency transactions | (420,809) | |
Total net realized gain (loss) | | 680,780,914 |
Change in net unrealized appreciation (depreciation) on: Investment securities (net of decrease in deferred foreign taxes of $12,339,731) | 1,619,242,164 | |
Assets and liabilities in foreign currencies | 441,882 | |
Total change in net unrealized appreciation (depreciation) | | 1,619,684,046 |
Net gain (loss) | | 2,300,464,960 |
Net increase (decrease) in net assets resulting from operations | | $2,407,130,055 |
See accompanying notes which are an integral part of the financial statements.
Annual Report
Fund Name
Financial Statements - continued
Statement of Changes in Net Assets
| Year ended
October 31,
2004 | Year ended
October 31,
2003 |
Increase (Decrease) in Net Assets | | |
Operations | | |
Net investment income (loss) | $106,665,095 | $80,996,234 |
Net realized gain (loss) | 680,780,914 | 163,805,573 |
Change in net unrealized appreciation (depreciation) | 1,619,684,046 | 2,381,925,774 |
Net increase (decrease) in net assets resulting from operations | 2,407,130,055 | 2,626,727,581 |
Distributions to shareholders from net investment income | (162,070,361) | (53,240,295) |
Share transactions
Proceeds from sales of shares | 9,058,506,235 | 3,892,882,628 |
Reinvestment of distributions | 153,854,160 | 50,696,237 |
Cost of shares redeemed | (3,099,431,189) | (1,710,750,521) |
Net increase (decrease) in net assets resulting from share transactions | 6,112,929,206 | 2,232,828,344 |
Redemption fees | 1,687,773 | 598,391 |
Total increase (decrease) in net assets | 8,359,676,673 | 4,806,914,021 |
| | |
Net Assets | | |
Beginning of period | 11,542,386,347 | 6,735,472,326 |
End of period (including undistributed net investment income of $85,476,474 and undistributed net investment income of $122,952,442, respectively) | $19,902,063,020 | $11,542,386,347 |
Other Information Shares | | |
Sold | 366,041,656 | 207,041,717 |
Issued in reinvestment of distributions | 6,640,238 | 2,989,169 |
Redeemed | (125,764,850) | (92,290,398) |
Net increase (decrease) | 246,917,044 | 117,740,488 |
Financial Highlights
Years ended October 31, | 2004 | 2003 | 2002 | 2001 | 2000 |
Selected Per-Share Data | | | | | |
Net asset value, beginning of period | $22.35 | $16.90 | $18.06 | $22.98 | $21.34 |
Income from Investment Operations | | | | | |
Net investment income (loss) B | .16 | .18 | .14 | .22 | .39 C |
Net realized and unrealized gain (loss) | 3.87 | 5.40 | (1.29) | (3.78) | 2.20 |
Total from investment operations | 4.03 | 5.58 | (1.15) | (3.56) | 2.59 |
Distributions from net investment income | (.30) | (.13) | (.01) | (.55) | (.25) |
Distributions from net realized gain | - | - | - | (.81) | (.70) |
Total distributions | (.30) | (.13) | (.01) | (1.36) | (.95) |
Redemption fees added to paid in capital B | - E | - E | - E | - E | - E |
Net asset value, end of period | $26.08 | $22.35 | $16.90 | $18.06 | $22.98 |
Total Return A | 18.20% | 33.26% | (6.37)% | (16.45)% | 12.20% |
Ratios to Average Net Assets D | | | | | |
Expenses before expense reductions | 1.15% | 1.24% | 1.22% | 1.21% | 1.14% |
Expenses net of voluntary waivers, if any | 1.15% | 1.24% | 1.22% | 1.21% | 1.14% |
Expenses net of all reductions | 1.12% | 1.22% | 1.19% | 1.16% | 1.12% |
Net investment income (loss) | .66% | .96% | .77% | 1.08% | 1.62% |
Supplemental Data | | | | | |
Net assets, end of period (000 omitted) | $19,902,063 | $11,542,386 | $6,735,472 | $5,843,745 | $6,287,669 |
Portfolio turnover rate | 55% | 51% | 55% | 86% | 94% |
A Total returns would have been lower had certain expenses not been reduced during the periods shown. B Calculated based on average shares outstanding during the period. C Investment income per share reflects a special dividend which amounted to $.19 per share. D Expense ratios reflect operating expenses of the fund. Expenses before reductions do not reflect amounts reimbursed by the investment adviser or reductions from brokerage service arrangements or other expense offset arrangements and do not represent the amount paid by the fund during periods when reimbursements or reductions occur. Expenses net of any voluntary waivers reflect expenses after reimbursement by the investment adviser but prior to reductions from brokerage service arrangements or other expense offset arrangements. Expenses net of all reductions represent the net expenses paid by the fund. E Amount represents less than $.01 per share. |
See accompanying notes which are an integral part of the financial statements.
Annual Report
Aggressive International
Performance: The Bottom Line
Average annual total return reflects the change in the value of an investment, assuming reinvestment of the fund's dividend income and capital gains (the profits earned upon the sale of securities that have grown in value) and assuming a constant rate of performance each year. The $10,000 table and the fund's returns do not reflect the deduction of taxes that a shareholder would pay on fund distributions or the redemption of fund shares. During periods of reimbursement by Fidelity a fund's total returns will be greater than it would be had the reimbursement not occurred. How a fund did yesterday is no guarantee of how it will do tomorrow.
Average Annual Total Returns
Periods ended
October 31, 2004 | Past 1
year | Past 5
years | Life of
fund A |
Fidelity Aggressive International | 6.65% | 0.51% | 6.45% |
A From November 1, 1994.
$10,000 Over Life of Fund
Let's say hypothetically that $10,000 was invested in Fidelity Aggressive International Fund on November 1, 1994, when the fund started. The chart shows how the value of your investment would have grown, and also shows how the Morgan Stanley Capital International All Country World ex USA Index did over the same period.
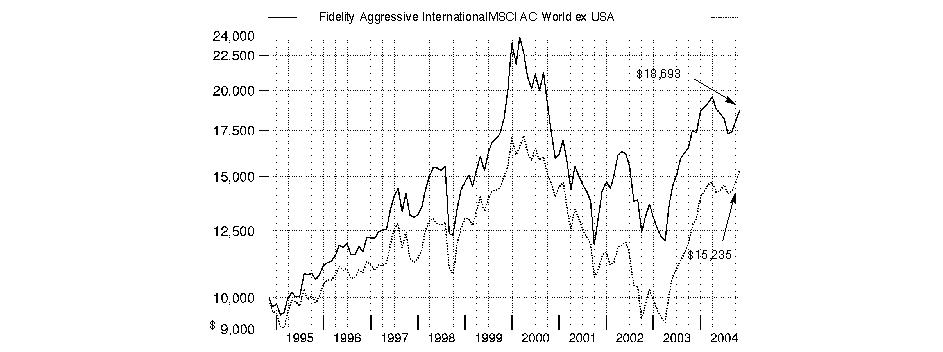
Annual Report
Aggressive International
Management's Discussion of Fund Performance
Comments from Kevin McCarey, Portfolio Manager of Fidelity® Aggressive International Fund
Most of the world's major stock markets posted solid gains for the year ending October 31, 2004. The Morgan Stanley Capital InternationalSM Europe, Australasia, Far East (MSCI® EAFE®) Index - designed to represent the performance of developed stock markets outside the United States and Canada - gained 19.00%, compared to 9.42% for the Standard & Poor's 500SM Index. A weak U.S. dollar relative to most foreign currencies was partly responsible for the performance disparity. On a regional basis, Europe was one of the top performers. Many investors felt European stocks offered better valuations and brighter earnings prospects than U.S. equities. Latin American countries, many of which are exporters of oil and materials that received strong support from high commodity prices, also did well. Conversely, Japan significantly underperformed, as early optimism was eroded by disappointing economic indicators and concerns about the impact of China's economic slowdown on exports. Meanwhile, technology-focused Asian emerging markets suffered due to a deceleration in corporate capital spending.
For the 12 months ending October 31, 2004, the fund gained 6.65%. By comparison, the Morgan Stanley Capital International All Country World (MSCI ACWI) ex USA Index returned 19.40%, and the LipperSM International Funds Average returned 16.12%. There were several reasons for the relative underperformance. One was weak stock selection in emerging markets, particularly India. India's stock market plummeted in May, as investors feared whether a new incoming government would reverse India's recent economic reforms. Also hurting performance were some of the fund's technology holdings, including those in emerging markets, which fell on a downturn in demand. For example, semiconductor equipment makers ASM International and AMSL Holding, both Dutch companies, hurt results. These leading suppliers to semiconductor manufacturers were hurt by a near-term slowdown in orders. On the positive side, Sweden-based wireless telecommunications equipment maker Ericsson was a particularly strong holding, benefiting from stronger-than-expected earnings. The fund also benefited from timely trading, as I eliminated Ericsson from the portfolio shortly before it declined on concerns about China's economy. Also adding to performance was French telecommunications equipment maker Alcatel, the third-largest holding in the fund at period end, which benefited from improved financial performance.
The views expressed in this statement reflect those of the portfolio manager only through the end of the period of the report as stated on the cover and do not necessarily represent the views of Fidelity or any other person in the Fidelity organization. Any such views are subject to change at any time based upon market or other conditions and Fidelity disclaims any responsibility to update such views. These views may not be relied on as investment advice and, because investment decisions for a Fidelity fund are based on numerous factors, may not be relied on as an indication of trading intent on behalf of any Fidelity fund.
Annual Report
Aggressive International
Investment Changes
Geographic Diversification (% of fund's net assets) |
As of October 31, 2004 |
| Switzerland | 15.1% | |
| United Kingdom | 14.5% | |
| Japan | 12.7% | |
| France | 11.9% | |
| United States of America | 9.0% | |
| Germany | 6.1% | |
| Netherlands | 5.4% | |
| Canada | 4.3% | |
| Hong Kong | 3.6% | |
| Other | 17.4% | |

Percentages are adjusted for the effect of futures contracts, if applicable. |
|
As of April 30, 2004 |
| Japan | 17.3% | |
| United Kingdom | 14.1% | |
| Switzerland | 13.3% | |
| United States of America | 11.3% | |
| India | 7.8% | |
| Canada | 5.1% | |
| France | 5.0% | |
| Korea (South) | 4.9% | |
| Germany | 4.0% | |
| Other | 17.2% | |

Percentages are adjusted for the effect of futures contracts, if applicable. |
Asset Allocation |
| % of fund's
net assets | % of fund's net assets
6 months ago |
Stocks | 91.9 | 89.1 |
Short-Term Investments and Net Other Assets | 8.1 | 10.9 |
Top Ten Stocks as of October 31, 2004 |
| % of fund's
net assets | % of fund's net assets
6 months ago |
Actelion Ltd. (Reg.) (Switzerland, Biotechnology) | 4.0 | 2.3 |
Vodafone Group PLC (United Kingdom, Wireless Telecommunication Services) | 3.7 | 3.0 |
Alcatel SA (RFD) (France, Communications Equipment) | 3.5 | 0.0 |
Roche Holding AG (participation certificate) (Switzerland, Pharmaceuticals) | 3.0 | 3.2 |
UBS AG (Reg.) (Switzerland, Capital Markets) | 2.7 | 2.1 |
ASML Holding NV (NY Shares) (Netherlands, Semiconductors & Semiconductor Equipment) | 2.6 | 0.0 |
Aracruz Celulose SA sponsored ADR (Brazil, Paper & Forest Products) | 2.4 | 2.2 |
EnCana Corp. (Canada, Oil & Gas) | 2.2 | 2.3 |
Total SA Series B (France, Oil & Gas) | 2.1 | 0.0 |
Deutsche Telekom AG (Reg.) (Germany, Diversified Telecommunication Services) | 2.1 | 0.0 |
| 28.3 | |
Market Sectors as of October 31, 2004 |
| % of fund's
net assets | % of fund's net assets
6 months ago |
Consumer Discretionary | 17.6 | 12.8 |
Financials | 16.8 | 23.7 |
Health Care | 13.7 | 15.6 |
Information Technology | 12.9 | 7.9 |
Energy | 9.3 | 4.4 |
Telecommunication Services | 6.8 | 10.0 |
Materials | 6.3 | 4.8 |
Industrials | 5.3 | 3.7 |
Consumer Staples | 3.2 | 5.4 |
Utilities | 0.0 | 0.8 |
Annual Report
Aggressive International
Investments October 31, 2004
Showing Percentage of Net Assets
Common Stocks - 91.9% |
| Shares | | Value (Note 1) |
Australia - 2.0% |
CSL Ltd. | 675,114 | | $14,558,158 |
Bahamas (Nassau) - 0.6% |
Kerzner International Ltd. (a) | 89,700 | | 4,549,584 |
Brazil - 3.4% |
Aracruz Celulose SA sponsored ADR | 516,700 | | 17,402,456 |
Votorantim Celulose e Papel SA sponsored ADR | 200,300 | | 6,920,365 |
TOTAL BRAZIL | | 24,322,821 |
Canada - 4.3% |
Canadian Natural Resources Ltd. | 357,000 | | 15,032,196 |
EnCana Corp. | 318,990 | | 15,820,500 |
TOTAL CANADA | | 30,852,696 |
China - 0.9% |
Global Bio-Chem Technology Group Co. Ltd. | 1,046,000 | | 819,739 |
Li Ning Co. Ltd. | 68,000 | | 26,864 |
People's Food Holdings Ltd. | 6,040,000 | | 4,213,236 |
Weichai Power Co. Ltd. (H Shares) | 778,000 | | 1,604,237 |
TOTAL CHINA | | 6,664,076 |
Denmark - 1.6% |
Novo Nordisk AS Series B | 230,600 | | 11,495,256 |
France - 11.9% |
Alcatel SA (RFD) (a) | 1,726,600 | | 25,225,626 |
Dassault Systemes SA | 163,793 | | 8,338,123 |
Louis Vuitton Moet Hennessy (LVMH) | 77,700 | | 5,339,535 |
NRJ Group | 110,300 | | 2,292,291 |
Pernod-Ricard | 107,700 | | 14,953,870 |
Societe Generale Series A | 120,899 | | 11,247,741 |
Technip-Coflexip SA | 20,940 | | 3,293,341 |
Total SA Series B | 72,993 | | 15,223,420 |
TOTAL FRANCE | | 85,913,947 |
Germany - 6.1% |
Adidas-Salomon AG | 52,621 | | 7,375,651 |
Deutsche Telekom AG (Reg.) (a) | 787,467 | | 15,174,489 |
HeidelbergCement AG | 217,467 | | 10,736,525 |
Siemens AG (Reg.) | 139,800 | | 10,448,652 |
TOTAL GERMANY | | 43,735,317 |
Hong Kong - 3.6% |
China Merchants Holdings International Co. Ltd. | 1,410,000 | | 2,083,200 |
China Resources Power Holdings Co. Ltd. | 280,000 | | 160,078 |
Johnson Electric Holdings Ltd. | 3,579,000 | | 3,563,504 |
Li & Fung Ltd. | 2,506,000 | | 3,702,481 |
Solomon Systech Ltd. | 18,234,000 | | 4,614,898 |
Techtronic Industries Co. Ltd. | 5,941,000 | | 11,830,556 |
TOTAL HONG KONG | | 25,954,717 |
|
| Shares | | Value (Note 1) |
India - 3.5% |
Bank of Baroda | 1,469,872 | | $4,994,679 |
National Thermal Power Corp. | 61,900 | | 84,654 |
State Bank of India | 1,296,598 | | 13,819,415 |
Zee Telefilms Ltd. | 1,943,534 | | 6,415,570 |
TOTAL INDIA | | 25,314,318 |
Italy - 2.3% |
Banca Intesa Spa | 1,788,700 | | 7,347,688 |
ENI Spa | 392,000 | | 8,971,312 |
TOTAL ITALY | | 16,319,000 |
Japan - 12.7% |
Aisin Seiki Co. Ltd. | 139,400 | | 3,128,218 |
Fast Retailing Co. Ltd. | 72,000 | | 4,585,251 |
Fuji Photo Film Co. Ltd. | 247,700 | | 8,472,377 |
Honda Motor Co. Ltd. | 133,000 | | 6,461,140 |
Hoya Corp. | 51,100 | | 5,253,158 |
JAFCO Co. Ltd. | 108,700 | | 5,597,534 |
Nintendo Co. Ltd. | 45,900 | | 5,186,980 |
SFCG Co. Ltd. | 25,420 | | 5,351,326 |
SKY Perfect Communications, Inc. | 2,509 | | 3,058,166 |
Softbank Corp. (d) | 266,500 | | 12,086,739 |
Sumitomo Mitsui Financial Group, Inc. (d) | 1,563 | | 10,175,339 |
Toyota Motor Corp. | 269,200 | | 10,443,614 |
Tv Asahi Corp. | 3,576 | | 7,433,458 |
UFJ Holdings, Inc. (a) | 863 | | 4,011,867 |
TOTAL JAPAN | | 91,245,167 |
Korea (South) - 0.1% |
Korea Exchange Bank (a) | 114,320 | | 760,772 |
Netherlands - 5.4% |
ASML Holding NV (a) | 508,700 | | 7,248,975 |
ASML Holding NV (NY Shares) (a) | 1,310,000 | | 18,667,500 |
ING Groep NV (Certificaten Van Aandelen) | 305,300 | | 8,130,139 |
QIAGEN NV (a) | 476,240 | | 5,067,194 |
TOTAL NETHERLANDS | | 39,113,808 |
Spain - 1.3% |
Antena 3 Television SA (a) | 33,800 | | 2,177,832 |
Telefonica SA | 455,900 | | 7,572,499 |
TOTAL SPAIN | | 9,750,331 |
Sweden - 0.7% |
Hennes & Mauritz AB (H&M) (B Shares) | 178,600 | | 5,213,069 |
Switzerland - 15.1% |
ABB Ltd. (Reg.) (a) | 1,202,460 | | 6,970,199 |
Actelion Ltd. (Reg.) (a) | 253,410 | | 29,081,227 |
Barry Callebaut AG | 19,160 | | 3,691,406 |
Julius Baer Holding AG (Bearer) | 24,461 | | 6,864,161 |
Novartis AG (Reg.) | 222,762 | | 10,694,804 |
Common Stocks - continued |
| Shares | | Value (Note 1) |
Switzerland - continued |
Roche Holding AG (participation certificate) | 214,582 | | $22,001,036 |
The Swatch Group AG (Reg.) | 354,137 | | 9,789,346 |
UBS AG (Reg.) | 268,754 | | 19,481,977 |
TOTAL SWITZERLAND | | 108,574,156 |
Taiwan - 1.0% |
Hon Hai Precision Industries Co. Ltd. | 2,040,000 | | 7,502,467 |
United Kingdom - 14.5% |
BHP Billiton PLC | 521,800 | | 5,307,433 |
BP PLC | 801,500 | | 7,781,229 |
BPB PLC | 543,900 | | 4,200,390 |
Capita Group PLC | 699,900 | | 4,524,107 |
Collins Stewart Tullett PLC | 829,516 | | 5,964,059 |
Enterprise Inns PLC | 317,300 | | 3,609,304 |
FKI PLC | 1,411,973 | | 3,100,681 |
HSBC Holdings PLC (United Kingdom) (Reg.) | 643,200 | | 10,423,699 |
Invensys PLC (a) | 4,199,355 | | 1,176,834 |
Man Group PLC | 240,800 | | 5,783,555 |
Rank Group PLC | 1,350,226 | | 7,096,354 |
Rio Tinto PLC (Reg.) | 201,200 | | 5,346,890 |
Shire Pharmaceuticals Group PLC | 637,057 | | 6,030,806 |
Taylor Nelson Sofres PLC | 1,873,934 | | 7,954,796 |
Vodafone Group PLC | 10,183,087 | | 26,262,180 |
TOTAL UNITED KINGDOM | | 104,562,317 |
United States of America - 0.9% |
NTL, Inc. (a) | 97,505 | | 6,485,058 |
TOTAL COMMON STOCKS (Cost $597,934,739) | 662,887,035 |
Money Market Funds - 13.6% |
| | | |
Fidelity Cash Central Fund, 1.79% (b) | 84,589,460 | | 84,589,460 |
Fidelity Securities Lending Cash Central Fund, 1.77% (b)(c) | 13,501,448 | | 13,501,448 |
TOTAL MONEY MARKET FUNDS (Cost $98,090,908) | 98,090,908 |
TOTAL INVESTMENT PORTFOLIO - 105.5% (Cost $696,025,647) | | 760,977,943 |
NET OTHER ASSETS - (5.5)% | | (39,834,304) |
NET ASSETS - 100% | $721,143,639 |
Legend |
(a)Non-income producing |
(b)Affiliated fund that is available only to investment companies and other accounts managed by Fidelity Investments. The rate quoted is the annualized seven-day yield of the fund at period end. A complete listing of the fund's holdings as of its most recent fiscal year end is available upon request. |
(c)Includes investment made with cash collateral received from securities on loan. |
(d)Security or a portion of the security is on loan at period end. |
Income Tax Information |
At October 31, 2004, the fund had a capital loss carryforward of approximately $46,350,000 of which $25,877,000 and $20,473,000 will expire on October 31, 2009 and 2010, respectively. |
See accompanying notes which are an integral part of the financial statements.
Annual Report
Aggressive International
Financial Statements
Statement of Assets and Liabilities
| October 31, 2004 |
| | |
Assets | | |
Investment in securities, at value (including securities loaned of $12,855,198) (cost $696,025,647) - See accompanying schedule | | $760,977,943 |
Foreign currency held at value (cost $959,793) | | 970,708 |
Receivable for investments sold | | 26,072 |
Receivable for fund shares sold | | 992,117 |
Dividends receivable | | 1,025,980 |
Interest receivable | | 95,957 |
Other affiliated receivables | | 763 |
Other receivables | | 197,977 |
Total assets | | 764,287,517 |
| | |
Liabilities | | |
Payable for investments purchased | $27,834,173 | |
Payable for fund shares redeemed | 1,029,779 | |
Accrued management fee | 448,623 | |
Other affiliated payables | 195,511 | |
Other payables and accrued expenses | 134,344 | |
Collateral on securities loaned, at value | 13,501,448 | |
Total liabilities | | 43,143,878 |
| | |
Net Assets | | $721,143,639 |
Net Assets consist of: | | |
Paid in capital | | $700,804,593 |
Undistributed net investment income | | 1,698,988 |
Accumulated undistributed net realized gain (loss) on investments and foreign currency transactions | | (46,352,240) |
Net unrealized appreciation (depreciation) on investments and assets and liabilities in foreign currencies | | 64,992,298 |
Net Assets, for 47,421,683 shares outstanding | | $721,143,639 |
Net Asset Value, offering price and redemption price per share ($721,143,639 ÷ 47,421,683 shares) | | $15.21 |
Statement of Operations
| Year ended October 31, 2004 |
| | |
Investment Income | | |
Dividends | | $9,702,787 |
Interest | | 534,485 |
Security lending | | 165,704 |
| | 10,402,976 |
Less foreign taxes withheld | | (904,838) |
Total income | | 9,498,138 |
| | |
Expenses | | |
Management fee
Basic fee | $4,797,867 | |
Performance adjustment | 640,242 | |
Transfer agent fees | 1,899,040 | |
Accounting and security lending fees | 327,886 | |
Non-interested trustees' compensation | 3,793 | |
Custodian fees and expenses | 373,114 | |
Registration fees | 69,055 | |
Audit | 56,017 | |
Legal | 1,484 | |
Miscellaneous | 50,115 | |
Total expenses before reductions | 8,218,613 | |
Expense reductions | (526,588) | 7,692,025 |
Net investment income (loss) | | 1,806,113 |
Realized and Unrealized Gain (Loss) Net realized gain (loss) on: | | |
Investment securities | 39,118,646 | |
Foreign currency transactions | (922,530) | |
Total net realized gain (loss) | | 38,196,116 |
Change in net unrealized appreciation (depreciation) on: Investment securities (net of decrease in deferred foreign taxes of $112,082) | (10,972,243) | |
Assets and liabilities in foreign currencies | 81,326 | |
Total change in net unrealized appreciation (depreciation) | | (10,890,917) |
Net gain (loss) | | 27,305,199 |
Net increase (decrease) in net assets resulting from operations | | $29,111,312 |
See accompanying notes which are an integral part of the financial statements.
Annual Report
Aggressive International
Financial Statements - continued
Statement of Changes in Net Assets
| Year ended
October 31,
2004 | Year ended
October 31,
2003 |
Increase (Decrease) in Net Assets | | |
Operations | | |
Net investment income (loss) | $1,806,113 | $1,907,618 |
Net realized gain (loss) | 38,196,116 | 37,939,727 |
Change in net unrealized appreciation (depreciation) | (10,890,917) | 78,049,577 |
Net increase (decrease) in net assets resulting from operations | 29,111,312 | 117,896,922 |
Distributions to shareholders from net investment income | (3,891,060) | (285,614) |
Share transactions
Proceeds from sales of shares | 403,776,314 | 284,514,275 |
Reinvestment of distributions | 3,653,262 | 266,849 |
Cost of shares redeemed | (266,445,863) | (146,077,268) |
Net increase (decrease) in net assets resulting from share transactions | 140,983,713 | 138,703,856 |
Redemption fees | 86,557 | 60,094 |
Total increase (decrease) in net assets | 166,290,522 | 256,375,258 |
| | |
Net Assets | | |
Beginning of period | 554,853,117 | 298,477,859 |
End of period (including undistributed net investment income of $1,698,988 and undistributed net investment income of $3,405,781, respectively) | $721,143,639 | $554,853,117 |
Other Information Shares | | |
Sold | 26,581,892 | 23,076,146 |
Issued in reinvestment of distributions | 252,472 | 24,685 |
Redeemed | (18,045,512) | (12,147,104) |
Net increase (decrease) | 8,788,852 | 10,953,727 |
Financial Highlights
Years ended October 31, | 2004 | 2003 | 2002 | 2001 | 2000 |
Selected Per-Share Data | | | | | |
Net asset value, beginning of period | $14.36 | $10.78 | $10.78 | $15.08 | $16.68 |
Income from Investment Operations | | | | | |
Net investment income (loss) B | .04 | .06 | .02 | .04 | .02 |
Net realized and unrealized gain (loss) | .91 | 3.53 | .04 | (3.63) | (.65) |
Total from investment operations | .95 | 3.59 | .06 | (3.59) | (.63) |
Distributions from net investment income | (.10) | (.01) | (.06) | (.02) | (.08) |
Distributions from net realized gain | - | - | - | (.70) | (.90) |
Total distributions | (.10) | (.01) | (.06) | (.72) | (.98) |
Redemption fees added to paid in capital B | - D | - D | - D | .01 | .01 |
Net asset value, end of period | $15.21 | $14.36 | $10.78 | $10.78 | $15.08 |
Total Return A | 6.65% | 33.33% | .50% | (24.71)% | (4.66)% |
Ratios to Average Net Assets C | | | | | |
Expenses before expense reductions | 1.24% | 1.23% | 1.54% | 1.16% | 1.21% |
Expenses net of voluntary waivers, if any | 1.24% | 1.23% | 1.54% | 1.16% | 1.21% |
Expenses net of all reductions | 1.16% | 1.16% | 1.40% | 1.02% | 1.16% |
Net investment income (loss) | .27% | .50% | .13% | .35% | .12% |
Supplemental Data | | | | | |
Net assets, end of period (000 omitted) | $721,144 | $554,853 | $298,478 | $203,107 | $459,222 |
Portfolio turnover rate | 161% | 212% | 188% | 242% | 344% |
A Total returns would have been lower had certain expenses not been reduced during the periods shown. B Calculated based on average shares outstanding during the period. C Expense ratios reflect operating expenses of the fund. Expenses before reductions do not reflect amounts reimbursed by the investment adviser or reductions from brokerage service arrangements or other expense offset arrangements and do not represent the amount paid by the fund during periods when reimbursements or reductions occur. Expenses net of any voluntary waivers reflect expenses after reimbursement by the investment adviser but prior to reductions from brokerage service arrangements or other expense offset arrangements. Expenses net of all reductions represent the net expenses paid by the fund. D Amount represents less than $.01 per share. |
See accompanying notes which are an integral part of the financial statements.
Annual Report
Overseas
Performance: The Bottom Line
Average annual total return reflects the change in the value of an investment, assuming reinvestment of the fund's dividend income and capital gains (the profits earned upon the sale of securities that have grown in value) and assuming a constant rate of performance each year. The $10,000 table and the fund's returns do not reflect the deduction of taxes that a shareholder would pay on fund distributions or the redemption of fund shares. During periods of reimbursement by Fidelity a fund's total returns will be greater than it would be had the reimbursement not occurred. How a fund did yesterday is no guarantee of how it will do tomorrow.
Average Annual Total Returns
Periods ended
October 31, 2004 | Past 1
year | Past 5
years | Past 10
years |
Fidelity Overseas | 11.45% | -1.41% | 5.01% |
$10,000 Over 10 Years
Let's say hypothetically that $10,000 was invested in Fidelity Overseas Fund on October 31, 1994. The chart shows how the value of your investment would have grown, and also shows how the Morgan Stanley Capital International EAFE Index did over the same period.
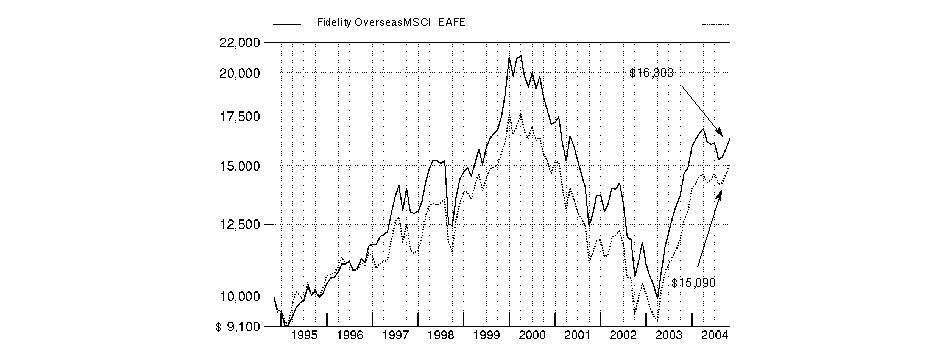
Annual Report
Overseas
Management's Discussion of Fund Performance
Comments from Rick Mace, Portfolio Manager of Fidelity® Overseas Fund
Most of the world's major stock markets posted solid gains for the year ending October 31, 2004. The Morgan Stanley Capital InternationalSM Europe, Australasia, Far East (MSCI® EAFE®) Index - designed to represent the performance of developed stock markets outside the United States and Canada - gained 19.00%, compared to 9.42% for the Standard & Poor's 500SM Index. A weak U.S. dollar relative to most foreign currencies was partly responsible for the performance disparity. On a regional basis, Europe was one of the top performers. Many investors felt European stocks offered better valuations and brighter earnings prospects than U.S. equities. Latin American countries, many of which are exporters of oil and materials that received strong support from high commodity prices, also did well. Conversely, Japan significantly underperformed, as early optimism was eroded by disappointing economic indicators and concerns about the impact of China's economic slowdown on exports. Meanwhile, technology-focused Asian emerging markets suffered due to a deceleration in corporate capital spending.
For the 12 months ending October 31, 2004, Fidelity Overseas Fund returned 11.45%, trailing the LipperSM International Funds Average, which rose 16.12%, as well as the MSCI EAFE index, which advanced 19.00%. The fund's overweighting in two poor-performing market groups - semiconductors and diversified financials - caused the bulk of its performance shortfall relative to the index. Notable detractors included Japanese semiconductor equipment manufacturer Tokyo Electron and Taiwanese chip maker United Microelectronics, as well as Japanese brokerage stocks Nikko Cordial and Nomura Holdings. On the positive side of the ledger, overweighting strong-performing energy stocks relative to the index was helpful. Growing worldwide demand for oil, coupled with supply shortages and geopolitical concerns, sent oil prices and energy company profits soaring. France-based energy producer Total SA and Canada's Talisman Energy were noteworthy standouts for the fund. Elsewhere, good security selection in the telecommunication services sector helped offset some of the fund's weakness in other areas. Holdings in U.K.-based mobile communications provider mmO2 and Germany-based Deutsche Telekom performed quite well.
The views expressed in this statement reflect those of the portfolio manager only through the end of the period of the report as stated on the cover and do not necessarily represent the views of Fidelity or any other person in the Fidelity organization. Any such views are subject to change at any time based upon market or other conditions and Fidelity disclaims any responsibility to update such views. These views may not be relied on as investment advice and, because investment decisions for a Fidelity fund are based on numerous factors, may not be relied on as an indication of trading intent on behalf of any Fidelity fund.
Annual Report
Overseas
Investment Changes
Geographic Diversification (% of fund's net assets) |
As of October 31, 2004 |
| Japan | 17.4% | |
| United Kingdom | 16.4% | |
| Germany | 11.8% | |
| France | 9.4% | |
| United States of America | 7.9% | |
| Switzerland | 6.5% | |
| Netherlands | 5.5% | |
| Korea (South) | 3.4% | |
| Canada | 3.4% | |
| Other | 18.3% | |

Percentages are adjusted for the effect of futures contracts, if applicable. |
|
As of April 30, 2004 |
| Japan | 21.0% | |
| United Kingdom | 14.9% | |
| United States of America | 13.1% | |
| France | 8.2% | |
| Germany | 6.4% | |
| Switzerland | 6.1% | |
| Korea (South) | 5.4% | |
| Netherlands | 5.3% | |
| Canada | 4.1% | |
| Other | 15.5% | |

Percentages are adjusted for the effect of futures contracts, if applicable. |
Asset Allocation |
| % of fund's
net assets | % of fund's net assets
6 months ago |
Stocks | 93.2 | 90.4 |
Bonds | 0.6 | 0.5 |
Short-Term Investments and Net Other Assets | 6.2 | 9.1 |
Top Ten Stocks as of October 31, 2004 |
| % of fund'
net assets | % of fund's net assets
6 months ago |
Deutsche Telekom AG (Germany, Diversified Telecommunication Services) | 4.3 | 0.6 |
Vodafone Group PLC (United Kingdom, Wireless Telecommunication Services) | 4.1 | 2.4 |
Total SA Series B (France, Oil & Gas) | 2.3 | 2.6 |
ASML Holding NV (Netherlands, Semiconductors & Semiconductor Equipment) | 2.1 | 1.4 |
HSBC Holdings PLC (United Kingdom) (Reg.) (United Kingdom, Commercial Banks) | 2.0 | 0.4 |
Allianz AG (Reg.) (Germany, Insurance) | 1.7 | 1.7 |
Sumitomo Mitsui Financial Group, Inc. (Japan, Commercial Banks) | 1.7 | 1.9 |
Novartis AG (Reg.) (Switzerland, Pharmaceuticals) | 1.6 | 1.6 |
UBS AG (Reg.) (Switzerland, Capital Markets) | 1.5 | 1.4 |
BP PLC (United Kingdom, Oil & Gas) | 1.4 | 1.2 |
| 22.7 | |
Market Sectors as of October 31, 2004 |
| % of fund's
net assets | % of fund's net assets
6 months ago |
Financials | 24.2 | 25.3 |
Information Technology | 16.7 | 14.4 |
Telecommunication Services | 12.9 | 6.3 |
Consumer Discretionary | 10.1 | 12.1 |
Health Care | 8.5 | 8.5 |
Energy | 7.4 | 12.0 |
Materials | 5.6 | 3.9 |
Consumer Staples | 4.2 | 6.1 |
Industrials | 2.9 | 1.7 |
Utilities | 0.7 | 0.6 |
Annual Report
Overseas
Investments October 31, 2004
Showing Percentage of Net Assets
Common Stocks - 93.0% |
| Shares | | Value (Note 1) |
Australia - 1.8% |
CSL Ltd. | 1,409,544 | | $30,395,407 |
News Corp. Ltd. sponsored ADR | 1,423,100 | | 44,742,264 |
TOTAL AUSTRALIA | | 75,137,671 |
Belgium - 0.4% |
Fortis | 620,700 | | 15,814,708 |
Bermuda - 0.1% |
Golar LNG Ltd. (a) | 140,700 | | 2,234,756 |
Brazil - 3.1% |
Aracruz Celulose SA sponsored ADR | 572,300 | | 19,275,064 |
Banco Bradesco SA sponsored ADR | 319,500 | | 19,447,965 |
Banco Itau Holding Financeira SA sponsored ADR | 261,800 | | 15,838,900 |
Embraer - Empresa Brasileira de Aeronautica SA sponsored ADR | 595,100 | | 15,793,954 |
Tele Norte Leste Participacoes SA ADR | 930,400 | | 12,169,632 |
Telebras sponsored ADR | 432,400 | | 11,398,064 |
Uniao de Bancos Brasileiros SA (Unibanco) GDR | 695,800 | | 18,403,910 |
Votorantim Celulose e Papel SA sponsored ADR | 498,600 | | 17,226,630 |
TOTAL BRAZIL | | 129,554,119 |
Canada - 3.4% |
Alcan, Inc. | 122,900 | | 5,686,591 |
Canadian Natural Resources Ltd. | 263,300 | | 11,086,771 |
Celestica, Inc. (sub. vtg.) (a) | 611,400 | | 8,880,951 |
EnCana Corp. | 756,600 | | 37,524,030 |
Nortel Networks Corp. (a) | 2,795,600 | | 9,477,084 |
Research in Motion Ltd. (a) | 170,100 | | 14,993,829 |
Talisman Energy, Inc. | 1,807,200 | | 48,524,400 |
Tembec, Inc. (a) | 596,900 | | 3,891,601 |
TOTAL CANADA | | 140,065,257 |
China - 0.7% |
BYD Co. Ltd. (H Shares) | 1,422,500 | | 4,002,306 |
China Telecom Corp. Ltd. sponsored ADR | 399,240 | | 12,791,650 |
Global Bio-Chem Technology Group Co. Ltd. | 13,324,000 | | 10,441,872 |
Global Bio-Chem Technology Group Co. Ltd. warrants 5/31/07 (a) | 1,054,250 | | 73,139 |
People's Food Holdings Ltd. | 3,432,000 | | 2,394,011 |
TOTAL CHINA | | 29,702,978 |
Denmark - 0.6% |
Coloplast AS Series B | 56,100 | | 5,583,435 |
Danske Bank AS | 337,550 | | 9,459,537 |
Novo Nordisk AS Series B | 226,500 | | 11,290,874 |
TOTAL DENMARK | | 26,333,846 |
Finland - 0.5% |
Nokia Corp. | 1,353,310 | | 20,868,040 |
France - 9.4% |
Accor SA | 399,306 | | 16,627,676 |
|
| Shares | | Value (Note 1) |
Alcatel SA sponsored ADR (a) | 3,251,300 | | $47,501,493 |
AXA SA | 1,370,760 | | 29,676,954 |
BNP Paribas SA | 726,498 | | 49,599,468 |
Credit Agricole SA | 244,400 | | 7,184,067 |
Dassault Systemes SA | 227,047 | | 11,558,160 |
France Telecom SA | 1,368,983 | | 39,358,261 |
L'Oreal SA | 159,616 | | 10,917,729 |
Lagardere S.C.A. (Reg.) | 81,700 | | 5,279,850 |
Pernod-Ricard | 186,600 | | 25,908,934 |
Sanofi-Aventis sponsored ADR | 999,600 | | 36,485,400 |
Television Francaise 1 SA | 201,200 | | 6,073,850 |
Total SA Series B | 450,469 | | 93,949,815 |
Vivendi Universal SA sponsored ADR (a) | 474,400 | | 13,012,792 |
TOTAL FRANCE | | 393,134,449 |
Germany - 11.6% |
Adidas-Salomon AG | 113,299 | | 15,880,616 |
Allianz AG (Reg.) | 676,800 | | 72,079,200 |
BASF AG | 576,278 | | 36,207,547 |
Bayerische Hypo-und Vereinsbank AG (a) | 683,400 | | 13,406,805 |
Bayerische Motoren Werke AG (BMW) | 549,914 | | 23,328,482 |
Deutsche Boerse AG | 472,446 | | 23,669,665 |
Deutsche Telekom AG: | | | |
(Reg.) (a) | 1,275,500 | | 24,578,885 |
sponsored ADR (a) | 8,021,600 | | 154,576,232 |
E.ON AG | 144,591 | | 11,791,396 |
Fresenius Medical Care AG | 175,700 | | 13,490,597 |
Infineon Technologies AG sponsored ADR (a) | 1,755,800 | | 19,190,894 |
RWE AG | 326,999 | | 17,374,485 |
SAP AG sponsored ADR | 501,500 | | 21,388,975 |
Siemens AG sponsored ADR | 509,900 | | 38,109,926 |
TOTAL GERMANY | | 485,073,705 |
Hong Kong - 1.3% |
Hong Kong Exchanges & Clearing Ltd. | 4,078,000 | | 9,273,302 |
Hutchison Whampoa Ltd. | 1,834,300 | | 14,080,633 |
Techtronic Industries Co. Ltd. | 12,624,000 | | 25,138,687 |
Television Broadcasts Ltd. | 1,288,000 | | 5,510,284 |
TOTAL HONG KONG | | 54,002,906 |
India - 3.1% |
Cipla Ltd. | 2,284,618 | | 14,075,082 |
Dr. Reddy's Laboratories Ltd. | 322,800 | | 5,349,145 |
HDFC Bank Ltd. | 345,657 | | 3,164,933 |
Housing Development Finance Corp. Ltd. | 2,136,540 | | 30,180,660 |
I-Flex Solutions Ltd. | 1,031,226 | | 13,555,953 |
Infosys Technologies Ltd. | 678,960 | | 28,550,467 |
National Thermal Power Corp. | 360,900 | | 493,566 |
Reliance Industries Ltd. | 745,900 | | 8,706,143 |
Satyam Computer Services Ltd. | 2,437,918 | | 20,117,462 |
State Bank of India | 363,400 | | 3,801,452 |
TOTAL INDIA | | 127,994,863 |
Common Stocks - continued |
| Shares | | Value (Note 1) |
Italy - 0.9% |
ENI Spa | 1,729,942 | | $39,591,453 |
Japan - 16.8% |
Advantest Corp. | 307,500 | | 21,529,503 |
Aeon Co. Ltd. | 1,824,800 | | 29,242,318 |
Canon, Inc. | 427,300 | | 21,151,350 |
Daiwa Securities Group, Inc. | 5,525,000 | | 33,932,536 |
FamilyMart Co. Ltd. | 533,800 | | 14,349,327 |
Honda Motor Co. Ltd. | 512,100 | | 24,877,818 |
Ito Yokado Ltd. | 639,900 | | 22,975,575 |
JAFCO Co. Ltd. | 478,000 | | 24,614,730 |
KDDI Corp. | 5,583 | | 26,903,482 |
Kyocera Corp. | 265,600 | | 19,298,568 |
Mizuho Financial Group, Inc. | 10,744 | | 41,520,253 |
Murata Manufacturing Co. Ltd. | 451,100 | | 21,524,590 |
Nikko Cordial Corp. | 8,485,000 | | 38,001,511 |
Nitto Denko Corp. | 235,600 | | 11,197,316 |
Nomura Holdings, Inc. | 4,177,000 | | 50,834,089 |
ORIX Corp. | 178,800 | | 20,999,518 |
Ricoh Co. Ltd. | 1,192,000 | | 22,300,373 |
Rohm Co. Ltd. | 213,200 | | 21,917,286 |
Softbank Corp. (d) | 711,100 | | 32,250,956 |
Sumitomo Electric Industries Ltd. | 1,643,000 | | 15,601,786 |
Sumitomo Mitsui Financial Group, Inc. (d) | 10,948 | | 71,272,943 |
TDK Corp. | 267,000 | | 18,567,770 |
Tokyo Electron Ltd. | 743,500 | | 40,394,245 |
Toyota Motor Corp. | 1,218,700 | | 47,279,466 |
Yahoo! Japan Corp. (a)(d) | 1,302 | | 5,892,739 |
Yahoo! Japan Corp. New (a) | 1,302 | | 5,671,300 |
TOTAL JAPAN | | 704,101,348 |
Korea (South) - 3.4% |
Honam Petrochemical Corp. | 649,150 | | 25,397,742 |
Hyundai Motor Co. | 129,716 | | 6,291,719 |
Kookmin Bank (a) | 634,920 | | 21,211,264 |
LG Electronics, Inc. | 426,260 | | 24,063,988 |
LG Petrochemical Co. Ltd. | 350,610 | | 8,518,618 |
Samsung Electro-Mechanics Co. Ltd. (a) | 368,790 | | 7,906,173 |
Samsung Electronics Co. Ltd. | 84,970 | | 33,358,033 |
Shinhan Financial Group Co. Ltd. | 813,510 | | 16,023,133 |
TOTAL KOREA (SOUTH) | | 142,770,670 |
Netherlands - 5.5% |
Aegon NV | 1,198,700 | | 13,161,517 |
ASML Holding NV (a) | 6,149,705 | | 87,633,296 |
Buhrmann NV | 637,500 | | 4,756,165 |
EADS NV | 381,500 | | 10,911,394 |
ING Groep NV (Certificaten Van Aandelen) | 1,817,164 | | 48,391,077 |
Unilever NV (NY Shares) | 301,500 | | 17,574,435 |
|
| Shares | | Value (Note 1) |
VNU NV | 1,056,239 | | $28,939,234 |
Wolters Kluwer NV (Certificaten Van Aandelen) | 1,025,044 | | 18,744,890 |
TOTAL NETHERLANDS | | 230,112,008 |
Portugal - 0.2% |
Portugal Telecom SGPS SA (Reg.) | 891,173 | | 10,070,033 |
South Africa - 0.3% |
Harmony Gold Mining Co. Ltd. sponsored ADR (d) | 383,400 | | 4,524,120 |
MTN Group Ltd. | 1,819,120 | | 9,936,715 |
TOTAL SOUTH AFRICA | | 14,460,835 |
Spain - 2.4% |
Banco Bilbao Vizcaya Argentaria SA | 1,651,200 | | 26,006,400 |
Banco Santander Central Hispano SA | 2,332,016 | | 26,071,939 |
Telefonica SA | 2,790,310 | | 46,347,049 |
TOTAL SPAIN | | 98,425,388 |
Sweden - 0.7% |
Telefonaktiebolaget LM Ericsson ADR (a) | 1,022,800 | | 29,569,148 |
Switzerland - 6.5% |
ABB Ltd. (Reg.) (a) | 1,330,636 | | 7,713,186 |
Actelion Ltd. (Reg.) (a) | 47,246 | | 5,421,932 |
Compagnie Financiere Richemont unit | 602,090 | | 17,122,596 |
Credit Suisse Group (Reg.) | 1,213,244 | | 41,577,872 |
Nestle SA (Reg.) | 62,951 | | 14,936,229 |
Novartis AG (Reg.) | 1,367,413 | | 65,649,498 |
Phonak Holding AG | 167,784 | | 5,270,481 |
Roche Holding AG (participation certificate) | 447,603 | | 45,892,618 |
Societe Generale de Surveillance Holding SA (SGS) (Reg.) | 8,699 | | 5,559,840 |
UBS AG (Reg.) | 869,407 | | 63,023,313 |
TOTAL SWITZERLAND | | 272,167,565 |
Taiwan - 2.2% |
Hon Hai Precision Industries Co. Ltd. | 4,243,495 | | 15,606,216 |
Quanta Computer, Inc. | 5,923,611 | | 9,564,210 |
Taiwan Semiconductor Manufacturing Co. Ltd. | 3,727,000 | | 4,880,927 |
Taiwan Semiconductor Manufacturing Co. Ltd. sponsored ADR | 1,299,300 | | 9,835,701 |
United Microelectronics Corp. (a) | 63,939,560 | | 38,618,004 |
United Microelectronics Corp. sponsored ADR (a) | 2,554,849 | | 8,941,972 |
Yageo Corp. (a) | 18,985,000 | | 6,300,897 |
TOTAL TAIWAN | | 93,747,927 |
United Kingdom - 16.4% |
3i Group PLC | 1,323,230 | | 14,164,266 |
AstraZeneca PLC (United Kingdom) | 959,000 | | 39,510,800 |
BHP Billiton PLC | 1,984,475 | | 20,184,875 |
BP PLC | 5,901,660 | | 57,295,282 |
Common Stocks - continued |
| Shares | | Value (Note 1) |
United Kingdom - continued |
British Sky Broadcasting Group PLC (BSkyB) | 635,700 | | $5,940,267 |
Carphone Warehouse Group PLC | 1,851,033 | | 5,663,582 |
Dixons Group PLC | 5,139,350 | | 16,220,631 |
Enterprise Inns PLC | 1,548,300 | | 17,611,995 |
Hilton Group PLC | 1,956,400 | | 9,266,572 |
HSBC Holdings PLC (United Kingdom) (Reg.) | 5,122,037 | | 83,007,731 |
ITV PLC | 8,564,797 | | 16,840,836 |
Kesa Electricals PLC | 2,765,836 | | 13,824,777 |
Man Group PLC | 1,178,702 | | 28,310,165 |
mmO2 PLC (a) | 1,248,000 | | 2,413,790 |
Prudential PLC | 1,728,111 | | 12,718,531 |
Reckitt Benckiser PLC | 640,100 | | 17,573,620 |
Reuters Group PLC | 2,060,100 | | 14,035,641 |
Rio Tinto PLC (Reg.) | 1,534,638 | | 40,783,005 |
Royal Bank of Scotland Group PLC | 469,500 | | 13,847,566 |
Shire Pharmaceuticals Group PLC sponsored ADR | 475,700 | | 13,509,880 |
Smith & Nephew PLC | 3,464,800 | | 29,963,590 |
Tesco PLC | 3,085,735 | | 16,274,338 |
Vodafone Group PLC | 66,228,459 | | 170,803,190 |
Xstrata PLC | 751,600 | | 11,670,952 |
Yell Group PLC | 2,013,900 | | 13,545,087 |
TOTAL UNITED KINGDOM | | 684,980,969 |
United States of America - 1.7% |
ENSCO International, Inc. | 158,900 | | 4,854,395 |
Freeport-McMoRan Copper & Gold, Inc. Class B | 485,900 | | 17,599,298 |
Phelps Dodge Corp. | 157,500 | | 13,787,550 |
Synthes, Inc. | 150,210 | | 16,055,282 |
Telewest Global, Inc. (a) | 1,503,482 | | 18,492,829 |
TOTAL UNITED STATES OF AMERICA | | 70,789,354 |
TOTAL COMMON STOCKS (Cost $3,617,012,984) | 3,890,703,996 |
Nonconvertible Preferred Stocks - 0.2% |
| | | |
Germany - 0.2% |
Fresenius Medical Care AG
(Cost $5,189,460) | 125,306 | | 6,858,344 |
Government Obligations - 0.6% |
| Principal
Amount | | |
Japan - 0.6% |
Japan Government 0.1% 8/20/05
(Cost $24,462,517) | JPY | 2,696,200,000 | | 25,491,350 |
Money Market Funds - 6.9% |
| Shares | | Value (Note 1) |
Fidelity Cash Central Fund, 1.79% (b) | 252,122,391 | | $252,122,391 |
Fidelity Securities Lending Cash Central Fund, 1.77% (b)(c) | 35,511,130 | | 35,511,130 |
TOTAL MONEY MARKET FUNDS (Cost $287,633,521) | 287,633,521 |
TOTAL INVESTMENT PORTFOLIO - 100.7% (Cost $3,934,298,482) | | 4,210,687,211 |
NET OTHER ASSETS - (0.7)% | | (28,583,879) |
NET ASSETS - 100% | $4,182,103,332 |
Currency Abbreviations |
JPY | - | Japanese yen |
Legend |
(a)Non-income producing |
(b)Affiliated fund that is available only to investment companies and other accounts managed by Fidelity Investments. The rate quoted is the annualized seven-day yield of the fund at period end. A complete listing of the fund's holdings as of its most recent fiscal year end is available upon request. |
(c)Includes investment made with cash collateral received from securities on loan. |
(d)Security or a portion of the security is on loan at period end. |
Income Tax Information |
At October 31, 2004, the fund had a capital loss carryforward of approximately $385,219,000 of which $63,599,000 and $321,620,000 will expire on October 31, 2009 and 2010, respectively. |
See accompanying notes which are an integral part of the financial statements.
Annual Report
Overseas
Financial Statements
Statement of Assets and Liabilities
| October 31, 2004 |
| | |
Assets | | |
Investment in securities, at value (including securities loaned of $33,869,230) (cost $3,934,298,482) - See accompanying schedule | | $4,210,687,211 |
Foreign currency held at value (cost $3,576,134) | | 3,616,374 |
Receivable for investments sold | | 97,908,087 |
Receivable for fund shares sold | | 13,213,264 |
Dividends receivable | | 5,165,689 |
Interest receivable | | 223,221 |
Other affiliated receivables | | 20,933 |
Other receivables | | 546,113 |
Total assets | | 4,331,380,892 |
| | |
Liabilities | | |
Payable to custodian bank | $101,786 | |
Payable for investments purchased | 104,803,516 | |
Payable for fund shares redeemed | 3,152,113 | |
Accrued management fee | 2,086,104 | |
Other affiliated payables | 1,172,114 | |
Other payables and accrued expenses | 2,450,797 | |
Collateral on securities loaned, at value | 35,511,130 | |
Total liabilities | | 149,277,560 |
| | |
Net Assets | | $4,182,103,332 |
Net Assets consist of: | | |
Paid in capital | | $4,308,387,691 |
Undistributed net investment income | | 19,416,090 |
Accumulated undistributed net realized gain (loss) on investments and foreign currency transactions | | (420,624,412) |
Net unrealized appreciation (depreciation) on investments and assets and liabilities in foreign currencies | | 274,923,963 |
Net Assets, for 129,820,638 shares outstanding | | $4,182,103,332 |
Net Asset Value, offering price and redemption price per share ($4,182,103,332 ÷ 129,820,638 shares) | | $32.21 |
Statement of Operations
| Year ended October 31, 2004 |
| | |
Investment Income | | |
Dividends | | $64,414,717 |
Interest | | 3,929,269 |
Security lending | | 1,865,633 |
| | 70,209,619 |
Less foreign taxes withheld | | (7,299,263) |
Total income | | 62,910,356 |
| | |
Expenses | | |
Management fee
Basic fee | $29,232,735 | |
Performance adjustment | (2,179,478) | |
Transfer agent fees | 11,621,427 | |
Accounting and security lending fees | 1,483,823 | |
Non-interested trustees' compensation | 23,305 | |
Appreciation in deferred trustee compensation account | 9,653 | |
Custodian fees and expenses | 1,417,917 | |
Registration fees | 96,461 | |
Audit | 109,770 | |
Legal | 9,979 | |
Miscellaneous | 523,723 | |
Total expenses before reductions | 42,349,315 | |
Expense reductions | (1,775,605) | 40,573,710 |
Net investment income (loss) | | 22,336,646 |
Realized and Unrealized Gain (Loss) Net realized gain (loss) on: | | |
Investment securities (net of foreign taxes of $316,602) | 339,742,303 | |
Foreign currency transactions | 182,099 | |
Total net realized gain (loss) | | 339,924,402 |
Change in net unrealized appreciation (depreciation) on: Investment securities (net of decrease in deferred foreign taxes of $2,153,646) | 48,454,719 | |
Assets and liabilities in foreign currencies | (170,181) | |
Total change in net unrealized appreciation (depreciation) | | 48,284,538 |
Net gain (loss) | | 388,208,940 |
Net increase (decrease) in net assets resulting from operations | | $410,545,586 |
See accompanying notes which are an integral part of the financial statements.
Annual Report
Overseas
Financial Statements - continued
Statement of Changes in Net Assets
| Year ended
October 31,
2004 | Year ended
October 31,
2003 |
Increase (Decrease) in Net Assets | | |
Operations | | |
Net investment income (loss) | $22,336,646 | $22,240,917 |
Net realized gain (loss) | 339,924,402 | 255,285,774 |
Change in net unrealized appreciation (depreciation) | 48,284,538 | 574,788,463 |
Net increase (decrease) in net assets resulting from operations | 410,545,586 | 852,315,154 |
Distributions to shareholders from net investment income | (36,930,253) | (11,619,951) |
Share transactions
Proceeds from sales of shares | 1,084,706,957 | 809,756,739 |
Reinvestment of distributions | 36,240,273 | 11,360,177 |
Cost of shares redeemed | (813,113,012) | (1,023,806,660) |
Net increase (decrease) in net assets resulting from share transactions | 307,834,218 | (202,689,744) |
Redemption fees | 259,688 | 287,198 |
Total increase (decrease) in net assets | 681,709,239 | 638,292,657 |
| | |
Net Assets | | |
Beginning of period | 3,500,394,093 | 2,862,101,436 |
End of period (including undistributed net investment income of $19,416,090 and undistributed net investment income of $27,195,811, respectively) | $4,182,103,332 | $3,500,394,093 |
Other Information Shares | | |
Sold | 34,493,299 | 34,162,410 |
Issued in reinvestment of distributions | 1,212,455 | 499,568 |
Redeemed | (25,819,606) | (42,842,235) |
Net increase (decrease) | 9,886,148 | (8,180,257) |
Financial Highlights
Years ended October 31, | 2004 | 2003 | 2002 | 2001 | 2000 |
Selected Per-Share Data | | | | | |
Net asset value, beginning of period | $29.19 | $22.34 | $25.98 | $40.72 | $42.84 |
Income from Investment Operations | | | | | |
Net investment income (loss) B | .17F | .18 | .11 | .20 | .25 E |
Net realized and unrealized gain (loss) | 3.15 | 6.76 | (3.75) | (9.96) | .71 |
Total from investment operations | 3.32 | 6.94 | (3.64) | (9.76) | .96 |
Distributions from net investment income | (.30) | (.09) | - | (.86) | (.45) |
Distributions from net realized gain | - | - | - | (4.12) | (2.63) |
Total distributions | (.30) | (.09) | - | (4.98) | (3.08) |
Redemption fees added to paid in capital B | - D | - D | - D | - D | - D |
Net asset value, end of period | $32.21 | $29.19 | $22.34 | $25.98 | $40.72 |
Total Return A | 11.45% | 31.18% | (14.01)% | (27.21)% | 1.78% |
Ratios to Average Net Assets C | | | | | |
Expenses before expense reductions | 1.05% | 1.04% | 1.21% | 1.18% | 1.19% |
Expenses net of voluntary waivers, if any | 1.05% | 1.04% | 1.21% | 1.18% | 1.19% |
Expenses net of all reductions | 1.01% | 1.00% | 1.16% | 1.12% | 1.16% |
Net investment income (loss) | .55%F | .75% | .42% | .63% | .55% |
Supplemental Data | | | | | |
Net assets, end of period (000 omitted) | $4,182,103 | $3,500,394 | $2,862,101 | $3,392,740 | $4,858,872 |
Portfolio turnover rate | 79% | 104% | 72% | 95% | 132% |
A Total returns would have been lower had certain expenses not been reduced during the periods shown. B Calculated based on average shares outstanding during the period. C Expense ratios reflect operating expenses of the fund. Expenses before reductions do not reflect amounts reimbursed by the investment adviser or reductions from brokerage service arrangements or other expense offset arrangements and do not represent the amount paid by the fund during periods when reimbursements or reductions occur. Expenses net of any voluntary waivers reflect expenses after reimbursement by the investment adviser but prior to reductions from brokerage service arrangements or other expense offset arrangements. Expenses net of all reductions represent the net expenses paid by the fund. D Amount represents less than $.01 per share. E Investment income per share reflects a special dividend which amounted to $.08 per share. F Net investment income per share includes approximately $.01 per share received as a result of a reorganization of an issuer that was in bankruptcy. Excluding this non-recurring amount, the ratio of net investment income to average net assets would have been .52%. |
See accompanying notes which are an integral part of the financial statements.
Annual Report
Worldwide
Performance: The Bottom Line
Average annual total return reflects the change in the value of an investment, assuming reinvestment of the fund's dividend income and capital gains (the profits earned upon the sale of securities that have grown in value) and assuming a constant rate of performance each year. The $10,000 table and the fund's returns do not reflect the deduction of taxes that a shareholder would pay on fund distributions or the redemption of fund shares. During periods of reimbursement by Fidelity a fund's total returns will be greater than it would be had the reimbursement not occurred. How a fund did yesterday is no guarantee of how it will do tomorrow.
Average Annual Total Returns
Periods ended
October 31, 2004 | Past 1
year | Past 5
years | Past 10
years |
Fidelity Worldwide | 9.77% | 2.55% | 6.64% |
$10,000 Over 10 Years
Let's say hypothetically that $10,000 was invested in Fidelity Worldwide Fund on October 31, 1994. The chart shows how the value of your investment would have grown, and also shows how the Morgan Stanley Capital International World Index did over the same period.
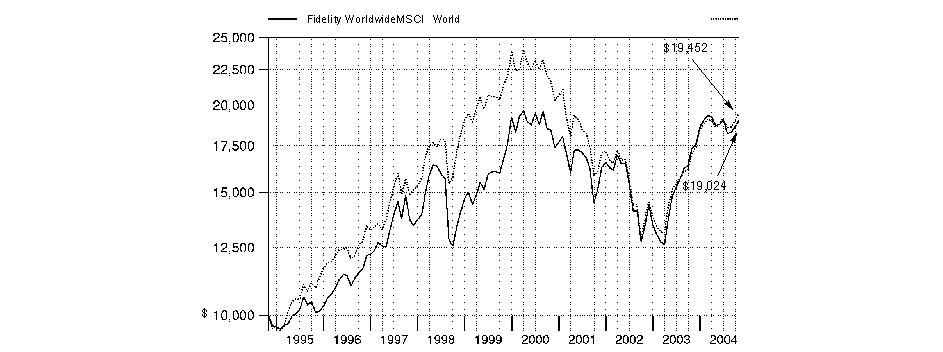
Annual Report
Worldwide
Management's Discussion of Fund Performance
Comments from Rick Mace, Portfolio Manager of Fidelity® Worldwide Fund
Most of the world's major stock markets posted solid gains for the year ending October 31, 2004. The Morgan Stanley Capital InternationalSM Europe, Australasia, Far East (MSCI® EAFE®) Index - designed to represent the performance of developed stock markets outside the United States and Canada - gained 19.00%, compared to 9.42% for the Standard & Poor's 500SM Index. A weak U.S. dollar relative to most foreign currencies was partly responsible for the performance disparity. On a regional basis, Europe was one of the top performers. Many investors felt European stocks offered better valuations and brighter earnings prospects than U.S. equities. Latin American countries, many of which are exporters of oil and materials that received strong support from high commodity prices, also did well. Conversely, Japan significantly underperformed, as early optimism was eroded by disappointing economic indicators and concerns about the impact of China's economic slowdown on exports. Meanwhile, technology-focused Asian emerging markets suffered due to a deceleration in corporate capital spending.
Fidelity Worldwide Fund was up 9.77% during the one-year period ending October 31, 2004, underperforming the Morgan Stanley Capital International World Index and the LipperSM Global Funds Average, which returned 13.65% and 11.90%, respectively. Overweighting poor-performing Asian technology and Japanese diversified financial stocks caused the bulk of the fund's underperformance relative to its index. Specifically, having a higher average weighting than the index in semiconductor stocks, such as Taiwan-based United Microelectronics and Japan-based Tokyo Electron, provided a significant head wind for the fund. Overweighting Japanese brokerage stocks that declined, including Nomura Holdings and Nikko Cordial, also held back the fund's performance relative to its index. On the positive side of the ledger, having a higher exposure to strong-performing Canadian energy stocks - namely EnCana and Talisman Energy - enhanced the fund's relative results. Elsewhere, good stock picking in the U.S. market, particularly in the industrial, materials and health care sectors, made the biggest contribution to the fund's relative performance. Top-performing domestic stocks included industrial conglomerate Tyco International, steel producer Nucor and analytical instrument manufacturer Waters Corp.
The views expressed in this statement reflect those of the portfolio manager only through the end of the period of the report as stated on the cover and do not necessarily represent the views of Fidelity or any other person in the Fidelity organization. Any such views are subject to change at any time based upon market or other conditions and Fidelity disclaims any responsibility to update such views. These views may not be relied on as investment advice and, because investment decisions for a Fidelity fund are based on numerous factors, may not be relied on as an indication of trading intent on behalf of any Fidelity fund.
Annual Report
Worldwide
Investment Changes
Geographic Diversification (% of fund's net assets) |
As of October 31, 2004 |
| United States of America | 55.5% | |
| Japan | 7.8% | |
| United Kingdom | 6.9% | |
| Germany | 6.4% | |
| France | 4.2% | |
| Netherlands | 3.1% | |
| Switzerland | 2.4% | |
| Korea (South) | 2.0% | |
| Brazil | 1.9% | |
| Other | 9.8% | |

Percentages are adjusted for the effect of futures contracts, if applicable. |
|
As of April 30, 2004 |
| United States of America | 58.9% | |
| Japan | 9.0% | |
| United Kingdom | 6.4% | |
| France | 3.7% | |
| Germany | 3.7% | |
| Korea (South) | 3.1% | |
| Netherlands | 2.9% | |
| Switzerland | 2.2% | |
| Canada | 2.2% | |
| Other | 7.9% | |

Percentages are adjusted for the effect of futures contracts, if applicable. |
Asset Allocation |
| % of fund'
net assets | % of fund's net assets
6 months ago |
Stocks | 97.0 | 92.1 |
Bonds | 0.0 | 0.5 |
Short-Term Investments and Net Other Assets | 3.0 | 7.4 |
Top Ten Stocks as of October 31, 2004 |
| % of fund's
net assets | % of fund's net assets
6 months ago |
General Electric Co. (United States of America, Industrial Conglomerates) | 2.3 | 1.9 |
Deutsche Telekom AG (Germany, Diversified Telecommunication Services) | 2.3 | 0.2 |
Microsoft Corp. (United States of America, Software) | 2.2 | 2.2 |
American International Group, Inc. (United States of America, Insurance) | 1.9 | 1.8 |
Vodafone Group PLC sponsored ADR (United Kingdom, Wireless Telecommunication Services) | 1.8 | 0.8 |
Tyco International Ltd. (United States of America, Industrial Conglomerates) | 1.5 | 1.3 |
ASML Holding NV (NY Shares) (Netherlands, Semiconductors & Semiconductor Equipment) | 1.1 | 0.7 |
Honeywell International, Inc. (United States of America, Aerospace & Defense) | 1.1 | 0.8 |
Bank of America Corp. (United States of America, Commercial Banks) | 1.1 | 0.9 |
Pfizer, Inc. (United States of America, Pharmaceuticals) | 1.1 | 1.5 |
| 16.4 | |
Market Sectors as of October 31, 2004 |
| % of fund's
net assets | % of fund's net assets
6 months ago |
Financials | 19.5 | 20.6 |
Information Technology | 16.9 | 15.0 |
Industrials | 11.6 | 9.1 |
Health Care | 11.3 | 10.5 |
Consumer Discretionary | 9.7 | 12.2 |
Telecommunication Services | 8.6 | 4.8 |
Energy | 6.8 | 7.8 |
Materials | 5.9 | 4.6 |
Consumer Staples | 5.4 | 6.7 |
Utilities | 1.3 | 1.3 |
Annual Report
Worldwide
Investments October 31, 2004
Showing Percentage of Net Assets
Common Stocks - 96.8% |
| Shares | | Value (Note 1) |
Australia - 0.9% |
CSL Ltd. | 229,830 | | $4,956,054 |
News Corp. Ltd. ADR | 133,700 | | 4,313,162 |
TOTAL AUSTRALIA | | 9,269,216 |
Belgium - 0.4% |
Fortis | 164,600 | | 4,193,815 |
Bermuda - 0.4% |
ACE Ltd. | 100,000 | | 3,806,000 |
Bunge Ltd. | 15,000 | | 715,950 |
Golar LNG Ltd. (a) | 13,100 | | 208,069 |
TOTAL BERMUDA | | 4,730,019 |
Brazil - 1.9% |
Aracruz Celulose SA sponsored ADR | 105,100 | | 3,539,768 |
Banco Bradesco SA sponsored ADR | 49,900 | | 3,037,413 |
Banco Itau Holding Financeira SA sponsored ADR | 38,200 | | 2,311,100 |
Embraer - Empresa Brasileira de Aeronautica SA sponsored ADR | 88,600 | | 2,351,444 |
Tele Norte Leste Participacoes SA ADR | 116,600 | | 1,525,128 |
Telebras sponsored ADR | 63,400 | | 1,671,224 |
Uniao de Bancos Brasileiros SA (Unibanco) GDR | 110,000 | | 2,909,500 |
Votorantim Celulose e Papel SA sponsored ADR | 74,200 | | 2,563,610 |
TOTAL BRAZIL | | 19,909,187 |
Canada - 1.5% |
Alcan, Inc. | 19,200 | | 888,385 |
Canadian Natural Resources Ltd. | 43,400 | | 1,827,443 |
Celestica, Inc. (sub. vtg.) (a) | 93,500 | | 1,358,143 |
EnCana Corp. | 112,100 | | 5,559,667 |
Nortel Networks Corp. (a) | 295,000 | | 1,000,050 |
Research in Motion Ltd. (a) | 22,200 | | 1,956,867 |
Talisman Energy, Inc. | 112,900 | | 3,031,432 |
Tembec, Inc. (a) | 93,100 | | 606,983 |
TOTAL CANADA | | 16,228,970 |
Cayman Islands - 0.2% |
GlobalSantaFe Corp. | 85,000 | | 2,507,500 |
China - 0.5% |
BYD Co. Ltd. (H Shares) | 268,000 | | 754,037 |
China Mengniu Dairy Co. Ltd. | 100,000 | | 82,865 |
China Telecom Corp. Ltd. sponsored ADR | 65,740 | | 2,106,310 |
Global Bio-Chem Technology Group Co. Ltd. | 2,934,000 | | 2,299,344 |
Global Bio-Chem Technology Group Co. Ltd. warrants 5/31/07 (a) | 212,250 | | 14,725 |
People's Food Holdings Ltd. | 583,000 | | 406,675 |
TOTAL CHINA | | 5,663,956 |
Denmark - 0.4% |
Coloplast AS Series B | 16,600 | | 1,652,139 |
|
| Shares | | Value (Note 1) |
Danske Bank AS | 36,950 | | $1,035,491 |
Novo Nordisk AS Series B | 28,700 | | 1,430,676 |
TOTAL DENMARK | | 4,118,306 |
Finland - 0.3% |
Nokia Corp. sponsored ADR | 190,400 | | 2,935,968 |
France - 4.2% |
Accor SA | 65,828 | | 2,741,173 |
Alcatel SA sponsored ADR (a) | 458,700 | | 6,701,607 |
AXA SA | 143,600 | | 3,108,940 |
BNP Paribas SA | 80,320 | | 5,483,607 |
CNP Assurances | 7,300 | | 498,386 |
Dassault Systemes SA | 29,258 | | 1,489,421 |
France Telecom SA sponsored ADR | 162,800 | | 4,680,500 |
L'Oreal SA | 21,268 | | 1,454,730 |
Lagardere S.C.A. (Reg.) | 8,500 | | 549,311 |
Pernod-Ricard | 29,000 | | 4,026,576 |
Sanofi-Aventis sponsored ADR | 160,000 | | 5,840,000 |
Television Francaise 1 SA | 17,900 | | 540,367 |
Total SA Series B | 29,124 | | 6,074,101 |
Vivendi Universal SA sponsored ADR (a) | 69,100 | | 1,895,413 |
TOTAL FRANCE | | 45,084,132 |
Germany - 6.2% |
Adidas-Salomon AG | 17,774 | | 2,491,302 |
Allianz AG (Reg.) | 88,000 | | 9,372,000 |
BASF AG | 43,776 | | 2,750,446 |
Bayerische Hypo-und Vereinsbank AG (a) | 115,700 | | 2,269,780 |
Bayerische Motoren Werke AG (BMW) | 114,459 | | 4,855,586 |
Deutsche Boerse AG | 86,830 | | 4,350,205 |
Deutsche Telekom AG: | | | |
(Reg.) (a) | 265,300 | | 5,112,331 |
sponsored ADR (a) | 972,100 | | 18,732,367 |
E.ON AG | 22,368 | | 1,824,110 |
Fresenius Medical Care AG | 23,100 | | 1,773,664 |
Infineon Technologies AG sponsored ADR (a) | 274,700 | | 3,002,471 |
Merck KGaA | 3,848 | | 215,044 |
RWE AG | 44,829 | | 2,381,906 |
SAP AG sponsored ADR | 54,400 | | 2,320,160 |
Siemens AG sponsored ADR | 65,100 | | 4,865,574 |
TOTAL GERMANY | | 66,316,946 |
Hong Kong - 0.5% |
Hong Kong Exchanges & Clearing Ltd. | 550,000 | | 1,250,691 |
Hutchison Whampoa Ltd. | 200,000 | | 1,535,260 |
Techtronic Industries Co. Ltd. | 740,000 | | 1,473,592 |
Television Broadcasts Ltd. | 223,000 | | 954,032 |
TOTAL HONG KONG | | 5,213,575 |
India - 1.5% |
Cipla Ltd. | 334,416 | | 2,060,271 |
Dr. Reddy's Laboratories Ltd. | 31,000 | | 513,704 |
Common Stocks - continued |
| Shares | | Value (Note 1) |
India - continued |
HDFC Bank Ltd. | 55,276 | | $506,123 |
Housing Development Finance Corp. Ltd. | 203,053 | | 2,868,317 |
I-Flex Solutions Ltd. | 178,127 | | 2,341,564 |
Infosys Technologies Ltd. | 80,789 | | 3,397,201 |
National Thermal Power Corp. | 92,200 | | 126,092 |
Reliance Industries Ltd. | 94,900 | | 1,107,673 |
Satyam Computer Services Ltd. | 233,115 | | 1,923,642 |
State Bank of India | 55,300 | | 578,482 |
TOTAL INDIA | | 15,423,069 |
Italy - 0.3% |
ENI Spa | 156,351 | | 3,578,249 |
Japan - 7.8% |
Advantest Corp. | 39,600 | | 2,772,580 |
Aeon Co. Ltd. | 329,900 | | 5,286,629 |
Canon, Inc. | 43,600 | | 2,158,200 |
Daiwa Securities Group, Inc. | 500,000 | | 3,070,818 |
FamilyMart Co. Ltd. | 48,200 | | 1,295,687 |
Honda Motor Co. Ltd. | 74,900 | | 3,638,642 |
Ito Yokado Ltd. | 141,000 | | 5,062,597 |
JAFCO Co. Ltd. | 36,200 | | 1,864,128 |
KDDI Corp. | 1,004 | | 4,838,097 |
Kyocera Corp. | 24,100 | | 1,751,113 |
Mizuho Financial Group, Inc. | 935 | | 3,613,313 |
Murata Manufacturing Co. Ltd. | 65,400 | | 3,120,612 |
Nichicon Corp. | 115,000 | | 1,328,908 |
Nikko Cordial Corp. | 942,000 | | 4,218,907 |
Nitto Denko Corp. | 32,300 | | 1,535,116 |
Nomura Holdings, Inc. | 351,000 | | 4,271,670 |
ORIX Corp. | 26,000 | | 3,053,621 |
Ricoh Co. Ltd. | 120,000 | | 2,245,004 |
Rohm Co. Ltd. | 34,600 | | 3,556,933 |
Softbank Corp. (d) | 113,600 | | 5,152,171 |
Sumitomo Electric Industries Ltd. | 245,000 | | 2,326,499 |
Sumitomo Mitsui Financial Group, Inc. | 890 | | 5,794,019 |
TDK Corp. | 28,700 | | 1,995,861 |
Tokyo Electron Ltd. | 93,800 | | 5,096,140 |
Toyota Motor Corp. | 69,300 | | 2,688,493 |
Yahoo! Japan Corp. (a) | 162 | | 733,198 |
Yahoo! Japan Corp. New (a) | 162 | | 705,646 |
TOTAL JAPAN | | 83,174,602 |
Korea (South) - 2.0% |
Honam Petrochemical Corp. | 103,940 | | 4,066,612 |
Hyundai Motor Co. | 33,471 | | 1,623,471 |
Kookmin Bank (a) | 85,120 | | 2,843,670 |
LG Electronics, Inc. | 60,295 | | 3,403,881 |
LG Petrochemical Co. Ltd. | 48,650 | | 1,182,028 |
Samsung Electro-Mechanics Co. Ltd. (a) | 75,280 | | 1,613,863 |
Samsung Electronics Co. Ltd. | 10,785 | | 4,234,040 |
Shinhan Financial Group Co. Ltd. | 142,690 | | 2,810,464 |
TOTAL KOREA (SOUTH) | | 21,778,029 |
|
| Shares | | Value (Note 1) |
Netherlands - 3.1% |
Aegon NV | 198,200 | | $2,176,202 |
ASML Holding NV (NY Shares) (a) | 822,614 | | 11,722,250 |
Buhrmann NV | 133,000 | | 992,267 |
Chicago Bridge & Iron Co. NV (NY Shares) | 75,000 | | 2,321,250 |
EADS NV | 48,700 | | 1,392,883 |
ING Groep NV (Certificaten Van Aandelen) | 245,000 | | 6,524,350 |
Unilever NV (NY Shares) | 45,600 | | 2,658,024 |
VNU NV | 98,855 | | 2,708,467 |
Wolters Kluwer NV (Certificaten Van Aandelen) | 131,286 | | 2,400,816 |
TOTAL NETHERLANDS | | 32,896,509 |
Portugal - 0.2% |
Portugal Telecom SGPS SA sponsored ADR | 182,100 | | 2,061,372 |
Singapore - 0.1% |
Flextronics International Ltd. (a) | 103,000 | | 1,241,150 |
South Africa - 0.3% |
Harmony Gold Mining Co. Ltd. sponsored ADR | 77,300 | | 912,140 |
MTN Group Ltd. | 323,494 | | 1,767,045 |
TOTAL SOUTH AFRICA | | 2,679,185 |
Spain - 0.7% |
Banco Bilbao Vizcaya Argentaria SA | 75,800 | | 1,193,850 |
Banco Santander Central Hispano SA | 197,300 | | 2,205,814 |
Telefonica SA | 14,900 | | 247,489 |
Telefonica SA sponsored ADR | 77,000 | | 3,836,910 |
TOTAL SPAIN | | 7,484,063 |
Sweden - 0.4% |
Telefonaktiebolaget LM Ericsson ADR (a) | 139,600 | | 4,035,836 |
Switzerland - 2.4% |
ABB Ltd. (Reg.) (a) | 185,135 | | 1,073,156 |
Actelion Ltd. (Reg.) (a) | 7,904 | | 907,060 |
Alcon, Inc. | 7,000 | | 498,400 |
Compagnie Financiere Richemont unit | 37,090 | | 1,054,788 |
Credit Suisse Group (Reg.) | 132,630 | | 4,545,230 |
Nestle SA (Reg.) | 11,292 | | 2,679,225 |
Novartis AG sponsored ADR | 71,600 | | 3,437,516 |
Phonak Holding AG | 42,583 | | 1,337,630 |
Roche Holding AG (participation certificate) | 30,268 | | 3,103,370 |
Societe Generale de Surveillance Holding SA (SGS) (Reg.) | 1,361 | | 869,863 |
UBS AG (NY Shares) | 77,920 | | 5,648,421 |
TOTAL SWITZERLAND | | 25,154,659 |
Taiwan - 1.2% |
Hon Hai Precision Industries Co. Ltd. | 588,799 | | 2,165,414 |
Quanta Computer, Inc. | 601,934 | | 971,877 |
Common Stocks - continued |
| Shares | | Value (Note 1) |
Taiwan - continued |
Taiwan Semiconductor Manufacturing Co. Ltd. | 583,000 | | $763,504 |
Taiwan Semiconductor Manufacturing Co. Ltd. sponsored ADR | 203,200 | | 1,538,224 |
United Microelectronics Corp. (a) | 7,092,240 | | 4,283,548 |
United Microelectronics Corp. sponsored ADR (a) | 406,426 | | 1,422,491 |
Yageo Corp. (a) | 3,714,000 | | 1,232,633 |
TOTAL TAIWAN | | 12,377,691 |
United Kingdom - 6.9% |
3i Group PLC | 289,240 | | 3,096,115 |
AstraZeneca PLC sponsored ADR | 85,100 | | 3,506,120 |
BHP Billiton PLC | 283,270 | | 2,881,250 |
BP PLC | 219,275 | | 2,128,795 |
British Sky Broadcasting Group PLC (BSkyB) | 71,700 | | 669,997 |
Carphone Warehouse Group PLC | 384,137 | | 1,175,339 |
Dixons Group PLC | 764,500 | | 2,412,887 |
Enterprise Inns PLC | 225,800 | | 2,568,487 |
Hilton Group PLC | 232,200 | | 1,099,825 |
HSBC Holdings PLC sponsored ADR | 100,086 | | 8,109,969 |
ITV PLC | 1,115,149 | | 2,192,701 |
Kesa Electricals PLC | 328,444 | | 1,641,697 |
London Stock Exchange PLC | 242,400 | | 1,625,879 |
Man Group PLC | 179,999 | | 4,323,231 |
mmO2 PLC (a) | 148,900 | | 287,991 |
Prudential PLC | 242,769 | | 1,786,728 |
Reckitt Benckiser PLC | 48,300 | | 1,326,052 |
Reuters Group PLC | 207,200 | | 1,411,672 |
Rio Tinto PLC (Reg.) | 136,262 | | 3,621,163 |
Shire Pharmaceuticals Group PLC sponsored ADR | 66,400 | | 1,885,760 |
Smith & Nephew PLC | 291,000 | | 2,516,568 |
Tesco PLC | 110,187 | | 581,132 |
Vodafone Group PLC sponsored ADR | 733,400 | | 18,914,386 |
Xstrata PLC | 86,200 | | 1,338,526 |
Yell Group PLC | 332,800 | | 2,238,346 |
TOTAL UNITED KINGDOM | | 73,340,616 |
United States of America - 52.5% |
3M Co. | 25,000 | | 1,939,250 |
99 Cents Only Stores (a) | 75,000 | | 1,155,750 |
AES Corp. (a) | 160,000 | | 1,744,000 |
Affiliated Computer Services, Inc. Class A (a) | 50,000 | | 2,727,500 |
AFLAC, Inc. | 55,000 | | 1,973,400 |
Agilent Technologies, Inc. (a) | 25,000 | | 626,500 |
AirTran Holdings, Inc. (a) | 55,000 | | 639,100 |
Albertsons, Inc. | 50,000 | | 1,140,500 |
Alcoa, Inc. | 75,000 | | 2,437,500 |
Alkermes, Inc. (a) | 40,000 | | 494,800 |
Altria Group, Inc. | 105,000 | | 5,088,300 |
AMBAC Financial Group, Inc. | 25,000 | | 1,951,500 |
|
| Shares | | Value (Note 1) |
American Eagle Outfitters, Inc. | 15,000 | | $613,200 |
American International Group, Inc. | 325,000 | | 19,730,750 |
American Tower Corp. Class A (a) | 100,000 | | 1,719,000 |
Amgen, Inc. (a) | 25,000 | | 1,420,000 |
Amkor Technology, Inc. (a) | 5,000 | | 24,900 |
Amphenol Corp. Class A (a) | 30,000 | | 1,029,900 |
Analog Devices, Inc. | 135,000 | | 5,435,100 |
Anheuser-Busch Companies, Inc. | 15,000 | | 749,250 |
Apache Corp. | 20,000 | | 1,014,000 |
Apartment Investment & Management Co. Class A | 115,000 | | 4,219,350 |
Avery Dennison Corp. | 10,000 | | 608,400 |
Avnet, Inc. (a) | 15,000 | | 254,400 |
Baker Hughes, Inc. | 25,000 | | 1,070,750 |
Bank of America Corp. | 254,974 | | 11,420,285 |
Baxter International, Inc. | 360,000 | | 11,073,600 |
BEA Systems, Inc. (a) | 160,000 | | 1,299,200 |
Bear Stearns Companies, Inc. | 28,000 | | 2,653,000 |
Biogen Idec, Inc. (a) | 20,000 | | 1,163,200 |
BioMarin Pharmaceutical, Inc. (a) | 125,000 | | 516,250 |
Broadcom Corp. Class A (a) | 35,000 | | 946,750 |
Brunswick Corp. | 10,000 | | 469,200 |
Burlington Resources, Inc. | 45,000 | | 1,867,500 |
Cablevision Systems Corp. - NY Group Class A (a) | 45,000 | | 926,100 |
Cabot Microelectronics Corp. (a) | 65,000 | | 2,341,950 |
Calamos Asset Management, Inc. Class A | 5,800 | | 113,100 |
Capital One Financial Corp. | 20,000 | | 1,475,200 |
Career Education Corp. (a) | 95,000 | | 2,980,150 |
CarMax, Inc. (a) | 55,000 | | 1,448,700 |
Cendant Corp. | 65,000 | | 1,338,350 |
Centex Corp. | 45,000 | | 2,337,300 |
ChevronTexaco Corp. | 75,000 | | 3,979,500 |
Cintas Corp. | 90,000 | | 3,882,600 |
Citigroup, Inc. | 65,000 | | 2,884,050 |
Clear Channel Communications, Inc. | 121,000 | | 4,041,400 |
Clorox Co. | 15,000 | | 819,000 |
CMS Energy Corp. (a) | 100,000 | | 936,000 |
Colgate-Palmolive Co. | 10,000 | | 446,200 |
Comverse Technology, Inc. (a) | 35,000 | | 722,400 |
ConocoPhillips | 30,027 | | 2,531,576 |
Covad Communications Group, Inc. (a) | 950,000 | | 1,425,000 |
Covance, Inc. (a) | 10,000 | | 397,200 |
Crown Holdings, Inc. (a) | 50,000 | | 567,500 |
Dade Behring Holdings, Inc. (a) | 29,300 | | 1,649,297 |
Dell, Inc. (a) | 105,000 | | 3,681,300 |
Delta Air Lines, Inc. (a) | 215,000 | | 1,171,750 |
Dow Chemical Co. | 115,000 | | 5,168,100 |
DreamWorks Animation SKG, Inc. Class A | 2,200 | | 85,910 |
E.I. du Pont de Nemours & Co. (d) | 80,000 | | 3,429,600 |
Eastman Kodak Co. | 35,000 | | 1,059,800 |
Ecolab, Inc. | 45,800 | | 1,550,330 |
Common Stocks - continued |
| Shares | | Value (Note 1) |
United States of America - continued |
Emmis Communications Corp. Class A (a) | 70,000 | | $1,309,000 |
Encore Acquisition Co. (a) | 20,000 | | 653,000 |
ENSCO International, Inc. | 35,000 | | 1,069,250 |
Entergy Corp. | 45,000 | | 2,941,200 |
Expeditors International of Washington, Inc. | 11,000 | | 628,100 |
Exxon Mobil Corp. | 190,000 | | 9,351,800 |
Fannie Mae | 60,000 | | 4,209,000 |
FirstEnergy Corp. | 35,000 | | 1,446,550 |
Fluor Corp. | 40,000 | | 1,857,600 |
Foundry Networks, Inc. (a) | 125,000 | | 1,516,250 |
Fox Entertainment Group, Inc. Class A (a) | 65,000 | | 1,927,900 |
Freddie Mac | 25,000 | | 1,665,000 |
Freeport-McMoRan Copper & Gold, Inc. Class B | 40,000 | | 1,448,800 |
Freescale Semiconductor, Inc. Class A | 158,000 | | 2,455,320 |
FuelCell Energy, Inc. (a)(d) | 110,000 | | 1,356,850 |
Genentech, Inc. (a) | 29,400 | | 1,338,582 |
General Electric Co. | 725,000 | | 24,737,000 |
Gillette Co. | 85,000 | | 3,525,800 |
Goodrich Corp. | 25,000 | | 770,750 |
Grant Prideco, Inc. (a) | 60,000 | | 1,233,600 |
Guidant Corp. | 45,000 | | 2,997,900 |
Halliburton Co. | 80,000 | | 2,963,200 |
Hartford Financial Services Group, Inc. | 20,000 | | 1,169,600 |
Hewlett-Packard Co. | 25,000 | | 466,500 |
Hilb Rogal & Hobbs Co. | 55,000 | | 1,743,500 |
Home Depot, Inc. | 210,000 | | 8,626,800 |
Honeywell International, Inc. | 340,000 | | 11,451,200 |
Hughes Supply, Inc. | 17,200 | | 488,652 |
Intel Corp. | 230,000 | | 5,119,800 |
International Business Machines Corp. | 50,000 | | 4,487,500 |
International Steel Group, Inc. | 30,000 | | 1,107,900 |
Interstate Bakeries Corp. (a) | 40,000 | | 164,400 |
J.P. Morgan Chase & Co. | 50,000 | | 1,930,000 |
JCPenney Co., Inc. | 23,000 | | 795,570 |
Johnson & Johnson | 165,000 | | 9,632,700 |
Juniper Networks, Inc. (a) | 145,000 | | 3,858,450 |
KB Home | 25,000 | | 2,056,250 |
KLA-Tencor Corp. (a) | 110,000 | | 5,008,300 |
Kohl's Corp. (a) | 1,000 | | 50,760 |
Lam Research Corp. (a) | 80,000 | | 2,082,400 |
Lamar Advertising Co. Class A (a) | 50,000 | | 2,071,000 |
Leap Wireless International, Inc. (a) | 12,000 | | 241,800 |
Lehman Brothers Holdings, Inc. | 28,000 | | 2,300,200 |
Liberty Media Corp. Class A (a) | 75,000 | | 669,000 |
Lockheed Martin Corp. | 60,000 | | 3,305,400 |
Lubrizol Corp. | 20,000 | | 694,600 |
Lucent Technologies, Inc. (a) | 100,000 | | 355,000 |
Lyondell Chemical Co. | 240,000 | | 5,515,200 |
Manufactured Home Communities, Inc. | 12,000 | | 413,880 |
Masco Corp. | 185,000 | | 6,338,100 |
|
| Shares | | Value (Note 1) |
Massey Energy Co. | 25,000 | | $673,250 |
MasTec, Inc. (a) | 180,000 | | 1,243,800 |
MBNA Corp. | 65,000 | | 1,665,950 |
McCormick & Co., Inc. (non-vtg.) | 15,000 | | 531,450 |
McDonald's Corp. | 145,000 | | 4,226,750 |
McKesson Corp. | 35,000 | | 933,100 |
MedImmune, Inc. (a) | 35,000 | | 994,700 |
Medtronic, Inc. | 125,000 | | 6,388,750 |
Merck & Co., Inc. | 1,000 | | 31,310 |
Merrill Lynch & Co., Inc. | 110,000 | | 5,933,400 |
MetLife, Inc. | 60,000 | | 2,301,000 |
Microsoft Corp. | 850,000 | | 23,791,500 |
Millennium Chemicals, Inc. (a) | 65,000 | | 1,396,200 |
Millennium Pharmaceuticals, Inc. (a) | 55,000 | | 713,900 |
Monsanto Co. | 55,000 | | 2,351,250 |
Morgan Stanley | 100,000 | | 5,109,000 |
Motorola, Inc. | 95,000 | | 1,639,700 |
National Instruments Corp. | 35,000 | | 963,550 |
National Semiconductor Corp. (a) | 30,000 | | 501,000 |
National-Oilwell, Inc. (a) | 56,100 | | 1,891,131 |
Navistar International Corp. (a) | 15,000 | | 518,250 |
New York Community Bancorp, Inc. | 70,000 | | 1,285,200 |
Newmont Mining Corp. | 40,000 | | 1,900,800 |
Nextel Communications, Inc. Class A (a) | 85,000 | | 2,251,650 |
Nordstrom, Inc. | 20,000 | | 863,600 |
Norfolk Southern Corp. | 95,000 | | 3,225,250 |
NTL, Inc. (a) | 15,000 | | 997,650 |
Nucor Corp. | 30,000 | | 1,266,900 |
NVIDIA Corp. (a) | 40,000 | | 578,800 |
Occidental Petroleum Corp. | 30,000 | | 1,674,900 |
Olin Corp. | 115,000 | | 2,150,500 |
Omnicom Group, Inc. | 10,000 | | 789,000 |
Oracle Corp. (a) | 175,000 | | 2,215,500 |
Owens-Illinois, Inc. (a) | 100,000 | | 1,853,000 |
PacifiCare Health Systems, Inc. (a) | 20,000 | | 712,400 |
Packaging Corp. of America | 65,000 | | 1,425,450 |
PalmOne, Inc. (a) | 36,100 | | 1,045,817 |
PalmSource, Inc. (a) | 22,000 | | 493,240 |
PepsiCo, Inc. | 65,000 | | 3,222,700 |
PerkinElmer, Inc. | 115,000 | | 2,362,100 |
Pfizer, Inc. | 390,001 | | 11,290,529 |
PG&E Corp. (a) | 45,000 | | 1,441,800 |
Phelps Dodge Corp. | 20,000 | | 1,750,800 |
PMC-Sierra, Inc. (a) | 47,000 | | 482,220 |
Precision Castparts Corp. | 15,000 | | 900,000 |
Pride International, Inc. (a) | 200,000 | | 3,696,000 |
Procter & Gamble Co. | 105,000 | | 5,373,900 |
Raytheon Co. | 75,000 | | 2,736,000 |
Robert Half International, Inc. | 235,000 | | 6,234,550 |
Safeway, Inc. (a) | 95,000 | | 1,732,800 |
Sapient Corp. (a) | 41,100 | | 330,855 |
SBC Communications, Inc. | 355,000 | | 8,967,300 |
Schering-Plough Corp. | 250,000 | | 4,527,500 |
Sealed Air Corp. (a) | 5,000 | | 247,700 |
Common Stocks - continued |
| Shares | | Value (Note 1) |
United States of America - continued |
Siebel Systems, Inc. (a) | 125,000 | | $1,187,500 |
Sierra Health Services, Inc. (a) | 15,000 | | 715,800 |
Smith International, Inc. (a) | 35,700 | | 2,073,456 |
Smurfit-Stone Container Corp. (a) | 145,000 | | 2,517,200 |
Solectron Corp. (a) | 85,000 | | 443,700 |
Sonic Automotive, Inc. Class A (sub. vtg.) | 45,000 | | 910,350 |
SouthTrust Corp. | 30,000 | | 1,307,100 |
Southwest Airlines Co. | 135,000 | | 2,128,950 |
Sovereign Bancorp, Inc. | 50,000 | | 1,082,500 |
Spirit Financial Corp. (e) | 25,000 | | 250,000 |
St. Jude Medical, Inc. (a) | 20,000 | | 1,531,400 |
St. Paul Travelers Companies, Inc. | 5,012 | | 170,208 |
Swift Transportation Co., Inc. (a) | 60,000 | | 1,134,000 |
Symbol Technologies, Inc. | 95,000 | | 1,395,550 |
Synthes, Inc. | 22,220 | | 2,374,997 |
Telewest Global, Inc. (a) | 365,639 | | 4,497,360 |
The Boeing Co. | 60,000 | | 2,994,000 |
The Coca-Cola Co. | 20,000 | | 813,200 |
The DIRECTV Group, Inc. (a) | 85,000 | | 1,425,450 |
The Pep Boys - Manny, Moe & Jack | 20,000 | | 284,400 |
Thermo Electron Corp. (a) | 50,000 | | 1,450,000 |
Time Warner, Inc. (a) | 75,000 | | 1,248,000 |
Toys 'R' Us, Inc. (a) | 110,000 | | 1,981,100 |
TradeStation Group, Inc. (a) | 75,000 | | 464,250 |
Transocean, Inc. (a) | 65,000 | | 2,291,250 |
TXU Corp. | 13,400 | | 820,348 |
Tyco International Ltd. | 497,700 | | 15,503,355 |
Union Pacific Corp. | 19,800 | | 1,246,806 |
UnitedHealth Group, Inc. | 105,000 | | 7,602,000 |
Univision Communications, Inc. Class A (a) | 30,000 | | 928,800 |
Valero Energy Corp. | 25,000 | | 1,074,250 |
Varco International, Inc. (a) | 90,000 | | 2,491,200 |
Verizon Communications, Inc. | 125,000 | | 4,887,500 |
Viacom, Inc. Class B (non-vtg.) | 149,446 | | 5,453,285 |
W.W. Grainger, Inc. | 20,000 | | 1,171,800 |
Wachovia Corp. | 90,009 | | 4,429,343 |
Wal-Mart Stores, Inc. | 125,000 | | 6,740,000 |
Walt Disney Co. | 125,000 | | 3,152,500 |
Washington Mutual, Inc. | 10,000 | | 387,100 |
Waters Corp. (a) | 80,000 | | 3,303,200 |
Weatherford International Ltd. (a) | 99,999 | | 5,225,948 |
Western Digital Corp. (a) | 165,000 | | 1,374,450 |
Wyeth | 150,000 | | 5,947,500 |
Xerox Corp. (a) | 40,000 | | 590,800 |
XL Capital Ltd. Class A | 25,000 | | 1,812,500 |
Yahoo!, Inc. (a) | 165,000 | | 5,971,350 |
TOTAL UNITED STATES OF AMERICA | | 558,763,470 |
TOTAL COMMON STOCKS (Cost $935,750,572) | 1,030,160,090 |
Preferred Stocks - 0.2% |
| Shares | | Value (Note 1) |
Convertible Preferred Stocks - 0.0% |
United Kingdom - 0.0% |
ITV PLC (a) | 58,481 | | $37,076 |
Nonconvertible Preferred Stocks - 0.2% |
Germany - 0.2% |
Fresenius Medical Care AG | 30,500 | | 1,669,349 |
TOTAL PREFERRED STOCKS (Cost $1,295,747) | 1,706,425 |
Money Market Funds - 4.4% |
| | | |
Fidelity Cash Central Fund, 1.79% (b) | 38,676,380 | | 38,676,380 |
Fidelity Securities Lending Cash Central Fund, 1.77% (b)(c) | 8,738,000 | | 8,738,000 |
TOTAL MONEY MARKET FUNDS (Cost $47,414,380) | 47,414,380 |
TOTAL INVESTMENT PORTFOLIO - 101.4% (Cost $984,460,699) | | 1,079,280,895 |
NET OTHER ASSETS - (1.4)% | | (15,118,551) |
NET ASSETS - 100% | $1,064,162,344 |
Legend |
(a)Non-income producing |
(b)Affiliated fund that is available only to investment companies and other accounts managed by Fidelity Investments. The rate quoted is the annualized seven-day yield of the fund at period end. A complete listing of the fund's holdings as of its most recent fiscal year end is available upon request. |
(c)Includes investment made with cash collateral received from securities on loan. |
(d)Security or a portion of the security is on loan at period end. |
(e)Security exempt from registration under Rule 144A of the Securities Act of 1933. These securities may be resold in transactions exempt from registration, normally to qualified institutional buyers. At the period end, the value of these securities amounted to $250,000 or 0.0% of net assets. |
Income Tax Information |
At October 31, 2004, the fund had a capital loss carryforward of approximately $15,189,000 all of which will expire on October 31, 2010. |
See accompanying notes which are an integral part of the financial statements.
Annual Report
Worldwide
Financial Statements
Statement of Assets and Liabilities
| October 31, 2004 |
| | |
Assets | | |
Investment in securities, at value (including securities loaned of $8,412,160) (cost $984,460,699) - See accompanying schedule | | $1,079,280,895 |
Foreign currency held at value (cost $3,294,353) | | 3,279,931 |
Receivable for investments sold | | 17,037,555 |
Receivable for fund shares sold | | 1,179,128 |
Dividends receivable | | 966,305 |
Interest receivable | | 48,647 |
Other affiliated receivables | | 281 |
Other receivables | | 154,955 |
Total assets | | 1,101,947,697 |
| | |
Liabilities | | |
Payable to custodian bank | $15,347 | |
Payable for investments purchased | 25,944,992 | |
Payable for fund shares redeemed | 1,727,792 | |
Accrued management fee | 687,118 | |
Other affiliated payables | 283,730 | |
Other payables and accrued expenses | 388,374 | |
Collateral on securities loaned, at value | 8,738,000 | |
Total liabilities | | 37,785,353 |
| | |
Net Assets | | $1,064,162,344 |
Net Assets consist of: | | |
Paid in capital | | $988,569,781 |
Undistributed net investment income | | 2,469,918 |
Accumulated undistributed net realized gain (loss) on investments and foreign currency transactions | | (21,548,936) |
Net unrealized appreciation (depreciation) on investments and assets and liabilities in foreign currencies | | 94,671,581 |
Net Assets, for 63,639,945 shares outstanding | | $1,064,162,344 |
Net Asset Value, offering price and redemption price per share ($1,064,162,344 ÷ 63,639,945 shares) | | $16.72 |
Statement of Operations
| Year ended October 31, 2004 |
| | |
Investment Income | | |
Dividends | | $14,567,696 |
Interest | | 867,948 |
Security lending | | 236,920 |
| | 15,672,564 |
Less foreign taxes withheld | | (863,388) |
Total income | | 14,809,176 |
| | |
Expenses | | |
Management fee
Basic fee | $7,292,206 | |
Performance adjustment | 1,322,402 | |
Transfer agent fees | 2,809,452 | |
Accounting and security lending fees | 465,246 | |
Non-interested trustees' compensation | 6,067 | |
Custodian fees and expenses | 206,979 | |
Registration fees | 53,626 | |
Audit | 59,094 | |
Legal | 2,486 | |
Miscellaneous | 187,980 | |
Total expenses before reductions | 12,405,538 | |
Expense reductions | (466,828) | 11,938,710 |
Net investment income (loss) | | 2,870,466 |
Realized and Unrealized Gain (Loss) Net realized gain (loss) on: | | |
Investment securities (net of foreign taxes of $65,064) | 59,114,394 | |
Foreign currency transactions | 55,553 | |
Total net realized gain (loss) | | 59,169,947 |
Change in net unrealized appreciation (depreciation) on: Investment securities (net of decrease in deferred foreign taxes of $268,266) | 23,275,664 | |
Assets and liabilities in foreign currencies | (125,802) | |
Total change in net unrealized appreciation (depreciation) | | 23,149,862 |
Net gain (loss) | | 82,319,809 |
Net increase (decrease) in net assets resulting from operations | | $85,190,275 |
See accompanying notes which are an integral part of the financial statements.
Annual Report
Worldwide
Financial Statements - continued
Statement of Changes in Net Assets
| Year ended
October 31,
2004 | Year ended
October 31,
2003 |
Increase (Decrease) in Net Assets | | |
Operations | | |
Net investment income (loss) | $2,870,466 | $1,942,714 |
Net realized gain (loss) | 59,169,947 | 47,546,772 |
Change in net unrealized appreciation (depreciation) | 23,149,862 | 133,184,486 |
Net increase (decrease) in net assets resulting from operations | 85,190,275 | 182,673,972 |
Distributions to shareholders from net investment income | (4,009,737) | (1,083,362) |
Share transactions
Proceeds from sales of shares | 336,194,112 | 215,146,230 |
Reinvestment of distributions | 3,842,365 | 1,031,556 |
Cost of shares redeemed | (206,186,102) | (196,517,438) |
Net increase (decrease) in net assets resulting from share transactions | 133,850,375 | 19,660,348 |
Redemption fees | 44,363 | 46,732 |
Total increase (decrease) in net assets | 215,075,276 | 201,297,690 |
| | |
Net Assets | | |
Beginning of period | 849,087,068 | 647,789,378 |
End of period (including undistributed net investment income of $2,469,918 and undistributed net investment income of $3,209,929, respectively) | $1,064,162,344 | $849,087,068 |
Other Information Shares | | |
Sold | 20,486,089 | 16,234,019 |
Issued in reinvestment of distributions | 243,496 | 86,178 |
Redeemed | (12,574,086) | (15,211,099) |
Net increase (decrease) | 8,155,499 | 1,109,098 |
Financial Highlights
Years ended October 31, | 2004 | 2003 | 2002 | 2001 | 2000 |
Selected Per-Share Data | | | | | |
Net asset value, beginning of period | $15.30 | $11.91 | $13.48 | $19.07 | $18.87 |
Income from Investment Operations | | | | | |
Net investment income (loss) B | .05E | .04 | .03 | .04 | .09 |
Net realized and unrealized gain (loss) | 1.44 | 3.37 | (1.60) | (2.98) | 1.73 |
Total from investment operations | 1.49 | 3.41 | (1.57) | (2.94) | 1.82 |
Distributions from net investment income | (.07) | (.02) | - | (.40) | (.10) |
Distributions from net realized gain | - | - | - | (2.25) | (1.52) |
Total distributions | (.07) | (.02) | - | (2.65) | (1.62) |
Redemption fees added to paid in capital B | - D | - D | - D | - D | - D |
Net asset value, end of period | $16.72 | $15.30 | $11.91 | $13.48 | $19.07 |
Total Return A | 9.77% | 28.68% | (11.65)% | (17.21)% | 9.80% |
Ratios to Average Net Assets C | | | | | |
Expenses before expense reductions | 1.23% | 1.31% | 1.24% | 1.12% | 1.09% |
Expenses net of voluntary waivers, if any | 1.23% | 1.31% | 1.24% | 1.12% | 1.09% |
Expenses net of all reductions | 1.19% | 1.28% | 1.20% | 1.05% | 1.04% |
Net investment income (loss) | .29%E | .28% | .19% | .29% | .48% |
Supplemental Data | | | | | |
Net assets, end of period (000 omitted) | $1,064,162 | $849,087 | $647,789 | $742,294 | $984,038 |
Portfolio turnover rate | 95% | 106% | 120% | 152% | 235% |
A Total returns would have been lower had certain expenses not been reduced during the periods shown. B Calculated based on average shares outstanding during the period. C Expense ratios reflect operating expenses of the fund. Expenses before reductions do not reflect amounts reimbursed by the investment adviser or reductions from brokerage service arrangements or other expense offset arrangements and do not represent the amount paid by the fund during periods when reimbursements or reductions occur. Expenses net of any voluntary waivers reflect expenses after reimbursement by the investment adviser but prior to reductions from brokerage service arrangements or other expense offset arrangements. Expenses net of all reductions represent the net expenses paid by the fund. D Amount represents less than $.01 per share. E Net investment income per share includes approximately $.01 per share received as a result of a reorganization of an issuer that was in bankruptcy. Excluding this non-recurring amount, the ratio of net investment income to average net assets would have been .25%. |
See accompanying notes which are an integral part of the financial statements.
Annual Report
Notes to Financial Statements
For the period ended October 31, 2004
1. Significant Accounting Policies.
Fidelity Global Balanced Fund, Fidelity Diversified International Fund, Fidelity Aggressive International Fund, Fidelity Overseas Fund and Fidelity Worldwide Fund (the funds) are funds of Fidelity Investment Trust (the trust). The trust is registered under the Investment Company Act of 1940, as amended (the 1940 Act), as an open-end management investment company organized as a Massachusetts business trust. Each fund is authorized to issue an unlimited number of shares. Effective the close of business on October 25, 2004, the Diversified International Fund was closed to most new accounts. Certain funds investments in emerging markets can be subject to social, economic, regulatory, and political uncertainties and can be extremely volatile. The financial statements have been prepared in conformity with accounting principles generally accepted in the United States of America, which require management to make certain estimates and assumptions at the date of the financial statements. The following summarizes the significant accounting policies of the funds:
Security Valuation. Net asset value per share (NAV calculation) is calculated as of the close of business of the New York Stock Exchange, normally 4:00 p.m. Eastern time. Equity securities, including restricted securities, for which market quotations are available are valued at the last sale price or official closing price (closing bid price or last evaluated quote if no sale has occurred) on the primary market or exchange on which they trade. Debt securities, including restricted securities, for which quotations are readily available are valued at their most recent bid prices (sales prices if the principal market is an exchange) in the principal market in which such securities are normally traded, as determined by recognized dealers in such securities, or securities are valued on the basis of information provided by a pricing service. Pricing services use valuation matrices that incorporate both dealer-supplied valuations and valuation models. If prices are not readily available or do not accurately reflect fair value for a security, or if a security's value has been materially affected by events occurring after the close of the exchange or market on which the security is principally traded, that security may be valued by another method that the Board of Trustees believes accurately reflects fair value. A security's valuation may differ depending on the method used for determining value. Price movements in futures contracts and ADRs, market and trading trends, the bid/ask quotes of brokers and off-exchange institutional trading may be reviewed in the course of making a good faith determination of a security's fair value. Short-term securities with remaining maturities of sixty days or less for which quotations are not readily available are valued on the basis of amortized cost. Investments in open-end investment companies are valued at their net asset value each business day.
Foreign Currency. Certain funds may use foreign currency contracts to facilitate transactions in foreign-denominated securities. Losses from these transactions may arise from changes in the value of the foreign currency or if the counterparties do not perform under the contracts' terms.
Foreign-denominated assets, including investment securities, and liabilities are translated into U.S. dollars at the exchange rate at period end. Purchases and sales of investment securities, income and dividends received and expenses denominated in foreign currencies are translated into U.S. dollars at the exchange rate in effect on the transaction date.
The effects of exchange rate fluctuations on investments are included with the net realized and unrealized gain (loss) on investment securities. Other foreign currency transactions resulting in realized and unrealized gain (loss) are disclosed separately.
Investment Transactions and Income. Security transactions are accounted for as of trade date. Gains and losses on securities sold are determined on the basis of identified cost and may include proceeds received from litigation. Dividend income is recorded on the ex-dividend date, except for certain dividends from foreign securities where the ex-dividend date may have passed, which are recorded as soon as the funds are informed of the ex-dividend date. Non-cash dividends included in dividend income, if any, are recorded at the fair market value of the securities received. Distributions received on securities that represent a return of capital or capital gain are recorded as a reduction of cost of investments and/or as a realized gain. The funds estimate the components of distributions received that may be considered return of capital distributions or capital gain distributions. Interest income is accrued as earned. Interest income includes coupon interest and amortization of premium and accretion of discount on debt securities. Investment income is recorded net of foreign taxes withheld where recovery of such taxes is uncertain.
Expenses. Most expenses of the trust can be directly attributed to a fund. Expenses which cannot be directly attributed are apportioned among the funds in the trust.
Deferred Trustee Compensation. Under a Deferred Compensation Plan (the Plan) for Overseas and Diversified International, non-interested Trustees must defer receipt of a portion of, and may elect to defer receipt of an additional portion of, their annual compensation. Deferred amounts are treated as though equivalent dollar amounts had been invested in shares of each applicable fund or are invested in a cross-section of other Fidelity funds, and are marked-to-market. Deferred amounts remain in the fund until distributed in accordance with the Plan.
Income Tax Information and Distributions to Shareholders. Each year, each fund intends to qualify as a regulated investment company by distributing all of its taxable income and realized gains under Subchapter M of the Internal Revenue Code. As a result, no provision for income taxes is required in the accompanying financial statements. Foreign taxes are provided for based on each fund's understanding of the tax rules and rates that exist in the foreign markets in which it invests. Distributions are recorded on the ex-dividend date.
Annual Report
Notes to Financial Statements - continued
1. Significant Accounting Policies - continued
Income Tax Information and Distributions to Shareholders - continued
Income and capital gain distributions are determined in accordance with income tax regulations, which may differ from generally accepted accounting principles. In addition, certain funds will claim a portion of the payment made to redeeming shareholders as a distribution for income tax purposes. Capital accounts within the financial statements are adjusted for permanent book-tax differences. These adjustments have no impact on net assets or the results of operations. Temporary book-tax differences will reverse in a subsequent period.
Book-tax differences are primarily due to futures transactions, foreign currency transactions, certain foreign taxes, passive foreign investment companies (PFIC), prior period premium and discount on debt securities, market discount, non-taxable dividends, capital loss carryforwards and losses deferred due to wash sales.
The tax-basis components of distributable earnings and the federal tax cost as of period end were as follows for each fund:
| Cost for Federal
Income Tax Purposes | Unrealized
Appreciation | Unrealized
Depreciation | Net Unrealized
Appreciation/
(Depreciation) |
Global Balanced | $119,499,064 | $18,745,597 | $(1,300,743) | $17,444,854 |
Diversified International | 16,639,371,059 | 3,894,333,673 | (280,705,554) | 3,613,628,119 |
Aggressive International | 696,021,294 | 77,450,274 | (12,493,625) | 64,956,649 |
Overseas | 3,986,035,173 | 503,684,543 | (279,032,505) | 224,652,038 |
Worldwide | 992,370,321 | 126,144,235 | (39,233,661) | 86,910,574 |
| Undistributed
Ordinary Income | Undistributed
Long-term
Capital Gain | Capital Loss
Carryforward |
Global Balanced | $1,826,966 | $1,184,146 | $- |
Diversified International | 144,754,504 | - | (179,438,207) |
Aggressive International | 1,731,944 | - | (46,349,544) |
Overseas | 34,282,248 | - | (385,218,646) |
Worldwide | 3,868,487 | - | (15,189,069) |
The tax character of distributions paid was as follows:
October 31, 2004 | | | | |
| Ordinary
Income | Long-term
Capital Gains | Return of Capital | Total |
Global Balanced | $2,085,080 | $- | $- | $2,085,080 |
Diversified International | 162,070,361 | - | - | 162,070,361 |
Aggressive International | 3,891,060 | - | - | 3,891,060 |
Overseas | 36,930,253 | - | - | 36,930,253 |
Worldwide | 4,009,737 | - | - | 4,009,737 |
October 31, 2003 | | | | |
| Ordinary
Income | Long-term
Capital Gains | Return of Capital | Total |
Global Balanced | $1,305,719 | $- | $- | $1,305,719 |
Diversified International | 53,240,295 | - | - | 53,240,295 |
Aggressive International | 285,614 | - | - | 285,614 |
Overseas | 11,619,951 | - | - | 11,619,951 |
Worldwide | 1,083,362 | - | - | 1,083,362 |
Short-Term Trading (Redemption) Fees. Shares held in the funds less than 30 days are subject to a redemption fee equal to 1% of the proceeds of the redeemed shares. All redemption fees, including any estimated redemption fees paid by Fidelity Management & Research Company (FMR), are retained by the funds and accounted for as an addition to paid in capital.
Annual Report
2. Operating Policies.
Repurchase Agreements. FMR has received an Exemptive Order from the Securities and Exchange Commission (the SEC) which permits the funds and other affiliated entities of FMR to transfer uninvested cash balances into joint trading accounts. These accounts are then invested in repurchase agreements that are collateralized by U.S. Treasury or Government obligations. Certain funds may also invest directly with institutions, in repurchase agreements that are collateralized by commercial paper obligations and corporate obligations. Collateral is held in segregated accounts with custodian banks and may be obtained in the event of a default of the counterparty. Collateral is marked-to-market daily and maintained at a value at least equal to the principal amount of the repurchase agreement (including accrued interest).
Restricted Securities. Certain funds may invest in securities that are subject to legal or contractual restrictions on resale. These securities generally may be resold in transactions exempt from registration or to the public if the securities are registered. Disposal of these securities may involve time-consuming negotiations and expense, and prompt sale at an acceptable price may be difficult. Information regarding restricted securities is included at the end of each applicable fund's Schedule of Investments.
3. Purchases and Sales of Investments.
Purchases and sales of securities, other than short-term securities and U.S. government securities, are noted in the table below.
| Purchases ($) | Sales ($) |
Global Balanced | 109,563,174 | 102,514,400 |
Diversified International | 13,848,550,823 | 8,455,702,222 |
Aggressive International | 1,102,250,898 | 980,773,142 |
Overseas | 3,365,423,296 | 3,002,616,716 |
Worldwide | 1,030,977,804 | 908,184,794 |
4. Fees and Other Transactions with Affiliates.
Management Fee. FMR and its affiliates provide the funds with investment management related services for which the funds pay a monthly management fee. The management fee is the sum of an individual fund fee rate and a group fee rate. The individual fund fee rate is applied to each fund's average net assets. The group fee rate is based upon the average net assets of all the mutual funds advised by FMR. The group fee rate decreases as assets under management increase and increases as assets under management decrease. In addition, the management fee for Diversified International, Aggressive International, Overseas and Worldwide is subject to a performance adjustment (up to a maximum ±.20% of each applicable fund's average net assets over a 36 month performance period). The upward or downward adjustment to the management fee is based on each fund's relative investment performance as compared to an appropriate benchmark index. Worldwide's performance adjustment took effect in March 2002. Subsequent months will be added until the performance period includes 36 months. For the period, each fund's annual management fee rate expressed as a percentage of each fund's average net assets, including the performance adjustment, if applicable was as follows:
| Individual Rate | Group Rate | Total |
Global Balanced | .45% | .28% | .73% |
Diversified International | .45% | .28% | .83% |
Aggressive International | .45% | .28% | .82% |
Overseas | .45% | .28% | .67% |
Worldwide | .45% | .28% | .86% |
Transfer Agent Fees. Fidelity Service Company, Inc. (FSC), an affiliate of FMR, is the funds' transfer, dividend disbursing and shareholder servicing agent. FSC receives account fees and asset-based fees that vary according to account size and type of account. FSC pays for typesetting, printing and mailing of shareholder reports, except proxy statements. For the period, the transfer agent fees were equivalent to the following annual rates expressed as a percentage of average net assets:
Global Balanced | .27% | |
Diversified International | .26% | |
Aggressive International | .29% | |
Overseas | .29% | |
Worldwide | .28% | |
Accounting and Security Lending Fees. FSC maintains each fund's accounting records. The accounting fee is based on the level of average net assets for the month. Under a separate contract, FSC administers the security lending program. The security lending fee is based on the number and duration of lending transactions.
Annual Report
Notes to Financial Statements - continued
4. Fees and Other Transactions with Affiliates - continued
Central Funds. The funds may invest in affiliated Central Funds managed by Fidelity Investments Money Management, Inc. (FIMM), an affiliate of FMR. The Central Funds are open-end investment companies available only to investment companies and other accounts managed by FMR and its affiliates. The Central Funds seek preservation of capital and current income and do not pay a management fee. Income distributions earned by the funds are recorded as income in the accompanying financial statements. Distributions from the Central Funds are noted in the table below:
| Income
Distributions | |
Global Balanced | $139,224 | |
Diversified International | 8,949,876 | |
Aggressive International | 528,094 | |
Overseas | 2,432,637 | |
Worldwide | 554,337 | |
Brokerage Commissions. Certain funds placed a portion of their portfolio transactions with brokerage firms which are affiliates of the investment adviser. The commissions paid to these affiliated firms were as follows:
| Amount | |
Global Balanced | $4,397 | |
Diversified International | 20,674 | |
Aggressive International | 93 | |
Overseas | 9,605 | |
Worldwide | 68,280 | |
5. Committed Line of Credit.
Certain funds participate with other funds managed by FMR in a $4.2 billion credit facility (the "line of credit") to be utilized for temporary or emergency purposes to fund shareholder redemptions or for other short-term liquidity purposes. The participating funds have agreed to pay commitment fees on their pro rata portion of the line of credit. During the period, there were no borrowings on this line of credit.
6. Security Lending.
Certain funds lend portfolio securities from time to time in order to earn additional income. Each applicable fund receives collateral (in the form of U.S. Treasury obligations, letters of credit and/or cash) against the loaned securities and maintains collateral in an amount not less than 100% of the market value of the loaned securities during the period of the loan. The market value of the loaned securities is determined at the close of business of the funds and any additional required collateral is delivered to the funds on the next business day. If the borrower defaults on its obligation to return the securities loaned because of insolvency or other reasons, a fund could experience delays and costs in recovering the securities loaned or in gaining access to the collateral. Cash collateral is invested in cash equivalents. The value of loaned securities and cash collateral at period end are disclosed on each applicable fund's Statement of Assets and Liabilities.
7. Expense Reductions.
Many of the brokers with whom FMR places trades on behalf of certain funds provided services to these funds in addition to trade execution. These services included payments of expenses on behalf of each applicable fund. In addition, through arrangements with each applicable fund's custodian and transfer agent, credits realized as a result of uninvested cash balances were used to reduce each applicable fund's expenses. All of the applicable expense reductions are noted in the table below.
| Brokerage Service
Arrangements | Custody
expense
reduction | Transfer
Agent
expense
reduction |
| | | |
Global Balanced | $13,301 | $6,078 | $572 |
Diversified International | 5,848,322 | 5,019 | 161,360 |
Aggressive International | 526,156 | 196 | 236 |
Overseas | 1,729,922 | 2,395 | 43,288 |
Worldwide | 458,789 | 1,631 | 6,408 |
Annual Report
Report of Independent Registered Public Accounting Firm
To the Trustees of Fidelity Investment Trust and Shareholders of Fidelity Diversified International Fund, Fidelity Aggressive International Fund and Fidelity Worldwide Fund:
We have audited the accompanying statements of assets and liabilities of Fidelity Diversified International Fund, Fidelity Aggressive International Fund and Fidelity Worldwide Fund (the Funds), funds of Fidelity Investment Trust (the Trust), including the portfolios of investments, as of October 31, 2004, and the related statements of operations for the year then ended, the statements of changes in net assets for each of the two years in the period then ended, and the financial highlights for each of the five years in the period then ended. These financial statements and financial highlights are the responsibility of the Funds' management. Our responsibility is to express an opinion on these financial statements and financial highlights based on our audits.
We conducted our audits in accordance with standards of the Public Company Accounting Oversight Board (United States). Those standards require that we plan and perform the audit to obtain reasonable assurance about whether the financial statements and financial highlights are free of material misstatement. An audit includes examining, on a test basis, evidence supporting the amounts and disclosures in the financial statements. Our procedures included confirmation of securities owned as of October 31, 2004, by correspondence with the custodian and brokers; where replies were not received from brokers, we performed other auditing procedures. An audit also includes assessing the accounting principles used and significant estimates made by management, as well as evaluating the overall financial statement presentation. We believe that our audits provide a reasonable basis for our opinion.
In our opinion, the financial statements and financial highlights referred to above present fairly, in all material respects, the financial position of Fidelity Diversified International Fund, Fidelity Aggressive International Fund and Fidelity Worldwide Fund as of October 31, 2004, the results of their operations for the year then ended, the changes in their net assets for each of the two years in the period then ended, and their financial highlights for each of the five years in the period then ended, in conformity with accounting principles generally accepted in the United States of America.
/s/DELOITTE & TOUCHE LLP
DELOITTE & TOUCHE LLP
Boston, Massachusetts
December 20, 2004
Annual Report
Report of Independent Registered Public Accounting Firm
To the Trustees of Fidelity Investment Trust and the Shareholders of Fidelity Global Balanced Fund and Fidelity Overseas Fund:
In our opinion, the accompanying statements of assets and liabilities, including the schedules of investments, and the related statements of operations and of changes in net assets and the financial highlights present fairly, in all material respects, the financial position of Fidelity Global Balanced Fund and Fidelity Overseas Fund (funds of Fidelity Investment Trust) at October 31, 2004, and the results of their operations, the changes in their net assets and the financial highlights for the periods indicated, in conformity with accounting principles generally accepted in the United States of America. These financial statements and financial highlights (hereafter referred to as "financial statements") are the responsibility of the Fidelity Investment Trust's management; our responsibility is to express an opinion on these financial statements based on our audits. We conducted our audits of these financial statements in accordance with the standards of the Public Company Accounting Oversight Board (United States). Those standards require that we plan and perform the audit to obtain reasonable assurance about whether the financial statements are free of material misstatement. An audit includes examining, on a test basis, evidence supporting the amounts and disclosures in the financial statements, assessing the accounting principles used and significant estimates made by management, and evaluating the overall financial statement presentation. We believe that our audits, which included confirmation of securities at October 31, 2004, by correspondence with the custodian and brokers, provide a reasonable basis for our opinion.
/s/PricewaterhouseCoopers LLP
PricewaterhouseCoopers LLP
Boston, Massachusetts
December 17, 2004
Annual Report
Trustees and Officers
The Trustees, Members of the Advisory Board, and executive officers of the trust and funds, as applicable, are listed below. The Board of Trustees governs each fund and is responsible for protecting the interests of shareholders. The Trustees are experienced executives who meet periodically throughout the year to oversee each fund's activities, review contractual arrangements with companies that provide services to each fund, and review each fund's performance. Except for William O. McCoy, each of the Trustees oversees 299 funds advised by FMR or an affiliate. Mr. McCoy oversees 301 funds advised by FMR or an affiliate.
The Trustees hold office without limit in time except that (a) any Trustee may resign; (b) any Trustee may be removed by written instrument, signed by at least two-thirds of the number of Trustees prior to such removal; (c) any Trustee who requests to be retired or who has become incapacitated by illness or injury may be retired by written instrument signed by a majority of the other Trustees; and (d) any Trustee may be removed at any special meeting of shareholders by a two-thirds vote of the outstanding voting securities of the trust. In any event, each non-interested Trustee shall retire not later than the last day of the calendar year in which his or her 72nd birthday occurs. The executive officers and Advisory Board Members hold office without limit in time, except that any officer and Advisory Board Member may resign or may be removed by a vote of a majority of the Trustees at any regular meeting or any special meeting of the Trustees. Except as indicated, each individual has held the office shown or other offices in the same company for the past five years.
The funds' Statement of Additional Information (SAI) includes more information about the Trustees. To request a free copy, call Fidelity at 1-800-544-8544.
Interested Trustees*:
Correspondence intended for each Trustee who is an "interested person" (as defined in the 1940 Act) may be sent to Fidelity Investments, 82 Devonshire Street, Boston, Massachusetts 02109.
Name, Age; Principal Occupation |
Edward C. Johnson 3d (74)** |
| Year of Election or Appointment: 1976 Mr. Johnson is Chairman of the Board of Trustees. Mr. Johnson serves as Chief Executive Officer, Chairman, and a Director of FMR Corp.; a Director and Chairman of the Board and of the Executive Committee of FMR; Chairman and a Director of Fidelity Management & Research (Far East) Inc.; Chairman (1998) and a Director of Fidelity Investments Money Management, Inc.; and Chairman (2001) and a Director (2000) of FMR Co., Inc. |
Abigail P. Johnson (42)** |
| Year of Election or Appointment: 2001 Senior Vice President of Global Balanced (2001), Diversified International (2001), Aggressive International (2001), Overseas (2001), and Worldwide (2001). Ms. Johnson also serves as Senior Vice President of other Fidelity funds (2001). She is President and a Director of FMR (2001), Fidelity Investments Money Management, Inc. (2001), FMR Co., Inc. (2001), and a Director of FMR Corp. Previously, Ms. Johnson managed a number of Fidelity funds. |
Laura B. Cronin (50) |
| Year of Election or Appointment: 2003 Ms. Cronin is an Executive Vice President (2002) and Chief Financial Officer (2002) of FMR Corp. and is a member of the Fidelity Management Committee (2003). Previously, Ms. Cronin served as Vice President of Finance of FMR (1997-1999), and Chief Financial Officer of FMR (1999-2001), Fidelity Personal Investments (2001), and Fidelity Brokerage Company (2001-2002). |
Robert L. Reynolds (52) |
| Year of Election or Appointment: 2003 Mr. Reynolds is a Director (2003) and Chief Operating Officer (2002) of FMR Corp. and is the head of the Fidelity Management Committee (2003). He also serves on the Board at Fidelity Investments Canada, Ltd. (2000). Previously, Mr. Reynolds served as President of Fidelity Investments Institutional Retirement Group (1996-2000). |
*Trustees have been determined to be "Interested Trustees" by virtue of, among other things, their affiliation with the trust or various entities under common control with FMR.
**Edward C. Johnson 3d, Trustee, is Abigail P. Johnson's father.
Annual Report
Trustees and Officers - continued
Non-Interested Trustees:
Correspondence intended for each non-interested Trustee (that is, the Trustees other than the Interested Trustees) may be sent to Fidelity Investments, P.O. Box 55235, Boston, Massachusetts 02205-5235.
Name, Age; Principal Occupation |
J. Michael Cook (62) |
| Year of Election or Appointment: 2001 Prior to Mr. Cook's retirement in May 1999, he served as Chairman and Chief Executive Officer of Deloitte & Touche LLP (accounting/consulting), Chairman of the Deloitte & Touche Foundation, and a member of the Board of Deloitte Touche Tohmatsu. He currently serves as a Director of Comcast (telecommunications, 2002), International Flavors & Fragrances, Inc. (2000), The Dow Chemical Company (2000), and Northrop Grumman Corporation (global defense technology, 2003). He is a Member of the Diversity Advisory Council of Marakon (2003) and the Advisory Council of the Public Company Accounting Oversight Board (PCAOB), Chairman Emeritus of the Board of Catalyst (a leading organization for the advancement of women in business), and is Chairman of the Accountability Advisory Council to the Comptroller General of the United States. He also serves as a Member of the Advisory Board of the Graduate School of Business of the University of Florida, his alma mater. |
Ralph F. Cox (72) |
| Year of Election or Appointment: 1991 Mr. Cox is President of RABAR Enterprises (management consulting for the petroleum industry). Prior to February 1994, he was President of Greenhill Petroleum Corporation (petroleum exploration and production). Until March 1990, Mr. Cox was President and Chief Operating Officer of Union Pacific Resources Company (exploration and production). He is a Director of CH2M Hill Companies (engineering), and Abraxas Petroleum (petroleum exploration and production, 1999). In addition, he is a member of advisory boards of Texas A&M University and the University of Texas at Austin. |
Robert M. Gates (61) |
| Year of Election or Appointment: 1997 Dr. Gates is President of Texas A&M University (2002). He was Director of the Central Intelligence Agency (CIA) from 1991 to 1993. From 1989 to 1991, Dr. Gates served as Assistant to the President of the United States and Deputy National Security Advisor. Dr. Gates is a Director of NACCO Industries, Inc. (mining and manufacturing), Parker Drilling Co., Inc. (drilling and rental tools for the energy industry, 2001), and Brinker International (restaurant management, 2003). He also serves as a member of the Advisory Board of VoteHere.net (secure Internet voting, 2001). Previously, Dr. Gates served as a Director of LucasVarity PLC (automotive components and diesel engines), a Director of TRW Inc. (automotive, space, defense, and information technology), and Dean of the George Bush School of Government and Public Service at Texas A&M University (1999-2001). Dr. Gates also is a Trustee of the Forum for International Policy. |
George H. Heilmeier (68) |
| Year of Election or Appointment: 2004 Dr. Heilmeier is Chairman Emeritus of Telcordia Technologies (communication software and systems), where prior to his retirement, he served as company Chairman and Chief Executive Officer. He currently serves on the Boards of Directors of The Mitre Corporation (systems engineering and information technology support for the government), INET Technologies Inc. (telecommunications network surveillance, 2001), Teletech Holdings (customer management services), and HRL Laboratories (private research and development, 2004). He is Chairman of the General Motors Technology Advisory Committee and a Life Fellow of the Institute of Electrical and Electronics Engineers (IEEE) (2000). Dr. Heilmeier is a member of the Defense Science Board and the National Security Agency Advisory Board. He is also a member of the National Academy of Engineering, the American Academy of Arts and Sciences, and the Board of Overseers of the School of Engineering and Applied Science of the University of Pennsylvania. Previously, Dr. Heilmeier served as a Director of TRW Inc. (automotive, space, defense, and information technology, 1992-2002), Compaq (1994-2002), and Automatic Data Processing, Inc. (ADP) (technology-based business outsourcing, 1995-2002). |
Donald J. Kirk (71) |
| Year of Election or Appointment: 1987 Mr. Kirk is a Governor of the American Stock Exchange (2001), a Trustee and former Chairman of the Board of Trustees of the Greenwich Hospital Association, a Director of the Yale-New Haven Health Services Corp. (1998), and a Director Emeritus and former Chairman of the Board of Directors of National Arts Strategies Inc. (leadership education for arts and culture). Mr. Kirk was an Executive-in-Residence (1995-2000) and a Professor (1987-1995) at Columbia University Graduate School of Business. Prior to 1987, he was Chairman of the Financial Accounting Standards Board. Previously, Mr. Kirk served as a Governor of the National Association of Securities Dealers, Inc. (1996-2002), a member and Vice Chairman of the Public Oversight Board of the American Institute of Certified Public Accountants' SEC Practice Section (1995-2002), a Director of General Re Corporation (reinsurance, 1987-1998) and as a Director of Valuation Research Corp. (appraisals and valuations). |
Marie L. Knowles (58) |
| Year of Election or Appointment: 2001 Prior to Ms. Knowles' retirement in June 2000, she served as Executive Vice President and Chief Financial Officer of Atlantic Richfield Company (ARCO) (diversified energy, 1996-2000). From 1993 to 1996, she was a Senior Vice President of ARCO and President of ARCO Transportation Company. She served as a Director of ARCO from 1996 to 1998. She currently serves as a Director of Phelps Dodge Corporation (copper mining and manufacturing) and McKesson Corporation (healthcare service, 2002). Ms. Knowles is a Trustee of the Brookings Institution and the Catalina Island Conservancy and also serves as a member of the Advisory Board for the School of Engineering of the University of Southern California. |
Ned C. Lautenbach (60) |
| Year of Election or Appointment: 2000 Mr. Lautenbach has been a partner of Clayton, Dubilier & Rice, Inc. (private equity investment firm) since September 1998. Previously, Mr. Lautenbach was with the International Business Machines Corporation (IBM) from 1968 until his retirement in 1998. He was most recently Senior Vice President and Group Executive of Worldwide Sales and Services. From 1993 to 1995, he was Chairman of IBM World Trade Corporation, and from 1994 to 1998 was a member of IBM's Corporate Executive Committee. Mr. Lautenbach serves as Co-Chairman and a Director of Covansys, Inc. (global provider of business and technology solutions, 2000). In addition, he is a Director of Italtel Holding S.p.A. (telecommunications (Milan, Italy), 2004) and Eaton Corporation (diversified industrial) as well as the Philharmonic Center for the Arts in Naples, Florida (1999). He also is a member of the Council on Foreign Relations. |
Marvin L. Mann (71) |
| Year of Election or Appointment: 1993 Mr. Mann is Chairman of the non-interested Trustees (2001). He is Chairman Emeritus of Lexmark International, Inc. (computer peripherals), where he served as CEO until April 1998, retired as Chairman May 1999, and remains a member of the Board. Prior to 1991, he held the positions of Vice President of International Business Machines Corporation (IBM) and President and General Manager of various IBM divisions and subsidiaries. He is a member of the Executive Committee of the Independent Director's Council of the Investment Company Institute. In addition, Mr. Mann is a member of the President's Cabinet at the University of Alabama and the Board of Visitors of the Culverhouse College of Commerce and Business Administration at the University of Alabama. |
William O. McCoy (71) |
| Year of Election or Appointment: 1997 Prior to his retirement in December 1994, Mr. McCoy was Vice Chairman of the Board of BellSouth Corporation (telecommunications) and President of BellSouth Enterprises. He is currently a Director of Liberty Corporation (holding company), Duke Realty Corporation (real estate), and Progress Energy, Inc. (electric utility). He is also a partner of Franklin Street Partners (private investment management firm) and a member of the Research Triangle Foundation Board. In addition, Mr. McCoy served as the Interim Chancellor (1999-2000) and a member of the Board of Visitors (1994-1998) for the University of North Carolina at Chapel Hill and currently serves on the Board of Directors of the University of North Carolina Health Care System and the Board of Visitors of the Kenan-Flagler Business School (University of North Carolina at Chapel Hill). He also served as Vice President of Finance for the University of North Carolina (16-school system, 1995-1998). |
William S. Stavropoulos (65) |
| Year of Election or Appointment: 2001 Mr. Stavropoulos is Chairman of the Board (2000), CEO (2002), a position he previously held from 1995-2000, Chairman of the Executive Committee (2000), and a Member of the Board of Directors of The Dow Chemical Company. Since joining The Dow Chemical Company in 1967, Mr. Stavropoulos served in numerous senior management positions, including President (1993-2000; 2002-2003). Currently, he is a Director of NCR Corporation (data warehousing and technology solutions), BellSouth Corporation (telecommunications), Chemical Financial Corporation, and Maersk Inc. (industrial conglomerate, 2002). He also serves as a member of the Board of Trustees of the American Enterprise Institute for Public Policy Research. In addition, Mr. Stavropoulos is a member of The Business Council, J.P. Morgan International Council and the University of Notre Dame Advisory Council for the College of Science. |
Annual Report
Trustees and Officers - continued
Advisory Board Members and Executive Officers:
Correspondence intended for Mr. Dirks, Ms. Small, and Mr. Wolfe may be sent to Fidelity Investments, P.O. Box 55235, Boston, Massachusetts 02205-5235. Correspondence intended for each executive officer and Mr. Lynch may be sent to Fidelity Investments, 82 Devonshire Street, Boston, Massachusetts 02109.
Name, Age; Principal Occupation |
Dennis J. Dirks (56) |
| Year of Election or Appointment: 2004 Member of the Advisory Board of Fidelity Investment Trust. Prior to his retirement in May 2003, Mr. Dirks was Chief Operating Officer and a member of the Board of The Depository Trust & Clearing Corporation (DTCC) (1999-2003). He also served as President, Chief Operating Officer, and Board member of The Depository Trust Company (DTC) (1999-2003) and President and Board member of the National Securities Clearing Corporation (NSCC) (1999-2003). In addition, Mr. Dirks served as Chief Executive Officer and Board member of the Government Securities Clearing Corporation (2001-2003) and Chief Executive Officer and Board member of the Mortgage-Backed Securities Clearing Corporation (2001-2003). |
Peter S. Lynch (61) |
| Year of Election or Appointment: 2003 Member of the Advisory Board of Fidelity Investment Trust. Vice Chairman and a Director of FMR, and Vice Chairman (2001) and a Director (2000) of FMR Co., Inc. Previously, Mr. Lynch served as a Trustee of the Fidelity funds (1990-2003). Prior to May 31, 1990, he was a Director of FMR and Executive Vice President of FMR (a position he held until March 31, 1991), Vice President of Fidelity® Magellan® Fund and FMR Growth Group Leader, and Managing Director of FMR Corp. Mr. Lynch was also Vice President of Fidelity Investments Corporate Services. In addition, he serves as a Trustee of Boston College, Massachusetts Eye & Ear Infirmary, Historic Deerfield, John F. Kennedy Library, and the Museum of Fine Arts of Boston. |
Cornelia M. Small (60) |
| Year of Election or Appointment: 2004 Member of the Advisory Board of Fidelity Investment Trust. Ms. Small is a member (2000) and Chairperson (2002) of the Investment Committee, and a member (2002) of the Board of Trustees of Smith College. Previously, she served as Chief Investment Officer (1999-2000), Director of Global Equity Investments (1996-1999), and a member of the Board of Directors of Scudder, Stevens & Clark (1990-1997) and Scudder Kemper Investments (1997-1998). In addition, Ms. Small served as Co-Chair (2000-2003) of the Annual Fund for the Fletcher School of Law and Diplomacy. |
Kenneth L. Wolfe (65) |
| Year of Election or Appointment: 2004 Member of the Advisory Board of Fidelity Investment Trust. Prior to his retirement in 2001, Mr. Wolfe was Chairman and Chief Executive Officer of Hershey Foods Corporation (1993-2001). He currently serves as a member of the boards of Adelphia Communications Corporation (2003), Bausch & Lomb, Inc., and Revlon Inc. (2004). |
Philip L. Bullen (45) |
| Year of Election or Appointment: 2001 Vice President of Global Balanced, Diversified International, Aggressive International, Overseas, and Worldwide. Mr. Bullen also serves as Vice President of certain Equity Funds (2001) and certain High Income Funds (2001). He is Senior Vice President of FMR (2001) and FMR Co., Inc. (2001), President and a Director of Fidelity Management & Research (Far East) Inc. (2001), President and a Director of Fidelity Management & Research (U.K.) Inc. (2002), and a Director of Strategic Advisers, Inc. (2002). Before joining Fidelity Investments, Mr. Bullen was President and Chief Investment Officer of Santander Global Advisors (1997-2000) and President and Chief Executive Officer of Boston's Baring Asset Management Inc. (1994-1997). |
Kevin R. McCarey (43) |
| Year of Election or Appointment: 1999 Vice President of Aggressive International. Mr. McCarey is also Vice President of another fund advised by FMR. Prior to assuming his current responsibilities, Mr. McCarey managed a variety of Fidelity funds. |
Richard R. Mace, Jr. (42) |
| Year of Election or Appointment: 1996 or 2001 Vice President of Global Balanced (1996), Overseas (1996), and Worldwide (2001). Mr. Mace is also Vice President of other funds advised by FMR. Prior to assuming his current responsibilities, Mr. Mace managed a variety of Fidelity funds. |
William Bower (36) |
| Year of Election or Appointment: 2001 Vice President of Diversified International. Mr. Bower is also Vice President of other funds advised by FMR. Prior to assuming his current responsibilities, Mr. Bower served as an analyst and manager of a variety of Fidelity funds. |
Eric D. Roiter (55) |
| Year of Election or Appointment: 1998 Secretary of Global Balanced, Diversified International, Aggressive International, Overseas, and Worldwide. He also serves as Secretary of other Fidelity funds (1998); Vice President, General Counsel, and Clerk of FMR Co., Inc. (2001) and FMR (1998); Vice President and Clerk of FDC (1998); Assistant Clerk of Fidelity Management & Research (U.K.) Inc. (2001) and Fidelity Management & Research (Far East) Inc. (2001); and Assistant Secretary of Fidelity Investments Money Management, Inc. (2001). Prior to joining Fidelity, Mr. Roiter was with the law firm of Debevoise & Plimpton, as an associate (1981-1984) and as a partner (1985-1997), and served as an Assistant General Counsel of the U.S. Securities and Exchange Commission (1979-1981). Mr. Roiter is an Adjunct Member, Faculty of Law, at Boston College Law School (2003). |
Stuart Fross (45) |
| Year of Election or Appointment: 2003 Assistant Secretary of Global Balanced, Diversified International, Aggressive International, Overseas, and Worldwide. Mr. Fross also serves as Assistant Secretary of other Fidelity funds (2003) and is an employee of FMR. |
Christine Reynolds (46) |
| Year of Election or Appointment: 2004 President, Treasurer, and Anti-Money Laundering (AML) officer of Global Balanced, Diversified International, Aggressive International, Overseas, and Worldwide. Ms. Reynolds also serves as President, Treasurer, and AML officer of other Fidelity funds (2004) and is a Vice President (2003) and an employee (2002) of FMR. Before joining Fidelity Investments, Ms. Reynolds worked at PricewaterhouseCoopers LLP (PwC) (1980-2002), where she was most recently an audit partner with PwC's investment management practice. |
Timothy F. Hayes (53) |
| Year of Election or Appointment: 2002 Chief Financial Officer of Global Balanced, Diversified International, Aggressive International, Overseas, and Worldwide. Mr. Hayes also serves as Chief Financial Officer of other Fidelity funds (2002). Recently he was appointed President of Fidelity Service Company (2003) where he also serves as a Director. Mr. Hayes also serves as President of Fidelity Investments Operations Group (FIOG, 2002), which includes Fidelity Pricing and Cash Management Services Group (FPCMS), where he was appointed President in 1998. Previously, Mr. Hayes served as Chief Financial Officer of Fidelity Investments Corporate Systems and Service Group (1998) and Fidelity Systems Company (1997-1998). |
Kenneth A. Rathgeber (57) |
| Year of Election or Appointment: 2004 Chief Compliance Officer of Global Balanced, Diversified International, Aggressive International, Overseas, and Worldwide. Mr. Rathgeber also serves as Chief Compliance Officer of other Fidelity funds (2004) and Executive Vice President of Risk Oversight for Fidelity Investments (2002). Previously, he served as Executive Vice President and Chief Operating Officer for Fidelity Investments Institutional Services Company, Inc. (1998-2002). |
John R. Hebble (46) |
| Year of Election or Appointment: 2003 Deputy Treasurer of Global Balanced, Diversified International, Aggressive International, Overseas, and Worldwide. Mr. Hebble also serves as Deputy Treasurer of other Fidelity funds (2003), and is an employee of FMR. Before joining Fidelity Investments, Mr. Hebble worked at Deutsche Asset Management where he served as Director of Fund Accounting (2002-2003) and Assistant Treasurer of the Scudder Funds (1998-2003). |
Kimberley H. Monasterio (40) |
| Year of Election or Appointment: 2004 Deputy Treasurer of Global Balanced, Diversified International, Aggressive International, Overseas, and Worldwide. Ms. Monasterio also serves as Deputy Treasurer of other Fidelity funds (2004) and is an employee of FMR (2004). Before joining Fidelity Investments, Ms. Monasterio served as Treasurer (2000-2004) and Chief Financial Officer (2002-2004) of the Franklin Templeton Funds and Senior Vice President of Franklin Templeton Services, LLC (2000-2004). |
John H. Costello (58) |
| Year of Election or Appointment: 1986, 1990, 1991, 1993, or 1994 Assistant Treasurer of Global Balanced (1993), Diversified International (1991), Aggressive International (1994), Overseas (1986), and Worldwide (1990). Mr. Costello also serves as Assistant Treasurer of other Fidelity funds and is an employee of FMR. |
Francis V. Knox, Jr. (57) |
| Year of Election or Appointment: 2002 Assistant Treasurer of Global Balanced, Diversified International, Aggressive International, Overseas, and Worldwide. Mr. Knox also serves as Assistant Treasurer of other Fidelity funds (2002), and is a Vice President and an employee of FMR. Previously, Mr. Knox served as Vice President of Investment & Advisor Compliance (1990-2001), and Compliance Officer of Fidelity Management & Research (U.K.) Inc. (1992-2002), Fidelity Management & Research (Far East) Inc. (1991-2002), and FMR Corp. (1995-2002). |
Peter L. Lydecker (50) |
| Year of Election or Appointment: 2004 Assistant Treasurer of Global Balanced, Diversified International, Aggressive International, Overseas, and Worldwide. Mr. Lydecker also serves as Assistant Treasurer of other Fidelity funds (2004) and is an employee of FMR. |
Mark Osterheld (49) |
| Year of Election or Appointment: 2002 Assistant Treasurer of Global Balanced, Diversified International, Aggressive International, Overseas, and Worldwide. Mr. Osterheld also serves as Assistant Treasurer of other Fidelity funds (2002) and is an employee of FMR. |
Kenneth B. Robins (35) |
| Year of Election or Appointment: 2004 Assistant Treasurer of Global Balanced, Diversified International, Aggressive International, Overseas, and Worldwide. Mr. Robins also serves as Assistant Treasurer of other Fidelity funds (2004) and is an employee of FMR (2004). Before joining Fidelity Investments, Mr. Robins worked at KPMG LLP, where he was a partner in KPMG's department of professional practice (2002-2004) and a Senior Manager (1999-2000). In addition, Mr. Robins served as Assistant Chief Accountant, United States Securities and Exchange Commission (2000-2002). |
Thomas J. Simpson (46) |
| Year of Election or Appointment: 2000 Assistant Treasurer of Global Balanced, Diversified International, Aggressive International, Overseas, and Worldwide. Mr. Simpson is Assistant Treasurer of other Fidelity funds (2000) and an employee of FMR (1996). Prior to joining FMR, Mr. Simpson was Vice President and Fund Controller of Liberty Investment Services (1987-1995). |
Annual Report
Distributions
The Board of Trustees of each fund voted to pay to shareholders of record at the opening of business on record date, the following distributions per share derived from capital gains realized from sales of portfolio securities, and dividends derived from net investment income:
Fund | Pay Date | Record Date | Dividends | Capital Gains |
Fidelity Global Balanced Fund | 12/06/04 | 12/03/04 | $0.13 | $0.32 |
Fidelity Diversified International Fund | 12/13/04 | 12/10/04 | $0.15 | $0.06 |
Fidelity Aggressive International Fund | 12/13/04 | 12/10/04 | $0.05 | - |
Fidelity Overseas Fund | 12/06/04 | 12/03/04 | $0.19 | $0.11 |
Fidelity Worldwide Fund | 12/13/04 | 12/10/04 | $0.10 | $0.02 |
A percentage of the dividends distributed during the fiscal year for the following funds was derived from interest on U.S. Government securities which is generally exempt from state income tax:
Fidelity Global Balanced Fund | 24.44% | |
A percentage of the dividends distributed during the fiscal year for the following funds qualifies for the dividends-received deduction for corporate shareholders:
Fidelity Global Balanced Fund | 18% | |
Fidelity Worldwide Fund | 100% | |
A percentage of the dividends distributed during the fiscal year for the following funds may be taken into account as a dividend for purposes of the maximum rate under section 1(h)(11) of the Internal Revenue Code.
Fidelity Global Balanced Fund | 51% | |
Fidelity Diversified International Fund | 83% | |
Fidelity Aggressive International Fund | 82% | |
Fidelity Overseas Fund | 84% | |
Fidelity Worldwide Fund | 100% | |
The amounts per share which represent income derived from sources within, and taxes paid to, foreign countries or possessions of the United States are as follows:
Fund | Pay Date | Income | Taxes |
Fidelity Global Balanced Fund | 12/08/03 | $0.078 | $0.011 |
Fidelity Diversified International Fund | 12/15/03 | $0.130 | $0.024 |
Fidelity Aggressive International Fund | 12/15/03 | $0.058 | $0.010 |
Fidelity Overseas Fund | 12/08/03 | $0.168 | $0.038 |
The funds will notify shareholders in January 2005 of amounts for use in preparing 2004 income tax returns.
Annual Report
Proxy Voting Results
A special meeting of each fund's shareholders was held on October 14, 2004. The results of votes taken among shareholders on proposals before them are reported below. Each vote reported represents one dollar of net asset value held on the record date for the meeting.
PROPOSAL 1 |
To amend the Declaration of Trust to allow the Board of Trustees, if permitted by applicable law, to authorize fund mergers without shareholder approval. A |
| # of
Votes | % of
Votes |
Affirmative | 15,718,325,709.37 | 74.142 |
Against | 3,816,318,151.70 | 18.001 |
Abstain | 840,597,158.37 | 3.965 |
Broker
Non-Votes | 825,022,241.94 | 3.892 |
TOTAL | 21,200,263,261.38 | 100.000 |
PROPOSAL 2 |
To elect a Board of Trustees. A |
| # of
Votes | % of
Votes |
J. Michael Cook |
Affirmative | 20,046,954,592.62 | 94.560 |
Withheld | 1,153,308,668.76 | 5.440 |
TOTAL | 21,200,263,261.38 | 100.000 |
Ralph F. Cox |
Affirmative | 20,022,775,321.09 | 94.446 |
Withheld | 1,177,487,940.29 | 5.554 |
TOTAL | 21,200,263,261.38 | 100.000 |
Laura B. Cronin |
Affirmative | 20,020,502,157.24 | 94.435 |
Withheld | 1,179,761,104.14 | 5.565 |
TOTAL | 21,200,263,261.38 | 100.000 |
Dennis J. Dirks B |
Affirmative | 20,051,128,100.47 | 94.580 |
Withheld | 1,149,135,160.91 | 5.420 |
TOTAL | 21,200,263,261.38 | 100.000 |
Robert M. Gates |
Affirmative | 20,029,013,552.52 | 94.475 |
Withheld | 1,171,249,708.86 | 5.525 |
TOTAL | 21,200,263,261.38 | 100.000 |
George H. Heilmeier |
Affirmative | 20,064,274,525.78 | 94.642 |
Withheld | 1,135,988,735.60 | 5.358 |
TOTAL | 21,200,263,261.38 | 100.000 |
Abigail P. Johnson |
Affirmative | 19,965,491,863.72 | 94.176 |
Withheld | 1,234,771,397.66 | 5.824 |
TOTAL | 21,200,263,261.38 | 100.000 |
Edward C. Johnson 3d |
Affirmative | 19,910,643,140.70 | 93.917 |
Withheld | 1,289,620,120.68 | 6.083 |
TOTAL | 21,200,263,261.38 | 100.000 |
| # of
Votes | % of
Votes |
Donald J. Kirk |
Affirmative | 20,034,697,704.85 | 94.502 |
Withheld | 1,165,565,556.53 | 5.498 |
TOTAL | 21,200,263,261.38 | 100.000 |
Marie L. Knowles |
Affirmative | 20,071,617,016.84 | 94.676 |
Withheld | 1,128,646,244.54 | 5.324 |
TOTAL | 21,200,263,261.38 | 100.000 |
Ned C. Lautenbach |
Affirmative | 20,069,374,137.98 | 94.666 |
Withheld | 1,130,889,123.40 | 5.334 |
TOTAL | 21,200,263,261.38 | 100.000 |
Marvin L. Mann |
Affirmative | 20,034,126,102.77 | 94.499 |
Withheld | 1,166,137,158.61 | 5.501 |
TOTAL | 21,200,263,261.38 | 100.000 |
William O. McCoy |
Affirmative | 20,046,749,092.57 | 94.559 |
Withheld | 1,153,514,168.81 | 5.441 |
TOTAL | 21,200,263,261.38 | 100.000 |
Robert L. Reynolds |
Affirmative | 20,051,009,814.32 | 94.579 |
Withheld | 1,149,253,447.06 | 5.421 |
TOTAL | 21,200,263,261.38 | 100.000 |
Cornelia M. Small B |
Affirmative | 20,037,030,750.74 | 94.513 |
Withheld | 1,163,232,510.64 | 5.487 |
TOTAL | 21,200,263,261.38 | 100.000 |
William S. Stavropoulos |
Affirmative | 20,037,089,868.63 | 94.513 |
Withheld | 1,163,173,392.75 | 5.487 |
TOTAL | 21,200,263,261.38 | 100.000 |
PROPOSAL 4 |
To amend each fund's fundamental investment limitation concerning lending. |
Fidelity Aggressive International Fund |
| # of
Votes | % of
Votes |
Affirmative | 363,425,018.38 | 84.546 |
Against | 36,724,986.29 | 8.544 |
Abstain | 23,774,719.92 | 5.531 |
Broker
Non-Votes | 5,927,555.40 | 1.379 |
TOTAL | 429,852,279.99 | 100.000 |
Fidelity Diversified International Fund |
| # of
Votes | % of
Votes |
Affirmative | 7,251,250,905.41 | 78.865 |
Against | 1,006,828,073.47 | 10.951 |
Abstain | 552,501,175.27 | 6.008 |
Broker
Non-Votes | 384,001,957.00 | 4.176 |
TOTAL | 9,194,582,111.15 | 100.000 |
Fidelity Global Balanced Fund |
| # of
Votes | % of
Votes |
Affirmative | 55,728,206.23 | 73.810 |
Against | 10,033,280.79 | 13.288 |
Abstain | 5,563,415.27 | 7.369 |
Broker
Non-Votes | 4,177,655.60 | 5.533 |
TOTAL | 75,502,557.89 | 100.000 |
Fidelity Overseas Fund |
| # of
Votes | % of
Votes |
Affirmative | 1,552,368,345.07 | 76.613 |
Against | 289,860,925.90 | 14.306 |
Abstain | 148,860,898.25 | 7.346 |
Broker
Non-Votes | 35,146,108.15 | 1.735 |
TOTAL | 2,026,236,277.37 | 100.000 |
Fidelity Worldwide Fund |
| # of
Votes | % of
Votes |
Affirmative | 420,519,900.33 | 78.017 |
Against | 68,949,855.25 | 12.792 |
Abstain | 36,687,593.90 | 6.806 |
Broker
Non-Votes | 12,854,366.22 | 2.385 |
TOTAL | 539,011,715.70 | 100.000 |
ADenotes trust-wide proposals and voting results. BEffective January 1, 2005. |
Annual Report
Annual Report
Investment Adviser
Fidelity Management & Research Company
Boston, MA
Investment Sub-Advisers
FMR Co., Inc.
Fidelity Management & Research (U.K.) Inc.
Fidelity Management & Research (Far East) Inc.
Fidelity International Investment Advisors
Fidelity International Investment Advisors
(U.K.) Limited
Fidelity Investments Japan Limited
General Distributor
Fidelity Distributors Corporation
Boston, MA
Transfer and Shareholder
Servicing Agent
Fidelity Service Company, Inc.
Boston, MA
Custodians
Brown Brothers Harriman & Co.
Boston, MA
Global Balanced Fund
JPMorgan Chase Bank
New York, NY
Aggressive International Fund, Diversified International Fund, International Growth & Income Fund, Overseas Fund, Worldwide Fund
Fidelity's International Equity Funds
Aggressive International Fund
Canada Fund
China Region Fund
Diversified International Fund
Emerging Markets Fund
Europe Fund
Europe Capital Appreciation Fund
Global Balanced Fund
International Discovery Fund
International Small Cap Fund
Japan Fund
Japan Smaller Companies Fund
Latin America Fund
Nordic Fund
Overseas Fund
Pacific Basin Fund
Southeast Asia Fund
Worldwide Fund
Please carefully consider the funds' investment objectives, risks, charges and expenses before investing. For this and other information, call 1-800-544-6666 for a free prospectus. Read it carefully before you invest or send money.
Corporate Headquarters
82 Devonshire Street
Boston, MA 02109
1-800-544-8888
The Fidelity Telephone Connection
Mutual Fund 24-Hour Service
Exchanges/Redemptions
and Account Assistance1-800-544-6666
Product Information1-800-544-6666
Retirement Accounts1-800-544-4774
(8 a.m. - 9 p.m.)
TDD Service1-800-544-0118
for the deaf and hearing impaired
(9 a.m. - 9 p.m. Eastern time)
Fidelity Automated Service
Telephone (FAST®) (automated graphic) 1-800-544-5555
(automated graphic) Automated line for quickest service
(fidelity_logo)
Fidelity Investments (registered trademark)
P.O. Box 193
Boston, MA 02101
(postage_prepaid_graphic)
IBD-UANNPRO-1204
1.784774.101
Printed on Recycled Paper
Item 2. Code of Ethics
As of the end of the period, October 31, 2004, Fidelity Investment Trust (the trust) has adopted a code of ethics, as defined in Item 2 of Form N-CSR, that applies to its President and Treasurer and its Chief Financial Officer. A copy of the code of ethics is filed as an exhibit to this Form N-CSR.
Item 3. Audit Committee Financial Expert
The Board of Trustees of the trust has determined that Marie L. Knowles and Donald J. Kirk are each audit committee financial experts, as defined in Item 3 of Form N-CSR. Ms. Knowles and Mr. Kirk are each independent for purposes of Item 3 of Form N-CSR.
Item 4. Principal Accountant Fees and Services
(a) Audit Fees.
For the fiscal years ended October 31, 2004 and October 31, 2003, the aggregate Audit Fees billed by PricewaterhouseCoopers LLP (PwC) for professional services rendered for the audits of the financial statements, or services that are normally provided in connection with statutory and regulatory filings or engagements for those fiscal years, for Fidelity Canada Fund, Fidelity China Region Fund, Fidelity Emerging Markets Fund, Fidelity Europe Fund, Fidelity Global Balanced Fund, Fidelity International Discovery Fund, Fidelity Japan Fund, Fidelity Japan Smaller Companies Fund, Fidelity Latin America Fund, Fidelity Nordic Fund, Fidelity Overseas Fund, Fidelity Pacific Basin Fund and Fidelity Southeast Asia Fund (the funds) and for all funds in the Fidelity Group of Funds are shown in the table below.
Fund | 2004A | 2003A |
Fidelity Canada Fund | $49,000 | $51,000 |
Fidelity China Region Fund | $45,000 | $48,000 |
Fidelity Emerging Markets Fund | $62,000 | $62,000 |
Fidelity Europe Fund | $58,000 | $58,000 |
Fidelity Global Balanced Fund | $62,000 | $63,000 |
Fidelity International Discovery Fund | $59,000 | $59,000 |
Fidelity Japan Fund | $50,000 | $52,000 |
Fidelity Japan Smaller Companies Fund | $44,000 | $46,000 |
Fidelity Latin America Fund | $68,000 | $68,000 |
Fidelity Nordic Fund | $40,000 | $44,000 |
Fidelity Overseas Fund | $87,000 | $84,000 |
Fidelity Pacific Basin Fund | $50,000 | $52,000 |
Fidelity Southeast Asia Fund | $69,000 | $68,000 |
All funds in the Fidelity Group of Funds audited by PwC | $10,600,000 | $10,500,000 |
A | Aggregate amounts may reflect rounding. |
For the fiscal years ended October 31, 2004 and October 31, 2003, the aggregate Audit Fees billed by Deloitte & Touche LLP, the member firms of Deloitte Touche Tohmatsu, and their respective affiliates (collectively, "Deloitte Entities") for professional services rendered for the audits of the financial statements, or services that are normally provided in connection with statutory and regulatory filings or engagements for those fiscal years, for Fidelity Aggressive International Fund, Fidelity Diversified International Fund Fidelity Europe Capital Appreciation Fund, Fidelity International Small Cap Fund and Fidelity Worldwide Fund (the funds) and for all funds in the Fidelity Group of Funds are shown in the table below.
Fund | 2004A | 2003A |
Fidelity Aggressive International Fund | $37,000 | $41,000 |
Fidelity Diversified International Fund | $56,000 | $53,000 |
Fidelity Europe Capital Appreciation Fund | $41,000 | $45,000 |
Fidelity International Small Cap Fund | $32,000 | $35,000 |
Fidelity Worldwide Fund | $42,000 | $45,000 |
All funds in the Fidelity Group of Funds audited by Deloitte Entities | $4,300,000 | $4,200,000 |
A | Aggregate amounts may reflect rounding. |
(b) Audit-Related Fees.
In each of the fiscal years ended October 31, 2004 and October 31, 2003, the aggregate Audit-Related Fees billed by PwC for services rendered for assurance and related services to each fund that are reasonably related to the performance of the audit or review of the fund's financial statements, but not reported as Audit Fees, are shown in the table below.
Fund | 2004A | 2003 A, B |
Fidelity Canada Fund | $0 | $0 |
Fidelity China Region Fund | $0 | $0 |
Fidelity Emerging Markets Fund | $0 | $0 |
Fidelity Europe Fund | $0 | $0 |
Fidelity Global Balanced Fund | $0 | $0 |
Fidelity International Discovery Fund | $0 | $0 |
Fidelity Japan Fund | $0 | $0 |
Fidelity Japan Smaller Companies Fund | $0 | $0 |
Fidelity Latin America Fund | $0 | $0 |
Fidelity Nordic Fund | $0 | $0 |
Fidelity Overseas Fund | $0 | $0 |
Fidelity Pacific Basin Fund | $0 | $0 |
Fidelity Southeast Asia Fund | $0 | $0 |
A | Aggregate amounts may reflect rounding. |
B | Includes amounts related to non-audit services prior to May 6, 2003 that would have been subject to pre-approval if the SEC rules relating to the pre-approval of non-audit services had been in effect at that time. |
In each of the fiscal years ended October 31, 2004 and October 31, 2003, the aggregate Audit-Related Fees billed by Deloitte Entities for services rendered for assurance and related services to each fund that are reasonably related to the performance of the audit or review of the fund's financial statements, but not reported as Audit Fees, are shown in the table below.
Fund | 2004A | 2003 A, B |
Fidelity Aggressive International Fund | $0 | $0 |
Fidelity Diversified International Fund | $0 | $0 |
Fidelity Europe Capital Appreciation Fund | $0 | $0 |
Fidelity International Small Cap Fund | $0 | $0 |
Fidelity Worldwide Fund | $0 | $0 |
A | Aggregate amounts may reflect rounding. |
B | Includes amounts related to non-audit services prior to May 6, 2003 that would have been subject to pre-approval if the SEC rules relating to the pre-approval of non-audit services had been in effect at that time. |
In each of the fiscal years ended October 31, 2004 and October 31, 2003, the aggregate Audit-Related Fees that were billed by PwC and Deloitte Entities that were required to be approved by the Audit Committee for services rendered on behalf of Fidelity Management & Research Company (FMR) and entities controlling, controlled by, or under common control with FMR (not including any sub-adviser whose role is primarily portfolio management and is subcontracted with or overseen by another investment adviser) that provide ongoing services to the funds ("Fund Service Providers") for assurance and related services that relate directly to the operations and financial reporting of each fund that are reasonably related to the performance of the audit or review of the fund's financial statements, but not reported as Audit Fees, are shown in the table below.
Billed By | 2004 A | 2003A, B |
PwC | $0 | $50,000 |
Deloitte Entities | $0 | $0 |
A | Aggregate amounts may reflect rounding. |
B | Includes amounts related to non-audit services prior to May 6, 2003 that would have been subject to pre-approval if the SEC rules relating to the pre-approval of non-audit services had been in effect at that time. |
Fees included in the audit-related category comprise assurance and related services (e.g., due diligence services) that are traditionally performed by the independent registered public accounting firm. These audit-related services include due diligence related to mergers and acquisitions, accounting consultations and audits in connection with acquisitions, internal control reviews, attest services that are not required by statute or regulation and consultation concerning financial accounting and reporting standards.
(c) Tax Fees.
In each of the fiscal years ended October 31, 2004 and October 31, 2003, the aggregate Tax Fees billed by PwC for professional services rendered for tax compliance, tax advice, and tax planning for each fund is shown in the table below.
Fund | 2004A | 2003A, B |
Fidelity Canada Fund | $4,000 | $3,700 |
Fidelity China Region Fund | $4,000 | $3,700 |
Fidelity Emerging Markets Fund | $4,000 | $3,700 |
Fidelity Europe Fund | $4,000 | $3,700 |
Fidelity Global Balanced Fund | $4,000 | $3,700 |
Fidelity International Discovery Fund | $4,000 | $3,700 |
Fidelity Japan Fund | $4,000 | $3,700 |
Fidelity Japan Smaller Companies Fund | $4,000 | $3,700 |
Fidelity Latin America Fund | $4,000 | $3,700 |
Fidelity Nordic Fund | $4,000 | $3,700 |
Fidelity Overseas Fund | $4,000 | $3,700 |
Fidelity Pacific Basin Fund | $4,000 | $3,700 |
Fidelity Southeast Asia Fund | $4,000 | $3,700 |
A | Aggregate amounts may reflect rounding. |
B | Includes amounts related to non-audit services prior to May 6, 2003 that would have been subject to pre-approval if the SEC rules relating to the pre-approval of non-audit services had been in effect at that time. |
In each of the fiscal years ended October 31, 2004 and October 31, 2003, the aggregate Tax Fees billed by Deloitte Entities for professional services rendered for tax compliance, tax advice, and tax planning for each fund is shown in the table below.
Fund | 2004A | 2003A, B |
Fidelity Aggressive International Fund | $3,900 | $3,600 |
Fidelity Diversified International Fund | $4,000 | $3,800 |
Fidelity Europe Capital Appreciation Fund | $4,000 | $3,800 |
Fidelity International Small Cap Fund | $3,600 | $3,300 |
Fidelity Worldwide Fund | $4,000 | $3,800 |
A | Aggregate amounts may reflect rounding. |
B | Includes amounts related to non-audit services prior to May 6, 2003 that would have been subject to pre-approval if the SEC rules relating to the pre-approval of non-audit services had been in effect at that time. |
In each of the fiscal years ended October 31, 2004 and October 31, 2003, the aggregate Tax Fees billed by PwC and Deloitte Entities that were required to be approved by the Audit Committee for professional services rendered on behalf of the Fund Service Providers for tax compliance, tax advice, and tax planning that relate directly to the operations and financial reporting of each fund is shown in the table below.
Billed By | 2004A | 2003A, B |
PwC | $0 | $0 |
Deloitte Entities | $0 | $0 |
A | Aggregate amounts may reflect rounding. |
B | Includes amounts related to non-audit services prior to May 6, 2003 that would have been subject to pre-approval if the SEC rules relating to the pre-approval of non-audit services had been in effect at that time. |
Fees included in the Tax Fees category comprise all services performed by professional staff in the independent registered public accounting firm's tax division except those services related to the audit. Typically, this category would include fees for tax compliance, tax planning, and tax advice. Tax compliance, tax advice, and tax planning services include preparation of original and amended tax returns, claims for refund and tax payment-planning services, assistance with tax audits and appeals, tax advice related to mergers and acquisitions and requests for rulings or technical advice from taxing authorities.
(d) All Other Fees.
In each of the fiscal years ended October 31, 2004 and October 31, 2003, the aggregate Other Fees billed by PwC for all other non-audit services rendered to the funds is shown in the table below.
Fund | 2004A | 2003A, B |
Fidelity Canada Fund | $1,500 | $1,400 |
Fidelity China Region Fund | $1,500 | $1,500 |
Fidelity Emerging Markets Fund | $1,700 | $1,600 |
Fidelity Europe Fund | $2,600 | $2,400 |
Fidelity Global Balanced Fund | $1,400 | $1,400 |
Fidelity International Discovery Fund | $2,700 | $2,300 |
Fidelity Japan Fund | $1,800 | $1,700 |
Fidelity Japan Smaller Companies Fund | $2,200 | $1,700 |
Fidelity Latin America Fund | $1,500 | $1,500 |
Fidelity Nordic Fund | $1,300 | $1,400 |
Fidelity Overseas Fund | $4,700 | $4,400 |
Fidelity Pacific Basin Fund | $1,600 | $1,700 |
Fidelity Southeast Asia Fund | $1,600 | $1,600 |
A | Aggregate amounts may reflect rounding. |
B | Includes amounts related to non-audit services prior to May 6, 2003 that would have been subject to pre-approval if the SEC rules relating to the pre-approval of non-audit services had been in effect at that time. |
In each of the fiscal years ended October 31, 2004 and October 31, 2003, the aggregate Other Fees billed by Deloitte Entities for all other non-audit services rendered to the funds is shown in the table below.
Fund | 2004A | 2003A, B |
Fidelity Aggressive International Fund | $0 | $0 |
Fidelity Diversified International Fund | $0 | $0 |
Fidelity Europe Capital Appreciation Fund | $0 | $0 |
Fidelity International Small Cap Fund | $0 | $0 |
Fidelity Worldwide Fund | $0 | $0 |
A | Aggregate amounts may reflect rounding. |
B | Includes amounts related to non-audit services prior to May 6, 2003 that would have been subject to pre-approval if the SEC rules relating to the pre-approval of non-audit services had been in effect at that time. |
In each of the fiscal years ended October 31, 2004 and October 31, 2003, the aggregate Other Fees billed by PwC and Deloitte Entities that were required to be approved by the Audit Committee for all other non-audit services rendered on behalf of the Fund Service Providers that relate directly to the operations and financial reporting of each fund is shown in the table below.
Billed By | 2004A | 2003A, B |
PwC | $300,000 | $300,000 |
Deloitte Entities | $720,000 | $130,000 |
A | Aggregate amounts may reflect rounding. |
B | Includes amounts related to non-audit services prior to May 6, 2003 that would have been subject to pre-approval if the SEC rules relating to the pre-approval of non-audit services had been in effect at that time. |
Fees included in the All Other Fees category include services related to internal control reviews, strategy and other consulting, financial information systems design and implementation, consulting on other information systems, and other tax services unrelated to the fund.
(e) (1) | Audit Committee Pre-Approval Policies and Procedures: |
The trust's Audit Committee must pre-approve all audit and non-audit services provided by the independent registered accounting firm relating to the operations or financial reporting of the funds. Prior to the commencement of any audit or non-audit services to a fund, the Audit Committee reviews the services to determine whether they are appropriate and permissible under applicable law.
The trust's Audit Committee has adopted policies and procedures to, among other purposes, provide a framework for the Committee's consideration of non-audit services by the audit firms that audit the Fidelity funds. The policies and procedures require that any non-audit service provided by a fund audit firm to a Fidelity Fund and any non-audit service provided by a fund auditor to a Fund Service Provider that relates directly to the operations and financial reporting of a Fidelity fund (Covered Service) are subject to approval by the Audit Committee before such service is provided. Non-audit services provided by a fund audit firm for a Fund Service Provider that do not relate directly to the operations and financial reporting of a Fidelity fund (Non-Covered Service) but that are expected to exceed $50,000 are also subject to pre-approval by the Audit Committee.
All Covered Services, as well as Non-Covered Services that are expected to exceed $50,000, must be approved in advance of provision of the service either: (i) by formal resolution of the Audit Committee, or (ii) by oral or written approval of the service by the Chair of the Audit Committee (or if the Chair is unavailable, such other member of the Audit Committee as may be designated by the Chair to act in the Chair's absence). The approval contemplated by (ii) above is permitted where the Treasurer determines that action on such an engagement is necessary before the next meeting of the Audit Committee. Neither pre-approval nor advance notice of Non-Covered Service engagements for which fees are not expected to exceed $50,000 is required; such engagements are to be reported to the Audit Committee monthly.
(e) (2) | Services approved pursuant to paragraph (c)(7)(i)(C) of Rule 2-01 of Regulation S-X: |
Audit-Related Fees:
There were no amounts, including amounts related to non-audit services prior to May 6, 2003 that would have been subject to pre-approval if the SEC rules relating to the pre-approval of non-audit services had been in effect at that time, that were approved by the Audit Committee pursuant to the de minimis exception for the fiscal years ended October 31, 2004 and October 31, 2003 on behalf of each fund.
There were no amounts, including amounts related to non-audit services prior to May 6, 2003 that would have been subject to pre-approval if the SEC rules relating to the pre-approval of non-audit services had been in effect at that time, that were required to be approved by the Audit Committee pursuant to the de minimis exception for the fiscal years ended October 31, 2004 and October 31, 2003 on behalf of the Fund Service Providers that relate directly to the operations and financial reporting of each fund.
Tax Fees:
There were no amounts, including amounts related to non-audit services prior to May 6, 2003 that would have been subject to pre-approval if the SEC rules relating to the pre-approval of non-audit services had been in effect at that time, that were approved by the Audit Committee pursuant to the de minimis exception for the fiscal years ended October 31, 2004 and October 31, 2003 on behalf of each fund.
There were no amounts, including amounts related to non-audit services prior to May 6, 2003 that would have been subject to pre-approval if the SEC rules relating to the pre-approval of non-audit services had been in effect at that time, that were required to be approved by the Audit Committee pursuant to the de minimis exception for the fiscal years ended October 31, 2004 and October 31, 2003 on behalf of the Fund Service Providers that relate directly to the operations and financial reporting of each fund.
All Other Fees:
There were no amounts, including amounts related to non-audit services prior to May 6, 2003 that would have been subject to pre-approval if the SEC rules relating to the pre-approval of non-audit services had been in effect at that time, that were approved by the Audit Committee pursuant to the de minimis exception for the fiscal years ended October 31, 2004 and October 31, 2003 on behalf of each fund.
There were no amounts, including amounts related to non-audit services prior to May 6, 2003 that would have been subject to pre-approval if the SEC rules relating to the pre-approval of non-audit services had been in effect at that time, that were required to be approved by the Audit Committee pursuant to the de minimis exception for the fiscal years ended October 31, 2004 and October 31, 2003 on behalf of the Fund Service Providers that relate directly to the operations and financial reporting of each fund.
(f) According to PwC for the fiscal year ended October 31, 2004, the percentage of hours spent on the audit of each fund's financial statements for the most recent fiscal year that were attributed to work performed by persons who are not full-time, permanent employees of PwC is as follows:
Fund | 2004 |
Fidelity Canada Fund | 0% |
Fidelity China Region Fund | 0% |
Fidelity Emerging Markets Fund | 0% |
Fidelity Europe Fund | 0% |
Fidelity Global Balanced Fund | 0% |
Fidelity International Discovery Fund | 0% |
Fidelity Japan Fund | 0% |
Fidelity Japan Smaller Companies Fund | 0% |
Fidelity Latin America Fund | 0% |
Fidelity Nordic Fund | 0% |
Fidelity Overseas Fund | 0% |
Fidelity Pacific Basin Fund | 0% |
Fidelity Southeast Asia Fund | 0% |
According to Deloitte Entities for the fiscal year ended October 31, 2004, the percentage of hours spent on the audit of the fund's financial statements for the most recent fiscal year that were attributed to work performed by persons who are not full-time, permanent employees of Deloitte Entities is as follows:
Fund | 2004 |
Fidelity Aggressive International Fund | 0% |
Fidelity Diversified International Fund | 0% |
Fidelity Europe Capital Appreciation Fund | 0% |
Fidelity International Small Cap Fund | 0% |
Fidelity Worldwide Fund | 0% |
(g) For the fiscal years ended October 31, 2004 and October 31, 2003, the aggregate fees billed by PwC of $2,300,000A and $2,100,000A,B for non-audit services rendered on behalf of the funds, FMR (not including any sub-adviser whose role is primarily portfolio management and is subcontracted with or overseen by another investment adviser) and Fund Service Providers relating to Covered Services and Non-Covered Services are shown in the table below.
| 2004A | 2003A,B |
Covered Services | $350,000 | $450,000 |
Non-Covered Services | $1,950,000 | $1,650,000 |
A | Aggregate amounts may reflect rounding. |
B | Includes amounts related to non-audit services prior to May 6, 2003 that would have been subject to pre-approval if the SEC rules relating to the pre-approval of non-audit services had been in effect at that time. |
For the fiscal years ended October 31, 2004 and October 31, 2003, the aggregate fees billed by Deloitte Entities of $1,600,000A and $900,000A,B for non-audit services rendered on behalf of the fund, FMR (not including any sub-adviser whose role is primarily portfolio management and is subcontracted with or overseen by another investment adviser) and Fund Service Providers relating to Covered Services and Non-Covered Services are shown in the table below.
| 2004A | 2003A,B |
Covered Services | $700,000 | $150,000 |
Non-Covered Services | $900,000 | $750,000 |
A | Aggregate amounts may reflect rounding. |
B | Includes amounts related to non-audit services prior to May 6, 2003 that would have been subject to pre-approval if the SEC rules relating to the pre-approval of non-audit services had been in effect at that time. |
(h) The trust's Audit Committee has considered Non-Covered Services that were not pre-approved that were provided by PwC and Deloitte Entities to Fund Service Providers to be compatible with maintaining the independence of PwC and Deloitte Entities in their audit of the funds, taking into account representations from PwC and Deloitte Entities, in accordance with Independence Standards Board Standard No.1, regarding their independence from the funds and their related entities.
Item 5. Audit Committee of Listed Registrants
Not applicable.
Item 6. Schedule of Investments
Not applicable.
Item 7. Disclosure of Proxy Voting Policies and Procedures for Closed-End Management Investment Companies
Not applicable.
Item 8. Purchase of Equity Securities by Closed-End Management Investment Company and Affiliated Purchasers
Not applicable.
Item 9. Submission of Matters to a Vote of Security Holders
There were no material changes to the procedures by which shareholders may recommend nominees to the trust's Board of Trustees.
Item 10. Controls and Procedures
(a)(i) The President and Treasurer and the Chief Financial Officer have concluded that the trust's disclosure controls and procedures (as defined in Rule 30a-3(c) under the Investment Company Act) provide reasonable assurances that material information relating to the trust is made known to them by the appropriate persons, based on their evaluation of these controls and procedures as of a date within 90 days of the filing date of this report.
(a)(ii) There was no change in the trust's internal control over financial reporting (as defined in Rule 30a-3(d) under the Investment Company Act) that occurred during the second fiscal quarter of the period covered by this report that has materially affected, or is reasonably likely to materially affect, the trust's internal control over financial reporting.
Item 11. Exhibits
(a) | (1) | Code of Ethics pursuant to Item 2 of Form N-CSR is filed and attached hereto as EX-99.CODE ETH. |
(a) | (2) | Certification pursuant to Rule 30a-2(a) under the Investment Company Act of 1940 (17 CFR 270.30a-2(a)) is filed and attached hereto as Exhibit 99.CERT. |
(a) | (3) | Not applicable. |
(b) | | Certification pursuant to Rule 30a-2(b) under the Investment Company Act of 1940 (17 CFR 270.30a-2(b)) is furnished and attached hereto as Exhibit 99.906CERT. |
SIGNATURES
Pursuant to the requirements of the Securities Exchange Act of 1934 and the Investment Company Act of 1940, the registrant has duly caused this report to be signed on its behalf by the undersigned, thereunto duly authorized.
Fidelity Investment Trust
By: | /s/John Hebble |
| John Hebble |
| President and Treasurer |
| |
Date: | December 20, 2004 |
Pursuant to the requirements of the Securities Exchange Act of 1934 and the Investment Company Act of 1940, this report has been signed below by the following persons on behalf of the registrant and in the capacities and on the dates indicated.
By: | /s/John Hebble |
| John Hebble |
| President and Treasurer |
| |
Date: | December 20, 2004 |
By: | /s/Timothy F. Hayes |
| Timothy F. Hayes |
| Chief Financial Officer |
| |
Date: | December 20, 2004 |