UNITED STATES
SECURITIES AND EXCHANGE COMMISSION
Washington, D.C. 20549
FORM N-CSR
CERTIFIED SHAREHOLDER REPORT OF REGISTERED
MANAGEMENT INVESTMENT COMPANIES
Investment Company Act file number 811-4008
Fidelity Investment Trust
(Exact name of registrant as specified in charter)
82 Devonshire St., Boston, Massachusetts 02109
(Address of principal executive offices) (Zip code)
Eric D. Roiter, Secretary
82 Devonshire St.
Boston, Massachusetts 02109
(Name and address of agent for service)
Registrant's telephone number, including area code: 617-563-7000
Date of fiscal year end: | October 31 |
| |
Date of reporting period: | October 31, 2006 |
Item 1. Reports to Stockholders
Fidelity®
International Discovery
Fund
Annual Report
October 31, 2006
(2_fidelity_logos) (Registered_Trademark)
Contents
Chairman's Message | 4 | Ned Johnson's message to shareholders. |
Performance | 5 | How the fund has done over time. |
Management's Discussion | 6 | The manager's review of fund performance, strategy and outlook. |
Shareholder Expense Example | 7 | An example of shareholder expenses. |
Investment Changes | 9 | A summary of major shifts in the fund's investments over the past six months. |
Investments | 11 | A complete list of the fund's investments with their market values. |
Financial Statements | 23 | Statements of assets and liabilities, operations, and changes in net assets,
as well as financial highlights. |
Notes | 33 | Notes to the financial statements. |
Report of Independent Registered Public Accounting Firm | 44 | |
Trustees and Officers | 45 | |
Distributions | 56 | |
Board Approval of Investment Advisory Contracts and Management Fees | 57 | |
To view a fund's proxy voting guidelines and proxy voting record for the 12-month period ended June 30, visit www.fidelity.com/proxyvotingresults or visit the Securities and Exchange Commission's (SEC) web site at www.sec.gov. You may also call 1-800-544-8544 to request a free copy of the proxy voting guidelines.
Standard & Poor's, S&P and S&P 500 are registered service marks of The McGraw-Hill Companies, Inc. and have been licensed for use by Fidelity Distributors Corporation.
Other third party marks appearing herein are the property of their respective owners.
All other marks appearing herein are registered or unregistered trademarks or service marks of FMR Corp. or an affiliated company.
Annual Report
This report and the financial statements contained herein are submitted for the general information of the shareholders of the fund. This report is not authorized for distribution to prospective investors in the fund unless preceded or accompanied by an effective prospectus.
A fund files its complete schedule of portfolio holdings with the SEC for the first and third quarters of each fiscal year on Form N-Q. Forms N-Q are available on the SEC's web site at http://www.sec.gov. A fund's Forms N-Q may be reviewed and copied at the SEC's Public Reference Room in Washington, DC. Information regarding the operation of the SEC's Public Reference Room may be obtained by calling 1-800-SEC-0330. For a complete list of a fund's portfolio holdings, view the most recent quarterly holdings report, semiannual report, or annual report on Fidelity's web site at http://www.fidelity.com/holdings.
NOT FDIC INSURED · MAY LOSE VALUE · NO BANK GUARANTEE
Neither the fund nor Fidelity Distributors Corporation is a bank.
Annual Report
Chairman's Message
(photo_of_Edward_C_Johnson_3d)
Dear Shareholder:
Stock and bond markets around the world have seen largely positive results year to date, although weakness in the technology sector and growth stocks in general have tempered performance. While financial markets are always unpredictable, there are a number of time-tested principles that can put the historical odds in your favor.
One of the basic tenets is to invest for the long term. Over time, riding out the markets' inevitable ups and downs has proven much more effective than selling into panic or chasing the hottest trend. Even missing only a few of the markets' best days can significantly diminish investor returns. Patience also affords the benefits of compounding - of earning interest on additional income or reinvested dividends and capital gains. There are tax advantages and cost benefits to consider as well. The more you sell, the more taxes you pay, and the more you trade, the higher the costs. While staying the course doesn't eliminate risk, it can considerably lessen the effect of short-term declines.
You can further manage your investing risk through diversification. And today, more than ever, geographic diversification should be taken into account. Studies indicate that asset allocation is the single most important determinant of a portfolio's long-term success. The right mix of stocks, bonds and cash - aligned to your particular risk tolerance and investment objective - is very important. Age-appropriate rebalancing is also an essential aspect of asset allocation. For younger investors, an emphasis on equities - which historically have been the best performing asset class over time - is encouraged. As investors near their specific goal, such as retirement or sending a child to college, consideration may be given to replacing volatile assets (e.g. common stocks) with more-stable fixed investments (bonds or savings plans).
A third investment principle - investing regularly - can help lower the average cost of your purchases. Investing a certain amount of money each month or quarter helps ensure you won't pay for all your shares at market highs. This strategy - known as dollar cost averaging - also reduces unconstructive "emotion" from investing, helping shareholders avoid selling weak performers just prior to an upswing, or chasing a hot performer just before a correction.
We invite you to contact us via the Internet, through our Investor Centers or over the phone. It is our privilege to provide you the information you need to make the investments that are right for you.
Sincerely,
/s/Edward C. Johnson 3d
Edward C. Johnson 3d
Annual Report
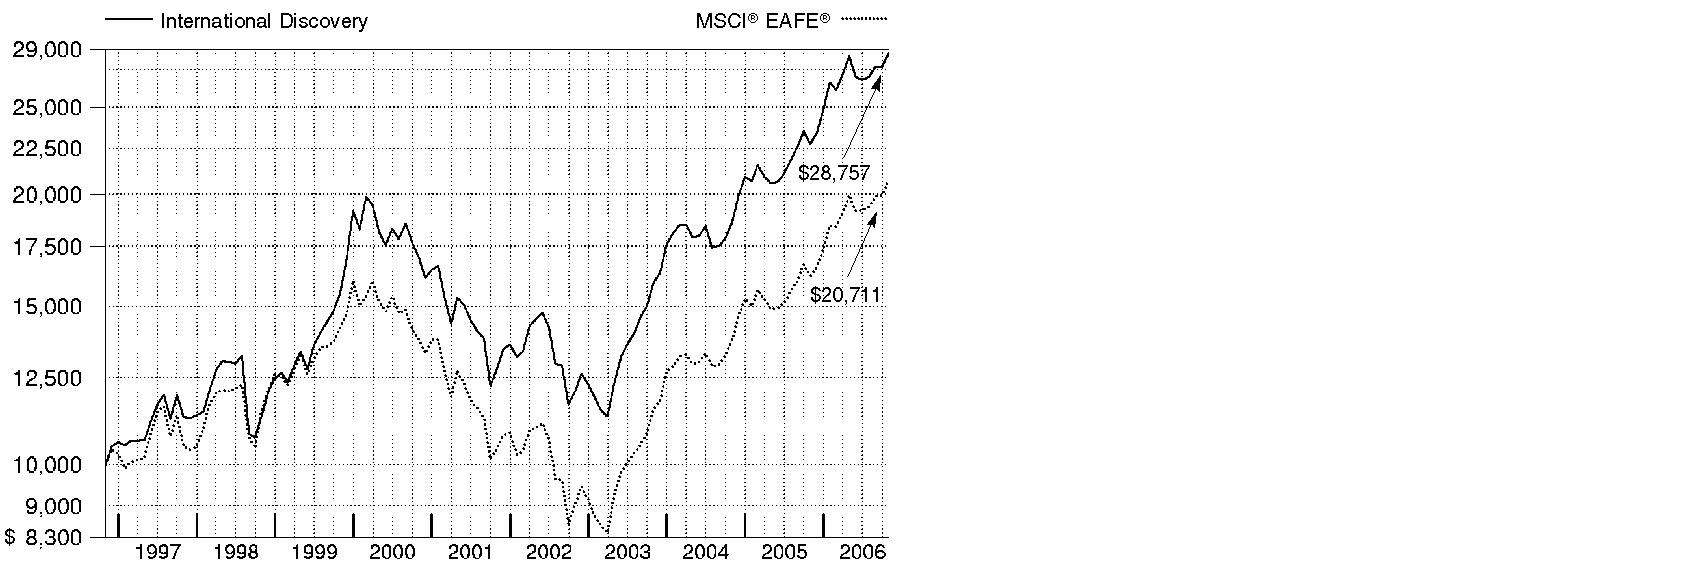
Performance: The Bottom Line
Average annual total return reflects the change in the value of an investment, assuming reinvestment of International Discovery's dividend income and capital gains (the profits earned upon the sale of securities that have grown in value) and assuming a constant rate of performance each year. The $10,000 table and the fund's returns do not reflect the deduction of taxes that a shareholder would pay on fund distributions or the redemption of fund shares. During periods of reimbursement by Fidelity, a fund's total return will be greater than it would be had the reimbursement not occurred. How a fund did yesterday is no guarantee of how it will do tomorrow.
Average Annual Total Returns
Periods ended October 31, 2006 | Past 1
year | Past 5
years | Past 10
years |
International Discovery A | 26.34% | 17.61% | 11.14% |
A Prior to October 1, 2004, International Discovery Fund operated under certain different investment policies. Accordingly, the fund's historical performance may not represent its current investment policies.
$10,000 Over 10 Years
Let's say hypothetically that $10,000 was invested in International Discovery on October 31, 1996. The chart shows how the value of your investment would have changed, and also shows how the Morgan Stanley Capital InternationalSM Europe, Australasia, Far East (MSCI® EAFE)® Index performed over the same period.
Annual Report
Management's Discussion of Fund Performance
Comments from William Kennedy, Portfolio Manager of Fidelity® International Discovery Fund
International equity markets as a whole outpaced their U.S. counterparts for the 12 months ending October 31, 2006 - partly as a result of favorable currency exchanges that boosted returns for U.S. investors. The Morgan Stanley Capital InternationalSM Europe, Australasia, Far East (MSCI® EAFE®) Index - a gauge of developed stock markets outside the United States and Canada - gained 27.72% during that time. European markets benefited from solid corporate profit growth and attractive dividends, which helped the MSCI Europe index advance 31.95%. Strong performing Latin American and Asian emerging markets drove the MSCI Emerging Markets index to a lofty 35.42% return. Japan was somewhat of an exception to the generally stellar foreign market performance after struggling in the middle part of the period. Still, its earlier gains helped the Tokyo Stock Exchange Stock Price Index (TOPIX) - a benchmark of the largest and better-established stocks traded on the Tokyo Stock Exchange - rise 12.47% overall. Natural-resources-rich Canada also struggled over the final six months as energy prices fell, but the S&P/TSX Composite Index managed a 12-month return of 28.21%.
For the 12 months ending October 31, 2006, International Discovery returned 26.34%, modestly trailing the MSCI EAFE index. Strong stock picking, especially in the technology and consumer staples sectors, as well as favorable country selection aided returns versus the index. The benefit from country selection was partially offset by currency fluctuations, though. The fund's underweighting in materials and overweighting in the consumer discretionary sector hampered returns, as did weak stock picking in financials. On a regional basis, the fund benefited from investments in Japan and emerging markets, but lost ground in Europe. Top contributors to performance relative to the MSCI index included C&C Group, an Irish beverage company, and Sumco, a Japanese semiconductor wafer manufacturer. C&C rallied after reinventing a traditional pub cider drink as a premium product, while Sumco climbed as a wafer shortage drove up industry pricing. The fund had overweightings on average in both names. On the downside, an overweighted position in Sompo Japan Insurance hampered performance amid a slowdown in the Japanese equity market. Not owning Endesa, a Spanish utility stock in the index that benefited from a bidding war, also detracted from relative returns.
The views expressed in this statement reflect those of the portfolio manager only through the end of the period of the report as stated on the cover and do not necessarily represent the views of Fidelity or any other person in the Fidelity organization. Any such views are subject to change at any time based upon market or other conditions and Fidelity disclaims any responsibility to update such views. These views may not be relied on as investment advice and, because investment decisions for a Fidelity fund are based on numerous factors, may not be relied on as an indication of trading intent on behalf of any Fidelity fund.
Annual Report
Shareholder Expense Example
As a shareholder of the Fund, you incur two types of costs: (1) transaction costs, including sales charges (loads) on purchase payments or redemption proceeds, redemption fees, and (2) ongoing costs, including management fees, distribution and/or service (12b-1) fees and other Fund expenses. This Example is intended to help you understand your ongoing costs (in dollars) of investing in the Fund and to compare these costs with the ongoing costs of investing in other mutual funds.
The Example is based on an investment of $1,000 invested at the beginning of the period and held for the entire period (May 1, 2006 to October 31, 2006).
Actual Expenses
The first line of the accompanying table for each class of the Fund provides information about actual account values and actual expenses. You may use the information in this line, together with the amount you invested, to estimate the expenses that you paid over the period. Simply divide your account value by $1,000.00 (for example, an $8,600 account value divided by $1,000.00 = 8.6), then multiply the result by the number in the first line for a class of the Fund under the heading entitled "Expenses Paid During Period" to estimate the expenses you paid on your account during this period. A small balance maintenance fee of $12.00 that is charged once a year may apply for certain accounts with a value of less than $2,000. This fee is not included in the table below. If it was, the estimate of expenses you paid during the period would be higher, and your ending account value lower, by this amount.
Hypothetical Example for Comparison Purposes
The second line of the accompanying table for each class of the Fund provides information about hypothetical account values and hypothetical expenses based on a Class' actual expense ratio and an assumed rate of return of 5% per year before expenses, which is not the Class' actual return. The hypothetical account values and expenses may not be used to estimate the actual ending account balance or expenses you paid for the period. You may use this information to compare the ongoing costs of investing in the Fund and other funds. To do so, compare this 5% hypothetical example with the 5% hypothetical examples that appear in the shareholder reports of the other funds. A small balance maintenance fee of $12.00 that is charged once a year may apply for certain accounts with a value of less than $2,000. This fee is not included in the table below. If it was, the estimate of expenses you paid during the period would be higher, and your ending account value lower, by this amount.
Annual Report
Shareholder Expense Example - continued
Please note that the expenses shown in the table are meant to highlight your ongoing costs only and do not reflect any transaction costs. Therefore, the second line of the table is useful in comparing ongoing costs only, and will not help you determine the relative total costs of owning different funds. In addition, if these transactional costs were included, your costs would have been higher.
| Beginning
Account Value
May 1, 2006 | Ending
Account Value
October 31, 2006 | Expenses Paid
During Period*
May 1, 2006
to October 31, 2006 |
Class A | | | |
Actual | $ 1,000.00 | $ 1,009.10 | $ 6.38 |
HypotheticalA | $ 1,000.00 | $ 1,018.85 | $ 6.41 |
Class T | | | |
Actual | $ 1,000.00 | $ 1,006.70 | $ 8.65 |
HypotheticalA | $ 1,000.00 | $ 1,016.59 | $ 8.69 |
Class B | | | |
Actual | $ 1,000.00 | $ 1,004.20 | $ 11.37 |
HypotheticalA | $ 1,000.00 | $ 1,013.86 | $ 11.42 |
Class C | | | |
Actual | $ 1,000.00 | $ 1,004.40 | $ 11.06 |
HypotheticalA | $ 1,000.00 | $ 1,014.17 | $ 11.12 |
International Discovery | | | |
Actual | $ 1,000.00 | $ 1,009.90 | $ 5.37 |
HypotheticalA | $ 1,000.00 | $ 1,019.86 | $ 5.40 |
Institutional Class | | | |
Actual | $ 1,000.00 | $ 1,010.20 | $ 4.91 |
HypotheticalA | $ 1,000.00 | $ 1,020.32 | $ 4.94 |
A 5% return per year before expenses
* Expenses are equal to each Class' annualized expense ratio (shown in the table below); multiplied by the average account value over the period, multiplied by 184/365 (to reflect the one-half year period).
| Annualized
Expense Ratio |
Class A | 1.26% |
Class T | 1.71% |
Class B | 2.25% |
Class C | 2.19% |
International Discovery | 1.06% |
Institutional Class | .97% |
Annual Report
Investment Changes
Geographic Diversification (% of fund's net assets) |
As of October 31, 2006 |
 | Japan 19.1% |
 | United Kingdom 16.5% |
 | France 12.3% |
 | Germany 10.2% |
 | Switzerland 9.5% |
 | Australia 5.5% |
 | Italy 3.6% |
 | United States of America 3.3% |
 | Spain 3.2% |
 | Other 16.8% |

Percentages are adjusted for the effect of futures contracts, if applicable. |
|
As of April 30, 2006 |
| Japan 21.7% |
| United Kingdom 13.7% |
| France 11.1% |
| Germany 10.0% |
| Switzerland 8.5% |
| Australia 3.8% |
| United States of America 3.5% |
| Italy 3.2% |
| Korea (South) 2.6% |
| Other 21.9% |

Percentages are adjusted for the effect of futures contracts, if applicable. |
Asset Allocation |
| % of fund's
net assets | % of fund's net assets
6 months ago |
Stocks and Equity Futures | 97.1 | 97.3 |
Short-Term Investments and Net Other Assets | 2.9 | 2.7 |
Top Ten Stocks as of October 31, 2006 |
| % of fund's
net assets | % of fund's net assets
6 months ago |
Roche Holding AG (participation certificate) (Switzerland, Pharmaceuticals) | 1.5 | 1.3 |
UBS AG (NY Shares) (Switzerland, Capital Markets) | 1.4 | 1.1 |
Novartis AG (Reg.) (Switzerland, Pharmaceuticals) | 1.4 | 1.2 |
BP PLC sponsored ADR (United Kingdom, Oil, Gas & Consumable Fuels) | 1.3 | 1.4 |
Toyota Motor Corp. (Japan, Automobiles) | 1.3 | 1.3 |
Total SA Series B (France, Oil, Gas & Consumable Fuels) | 1.2 | 1.4 |
E.ON AG (Germany, Electric Utilities) | 1.1 | 1.1 |
Nestle SA (Reg.) (Switzerland, Food Products) | 1.1 | 0.8 |
Allianz AG (Reg.) (Germany, Insurance) | 1.1 | 1.0 |
Mizuho Financial Group, Inc. (Japan, Commercial Banks) | 1.1 | 0.8 |
| 12.5 | |
Market Sectors as of October 31, 2006 |
| % of fund's
net assets | % of fund's net assets
6 months ago |
Financials | 27.5 | 25.7 |
Consumer Discretionary | 15.8 | 15.5 |
Consumer Staples | 9.6 | 5.7 |
Industrials | 8.3 | 11.3 |
Health Care | 8.1 | 7.5 |
Information Technology | 7.4 | 9.3 |
Energy | 6.6 | 8.7 |
Utilities | 5.2 | 4.2 |
Materials | 4.5 | 5.9 |
Telecommunication Services | 2.7 | 2.1 |
Annual Report
Investments October 31, 2006
Showing Percentage of Net Assets
Common Stocks - 94.5% |
| Shares | | Value (Note 1) (000s) |
Australia - 5.5% |
AMP Ltd. | 2,219,300 | | $ 16,322 |
Australia & New Zealand Banking Group Ltd. | 871,800 | | 19,599 |
AXA Asia Pacific Holdings Ltd. | 3,932,100 | | 20,273 |
Babcock & Brown Japan Property Trust | 8,156,000 | | 12,218 |
BHP Billiton Ltd. | 2,255,700 | | 48,013 |
Billabong International Ltd. | 2,162,828 | | 26,254 |
Brambles Industries Ltd. | 2,096,000 | | 20,250 |
Cochlear Ltd. | 284,000 | | 12,240 |
Commonwealth Bank of Australia | 296,000 | | 10,930 |
Computershare Ltd. | 3,151,800 | | 18,788 |
CSL Ltd. | 1,304,950 | | 56,664 |
Downer EDI Ltd. | 48,361 | | 241 |
Fosters Group Ltd. | 4,060,500 | | 20,275 |
Macquarie Airports unit | 2,141,930 | | 5,323 |
Macquarie Bank Ltd. | 420,000 | | 24,239 |
Macquarie Communications Infrastructure Group unit | 1,632,940 | | 7,737 |
Macquarie Infrastructure Group unit | 1,750,121 | | 4,579 |
Mortgage Choice Ltd. | 2,899,300 | | 6,015 |
Multiplex Group unit | 6,100,300 | | 17,379 |
National Australia Bank Ltd. | 1,216,500 | | 35,814 |
QBE Insurance Group Ltd. | 1,230,667 | | 23,532 |
Seek Ltd. | 2,000,000 | | 8,237 |
Transurban Group unit | 989,403 | | 5,530 |
Woolworths Ltd. | 2,266,939 | | 36,310 |
TOTAL AUSTRALIA | | 456,762 |
Austria - 0.7% |
Austriamicrosystems AG (a) | 111,000 | | 7,057 |
Oesterreichische Elektrizitaetswirtschafts AG (Verbund) | 380,400 | | 18,990 |
OMV AG | 379,500 | | 20,630 |
Telekom Austria AG | 472,700 | | 11,765 |
TOTAL AUSTRIA | | 58,442 |
Belgium - 0.3% |
Almancora SCA (Certificaten Van Aandelen) | 185,500 | | 24,459 |
Bermuda - 0.1% |
Catlin Group Ltd. | 486,300 | | 4,645 |
Ports Design Ltd. | 4,460,500 | | 7,754 |
TOTAL BERMUDA | | 12,399 |
Common Stocks - continued |
| Shares | | Value (Note 1) (000s) |
Brazil - 0.1% |
Banco Nossa Caixa SA | 256,500 | | $ 6,106 |
CSU Cardsystem SA sponsored ADR (e) | 158,000 | | 2,745 |
TOTAL BRAZIL | | 8,851 |
Canada - 0.2% |
Potash Corp. of Saskatchewan, Inc. | 112,200 | | 14,014 |
Cayman Islands - 0.6% |
DSND, Inc. (a)(d) | 791,800 | | 14,354 |
Foxconn International Holdings Ltd. (a) | 9,433,300 | | 31,355 |
Xinao Gas Holdings Ltd. | 5,392,000 | | 5,429 |
TOTAL CAYMAN ISLANDS | | 51,138 |
China - 0.5% |
Bank of China Ltd. (H Shares) | 10,737,000 | | 4,625 |
China Life Insurance Co. Ltd. (H Shares) | 10,031,000 | | 21,127 |
China Merchants Bank Co. Ltd. (H Shares) (a) | 552,500 | | 862 |
China Shenhua Energy Co. Ltd. (H Shares) | 5,943,500 | | 10,455 |
Home Inns & Hotels Management, Inc. sponsored ADR | 9,100 | | 223 |
Industrial & Commercial Bank of China | 10,494,000 | | 4,696 |
TOTAL CHINA | | 41,988 |
Denmark - 0.2% |
Vestas Wind Systems AS (a) | 670,200 | | 18,879 |
Finland - 1.2% |
Citycon Oyj | 692,322 | | 3,667 |
Fortum Oyj | 1,557,000 | | 42,847 |
Nokia Corp. sponsored ADR | 2,683,300 | | 53,344 |
TOTAL FINLAND | | 99,858 |
France - 12.3% |
Alcatel SA (RFD) | 1,089,900 | | 13,842 |
Alstom SA (a) | 427,300 | | 39,433 |
April Group | 280,900 | | 12,011 |
AXA SA | 1,209,666 | | 46,112 |
BNP Paribas SA | 650,139 | | 71,490 |
Carrefour SA | 776,600 | | 47,322 |
CNP Assurances | 217,100 | | 22,847 |
Electricite de France | 318,800 | | 19,333 |
Gaz de France (d) | 802,800 | | 32,278 |
Groupe Danone | 228,600 | | 33,497 |
Icade SA | 549,889 | | 32,644 |
L'Oreal SA | 336,200 | | 32,699 |
Common Stocks - continued |
| Shares | | Value (Note 1) (000s) |
France - continued |
Louis Vuitton Moet Hennessy (LVMH) | 338,000 | | $ 35,226 |
Neopost SA | 356,900 | | 43,641 |
Nexity | 362,750 | | 25,003 |
Orpea (a)(d) | 279,164 | | 23,393 |
Pernod Ricard SA | 230,900 | | 46,242 |
Pinault Printemps-Redoute SA | 160,200 | | 23,904 |
Renault SA | 541,500 | | 63,346 |
Sanofi-Aventis sponsored ADR | 482,100 | | 20,581 |
Schneider Electric SA | 197,100 | | 20,478 |
Societe Generale Series A | 366,620 | | 60,928 |
SR Teleperformance SA (d) | 475,900 | | 17,197 |
Suez SA (France) | 573,600 | | 25,669 |
Total SA Series B | 1,509,776 | | 102,876 |
Veolia Environnement | 416,100 | | 25,477 |
Vinci SA | 320,800 | | 36,136 |
Vivendi Universal SA | 1,039,400 | | 39,363 |
TOTAL FRANCE | | 1,012,968 |
Germany - 9.5% |
Allianz AG (Reg.) | 485,330 | | 90,223 |
Bayer AG sponsored ADR | 1,005,300 | | 50,456 |
Bilfinger Berger AG | 260,300 | | 16,227 |
Continental AG | 266,500 | | 29,805 |
Deutsche Bank AG | 349,400 | | 44,147 |
Deutsche Boerse AG | 243,700 | | 39,299 |
Deutsche Postbank AG | 277,100 | | 20,613 |
E.ON AG | 789,000 | | 94,988 |
Fresenius Medical Care AG | 144,900 | | 19,335 |
GFK AG | 288,897 | | 12,644 |
Hugo Boss AG | 43,200 | | 2,051 |
Hypo Real Estate Holding AG | 179,368 | | 11,276 |
KarstadtQuelle AG (a)(d) | 1,023,200 | | 24,031 |
Linde AG | 379,228 | | 37,591 |
Merck KGaA | 231,200 | | 24,376 |
MPC Muenchmeyer Petersen Capital AG | 50,500 | | 4,435 |
MTU Aero Engines Holding AG | 337,500 | | 13,850 |
Muenchener Rueckversicherungs-Gesellschaft AG (Reg.) | 311,800 | | 50,615 |
Pfleiderer AG (d) | 1,097,696 | | 29,815 |
Puma AG | 44,800 | | 15,887 |
Q-Cells AG (d) | 286,000 | | 11,317 |
RWE AG | 660,019 | | 65,231 |
SAP AG | 145,800 | | 28,950 |
Common Stocks - continued |
| Shares | | Value (Note 1) (000s) |
Germany - continued |
SGL Carbon AG (a) | 632,300 | | $ 13,849 |
SolarWorld AG (d) | 142,400 | | 7,659 |
Wincor Nixdorf AG | 173,700 | | 24,155 |
TOTAL GERMANY | | 782,825 |
Greece - 0.3% |
EFG Eurobank Ergasias SA | 374,100 | | 12,444 |
Greek Organization of Football Prognostics SA | 359,130 | | 12,826 |
TOTAL GREECE | | 25,270 |
Hong Kong - 1.3% |
BOC Hong Kong Holdings Ltd. | 3,447,000 | | 7,712 |
Chaoda Modern Agriculture (Holdings) Ltd. | 12,600,000 | | 7,631 |
China Resources Power Holdings Co. Ltd. | 4,984,000 | | 6,216 |
CNOOC Ltd. | 31,338,500 | | 26,268 |
Esprit Holdings Ltd. | 5,874,500 | | 56,878 |
TOTAL HONG KONG | | 104,705 |
India - 0.4% |
Infosys Technologies Ltd. | 711,488 | | 33,191 |
Pantaloon Retail India Ltd. | 60,499 | | 2,929 |
TOTAL INDIA | | 36,120 |
Indonesia - 0.1% |
PT Perusahaan Gas Negara Tbk Series B | 5,903,500 | | 7,387 |
Ireland - 1.2% |
AgCert International (a) | 1,462,000 | | 4,155 |
Allied Irish Banks PLC | 910,000 | | 24,881 |
C&C Group PLC | 2,070,005 | | 34,401 |
Paddy Power PLC (Ireland) | 623,197 | | 11,653 |
Ryanair Holdings PLC sponsored ADR (a) | 297,100 | | 19,852 |
TOTAL IRELAND | | 94,942 |
Israel - 0.4% |
Bank Hapoalim BM (Reg.) | 2,497,200 | | 12,445 |
Ormat Industries Ltd. | 1,771,900 | | 18,382 |
TOTAL ISRAEL | | 30,827 |
Italy - 3.1% |
Autostrade Spa | 629,100 | | 18,605 |
Banca Credit Firenze (d) | 2,548,526 | | 8,523 |
Common Stocks - continued |
| Shares | | Value (Note 1) (000s) |
Italy - continued |
ENI Spa | 288,800 | | $ 8,767 |
ENI Spa sponsored ADR (d) | 401,950 | | 24,402 |
Fiat Spa (a) | 2,195,000 | | 38,770 |
Lottomatica Spa | 869,825 | | 31,753 |
Mediobanca Spa | 391,500 | | 9,099 |
Milano Assicurazioni Spa | 1,947,700 | | 15,195 |
Pirelli & C. Real Estate Spa | 235,100 | | 15,382 |
Unicredito Italiano Spa | 10,053,500 | | 83,359 |
TOTAL ITALY | | 253,855 |
Japan - 17.7% |
Aeon Co. Ltd. | 1,796,700 | | 42,321 |
Aeon Fantasy Co. Ltd. | 19,400 | | 690 |
Aeon Mall Co. Ltd. | 396,800 | | 20,932 |
Asics Corp. | 2,315,000 | | 31,016 |
Canon, Inc. | 1,241,750 | | 66,297 |
Credit Saison Co. Ltd. | 430,600 | | 15,573 |
Daiwa House Industry Co. Ltd. | 939,000 | | 16,940 |
Daiwa Securities Group, Inc. | 3,275,000 | | 37,157 |
DCM Japan Holdings Co. Ltd. (a)(d) | 770,660 | | 8,829 |
East Japan Railway Co. | 3,017 | | 21,100 |
Fanuc Ltd. | 288,900 | | 25,071 |
Fast Retailing Co. Ltd. | 188,900 | | 17,879 |
Honda Motor Co. Ltd. | 536,700 | | 18,962 |
Hoya Corp. | 800,000 | | 30,917 |
Idemitsu Kosan Co., Ltd. | 18,200 | | 1,771 |
Japan Tobacco, Inc. | 10,045 | | 43,801 |
JSR Corp. | 718,900 | | 18,071 |
JTEKT Corp. | 659,000 | | 13,720 |
Kansai Urban Banking Corp. | 1,288,000 | | 5,682 |
Keyence Corp. | 82,600 | | 18,291 |
Kose Corp. | 175,300 | | 5,276 |
Matsushita Electric Industrial Co. Ltd. | 1,271,000 | | 26,437 |
Mitsubishi Estate Co. Ltd. | 1,508,400 | | 36,111 |
Mitsubishi UFJ Financial Group, Inc. | 3,395 | | 43,286 |
Mitsui & Co. Ltd. | 2,155,000 | | 29,425 |
Mitsui Fudosan Co. Ltd. | 1,711,000 | | 42,131 |
Mizuho Financial Group, Inc. | 11,121 | | 86,621 |
Nidec Corp. | 131,900 | | 10,093 |
Nikko Cordial Corp. | 620,000 | | 7,427 |
Nintendo Co. Ltd. | 320,900 | | 65,629 |
Nippon Electric Glass Co. Ltd. | 570,000 | | 12,281 |
Common Stocks - continued |
| Shares | | Value (Note 1) (000s) |
Japan - continued |
Nippon Oil Corp. | 1,544,000 | | $ 11,485 |
Nishimatsuya Chain Co. Ltd. | 141,800 | | 2,770 |
Nissan Motor Co. Ltd. | 1,373,400 | | 16,451 |
Nitto Denko Corp. | 307,400 | | 17,530 |
Nomura Holdings, Inc. | 433,500 | | 7,638 |
NSK Ltd. | 1,893,000 | | 15,861 |
OMC Card, Inc. | 600,100 | | 5,962 |
Omron Corp. | 555,800 | | 14,351 |
ORIX Corp. | 234,540 | | 66,075 |
Shin-Etsu Chemical Co. Ltd. | 57,600 | | 3,777 |
Sompo Japan Insurance, Inc. | 2,002,000 | | 26,634 |
Sony Corp. sponsored ADR | 741,200 | | 30,374 |
St. Marc Holdings Co. Ltd. | 83,900 | | 5,610 |
Sugi Pharmacy Co. Ltd. (d) | 546,800 | | 9,911 |
Sumco Corp. (d) | 373,900 | | 26,598 |
Sumitomo Electric Industries Ltd. | 1,786,100 | | 25,289 |
Sumitomo Metal Industries Ltd. | 4,099,000 | | 15,420 |
Sumitomo Mitsui Financial Group, Inc. | 5,877 | | 64,317 |
Sumitomo Trust & Banking Co. Ltd. | 3,570,800 | | 38,407 |
T&D Holdings, Inc. | 472,350 | | 34,530 |
Takeda Pharamaceutical Co. Ltd. | 698,600 | | 44,857 |
The Sumitomo Warehouse Co. Ltd. (d) | 338,000 | | 2,387 |
Token Corp. | 78,400 | | 5,919 |
Tokuyama Corp. | 523,000 | | 6,582 |
Tokyo Tomin Bank Ltd. | 40,700 | | 1,656 |
Toyota Motor Corp. | 1,815,800 | | 107,132 |
Valor Co. Ltd. | 147,400 | | 2,168 |
Yamada Denki Co. Ltd. | 325,600 | | 32,404 |
TOTAL JAPAN | | 1,461,832 |
Korea (South) - 1.6% |
Kookmin Bank | 258,550 | | 20,552 |
Korean Reinsurance Co. | 946,600 | | 10,699 |
KT&G Corp. | 169,400 | | 10,463 |
LG Household & Health Care Ltd. | 445,680 | | 41,151 |
NHN Corp. | 246,216 | | 24,432 |
Shinhan Financial Group Co. Ltd. | 397,520 | | 18,331 |
Shinsegae Co. Ltd. | 7,900 | | 4,553 |
TOTAL KOREA (SOUTH) | | 130,181 |
Common Stocks - continued |
| Shares | | Value (Note 1) (000s) |
Luxembourg - 0.2% |
GAGFAH SA | 35,000 | | $ 1,016 |
SES Global SA FDR | 1,085,903 | | 16,633 |
TOTAL LUXEMBOURG | | 17,649 |
Mexico - 0.5% |
America Movil SA de CV Series L sponsored ADR | 579,700 | | 24,852 |
Urbi, Desarrollos Urbanos, SA de CV (a) | 4,121,400 | | 12,631 |
TOTAL MEXICO | | 37,483 |
Netherlands - 1.7% |
ING Groep NV (Certificaten Van Aandelen) | 1,334,044 | | 59,138 |
Koninklijke KPN NV | 2,772,000 | | 37,045 |
Koninklijke Numico NV | 461,400 | | 20,630 |
Koninklijke Philips Electronics NV | 655,900 | | 22,845 |
Tele Atlas NV (Netherlands) (a) | 132,400 | | 2,483 |
TOTAL NETHERLANDS | | 142,141 |
Norway - 1.8% |
Aker Kvaerner ASA | 285,200 | | 29,669 |
DnB Nor ASA | 928,300 | | 12,157 |
Norsk Hydro ASA | 1,370,500 | | 31,727 |
ProSafe ASA | 154,600 | | 9,886 |
Renewable Energy Corp. AS (d) | 756,200 | | 12,552 |
Statoil ASA | 511,800 | | 12,939 |
Telenor ASA | 2,699,300 | | 42,637 |
TOTAL NORWAY | | 151,567 |
Portugal - 0.2% |
Energias de Portugal SA | 4,219,400 | | 18,957 |
Russia - 0.3% |
Novatek JSC GDR (e) | 66,900 | | 3,894 |
OAO Gazprom sponsored ADR | 427,000 | | 18,190 |
OAO TMK unit | 169,200 | | 4,272 |
TOTAL RUSSIA | | 26,356 |
Singapore - 0.5% |
Ascendas Real Estate Investment Trust (A-REIT) | 4,630,000 | | 6,451 |
HTL International Holdings Ltd. | 7,187,500 | | 5,446 |
Keppel Corp. Ltd. | 1,166,000 | | 11,829 |
Common Stocks - continued |
| Shares | | Value (Note 1) (000s) |
Singapore - continued |
SembCorp Marine Ltd. | 5,118,000 | | $ 11,239 |
Singapore Exchange Ltd. | 3,217,000 | | 9,295 |
TOTAL SINGAPORE | | 44,260 |
South Africa - 0.2% |
FirstRand Ltd. | 2,253,800 | | 5,896 |
Steinhoff International Holdings Ltd. | 2,419,100 | | 7,882 |
TOTAL SOUTH AFRICA | | 13,778 |
Spain - 3.2% |
Banco Bilbao Vizcaya Argentaria SA | 3,378,000 | | 81,748 |
Banco Santander Central Hispano SA | 3,660,200 | | 63,351 |
Gestevision Telecinco SA | 256,800 | | 6,749 |
Inditex SA | 1,032,600 | | 49,373 |
Telefonica SA | 3,291,100 | | 63,299 |
TOTAL SPAIN | | 264,520 |
Sweden - 0.9% |
Hennes & Mauritz AB (H&M) (B Shares) | 574,100 | | 24,761 |
Modern Times Group AB (MTG) (B Shares) | 792,100 | | 45,624 |
TOTAL SWEDEN | | 70,385 |
Switzerland - 9.5% |
ABB Ltd. sponsored ADR | 3,267,100 | | 48,745 |
Actelion Ltd. (Reg.) (a) | 156,158 | | 26,295 |
Compagnie Financiere Richemont unit | 525,208 | | 25,983 |
Credit Suisse Group sponsored ADR | 220,100 | | 13,312 |
Credit Suisse Group (Reg.) | 730,684 | | 44,192 |
Lindt & Spruengli AG (participation certificate) | 13,274 | | 28,988 |
Nestle SA (Reg.) | 264,143 | | 90,231 |
Nobel Biocare Holding AG (Switzerland) | 68,513 | | 18,751 |
Novartis AG (Reg.) | 1,871,819 | | 113,676 |
Pargesa Holding SA | 141,700 | | 13,587 |
Roche Holding AG (participation certificate) | 725,268 | | 126,895 |
Societe Generale de Surveillance Holding SA (SGS) (Reg.) | 12,915 | | 13,713 |
Swiss Life Holding | 98,975 | | 23,349 |
Syngenta AG (Switzerland) | 315,081 | | 50,775 |
Tecan Group AG | 197,600 | | 10,594 |
The Swatch Group AG (Reg.) | 389,573 | | 15,562 |
UBS AG (NY Shares) | 1,935,600 | | 115,826 |
TOTAL SWITZERLAND | | 780,474 |
Common Stocks - continued |
| Shares | | Value (Note 1) (000s) |
Taiwan - 1.0% |
Acer, Inc. | 11,506,000 | | $ 20,914 |
Holtek Semiconductor, Inc. | 3,887,044 | | 7,827 |
Hon Hai Precision Industry Co. Ltd. (Foxconn) | 6,633,890 | | 43,093 |
InnoLux Display Corp. | 1,051,000 | | 1,635 |
Shin Kong Financial Holding Co. Ltd. | 10,227,415 | | 9,064 |
TOTAL TAIWAN | | 82,533 |
Turkey - 0.3% |
Finansbank AS | 5,689,491 | | 22,450 |
United Kingdom - 16.5% |
Anglo American PLC (United Kingdom) | 913,600 | | 41,197 |
AstraZeneca PLC sponsored ADR | 864,200 | | 50,729 |
BAE Systems PLC | 4,081,909 | | 32,663 |
Barclays PLC | 1,458,400 | | 19,801 |
Benfield Group PLC | 2,897,300 | | 19,260 |
BG Group PLC | 1,368,000 | | 18,149 |
BG Group PLC sponsored ADR | 200,000 | | 13,290 |
BHP Billiton PLC | 1,397,300 | | 26,947 |
BP PLC sponsored ADR | 1,603,500 | | 107,595 |
British American Tobacco PLC | 1,309,500 | | 36,011 |
British American Tobacco PLC sponsored ADR | 402,700 | | 22,149 |
British Land Co. PLC | 627,900 | | 17,906 |
Cable & Wireless PLC | 8,734,800 | | 24,409 |
Capita Group PLC | 1,106,900 | | 11,381 |
Enterprise Inns PLC | 505,225 | | 10,389 |
Experian Group Ltd. | 1,543,300 | | 16,986 |
GlaxoSmithKline PLC | 249,400 | | 6,640 |
GlaxoSmithKline PLC sponsored ADR | 1,137,700 | | 60,583 |
HSBC Holdings PLC: | | | |
(Hong Kong) (Reg.) | 3,810,944 | | 72,766 |
(United Kingdom) (Reg.) | 700,000 | | 13,366 |
Imperial Energy PLC (a) | 372,200 | | 4,807 |
Imperial Tobacco Group PLC | 76,000 | | 2,692 |
Imperial Tobacco Group PLC sponsored ADR | 175,100 | | 12,492 |
Informa PLC | 1,379,400 | | 14,366 |
International Power PLC | 5,092,700 | | 32,519 |
Man Group PLC | 1,642,200 | | 15,287 |
Marks & Spencer Group PLC | 4,489,000 | | 56,215 |
National Grid PLC | 1,576,500 | | 20,148 |
NDS Group PLC sponsored ADR (a) | 112,400 | | 5,377 |
Pearson PLC | 2,075,500 | | 30,623 |
Common Stocks - continued |
| Shares | | Value (Note 1) (000s) |
United Kingdom - continued |
Prudential PLC | 1,178,448 | | $ 14,443 |
Reckitt Benckiser PLC | 1,303,300 | | 56,707 |
Reed Elsevier PLC | 2,071,800 | | 23,593 |
Renovo Group PLC | 4,990,300 | | 14,540 |
Reuters Group PLC sponsored ADR | 481,050 | | 24,673 |
Rio Tinto PLC sponsored ADR | 137,100 | | 30,353 |
Rolls-Royce Group PLC | 3,776,051 | | 33,835 |
Royal Bank of Scotland Group PLC | 759,471 | | 27,062 |
Royal Dutch Shell PLC Class B | 1,999,459 | | 71,981 |
Scottish & Southern Energy PLC | 1,387,700 | | 34,782 |
Shire PLC | 1,567,000 | | 28,590 |
SIG PLC | 536,100 | | 10,206 |
Smiths Group PLC | 913,000 | | 16,475 |
Tesco PLC | 9,498,512 | | 71,296 |
Unilever PLC | 1,075,400 | | 26,111 |
Vodafone Group PLC | 11,282,735 | | 29,166 |
VT Group PLC | 1,218,600 | | 11,181 |
Whatman PLC | 735,900 | | 4,071 |
William Hill PLC | 1,250,500 | | 15,528 |
TOTAL UNITED KINGDOM | | 1,361,336 |
United States of America - 0.4% |
Macquarie Infrastructure Co. Trust | 131,000 | | 3,908 |
NTL, Inc. | 943,200 | | 25,495 |
TOTAL UNITED STATES OF AMERICA | | 29,403 |
TOTAL COMMON STOCKS (Cost $6,291,807) | 7,790,994 |
Nonconvertible Preferred Stocks - 1.2% |
| | | |
Germany - 0.7% |
Fresenius AG (non-vtg.) | 94,600 | | 17,750 |
Hugo Boss AG (non-vtg.) | 332,800 | | 15,483 |
Porsche AG (non-vtg.) | 21,395 | | 24,946 |
TOTAL GERMANY | | 58,179 |
Italy - 0.5% |
Banca Intesa Spa (Risp) | 5,848,702 | | 38,775 |
Nonconvertible Preferred Stocks - continued |
| Shares | | Value (Note 1) (000s) |
United Kingdom - 0.0% |
Rolls-Royce Group PLC Series B | 138,581,071 | | $ 271 |
TOTAL NONCONVERTIBLE PREFERRED STOCKS (Cost $60,462) | 97,225 |
Government Obligations - 0.1% |
| Principal Amount (000s) | | |
United States of America - 0.1% |
U.S. Treasury Bills, yield at date of purchase 4.78% to 5.01% 12/7/06 to 1/11/07 (f)
(Cost $5,510) | | $ 5,550 | | 5,511 |
Money Market Funds - 5.5% |
| Shares | | |
Fidelity Cash Central Fund, 5.34% (b) | 334,895,573 | | 334,896 |
Fidelity Securities Lending Cash Central Fund, 5.35% (b)(c) | 123,395,664 | | 123,396 |
TOTAL MONEY MARKET FUNDS (Cost $458,292) | 458,292 |
TOTAL INVESTMENT PORTFOLIO - 101.3% (Cost $6,816,071) | 8,352,022 |
NET OTHER ASSETS - (1.3)% | | (109,919) |
NET ASSETS - 100% | $ 8,242,103 |
Futures Contracts |
| Expiration Date | | Underlying Face Amount at Value (000s) | | Unrealized
Appreciation/ (Depreciation) (000s) |
Purchased |
Equity Index Contracts |
1,382 Nikkei 225 Index Contracts (Japan) | Dec. 2006 | | $ 113,082 | | $ 1,285 |
|
The face value of futures purchased as a percentage of net assets - 1.4% |
Legend |
(a) Non-income producing |
(b) Affiliated fund that is available only to investment companies and other accounts managed by Fidelity Investments. The rate quoted is the annualized seven-day yield of the fund at period end. A complete unaudited listing of the fund's holdings as of its most recent quarter end is available upon request. |
(c) Investment made with cash collateral received from securities on loan. |
(d) Security or a portion of the security is on loan at period end. |
(e) Security exempt from registration under Rule 144A of the Securities Act of 1933. These securities may be resold in transactions exempt from registration, normally to qualified institutional buyers. At the end of the period, the value of these securities amounted to $6,639,000 or 0.1% of net assets. |
(f) Security or a portion of the security was pledged to cover margin requirements for futures contracts. At the period end, the value of securities pledged amounted to $5,511,000. |
Affiliated Central Funds |
Information regarding fiscal year to date income earned by the Fund from investments in Fidelity Central Funds is as follows: |
Fund | Income earned
(Amounts in thousands) |
Fidelity Cash Central Fund | $ 11,118 |
Fidelity Securities Lending Cash Central Fund | 5,746 |
Total | $ 16,864 |
Annual Report
See accompanying notes which are an integral part of the financial statements.
Financial Statements
Statement of Assets and Liabilities
Amounts in thousands (except per-share amounts) | October 31, 2006 |
| | |
Assets | | |
Investment in securities, at value (including securities loaned of $117,944) - See accompanying schedule: Unaffiliated issuers (cost $6,357,779) | $ 7,893,730 | |
Fidelity Central Funds (cost $458,292) | 458,292 | |
Total Investments (cost $6,816,071) | | $ 8,352,022 |
Foreign currency held at value (cost $1,001) | | 1,060 |
Receivable for investments sold | | 36,415 |
Receivable for fund shares sold | | 15,792 |
Dividends receivable | | 7,417 |
Interest receivable | | 1,414 |
Other receivables | | 796 |
Total assets | | 8,414,916 |
| | |
Liabilities | | |
Payable for investments purchased | $ 33,989 | |
Payable for fund shares redeemed | 5,884 | |
Accrued management fee | 5,123 | |
Distribution fees payable | 39 | |
Payable for daily variation on futures contracts | 518 | |
Other affiliated payables | 1,549 | |
Other payables and accrued expenses | 2,315 | |
Collateral on securities loaned, at value | 123,396 | |
Total liabilities | | 172,813 |
| | |
Net Assets | | $ 8,242,103 |
Net Assets consist of: | | |
Paid in capital | | $ 6,402,118 |
Undistributed net investment income | | 83,948 |
Accumulated undistributed net realized gain (loss) on investments and foreign currency transactions | | 220,510 |
Net unrealized appreciation (depreciation) on investments and assets and liabilities in foreign currencies | | 1,535,527 |
Net Assets | | $ 8,242,103 |
Annual Report
See accompanying notes which are an integral part of the financial statements.
Financial Statements - continued
Statement of Assets and Liabilities - continued
Amounts in thousands (except per-share amounts) | October 31, 2006 |
| | |
Calculation of Maximum Offering Price
Class A:
Net Asset Value and redemption price per share ($139,827 ÷ 3,835 shares) | | $ 36.47 |
| | |
Maximum offering price per share (100/94.25 of $36.47) | | $ 38.69 |
Class T:
Net Asset Value and redemption price per share ($10,065 ÷ 277.24 shares) | | $ 36.30 |
| | |
Maximum offering price per share (100/96.50 of $36.30) | | $ 37.62 |
Class B:
Net Asset Value and offering price per share ($4,477 ÷ 123.96 shares)A | | $ 36.12 |
| | |
Class C:
Net Asset Value and offering price per share ($5,846 ÷ 161.5 shares)A | | $ 36.19 |
| | |
| | |
International Discovery:
Net Asset Value, offering price and redemption price per share ($8,053,564 ÷ 219,645 shares) | | $ 36.67 |
| | |
Institutional Class:
Net Asset Value, offering price and redemption price per share ($28,324 ÷ 771.5 shares) | | $ 36.71 |
A Redemption price per share is equal to net asset value less any applicable contingent deferred sales charge.
Annual Report
See accompanying notes which are an integral part of the financial statements.
Statement of Operations
Amounts in thousands | Year ended October 31, 2006 |
| | |
Investment Income | | |
Dividends | | $ 149,831 |
Interest | | 315 |
Income from Fidelity Central Funds | | 16,864 |
| | 167,010 |
Less foreign taxes withheld | | (12,732) |
Total income | | 154,278 |
| | |
Expenses | | |
Management fee
Basic fee | $ 45,254 | |
Performance adjustment | 4,736 | |
Transfer agent fees | 14,071 | |
Distribution fees | 263 | |
Accounting and security lending fees | 1,726 | |
Custodian fees and expenses | 2,003 | |
Independent trustees' compensation | 23 | |
Registration fees | 661 | |
Audit | 114 | |
Legal | 94 | |
Interest | 2 | |
Miscellaneous | 46 | |
Total expenses before reductions | 68,993 | |
Expense reductions | (3,737) | 65,256 |
Net investment income (loss) | | 89,022 |
Realized and Unrealized Gain (Loss) Net realized gain (loss) on: | | |
Investment securities: | | |
Unaffiliated issuers (net of foreign taxes of $780) | 231,379 | |
Foreign currency transactions | (2,357) | |
Futures contracts | 9,977 | |
Total net realized gain (loss) | | 238,999 |
Change in net unrealized appreciation (depreciation) on: Investment securities (net of increase in deferred foreign taxes of $1,455) | 942,135 | |
Assets and liabilities in foreign currencies | 247 | |
Futures contracts | (2,186) | |
Total change in net unrealized appreciation (depreciation) | | 940,196 |
Net gain (loss) | | 1,179,195 |
Net increase (decrease) in net assets resulting from operations | | $ 1,268,217 |
Annual Report
See accompanying notes which are an integral part of the financial statements.
Financial Statements - continued
Statement of Changes in Net Assets
Amounts in thousands | Year ended
October 31,
2006 | Year ended
October 31,
2005 |
Increase (Decrease) in Net Assets | | |
Operations | | |
Net investment income (loss) | $ 89,022 | $ 41,777 |
Net realized gain (loss) | 238,999 | 194,174 |
Change in net unrealized appreciation (depreciation) | 940,196 | 324,844 |
Net increase (decrease) in net assets resulting
from operations | 1,268,217 | 560,795 |
Distributions to shareholders from net investment income | (41,324) | (12,813) |
Distributions to shareholders from net realized gain | (189,744) | (10,250) |
Total distributions | (231,068) | (23,063) |
Share transactions - net increase (decrease) | 3,239,823 | 1,234,164 |
Redemption fees | 380 | 193 |
Total increase (decrease) in net assets | 4,277,352 | 1,772,089 |
| | |
Net Assets | | |
Beginning of period | 3,964,751 | 2,192,662 |
End of period (including undistributed net investment income of $83,948 and undistributed net investment income of $40,185, respectively) | $ 8,242,103 | $ 3,964,751 |
Annual Report
See accompanying notes which are an integral part of the financial statements.
Financial Highlights - Class A
Years ended October 31, | 2006 | 2005 H |
Selected Per-Share Data | | |
Net asset value, beginning of period | $ 30.57 | $ 27.41 |
Income from Investment Operations | | |
Net investment income (loss) E | .42 | .28 |
Net realized and unrealized gain (loss) | 7.19 | 2.88 |
Total from investment operations | 7.61 | 3.16 |
Distributions from net investment income | (.31) | - |
Distributions from net realized gain | (1.40) | - |
Total distributions | (1.71) | - |
Redemption fees added to paid in capital E | - J | - J |
Net asset value, end of period | $ 36.47 | $ 30.57 |
Total Return B,C,D | 26.01% | 11.53% |
Ratios to Average Net Assets F,I | | |
Expenses before reductions | 1.27% | 1.42% A |
Expenses net of fee waivers, if any | 1.27% | 1.42% A |
Expenses net of all reductions | 1.21% | 1.36% A |
Net investment income (loss) | 1.22% | 1.15% A |
Supplemental Data | | |
Net assets, end of period (in millions) | $ 140 | $ 2 |
Portfolio turnover rate G | 56% | 75% |
A Annualized
B Total returns for periods of less than one year are not annualized.
C Total returns would have been lower had certain expenses not been reduced during the periods shown.
D Total returns do not include the effect of the sales charges.
E Calculated based on average shares outstanding during the period.
F Fees and expenses of the underlying Fidelity Central Funds are not included in the Fund's expense ratio. The Fund indirectly bears its proportionate share of the expenses of any underlying Fidelity Central Funds.
G Amount does not include the portfolio activity of any underlying Fidelity Central Funds.
H For the period January 6, 2005 (commencement of sale of shares) to October 31, 2005.
I Expense ratios reflect operating expenses of the class. Expenses before reductions do not reflect amounts reimbursed by the investment adviser or reductions from brokerage service arrangements or other expense offset arrangements and do not represent the amount paid by the class during periods when reimbursements or reductions occur. Expense ratios before reductions for start-up periods may not be representative of longer-term operating periods. Expenses net of fee waivers reflect expenses after reimbursement by the investment adviser but prior to reductions from brokerage service arrangements or other expense offset arrangements. Expenses net of all reductions represent the net expenses paid by the class.
J Amount represents less than $.01 per share.
Annual Report
See accompanying notes which are an integral part of the financial statements.
Financial Highlights - Class T
Years ended October 31, | 2006 | 2005 H |
Selected Per-Share Data | | |
Net asset value, beginning of period | $ 30.49 | $ 27.41 |
Income from Investment Operations | | |
Net investment income (loss) E | .27 | .20 |
Net realized and unrealized gain (loss) | 7.18 | 2.88 |
Total from investment operations | 7.45 | 3.08 |
Distributions from net investment income | (.24) | - |
Distributions from net realized gain | (1.40) | - |
Total distributions | (1.64) | - |
Redemption fees added to paid in capital E | - J | - J |
Net asset value, end of period | $ 36.30 | $ 30.49 |
Total Return B,C,D | 25.49% | 11.24% |
Ratios to Average Net Assets F,I | | |
Expenses before reductions | 1.71% | 1.75% A |
Expenses net of fee waivers, if any | 1.71% | 1.75% A |
Expenses net of all reductions | 1.65% | 1.69% A |
Net investment income (loss) | .78% | .83% A |
Supplemental Data | | |
Net assets, end of period (in millions) | $ 10 | $ 2 |
Portfolio turnover rate G | 56% | 75% |
A Annualized
B Total returns for periods of less than one year are not annualized.
C Total returns would have been lower had certain expenses not been reduced during the periods shown.
D Total returns do not include the effect of the sales charges.
E Calculated based on average shares outstanding during the period.
F Fees and expenses of the underlying Fidelity Central Funds are not included in the Fund's expense ratio. The Fund indirectly bears its proportionate share of the expenses of any underlying Fidelity Central Funds.
G Amount does not include the portfolio activity of any underlying Fidelity Central Funds.
H For the period January 6, 2005 (commencement of sale of shares) to October 31, 2005.
I Expense ratios reflect operating expenses of the class. Expenses before reductions do not reflect amounts reimbursed by the investment adviser or reductions from brokerage service arrangements or other expense offset arrangements and do not represent the amount paid by the class during periods when reimbursements or reductions occur. Expense ratios before reductions for start-up periods may not be representative of longer-term operating periods. Expenses net of fee waivers reflect expenses after reimbursement by the investment adviser but prior to reductions from brokerage service arrangements or other expense offset arrangements. Expenses net of all reductions represent the net expenses paid by the class.
J Amount represents less than $.01 per share.
Annual Report
See accompanying notes which are an integral part of the financial statements.
Financial Highlights - Class B
Years ended October 31, | 2006 | 2005 H |
Selected Per-Share Data | | |
Net asset value, beginning of period | $ 30.36 | $ 27.41 |
Income from Investment Operations | | |
Net investment income (loss) E | .08 | .08 |
Net realized and unrealized gain (loss) | 7.19 | 2.87 |
Total from investment operations | 7.27 | 2.95 |
Distributions from net investment income | (.11) | - |
Distributions from net realized gain | (1.40) | - |
Total distributions | (1.51) | - |
Redemption fees added to paid in capital E | - J | - J |
Net asset value, end of period | $ 36.12 | $ 30.36 |
Total Return B,C,D | 24.91% | 10.76% |
Ratios to Average Net Assets F,I | | |
Expenses before reductions | 2.27% | 2.24% A |
Expenses net of fee waivers, if any | 2.25% | 2.24% A |
Expenses net of all reductions | 2.19% | 2.18% A |
Net investment income (loss) | .24% | .33% A |
Supplemental Data | | |
Net assets, end of period (in millions) | $ 4 | $ 1 |
Portfolio turnover rate G | 56% | 75% |
A Annualized
B Total returns for periods of less than one year are not annualized.
C Total returns would have been lower had certain expenses not been reduced during the periods shown.
D Total returns do not include the effect of the contingent deferred sales charge.
E Calculated based on average shares outstanding during the period.
F Fees and expenses of the underlying Fidelity Central Funds are not included in the Fund's expense ratio. The Fund indirectly bears its proportionate share of the expenses of any underlying Fidelity Central Funds.
G Amount does not include the portfolio activity of any underlying Fidelity Central Funds.
H For the period January 6, 2005 (commencement of sale of shares) to October 31, 2005.
I Expense ratios reflect operating expenses of the class. Expenses before reductions do not reflect amounts reimbursed by the investment adviser or reductions from brokerage service arrangements or other expense offset arrangements and do not represent the amount paid by the class during periods when reimbursements or reductions occur. Expense ratios before reductions for start-up periods may not be representative of longer-term operating periods. Expenses net of fee waivers reflect expenses after reimbursement by the investment adviser but prior to reductions from brokerage service arrangements or other expense offset arrangements. Expenses net of all reductions represent the net expenses paid by the class.
J Amount represents less than $.01 per share.
Annual Report
See accompanying notes which are an integral part of the financial statements.
Financial Highlights - Class C
Years ended October 31, | 2006 | 2005 H |
Selected Per-Share Data | | |
Net asset value, beginning of period | $ 30.41 | $ 27.41 |
Income from Investment Operations | | |
Net investment income (loss) E | .11 | .13 |
Net realized and unrealized gain (loss) | 7.19 | 2.87 |
Total from investment operations | 7.30 | 3.00 |
Distributions from net investment income | (.12) | - |
Distributions from net realized gain | (1.40) | - |
Total distributions | (1.52) | - |
Redemption fees added to paid in capital E | - J | - J |
Net asset value, end of period | $ 36.19 | $ 30.41 |
Total Return B,C,D | 24.97% | 10.94% |
Ratios to Average Net Assets F,I | | |
Expenses before reductions | 2.16% | 2.04% A |
Expenses net of fee waivers, if any | 2.16% | 2.04% A |
Expenses net of all reductions | 2.11% | 1.98% A |
Net investment income (loss) | .33% | .53% A |
Supplemental Data | | |
Net assets, end of period (in millions) | $ 6 | $ 2 |
Portfolio turnover rate G | 56% | 75% |
A Annualized
B Total returns for periods of less than one year are not annualized.
C Total returns would have been lower had certain expenses not been reduced during the periods shown.
D Total returns do not include the effect of the contingent deferred sales charge.
E Calculated based on average shares outstanding during the period.
F Fees and expenses of the underlying Fidelity Central Funds are not included in the Fund's expense ratio. The Fund indirectly bears its proportionate share of the expenses of any underlying Fidelity Central Funds.
G Amount does not include the portfolio activity of any underlying Fidelity Central Funds.
H For the period January 6, 2005 (commencement of sale of shares) to October 31, 2005.
I Expense ratios reflect operating expenses of the class. Expenses before reductions do not reflect amounts reimbursed by the investment adviser or reductions from brokerage service arrangements or other expense offset arrangements and do not represent the amount paid by the class during periods when reimbursements or reductions occur. Expense ratios before reductions for start-up periods may not be representative of longer-term operating periods. Expenses net of fee waivers reflect expenses after reimbursement by the investment adviser but prior to reductions from brokerage service arrangements or other expense offset arrangements. Expenses net of all reductions represent the net expenses paid by the class.
J Amount represents less than $.01 per share.
Annual Report
See accompanying notes which are an integral part of the financial statements.
Financial Highlights - International Discovery
Years ended October 31, | 2006 | 2005 | 2004 | 2003 | 2002 |
Selected Per-Share Data | | | | | |
Net asset value, beginning of period | $ 30.65 | $ 25.31 | $ 21.87 | $ 16.66 | $ 17.61 |
Income from Investment Operations | | | | | |
Net investment income (loss) B | .48 | .37 | .22 | .19 | .11 |
Net realized and unrealized gain (loss) | 7.25 | 5.24 | 3.40 | 5.11 | (1.06) |
Total from investment operations | 7.73 | 5.61 | 3.62 | 5.30 | (.95) |
Distributions from net investment income | (.31) | (.15) | (.18) | (.09) | - |
Distributions from net realized gain | (1.40) | (.12) | - | - | - |
Total distributions | (1.71) | (.27) | (.18) | (.09) | - |
Redemption fees added to paid in capital B | - F | - F | - F | - F | - F |
Net asset value, end of period | $ 36.67 | $ 30.65 | $ 25.31 | $ 21.87 | $ 16.66 |
Total Return A | 26.34% | 22.29% | 16.65% | 31.97% | (5.39)% |
Ratios to Average Net Assets C,E | | | | | |
Expenses before reductions | 1.09% | 1.08% | 1.10% | 1.14% | 1.14% |
Expenses net of fee waivers, if any | 1.08% | 1.07% | 1.10% | 1.14% | 1.14% |
Expenses net of all reductions | 1.03% | 1.01% | 1.06% | 1.11% | 1.12% |
Net investment income (loss) | 1.41% | 1.35% | .92% | 1.08% | .59% |
Supplemental Data | | | | | |
Net assets, end of period (in millions) | $ 8,054 | $ 3,949 | $ 2,193 | $ 1,243 | $ 890 |
Portfolio turnover rate D | 56% | 75% | 87% | 81% | 63% |
A Total returns would have been lower had certain expenses not been reduced during the periods shown.
B Calculated based on average shares outstanding during the period.
C Fees and expenses of the underlying Fidelity Central Funds are not included in the Fund's expense ratio. The Fund indirectly bears its proportionate share of the expenses of any underlying Fidelity Central Funds.
D Amount does not include the portfolio activity of any underlying Fidelity Central Funds.
E Expense ratios reflect operating expenses of the class. Expenses before reductions do not reflect amounts reimbursed by the investment adviser or reductions from brokerage service arrangements or other expense offset arrangements and do not represent the amount paid by the class during periods when reimbursements or reductions occur. Expenses net of fee waivers reflect expenses after reimbursement by the investment adviser but prior to reductions from brokerage service arrangements or other expense offset arrangements. Expenses net of all reductions represent the net expenses paid by the class.
F Amount represents less than $.01 per share.
Annual Report
See accompanying notes which are an integral part of the financial statements.
Financial Highlights - Institutional Class
Years ended October 31, | 2006 | 2005 G |
Selected Per-Share Data | | |
Net asset value, beginning of period | $ 30.68 | $ 27.41 |
Income from Investment Operations | | |
Net investment income (loss) D | .51 | .38 |
Net realized and unrealized gain (loss) | 7.25 | 2.89 |
Total from investment operations | 7.76 | 3.27 |
Distributions from net investment income | (.33) | - |
Distributions from net realized gain | (1.40) | - |
Total distributions | (1.73) | - |
Redemption fees added to paid in capital D | - I | - I |
Net asset value, end of period | $ 36.71 | $ 30.68 |
Total Return B,C | 26.45% | 11.93% |
Ratios to Average Net Assets E,H | | |
Expenses before reductions | 1.00% | .97% A |
Expenses net of fee waivers, if any | 1.00% | .97% A |
Expenses net of all reductions | .95% | .90% A |
Net investment income (loss) | 1.49% | 1.60% A |
Supplemental Data | | |
Net assets, end of period (in millions) | $ 28 | $ 10 |
Portfolio turnover rate F | 56% | 75% |
A Annualized
B Total returns for periods of less than one year are not annualized.
C Total returns would have been lower had certain expenses not been reduced during the periods shown.
D Calculated based on average shares outstanding during the period.
E Fees and expenses of the underlying Fidelity Central Funds are not included in the Fund's expense ratio. The Fund indirectly bears its proportionate share of the expenses of any underlying Fidelity Central Funds.
F Amount does not include the portfolio activity of any underlying Fidelity Central Funds.
G For the period January 6, 2005 (commencement of sale of shares) to October 31, 2005.
H Expense ratios reflect operating expenses of the class. Expenses before reductions do not reflect amounts reimbursed by the investment adviser or reductions from brokerage service arrangements or other expense offset arrangements and do not represent the amount paid by the class during periods when reimbursements or reductions occur. Expense ratios before reductions for start-up periods may not be representative of longer-term operating periods. Expenses net of fee waivers reflect expenses after reimbursement by the investment adviser but prior to reductions from brokerage service arrangements or other expense offset arrangements. Expenses net of all reductions represent the net expenses paid by the class.
I Amount represents less than $.01 per share.
Annual Report
See accompanying notes which are an integral part of the financial statements.
Notes to Financial Statements
For the period ended October 31, 2006
(Amounts in thousands except ratios)
1. Significant Accounting Policies.
Fidelity International Discovery Fund (the Fund) is a fund of Fidelity Investment Trust (the trust) and is authorized to issue an unlimited number of shares. The trust is registered under the Investment Company Act of 1940, as amended (the 1940 Act), as an open-end management investment company organized as a Massachusetts business trust.
The Fund offers Class A, Class T, Class B, Class C, International Discovery and Institutional Class shares, each of which has equal rights as to assets and voting privileges. Each class has exclusive voting rights with respect to matters that affect that class. Class B shares will automatically convert to Class A shares after a holding period of seven years from the initial date of purchase. Investment income, realized and unrealized capital gains and losses, the common expenses of the Fund, and certain fund-level expense reductions, if any, are allocated on a pro rata basis to each class based on the relative net assets of each class to the total net assets of the Fund. Each class differs with respect to transfer agent and distribution and service plan fees incurred. Certain expense reductions also differ by class.
The Fund's investments in emerging markets can be subject to social, economic, regulatory, and political uncertainties and can be extremely volatile. The Fund may invest in Fidelity Central Funds which are open-end investment companies available to investment companies and other accounts managed by Fidelity Management & Research Company (FMR) and its affiliates. The financial statements have been prepared in conformity with accounting principles generally accepted in the United States of America, which require management to make certain estimates and assumptions at the date of the financial statements. The following summarizes the significant accounting policies of the Fund, which are also consistently followed by the Fidelity Central Funds:
Security Valuation. Investments are valued and net asset value (NAV) per share is calculated (NAV calculation) as of the close of business of the New York Stock Exchange (NYSE), normally 4:00 p.m. Eastern time. Wherever possible, the Fund uses independent pricing services approved by the Board of Trustees to value its investments.
Equity securities, including restricted securities, for which market quotations are readily available, are valued at the last reported sale price or official closing price as reported by an independent pricing service on the primary market or exchange on which they are traded. In the event there were no sales during the day or closing prices are not available, securities are valued at the last quoted bid price. Investments in open-end mutual funds, including the Fidelity Central Funds, are valued at their closing net asset value each business day. Short-term securities with remaining maturities of sixty days or less for which quotations are not readily available are valued at amortized cost, which approximates value.
Annual Report
Notes to Financial Statements - continued
(Amounts in thousands except ratios)
1. Significant Accounting Policies - continued
Security Valuation - continued
When current market prices or quotations are not readily available or do not accurately reflect fair value, valuations may be determined in accordance with procedures adopted by the Board of Trustees. For example, when developments occur between the close of a market and the close of the NYSE that may materially affect the value of some or all of the securities, or when trading in a security is halted, those securities may be fair valued. Factors used in the determination of fair value may include monitoring news to identify significant market or security specific events such as changes in the value of U.S. securities markets, reviewing developments in foreign markets and evaluating the performance of ADRs, futures contracts and exchange-traded funds. Because the Fund's utilization of fair value pricing depends on market activity, the frequency with which fair value pricing is used can not be predicted and may be utilized to a significant extent. The value of securities used for NAV calculation under fair value pricing may differ from published prices for the same securities.
Foreign Currency. The Fund uses foreign currency contracts to facilitate transactions in foreign-denominated securities. Losses from these transactions may arise from changes in the value of the foreign currency or if the counterparties do not perform under the contracts' terms.
Foreign-denominated assets, including investment securities, and liabilities are translated into U.S. dollars at the exchange rate at period end. Purchases and sales of investment securities, income and dividends received and expenses denominated in foreign currencies are translated into U.S. dollars at the exchange rate in effect on the transaction date.
The effects of exchange rate fluctuations on investments are included with the net realized and unrealized gain (loss) on investment securities. Other foreign currency transactions resulting in realized and unrealized gain (loss) are disclosed separately.
Investment Transactions and Income. Security transactions, including the Fund's investment activity in the Fidelity Central Funds, are accounted for as of trade date. Gains and losses on securities sold are determined on the basis of identified cost and may include proceeds received from litigation. Dividend income is recorded on the ex-dividend date, except for certain dividends from foreign securities where the ex-dividend date may have passed, which are recorded as soon as the Fund is informed of the ex-dividend date. Non-cash dividends included in dividend income, if any, are recorded at the fair market value of the securities received. Distributions received on securities that represent a return of capital or capital gain are recorded as a reduction of cost of investments and/or as a realized gain. The Fund estimates the components of distributions received that may be considered return of capital distributions or capital gain distributions. Interest income is accrued as earned. Interest income includes coupon interest and amortization of premium and accretion of discount on debt securities. Investment income is recorded net of foreign taxes withheld where recovery of such taxes is uncertain.
Annual Report
1. Significant Accounting Policies - continued
Expenses. Most expenses of the trust can be directly attributed to a fund. Expenses which cannot be directly attributed are apportioned among each Fund in the trust. Expense estimates are accrued in the period to which they relate and adjustments are made when actual amounts are known.
Income Tax Information and Distributions to Shareholders. Each year, the Fund intends to qualify as a regulated investment company by distributing all of its taxable income and realized gains under Subchapter M of the Internal Revenue Code. As a result, no provision for income taxes is required in the accompanying financial statements. Foreign taxes are provided for based on the Fund's understanding of the tax rules and rates that exist in the foreign markets in which it invests.
Distributions are recorded on the ex-dividend date. Income dividends and capital gain distributions are declared separately for each class. Income and capital gain distributions are determined in accordance with income tax regulations, which may differ from generally accepted accounting principles. In addition, the Fund will claim a portion of the payment made to redeeming shareholders as a distribution for income tax purposes.
Capital accounts within the financial statements are adjusted for permanent book-tax differences. These adjustments have no impact on net assets or the results of operations. Temporary book-tax differences will reverse in a subsequent period.
Book-tax differences are primarily due to futures transactions, foreign currency transactions, passive foreign investment companies (PFIC), and losses deferred due to wash sales.
The tax-basis components of distributable earnings and the federal tax cost as of period end were as follows:
Unrealized appreciation | $ 1,585,398 | |
Unrealized depreciation | (82,869) | |
Net unrealized appreciation (depreciation) | 1,502,529 | |
Undistributed ordinary income | 132,824 | |
Undistributed long-term capital gain | 165,476 | |
| | |
Cost for federal income tax purposes | $ 6,849,493 | |
The tax character of distributions paid was as follows:
| October 31, 2006 | October 31, 2005 |
Ordinary Income | $ 106,379 | $ 12,813 |
Long-term Capital Gains | 124,689 | 10,250 |
| | |
Total | $ 231,068 | $ 23,063 |
Annual Report
Notes to Financial Statements - continued
(Amounts in thousands except ratios)
1. Significant Accounting Policies - continued
Short-Term Trading (Redemption) Fees. Shares held in the Fund less than 30 days are subject to a redemption fee equal to 1.00% of the proceeds of the redeemed shares. All redemption fees, including any estimated redemption fees paid by FMR, are retained by the Fund and accounted for as an addition to paid in capital.
New Accounting Pronouncements. In July 2006, Financial Accounting Standards Board Interpretation No. 48, Accounting for Uncertainty in Income Taxes - an interpretation of FASB Statement 109 (FIN 48), was issued and is effective for fiscal years beginning after December 15, 2006. FIN 48 sets forth a threshold for financial statement recognition, measurement and disclosure of a tax position taken or expected to be taken on a tax return. Management is currently evaluating the impact, if any, the adoption of FIN 48 will have on the Fund's net assets, results of operations and financial statement disclosures.
In addition, in September 2006, Statement of Financial Accounting Standards No. 157, Fair Value Measurements (SFAS 157), was issued and is effective for fiscal years beginning after November 15, 2007. SFAS 157 defines fair value, establishes a framework for measuring fair value and expands disclosures about fair value measurements. Management is currently evaluating the impact the adoption of SFAS 157 will have on the Fund's financial statement disclosures.
2. Operating Policies.
Repurchase Agreements. FMR has received an Exemptive Order from the Securities and Exchange Commission (the SEC) which permits the Fund and other affiliated entities of FMR to transfer uninvested cash balances into joint trading accounts which are then invested in repurchase agreements. The Fund may also invest directly with institutions in repurchase agreements. Repurchase agreements are collateralized by government or non-government securities. Upon settlement date, collateral is held in segregated accounts with custodian banks and may be obtained in the event of a default of the counterparty. The Fund monitors, on a daily basis, the value of the collateral to ensure it is at least equal to the principal amount of the repurchase agreement (including accrued interest). In the event of a default by the counterparty, realization of the collateral proceeds could be delayed, during which time the value of the collateral may decline.
Futures Contracts. The Fund may use futures contracts to manage its exposure to the stock market. Buying futures tends to increase a fund's exposure to the underlying instrument, while selling futures tends to decrease a fund's exposure to the underlying instrument or hedge other fund investments. Upon entering into a futures contract, a fund is required to deposit with a clearing broker, no later than the following business day, an amount ("initial margin") equal to a certain percentage of the face value of the contract. The initial margin may be in the form of cash or securities and is transferred to a segregated account on settlement date. Subsequent payments ("variation margin") are made or
Annual Report
2. Operating Policies - continued
Futures Contracts - continued
received by a fund depending on the daily fluctuations in the value of the futures contract and are accounted for as unrealized gains or losses. Realized gains (losses) are recorded upon the expiration or closing of the futures contract. Securities deposited to meet margin requirements are identified in the Schedule of Investments. Futures contracts involve, to varying degrees, risk of loss in excess of any futures variation margin reflected in the Statement of Assets and Liabilities. The underlying face amount at value of any open futures contracts at period end is shown in the Schedule of Investments under the caption "Futures Contracts." This amount reflects each contract's exposure to the underlying instrument at period end. Losses may arise from changes in the value of the underlying instruments or if the counterparties do not perform under the contract's terms. Futures contracts are valued at the settlement price established each day by the board of trade or exchange on which they are traded.
Restricted Securities. The Fund may invest in securities that are subject to legal or contractual restrictions on resale. These securities generally may be resold in transactions exempt from registration or to the public if the securities are registered. Disposal of these securities may involve time-consuming negotiations and expense, and prompt sale at an acceptable price may be difficult. Information regarding restricted securities is included at the end of the Fund's Schedule of Investments.
3. Purchases and Sales of Investments.
Purchases and sales of securities, other than short-term securities, aggregated $6,247,376 and $3,418,782, respectively.
4. Fees and Other Transactions with Affiliates.
Management Fee. FMR and its affiliates provide the Fund with investment management related services for which the Fund pays a monthly management fee. The management fee is the sum of an individual fund fee rate that is based on an annual rate of .45% of the Fund's average net assets and a group fee rate that averaged .27% during the period. The group fee rate is based upon the average net assets of all the mutual funds advised by FMR.
The group fee rate decreases as assets under management increase and increases as assets under management decrease. In addition, the management fee is subject to a performance adjustment (up to a maximum of ± .20% of the Fund's average net assets over a 36 month performance period). The upward or downward adjustment to the management fee is based on the relative investment performance of the retail class of the Fund, International Discovery, as compared to an appropriate benchmark index. The Fund's performance adjustment took effect in September 2005. Subsequent months will be added until the performance period includes 36 months. For the period, the total annual management fee rate, including the performance adjustment, was .79% of the Fund's average net assets.
Annual Report
Notes to Financial Statements - continued
(Amounts in thousands except ratios)
4. Fees and Other Transactions with Affiliates - continued
Distribution and Service Plan. In accordance with Rule 12b-1 of the 1940 Act, the Fund has adopted separate Distribution and Service Plans for each class of shares. Certain classes pay Fidelity Distributors Corporation (FDC), an affiliate of FMR, separate Distribution and Service Fees, each of which is based on an annual percentage of each class' average net assets. In addition, FDC may pay financial intermediaries for selling shares of the Fund and providing shareholder support services. For the period, the Distribution and Service Fee rates and the total amounts paid to and retained by FDC were as follows:
| Distribution
Fee | Service
Fee | Paid to
FDC | Retained
by FDC |
Class A | 0% | .25% | $ 183 | $ - |
Class T | .25% | .25% | 26 | 2 |
Class B | .75% | .25% | 21 | 16 |
Class C | .75% | .25% | 33 | 19 |
| | | $ 263 | $ 37 |
Sales Load. FDC receives a front-end sales charge of up to 5.75% for selling Class A shares, and 3.50% for selling Class T shares, some of which is paid to financial intermediaries for selling shares of the Fund. FDC receives the proceeds of contingent deferred sales charges levied on Class A, Class T, Class B, and Class C redemptions. These charges depend on the holding period. The deferred sales charges range from 5% to 1% for Class B, 1% for Class C, 1.00% to .50% for certain purchases of Class A shares (.25% prior to February 24, 2006) and .25% for certain purchases of Class T shares.
For the period, sales charge amounts retained by FDC were as follows:
| Retained
by FDC |
Class A | $ 36 |
Class T | 7 |
Class B* | 3 |
Class C* | 1 |
| $ 47 |
* When Class B and Class C shares are initially sold, FDC pays commissions from its own resources to financial intermediaries through which the sales
are made.
Transfer Agent Fees. Fidelity Investments Institutional Operations Company, Inc. (FIIOC), an affiliate of FMR, is the transfer, dividend disbursing and shareholder servicing agent for each class of the Fund, except for International Discovery. Fidelity Service Company, Inc. (FSC), an affiliate of FMR, is the transfer agent for International Discovery shares. FIIOC and FSC receive account fees and asset-based fees that vary according to the account size and type of account of the shareholders of the respective classes of the Fund.
Annual Report
4. Fees and Other Transactions with Affiliates - continued
Transfer Agent Fees - continued
FIIOC and FSC pay for typesetting, printing and mailing of shareholder reports, except proxy statements. For the period, the total transfer agent fees paid by each class to FIIOC or FSC, were as follows:
| Amount | % of
Average
Net Assets |
Class A | $ 115 | .16 |
Class T | 18 | .35 |
Class B | 9 | .41 |
Class C | 10 | .31 |
International Discovery | 13,891 | .22 |
Institutional Class | 28 | .14 |
| $ 14,071 | |
Accounting and Security Lending Fees. FSC maintains the Fund's accounting records. The accounting fee is based on the level of average net assets for the month. Under a separate contract, FSC administers the security lending program. The security lending fee is based on the number and duration of lending transactions.
Investments in Fidelity Central Funds. The Fund may invest in Fidelity Central Funds. The Fund's Schedule of Investments lists each of the Fidelity Central Funds as an investment of the Fund but does not include the underlying holdings of each Fidelity Central Fund. As an Investing Fund, the Fund indirectly bears its proportionate share of the expenses of the underlying Fidelity Central Funds. A complete unaudited list of holdings for each Fidelity Central Fund is available upon request. In addition, the financial statements of the Fidelity Central Funds, which are not covered by the Fund's Report of Independent Registered Public Accounting Firm, are available on the EDGAR Database on the SEC's web site, www.sec.gov, or upon request.
The Money Market Central Funds seek preservation of capital and current income and are managed by Fidelity Investments Money Management, Inc. (FIMM), an affiliate of FMR.
5. Committed Line of Credit.
The Fund participates with other funds managed by FMR in a $4.2 billion credit facility (the "line of credit") to be utilized for temporary or emergency purposes to fund shareholder redemptions or for other short-term liquidity purposes. The Fund has agreed to pay commitment fees on its pro rata portion of the line of credit, which amounts to $16 and is reflected in Miscellaneous Expense on the Statement of Operations. During the period, there were no borrowings on this line of credit.
Annual Report
Notes to Financial Statements - continued
(Amounts in thousands except ratios)
6. Security Lending.
The Fund lends portfolio securities from time to time in order to earn additional income. On the settlement date of the loan, the Fund receives collateral (in the form of U.S. Treasury obligations, letters of credit and/or cash) against the loaned securities and maintains collateral in an amount not less than 100% of the market value of the loaned securities during the period of the loan. The market value of the loaned securities is determined at the close of business of the Fund and any additional required collateral is delivered to the Fund on the next business day. If the borrower defaults on its obligation to return the securities loaned because of insolvency or other reasons, a fund could experience delays and costs in recovering the securities loaned or in gaining access to the collateral. Any cash collateral received is invested in the Fidelity Securities Lending Cash Central Fund. The value of loaned securities and cash collateral at period end are disclosed on the Fund's Statement of Assets and Liabilities. Security lending income represents the income earned on investing cash collateral, less fees and expenses associated with the loan, plus any premium payments that may be received on the loan of certain types of securities. Net income from lending portfolio securities during the period amounted to $5,746.
7. Bank Borrowings.
The Fund is permitted to have bank borrowings for temporary or emergency purposes to fund shareholder redemptions. The Fund has established borrowing arrangements with certain banks. The interest rate on the borrowings is the bank's base rate, as revised from time to time. The average daily loan balance during the period for which loans were outstanding amounted to $6,674. The weighted average interest rate was 4.79%. At period end, there were no bank borrowings outstanding.
8. Expense Reductions.
FMR voluntarily agreed to reimburse a portion of Fidelity International Discovery's operating expenses. During the period, this reimbursement reduced the class expenses by $38.
FMR voluntarily agreed to reimburse each class to the extent annual operating expenses exceeded certain levels of average net assets as noted in the table below. Some expenses, for example interest expense, including commitment fees, are excluded from this reimbursement.
The following classes were in reimbursement during the period:
| Expense
Limitations | Reimbursement
from adviser |
Class B | 2.25% | $ 1 |
Annual Report
8. Expense Reductions - continued
Many of the brokers with whom FMR places trades on behalf of the Fund provided services to the Fund in addition to trade execution. These services included payments of certain expenses on behalf of the Fund totaling $3,493 for the period. In addition, through arrangements with the Fund's custodian and each class' transfer agent, credits realized as a result of uninvested cash balances were used to reduce the Fund's expenses. During the period, credits reduced each class' transfer agent expense as noted in the table below.
| Transfer Agent
expense reduction |
International Discovery | $ 205 |
9. Other.
The Fund's organizational documents provide former and current trustees and officers with a limited indemnification against liabilities arising in connection with the performance of their duties to the Fund. In the normal course of business, the Fund may also enter into contracts that provide general indemnifications. The Fund's maximum exposure under these arrangements is unknown as this would be dependent on future claims that may be made against the Fund. The risk of material loss from such claims is considered remote.
During the period, the Fund's transfer agent, Fidelity Investments Institutional Operations Company, Inc. (FIIOC), an affiliate of Fidelity Management & Research Company, notified the Fund that the fund's books and records did not reflect a conversion of certain Class B to Class A shares upon their conversion date. Management has determined that this did not have a material impact to the Fund's reported net assets or results of operations in the accompanying financial statements. FIIOC will cause the books and records of the Fund to reflect a conversion of the relevant Class B shares to Class A and is in the process of determining the impact to affected shareholder accounts for purposes of its remediation.
The United States Securities and Exchange Commission ("SEC") is conducting an investigation of FMR (covering the years 2002 to 2004) arising from gifts, gratuities and business entertainment provided by certain brokers to certain individuals who were employed on FMR's domestic equity trading desk during that period. FMR is in discussions with the SEC staff regarding the possible resolution of the matter, but as of period-end no final resolution has been reached.
Annual Report
Notes to Financial Statements - continued
(Amounts in thousands except ratios)
9. Other - continued
In December 2006, the Independent Trustees completed their own investigation of the matter with the assistance of independent counsel. The Independent Trustees and FMR agree that, despite the absence of proof that the Fidelity mutual funds experienced diminished execution quality as a result of the improper receipt of gifts and business entertainment, the conduct at issue was serious and is worthy of redress. Accordingly, the Independent Trustees have requested and FMR has agreed to pay $42 million to Fidelity mutual funds, plus interest to be determined at the time that payment is made. A method of allocating this payment among the funds has not yet been determined. In addition, FMR has agreed to reimburse related legal expenses. The total payment to the Fund is not anticipated to have a material impact on the Fund's net assets.
10. Distributions to Shareholders.
Distributions to shareholders of each class were as follows:
Years ended October 31, | 2006 | 2005 |
From net investment income | | |
Class A | $ 38 | $ - |
Class T | 18 | - |
Class B | 3 | - |
Class C | 8 | - |
International Discovery | 41,152 | 12,813 |
Institutional Class | 105 | - |
Total | $ 41,324 | $ 12,813 |
From net realized gain | | |
Class A | $ 173 | $ - |
Class T | 102 | - |
Class B | 40 | - |
Class C | 94 | - |
International Discovery | 188,890 | 10,250 |
Institutional Class | 445 | - |
Total | $ 189,744 | $ 10,250 |
Annual Report
11. Share Transactions.
Transactions for each class of shares were as follows:
| Shares | Dollars |
Years ended October 31, | 2006 | 2005 A | 2006 | 2005 A |
Class A | | | | |
Shares sold | 3,952 | 62 | $ 133,777 | $ 1,786 |
Reinvestment of distributions | 5 | - | 160 | - |
Shares redeemed | (183) | (1) | (6,217) | (30) |
Net increase (decrease) | 3,774 | 61 | $ 127,720 | $ 1,756 |
Class T | | | | |
Shares sold | 248 | 63 | $ 8,469 | $ 1,829 |
Reinvestment of distributions | 4 | - | 112 | - |
Shares redeemed | (36) | (2) | (1,223) | (58) |
Net increase (decrease) | 216 | 61 | $ 7,358 | $ 1,771 |
Class B | | | | |
Shares sold | 112 | 27 | $ 3,875 | $ 759 |
Reinvestment of distributions | 1 | - | 37 | - |
Shares redeemed | (14) | (2) | (489) | (53) |
Net increase (decrease) | 99 | 25 | $ 3,423 | $ 706 |
Class C | | | | |
Shares sold | 130 | 63 | $ 4,409 | $ 1,805 |
Reinvestment of distributions | 1 | - | 41 | - |
Shares redeemed | (32) | - | (1,088) | (1) |
Net increase (decrease) | 99 | 63 | $ 3,362 | $ 1,804 |
International Discovery | | | | |
Shares sold | 123,095 | 73,475 | $ 4,201,412 | $ 2,106,762 |
Reinvestment of distributions | 7,089 | 781 | 215,944 | 21,434 |
Shares redeemed | (39,365) | (32,072) | (1,334,783) | (909,132) |
Net increase (decrease) | 90,819 | 42,184 | $ 3,082,573 | $ 1,219,064 |
Institutional Class | | | | |
Shares sold | 512 | 365 | $ 17,352 | $ 10,479 |
Reinvestment of distributions | 4 | - | 121 | - |
Shares redeemed | (61) | (48) | (2,086) | (1,416) |
Net increase (decrease) | 455 | 317 | $ 15,387 | $ 9,063 |
A Share transactions for Class A, T, B, C and Institutional Class are for the period January 6, 2005 (commencement of sale of shares) to
October 31, 2005.
Annual Report
Report of Independent Registered Public Accounting Firm
To the Trustees of Fidelity Investment Trust and the Shareholders of Fidelity International Discovery Fund:
In our opinion, the accompanying statement of assets and liabilities, including the schedule of investments, and the related statements of operations and of changes in net assets and the financial highlights present fairly, in all material respects, the financial position of Fidelity International Discovery Fund (a fund of Fidelity Investment Trust) at October 31, 2006, the results of its operations for the year then ended, the changes in its net assets for each of the two years in the period then ended and the financial highlights for each of the periods indicated, in conformity with accounting principles generally accepted in the United States of America. These financial statements and financial highlights (hereafter referred to as "financial statements") are the responsibility of the Fidelity International Discovery Fund's management. Our responsibility is to express an opinion on these financial statements based on our audits. We conducted our audits of these financial statements in accordance with the standards of the Public Company Accounting Oversight Board (United States). Those standards require that we plan and perform the audit to obtain reasonable assurance about whether the financial statements are free of material misstatement. An audit includes examining, on a test basis, evidence supporting the amounts and disclosures in the financial statements, assessing the accounting principles used and significant estimates made by management, and evaluating the overall financial statement presentation. We believe that our audits, which included confirmation of securities at October 31, 2006 by correspondence with the custodian and brokers, provide a reasonable basis for our opinion.
/s/PricewaterhouseCoopers LLP
PricewaterhouseCoopers LLP
Boston, Massachusetts
December 21, 2006
Annual Report
Trustees and Officers
The Trustees, Members of the Advisory Board, and executive officers of the trust and fund, as applicable, are listed below. The Board of Trustees governs the fund and is responsible for protecting the interests of shareholders. The Trustees are experienced executives who meet periodically throughout the year to oversee the fund's activities, review contractual arrangements with companies that provide services to the fund, and review the fund's performance. Except for William O. McCoy, each of the Trustees oversees 348 funds advised by FMR or an affiliate. Mr. McCoy oversees 350 funds advised by FMR or an affiliate.
The Trustees hold office without limit in time except that (a) any Trustee may resign; (b) any Trustee may be removed by written instrument, signed by at least two-thirds of the number of Trustees prior to such removal; (c) any Trustee who requests to be retired or who has become incapacitated by illness or injury may be retired by written instrument signed by a majority of the other Trustees; and (d) any Trustee may be removed at any special meeting of shareholders by a two-thirds vote of the outstanding voting securities of the trust. Each Trustee who is not an interested person (as defined in the 1940 Act) (Independent Trustee), shall retire not later than the last day of the calendar year in which his or her 72nd birthday occurs. The Independent Trustees may waive this mandatory retirement age policy with respect to individual Trustees. The executive officers and Advisory Board Members hold office without limit in time, except that any officer and Advisory Board Member may resign or may be removed by a vote of a majority of the Trustees at any regular meeting or any special meeting of the Trustees. Except as indicated, each individual has held the office shown or other offices in the same company for the past five years.
The fund's Statement of Additional Information (SAI) includes more information about the Trustees. To request a free copy, call Fidelity at 1-800-544-8544.
Interested Trustees*:
Correspondence intended for each Trustee who is an interested person may be sent to Fidelity Investments, 82 Devonshire Street, Boston, Massachusetts 02109.
Name, Age; Principal Occupation |
Edward C. Johnson 3d (76) |
| Year of Election or Appointment: 1984 Mr. Johnson is Chairman of the Board of Trustees. Mr. Johnson serves as President (2006-present), Chief Executive Officer, Chairman, and a Director of FMR Corp.; Chairman and a Director of FMR; Chairman and a Director of Fidelity Research & Analysis Company (FRAC); Chairman and a Director of Fidelity Investments Money Management, Inc.; and Chairman (2001-present) and a Director of FMR Co., Inc. In addition, Mr. Johnson serves as Chairman and Director of Fidelity International Limited (FIL). |
Stephen P. Jonas (53) |
| Year of Election or Appointment: 2005 Mr. Jonas is Senior Vice President of International Discovery (2005-present). He also serves as Senior Vice President of other Fidelity funds (2005-present). Mr. Jonas is Executive Director of FMR (2005-present) and FMR Co., Inc. (2005-present). He also serves as a Director of Fidelity Investments Money Management, Inc. (2005-present) and FMR Corp. (2003-present). Previously, Mr. Jonas served as President of Fidelity Enterprise Operations and Risk Services (2004-2005), Chief Administrative Officer (2002-2004), and Chief Financial Officer of FMR Corp. (1998-2002). In addition, he serves on the Boards of Boston Ballet (2003-present) and Simmons College (2003-present). |
Robert L. Reynolds (54) |
| Year of Election or Appointment: 2003 Mr. Reynolds is President and a Director of FMR (2005-present), Fidelity Investments Money Management, Inc. (2005-present), and FMR Co., Inc. (2005-present). Mr. Reynolds also serves as Vice Chairman (2006-present), a Director (2003-present), and Chief Operating Officer of FMR Corp. and a Director of Strategic Advisers, Inc. (2005-present). He also serves on the Board at Fidelity Investments Canada, Ltd. |
* Trustees have been determined to be "Interested Trustees" by virtue of, among other things, their affiliation with the trust or various entities under common control with FMR.
Annual Report
Independent Trustees:
Correspondence intended for each Independent Trustee (that is, the Trustees other than the Interested Trustees) may be sent to Fidelity Investments, P.O. Box 55235, Boston, Massachusetts 02205-5235.
Name, Age; Principal Occupation |
Dennis J. Dirks (58) |
| Year of Election or Appointment: 2005 Prior to his retirement in May 2003, Mr. Dirks was Chief Operating Officer and a member of the Board of The Depository Trust & Clearing Corporation (DTCC) (1999-2003). He also served as President, Chief Operating Officer, and Board member of The Depository Trust Company (DTC) (1999-2003) and President and Board member of the National Securities Clearing Corporation (NSCC) (1999-2003). In addition, Mr. Dirks served as Chief Executive Officer and Board member of the Government Securities Clearing Corporation (2001-2003) and Chief Executive Officer and Board member of the Mortgage-Backed Securities Clearing Corporation (2001-2003). Mr. Dirks also serves as a Trustee and a member of the Finance Committee of Manhattan College (2005-present) and a Trustee and a member of the Finance Committee of AHRC of Nassau County (2006-present). |
Albert R. Gamper, Jr. (64) |
| Year of Election or Appointment: 2006 Prior to his retirement in December 2004, Mr. Gamper served as Chairman of the Board of CIT Group Inc. (commercial finance). During his tenure with CIT Group Inc. Mr. Gamper served in numerous senior management positions, including Chairman (1987-1989; 1999-2001; 2002-2004), Chief Executive Officer (1987-2004), and President (1989-2002). He currently serves as a member of the Board of Directors of Public Service Enterprise Group (utilities, 2001-present), Chairman of the Board of Governors, Rutgers University (2004-present), and Chairman of the Board of Saint Barnabas Health Care System. |
George H. Heilmeier (70) |
| Year of Election or Appointment: 2004 Dr. Heilmeier is Chairman Emeritus of Telcordia Technologies (communication software and systems), where prior to his retirement, he served as company Chairman and Chief Executive Officer. He currently serves on the Boards of Directors of The Mitre Corporation (systems engineering and information technology support for the government), and HRL Laboratories (private research and development, 2004-present). He is Chairman of the General Motors Science & Technology Advisory Board and a Life Fellow of the Institute of Electrical and Electronics Engineers (IEEE). Dr. Heilmeier is a member of the Defense Science Board and the National Security Agency Advisory Board. He is also a member of the National Academy of Engineering, the American Academy of Arts and Sciences, and the Board of Overseers of the School of Engineering and Applied Science of the University of Pennsylvania. Previously, Dr. Heilmeier served as a Director of TRW Inc. (automotive, space, defense, and information technology, 1992-2002), Compaq (1994-2002), Automatic Data Processing, Inc. (ADP) (technology-based business outsourcing, 1995-2002), INET Technologies Inc. (telecommunications network surveillance, 2001-2004), and Teletech Holdings (customer management services). He is the recipient of the 2005 Kyoto Prize in Advanced Technology for his invention of the liquid crystal display, and a member of the Consumer Electronics Hall of Fame. |
Marie L. Knowles (60) |
| Year of Election or Appointment: 2001 Prior to Ms. Knowles' retirement in June 2000, she served as Executive Vice President and Chief Financial Officer of Atlantic Richfield Company (ARCO) (diversified energy, 1996-2000). From 1993 to 1996, she was a Senior Vice President of ARCO and President of ARCO Transportation Company. She served as a Director of ARCO from 1996 to 1998. She currently serves as a Director of Phelps Dodge Corporation (copper mining and manufacturing) and McKesson Corporation (healthcare service, 2002-present). Ms. Knowles is a Trustee of the Brookings Institution and the Catalina Island Conservancy and also serves as a member of the Advisory Board for the School of Engineering of the University of Southern California. |
Ned C. Lautenbach (62) |
| Year of Election or Appointment: 2000 Mr. Lautenbach is Chairman of the Independent Trustees (2006-present). Mr. Lautenbach has been a partner of Clayton, Dubilier & Rice, Inc. (private equity investment firm) since September 1998. Previously, Mr. Lautenbach was with the International Business Machines Corporation (IBM) from 1968 until his retirement in 1998. Mr. Lautenbach serves as a Director of Sony Corporation (2006-present) and Eaton Corporation (diversified industrial) as well as the Philharmonic Center for the Arts in Naples, Florida. He also is a member of the Board of Trustees of Fairfield University (2005-present), as well as a member of the Council on Foreign Relations. |
William O. McCoy (73) |
| Year of Election or Appointment: 1997 Prior to his retirement in December 1994, Mr. McCoy was Vice Chairman of the Board of BellSouth Corporation (telecommunications) and President of BellSouth Enterprises. He is currently a Director of Duke Realty Corporation (real estate). He is also a partner of Franklin Street Partners (private investment management firm). In addition, Mr. McCoy served as the Interim Chancellor (1999-2000) and a member of the Board of Visitors for the University of North Carolina at Chapel Hill and currently serves as Chairman of the Board of Directors of the University of North Carolina Health Care System. He also served as Vice President of Finance for the University of North Carolina (16-school system). |
Cornelia M. Small (62) |
| Year of Election or Appointment: 2005 Ms. Small is a member (2000-present) and Chairperson (2002-present) of the Investment Committee, and a member (2002-present) of the Board of Trustees of Smith College. Previously, she served as Chief Investment Officer (1999-2000), Director of Global Equity Investments (1996-1999), and a member of the Board of Directors of Scudder, Stevens & Clark (1990-1997) and Scudder Kemper Investments (1997-1999). In addition, Ms. Small served as Co-Chair (2000-2003) of the Annual Fund for the Fletcher School of Law and Diplomacy. |
William S. Stavropoulos (67) |
| Year of Election or Appointment: 2001 Mr. Stavropoulos is Chairman Emeritus of the Board of Directors of The Dow Chemical Company. Since joining The Dow Chemical Company in 1967, Mr. Stavropoulos served in numerous senior management positions, including President (1993-2000; 2002-2003), CEO (1995-2000; 2002-2004), and Chairman of the Executive Committee (2000-2004). Currently, he is a Director of NCR Corporation (data warehousing and technology solutions), BellSouth Corporation (telecommunications), Chemical Financial Corporation, Maersk Inc. (industrial conglomerate, 2002-present), and Metalmark Capital (private equity investment firm, 2005-present). He also serves as a member of the Board of Trustees of the American Enterprise Institute for Public Policy Research. In addition, Mr. Stavropoulos is a member of The Business Council, J.P. Morgan International Council and the University of Notre Dame Advisory Council for the College of Science. |
Kenneth L. Wolfe (67) |
| Year of Election or Appointment: 2005 Prior to his retirement in 2001, Mr. Wolfe was Chairman and Chief Executive Officer of Hershey Foods Corporation (1993-2001). He currently serves as a member of the boards of Adelphia Communications Corporation (2003-present), Bausch & Lomb, Inc., and Revlon Inc. (2004-present). |
Advisory Board Members and Executive Officers:
Correspondence intended for Mr. Keyes may be sent to Fidelity Investments, P.O. Box 55235, Boston, Massachusetts 02205-5235. Correspondence intended for each executive officer and Mr. Lynch may be sent to Fidelity Investments, 82 Devonshire Street, Boston, Massachusetts 02109.
Annual Report
Name, Age; Principal Occupation |
James H. Keyes (66) |
| Year of Election or Appointment: 2006 Member of the Advisory Board of Fidelity Investment Trust. Prior to his retirement in 2003, Mr. Keyes was Chairman, President, and Chief Executive Officer of Johnson Controls, Inc. (automotive supplier, 1993-2003). He currently serves as a member of the boards of LSI Logic Corporation (semiconductor technologies), Navistar International Corporation (manufacture and sale of trucks, buses, and diesel engines, 2002-present), and Pitney Bowes, Inc. (integrated mail, messaging, and document management solutions). |
Peter S. Lynch (62) |
| Year of Election or Appointment: 2003 Member of the Advisory Board of Fidelity Investment Trust. Mr. Lynch is Vice Chairman and a Director of FMR, and Vice Chairman (2001-present) and a Director of FMR Co., Inc. Previously, Mr. Lynch served as a Trustee of the Fidelity funds (1990-2003). In addition, he serves as a Trustee of Boston College and as the Chairman of the Inner-City Scholarship Fund. |
Dwight D. Churchill (52) |
| Year of Election or Appointment: 2005 Vice President of International Discovery. Mr. Churchill also serves as Vice President of certain Equity Funds (2005-present). Mr. Churchill is Executive Vice President of FMR (2005-present) and FMR Co., Inc. (2005-present). Previously, Mr. Churchill served as Senior Vice President of Fidelity Investments Money Management, Inc. (2005-2006), Head of Fidelity's Fixed-Income Division (2000-2005), Vice President of Fidelity's Money Market Funds (2000-2005), Vice President of Fidelity's Bond Funds, and Senior Vice President of FMR. |
Eric M. Wetlaufer (44) |
| Year of Election or Appointment: 2006 Vice President of International Discovery. Mr. Wetlaufer also serves as Vice President of certain International Equity Funds (2006-present). Mr. Wetlaufer is Senior Vice President of FMR (2006-present) and FMR Co., Inc. (2006-present), and President and Director of Fidelity Management & Research (U.K.) Inc. (2006-present) and Fidelity Research & Analysis Company (2006-present). Before joining Fidelity Investments in 2005, Mr. Wetlaufer was a partner in Oxhead Capital Management (2004-2005). Previously, Mr. Wetlaufer served as a Chief Investment Officer of Putnam Investments (1997-2003). |
William Kennedy (38) |
| Year of Election or Appointment: 2004 Vice President of International Discovery. Mr. Kennedy also serves as Vice President of other funds advised by FMR. Prior to assuming his current responsibilities, Mr. Kennedy worked as a research analyst and portfolio manager. Mr. Kennedy also serves as a Vice President of FMR (2000) and FMR Co., Inc. (2001). |
Eric D. Roiter (57) |
| Year of Election or Appointment: 1998 Secretary of International Discovery. He also serves as Secretary of other Fidelity funds; Vice President, General Counsel, and Secretary of FMR Co., Inc. (2001-present) and FMR; Assistant Secretary of Fidelity Management & Research (U.K.) Inc. (2001-present), Fidelity Research & Analysis Company (2001-present), and Fidelity Investments Money Management, Inc. (2001-present). Mr. Roiter is an Adjunct Member, Faculty of Law, at Boston College Law School (2003-present). Previously, Mr. Roiter served as Vice President and Secretary of Fidelity Distributors Corporation (FDC) (1998-2005). |
Stuart Fross (47) |
| Year of Election or Appointment: 2003 Assistant Secretary of International Discovery. Mr. Fross also serves as Assistant Secretary of other Fidelity funds (2003-present), Vice President and Secretary of FDC (2005-present), and is an employee of FMR. |
Christine Reynolds (48) |
| Year of Election or Appointment: 2004 President and Treasurer of International Discovery. Ms. Reynolds also serves as President and Treasurer of other Fidelity funds (2004-present) and is a Vice President (2003-present) and an employee (2002-present) of FMR. Before joining Fidelity Investments, Ms. Reynolds worked at PricewaterhouseCoopers LLP (PwC) (1980-2002), where she was most recently an audit partner with PwC's investment management practice. |
R. Stephen Ganis (40) |
| Year of Election or Appointment: 2006 Anti-Money Laundering (AML) officer of International Discovery. Mr. Ganis also serves as AML officer of other Fidelity funds (2006-present) and FMR Corp. (2003-present). Before joining Fidelity Investments, Mr. Ganis practiced law at Goodwin Procter, LLP (2000-2002). |
Joseph B. Hollis (58) |
| Year of Election or Appointment: 2006 Chief Financial Officer of International Discovery. Mr. Hollis also serves as Chief Financial Officer of other Fidelity funds. Mr. Hollis is President of Fidelity Pricing and Cash Management Services (FPCMS) (2005-present). Mr. Hollis also serves as President and Director of Fidelity Service Company, Inc. (2006-present). Previously, Mr. Hollis served as Senior Vice President of Cash Management Services (1999-2002) and Investment Management Operations (2002-2005). |
Kenneth A. Rathgeber (59) |
| Year of Election or Appointment: 2004 Chief Compliance Officer of International Discovery. Mr. Rathgeber also serves as Chief Compliance Officer of other Fidelity funds (2004-present) and Executive Vice President of Risk Oversight for Fidelity Investments (2002-present). He is Chief Compliance Officer of FMR (2005-present), FMR Co., Inc. (2005-present), Fidelity Management & Research (U.K.) Inc. (2005-present), Fidelity Research & Analysis Company (2005-present), Fidelity Investments Money Management, Inc. (2005-present), and Strategic Advisers, Inc. (2005-present). Previously, Mr. Rathgeber served as Executive Vice President and Chief Operating Officer for Fidelity Investments Institutional Services Company, Inc. (1998-2002). |
Bryan A. Mehrmann (45) |
| Year of Election or Appointment: 2005 Deputy Treasurer of International Discovery. Mr. Mehrmann also serves as Deputy Treasurer of other Fidelity funds (2005-present) and is an employee of FMR. Previously, Mr. Mehrmann served as Vice President of Fidelity Investments Institutional Services Group (FIIS)/Fidelity Investments Institutional Operations Corporation, Inc. (FIIOC) Client Services (1998-2004). |
Kimberley H. Monasterio (42) |
| Year of Election or Appointment: 2004 Deputy Treasurer of International Discovery. Ms. Monasterio also serves as Deputy Treasurer of other Fidelity funds (2004) and is an employee of FMR (2004). Before joining Fidelity Investments, Ms. Monasterio served as Treasurer (2000-2004) and Chief Financial Officer (2002-2004) of the Franklin Templeton Funds and Senior Vice President of Franklin Templeton Services, LLC (2000-2004). |
Kenneth B. Robins (37) |
| Year of Election or Appointment: 2005 Deputy Treasurer of International Discovery. Mr. Robins also serves as Deputy Treasurer of other Fidelity funds (2005-present) and is an employee of FMR (2004-present). Before joining Fidelity Investments, Mr. Robins worked at KPMG LLP, where he was a partner in KPMG's department of professional practice (2002-2004) and a Senior Manager (1999-2000). In addition, Mr. Robins served as Assistant Chief Accountant, United States Securities and Exchange Commission (2000-2002). |
Robert G. Byrnes (39) |
| Year of Election or Appointment: 2005 Assistant Treasurer of International Discovery. Mr. Byrnes also serves as Assistant Treasurer of other Fidelity funds (2005-present) and is an employee of FMR (2005-present). Previously, Mr. Byrnes served as Vice President of FPCMS (2003-2005). Before joining Fidelity Investments, Mr. Byrnes worked at Deutsche Asset Management where he served as Vice President of the Investment Operations Group (2000-2003). |
John H. Costello (60) |
| Year of Election or Appointment: 1986 Assistant Treasurer of International Discovery. Mr. Costello also serves as Assistant Treasurer of other Fidelity funds and is an employee of FMR. |
Peter L. Lydecker (52) |
| Year of Election or Appointment: 2004 Assistant Treasurer of International Discovery. Mr. Lydecker also serves as Assistant Treasurer of other Fidelity funds (2004) and is an employee of FMR. |
Mark Osterheld (51) |
| Year of Election or Appointment: 2002 Assistant Treasurer of International Discovery. Mr. Osterheld also serves as Assistant Treasurer of other Fidelity funds (2002) and is an employee of FMR. |
Gary W. Ryan (48) |
| Year of Election or Appointment: 2005 Assistant Treasurer of International Discovery. Mr. Ryan also serves as Assistant Treasurer of other Fidelity funds (2005-present) and is an employee of FMR (2005-present). Previously, Mr. Ryan served as Vice President of Fund Reporting in FPCMS (1999-2005). |
Salvatore Schiavone (40) |
| Year of Election or Appointment: 2005 Assistant Treasurer of International Discovery. Mr. Schiavone also serves as Assistant Treasurer of other Fidelity funds (2005-present) and is an employee of FMR (2005-present). Before joining Fidelity Investments, Mr. Schiavone worked at Deutsche Asset Management, where he most recently served as Assistant Treasurer (2003-2005) of the Scudder Funds and Vice President and Head of Fund Reporting (1996-2003). |
Annual Report
Distributions
The Board of Trustees of Advisor International Discovery voted to pay to shareholders of record at the opening of business on record date, the following distributions per share derived from capital gains realized from sales of portfolio securities, and dividends derived from net investment income:
| Pay Date | Record Date | Dividends | Capital Gains |
International
Discovery Fund | 12/04/06 | 12/01/06 | $.376 | $.98 |
The fund hereby designates as a capital gain dividend with respect to the taxable year ended October 31, 2006, $165,476,023, or, if subsequently determined to be different, the net capital gain of such year.
Class International Discovery Fund designates 45% of the dividend distributed during the fiscal year as amounts which may be taken into account as a dividend for purposes of the maximum rate under section 1(h)(11) of the Internal Revenue Code.
The amounts per share which represent income derived from sources within, and taxes paid to, foreign countries or possessions of the United States are as follows:
| Pay Date | Income | Taxes |
International
Discovery Fund | 12/05/05 | $.327 | $.03 |
The fund will notify shareholders in January 2007 of amounts for use in preparing 2006 income tax returns.
Annual Report
Board Approval of Investment Advisory Contracts and Management Fees
Fidelity International Discovery Fund
Each year, typically in July, the Board of Trustees, including the Independent Trustees (together, the Board), votes on the renewal of the management contract and sub-advisory agreements (together, the Advisory Contracts) for the fund. The Board, assisted by the advice of fund counsel and Independent Trustees' counsel, requests and considers a broad range of information throughout the year.
The Board meets regularly each month except August and takes into account throughout the year matters bearing on Advisory Contracts. The Board, acting directly and through its separate committees, considers at each of its meetings factors that are relevant to the annual renewal of the fund's Advisory Contracts, including the services and support provided to the fund and its shareholders. At the time of the renewal, the Board had 12 standing committees, each composed of Independent Trustees with varying backgrounds, to which the Board has assigned specific subject matter responsibilities in order to enhance effective decision-making by the Board. Each committee has adopted a written charter outlining the structure and purposes of the committee. One such committee, the Equity Contract Committee, meets periodically as needed throughout the year to consider matters specifically related to the annual renewal of Advisory Contracts. The committee requests and receives information on, and makes recommendations to the Independent Trustees concerning, the approval and annual review of the Advisory Contracts.
At its July 2006 meeting, the Board of Trustees, including the Independent Trustees, unanimously determined to renew the Advisory Contracts for the fund. In reaching its determination, the Board considered all factors it believed relevant, including (i) the nature, extent, and quality of the services to be provided to the fund and its shareholders (including the investment performance of the fund); (ii) the competitiveness of the management fee and total expenses of the fund; (iii) the total costs of the services to be provided by and the profits to be realized by the investment adviser and its affiliates from the relationship with the fund; (iv) the extent to which economies of scale would be realized as the fund grows; and (v) whether fee levels reflect these economies of scale, if any, for the benefit of fund shareholders.
In determining whether to renew the Advisory Contracts for the fund, the Board ultimately reached a determination, with the assistance of fund counsel and Independent Trustees' counsel, that the renewal of the Advisory Contracts and the compensation to be received by Fidelity under the management contract is consistent with Fidelity's fiduciary duty under applicable law. In addition to evaluating the specific factors noted above, the Board, in reaching its determination, is aware that shareholders in the fund have a broad range of investment choices available to them, including a wide choice among mutual funds offered by competitors to Fidelity, and that the fund's shareholders, with the opportunity to review and weigh the disclosure provided by the fund in its prospectus and other public disclosures, have chosen to invest in this fund, managed by Fidelity.
Annual Report
Board Approval of Investment Advisory Contracts and
Management Fees - continued
Nature, Extent, and Quality of Services Provided. The Board considered staffing within the investment adviser, FMR, and the sub-advisers (together, the Investment Advisers), including the background of the fund's portfolio manager and the fund's investment objective and discipline. The Independent Trustees also had discussions with senior management of Fidelity's investment operations and investment groups. The Board considered the structure of the portfolio manager compensation program and whether this structure provides appropriate incentives.
Resources Dedicated to Investment Management and Support Services. The Board reviewed the size, education, and experience of the Investment Advisers' investment staff, their use of technology, and the Investment Advisers' approach to recruiting, training, and retaining portfolio managers and other research, advisory, and management personnel. The Board considered Fidelity's extensive global research capabilities that enable the Investment Advisers to aggregate data from various sources in an effort to produce positive investment results. The Board noted that Fidelity's analysts have access to a variety of technological tools that enable them to perform both fundamental and quantitative analysis and to specialize in various disciplines. The Board also considered that Fidelity's portfolio managers and analysts have access to daily portfolio attribution that allows for monitoring of a fund's portfolio, as well as an electronic communication system that provides immediate real-time access to research concerning issuers and credit enhancers.
Shareholder and Administrative Services. The Board considered (i) the nature, extent, quality, and cost of administrative, distribution, and shareholder services performed by the Investment Advisers and their affiliates under the Advisory Contracts and under separate agreements covering transfer agency, pricing and bookkeeping, and securities lending services for the fund; (ii) the nature and extent of the Investment Advisers' supervision of third party service providers, principally custodians and subcustodians; and (iii) the resources devoted to, and the record of compliance with, the fund's compliance policies and procedures. The Board reviewed the allocation of fund brokerage, including allocations to brokers affiliated with the Investment Advisers, the use of brokerage commissions to pay fund expenses, and the use of "soft" commission dollars to pay for research services. The Board also considered that Fidelity voluntarily pays for market data out of its own resources.
The Board noted that the growth of fund assets across the complex allows Fidelity to reinvest in the development of services designed to enhance the value or convenience of the Fidelity funds as investment vehicles. These services include 24-hour access to account information and market information through phone representatives and over the Internet, and investor education materials and asset allocation tools.
Annual Report
Investment in a Large Fund Family. The Board considered the benefits to shareholders of investing in a Fidelity fund, including the benefits of investing in a fund that is part of a large family of funds offering a variety of investment disciplines and providing for a large variety of mutual fund investor services. For example, fund shareholders are offered the privilege of exchanging shares of the fund for shares of other Fidelity funds, as set forth in the fund's prospectus, without paying an additional sales charge. The Board noted that, since the last Advisory Contract renewals in July 2005, Fidelity has taken a number of actions that benefited particular funds, including (i) dedicating additional resources to investment research and to restructure the investment research teams; (ii) voluntarily entering into contractual arrangements with certain brokers pursuant to which Fidelity pays for research products and services separately out of its own resources, rather than bundling with fund commissions; (iii) launching the Fidelity Advantage Class of its five Spartan stock index funds and three Spartan bond index funds, which is a lower-fee class available to shareholders with higher account balances; (iv) contractually agreeing to impose expense limitations on Fidelity U.S. Bond Index Fund and reducing the fund's initial investment minimum; and (v) offering shareholders of each of the Fidelity Institutional Money Market Funds the privilege of exchanging shares of the fund for shares of other Fidelity funds.
Investment Performance and Compliance. The Board considered whether the fund has operated within its investment objective, as well as its record of compliance with its investment restrictions. It also reviewed the fund's absolute investment performance for Fidelity International Discovery (retail class), as well as the fund's relative investment performance for Fidelity International Discovery (retail class) measured against (i) a broad-based securities market index, and (ii) a peer group of mutual funds deemed appropriate by the Board over multiple periods. The following charts considered by the Board show, over the one-, three-, and five-year periods ended December 31, 2005, the cumulative total returns of Fidelity International Discovery (retail class), the cumulative total returns of a broad-based securities market index ("benchmark"), and a range of cumulative total returns of a peer group of mutual funds identified by Lipper Inc. as having an investment objective similar to that of the fund. (The Advisor classes of the fund had less than one year of performance as of December 31, 2005.) The box within each chart shows the 25th percentile return (bottom of box) and the 75th percentile return (top of box) of the Lipper peer group. Returns shown above the box are in the first quartile and returns shown below the box are in the fourth quartile. The percentage beaten numbers noted below each chart correspond to the percentile box and represent the percentage of funds in the Lipper peer group whose performance was equal to or lower than that of Fidelity International Discovery (retail class).
Annual Report
Board Approval of Investment Advisory Contracts and
Management Fees - continued
Fidelity International Discovery Fund

The Board reviewed the fund's relative investment performance against its Lipper peer group and stated that the performance of Fidelity International Discovery (retail class) was in the first quartile for all the periods shown. The Board also stated that the relative investment performance of Fidelity International Discovery (retail class) compared favorably to its benchmark for all the periods shown. The Board also reviewed the fund's relative investment performance against a peer group defined by Morningstar.
The Board also considered that the fund's management fee is subject to upward or downward adjustment depending upon whether, and to what extent, the fund's investment performance for the performance period exceeds, or is exceeded by, the record (over the same period) of a Board-approved performance adjustment index. The Board realizes that the performance adjustment provides FMR with a strong economic incentive to seek to achieve superior performance for the fund's shareholders and helps to more closely align the interests of FMR and the fund's shareholders.
The Board considered that FMR has taken steps to refocus and strengthen equity research, equity portfolio management, and compliance. The Board noted with favor FMR's reorganization of its senior management team in 2005 and FMR's dedication of additional resources to investment research, and participated in the process that led to those changes.
Based on its review, and giving particular weight to the nature and quality of the resources dedicated by the Investment Advisers to maintain and improve relative performance, the Board concluded that the nature, extent, and quality of the services provided to the fund will benefit the fund's shareholders, particularly in light of the Board's view that the fund's shareholders benefit from investing in a fund that is part of a large family of funds offering a variety of investment disciplines and services.
Annual Report
Competitiveness of Management Fee and Total Fund Expenses. The Board considered the fund's management fee and total expenses compared to "mapped groups" of competitive funds and classes. Fidelity creates "mapped groups" by combining similar Lipper investment objective categories that have comparable management fee characteristics. Combining Lipper investment objective categories aids the Board's management fee and total expense comparisons by broadening the competitive group used for comparison and by reducing the number of universes to which various Fidelity funds are compared.
The Board considered two proprietary management fee comparisons for the 12-month periods shown in the chart below. The group of Lipper funds used by the Board for management fee comparisons is referred to below as the "Total Mapped Group" and, for the reasons explained above, is broader than the Lipper peer group used by the Board for performance comparisons. The Total Mapped Group comparison focuses on a fund's standing relative to the total universe of comparable funds available to investors, in terms of gross management fees before expense reimbursements or caps, and without giving effect to the fund's performance adjustment. "TMG %" represents the percentage of funds in the Total Mapped Group that had management fees that were lower than the fund's. For example, a TMG % of 13% means that 87% of the funds in the Total Mapped Group had higher management fees than the fund. The "Asset-Size Peer Group" (ASPG) comparison focuses on a fund's standing relative to non-Fidelity funds similar in size to the fund within the Total Mapped Group. The ASPG represents at least 15% of the funds in the Total Mapped Group with comparable asset size and management fee characteristics, subject to a minimum of 50 funds (or all funds in the Total Mapped Group if fewer than 50). Additional information, such as the ASPG quartile in which the fund's management fee ranked and the impact of the fund's performance adjustment, is also included in the chart and considered by the Board.
Annual Report
Board Approval of Investment Advisory Contracts and
Management Fees - continued
Fidelity International Discovery Fund
The Board noted that the fund's management fee ranked below the median of its Total Mapped Group and below the median of its ASPG for 2005. The Board also noted the effect of the fund's positive performance adjustment on the fund's management fee ranking. The Board noted that the performance adjustment for 2005 represents calculations for rolling 36-month periods that differ from the periods shown in the performance charts above.
Based on its review, the Board concluded that the fund's management fee was fair and reasonable in light of the services that the fund receives and the other factors considered.
In its review of each class's total expenses, the Board considered the fund's management fee as well as other fund or class expenses, as applicable, such as transfer agent fees, pricing and bookkeeping fees, fund-paid 12b-1 fees, and custodial, legal, and audit fees. The Board also noted the effects of any waivers and reimbursements on fees and expenses, as well as the fund's positive performance adjustment. As part of its review, the Board also considered current and historical total expenses of each class of the fund compared to competitive fund median expenses. Each class of the fund is compared to those funds and classes in the Total Mapped Group (used by the Board for management fee comparisons) that have a similar sales load structure.
The Board noted that the total expenses of each of Class A, Class B, Class C, Institutional Class and Fidelity International Discovery (retail class) ranked below its competitive median for 2005, and the total expenses of Class T ranked above its competitive median for 2005. The Board noted that the fund offers multiple classes, each of which has a different sales load and 12b-1 fee structure, and that the multiple structures are intended to offer a range of pricing options for the intermediary market. The Board also noted that the total expenses of the classes vary primarily by the level of their 12b-1 fees, although differences in transfer agent fees may also cause expenses to vary from class to class.
Annual Report
In its review of total expenses, the Board also considered Fidelity fee structures and other information on clients that FMR and its affiliates service in other competitive markets, such as other mutual funds advised or subadvised by FMR or its affiliates, pension plan clients, and other institutional clients.
Based on its review, the Board concluded that the total expenses of each class of the fund were reasonable, although in one case above the median of the universe presented for comparison, in light of the services that the fund and its shareholders receive and the other factors considered.
Costs of the Services and Profitability. The Board considered the revenues earned and the expenses incurred by Fidelity in conducting the business of developing, marketing, distributing, managing, administering and servicing the fund and its shareholders. The Board also considered the level of Fidelity's profits in respect of all the Fidelity funds.
On an annual basis, FMR presents to the Board Fidelity's profitability for the fund. Fidelity calculates the profitability for each fund, as well as aggregate profitability for groups of Fidelity funds and all Fidelity funds, using a series of detailed revenue and cost allocation methodologies which originate with the audited books and records of Fidelity. The Audit Committee of the Board reviews any significant changes from the prior year's methodologies.
PricewaterhouseCoopers LLP (PwC), independent registered accounting firm and auditor to Fidelity and certain Fidelity funds, has been engaged annually by the Board as part of the Board's assessment of the results of Fidelity's profitability analysis. PwC's engagement includes the review and assessment of Fidelity's methodologies used in determining the revenues and expenses attributable to Fidelity's mutual fund business, and completion of agreed-upon procedures surrounding the mathematical accuracy of fund profitability and its conformity to allocation methodologies. After considering PwC's reports issued under the engagement and information provided by Fidelity, the Board believes that while other allocation methods may also be reasonable, Fidelity's profitability methodologies are reasonable in all material respects.
The Board has also reviewed Fidelity's non-fund businesses and any fall-out benefits related to the mutual fund business as well as cases where Fidelity's affiliates may benefit from or be related to the fund's business.
The Board considered the costs of the services provided by and the profits realized by Fidelity in connection with the operation of the fund and determined that the amount of profit is a fair entrepreneurial profit for the management of the fund.
Annual Report
Board Approval of Investment Advisory Contracts and
Management Fees - continued
Economies of Scale. The Board considered whether there have been economies of scale in respect of the management of the Fidelity funds, whether the Fidelity funds (including the fund) have appropriately benefited from any such economies of scale, and whether there is potential for realization of any further economies of scale. The Board considered the extent to which the fund will benefit from economies of scale through increased services to the fund, through waivers or reimbursements, or through fee or expense reductions, including reductions that occur through operation of the transfer agent agreement. The transfer agent fee varies in part based on the number of accounts in the fund. If the number of accounts decreases or the average account size increases, the overall transfer agent fee rate decreases.
The Board recognized that the fund's management contract incorporates a "group fee" structure, which provides for lower fee rates as total fund assets under FMR's management increase, and for higher fee rates as total fund assets under FMR's management decrease. The Board considered that the group fee is designed to deliver the benefits of economies of scale to fund shareholders when total fund assets increase, even if assets of any particular fund are unchanged or have declined, because some portion of Fidelity's costs are attributable to services provided to all Fidelity funds, and all funds benefit if those costs can be allocated among more assets. The Board concluded that, given the group fee structure, fund shareholders will achieve a certain level of economies of scale as assets under FMR's management increase at the fund complex level, regardless of whether Fidelity achieves any such economies of scale.
The Board further concluded that any potential economies of scale are being shared between fund shareholders and Fidelity in an appropriate manner.
Additional Information Requested by the Board. In order to develop fully the factual basis for consideration of the Advisory Contracts, the Board requested additional information on several topics, including (i) Fidelity's fund profitability methodology and profitability trends within certain funds; (ii) portfolio manager compensation; (iii) the extent to which any economies of scale exist and are shared between the funds and Fidelity; (iv) the total expenses of certain funds and classes relative to competitors, including the extent to which the expenses of certain funds have been or could be capped; (v) fund performance trends; and (vi) Fidelity's fee structures, including use of performance fees.
Based on its evaluation of all of the conclusions noted above, and after considering all material factors, the Board ultimately concluded that the advisory fee structures are fair and reasonable, and that the fund's Advisory Contracts should be renewed.
Annual Report
Managing Your Investments
Fidelity offers several ways to conveniently manage your personal investments via your telephone or PC. You can access your account information, conduct trades and research your investments 24 hours a day.
By Phone
Fidelity Automated Service Telephone provides a single toll-free number to access account balances, positions, quotes and trading. It's easy to navigate the service, and on your first call, the system will help you create a personal identification number (PIN) for security.
(phone_graphic)Fidelity Automated
Service Telephone (FAST®)
1-800-544-5555
Press
1 For mutual fund and brokerage trading.
2 For quotes.*
3 For account balances and holdings.
4 To review orders and mutual
fund activity.
5 To change your PIN.
*0 To speak to a Fidelity representative.
By PC
Fidelity's web site on the Internet provides a wide range of information, including daily financial news, fund performance, interactive planning tools and news about Fidelity products and services.
(computer_graphic)Fidelity's Web Site
www.fidelity.com
* When you call the quotes line, please remember that a fund's yield and return will vary and, except for money market funds, share price will also vary. This means that you may have a gain or loss when you sell your shares. There is no assurance that money market funds will be able to maintain a stable $1 share price; an investment in a money market fund is not insured or guaranteed by the U.S. government. Total returns are historical and include changes in share price, reinvestment of dividends and capital gains, and the effects of any sales charges.
Annual Report
To Visit Fidelity
For directions and hours,
please call 1-800-544-9797.
Arizona
7001 West Ray Road
Chandler, AZ
15445 N. Scottsdale Road
Scottsdale, AZ
California
815 East Birch Street
Brea, CA
1411 Chapin Avenue
Burlingame, CA
851 East Hamilton Avenue
Campbell, CA
19200 Von Karman Avenue
Irvine, CA
601 Larkspur Landing Circle
Larkspur, CA
10100 Santa Monica Blvd.
Los Angeles, CA
27101 Puerta Real
Mission Viejo, CA
73-575 El Paseo
Palm Desert, CA
251 University Avenue
Palo Alto, CA
123 South Lake Avenue
Pasadena, CA
16995 Bernardo Ctr. Drive
Rancho Bernardo, CA
1220 Roseville Parkway
Roseville, CA
1740 Arden Way
Sacramento, CA
7676 Hazard Center Drive
San Diego, CA
11943 El Camino Real
San Diego, CA
8 Montgomery Street
San Francisco, CA
3793 State Street
Santa Barbara, CA
1200 Wilshire Boulevard
Santa Monica, CA
21701 Hawthorne Boulevard
Torrance, CA
2001 North Main Street
Walnut Creek, CA
6300 Canoga Avenue
Woodland Hills, CA
Colorado
1625 Broadway
Denver, CO
9185 Westview Road
Lone Tree, CO
Connecticut
48 West Putnam Avenue
Greenwich, CT
265 Church Street
New Haven, CT
300 Atlantic Street
Stamford, CT
29 South Main Street
West Hartford, CT
Delaware
400 Delaware Avenue
Wilmington, DE
Florida
4400 N. Federal Highway
Boca Raton, FL
121 Alhambra Plaza
Coral Gables, FL
2948 N. Federal Highway
Ft. Lauderdale, FL
4671 Town Center Parkway
Jacksonville, FL
1907 West State Road 434
Longwood, FL
8880 Tamiami Trail, North
Naples, FL
3501 PGA Boulevard
Palm Beach Gardens, FL
3550 Tamiami Trail, South
Sarasota, FL
1502 N. Westshore Blvd.
Tampa, FL
2465 State Road 7
Wellington, FL
Georgia
3445 Peachtree Road, N.E.
Atlanta, GA
1000 Abernathy Road
Atlanta, GA
Illinois
One North LaSalle Street
Chicago, IL
875 North Michigan Ave.
Chicago, IL
1415 West 22nd Street
Oak Brook, IL
1572 East Golf Road
Schaumburg, IL
3232 Lake Avenue
Wilmette, IL
Indiana
4729 East 82nd Street
Indianapolis, IN
Kansas
5400 College Boulevard
Overland Park, KS
Maine
Three Canal Plaza
Portland, ME
Maryland
7315 Wisconsin Avenue
Bethesda, MD
One W. Pennsylvania Ave.
Towson, MD
Massachusetts
801 Boylston Street
Boston, MA
155 Congress Street
Boston, MA
300 Granite Street
Braintree, MA
44 Mall Road
Burlington, MA
238 Main Street
Cambridge, MA
405 Cochituate Road
Framingham, MA
416 Belmont Street
Worcester, MA
Annual Report
Fidelity Brokerage Services, Inc., 100 Summer St., Boston, MA 02110 Member NYSE/SIPC
Michigan
500 E. Eisenhower Pkwy.
Ann Arbor, MI
280 Old N. Woodward Ave.
Birmingham, MI
43420 Grand River Avenue
Novi, MI
29155 Northwestern Hwy.
Southfield, MI
Minnesota
7600 France Avenue South
Edina, MN
Missouri
1524 South Lindbergh Blvd.
St. Louis, MO
Nevada
2225 Village Walk Drive
Henderson, NV
New Jersey
150 Essex Street
Millburn, NJ
56 South Street
Morristown, NJ
396 Route 17, North
Paramus, NJ
3518 Route 1 North
Princeton, NJ
530 Broad Street
Shrewsbury, NJ
New York
1055 Franklin Avenue
Garden City, NY
37 West Jericho Turnpike
Huntington Station, NY
1271 Avenue of the Americas
New York, NY
980 Madison Avenue
New York, NY
61 Broadway
New York, NY
350 Park Avenue
New York, NY
200 Fifth Avenue
New York, NY
733 Third Avenue
New York, NY
11 Penn Plaza
New York, NY
2070 Broadway
New York, NY
1075 Northern Blvd.
Roslyn, NY
799 Central Park Avenue
Scarsdale, NY
North Carolina
4611 Sharon Road
Charlotte, NC
7011 Fayetteville Road
Durham, NC
Ohio
3805 Edwards Road
Cincinnati, OH
1324 Polaris Parkway
Columbus, OH
28699 Chagrin Boulevard
Woodmere Village, OH
Oregon
7493 SW Bridgeport Road
Tigard, OR
Pennsylvania
600 West DeKalb Pike
King of Prussia, PA
1735 Market Street
Philadelphia, PA
12001 Perry Highway
Wexford, PA
Rhode Island
47 Providence Place
Providence, RI
Tennessee
6150 Poplar Avenue
Memphis, TN
Texas
10000 Research Boulevard
Austin, TX
4001 Northwest Parkway
Dallas, TX
12532 Memorial Drive
Houston, TX
2701 Drexel Drive
Houston, TX
6560 Fannin Street
Houston, TX
6500 N. MacArthur Blvd.
Irving, TX
6005 West Park Boulevard
Plano, TX
14100 San Pedro
San Antonio, TX
1576 East Southlake Blvd.
Southlake, TX
19740 IH 45 North
Spring, TX
Utah
279 West South Temple
Salt Lake City, UT
Virginia
1861 International Drive
McLean, VA
Washington
411 108th Avenue, N.E.
Bellevue, WA
1518 6th Avenue
Seattle, WA
Washington, DC
1900 K Street, N.W.
Washington, DC
Wisconsin
595 North Barker Road
Brookfield, WI
Annual Report
To Write Fidelity
We'll give your correspondence immediate attention and send you written confirmation upon completion of your request.
(letter_graphic)Making Changes
To Your Account
(such as changing name, address, bank, etc.)
Fidelity Investments
P.O. Box 770001
Cincinnati, OH 45277-0002
(letter_graphic)For Non-Retirement
Accounts
Buying shares
Fidelity Investments
P.O. Box 770001
Cincinnati, OH 45277-0003
Overnight Express
Fidelity Investments
Attn: Distribution Services
100 Crosby Parkway - KC1H
Covington, KY 41015
Selling shares
Fidelity Investments
P.O. Box 770001
Cincinnati, OH 45277-0035
Overnight Express
Fidelity Investments
Attn: Distribution Services
100 Crosby Parkway - KC1H
Covington, KY 41015
General Correspondence
Fidelity Investments
P.O. Box 500
Merrimack, NH 03054-0500
(letter_graphic)For Retirement
Accounts
Buying shares
Fidelity Investments
P.O. Box 770001
Cincinnati, OH 45277-0003
Selling shares
Fidelity Investments
P.O. Box 770001
Cincinnati, OH 45277-0035
Overnight Express
Fidelity Investments
Attn: Distribution Services
100 Crosby Parkway - KC1H
Covington, KY 41015
General Correspondence
Fidelity Investments
P.O. Box 500
Merrimack, NH 03054-0500
Annual Report
Annual Report
Annual Report
Annual Report
Investment Adviser
Fidelity Management & Research Company
Boston, MA
Investment Sub-Advisers
FMR Co., Inc.
Fidelity Management & Research
(U.K.) Inc.
Fidelity Research & Analysis Company
(formerly Fidelity Management &
Research (Far East) Inc.)
Fidelity International Investment
Advisors
Fidelity Investments Japan Limited
Fidelity International Investment
Advisors (U.K.) Limited
General Distributor
Fidelity Distributors Corporation
Boston, MA
Transfer and Service Agent
Fidelity Service Company, Inc.
Boston, MA
Custodian
JPMorgan Chase Bank
New York, NY
The Fidelity Telephone Connection
Mutual Fund 24-Hour Service
Exchanges/Redemptions
and Account Assistance 1-800-544-6666
Product Information 1-800-544-8888
Retirement Accounts 1-800-544-4774
(8 a.m. - 9 p.m.)
TDD Service 1-800-544-0118
for the deaf and hearing impaired
(9 a.m. - 9 p.m. Eastern time)
Fidelity Automated Service
Telephone (FAST®) (automated graphic) 1-800-544-5555
(automated graphic) Automated line for quickest service
(Fidelity Investment logo)(registered trademark)
Corporate Headquarters
82 Devonshire St., Boston, MA 02109
www.fidelity.com
IGI-UANN-1206
1.807257.102
(Fidelity Investment logo)(registered trademark)
Fidelity Advisor
International Discovery
Fund - Class A, Class T, Class B
and Class C
Annual Report
October 31, 2006
(2_fidelity_logos) (Registered_Trademark)
Class A, Class T, Class B, and Class C are classes of Fidelity® International Discovery Fund
Contents
Chairman's Message | 4 | Ned Johnson's message to shareholders. |
Performance | 5 | How the fund has done over time. |
Management's Discussion | 7 | The manager's review of fund performance, strategy and outlook. |
Shareholder Expense Example | 8 | An example of shareholder expenses. |
Investment Changes | 10 | A summary of major shifts in the fund's investments over the past six months. |
Investments | 12 | A complete list of the fund's investments with their market values. |
Financial Statements | 24 | Statements of assets and liabilities, operations, and changes in net assets,
as well as financial highlights. |
Notes | 34 | Notes to the financial statements. |
Report of Independent Registered Public Accounting Firm | 45 | |
Trustees and Officers | 46 | |
Distributions | 57 | |
Board Approval of Investment Advisory Contracts and Management Fees | 58 | |
To view a fund's proxy voting guidelines and proxy voting record for the 12-month period ended June 30, visit www.fidelity.com/proxyvotingresults or visit the Securities and Exchange Commission's (SEC) web site at www.sec.gov. You may also call 1-877-208-0098 to request a free copy of the proxy voting guidelines.
Standard & Poor's, S&P and S&P 500 are registered service marks of The McGraw-Hill Companies, Inc. and have been licensed for use by Fidelity Distributors Corporation.
Other third party marks appearing herein are the property of their respective owners.
All other marks appearing herein are registered or unregistered trademarks or service marks of FMR Corp. or an affiliated company.
Annual Report
This report and the financial statements contained herein are submitted for the general information of the shareholders of the fund. This report is not authorized for distribution to prospective investors in the fund unless preceded or accompanied by an effective prospectus.
A fund files its complete schedule of portfolio holdings with the SEC for the first and third quarters of each fiscal year on Form N-Q. Forms N-Q are available on the SEC's web site at http://www.sec.gov. A fund's Forms N-Q may be reviewed and copied at the SEC's Public Reference Room in Washington, DC. Information regarding the operation of the SEC's Public Reference Room may be obtained by calling 1-800-SEC-0330. For a complete list of a fund's portfolio holdings, view the most recent quarterly holdings report, semiannual report, or annual report on Fidelity's web site at http://www.advisor.fidelity.com.
NOT FDIC INSURED · MAY LOSE VALUE · NO BANK GUARANTEE
Neither the fund nor Fidelity Distributors Corporation is a bank.
Annual Report
Chairman's Message
(photo_of_Edward_C_Johnson_3d)
Dear Shareholder:
Stock and bond markets around the world have seen largely positive results year to date, although weakness in the technology sector and growth stocks in general have tempered performance. While financial markets are always unpredictable, there are a number of time-tested principles that can put the historical odds in your favor.
One of the basic tenets is to invest for the long term. Over time, riding out the markets' inevitable ups and downs has proven much more effective than selling into panic or chasing the hottest trend. Even missing only a few of the markets' best days can significantly diminish investor returns. Patience also affords the benefits of compounding - of earning interest on additional income or reinvested dividends and capital gains. There are tax advantages and cost benefits to consider as well. The more you sell, the more taxes you pay, and the more you trade, the higher the costs. While staying the course doesn't eliminate risk, it can considerably lessen the effect of short-term declines.
You can further manage your investing risk through diversification. And today, more than ever, geographic diversification should be taken into account. Studies indicate that asset allocation is the single most important determinant of a portfolio's long-term success. The right mix of stocks, bonds and cash - aligned to your particular risk tolerance and investment objective - is very important. Age-appropriate rebalancing is also an essential aspect of asset allocation. For younger investors, an emphasis on equities - which historically have been the best performing asset class over time - is encouraged. As investors near their specific goal, such as retirement or sending a child to college, consideration may be given to replacing volatile assets (e.g. common stocks) with more-stable fixed investments (bonds or savings plans).
A third investment principle - investing regularly - can help lower the average cost of your purchases. Investing a certain amount of money each month or quarter helps ensure you won't pay for all your shares at market highs. This strategy - known as dollar cost averaging - also reduces unconstructive "emotion" from investing, helping shareholders avoid selling weak performers just prior to an upswing, or chasing a hot performer just before a correction.
We invite you to contact us via the Internet, through our Investor Centers or over the phone. It is our privilege to provide you the information you need to make the investments that are right for you.
Sincerely,
/s/Edward C. Johnson 3d
Edward C. Johnson 3d
Annual Report
Fidelity Advisor International Discovery Fund - Class A, T, B, and C
Performance: The Bottom Line
Average annual total return reflects the change in the value of an investment, assuming reinvestment of the class' dividend income and capital gains (the profits earned upon the sale of securities that have grown in value) and assuming a constant rate of performance each year. The $10,000 table and the fund's returns do not reflect the deduction of taxes that a shareholder would pay on fund distributions or the redemption of fund shares. During periods of reimbursement by Fidelity, a fund's total return will be greater than it would be had the reimbursement not occurred. How a fund did yesterday is no guarantee of how it will do tomorrow.
Average Annual Total Returns
Periods ended October 31, 2006 | Past 1
year | Past 5
years | Past 10
years |
Class A (incl. 5.75% sales charge) A, E | 18.76% | 16.10% | 10.43% |
Class T (incl. 3.50% sales charge) B, E | 21.10% | 16.49% | 10.61% |
Class B (incl. contingent deferred sales charge) C, E | 19.91% | 16.91% | 10.91% |
Class C (incl. contingent deferred sales charge) D , E | 23.97% | 17.17% | 10.93% |
A Class A shares bear a 0.25% 12b-1 fee. The initial offering of Class A shares took place on Janu-ary 6, 2005. Returns prior to January 6, 2005 are those of International Discovery, the original class of the fund, which has no 12b-1 fee. Had Class A shares' 12b-1 fee been reflected, returns prior to January 6, 2005 would have been lower.
B Class T shares bear a 0.50% 12b-1 fee. The initial offering of Class T shares took place on Janu-ary 6, 2005. Returns prior to January 6, 2005 are those of International Discovery, the original class of the fund, which has no 12b-1 fee. Had Class T shares' 12b-1 fee been reflected, returns prior to January 6, 2005 would have been lower.
C Class B shares bear a 1.00% 12b-1 fee. The initial offering of Class B shares took place on Janu-ary 6, 2005. Returns prior to January 6, 2005 are those of International Discovery, the original class of the fund, which has no 12b-1 fee. Had Class B shares' 12b-1 fee been reflected, returns prior to January 6, 2005 would have been lower. Class B shares' contingent deferred sales charges included in the past one year, past five year, and past 10 year total return figures are 5%, 2%, and 0% respectively.
D Class C shares bear a 1.00% 12b-1 fee. The initial offering of Class C shares took place on Janu-ary 6, 2005. Returns prior to January 6, 2005 are those of International Discovery, the original class of the fund, which has no 12b-1 fee. Had Class C shares' 12b-1 fee been reflected, returns prior to January 6, 2005 would have been lower. Class C shares' contingent deferred sales charges included in the past one year, past five year, and past 10 year total return figures are 1%, 0%, and 0% respectively.
E Prior to October 1, 2004, the fund operated under certain different investment policies. Accordingly, the fund's historical performance may not represent its current investment policies.
Annual Report
Fidelity Advisor International Discovery Fund - Class A, T, B, and C
Performance - continued
$10,000 Over 10 Years
Let's say hypothetically that $10,000 was invested in Fidelity Advisor International Discovery Fund - Class T on October 31, 1996 and the current 3.50% sales charge was paid. The chart shows how the value of your investment would have changed, and also shows how the Morgan Stanley Capital InternationalSM Europe, Australasia, Far East (MSCI® EAFE®) Index performed over the same period. The initial offering of Class T took place on January 6, 2005. See the previous page for additional information regarding the performance of Class T.
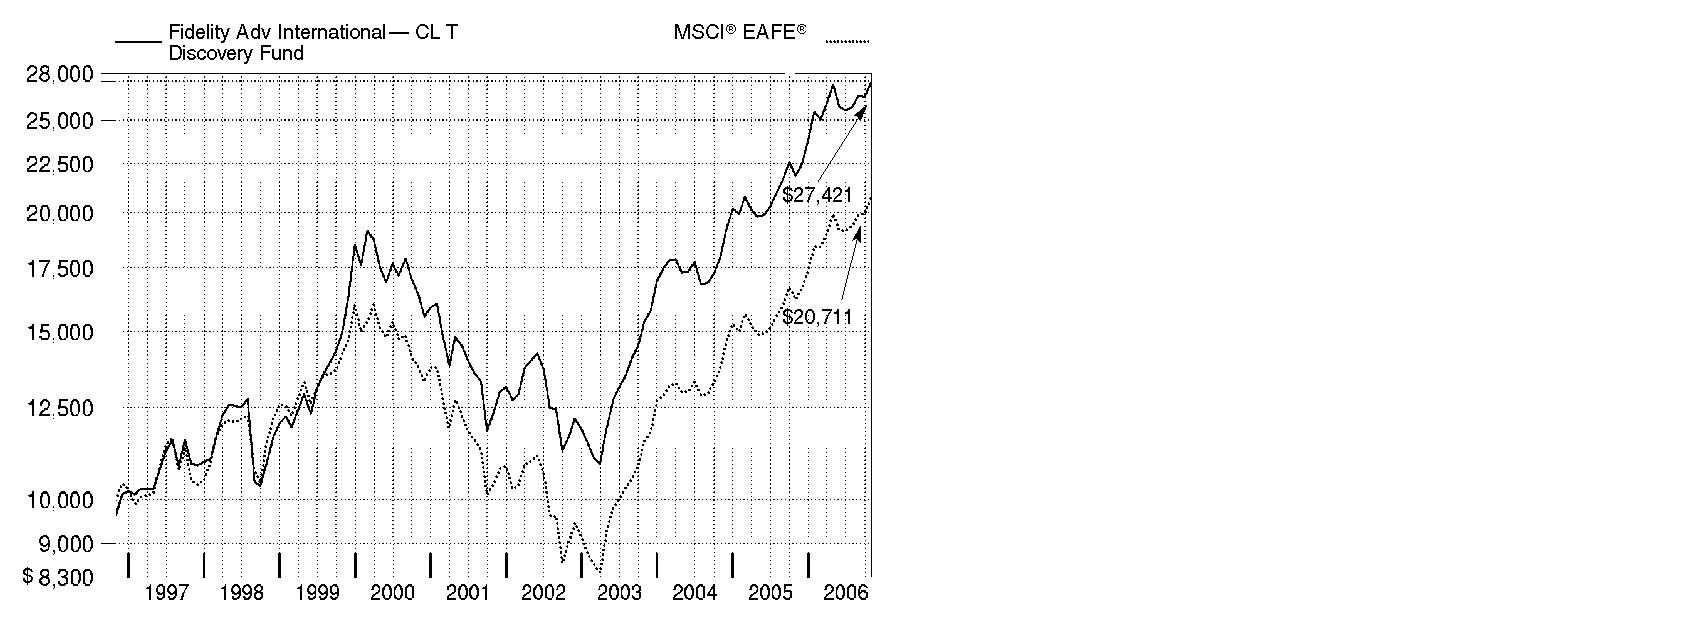
Annual Report
Management's Discussion of Fund Performance
Comments from William Kennedy, Portfolio Manager of Fidelity Advisor International Discovery Fund
International equity markets as a whole outpaced their U.S. counterparts for the 12 months ending October 31, 2006 - partly as a result of favorable currency exchanges that boosted returns for U.S. investors. The Morgan Stanley Capital InternationalSM Europe, Australasia, Far East (MSCI® EAFE®) Index - a gauge of developed stock markets outside the United States and Canada - gained 27.72% during that time. European markets benefited from solid corporate profit growth and attractive dividends, which helped the MSCI Europe index advance 31.95%. Strong performing Latin American and Asian emerging markets drove the MSCI Emerging Markets index to a lofty 35.42% return. Japan was somewhat of an exception to the generally stellar foreign market performance after struggling in the middle part of the period. Still, its earlier gains helped the Tokyo Stock Exchange Stock Price Index (TOPIX) - a benchmark of the largest and better-established stocks traded on the Tokyo Stock Exchange - rise 12.47% overall. Natural-resources-rich Canada also struggled over the final six months as energy prices fell, but the S&P/TSX Composite Index managed a 12-month return of 28.21%.
For the 12 months ending October 31, 2006, the fund's Class A, Class T, Class B and Class C shares returned 26.01%, 25.49%, 24.91% and 24.97%, respectively (excluding sales charges). These returns trailed the MSCI EAFE index. Strong stock picking, especially in the technology and consumer staples sectors, as well as favorable country selection aided returns versus the index. The benefit from country selection was partially offset by currency fluctuations, though. The fund's underweighting in materials and overweighting in the consumer discretionary sector hampered returns, as did weak stock picking in financials. On a regional basis, the fund benefited from investments in Japan and emerging markets, but lost ground in Europe. Top contributors to performance relative to the MSCI index included C&C Group, an Irish beverage company, and Sumco, a Japanese semiconductor wafer manufacturer. C&C rallied after reinventing a traditional pub cider drink as a premium product, while Sumco climbed as a wafer shortage drove up industry pricing. The fund had overweightings on average in both names. On the downside, an overweighted position in Sompo Japan Insurance hampered performance amid a slowdown in the Japanese equity market. Not owning Endesa, a Spanish utility stock in the index that benefited from a bidding war, also detracted from relative returns.
The views expressed in this statement reflect those of the portfolio manager only through the end of the period of the report as stated on the cover and do not necessarily represent the views of Fidelity or any other person in the Fidelity organization. Any such views are subject to change at any time based upon market or other conditions and Fidelity disclaims any responsibility to update such views. These views may not be relied on as investment advice and, because investment decisions for a Fidelity fund are based on numerous factors, may not be relied on as an indication of trading intent on behalf of any Fidelity fund.
Annual Report
Shareholder Expense Example
As a shareholder of the Fund, you incur two types of costs: (1) transaction costs, including sales charges (loads) on purchase payments or redemption proceeds, redemption fees, and (2) ongoing costs, including management fees, distribution and/or service (12b-1) fees and other Fund expenses. This Example is intended to help you understand your ongoing costs (in dollars) of investing in the Fund and to compare these costs with the ongoing costs of investing in other mutual funds.
The Example is based on an investment of $1,000 invested at the beginning of the period and held for the entire period (May 1, 2006 to October 31, 2006).
Actual Expenses
The first line of the accompanying table for each class of the Fund provides information about actual account values and actual expenses. You may use the information in this line, together with the amount you invested, to estimate the expenses that you paid over the period. Simply divide your account value by $1,000.00 (for example, an $8,600 account value divided by $1,000.00 = 8.6), then multiply the result by the number in the first line for a class of the Fund under the heading entitled "Expenses Paid During Period" to estimate the expenses you paid on your account during this period. A small balance maintenance fee of $12.00 that is charged once a year may apply for certain accounts with a value of less than $2,000. This fee is not included in the table below. If it was, the estimate of expenses you paid during the period would be higher, and your ending account value lower, by this amount.
Hypothetical Example for Comparison Purposes
The second line of the accompanying table for each class of the Fund provides information about hypothetical account values and hypothetical expenses based on a Class' actual expense ratio and an assumed rate of return of 5% per year before expenses, which is not the Class' actual return. The hypothetical account values and expenses may not be used to estimate the actual ending account balance or expenses you paid for the period. You may use this information to compare the ongoing costs of investing in the Fund and other funds. To do so, compare this 5% hypothetical example with the 5% hypothetical examples that appear in the shareholder reports of the other funds. A small balance maintenance fee of $12.00 that is charged once a year may apply for certain accounts with a value of less than $2,000. This fee is not included in the table below. If it was, the estimate of expenses you paid during the period would be higher, and your ending account value lower, by this amount.
Annual Report
tShareholder Expense Example - continued
Please note that the expenses shown in the table are meant to highlight your ongoing costs only and do not reflect any transaction costs. Therefore, the second line of the table is useful in comparing ongoing costs only, and will not help you determine the relative total costs of owning different funds. In addition, if these transactional costs were included, your costs would have been higher.
| Beginning
Account Value
May 1, 2006 | Ending
Account Value
October 31, 2006 | Expenses Paid
During Period*
May 1, 2006
to October 31, 2006 |
Class A | | | |
Actual | $ 1,000.00 | $ 1,009.10 | $ 6.38 |
HypotheticalA | $ 1,000.00 | $ 1,018.85 | $ 6.41 |
Class T | | | |
Actual | $ 1,000.00 | $ 1,006.70 | $ 8.65 |
HypotheticalA | $ 1,000.00 | $ 1,016.59 | $ 8.69 |
Class B | | | |
Actual | $ 1,000.00 | $ 1,004.20 | $ 11.37 |
HypotheticalA | $ 1,000.00 | $ 1,013.86 | $ 11.42 |
Class C | | | |
Actual | $ 1,000.00 | $ 1,004.40 | $ 11.06 |
HypotheticalA | $ 1,000.00 | $ 1,014.17 | $ 11.12 |
International Discovery | | | |
Actual | $ 1,000.00 | $ 1,009.90 | $ 5.37 |
HypotheticalA | $ 1,000.00 | $ 1,019.86 | $ 5.40 |
Institutional Class | | | |
Actual | $ 1,000.00 | $ 1,010.20 | $ 4.91 |
HypotheticalA | $ 1,000.00 | $ 1,020.32 | $ 4.94 |
A 5% return per year before expenses
* Expenses are equal to each Class' annualized expense ratio (shown in the table below); multiplied by the average account value over the period, multiplied by 184/365 (to reflect the one-half year period).
| Annualized
Expense Ratio |
Class A | 1.26% |
Class T | 1.71% |
Class B | 2.25% |
Class C | 2.19% |
International Discovery | 1.06% |
Institutional Class | .97% |
Annual Report
Investment Changes
Geographic Diversification (% of fund's net assets) |
As of October 31, 2006 |
| Japan 19.1% |
| United Kingdom 16.5% |
| France 12.3% |
| Germany 10.2% |
| Switzerland 9.5% |
| Australia 5.5% |
| Italy 3.6% |
| United States of America 3.3% |
| Spain 3.2% |
| Other 16.8% |

Percentages are adjusted for the effect of futures contracts, if applicable. |
|
As of April 30, 2006 |
| Japan 21.7% |
| United Kingdom 13.7% |
| France 11.1% |
| Germany 10.0% |
| Switzerland 8.5% |
| Australia 3.8% |
| United States of America 3.5% |
| Italy 3.2% |
| Korea (South) 2.6% |
| Other 21.9% |

Percentages are adjusted for the effect of futures contracts, if applicable. |
Asset Allocation |
| % of fund's
net assets | % of fund's net assets
6 months ago |
Stocks and Equity Futures | 97.1 | 97.3 |
Short-Term Investments and Net Other Assets | 2.9 | 2.7 |
Top Ten Stocks as of October 31, 2006 |
| % of fund's
net assets | % of fund's net assets
6 months ago |
Roche Holding AG (participation certificate) (Switzerland, Pharmaceuticals) | 1.5 | 1.3 |
UBS AG (NY Shares) (Switzerland, Capital Markets) | 1.4 | 1.1 |
Novartis AG (Reg.) (Switzerland, Pharmaceuticals) | 1.4 | 1.2 |
BP PLC sponsored ADR (United Kingdom, Oil, Gas & Consumable Fuels) | 1.3 | 1.4 |
Toyota Motor Corp. (Japan, Automobiles) | 1.3 | 1.3 |
Total SA Series B (France, Oil, Gas & Consumable Fuels) | 1.2 | 1.4 |
E.ON AG (Germany, Electric Utilities) | 1.1 | 1.1 |
Nestle SA (Reg.) (Switzerland, Food Products) | 1.1 | 0.8 |
Allianz AG (Reg.) (Germany, Insurance) | 1.1 | 1.0 |
Mizuho Financial Group, Inc. (Japan, Commercial Banks) | 1.1 | 0.8 |
| 12.5 | |
Market Sectors as of October 31, 2006 |
| % of fund's
net assets | % of fund's net assets
6 months ago |
Financials | 27.5 | 25.7 |
Consumer Discretionary | 15.8 | 15.5 |
Consumer Staples | 9.6 | 5.7 |
Industrials | 8.3 | 11.3 |
Health Care | 8.1 | 7.5 |
Information Technology | 7.4 | 9.3 |
Energy | 6.6 | 8.7 |
Utilities | 5.2 | 4.2 |
Materials | 4.5 | 5.9 |
Telecommunication Services | 2.7 | 2.1 |
Annual Report
Investments October 31, 2006
Showing Percentage of Net Assets
Common Stocks - 94.5% |
| Shares | | Value (Note 1) (000s) |
Australia - 5.5% |
AMP Ltd. | 2,219,300 | | $ 16,322 |
Australia & New Zealand Banking Group Ltd. | 871,800 | | 19,599 |
AXA Asia Pacific Holdings Ltd. | 3,932,100 | | 20,273 |
Babcock & Brown Japan Property Trust | 8,156,000 | | 12,218 |
BHP Billiton Ltd. | 2,255,700 | | 48,013 |
Billabong International Ltd. | 2,162,828 | | 26,254 |
Brambles Industries Ltd. | 2,096,000 | | 20,250 |
Cochlear Ltd. | 284,000 | | 12,240 |
Commonwealth Bank of Australia | 296,000 | | 10,930 |
Computershare Ltd. | 3,151,800 | | 18,788 |
CSL Ltd. | 1,304,950 | | 56,664 |
Downer EDI Ltd. | 48,361 | | 241 |
Fosters Group Ltd. | 4,060,500 | | 20,275 |
Macquarie Airports unit | 2,141,930 | | 5,323 |
Macquarie Bank Ltd. | 420,000 | | 24,239 |
Macquarie Communications Infrastructure Group unit | 1,632,940 | | 7,737 |
Macquarie Infrastructure Group unit | 1,750,121 | | 4,579 |
Mortgage Choice Ltd. | 2,899,300 | | 6,015 |
Multiplex Group unit | 6,100,300 | | 17,379 |
National Australia Bank Ltd. | 1,216,500 | | 35,814 |
QBE Insurance Group Ltd. | 1,230,667 | | 23,532 |
Seek Ltd. | 2,000,000 | | 8,237 |
Transurban Group unit | 989,403 | | 5,530 |
Woolworths Ltd. | 2,266,939 | | 36,310 |
TOTAL AUSTRALIA | | 456,762 |
Austria - 0.7% |
Austriamicrosystems AG (a) | 111,000 | | 7,057 |
Oesterreichische Elektrizitaetswirtschafts AG (Verbund) | 380,400 | | 18,990 |
OMV AG | 379,500 | | 20,630 |
Telekom Austria AG | 472,700 | | 11,765 |
TOTAL AUSTRIA | | 58,442 |
Belgium - 0.3% |
Almancora SCA (Certificaten Van Aandelen) | 185,500 | | 24,459 |
Bermuda - 0.1% |
Catlin Group Ltd. | 486,300 | | 4,645 |
Ports Design Ltd. | 4,460,500 | | 7,754 |
TOTAL BERMUDA | | 12,399 |
Common Stocks - continued |
| Shares | | Value (Note 1) (000s) |
Brazil - 0.1% |
Banco Nossa Caixa SA | 256,500 | | $ 6,106 |
CSU Cardsystem SA sponsored ADR (e) | 158,000 | | 2,745 |
TOTAL BRAZIL | | 8,851 |
Canada - 0.2% |
Potash Corp. of Saskatchewan, Inc. | 112,200 | | 14,014 |
Cayman Islands - 0.6% |
DSND, Inc. (a)(d) | 791,800 | | 14,354 |
Foxconn International Holdings Ltd. (a) | 9,433,300 | | 31,355 |
Xinao Gas Holdings Ltd. | 5,392,000 | | 5,429 |
TOTAL CAYMAN ISLANDS | | 51,138 |
China - 0.5% |
Bank of China Ltd. (H Shares) | 10,737,000 | | 4,625 |
China Life Insurance Co. Ltd. (H Shares) | 10,031,000 | | 21,127 |
China Merchants Bank Co. Ltd. (H Shares) (a) | 552,500 | | 862 |
China Shenhua Energy Co. Ltd. (H Shares) | 5,943,500 | | 10,455 |
Home Inns & Hotels Management, Inc. sponsored ADR | 9,100 | | 223 |
Industrial & Commercial Bank of China | 10,494,000 | | 4,696 |
TOTAL CHINA | | 41,988 |
Denmark - 0.2% |
Vestas Wind Systems AS (a) | 670,200 | | 18,879 |
Finland - 1.2% |
Citycon Oyj | 692,322 | | 3,667 |
Fortum Oyj | 1,557,000 | | 42,847 |
Nokia Corp. sponsored ADR | 2,683,300 | | 53,344 |
TOTAL FINLAND | | 99,858 |
France - 12.3% |
Alcatel SA (RFD) | 1,089,900 | | 13,842 |
Alstom SA (a) | 427,300 | | 39,433 |
April Group | 280,900 | | 12,011 |
AXA SA | 1,209,666 | | 46,112 |
BNP Paribas SA | 650,139 | | 71,490 |
Carrefour SA | 776,600 | | 47,322 |
CNP Assurances | 217,100 | | 22,847 |
Electricite de France | 318,800 | | 19,333 |
Gaz de France (d) | 802,800 | | 32,278 |
Groupe Danone | 228,600 | | 33,497 |
Icade SA | 549,889 | | 32,644 |
L'Oreal SA | 336,200 | | 32,699 |
Common Stocks - continued |
| Shares | | Value (Note 1) (000s) |
France - continued |
Louis Vuitton Moet Hennessy (LVMH) | 338,000 | | $ 35,226 |
Neopost SA | 356,900 | | 43,641 |
Nexity | 362,750 | | 25,003 |
Orpea (a)(d) | 279,164 | | 23,393 |
Pernod Ricard SA | 230,900 | | 46,242 |
Pinault Printemps-Redoute SA | 160,200 | | 23,904 |
Renault SA | 541,500 | | 63,346 |
Sanofi-Aventis sponsored ADR | 482,100 | | 20,581 |
Schneider Electric SA | 197,100 | | 20,478 |
Societe Generale Series A | 366,620 | | 60,928 |
SR Teleperformance SA (d) | 475,900 | | 17,197 |
Suez SA (France) | 573,600 | | 25,669 |
Total SA Series B | 1,509,776 | | 102,876 |
Veolia Environnement | 416,100 | | 25,477 |
Vinci SA | 320,800 | | 36,136 |
Vivendi Universal SA | 1,039,400 | | 39,363 |
TOTAL FRANCE | | 1,012,968 |
Germany - 9.5% |
Allianz AG (Reg.) | 485,330 | | 90,223 |
Bayer AG sponsored ADR | 1,005,300 | | 50,456 |
Bilfinger Berger AG | 260,300 | | 16,227 |
Continental AG | 266,500 | | 29,805 |
Deutsche Bank AG | 349,400 | | 44,147 |
Deutsche Boerse AG | 243,700 | | 39,299 |
Deutsche Postbank AG | 277,100 | | 20,613 |
E.ON AG | 789,000 | | 94,988 |
Fresenius Medical Care AG | 144,900 | | 19,335 |
GFK AG | 288,897 | | 12,644 |
Hugo Boss AG | 43,200 | | 2,051 |
Hypo Real Estate Holding AG | 179,368 | | 11,276 |
KarstadtQuelle AG (a)(d) | 1,023,200 | | 24,031 |
Linde AG | 379,228 | | 37,591 |
Merck KGaA | 231,200 | | 24,376 |
MPC Muenchmeyer Petersen Capital AG | 50,500 | | 4,435 |
MTU Aero Engines Holding AG | 337,500 | | 13,850 |
Muenchener Rueckversicherungs-Gesellschaft AG (Reg.) | 311,800 | | 50,615 |
Pfleiderer AG (d) | 1,097,696 | | 29,815 |
Puma AG | 44,800 | | 15,887 |
Q-Cells AG (d) | 286,000 | | 11,317 |
RWE AG | 660,019 | | 65,231 |
SAP AG | 145,800 | | 28,950 |
Common Stocks - continued |
| Shares | | Value (Note 1) (000s) |
Germany - continued |
SGL Carbon AG (a) | 632,300 | | $ 13,849 |
SolarWorld AG (d) | 142,400 | | 7,659 |
Wincor Nixdorf AG | 173,700 | | 24,155 |
TOTAL GERMANY | | 782,825 |
Greece - 0.3% |
EFG Eurobank Ergasias SA | 374,100 | | 12,444 |
Greek Organization of Football Prognostics SA | 359,130 | | 12,826 |
TOTAL GREECE | | 25,270 |
Hong Kong - 1.3% |
BOC Hong Kong Holdings Ltd. | 3,447,000 | | 7,712 |
Chaoda Modern Agriculture (Holdings) Ltd. | 12,600,000 | | 7,631 |
China Resources Power Holdings Co. Ltd. | 4,984,000 | | 6,216 |
CNOOC Ltd. | 31,338,500 | | 26,268 |
Esprit Holdings Ltd. | 5,874,500 | | 56,878 |
TOTAL HONG KONG | | 104,705 |
India - 0.4% |
Infosys Technologies Ltd. | 711,488 | | 33,191 |
Pantaloon Retail India Ltd. | 60,499 | | 2,929 |
TOTAL INDIA | | 36,120 |
Indonesia - 0.1% |
PT Perusahaan Gas Negara Tbk Series B | 5,903,500 | | 7,387 |
Ireland - 1.2% |
AgCert International (a) | 1,462,000 | | 4,155 |
Allied Irish Banks PLC | 910,000 | | 24,881 |
C&C Group PLC | 2,070,005 | | 34,401 |
Paddy Power PLC (Ireland) | 623,197 | | 11,653 |
Ryanair Holdings PLC sponsored ADR (a) | 297,100 | | 19,852 |
TOTAL IRELAND | | 94,942 |
Israel - 0.4% |
Bank Hapoalim BM (Reg.) | 2,497,200 | | 12,445 |
Ormat Industries Ltd. | 1,771,900 | | 18,382 |
TOTAL ISRAEL | | 30,827 |
Italy - 3.1% |
Autostrade Spa | 629,100 | | 18,605 |
Banca Credit Firenze (d) | 2,548,526 | | 8,523 |
Common Stocks - continued |
| Shares | | Value (Note 1) (000s) |
Italy - continued |
ENI Spa | 288,800 | | $ 8,767 |
ENI Spa sponsored ADR (d) | 401,950 | | 24,402 |
Fiat Spa (a) | 2,195,000 | | 38,770 |
Lottomatica Spa | 869,825 | | 31,753 |
Mediobanca Spa | 391,500 | | 9,099 |
Milano Assicurazioni Spa | 1,947,700 | | 15,195 |
Pirelli & C. Real Estate Spa | 235,100 | | 15,382 |
Unicredito Italiano Spa | 10,053,500 | | 83,359 |
TOTAL ITALY | | 253,855 |
Japan - 17.7% |
Aeon Co. Ltd. | 1,796,700 | | 42,321 |
Aeon Fantasy Co. Ltd. | 19,400 | | 690 |
Aeon Mall Co. Ltd. | 396,800 | | 20,932 |
Asics Corp. | 2,315,000 | | 31,016 |
Canon, Inc. | 1,241,750 | | 66,297 |
Credit Saison Co. Ltd. | 430,600 | | 15,573 |
Daiwa House Industry Co. Ltd. | 939,000 | | 16,940 |
Daiwa Securities Group, Inc. | 3,275,000 | | 37,157 |
DCM Japan Holdings Co. Ltd. (a)(d) | 770,660 | | 8,829 |
East Japan Railway Co. | 3,017 | | 21,100 |
Fanuc Ltd. | 288,900 | | 25,071 |
Fast Retailing Co. Ltd. | 188,900 | | 17,879 |
Honda Motor Co. Ltd. | 536,700 | | 18,962 |
Hoya Corp. | 800,000 | | 30,917 |
Idemitsu Kosan Co., Ltd. | 18,200 | | 1,771 |
Japan Tobacco, Inc. | 10,045 | | 43,801 |
JSR Corp. | 718,900 | | 18,071 |
JTEKT Corp. | 659,000 | | 13,720 |
Kansai Urban Banking Corp. | 1,288,000 | | 5,682 |
Keyence Corp. | 82,600 | | 18,291 |
Kose Corp. | 175,300 | | 5,276 |
Matsushita Electric Industrial Co. Ltd. | 1,271,000 | | 26,437 |
Mitsubishi Estate Co. Ltd. | 1,508,400 | | 36,111 |
Mitsubishi UFJ Financial Group, Inc. | 3,395 | | 43,286 |
Mitsui & Co. Ltd. | 2,155,000 | | 29,425 |
Mitsui Fudosan Co. Ltd. | 1,711,000 | | 42,131 |
Mizuho Financial Group, Inc. | 11,121 | | 86,621 |
Nidec Corp. | 131,900 | | 10,093 |
Nikko Cordial Corp. | 620,000 | | 7,427 |
Nintendo Co. Ltd. | 320,900 | | 65,629 |
Nippon Electric Glass Co. Ltd. | 570,000 | | 12,281 |
Common Stocks - continued |
| Shares | | Value (Note 1) (000s) |
Japan - continued |
Nippon Oil Corp. | 1,544,000 | | $ 11,485 |
Nishimatsuya Chain Co. Ltd. | 141,800 | | 2,770 |
Nissan Motor Co. Ltd. | 1,373,400 | | 16,451 |
Nitto Denko Corp. | 307,400 | | 17,530 |
Nomura Holdings, Inc. | 433,500 | | 7,638 |
NSK Ltd. | 1,893,000 | | 15,861 |
OMC Card, Inc. | 600,100 | | 5,962 |
Omron Corp. | 555,800 | | 14,351 |
ORIX Corp. | 234,540 | | 66,075 |
Shin-Etsu Chemical Co. Ltd. | 57,600 | | 3,777 |
Sompo Japan Insurance, Inc. | 2,002,000 | | 26,634 |
Sony Corp. sponsored ADR | 741,200 | | 30,374 |
St. Marc Holdings Co. Ltd. | 83,900 | | 5,610 |
Sugi Pharmacy Co. Ltd. (d) | 546,800 | | 9,911 |
Sumco Corp. (d) | 373,900 | | 26,598 |
Sumitomo Electric Industries Ltd. | 1,786,100 | | 25,289 |
Sumitomo Metal Industries Ltd. | 4,099,000 | | 15,420 |
Sumitomo Mitsui Financial Group, Inc. | 5,877 | | 64,317 |
Sumitomo Trust & Banking Co. Ltd. | 3,570,800 | | 38,407 |
T&D Holdings, Inc. | 472,350 | | 34,530 |
Takeda Pharamaceutical Co. Ltd. | 698,600 | | 44,857 |
The Sumitomo Warehouse Co. Ltd. (d) | 338,000 | | 2,387 |
Token Corp. | 78,400 | | 5,919 |
Tokuyama Corp. | 523,000 | | 6,582 |
Tokyo Tomin Bank Ltd. | 40,700 | | 1,656 |
Toyota Motor Corp. | 1,815,800 | | 107,132 |
Valor Co. Ltd. | 147,400 | | 2,168 |
Yamada Denki Co. Ltd. | 325,600 | | 32,404 |
TOTAL JAPAN | | 1,461,832 |
Korea (South) - 1.6% |
Kookmin Bank | 258,550 | | 20,552 |
Korean Reinsurance Co. | 946,600 | | 10,699 |
KT&G Corp. | 169,400 | | 10,463 |
LG Household & Health Care Ltd. | 445,680 | | 41,151 |
NHN Corp. | 246,216 | | 24,432 |
Shinhan Financial Group Co. Ltd. | 397,520 | | 18,331 |
Shinsegae Co. Ltd. | 7,900 | | 4,553 |
TOTAL KOREA (SOUTH) | | 130,181 |
Common Stocks - continued |
| Shares | | Value (Note 1) (000s) |
Luxembourg - 0.2% |
GAGFAH SA | 35,000 | | $ 1,016 |
SES Global SA FDR | 1,085,903 | | 16,633 |
TOTAL LUXEMBOURG | | 17,649 |
Mexico - 0.5% |
America Movil SA de CV Series L sponsored ADR | 579,700 | | 24,852 |
Urbi, Desarrollos Urbanos, SA de CV (a) | 4,121,400 | | 12,631 |
TOTAL MEXICO | | 37,483 |
Netherlands - 1.7% |
ING Groep NV (Certificaten Van Aandelen) | 1,334,044 | | 59,138 |
Koninklijke KPN NV | 2,772,000 | | 37,045 |
Koninklijke Numico NV | 461,400 | | 20,630 |
Koninklijke Philips Electronics NV | 655,900 | | 22,845 |
Tele Atlas NV (Netherlands) (a) | 132,400 | | 2,483 |
TOTAL NETHERLANDS | | 142,141 |
Norway - 1.8% |
Aker Kvaerner ASA | 285,200 | | 29,669 |
DnB Nor ASA | 928,300 | | 12,157 |
Norsk Hydro ASA | 1,370,500 | | 31,727 |
ProSafe ASA | 154,600 | | 9,886 |
Renewable Energy Corp. AS (d) | 756,200 | | 12,552 |
Statoil ASA | 511,800 | | 12,939 |
Telenor ASA | 2,699,300 | | 42,637 |
TOTAL NORWAY | | 151,567 |
Portugal - 0.2% |
Energias de Portugal SA | 4,219,400 | | 18,957 |
Russia - 0.3% |
Novatek JSC GDR (e) | 66,900 | | 3,894 |
OAO Gazprom sponsored ADR | 427,000 | | 18,190 |
OAO TMK unit | 169,200 | | 4,272 |
TOTAL RUSSIA | | 26,356 |
Singapore - 0.5% |
Ascendas Real Estate Investment Trust (A-REIT) | 4,630,000 | | 6,451 |
HTL International Holdings Ltd. | 7,187,500 | | 5,446 |
Keppel Corp. Ltd. | 1,166,000 | | 11,829 |
Common Stocks - continued |
| Shares | | Value (Note 1) (000s) |
Singapore - continued |
SembCorp Marine Ltd. | 5,118,000 | | $ 11,239 |
Singapore Exchange Ltd. | 3,217,000 | | 9,295 |
TOTAL SINGAPORE | | 44,260 |
South Africa - 0.2% |
FirstRand Ltd. | 2,253,800 | | 5,896 |
Steinhoff International Holdings Ltd. | 2,419,100 | | 7,882 |
TOTAL SOUTH AFRICA | | 13,778 |
Spain - 3.2% |
Banco Bilbao Vizcaya Argentaria SA | 3,378,000 | | 81,748 |
Banco Santander Central Hispano SA | 3,660,200 | | 63,351 |
Gestevision Telecinco SA | 256,800 | | 6,749 |
Inditex SA | 1,032,600 | | 49,373 |
Telefonica SA | 3,291,100 | | 63,299 |
TOTAL SPAIN | | 264,520 |
Sweden - 0.9% |
Hennes & Mauritz AB (H&M) (B Shares) | 574,100 | | 24,761 |
Modern Times Group AB (MTG) (B Shares) | 792,100 | | 45,624 |
TOTAL SWEDEN | | 70,385 |
Switzerland - 9.5% |
ABB Ltd. sponsored ADR | 3,267,100 | | 48,745 |
Actelion Ltd. (Reg.) (a) | 156,158 | | 26,295 |
Compagnie Financiere Richemont unit | 525,208 | | 25,983 |
Credit Suisse Group sponsored ADR | 220,100 | | 13,312 |
Credit Suisse Group (Reg.) | 730,684 | | 44,192 |
Lindt & Spruengli AG (participation certificate) | 13,274 | | 28,988 |
Nestle SA (Reg.) | 264,143 | | 90,231 |
Nobel Biocare Holding AG (Switzerland) | 68,513 | | 18,751 |
Novartis AG (Reg.) | 1,871,819 | | 113,676 |
Pargesa Holding SA | 141,700 | | 13,587 |
Roche Holding AG (participation certificate) | 725,268 | | 126,895 |
Societe Generale de Surveillance Holding SA (SGS) (Reg.) | 12,915 | | 13,713 |
Swiss Life Holding | 98,975 | | 23,349 |
Syngenta AG (Switzerland) | 315,081 | | 50,775 |
Tecan Group AG | 197,600 | | 10,594 |
The Swatch Group AG (Reg.) | 389,573 | | 15,562 |
UBS AG (NY Shares) | 1,935,600 | | 115,826 |
TOTAL SWITZERLAND | | 780,474 |
Common Stocks - continued |
| Shares | | Value (Note 1) (000s) |
Taiwan - 1.0% |
Acer, Inc. | 11,506,000 | | $ 20,914 |
Holtek Semiconductor, Inc. | 3,887,044 | | 7,827 |
Hon Hai Precision Industry Co. Ltd. (Foxconn) | 6,633,890 | | 43,093 |
InnoLux Display Corp. | 1,051,000 | | 1,635 |
Shin Kong Financial Holding Co. Ltd. | 10,227,415 | | 9,064 |
TOTAL TAIWAN | | 82,533 |
Turkey - 0.3% |
Finansbank AS | 5,689,491 | | 22,450 |
United Kingdom - 16.5% |
Anglo American PLC (United Kingdom) | 913,600 | | 41,197 |
AstraZeneca PLC sponsored ADR | 864,200 | | 50,729 |
BAE Systems PLC | 4,081,909 | | 32,663 |
Barclays PLC | 1,458,400 | | 19,801 |
Benfield Group PLC | 2,897,300 | | 19,260 |
BG Group PLC | 1,368,000 | | 18,149 |
BG Group PLC sponsored ADR | 200,000 | | 13,290 |
BHP Billiton PLC | 1,397,300 | | 26,947 |
BP PLC sponsored ADR | 1,603,500 | | 107,595 |
British American Tobacco PLC | 1,309,500 | | 36,011 |
British American Tobacco PLC sponsored ADR | 402,700 | | 22,149 |
British Land Co. PLC | 627,900 | | 17,906 |
Cable & Wireless PLC | 8,734,800 | | 24,409 |
Capita Group PLC | 1,106,900 | | 11,381 |
Enterprise Inns PLC | 505,225 | | 10,389 |
Experian Group Ltd. | 1,543,300 | | 16,986 |
GlaxoSmithKline PLC | 249,400 | | 6,640 |
GlaxoSmithKline PLC sponsored ADR | 1,137,700 | | 60,583 |
HSBC Holdings PLC: | | | |
(Hong Kong) (Reg.) | 3,810,944 | | 72,766 |
(United Kingdom) (Reg.) | 700,000 | | 13,366 |
Imperial Energy PLC (a) | 372,200 | | 4,807 |
Imperial Tobacco Group PLC | 76,000 | | 2,692 |
Imperial Tobacco Group PLC sponsored ADR | 175,100 | | 12,492 |
Informa PLC | 1,379,400 | | 14,366 |
International Power PLC | 5,092,700 | | 32,519 |
Man Group PLC | 1,642,200 | | 15,287 |
Marks & Spencer Group PLC | 4,489,000 | | 56,215 |
National Grid PLC | 1,576,500 | | 20,148 |
NDS Group PLC sponsored ADR (a) | 112,400 | | 5,377 |
Pearson PLC | 2,075,500 | | 30,623 |
Common Stocks - continued |
| Shares | | Value (Note 1) (000s) |
United Kingdom - continued |
Prudential PLC | 1,178,448 | | $ 14,443 |
Reckitt Benckiser PLC | 1,303,300 | | 56,707 |
Reed Elsevier PLC | 2,071,800 | | 23,593 |
Renovo Group PLC | 4,990,300 | | 14,540 |
Reuters Group PLC sponsored ADR | 481,050 | | 24,673 |
Rio Tinto PLC sponsored ADR | 137,100 | | 30,353 |
Rolls-Royce Group PLC | 3,776,051 | | 33,835 |
Royal Bank of Scotland Group PLC | 759,471 | | 27,062 |
Royal Dutch Shell PLC Class B | 1,999,459 | | 71,981 |
Scottish & Southern Energy PLC | 1,387,700 | | 34,782 |
Shire PLC | 1,567,000 | | 28,590 |
SIG PLC | 536,100 | | 10,206 |
Smiths Group PLC | 913,000 | | 16,475 |
Tesco PLC | 9,498,512 | | 71,296 |
Unilever PLC | 1,075,400 | | 26,111 |
Vodafone Group PLC | 11,282,735 | | 29,166 |
VT Group PLC | 1,218,600 | | 11,181 |
Whatman PLC | 735,900 | | 4,071 |
William Hill PLC | 1,250,500 | | 15,528 |
TOTAL UNITED KINGDOM | | 1,361,336 |
United States of America - 0.4% |
Macquarie Infrastructure Co. Trust | 131,000 | | 3,908 |
NTL, Inc. | 943,200 | | 25,495 |
TOTAL UNITED STATES OF AMERICA | | 29,403 |
TOTAL COMMON STOCKS (Cost $6,291,807) | 7,790,994 |
Nonconvertible Preferred Stocks - 1.2% |
| | | |
Germany - 0.7% |
Fresenius AG (non-vtg.) | 94,600 | | 17,750 |
Hugo Boss AG (non-vtg.) | 332,800 | | 15,483 |
Porsche AG (non-vtg.) | 21,395 | | 24,946 |
TOTAL GERMANY | | 58,179 |
Italy - 0.5% |
Banca Intesa Spa (Risp) | 5,848,702 | | 38,775 |
Nonconvertible Preferred Stocks - continued |
| Shares | | Value (Note 1) (000s) |
United Kingdom - 0.0% |
Rolls-Royce Group PLC Series B | 138,581,071 | | $ 271 |
TOTAL NONCONVERTIBLE PREFERRED STOCKS (Cost $60,462) | 97,225 |
Government Obligations - 0.1% |
| Principal Amount (000s) | | |
United States of America - 0.1% |
U.S. Treasury Bills, yield at date of purchase 4.78% to 5.01% 12/7/06 to 1/11/07 (f)
(Cost $5,510) | | $ 5,550 | | 5,511 |
Money Market Funds - 5.5% |
| Shares | | |
Fidelity Cash Central Fund, 5.34% (b) | 334,895,573 | | 334,896 |
Fidelity Securities Lending Cash Central Fund, 5.35% (b)(c) | 123,395,664 | | 123,396 |
TOTAL MONEY MARKET FUNDS (Cost $458,292) | 458,292 |
TOTAL INVESTMENT PORTFOLIO - 101.3% (Cost $6,816,071) | 8,352,022 |
NET OTHER ASSETS - (1.3)% | | (109,919) |
NET ASSETS - 100% | $ 8,242,103 |
Futures Contracts |
| Expiration Date | | Underlying Face Amount at Value (000s) | | Unrealized
Appreciation/ (Depreciation) (000s) |
Purchased |
Equity Index Contracts |
1,382 Nikkei 225 Index Contracts (Japan) | Dec. 2006 | | $ 113,082 | | $ 1,285 |
|
The face value of futures purchased as a percentage of net assets - 1.4% |
Legend |
(a) Non-income producing |
(b) Affiliated fund that is available only to investment companies and other accounts managed by Fidelity Investments. The rate quoted is the annualized seven-day yield of the fund at period end. A complete unaudited listing of the fund's holdings as of its most recent quarter end is available upon request. |
(c) Investment made with cash collateral received from securities on loan. |
(d) Security or a portion of the security is on loan at period end. |
(e) Security exempt from registration under Rule 144A of the Securities Act of 1933. These securities may be resold in transactions exempt from registration, normally to qualified institutional buyers. At the end of the period, the value of these securities amounted to $6,639,000 or 0.1% of net assets. |
(f) Security or a portion of the security was pledged to cover margin requirements for futures contracts. At the period end, the value of securities pledged amounted to $5,511,000. |
Affiliated Central Funds |
Information regarding fiscal year to date income earned by the Fund from investments in Fidelity Central Funds is as follows: |
Fund | Income earned
(Amounts in thousands) |
Fidelity Cash Central Fund | $ 11,118 |
Fidelity Securities Lending Cash Central Fund | 5,746 |
Total | $ 16,864 |
Annual Report
See accompanying notes which are an integral part of the financial statements.
Financial Statements
Statement of Assets and Liabilities
Amounts in thousands (except per-share amounts) | October 31, 2006 |
| | |
Assets | | |
Investment in securities, at value (including securities loaned of $117,944) - See accompanying schedule: Unaffiliated issuers (cost $6,357,779) | $ 7,893,730 | |
Fidelity Central Funds (cost $458,292) | 458,292 | |
Total Investments (cost $6,816,071) | | $ 8,352,022 |
Foreign currency held at value (cost $1,001) | | 1,060 |
Receivable for investments sold | | 36,415 |
Receivable for fund shares sold | | 15,792 |
Dividends receivable | | 7,417 |
Interest receivable | | 1,414 |
Other receivables | | 796 |
Total assets | | 8,414,916 |
| | |
Liabilities | | |
Payable for investments purchased | $ 33,989 | |
Payable for fund shares redeemed | 5,884 | |
Accrued management fee | 5,123 | |
Distribution fees payable | 39 | |
Payable for daily variation on futures contracts | 518 | |
Other affiliated payables | 1,549 | |
Other payables and accrued expenses | 2,315 | |
Collateral on securities loaned, at value | 123,396 | |
Total liabilities | | 172,813 |
| | |
Net Assets | | $ 8,242,103 |
Net Assets consist of: | | |
Paid in capital | | $ 6,402,118 |
Undistributed net investment income | | 83,948 |
Accumulated undistributed net realized gain (loss) on investments and foreign currency transactions | | 220,510 |
Net unrealized appreciation (depreciation) on investments and assets and liabilities in foreign currencies | | 1,535,527 |
Net Assets | | $ 8,242,103 |
Annual Report
See accompanying notes which are an integral part of the financial statements.
Financial Statements - continued
Statement of Assets and Liabilities - continued
Amounts in thousands (except per-share amounts) | October 31, 2006 |
| | |
Calculation of Maximum Offering Price
Class A:
Net Asset Value and redemption price per share ($139,827 ÷ 3,835 shares) | | $ 36.47 |
| | |
Maximum offering price per share (100/94.25 of $36.47) | | $ 38.69 |
Class T:
Net Asset Value and redemption price per share ($10,065 ÷ 277.24 shares) | | $ 36.30 |
| | |
Maximum offering price per share (100/96.50 of $36.30) | | $ 37.62 |
Class B:
Net Asset Value and offering price per share ($4,477 ÷ 123.96 shares)A | | $ 36.12 |
| | |
Class C:
Net Asset Value and offering price per share ($5,846 ÷ 161.5 shares)A | | $ 36.19 |
| | |
| | |
International Discovery:
Net Asset Value, offering price and redemption price per share ($8,053,564 ÷ 219,645 shares) | | $ 36.67 |
| | |
Institutional Class:
Net Asset Value, offering price and redemption price per share ($28,324 ÷ 771.5 shares) | | $ 36.71 |
A Redemption price per share is equal to net asset value less any applicable contingent deferred sales charge.
Annual Report
See accompanying notes which are an integral part of the financial statements.
Statement of Operations
Amounts in thousands | Year ended October 31, 2006 |
| | |
Investment Income | | |
Dividends | | $ 149,831 |
Interest | | 315 |
Income from Fidelity Central Funds | | 16,864 |
| | 167,010 |
Less foreign taxes withheld | | (12,732) |
Total income | | 154,278 |
| | |
Expenses | | |
Management fee
Basic fee | $ 45,254 | |
Performance adjustment | 4,736 | |
Transfer agent fees | 14,071 | |
Distribution fees | 263 | |
Accounting and security lending fees | 1,726 | |
Custodian fees and expenses | 2,003 | |
Independent trustees' compensation | 23 | |
Registration fees | 661 | |
Audit | 114 | |
Legal | 94 | |
Interest | 2 | |
Miscellaneous | 46 | |
Total expenses before reductions | 68,993 | |
Expense reductions | (3,737) | 65,256 |
Net investment income (loss) | | 89,022 |
Realized and Unrealized Gain (Loss) Net realized gain (loss) on: | | |
Investment securities: | | |
Unaffiliated issuers (net of foreign taxes of $780) | 231,379 | |
Foreign currency transactions | (2,357) | |
Futures contracts | 9,977 | |
Total net realized gain (loss) | | 238,999 |
Change in net unrealized appreciation (depreciation) on: Investment securities (net of increase in deferred foreign taxes of $1,455) | 942,135 | |
Assets and liabilities in foreign currencies | 247 | |
Futures contracts | (2,186) | |
Total change in net unrealized appreciation (depreciation) | | 940,196 |
Net gain (loss) | | 1,179,195 |
Net increase (decrease) in net assets resulting from operations | | $ 1,268,217 |
Annual Report
See accompanying notes which are an integral part of the financial statements.
Financial Statements - continued
Statement of Changes in Net Assets
Amounts in thousands | Year ended
October 31,
2006 | Year ended
October 31,
2005 |
Increase (Decrease) in Net Assets | | |
Operations | | |
Net investment income (loss) | $ 89,022 | $ 41,777 |
Net realized gain (loss) | 238,999 | 194,174 |
Change in net unrealized appreciation (depreciation) | 940,196 | 324,844 |
Net increase (decrease) in net assets resulting
from operations | 1,268,217 | 560,795 |
Distributions to shareholders from net investment income | (41,324) | (12,813) |
Distributions to shareholders from net realized gain | (189,744) | (10,250) |
Total distributions | (231,068) | (23,063) |
Share transactions - net increase (decrease) | 3,239,823 | 1,234,164 |
Redemption fees | 380 | 193 |
Total increase (decrease) in net assets | 4,277,352 | 1,772,089 |
| | |
Net Assets | | |
Beginning of period | 3,964,751 | 2,192,662 |
End of period (including undistributed net investment income of $83,948 and undistributed net investment income of $40,185, respectively) | $ 8,242,103 | $ 3,964,751 |
Annual Report
See accompanying notes which are an integral part of the financial statements.
Financial Highlights - Class A
Years ended October 31, | 2006 | 2005 H |
Selected Per-Share Data | | |
Net asset value, beginning of period | $ 30.57 | $ 27.41 |
Income from Investment Operations | | |
Net investment income (loss) E | .42 | .28 |
Net realized and unrealized gain (loss) | 7.19 | 2.88 |
Total from investment operations | 7.61 | 3.16 |
Distributions from net investment income | (.31) | - |
Distributions from net realized gain | (1.40) | - |
Total distributions | (1.71) | - |
Redemption fees added to paid in capital E | - J | - J |
Net asset value, end of period | $ 36.47 | $ 30.57 |
Total Return B,C,D | 26.01% | 11.53% |
Ratios to Average Net Assets F,I | | |
Expenses before reductions | 1.27% | 1.42% A |
Expenses net of fee waivers, if any | 1.27% | 1.42% A |
Expenses net of all reductions | 1.21% | 1.36% A |
Net investment income (loss) | 1.22% | 1.15% A |
Supplemental Data | | |
Net assets, end of period (in millions) | $ 140 | $ 2 |
Portfolio turnover rate G | 56% | 75% |
A Annualized
B Total returns for periods of less than one year are not annualized.
C Total returns would have been lower had certain expenses not been reduced during the periods shown.
D Total returns do not include the effect of the sales charges.
E Calculated based on average shares outstanding during the period.
F Fees and expenses of the underlying Fidelity Central Funds are not included in the Fund's expense ratio. The Fund indirectly bears its proportionate share of the expenses of any underlying Fidelity Central Funds.
G Amount does not include the portfolio activity of any underlying Fidelity Central Funds.
H For the period January 6, 2005 (commencement of sale of shares) to October 31, 2005.
I Expense ratios reflect operating expenses of the class. Expenses before reductions do not reflect amounts reimbursed by the investment adviser or reductions from brokerage service arrangements or other expense offset arrangements and do not represent the amount paid by the class during periods when reimbursements or reductions occur. Expense ratios before reductions for start-up periods may not be representative of longer-term operating periods. Expenses net of fee waivers reflect expenses after reimbursement by the investment adviser but prior to reductions from brokerage service arrangements or other expense offset arrangements. Expenses net of all reductions represent the net expenses paid by the class.
J Amount represents less than $.01 per share.
Annual Report
See accompanying notes which are an integral part of the financial statements.
Financial Highlights - Class T
Years ended October 31, | 2006 | 2005 H |
Selected Per-Share Data | | |
Net asset value, beginning of period | $ 30.49 | $ 27.41 |
Income from Investment Operations | | |
Net investment income (loss) E | .27 | .20 |
Net realized and unrealized gain (loss) | 7.18 | 2.88 |
Total from investment operations | 7.45 | 3.08 |
Distributions from net investment income | (.24) | - |
Distributions from net realized gain | (1.40) | - |
Total distributions | (1.64) | - |
Redemption fees added to paid in capital E | - J | - J |
Net asset value, end of period | $ 36.30 | $ 30.49 |
Total Return B,C,D | 25.49% | 11.24% |
Ratios to Average Net Assets F,I | | |
Expenses before reductions | 1.71% | 1.75% A |
Expenses net of fee waivers, if any | 1.71% | 1.75% A |
Expenses net of all reductions | 1.65% | 1.69% A |
Net investment income (loss) | .78% | .83% A |
Supplemental Data | | |
Net assets, end of period (in millions) | $ 10 | $ 2 |
Portfolio turnover rate G | 56% | 75% |
A Annualized
B Total returns for periods of less than one year are not annualized.
C Total returns would have been lower had certain expenses not been reduced during the periods shown.
D Total returns do not include the effect of the sales charges.
E Calculated based on average shares outstanding during the period.
F Fees and expenses of the underlying Fidelity Central Funds are not included in the Fund's expense ratio. The Fund indirectly bears its proportionate share of the expenses of any underlying Fidelity Central Funds.
G Amount does not include the portfolio activity of any underlying Fidelity Central Funds.
H For the period January 6, 2005 (commencement of sale of shares) to October 31, 2005.
I Expense ratios reflect operating expenses of the class. Expenses before reductions do not reflect amounts reimbursed by the investment adviser or reductions from brokerage service arrangements or other expense offset arrangements and do not represent the amount paid by the class during periods when reimbursements or reductions occur. Expense ratios before reductions for start-up periods may not be representative of longer-term operating periods. Expenses net of fee waivers reflect expenses after reimbursement by the investment adviser but prior to reductions from brokerage service arrangements or other expense offset arrangements. Expenses net of all reductions represent the net expenses paid by the class.
J Amount represents less than $.01 per share.
Annual Report
See accompanying notes which are an integral part of the financial statements.
Financial Highlights - Class B
Years ended October 31, | 2006 | 2005 H |
Selected Per-Share Data | | |
Net asset value, beginning of period | $ 30.36 | $ 27.41 |
Income from Investment Operations | | |
Net investment income (loss) E | .08 | .08 |
Net realized and unrealized gain (loss) | 7.19 | 2.87 |
Total from investment operations | 7.27 | 2.95 |
Distributions from net investment income | (.11) | - |
Distributions from net realized gain | (1.40) | - |
Total distributions | (1.51) | - |
Redemption fees added to paid in capital E | - J | - J |
Net asset value, end of period | $ 36.12 | $ 30.36 |
Total Return B,C,D | 24.91% | 10.76% |
Ratios to Average Net Assets F,I | | |
Expenses before reductions | 2.27% | 2.24% A |
Expenses net of fee waivers, if any | 2.25% | 2.24% A |
Expenses net of all reductions | 2.19% | 2.18% A |
Net investment income (loss) | .24% | .33% A |
Supplemental Data | | |
Net assets, end of period (in millions) | $ 4 | $ 1 |
Portfolio turnover rate G | 56% | 75% |
A Annualized
B Total returns for periods of less than one year are not annualized.
C Total returns would have been lower had certain expenses not been reduced during the periods shown.
D Total returns do not include the effect of the contingent deferred sales charge.
E Calculated based on average shares outstanding during the period.
F Fees and expenses of the underlying Fidelity Central Funds are not included in the Fund's expense ratio. The Fund indirectly bears its proportionate share of the expenses of any underlying Fidelity Central Funds.
G Amount does not include the portfolio activity of any underlying Fidelity Central Funds.
H For the period January 6, 2005 (commencement of sale of shares) to October 31, 2005.
I Expense ratios reflect operating expenses of the class. Expenses before reductions do not reflect amounts reimbursed by the investment adviser or reductions from brokerage service arrangements or other expense offset arrangements and do not represent the amount paid by the class during periods when reimbursements or reductions occur. Expense ratios before reductions for start-up periods may not be representative of longer-term operating periods. Expenses net of fee waivers reflect expenses after reimbursement by the investment adviser but prior to reductions from brokerage service arrangements or other expense offset arrangements. Expenses net of all reductions represent the net expenses paid by the class.
J Amount represents less than $.01 per share.
Annual Report
See accompanying notes which are an integral part of the financial statements.
Financial Highlights - Class C
Years ended October 31, | 2006 | 2005 H |
Selected Per-Share Data | | |
Net asset value, beginning of period | $ 30.41 | $ 27.41 |
Income from Investment Operations | | |
Net investment income (loss) E | .11 | .13 |
Net realized and unrealized gain (loss) | 7.19 | 2.87 |
Total from investment operations | 7.30 | 3.00 |
Distributions from net investment income | (.12) | - |
Distributions from net realized gain | (1.40) | - |
Total distributions | (1.52) | - |
Redemption fees added to paid in capital E | - J | - J |
Net asset value, end of period | $ 36.19 | $ 30.41 |
Total Return B,C,D | 24.97% | 10.94% |
Ratios to Average Net Assets F,I | | |
Expenses before reductions | 2.16% | 2.04% A |
Expenses net of fee waivers, if any | 2.16% | 2.04% A |
Expenses net of all reductions | 2.11% | 1.98% A |
Net investment income (loss) | .33% | .53% A |
Supplemental Data | | |
Net assets, end of period (in millions) | $ 6 | $ 2 |
Portfolio turnover rate G | 56% | 75% |
A Annualized
B Total returns for periods of less than one year are not annualized.
C Total returns would have been lower had certain expenses not been reduced during the periods shown.
D Total returns do not include the effect of the contingent deferred sales charge.
E Calculated based on average shares outstanding during the period.
F Fees and expenses of the underlying Fidelity Central Funds are not included in the Fund's expense ratio. The Fund indirectly bears its proportionate share of the expenses of any underlying Fidelity Central Funds.
G Amount does not include the portfolio activity of any underlying Fidelity Central Funds.
H For the period January 6, 2005 (commencement of sale of shares) to October 31, 2005.
I Expense ratios reflect operating expenses of the class. Expenses before reductions do not reflect amounts reimbursed by the investment adviser or reductions from brokerage service arrangements or other expense offset arrangements and do not represent the amount paid by the class during periods when reimbursements or reductions occur. Expense ratios before reductions for start-up periods may not be representative of longer-term operating periods. Expenses net of fee waivers reflect expenses after reimbursement by the investment adviser but prior to reductions from brokerage service arrangements or other expense offset arrangements. Expenses net of all reductions represent the net expenses paid by the class.
J Amount represents less than $.01 per share.
Annual Report
See accompanying notes which are an integral part of the financial statements.
Financial Highlights - International Discovery
Years ended October 31, | 2006 | 2005 | 2004 | 2003 | 2002 |
Selected Per-Share Data | | | | | |
Net asset value, beginning of period | $ 30.65 | $ 25.31 | $ 21.87 | $ 16.66 | $ 17.61 |
Income from Investment Operations | | | | | |
Net investment income (loss) B | .48 | .37 | .22 | .19 | .11 |
Net realized and unrealized gain (loss) | 7.25 | 5.24 | 3.40 | 5.11 | (1.06) |
Total from investment operations | 7.73 | 5.61 | 3.62 | 5.30 | (.95) |
Distributions from net investment income | (.31) | (.15) | (.18) | (.09) | - |
Distributions from net realized gain | (1.40) | (.12) | - | - | - |
Total distributions | (1.71) | (.27) | (.18) | (.09) | - |
Redemption fees added to paid in capital B | - F | - F | - F | - F | - F |
Net asset value, end of period | $ 36.67 | $ 30.65 | $ 25.31 | $ 21.87 | $ 16.66 |
Total Return A | 26.34% | 22.29% | 16.65% | 31.97% | (5.39)% |
Ratios to Average Net Assets C,E | | | | | |
Expenses before reductions | 1.09% | 1.08% | 1.10% | 1.14% | 1.14% |
Expenses net of fee waivers, if any | 1.08% | 1.07% | 1.10% | 1.14% | 1.14% |
Expenses net of all reductions | 1.03% | 1.01% | 1.06% | 1.11% | 1.12% |
Net investment income (loss) | 1.41% | 1.35% | .92% | 1.08% | .59% |
Supplemental Data | | | | | |
Net assets, end of period (in millions) | $ 8,054 | $ 3,949 | $ 2,193 | $ 1,243 | $ 890 |
Portfolio turnover rate D | 56% | 75% | 87% | 81% | 63% |
A Total returns would have been lower had certain expenses not been reduced during the periods shown.
B Calculated based on average shares outstanding during the period.
C Fees and expenses of the underlying Fidelity Central Funds are not included in the Fund's expense ratio. The Fund indirectly bears its proportionate share of the expenses of any underlying Fidelity Central Funds.
D Amount does not include the portfolio activity of any underlying Fidelity Central Funds.
E Expense ratios reflect operating expenses of the class. Expenses before reductions do not reflect amounts reimbursed by the investment adviser or reductions from brokerage service arrangements or other expense offset arrangements and do not represent the amount paid by the class during periods when reimbursements or reductions occur. Expenses net of fee waivers reflect expenses after reimbursement by the investment adviser but prior to reductions from brokerage service arrangements or other expense offset arrangements. Expenses net of all reductions represent the net expenses paid by the class.
F Amount represents less than $.01 per share.
Annual Report
See accompanying notes which are an integral part of the financial statements.
Financial Highlights - Institutional Class
Years ended October 31, | 2006 | 2005 G |
Selected Per-Share Data | | |
Net asset value, beginning of period | $ 30.68 | $ 27.41 |
Income from Investment Operations | | |
Net investment income (loss) D | .51 | .38 |
Net realized and unrealized gain (loss) | 7.25 | 2.89 |
Total from investment operations | 7.76 | 3.27 |
Distributions from net investment income | (.33) | - |
Distributions from net realized gain | (1.40) | - |
Total distributions | (1.73) | - |
Redemption fees added to paid in capital D | - I | - I |
Net asset value, end of period | $ 36.71 | $ 30.68 |
Total Return B,C | 26.45% | 11.93% |
Ratios to Average Net Assets E,H | | |
Expenses before reductions | 1.00% | .97% A |
Expenses net of fee waivers, if any | 1.00% | .97% A |
Expenses net of all reductions | .95% | .90% A |
Net investment income (loss) | 1.49% | 1.60% A |
Supplemental Data | | |
Net assets, end of period (in millions) | $ 28 | $ 10 |
Portfolio turnover rate F | 56% | 75% |
A Annualized
B Total returns for periods of less than one year are not annualized.
C Total returns would have been lower had certain expenses not been reduced during the periods shown.
D Calculated based on average shares outstanding during the period.
E Fees and expenses of the underlying Fidelity Central Funds are not included in the Fund's expense ratio. The Fund indirectly bears its proportionate share of the expenses of any underlying Fidelity Central Funds.
F Amount does not include the portfolio activity of any underlying Fidelity Central Funds.
G For the period January 6, 2005 (commencement of sale of shares) to October 31, 2005.
H Expense ratios reflect operating expenses of the class. Expenses before reductions do not reflect amounts reimbursed by the investment adviser or reductions from brokerage service arrangements or other expense offset arrangements and do not represent the amount paid by the class during periods when reimbursements or reductions occur. Expense ratios before reductions for start-up periods may not be representative of longer-term operating periods. Expenses net of fee waivers reflect expenses after reimbursement by the investment adviser but prior to reductions from brokerage service arrangements or other expense offset arrangements. Expenses net of all reductions represent the net expenses paid by the class.
I Amount represents less than $.01 per share.
Annual Report
See accompanying notes which are an integral part of the financial statements.
Notes to Financial Statements
For the period ended October 31, 2006
(Amounts in thousands except ratios)
1. Significant Accounting Policies.
Fidelity International Discovery Fund (the Fund) is a fund of Fidelity Investment Trust (the trust) and is authorized to issue an unlimited number of shares. The trust is registered under the Investment Company Act of 1940, as amended (the 1940 Act), as an open-end management investment company organized as a Massachusetts business trust.
The Fund offers Class A, Class T, Class B, Class C, International Discovery and Institutional Class shares, each of which has equal rights as to assets and voting privileges. Each class has exclusive voting rights with respect to matters that affect that class. Class B shares will automatically convert to Class A shares after a holding period of seven years from the initial date of purchase. Investment income, realized and unrealized capital gains and losses, the common expenses of the Fund, and certain fund-level expense reductions, if any, are allocated on a pro rata basis to each class based on the relative net assets of each class to the total net assets of the Fund. Each class differs with respect to transfer agent and distribution and service plan fees incurred. Certain expense reductions also differ by class.
The Fund's investments in emerging markets can be subject to social, economic, regulatory, and political uncertainties and can be extremely volatile. The Fund may invest in Fidelity Central Funds which are open-end investment companies available to investment companies and other accounts managed by Fidelity Management & Research Company (FMR) and its affiliates. The financial statements have been prepared in conformity with accounting principles generally accepted in the United States of America, which require management to make certain estimates and assumptions at the date of the financial statements. The following summarizes the significant accounting policies of the Fund, which are also consistently followed by the Fidelity Central Funds:
Security Valuation. Investments are valued and net asset value (NAV) per share is calculated (NAV calculation) as of the close of business of the New York Stock Exchange (NYSE), normally 4:00 p.m. Eastern time. Wherever possible, the Fund uses independent pricing services approved by the Board of Trustees to value its investments.
Equity securities, including restricted securities, for which market quotations are readily available, are valued at the last reported sale price or official closing price as reported by an independent pricing service on the primary market or exchange on which they are traded. In the event there were no sales during the day or closing prices are not available, securities are valued at the last quoted bid price. Investments in open-end mutual funds, including the Fidelity Central Funds, are valued at their closing net asset value each business day. Short-term securities with remaining maturities of sixty days or less for which quotations are not readily available are valued at amortized cost, which approximates value.
Annual Report
Notes to Financial Statements - continued
(Amounts in thousands except ratios)
1. Significant Accounting Policies - continued
Security Valuation - continued
When current market prices or quotations are not readily available or do not accurately reflect fair value, valuations may be determined in accordance with procedures adopted by the Board of Trustees. For example, when developments occur between the close of a market and the close of the NYSE that may materially affect the value of some or all of the securities, or when trading in a security is halted, those securities may be fair valued. Factors used in the determination of fair value may include monitoring news to identify significant market or security specific events such as changes in the value of U.S. securities markets, reviewing developments in foreign markets and evaluating the performance of ADRs, futures contracts and exchange-traded funds. Because the Fund's utilization of fair value pricing depends on market activity, the frequency with which fair value pricing is used can not be predicted and may be utilized to a significant extent. The value of securities used for NAV calculation under fair value pricing may differ from published prices for the same securities.
Foreign Currency. The Fund uses foreign currency contracts to facilitate transactions in foreign-denominated securities. Losses from these transactions may arise from changes in the value of the foreign currency or if the counterparties do not perform under the contracts' terms.
Foreign-denominated assets, including investment securities, and liabilities are translated into U.S. dollars at the exchange rate at period end. Purchases and sales of investment securities, income and dividends received and expenses denominated in foreign currencies are translated into U.S. dollars at the exchange rate in effect on the transaction date.
The effects of exchange rate fluctuations on investments are included with the net realized and unrealized gain (loss) on investment securities. Other foreign currency transactions resulting in realized and unrealized gain (loss) are disclosed separately.
Investment Transactions and Income. Security transactions, including the Fund's investment activity in the Fidelity Central Funds, are accounted for as of trade date. Gains and losses on securities sold are determined on the basis of identified cost and may include proceeds received from litigation. Dividend income is recorded on the ex-dividend date, except for certain dividends from foreign securities where the ex-dividend date may have passed, which are recorded as soon as the Fund is informed of the ex-dividend date. Non-cash dividends included in dividend income, if any, are recorded at the fair market value of the securities received. Distributions received on securities that represent a return of capital or capital gain are recorded as a reduction of cost of investments and/or as a realized gain. The Fund estimates the components of distributions received that may be considered return of capital distributions or capital gain distributions. Interest income is accrued as earned. Interest income includes coupon interest and amortization of premium and accretion of discount on debt securities. Investment income is recorded net of foreign taxes withheld where recovery of such taxes is uncertain.
Annual Report
1. Significant Accounting Policies - continued
Expenses. Most expenses of the trust can be directly attributed to a fund. Expenses which cannot be directly attributed are apportioned among each Fund in the trust. Expense estimates are accrued in the period to which they relate and adjustments are made when actual amounts are known.
Income Tax Information and Distributions to Shareholders. Each year, the Fund intends to qualify as a regulated investment company by distributing all of its taxable income and realized gains under Subchapter M of the Internal Revenue Code. As a result, no provision for income taxes is required in the accompanying financial statements. Foreign taxes are provided for based on the Fund's understanding of the tax rules and rates that exist in the foreign markets in which it invests.
Distributions are recorded on the ex-dividend date. Income dividends and capital gain distributions are declared separately for each class. Income and capital gain distributions are determined in accordance with income tax regulations, which may differ from generally accepted accounting principles. In addition, the Fund will claim a portion of the payment made to redeeming shareholders as a distribution for income tax purposes.
Capital accounts within the financial statements are adjusted for permanent book-tax differences. These adjustments have no impact on net assets or the results of operations. Temporary book-tax differences will reverse in a subsequent period.
Book-tax differences are primarily due to futures transactions, foreign currency transactions, passive foreign investment companies (PFIC), and losses deferred due to wash sales.
The tax-basis components of distributable earnings and the federal tax cost as of period end were as follows:
Unrealized appreciation | $ 1,585,398 | |
Unrealized depreciation | (82,869) | |
Net unrealized appreciation (depreciation) | 1,502,529 | |
Undistributed ordinary income | 132,824 | |
Undistributed long-term capital gain | 165,476 | |
| | |
Cost for federal income tax purposes | $ 6,849,493 | |
The tax character of distributions paid was as follows:
| October 31, 2006 | October 31, 2005 |
Ordinary Income | $ 106,379 | $ 12,813 |
Long-term Capital Gains | 124,689 | 10,250 |
| | |
Total | $ 231,068 | $ 23,063 |
Annual Report
Notes to Financial Statements - continued
(Amounts in thousands except ratios)
1. Significant Accounting Policies - continued
Short-Term Trading (Redemption) Fees. Shares held in the Fund less than 30 days are subject to a redemption fee equal to 1.00% of the proceeds of the redeemed shares. All redemption fees, including any estimated redemption fees paid by FMR, are retained by the Fund and accounted for as an addition to paid in capital.
New Accounting Pronouncements. In July 2006, Financial Accounting Standards Board Interpretation No. 48, Accounting for Uncertainty in Income Taxes - an interpretation of FASB Statement 109 (FIN 48), was issued and is effective for fiscal years beginning after December 15, 2006. FIN 48 sets forth a threshold for financial statement recognition, measurement and disclosure of a tax position taken or expected to be taken on a tax return. Management is currently evaluating the impact, if any, the adoption of FIN 48 will have on the Fund's net assets, results of operations and financial statement disclosures.
In addition, in September 2006, Statement of Financial Accounting Standards No. 157, Fair Value Measurements (SFAS 157), was issued and is effective for fiscal years beginning after November 15, 2007. SFAS 157 defines fair value, establishes a framework for measuring fair value and expands disclosures about fair value measurements. Management is currently evaluating the impact the adoption of SFAS 157 will have on the Fund's financial statement disclosures.
2. Operating Policies.
Repurchase Agreements. FMR has received an Exemptive Order from the Securities and Exchange Commission (the SEC) which permits the Fund and other affiliated entities of FMR to transfer uninvested cash balances into joint trading accounts which are then invested in repurchase agreements. The Fund may also invest directly with institutions in repurchase agreements. Repurchase agreements are collateralized by government or non-government securities. Upon settlement date, collateral is held in segregated accounts with custodian banks and may be obtained in the event of a default of the counterparty. The Fund monitors, on a daily basis, the value of the collateral to ensure it is at least equal to the principal amount of the repurchase agreement (including accrued interest). In the event of a default by the counterparty, realization of the collateral proceeds could be delayed, during which time the value of the collateral may decline.
Futures Contracts. The Fund may use futures contracts to manage its exposure to the stock market. Buying futures tends to increase a fund's exposure to the underlying instrument, while selling futures tends to decrease a fund's exposure to the underlying instrument or hedge other fund investments. Upon entering into a futures contract, a fund is required to deposit with a clearing broker, no later than the following business day, an amount ("initial margin") equal to a certain percentage of the face value of the contract. The initial margin may be in the form of cash or securities and is transferred to a segregated account on settlement date. Subsequent payments ("variation margin") are made or
Annual Report
2. Operating Policies - continued
Futures Contracts - continued
received by a fund depending on the daily fluctuations in the value of the futures contract and are accounted for as unrealized gains or losses. Realized gains (losses) are recorded upon the expiration or closing of the futures contract. Securities deposited to meet margin requirements are identified in the Schedule of Investments. Futures contracts involve, to varying degrees, risk of loss in excess of any futures variation margin reflected in the Statement of Assets and Liabilities. The underlying face amount at value of any open futures contracts at period end is shown in the Schedule of Investments under the caption "Futures Contracts." This amount reflects each contract's exposure to the underlying instrument at period end. Losses may arise from changes in the value of the underlying instruments or if the counterparties do not perform under the contract's terms. Futures contracts are valued at the settlement price established each day by the board of trade or exchange on which they are traded.
Restricted Securities. The Fund may invest in securities that are subject to legal or contractual restrictions on resale. These securities generally may be resold in transactions exempt from registration or to the public if the securities are registered. Disposal of these securities may involve time-consuming negotiations and expense, and prompt sale at an acceptable price may be difficult. Information regarding restricted securities is included at the end of the Fund's Schedule of Investments.
3. Purchases and Sales of Investments.
Purchases and sales of securities, other than short-term securities, aggregated $6,247,376 and $3,418,782, respectively.
4. Fees and Other Transactions with Affiliates.
Management Fee. FMR and its affiliates provide the Fund with investment management related services for which the Fund pays a monthly management fee. The management fee is the sum of an individual fund fee rate that is based on an annual rate of .45% of the Fund's average net assets and a group fee rate that averaged .27% during the period. The group fee rate is based upon the average net assets of all the mutual funds advised by FMR.
The group fee rate decreases as assets under management increase and increases as assets under management decrease. In addition, the management fee is subject to a performance adjustment (up to a maximum of ± .20% of the Fund's average net assets over a 36 month performance period). The upward or downward adjustment to the management fee is based on the relative investment performance of the retail class of the Fund, International Discovery, as compared to an appropriate benchmark index. The Fund's performance adjustment took effect in September 2005. Subsequent months will be added until the performance period includes 36 months. For the period, the total annual management fee rate, including the performance adjustment, was .79% of the Fund's average net assets.
Annual Report
Notes to Financial Statements - continued
(Amounts in thousands except ratios)
4. Fees and Other Transactions with Affiliates - continued
Distribution and Service Plan. In accordance with Rule 12b-1 of the 1940 Act, the Fund has adopted separate Distribution and Service Plans for each class of shares. Certain classes pay Fidelity Distributors Corporation (FDC), an affiliate of FMR, separate Distribution and Service Fees, each of which is based on an annual percentage of each class' average net assets. In addition, FDC may pay financial intermediaries for selling shares of the Fund and providing shareholder support services. For the period, the Distribution and Service Fee rates and the total amounts paid to and retained by FDC were as follows:
| Distribution
Fee | Service
Fee | Paid to
FDC | Retained
by FDC |
Class A | 0% | .25% | $ 183 | $ - |
Class T | .25% | .25% | 26 | 2 |
Class B | .75% | .25% | 21 | 16 |
Class C | .75% | .25% | 33 | 19 |
| | | $ 263 | $ 37 |
Sales Load. FDC receives a front-end sales charge of up to 5.75% for selling Class A shares, and 3.50% for selling Class T shares, some of which is paid to financial intermediaries for selling shares of the Fund. FDC receives the proceeds of contingent deferred sales charges levied on Class A, Class T, Class B, and Class C redemptions. These charges depend on the holding period. The deferred sales charges range from 5% to 1% for Class B, 1% for Class C, 1.00% to .50% for certain purchases of Class A shares (.25% prior to February 24, 2006) and .25% for certain purchases of Class T shares.
For the period, sales charge amounts retained by FDC were as follows:
| Retained
by FDC |
Class A | $ 36 |
Class T | 7 |
Class B* | 3 |
Class C* | 1 |
| $ 47 |
* When Class B and Class C shares are initially sold, FDC pays commissions from its own resources to financial intermediaries through which the sales
are made.
Transfer Agent Fees. Fidelity Investments Institutional Operations Company, Inc. (FIIOC), an affiliate of FMR, is the transfer, dividend disbursing and shareholder servicing agent for each class of the Fund, except for International Discovery. Fidelity Service Company, Inc. (FSC), an affiliate of FMR, is the transfer agent for International Discovery shares. FIIOC and FSC receive account fees and asset-based fees that vary according to the account size and type of account of the shareholders of the respective classes of the Fund.
Annual Report
4. Fees and Other Transactions with Affiliates - continued
Transfer Agent Fees - continued
FIIOC and FSC pay for typesetting, printing and mailing of shareholder reports, except proxy statements. For the period, the total transfer agent fees paid by each class to FIIOC or FSC, were as follows:
| Amount | % of
Average
Net Assets |
Class A | $ 115 | .16 |
Class T | 18 | .35 |
Class B | 9 | .41 |
Class C | 10 | .31 |
International Discovery | 13,891 | .22 |
Institutional Class | 28 | .14 |
| $ 14,071 | |
Accounting and Security Lending Fees. FSC maintains the Fund's accounting records. The accounting fee is based on the level of average net assets for the month. Under a separate contract, FSC administers the security lending program. The security lending fee is based on the number and duration of lending transactions.
Investments in Fidelity Central Funds. The Fund may invest in Fidelity Central Funds. The Fund's Schedule of Investments lists each of the Fidelity Central Funds as an investment of the Fund but does not include the underlying holdings of each Fidelity Central Fund. As an Investing Fund, the Fund indirectly bears its proportionate share of the expenses of the underlying Fidelity Central Funds. A complete unaudited list of holdings for each Fidelity Central Fund is available upon request. In addition, the financial statements of the Fidelity Central Funds, which are not covered by the Fund's Report of Independent Registered Public Accounting Firm, are available on the EDGAR Database on the SEC's web site, www.sec.gov, or upon request.
The Money Market Central Funds seek preservation of capital and current income and are managed by Fidelity Investments Money Management, Inc. (FIMM), an affiliate of FMR.
5. Committed Line of Credit.
The Fund participates with other funds managed by FMR in a $4.2 billion credit facility (the "line of credit") to be utilized for temporary or emergency purposes to fund shareholder redemptions or for other short-term liquidity purposes. The Fund has agreed to pay commitment fees on its pro rata portion of the line of credit, which amounts to $16 and is reflected in Miscellaneous Expense on the Statement of Operations. During the period, there were no borrowings on this line of credit.
Annual Report
Notes to Financial Statements - continued
(Amounts in thousands except ratios)
6. Security Lending.
The Fund lends portfolio securities from time to time in order to earn additional income. On the settlement date of the loan, the Fund receives collateral (in the form of U.S. Treasury obligations, letters of credit and/or cash) against the loaned securities and maintains collateral in an amount not less than 100% of the market value of the loaned securities during the period of the loan. The market value of the loaned securities is determined at the close of business of the Fund and any additional required collateral is delivered to the Fund on the next business day. If the borrower defaults on its obligation to return the securities loaned because of insolvency or other reasons, a fund could experience delays and costs in recovering the securities loaned or in gaining access to the collateral. Any cash collateral received is invested in the Fidelity Securities Lending Cash Central Fund. The value of loaned securities and cash collateral at period end are disclosed on the Fund's Statement of Assets and Liabilities. Security lending income represents the income earned on investing cash collateral, less fees and expenses associated with the loan, plus any premium payments that may be received on the loan of certain types of securities. Net income from lending portfolio securities during the period amounted to $5,746.
7. Bank Borrowings.
The Fund is permitted to have bank borrowings for temporary or emergency purposes to fund shareholder redemptions. The Fund has established borrowing arrangements with certain banks. The interest rate on the borrowings is the bank's base rate, as revised from time to time. The average daily loan balance during the period for which loans were outstanding amounted to $6,674. The weighted average interest rate was 4.79%. At period end, there were no bank borrowings outstanding.
8. Expense Reductions.
FMR voluntarily agreed to reimburse a portion of Fidelity International Discovery's operating expenses. During the period, this reimbursement reduced the class expenses by $38.
FMR voluntarily agreed to reimburse each class to the extent annual operating expenses exceeded certain levels of average net assets as noted in the table below. Some expenses, for example interest expense, including commitment fees, are excluded from this reimbursement.
The following classes were in reimbursement during the period:
| Expense
Limitations | Reimbursement
from adviser |
Class B | 2.25% | $ 1 |
Annual Report
8. Expense Reductions - continued
Many of the brokers with whom FMR places trades on behalf of the Fund provided services to the Fund in addition to trade execution. These services included payments of certain expenses on behalf of the Fund totaling $3,493 for the period. In addition, through arrangements with the Fund's custodian and each class' transfer agent, credits realized as a result of uninvested cash balances were used to reduce the Fund's expenses. During the period, credits reduced each class' transfer agent expense as noted in the table below.
| Transfer Agent
expense reduction |
International Discovery | $ 205 |
9. Other.
The Fund's organizational documents provide former and current trustees and officers with a limited indemnification against liabilities arising in connection with the performance of their duties to the Fund. In the normal course of business, the Fund may also enter into contracts that provide general indemnifications. The Fund's maximum exposure under these arrangements is unknown as this would be dependent on future claims that may be made against the Fund. The risk of material loss from such claims is considered remote.
During the period, the Fund's transfer agent, Fidelity Investments Institutional Operations Company, Inc. (FIIOC), an affiliate of Fidelity Management & Research Company, notified the Fund that the fund's books and records did not reflect a conversion of certain Class B to Class A shares upon their conversion date. Management has determined that this did not have a material impact to the Fund's reported net assets or results of operations in the accompanying financial statements. FIIOC will cause the books and records of the Fund to reflect a conversion of the relevant Class B shares to Class A and is in the process of determining the impact to affected shareholder accounts for purposes of its remediation.
The United States Securities and Exchange Commission ("SEC") is conducting an investigation of FMR (covering the years 2002 to 2004) arising from gifts, gratuities and business entertainment provided by certain brokers to certain individuals who were employed on FMR's domestic equity trading desk during that period. FMR is in discussions with the SEC staff regarding the possible resolution of the matter, but as of period-end no final resolution has been reached.
Annual Report
Notes to Financial Statements - continued
(Amounts in thousands except ratios)
9. Other - continued
In December 2006, the Independent Trustees completed their own investigation of the matter with the assistance of independent counsel. The Independent Trustees and FMR agree that, despite the absence of proof that the Fidelity mutual funds experienced diminished execution quality as a result of the improper receipt of gifts and business entertainment, the conduct at issue was serious and is worthy of redress. Accordingly, the Independent Trustees have requested and FMR has agreed to pay $42 million to Fidelity mutual funds, plus interest to be determined at the time that payment is made. A method of allocating this payment among the funds has not yet been determined. In addition, FMR has agreed to reimburse related legal expenses. The total payment to the Fund is not anticipated to have a material impact on the Fund's net assets.
10. Distributions to Shareholders.
Distributions to shareholders of each class were as follows:
Years ended October 31, | 2006 | 2005 |
From net investment income | | |
Class A | $ 38 | $ - |
Class T | 18 | - |
Class B | 3 | - |
Class C | 8 | - |
International Discovery | 41,152 | 12,813 |
Institutional Class | 105 | - |
Total | $ 41,324 | $ 12,813 |
From net realized gain | | |
Class A | $ 173 | $ - |
Class T | 102 | - |
Class B | 40 | - |
Class C | 94 | - |
International Discovery | 188,890 | 10,250 |
Institutional Class | 445 | - |
Total | $ 189,744 | $ 10,250 |
Annual Report
11. Share Transactions.
Transactions for each class of shares were as follows:
| Shares | Dollars |
Years ended October 31, | 2006 | 2005 A | 2006 | 2005 A |
Class A | | | | |
Shares sold | 3,952 | 62 | $ 133,777 | $ 1,786 |
Reinvestment of distributions | 5 | - | 160 | - |
Shares redeemed | (183) | (1) | (6,217) | (30) |
Net increase (decrease) | 3,774 | 61 | $ 127,720 | $ 1,756 |
Class T | | | | |
Shares sold | 248 | 63 | $ 8,469 | $ 1,829 |
Reinvestment of distributions | 4 | - | 112 | - |
Shares redeemed | (36) | (2) | (1,223) | (58) |
Net increase (decrease) | 216 | 61 | $ 7,358 | $ 1,771 |
Class B | | | | |
Shares sold | 112 | 27 | $ 3,875 | $ 759 |
Reinvestment of distributions | 1 | - | 37 | - |
Shares redeemed | (14) | (2) | (489) | (53) |
Net increase (decrease) | 99 | 25 | $ 3,423 | $ 706 |
Class C | | | | |
Shares sold | 130 | 63 | $ 4,409 | $ 1,805 |
Reinvestment of distributions | 1 | - | 41 | - |
Shares redeemed | (32) | - | (1,088) | (1) |
Net increase (decrease) | 99 | 63 | $ 3,362 | $ 1,804 |
International Discovery | | | | |
Shares sold | 123,095 | 73,475 | $ 4,201,412 | $ 2,106,762 |
Reinvestment of distributions | 7,089 | 781 | 215,944 | 21,434 |
Shares redeemed | (39,365) | (32,072) | (1,334,783) | (909,132) |
Net increase (decrease) | 90,819 | 42,184 | $ 3,082,573 | $ 1,219,064 |
Institutional Class | | | | |
Shares sold | 512 | 365 | $ 17,352 | $ 10,479 |
Reinvestment of distributions | 4 | - | 121 | - |
Shares redeemed | (61) | (48) | (2,086) | (1,416) |
Net increase (decrease) | 455 | 317 | $ 15,387 | $ 9,063 |
A Share transactions for Class A, T, B, C and Institutional Class are for the period January 6, 2005 (commencement of sale of shares) to
October 31, 2005.
Annual Report
Report of Independent Registered Public Accounting Firm
To the Trustees of Fidelity Investment Trust and the Shareholders of Fidelity International Discovery Fund:
In our opinion, the accompanying statement of assets and liabilities, including the schedule of investments, and the related statements of operations and of changes in net assets and the financial highlights present fairly, in all material respects, the financial position of Fidelity International Discovery Fund (a fund of Fidelity Investment Trust) at October 31, 2006, the results of its operations for the year then ended, the changes in its net assets for each of the two years in the period then ended and the financial highlights for each of the periods indicated, in conformity with accounting principles generally accepted in the United States of America. These financial statements and financial highlights (hereafter referred to as "financial statements") are the responsibility of the Fidelity International Discovery Fund's management. Our responsibility is to express an opinion on these financial statements based on our audits. We conducted our audits of these financial statements in accordance with the standards of the Public Company Accounting Oversight Board (United States). Those standards require that we plan and perform the audit to obtain reasonable assurance about whether the financial statements are free of material misstatement. An audit includes examining, on a test basis, evidence supporting the amounts and disclosures in the financial statements, assessing the accounting principles used and significant estimates made by management, and evaluating the overall financial statement presentation. We believe that our audits, which included confirmation of securities at October 31, 2006 by correspondence with the custodian and brokers, provide a reasonable basis for our opinion.
/s/PricewaterhouseCoopers LLP
PricewaterhouseCoopers LLP
Boston, Massachusetts
December 21, 2006
Annual Report
Trustees and Officers
The Trustees, Members of the Advisory Board, and executive officers of the trust and fund, as applicable, are listed below. The Board of Trustees governs the fund and is responsible for protecting the interests of shareholders. The Trustees are experienced executives who meet periodically throughout the year to oversee the fund's activities, review contractual arrangements with companies that provide services to the fund, and review the fund's performance. Except for William O. McCoy, each of the Trustees oversees 348 funds advised by FMR or an affiliate. Mr. McCoy oversees 350 funds advised by FMR or an affiliate.
The Trustees hold office without limit in time except that (a) any Trustee may resign; (b) any Trustee may be removed by written instrument, signed by at least two-thirds of the number of Trustees prior to such removal; (c) any Trustee who requests to be retired or who has become incapacitated by illness or injury may be retired by written instrument signed by a majority of the other Trustees; and (d) any Trustee may be removed at any special meeting of shareholders by a two-thirds vote of the outstanding voting securities of the trust. Each Trustee who is not an interested person (as defined in the 1940 Act) (Independent Trustee), shall retire not later than the last day of the calendar year in which his or her 72nd birthday occurs. The Independent Trustees may waive this mandatory retirement age policy with respect to individual Trustees. The executive officers and Advisory Board Members hold office without limit in time, except that any officer and Advisory Board Member may resign or may be removed by a vote of a majority of the Trustees at any regular meeting or any special meeting of the Trustees. Except as indicated, each individual has held the office shown or other offices in the same company for the past five years.
The fund's Statement of Additional Information (SAI) includes more information about the Trustees. To request a free copy, call Fidelity at 1-877-208-0098.
Interested Trustees*:
Correspondence intended for each Trustee who is an interested person may be sent to Fidelity Investments, 82 Devonshire Street, Boston, Massachusetts 02109.
Name, Age; Principal Occupation |
Edward C. Johnson 3d (76) |
| Year of Election or Appointment: 1984 Mr. Johnson is Chairman of the Board of Trustees. Mr. Johnson serves as President (2006-present), Chief Executive Officer, Chairman, and a Director of FMR Corp.; Chairman and a Director of FMR; Chairman and a Director of Fidelity Research & Analysis Company (FRAC); Chairman and a Director of Fidelity Investments Money Management, Inc.; and Chairman (2001-present) and a Director of FMR Co., Inc. In addition, Mr. Johnson serves as Chairman and Director of Fidelity International Limited (FIL). |
Stephen P. Jonas (53) |
| Year of Election or Appointment: 2005 Mr. Jonas is Senior Vice President of the fund (2005-present). He also serves as Senior Vice President of other Fidelity funds (2005-present). Mr. Jonas is Executive Director of FMR (2005-present) and FMR Co., Inc. (2005-present). He also serves as a Director of Fidelity Investments Money Management, Inc. (2005-present) and FMR Corp. (2003- present). Previously, Mr. Jonas served as President of Fidelity Enterprise Operations and Risk Services (2004-2005), Chief Administrative Officer (2002-2004), and Chief Financial Officer of FMR Corp. (1998-2002). In addition, he serves on the Boards of Boston Ballet (2003-present) and Simmons College (2003-present). |
Robert L. Reynolds (54) |
| Year of Election or Appointment: 2003 Mr. Reynolds is President and a Director of FMR (2005-present), Fidelity Investments Money Management, Inc. (2005-present), and FMR Co., Inc. (2005-present). Mr. Reynolds also serves as Vice Chairman (2006-present), a Director (2003-present), and Chief Operating Officer of FMR Corp. and a Director of Strategic Advisers, Inc. (2005-present). He also serves on the Board at Fidelity Investments Canada, Ltd. |
* Trustees have been determined to be "Interested Trustees" by virtue of, among other things, their affiliation with the trust or various entities under common control with FMR.
Annual Report
Independent Trustees:
Correspondence intended for each Independent Trustee (that is, the Trustees other than the Interested Trustees) may be sent to Fidelity Investments, P.O. Box 55235, Boston, Massachusetts 02205-5235.
Name, Age; Principal Occupation |
Dennis J. Dirks (58) |
| Year of Election or Appointment: 2005 Prior to his retirement in May 2003, Mr. Dirks was Chief Operating Officer and a member of the Board of The Depository Trust & Clearing Corporation (DTCC) (1999-2003). He also served as President, Chief Operating Officer, and Board member of The Depository Trust Company (DTC) (1999-2003) and President and Board member of the National Securities Clearing Corporation (NSCC) (1999-2003). In addition, Mr. Dirks served as Chief Executive Officer and Board member of the Government Securities Clearing Corporation (2001- 2003) and Chief Executive Officer and Board member of the Mortgage-Backed Securities Clearing Corporation (2001-2003). Mr. Dirks also serves as a Trustee and a member of the Finance Committee of Manhattan College (2005-present) and a Trustee and a member of the Finance Committee of AHRC of Nassau County (2006-present). |
Albert R. Gamper, Jr. (64) |
| Year of Election or Appointment: 2006 Prior to his retirement in December 2004, Mr. Gamper served as Chairman of the Board of CIT Group Inc. (commercial finance). During his tenure with CIT Group Inc. Mr. Gamper served in numerous senior management positions, including Chairman (1987-1989; 1999-2001; 2002-2004), Chief Executive Officer (1987-2004), and President (1989-2002). He currently serves as a member of the Board of Directors of Public Service Enterprise Group (utilities, 2001-present), Chairman of the Board of Governors, Rutgers University (2004-present), and Chairman of the Board of Saint Barnabas Health Care System. |
George H. Heilmeier (70) |
| Year of Election or Appointment: 2004 Dr. Heilmeier is Chairman Emeritus of Telcordia Technologies (communication software and systems), where prior to his retirement, he served as company Chairman and Chief Executive Officer. He currently serves on the Boards of Directors of The Mitre Corporation (systems engineering and information technology support for the government), and HRL Laboratories (private research and development, 2004-present). He is Chairman of the General Motors Science & Technology Advisory Board and a Life Fellow of the Institute of Electrical and Electronics Engineers (IEEE). Dr. Heilmeier is a member of the Defense Science Board and the National Security Agency Advisory Board. He is also a member of the National Academy of Engineering, the American Academy of Arts and Sciences, and the Board of Overseers of the School of Engineering and Applied Science of the University of Pennsylvania. Previously, Dr. Heilmeier served as a Director of TRW Inc. (automotive, space, defense, and information technology, 1992-2002), Compaq (1994-2002), Automatic Data Processing, Inc. (ADP) (technology-based business outsourcing, 1995-2002), INET Technologies Inc. (telecommunications network surveillance, 2001-2004), and Teletech Holdings (customer management services). He is the recipient of the 2005 Kyoto Prize in Advanced Technology for his invention of the liquid crystal display, and a member of the Consumer Electronics Hall of Fame. |
Marie L. Knowles (60) |
| Year of Election or Appointment: 2001 Prior to Ms. Knowles' retirement in June 2000, she served as Executive Vice President and Chief Financial Officer of Atlantic Richfield Company (ARCO) (diversified energy, 1996-2000). From 1993 to 1996, she was a Senior Vice President of ARCO and President of ARCO Transportation Company. She served as a Director of ARCO from 1996 to 1998. She currently serves as a Director of Phelps Dodge Corporation (copper mining and manufacturing) and McKesson Corporation (healthcare service, 2002-present). Ms. Knowles is a Trustee of the Brookings Institution and the Catalina Island Conservancy and also serves as a member of the Advisory Board for the School of Engineering of the University of Southern California. |
Ned C. Lautenbach (62) |
| Year of Election or Appointment: 2000 Mr. Lautenbach is Chairman of the Independent Trustees (2006-present). Mr. Lautenbach has been a partner of Clayton, Dubilier & Rice, Inc. (private equity investment firm) since September 1998. Previously, Mr. Lautenbach was with the International Business Machines Corporation (IBM) from 1968 until his retirement in 1998. Mr. Lautenbach serves as a Director of Sony Corporation (2006-present) and Eaton Corporation (diversified industrial) as well as the Philharmonic Center for the Arts in Naples, Florida. He also is a member of the Board of Trustees of Fairfield University (2005-present), as well as a member of the Council on Foreign Relations. |
William O. McCoy (73) |
| Year of Election or Appointment: 1997 Prior to his retirement in December 1994, Mr. McCoy was Vice Chairman of the Board of BellSouth Corporation (telecommunications) and President of BellSouth Enterprises. He is currently a Director of Duke Realty Corporation (real estate). He is also a partner of Franklin Street Partners (private investment management firm). In addition, Mr. McCoy served as the Interim Chancellor (1999-2000) and a member of the Board of Visitors for the University of North Carolina at Chapel Hill and currently serves as Chairman of the Board of Directors of the University of North Carolina Health Care System. He also served as Vice President of Finance for the University of North Carolina (16-school system). |
Cornelia M. Small (62) |
| Year of Election or Appointment: 2005 Ms. Small is a member (2000-present) and Chairperson (2002-present) of the Investment Committee, and a member (2002-present) of the Board of Trustees of Smith College. Previously, she served as Chief Investment Officer (1999-2000), Director of Global Equity Investments (1996-1999), and a member of the Board of Directors of Scudder, Stevens & Clark (1990-1997) and Scudder Kemper Investments (1997-1999). In addition, Ms. Small served as Co-Chair (2000-2003) of the Annual Fund for the Fletcher School of Law and Diplomacy. |
William S. Stavropoulos (67) |
| Year of Election or Appointment: 2001 Mr. Stavropoulos is Chairman Emeritus of the Board of Directors of The Dow Chemical Company. Since joining The Dow Chemical Company in 1967, Mr. Stavropoulos served in numerous senior management positions, including President (1993-2000; 2002-2003), CEO (1995-2000; 2002-2004), and Chairman of the Executive Committee (2000-2004). Currently, he is a Director of NCR Corporation (data warehousing and technology solutions), BellSouth Corporation (telecommunications), Chemical Financial Corporation, Maersk Inc. (industrial conglomerate, 2002-present), and Metalmark Capital (private equity investment firm, 2005-present). He also serves as a member of the Board of Trustees of the American Enterprise Institute for Public Policy Research. In addition, Mr. Stavropoulos is a member of The Business Council, J.P. Morgan International Council and the University of Notre Dame Advisory Council for the College of Science. |
Kenneth L. Wolfe (67) |
| Year of Election or Appointment: 2005 Prior to his retirement in 2001, Mr. Wolfe was Chairman and Chief Executive Officer of Hershey Foods Corporation (1993-2001). He currently serves as a member of the boards of Adelphia Communications Corporation (2003-present), Bausch & Lomb, Inc., and Revlon Inc. (2004-present). |
Annual Report
Advisory Board Members and Executive Officers:
Correspondence intended for Mr. Keyes may be sent to Fidelity Investments, P.O. Box 55235, Boston, Massachusetts 02205-5235. Correspondence intended for each executive officer and Mr. Lynch may be sent to Fidelity Investments, 82 Devonshire Street, Boston, Massachusetts 02109.
Name, Age; Principal Occupation |
James H. Keyes (66) |
| Year of Election or Appointment: 2006 Member of the Advisory Board of Fidelity Investment Trust. Prior to his retirement in 2003, Mr. Keyes was Chairman, President, and Chief Executive Officer of Johnson Controls, Inc. (automotive supplier, 1993-2003). He currently serves as a member of the boards of LSI Logic Corporation (semiconductor technologies), Navistar International Corporation (manufacture and sale of trucks, buses, and diesel engines, 2002-present), and Pitney Bowes, Inc. (integrated mail, messaging, and document management solutions). |
Peter S. Lynch (62) |
| Year of Election or Appointment: 2003 Member of the Advisory Board of Fidelity Investment Trust. Mr. Lynch is Vice Chairman and a Director of FMR, and Vice Chairman (2001- present) and a Director of FMR Co., Inc. Previously, Mr. Lynch served as a Trustee of the Fidelity funds (1990-2003). In addition, he serves as a Trustee of Boston College and as the Chairman of the Inner-City Scholarship Fund. |
Dwight D. Churchill (52) |
| Year of Election or Appointment: 2005 Vice President of the fund. Mr. Churchill also serves as Vice President of certain Equity Funds (2005-present). Mr. Churchill is Executive Vice President of FMR (2005-present) and FMR Co., Inc. (2005-present). Previously, Mr. Churchill served as Senior Vice President of Fidelity Investments Money Management, Inc. (2005-2006), Head of Fidelity's Fixed-Income Division (2000-2005), Vice President of Fidelity's Money Market Funds (2000-2005), Vice President of Fidelity's Bond Funds, and Senior Vice President of FMR. |
Eric M. Wetlaufer (44) |
| Year of Election or Appointment: 2006 Vice President of the fund. Mr. Wetlaufer also serves as Vice President of certain International Equity Funds (2006-present). Mr. Wetlaufer is Senior Vice President of FMR (2006-present) and FMR Co., Inc. (2006-present), and President and Director of Fidelity Management & Research (U.K.) Inc. (2006-present) and Fidelity Research & Analysis Company (2006-present). Before joining Fidelity Investments in 2005, Mr. Wetlaufer was a partner in Oxhead Capital Management (2004-2005). Previously, Mr. Wetlaufer served as a Chief Investment Officer of Putnam Investments (1997-2003). |
William Kennedy (38) |
| Year of Election or Appointment: 2004 Vice President of the fund. Mr. Kennedy also serves as Vice President of other funds advised by FMR. Prior to assuming his current responsibilities, Mr. Kennedy worked as a research analyst and a portfolio manager. Mr. Kennedy also serves as a Vice President of FMR (2000) and FMR Co., Inc. (2001). |
Eric D. Roiter (57) |
| Year of Election or Appointment: 1998 Secretary of the fund. He also serves as Secretary of other Fidelity funds; Vice President, General Counsel, and Secretary of FMR Co., Inc. (2001-present) and FMR; Assistant Secretary of Fidelity Management & Research (U.K.) Inc. (2001-present), Fidelity Research & Analysis Company (2001-present), and Fidelity Investments Money Management, Inc. (2001-present). Mr. Roiter is an Adjunct Member, Faculty of Law, at Boston College Law School (2003-present). Previously, Mr. Roiter served as Vice President and Secretary of Fidelity Distributors Corporation (FDC) (1998-2005). |
Stuart Fross (47) |
| Year of Election or Appointment: 2003 Assistant Secretary of the fund. Mr. Fross also serves as Assistant Secretary of other Fidelity funds (2003-present), Vice President and Secretary of FDC (2005-present), and is an employee of FMR. |
Christine Reynolds (48) |
| Year of Election or Appointment: 2004 President and Treasurer of the fund. Ms. Reynolds also serves as President and Treasurer of other Fidelity funds (2004-present) and is a Vice President (2003-present) and an employee (2002-present) of FMR. Before joining Fidelity Investments, Ms. Reynolds worked at PricewaterhouseCoopers LLP (PwC) (1980-2002), where she was most recently an audit partner with PwC's investment management practice. |
R. Stephen Ganis (40) |
| Year of Election or Appointment: 2006 Anti-Money Laundering (AML) officer of the fund. Mr. Ganis also serves as AML officer of other Fidelity funds (2006-present) and FMR Corp. (2003-present). Before joining Fidelity Investments, Mr. Ganis practiced law at Goodwin Procter, LLP (2000-2002). |
Joseph B. Hollis (58) |
| Year of Election or Appointment: 2006 Chief Financial Officer of the fund. Mr. Hollis also serves as Chief Financial Officer of other Fidelity funds. Mr. Hollis is President of Fidelity Pricing and Cash Management Services (FPCMS) (2005-present). Mr. Hollis also serves as President and Director of Fidelity Service Company, Inc. (2006-present). Previously, Mr. Hollis served as Senior Vice President of Cash Management Services (1999-2002) and Investment Management Operations (2002-2005). |
Kenneth A. Rathgeber (59) |
| Year of Election or Appointment: 2004 Chief Compliance Officer of the fund. Mr. Rathgeber also serves as Chief Compliance Officer of other Fidelity funds (2004-present) and Executive Vice President of Risk Oversight for Fidelity Investments (2002-present). He is Chief Compliance Officer of FMR (2005-present), FMR Co., Inc. (2005-present), Fidelity Management & Research (U.K.) Inc. (2005-present), Fidelity Research & Analysis Company (2005- present), Fidelity Investments Money Management, Inc. (2005-present), and Strategic Advisers, Inc. (2005-present). Previously, Mr. Rathgeber served as Executive Vice President and Chief Operating Officer for Fidelity Investments Institutional Services Company, Inc. (1998-2002). |
Bryan A. Mehrmann (45) |
| Year of Election or Appointment: 2005 Deputy Treasurer of the fund. Mr. Mehrmann also serves as Deputy Treasurer of other Fidelity funds (2005-present) and is an employee of FMR. Previously, Mr. Mehrmann served as Vice President of Fidelity Investments Institutional Services Group (FIIS)/Fidelity Investments Institutional Operations Corporation, Inc. (FIIOC) Client Services (1998-2004). |
Kimberley H. Monasterio (42) |
| Year of Election or Appointment: 2004 Deputy Treasurer of the fund. Ms. Monasterio also serves as Deputy Treasurer of other Fidelity funds (2004) and is an employee of FMR (2004). Before joining Fidelity Investments, Ms. Monasterio served as Treasurer (2000-2004) and Chief Financial Officer (2002-2004) of the Franklin Templeton Funds and Senior Vice President of Franklin Templeton Services, LLC (2000-2004). |
Kenneth B. Robins (37) |
| Year of Election or Appointment: 2005 Deputy Treasurer of the fund. Mr. Robins also serves as Deputy Treasurer of other Fidelity funds (2005-present) and is an employee of FMR (2004-present). Before joining Fidelity Investments, Mr. Robins worked at KPMG LLP, where he was a partner in KPMG's department of professional practice (2002-2004) and a Senior Manager (1999-2000). In addition, Mr. Robins served as Assistant Chief Accountant, United States Securities and Exchange Commission (2000-2002). |
Robert G. Byrnes (39) |
| Year of Election or Appointment: 2005 Assistant Treasurer of the fund. Mr. Byrnes also serves as Assistant Treasurer of other Fidelity funds (2005-present) and is an employee of FMR (2005-present). Previously, Mr. Byrnes served as Vice President of FPCMS (2003-2005). Before joining Fidelity Investments, Mr. Byrnes worked at Deutsche Asset Management where he served as Vice President of the Investment Operations Group (2000-2003). |
John H. Costello (60) |
| Year of Election or Appointment: 1986 Assistant Treasurer of the fund. Mr. Costello also serves as Assistant Treasurer of other Fidelity funds and is an employee of FMR. |
Peter L. Lydecker (52) |
| Year of Election or Appointment: 2004 Assistant Treasurer of the fund. Mr. Lydecker also serves as Assistant Treasurer of other Fidelity funds (2004) and is an employee of FMR. |
Mark Osterheld (51) |
| Year of Election or Appointment: 2002 Assistant Treasurer of the fund. Mr. Osterheld also serves as Assistant Treasurer of other Fidelity funds (2002) and is an employee of FMR. |
Gary W. Ryan (48) |
| Year of Election or Appointment: 2005 Assistant Treasurer of the fund. Mr. Ryan also serves as Assistant Treasurer of other Fidelity funds (2005-present) and is an employee of FMR (2005-present). Previously, Mr. Ryan served as Vice President of Fund Reporting in FPCMS (1999-2005). |
Salvatore Schiavone (40) |
| Year of Election or Appointment: 2005 Assistant Treasurer of the fund. Mr. Schiavone also serves as Assistant Treasurer of other Fidelity funds (2005-present) and is an employee of FMR (2005-present). Before joining Fidelity Investments, Mr. Schiavone worked at Deutsche Asset Management, where he most recently served as Assistant Treasurer (2003-2005) of the Scudder Funds and Vice President and Head of Fund Reporting (1996-2003). |
Annual Report
Distributions
The Board of Trustees of Advisor International Discovery Fund voted to pay to shareholders of record at the opening of business on record date, the following distributions per share derived from capital gains realized from sales of portfolio securities, and dividends derived from net investment income:
| Pay Date | Record Date | Dividends | Capital Gains |
Class A | 12/04/06 | 12/01/06 | $.346 | $.98 |
Class T | 12/04/06 | 12/01/06 | $.260 | $.98 |
Class B | 12/04/06 | 12/01/06 | $.161 | $.98 |
Class C | 12/04/06 | 12/01/06 | $.141 | $.98 |
The fund hereby designates as a capital gain dividend with respect to the taxable year ended October 31, 2006, $165,476,023, or, if subsequently determined to be different, the net capital gain of such year.
Class A designates 44%; Class T designates 48%; Class B designates 58%; and Class C designates 58%; of the dividends distributed during the fiscal year as amounts which may be taken into account as a dividend for purposes of the maximum rate under section 1(h)(11) of the Internal Revenue Code.
The amounts per share which represent income derived from sources within, and taxes paid to, foreign countries or possessions of the United States are as follows:
| Pay Date | Income | Taxes |
Class A | 12/05/05 | $.328 | $.03 |
Class T | 12/05/05 | $.301 | $.03 |
Class B | 12/05/05 | $.250 | $.03 |
Class C | 12/05/05 | $.253 | $.03 |
The fund will notify shareholders in January 2007 of amounts for use in preparing 2006 income tax returns.
Annual Report
Board Approval of Investment Advisory Contracts and Management Fees
Fidelity International Discovery Fund
Each year, typically in July, the Board of Trustees, including the Independent Trustees (together, the Board), votes on the renewal of the management contract and sub-advisory agreements (together, the Advisory Contracts) for the fund. The Board, assisted by the advice of fund counsel and Independent Trustees' counsel, requests and considers a broad range of information throughout the year.
The Board meets regularly each month except August and takes into account throughout the year matters bearing on Advisory Contracts. The Board, acting directly and through its separate committees, considers at each of its meetings factors that are relevant to the annual renewal of the fund's Advisory Contracts, including the services and support provided to the fund and its shareholders. At the time of the renewal, the Board had 12 standing committees, each composed of Independent Trustees with varying backgrounds, to which the Board has assigned specific subject matter responsibilities in order to enhance effective decision-making by the Board. Each committee has adopted a written charter outlining the structure and purposes of the committee. One such committee, the Equity Contract Committee, meets periodically as needed throughout the year to consider matters specifically related to the annual renewal of Advisory Contracts. The committee requests and receives information on, and makes recommendations to the Independent Trustees concerning, the approval and annual review of the Advisory Contracts.
At its July 2006 meeting, the Board of Trustees, including the Independent Trustees, unanimously determined to renew the Advisory Contracts for the fund. In reaching its determination, the Board considered all factors it believed relevant, including (i) the nature, extent, and quality of the services to be provided to the fund and its shareholders (including the investment performance of the fund); (ii) the competitiveness of the management fee and total expenses of the fund; (iii) the total costs of the services to be provided by and the profits to be realized by the investment adviser and its affiliates from the relationship with the fund; (iv) the extent to which economies of scale would be realized as the fund grows; and (v) whether fee levels reflect these economies of scale, if any, for the benefit of fund shareholders.
In determining whether to renew the Advisory Contracts for the fund, the Board ultimately reached a determination, with the assistance of fund counsel and Independent Trustees' counsel, that the renewal of the Advisory Contracts and the compensation to be received by Fidelity under the management contract is consistent with Fidelity's fiduciary duty under applicable law. In addition to evaluating the specific factors noted above, the Board, in reaching its determination, is aware that shareholders in the fund have a broad range of investment choices available to them, including a wide choice among mutual funds offered by competitors to Fidelity, and that the fund's shareholders, with the opportunity to review and weigh the disclosure provided by the fund in its prospectus and other public disclosures, have chosen to invest in this fund, managed by Fidelity.
Annual Report
Board Approval of Investment Advisory Contracts and
Management Fees - continued
Nature, Extent, and Quality of Services Provided. The Board considered staffing within the investment adviser, FMR, and the sub-advisers (together, the Investment Advisers), including the background of the fund's portfolio manager and the fund's investment objective and discipline. The Independent Trustees also had discussions with senior management of Fidelity's investment operations and investment groups. The Board considered the structure of the portfolio manager compensation program and whether this structure provides appropriate incentives.
Resources Dedicated to Investment Management and Support Services. The Board reviewed the size, education, and experience of the Investment Advisers' investment staff, their use of technology, and the Investment Advisers' approach to recruiting, training, and retaining portfolio managers and other research, advisory, and management personnel. The Board considered Fidelity's extensive global research capabilities that enable the Investment Advisers to aggregate data from various sources in an effort to produce positive investment results. The Board noted that Fidelity's analysts have access to a variety of technological tools that enable them to perform both fundamental and quantitative analysis and to specialize in various disciplines. The Board also considered that Fidelity's portfolio managers and analysts have access to daily portfolio attribution that allows for monitoring of a fund's portfolio, as well as an electronic communication system that provides immediate real-time access to research concerning issuers and credit enhancers.
Shareholder and Administrative Services. The Board considered (i) the nature, extent, quality, and cost of administrative, distribution, and shareholder services performed by the Investment Advisers and their affiliates under the Advisory Contracts and under separate agreements covering transfer agency, pricing and bookkeeping, and securities lending services for the fund; (ii) the nature and extent of the Investment Advisers' supervision of third party service providers, principally custodians and subcustodians; and (iii) the resources devoted to, and the record of compliance with, the fund's compliance policies and procedures. The Board reviewed the allocation of fund brokerage, including allocations to brokers affiliated with the Investment Advisers, the use of brokerage commissions to pay fund expenses, and the use of "soft" commission dollars to pay for research services. The Board also considered that Fidelity voluntarily pays for market data out of its own resources.
The Board noted that the growth of fund assets across the complex allows Fidelity to reinvest in the development of services designed to enhance the value or convenience of the Fidelity funds as investment vehicles. These services include 24-hour access to account information and market information through phone representatives and over the Internet, and investor education materials and asset allocation tools.
Annual Report
Investment in a Large Fund Family. The Board considered the benefits to shareholders of investing in a Fidelity fund, including the benefits of investing in a fund that is part of a large family of funds offering a variety of investment disciplines and providing for a large variety of mutual fund investor services. For example, fund shareholders are offered the privilege of exchanging shares of the fund for shares of other Fidelity funds, as set forth in the fund's prospectus, without paying an additional sales charge. The Board noted that, since the last Advisory Contract renewals in July 2005, Fidelity has taken a number of actions that benefited particular funds, including (i) dedicating additional resources to investment research and to restructure the investment research teams; (ii) voluntarily entering into contractual arrangements with certain brokers pursuant to which Fidelity pays for research products and services separately out of its own resources, rather than bundling with fund commissions; (iii) launching the Fidelity Advantage Class of its five Spartan stock index funds and three Spartan bond index funds, which is a lower-fee class available to shareholders with higher account balances; (iv) contractually agreeing to impose expense limitations on Fidelity U.S. Bond Index Fund and reducing the fund's initial investment minimum; and (v) offering shareholders of each of the Fidelity Institutional Money Market Funds the privilege of exchanging shares of the fund for shares of other Fidelity funds.
Investment Performance and Compliance. The Board considered whether the fund has operated within its investment objective, as well as its record of compliance with its investment restrictions. It also reviewed the fund's absolute investment performance for Fidelity International Discovery (retail class), as well as the fund's relative investment performance for Fidelity International Discovery (retail class) measured against (i) a broad-based securities market index, and (ii) a peer group of mutual funds deemed appropriate by the Board over multiple periods. The following charts considered by the Board show, over the one-, three-, and five-year periods ended December 31, 2005, the cumulative total returns of Fidelity International Discovery (retail class), the cumulative total returns of a broad-based securities market index ("benchmark"), and a range of cumulative total returns of a peer group of mutual funds identified by Lipper Inc. as having an investment objective similar to that of the fund. (The Advisor classes of the fund had less than one year of performance as of December 31, 2005.) The box within each chart shows the 25th percentile return (bottom of box) and the 75th percentile return (top of box) of the Lipper peer group. Returns shown above the box are in the first quartile and returns shown below the box are in the fourth quartile. The percentage beaten numbers noted below each chart correspond to the percentile box and represent the percentage of funds in the Lipper peer group whose performance was equal to or lower than that of Fidelity International Discovery (retail class).
Annual Report
Board Approval of Investment Advisory Contracts and
Management Fees - continued
Fidelity International Discovery Fund
The Board reviewed the fund's relative investment performance against its Lipper peer group and stated that the performance of Fidelity International Discovery (retail class) was in the first quartile for all the periods shown. The Board also stated that the relative investment performance of Fidelity International Discovery (retail class) compared favorably to its benchmark for all the periods shown. The Board also reviewed the fund's relative investment performance against a peer group defined by Morningstar.
The Board also considered that the fund's management fee is subject to upward or downward adjustment depending upon whether, and to what extent, the fund's investment performance for the performance period exceeds, or is exceeded by, the record (over the same period) of a Board-approved performance adjustment index. The Board realizes that the performance adjustment provides FMR with a strong economic incentive to seek to achieve superior performance for the fund's shareholders and helps to more closely align the interests of FMR and the fund's shareholders.
The Board considered that FMR has taken steps to refocus and strengthen equity research, equity portfolio management, and compliance. The Board noted with favor FMR's reorganization of its senior management team in 2005 and FMR's dedication of additional resources to investment research, and participated in the process that led to those changes.
Based on its review, and giving particular weight to the nature and quality of the resources dedicated by the Investment Advisers to maintain and improve relative performance, the Board concluded that the nature, extent, and quality of the services provided to the fund will benefit the fund's shareholders, particularly in light of the Board's view that the fund's shareholders benefit from investing in a fund that is part of a large family of funds offering a variety of investment disciplines and services.
Annual Report
Competitiveness of Management Fee and Total Fund Expenses. The Board considered the fund's management fee and total expenses compared to "mapped groups" of competitive funds and classes. Fidelity creates "mapped groups" by combining similar Lipper investment objective categories that have comparable management fee characteristics. Combining Lipper investment objective categories aids the Board's management fee and total expense comparisons by broadening the competitive group used for comparison and by reducing the number of universes to which various Fidelity funds are compared.
The Board considered two proprietary management fee comparisons for the 12-month periods shown in the chart below. The group of Lipper funds used by the Board for management fee comparisons is referred to below as the "Total Mapped Group" and, for the reasons explained above, is broader than the Lipper peer group used by the Board for performance comparisons. The Total Mapped Group comparison focuses on a fund's standing relative to the total universe of comparable funds available to investors, in terms of gross management fees before expense reimbursements or caps, and without giving effect to the fund's performance adjustment. "TMG %" represents the percentage of funds in the Total Mapped Group that had management fees that were lower than the fund's. For example, a TMG % of 13% means that 87% of the funds in the Total Mapped Group had higher management fees than the fund. The "Asset-Size Peer Group" (ASPG) comparison focuses on a fund's standing relative to non-Fidelity funds similar in size to the fund within the Total Mapped Group. The ASPG represents at least 15% of the funds in the Total Mapped Group with comparable asset size and management fee characteristics, subject to a minimum of 50 funds (or all funds in the Total Mapped Group if fewer than 50). Additional information, such as the ASPG quartile in which the fund's management fee ranked and the impact of the fund's performance adjustment, is also included in the chart and considered by the Board.
Annual Report
Board Approval of Investment Advisory Contracts and
Management Fees - continued
Fidelity International Discovery Fund

The Board noted that the fund's management fee ranked below the median of its Total Mapped Group and below the median of its ASPG for 2005. The Board also noted the effect of the fund's positive performance adjustment on the fund's management fee ranking. The Board noted that the performance adjustment for 2005 represents calculations for rolling 36-month periods that differ from the periods shown in the performance charts above.
Based on its review, the Board concluded that the fund's management fee was fair and reasonable in light of the services that the fund receives and the other factors considered.
In its review of each class's total expenses, the Board considered the fund's management fee as well as other fund or class expenses, as applicable, such as transfer agent fees, pricing and bookkeeping fees, fund-paid 12b-1 fees, and custodial, legal, and audit fees. The Board also noted the effects of any waivers and reimbursements on fees and expenses, as well as the fund's positive performance adjustment. As part of its review, the Board also considered current and historical total expenses of each class of the fund compared to competitive fund median expenses. Each class of the fund is compared to those funds and classes in the Total Mapped Group (used by the Board for management fee comparisons) that have a similar sales load structure.
The Board noted that the total expenses of each of Class A, Class B, Class C, Institutional Class and Fidelity International Discovery (retail class) ranked below its competitive median for 2005, and the total expenses of Class T ranked above its competitive median for 2005. The Board noted that the fund offers multiple classes, each of which has a different sales load and 12b-1 fee structure, and that the multiple structures are intended to offer a range of pricing options for the intermediary market. The Board also noted that the total expenses of the classes vary primarily by the level of their 12b-1 fees, although differences in transfer agent fees may also cause expenses to vary from class to class.
Annual Report
In its review of total expenses, the Board also considered Fidelity fee structures and other information on clients that FMR and its affiliates service in other competitive markets, such as other mutual funds advised or subadvised by FMR or its affiliates, pension plan clients, and other institutional clients.
Based on its review, the Board concluded that the total expenses of each class of the fund were reasonable, although in one case above the median of the universe presented for comparison, in light of the services that the fund and its shareholders receive and the other factors considered.
Costs of the Services and Profitability. The Board considered the revenues earned and the expenses incurred by Fidelity in conducting the business of developing, marketing, distributing, managing, administering and servicing the fund and its shareholders. The Board also considered the level of Fidelity's profits in respect of all the Fidelity funds.
On an annual basis, FMR presents to the Board Fidelity's profitability for the fund. Fidelity calculates the profitability for each fund, as well as aggregate profitability for groups of Fidelity funds and all Fidelity funds, using a series of detailed revenue and cost allocation methodologies which originate with the audited books and records of Fidelity. The Audit Committee of the Board reviews any significant changes from the prior year's methodologies.
PricewaterhouseCoopers LLP (PwC), independent registered accounting firm and auditor to Fidelity and certain Fidelity funds, has been engaged annually by the Board as part of the Board's assessment of the results of Fidelity's profitability analysis. PwC's engagement includes the review and assessment of Fidelity's methodologies used in determining the revenues and expenses attributable to Fidelity's mutual fund business, and completion of agreed-upon procedures surrounding the mathematical accuracy of fund profitability and its conformity to allocation methodologies. After considering PwC's reports issued under the engagement and information provided by Fidelity, the Board believes that while other allocation methods may also be reasonable, Fidelity's profitability methodologies are reasonable in all material respects.
The Board has also reviewed Fidelity's non-fund businesses and any fall-out benefits related to the mutual fund business as well as cases where Fidelity's affiliates may benefit from or be related to the fund's business.
The Board considered the costs of the services provided by and the profits realized by Fidelity in connection with the operation of the fund and determined that the amount of profit is a fair entrepreneurial profit for the management of the fund.
Annual Report
Board Approval of Investment Advisory Contracts and
Management Fees - continued
Economies of Scale. The Board considered whether there have been economies of scale in respect of the management of the Fidelity funds, whether the Fidelity funds (including the fund) have appropriately benefited from any such economies of scale, and whether there is potential for realization of any further economies of scale. The Board considered the extent to which the fund will benefit from economies of scale through increased services to the fund, through waivers or reimbursements, or through fee or expense reductions, including reductions that occur through operation of the transfer agent agreement. The transfer agent fee varies in part based on the number of accounts in the fund. If the number of accounts decreases or the average account size increases, the overall transfer agent fee rate decreases.
The Board recognized that the fund's management contract incorporates a "group fee" structure, which provides for lower fee rates as total fund assets under FMR's management increase, and for higher fee rates as total fund assets under FMR's management decrease. The Board considered that the group fee is designed to deliver the benefits of economies of scale to fund shareholders when total fund assets increase, even if assets of any particular fund are unchanged or have declined, because some portion of Fidelity's costs are attributable to services provided to all Fidelity funds, and all funds benefit if those costs can be allocated among more assets. The Board concluded that, given the group fee structure, fund shareholders will achieve a certain level of economies of scale as assets under FMR's management increase at the fund complex level, regardless of whether Fidelity achieves any such economies of scale.
The Board further concluded that any potential economies of scale are being shared between fund shareholders and Fidelity in an appropriate manner.
Additional Information Requested by the Board. In order to develop fully the factual basis for consideration of the Advisory Contracts, the Board requested additional information on several topics, including (i) Fidelity's fund profitability methodology and profitability trends within certain funds; (ii) portfolio manager compensation; (iii) the extent to which any economies of scale exist and are shared between the funds and Fidelity; (iv) the total expenses of certain funds and classes relative to competitors, including the extent to which the expenses of certain funds have been or could be capped; (v) fund performance trends; and (vi) Fidelity's fee structures, including use of performance fees.
Based on its evaluation of all of the conclusions noted above, and after considering all material factors, the Board ultimately concluded that the advisory fee structures are fair and reasonable, and that the fund's Advisory Contracts should be renewed.
Annual Report
Annual Report
Annual Report
Annual Report
Annual Report
Investment Adviser
Fidelity Management & Research Company
Boston, MA
Investment Sub-Advisers
FMR Co., Inc.
Fidelity Management & Research
(U.K.) Inc.
Fidelity Research & Analysis Company (formerly Fidelity Management & Research (Far East) Inc.)
Fidelity International
Investment Advisors
Fidelity Investments Japan Limited
Fidelity International Investment Advisors (U.K.) Limited
General Distributor
Fidelity Distributors Corporation
Boston, MA
Transfer and Service Agents
Fidelity Investments Institutional Operations Company, Inc.
Boston, MA
Fidelity Service Company, Inc.
Boston, MA
Custodian
JPMorgan Chase Bank
New York, NY
(Fidelity Investment logo)(registered trademark)
Corporate Headquarters
82 Devonshire St., Boston, MA 02109
www.fidelity.com
AID-UANN-1206
1.806656.101
(Fidelity Investment logo)(registered trademark)
Fidelity Advisor
International Discovery
Fund - Institutional Class
Annual Report
October 31, 2006
(2_fidelity_logos) (Registered_Trademark)
Institutional Class is
a class of Fidelity®
International Discovery Fund
Contents
Chairman's Message | 4 | Ned Johnson's message to shareholders. |
Performance | 5 | How the fund has done over time. |
Management's Discussion | 6 | The manager's review of fund performance, strategy and outlook. |
Shareholder Expense Example | 7 | An example of shareholder expenses. |
Investment Changes | 9 | A summary of major shifts in the fund's investments over the past six months. |
Investments | 11 | A complete list of the fund's investments with their market values. |
Financial Statements | 23 | Statements of assets and liabilities, operations, and changes in net assets,
as well as financial highlights. |
Notes | 33 | Notes to the financial statements. |
Report of Independent Registered Public Accounting Firm | 44 | |
Trustees and Officers | 45 | |
Distributions | 56 | |
Board Approval of Investment Advisory Contracts and Management Fees | 57 | |
To view a fund's proxy voting guidelines and proxy voting record for the 12-month period ended June 30, visit www.fidelity.com/proxyvotingresults or visit the Securities and Exchange Commission's (SEC) web site at www.sec.gov. You may also call 1-877-208-0098 to request a free copy of the proxy voting guidelines.
Standard & Poor's, S&P and S&P 500 are registered service marks of The McGraw-Hill Companies, Inc. and have been licensed for use by Fidelity Distributors Corporation.
Other third party marks appearing herein are the property of their respective owners.
All other marks appearing herein are registered or unregistered trademarks or service marks of FMR Corp. or an affiliated company.
Annual Report
This report and the financial statements contained herein are submitted for the general information of the shareholders of the fund. This report is not authorized for distribution to prospective investors in the fund unless preceded or accompanied by an effective prospectus.
A fund files its complete schedule of portfolio holdings with the SEC for the first and third quarters of each fiscal year on Form N-Q. Forms N-Q are available on the SEC's web site at http://www.sec.gov. A fund's Forms N-Q may be reviewed and copied at the SEC's Public Reference Room in Washington, DC. Information regarding the operation of the SEC's Public Reference Room may be obtained by calling 1-800-SEC-0330. For a complete list of a fund's portfolio holdings, view the fund's most recent quarterly holdings report, semiannual report, or annual report on Fidelity's web site at http://www.advisor.fidelity.com.
NOT FDIC INSURED · MAY LOSE VALUE · NO BANK GUARANTEE
Neither the fund nor Fidelity Distributors Corporation is a bank.
Annual Report
Chairman's Message
(photo_of_Edward_C_Johnson_3d)
Dear Shareholder:
Stock and bond markets around the world have seen largely positive results year to date, although weakness in the technology sector and growth stocks in general have tempered performance. While financial markets are always unpredictable, there are a number of time-tested principles that can put the historical odds in your favor.
One of the basic tenets is to invest for the long term. Over time, riding out the markets' inevitable ups and downs has proven much more effective than selling into panic or chasing the hottest trend. Even missing only a few of the markets' best days can significantly diminish investor returns. Patience also affords the benefits of compounding - of earning interest on additional income or reinvested dividends and capital gains. There are tax advantages and cost benefits to consider as well. The more you sell, the more taxes you pay, and the more you trade, the higher the costs. While staying the course doesn't eliminate risk, it can considerably lessen the effect of short-term declines.
You can further manage your investing risk through diversification. And today, more than ever, geographic diversification should be taken into account. Studies indicate that asset allocation is the single most important determinant of a portfolio's long-term success. The right mix of stocks, bonds and cash - aligned to your particular risk tolerance and investment objective - is very important. Age-appropriate rebalancing is also an essential aspect of asset allocation. For younger investors, an emphasis on equities - which historically have been the best performing asset class over time - is encouraged. As investors near their specific goal, such as retirement or sending a child to college, consideration may be given to replacing volatile assets (e.g. common stocks) with more-stable fixed investments (bonds or savings plans).
A third investment principle - investing regularly - can help lower the average cost of your purchases. Investing a certain amount of money each month or quarter helps ensure you won't pay for all your shares at market highs. This strategy - known as dollar cost averaging - also reduces unconstructive "emotion" from investing, helping shareholders avoid selling weak performers just prior to an upswing, or chasing a hot performer just before a correction.
We invite you to contact us via the Internet, through our Investor Centers or over the phone. It is our privilege to provide you the information you need to make the investments that are right for you.
Sincerely,
/s/Edward C. Johnson 3d
Edward C. Johnson 3d
Annual Report
Fidelity Advisor International Discovery Fund - Institutional Class
Performance: The Bottom Line
Average annual total return reflects the change in the value of an investment, assuming reinvestment of the class' dividend income and capital gains (the profits earned upon the sale of securities that have grown in value) and assuming a constant rate of performance each year. The $10,000 table and the fund's returns do not reflect the deduction of taxes that a shareholder would pay on fund distributions or the redemption of fund shares. During periods of reimbursement by Fidelity, a fund's total return will be greater than it would be had the reimbursement not occurred. How a fund did yesterday is no guarantee of how it will do tomorrow.
Average Annual Total Returns
Periods ended October 31, 2006 | Past 1
year | Past 5
years | Past 10 years |
Institutional Class A, B | 26.45% | 17.65% | 11.16% |
A The initial offering of Institutional Class shares took place on January 6, 2005. Returns prior to January 6, 2005 are those of International Discovery, the original class of the fund.
B Prior to October 1, 2004, the fund operated under certain different investment policies.
Accordingly, the fund's historical performance may not represent its current investment policies.
$10,000 Over 10 Years
Let's say hypothetically that $10,000 was invested in Fidelity Advisor International Discovery Fund - Institutional Class on October 31, 1996. The chart shows how the value of your investment would have changed, and also shows how the Morgan Stanley Capital InternationalSM Europe, Australasia, Far East (MSCI® EAFE®) Index performed over the same period. The initial offering of Institutional Class took place on January 6, 2005. See above for additional information regarding the performance of Institutional Class.

Annual Report
Management's Discussion of Fund Performance
Comments from William Kennedy, Portfolio Manager of Fidelity Advisor International Discovery Fund
International equity markets as a whole outpaced their U.S. counterparts for the 12 months ending October 31, 2006 - partly as a result of favorable currency exchanges that boosted returns for U.S. investors. The Morgan Stanley Capital InternationalSM Europe, Australasia, Far East (MSCI® EAFE®) Index - a gauge of developed stock markets outside the United States and Canada - gained 27.72% during that time. European markets benefited from solid corporate profit growth and attractive dividends, which helped the MSCI Europe index advance 31.95%. Strong performing Latin American and Asian emerging markets drove the MSCI Emerging Markets index to a lofty 35.42% return. Japan was somewhat of an exception to the generally stellar foreign market performance after struggling in the middle part of the period. Still, its earlier gains helped the Tokyo Stock Exchange Stock Price Index (TOPIX) - a benchmark of the largest and better-established stocks traded on the Tokyo Stock Exchange - rise 12.47% overall. Natural-resources-rich Canada also struggled over the final six months as energy prices fell, but the S&P/TSX Composite Index managed a 12-month return of 28.21%.
For the 12 months ending October 31, 2006, the fund's Institutional Class shares returned 26.45%, modestly trailing the MSCI EAFE index. Strong stock picking, especially in the technology and consumer staples sectors, as well as favorable country selection aided returns versus the index. The benefit from country selection was partially offset by currency fluctuations, though. The fund's underweighting in materials and overweighting in the consumer discretionary sector hampered returns, as did weak stock picking in financials. On a regional basis, the fund benefited from investments in Japan and emerging markets, but lost ground in Europe. Top contributors to performance relative to the MSCI index included C&C Group, an Irish beverage company, and Sumco, a Japanese semiconductor wafer manufacturer. C&C rallied after reinventing a traditional pub cider drink as a premium product, while Sumco climbed as a wafer shortage drove up industry pricing. The fund had overweightings on average in both names. On the downside, an overweighted position in Sompo Japan Insurance hampered performance amid a slowdown in the Japanese equity market. Not owning Endesa, a Spanish utility stock in the index that benefited from a bidding war, also detracted from relative returns.
The views expressed in this statement reflect those of the portfolio manager only through the end of the period of the report as stated on the cover and do not necessarily represent the views of Fidelity or any other person in the Fidelity organization. Any such views are subject to change at any time based upon market or other conditions and Fidelity disclaims any responsibility to update such views. These views may not be relied on as investment advice and, because investment decisions for a Fidelity fund are based on numerous factors, may not be relied on as an indication of trading intent on behalf of any Fidelity fund.
Annual Report
Shareholder Expense Example
As a shareholder of the Fund, you incur two types of costs: (1) transaction costs, including sales charges (loads) on purchase payments or redemption proceeds, redemption fees, and (2) ongoing costs, including management fees, distribution and/or service (12b-1) fees and other Fund expenses. This Example is intended to help you understand your ongoing costs (in dollars) of investing in the Fund and to compare these costs with the ongoing costs of investing in other mutual funds.
The Example is based on an investment of $1,000 invested at the beginning of the period and held for the entire period (May 1, 2006 to October 31, 2006).
Actual Expenses
The first line of the accompanying table for each class of the Fund provides information about actual account values and actual expenses. You may use the information in this line, together with the amount you invested, to estimate the expenses that you paid over the period. Simply divide your account value by $1,000.00 (for example, an $8,600 account value divided by $1,000.00 = 8.6), then multiply the result by the number in the first line for a class of the Fund under the heading entitled "Expenses Paid During Period" to estimate the expenses you paid on your account during this period. A small balance maintenance fee of $12.00 that is charged once a year may apply for certain accounts with a value of less than $2,000. This fee is not included in the table below. If it was, the estimate of expenses you paid during the period would be higher, and your ending account value lower, by this amount.
Hypothetical Example for Comparison Purposes
The second line of the accompanying table for each class of the Fund provides information about hypothetical account values and hypothetical expenses based on a Class' actual expense ratio and an assumed rate of return of 5% per year before expenses, which is not the Class' actual return. The hypothetical account values and expenses may not be used to estimate the actual ending account balance or expenses you paid for the period. You may use this information to compare the ongoing costs of investing in the Fund and other funds. To do so, compare this 5% hypothetical example with the 5% hypothetical examples that appear in the shareholder reports of the other funds. A small balance maintenance fee of $12.00 that is charged once a year may apply for certain accounts with a value of less than $2,000. This fee is not included in the table below. If it was, the estimate of expenses you paid during the period would be higher, and your ending account value lower, by this amount.
Annual Report
tShareholder Expense Example - continued
Please note that the expenses shown in the table are meant to highlight your ongoing costs only and do not reflect any transaction costs. Therefore, the second line of the table is useful in comparing ongoing costs only, and will not help you determine the relative total costs of owning different funds. In addition, if these transactional costs were included, your costs would have been higher.
| Beginning
Account Value
May 1, 2006 | Ending
Account Value
October 31, 2006 | Expenses Paid
During Period*
May 1, 2006
to October 31, 2006 |
Class A | | | |
Actual | $ 1,000.00 | $ 1,009.10 | $ 6.38 |
HypotheticalA | $ 1,000.00 | $ 1,018.85 | $ 6.41 |
Class T | | | |
Actual | $ 1,000.00 | $ 1,006.70 | $ 8.65 |
HypotheticalA | $ 1,000.00 | $ 1,016.59 | $ 8.69 |
Class B | | | |
Actual | $ 1,000.00 | $ 1,004.20 | $ 11.37 |
HypotheticalA | $ 1,000.00 | $ 1,013.86 | $ 11.42 |
Class C | | | |
Actual | $ 1,000.00 | $ 1,004.40 | $ 11.06 |
HypotheticalA | $ 1,000.00 | $ 1,014.17 | $ 11.12 |
International Discovery | | | |
Actual | $ 1,000.00 | $ 1,009.90 | $ 5.37 |
HypotheticalA | $ 1,000.00 | $ 1,019.86 | $ 5.40 |
Institutional Class | | | |
Actual | $ 1,000.00 | $ 1,010.20 | $ 4.91 |
HypotheticalA | $ 1,000.00 | $ 1,020.32 | $ 4.94 |
A 5% return per year before expenses
* Expenses are equal to each Class' annualized expense ratio (shown in the table below); multiplied by the average account value over the period, multiplied by 184/365 (to reflect the one-half year period).
| Annualized
Expense Ratio |
Class A | 1.26% |
Class T | 1.71% |
Class B | 2.25% |
Class C | 2.19% |
International Discovery | 1.06% |
Institutional Class | .97% |
Annual Report
Investment Changes
Geographic Diversification (% of fund's net assets) |
As of October 31, 2006 |
| Japan 19.1% |
| United Kingdom 16.5% |
| France 12.3% |
| Germany 10.2% |
| Switzerland 9.5% |
| Australia 5.5% |
| Italy 3.6% |
| United States of America 3.3% |
| Spain 3.2% |
| Other 16.8% |

Percentages are adjusted for the effect of futures contracts, if applicable. |
|
As of April 30, 2006 |
| Japan 21.7% |
| United Kingdom 13.7% |
| France 11.1% |
| Germany 10.0% |
| Switzerland 8.5% |
| Australia 3.8% |
| United States of America 3.5% |
| Italy 3.2% |
| Korea (South) 2.6% |
| Other 21.9% |

Percentages are adjusted for the effect of futures contracts, if applicable. |
Asset Allocation |
| % of fund's
net assets | % of fund's net assets
6 months ago |
Stocks and Equity Futures | 97.1 | 97.3 |
Short-Term Investments and Net Other Assets | 2.9 | 2.7 |
Top Ten Stocks as of October 31, 2006 |
| % of fund's
net assets | % of fund's net assets
6 months ago |
Roche Holding AG (participation certificate) (Switzerland, Pharmaceuticals) | 1.5 | 1.3 |
UBS AG (NY Shares) (Switzerland, Capital Markets) | 1.4 | 1.1 |
Novartis AG (Reg.) (Switzerland, Pharmaceuticals) | 1.4 | 1.2 |
BP PLC sponsored ADR (United Kingdom, Oil, Gas & Consumable Fuels) | 1.3 | 1.4 |
Toyota Motor Corp. (Japan, Automobiles) | 1.3 | 1.3 |
Total SA Series B (France, Oil, Gas & Consumable Fuels) | 1.2 | 1.4 |
E.ON AG (Germany, Electric Utilities) | 1.1 | 1.1 |
Nestle SA (Reg.) (Switzerland, Food Products) | 1.1 | 0.8 |
Allianz AG (Reg.) (Germany, Insurance) | 1.1 | 1.0 |
Mizuho Financial Group, Inc. (Japan, Commercial Banks) | 1.1 | 0.8 |
| 12.5 | |
Market Sectors as of October 31, 2006 |
| % of fund's
net assets | % of fund's net assets
6 months ago |
Financials | 27.5 | 25.7 |
Consumer Discretionary | 15.8 | 15.5 |
Consumer Staples | 9.6 | 5.7 |
Industrials | 8.3 | 11.3 |
Health Care | 8.1 | 7.5 |
Information Technology | 7.4 | 9.3 |
Energy | 6.6 | 8.7 |
Utilities | 5.2 | 4.2 |
Materials | 4.5 | 5.9 |
Telecommunication Services | 2.7 | 2.1 |
Annual Report
Investments October 31, 2006
Showing Percentage of Net Assets
Common Stocks - 94.5% |
| Shares | | Value (Note 1) (000s) |
Australia - 5.5% |
AMP Ltd. | 2,219,300 | | $ 16,322 |
Australia & New Zealand Banking Group Ltd. | 871,800 | | 19,599 |
AXA Asia Pacific Holdings Ltd. | 3,932,100 | | 20,273 |
Babcock & Brown Japan Property Trust | 8,156,000 | | 12,218 |
BHP Billiton Ltd. | 2,255,700 | | 48,013 |
Billabong International Ltd. | 2,162,828 | | 26,254 |
Brambles Industries Ltd. | 2,096,000 | | 20,250 |
Cochlear Ltd. | 284,000 | | 12,240 |
Commonwealth Bank of Australia | 296,000 | | 10,930 |
Computershare Ltd. | 3,151,800 | | 18,788 |
CSL Ltd. | 1,304,950 | | 56,664 |
Downer EDI Ltd. | 48,361 | | 241 |
Fosters Group Ltd. | 4,060,500 | | 20,275 |
Macquarie Airports unit | 2,141,930 | | 5,323 |
Macquarie Bank Ltd. | 420,000 | | 24,239 |
Macquarie Communications Infrastructure Group unit | 1,632,940 | | 7,737 |
Macquarie Infrastructure Group unit | 1,750,121 | | 4,579 |
Mortgage Choice Ltd. | 2,899,300 | | 6,015 |
Multiplex Group unit | 6,100,300 | | 17,379 |
National Australia Bank Ltd. | 1,216,500 | | 35,814 |
QBE Insurance Group Ltd. | 1,230,667 | | 23,532 |
Seek Ltd. | 2,000,000 | | 8,237 |
Transurban Group unit | 989,403 | | 5,530 |
Woolworths Ltd. | 2,266,939 | | 36,310 |
TOTAL AUSTRALIA | | 456,762 |
Austria - 0.7% |
Austriamicrosystems AG (a) | 111,000 | | 7,057 |
Oesterreichische Elektrizitaetswirtschafts AG (Verbund) | 380,400 | | 18,990 |
OMV AG | 379,500 | | 20,630 |
Telekom Austria AG | 472,700 | | 11,765 |
TOTAL AUSTRIA | | 58,442 |
Belgium - 0.3% |
Almancora SCA (Certificaten Van Aandelen) | 185,500 | | 24,459 |
Bermuda - 0.1% |
Catlin Group Ltd. | 486,300 | | 4,645 |
Ports Design Ltd. | 4,460,500 | | 7,754 |
TOTAL BERMUDA | | 12,399 |
Common Stocks - continued |
| Shares | | Value (Note 1) (000s) |
Brazil - 0.1% |
Banco Nossa Caixa SA | 256,500 | | $ 6,106 |
CSU Cardsystem SA sponsored ADR (e) | 158,000 | | 2,745 |
TOTAL BRAZIL | | 8,851 |
Canada - 0.2% |
Potash Corp. of Saskatchewan, Inc. | 112,200 | | 14,014 |
Cayman Islands - 0.6% |
DSND, Inc. (a)(d) | 791,800 | | 14,354 |
Foxconn International Holdings Ltd. (a) | 9,433,300 | | 31,355 |
Xinao Gas Holdings Ltd. | 5,392,000 | | 5,429 |
TOTAL CAYMAN ISLANDS | | 51,138 |
China - 0.5% |
Bank of China Ltd. (H Shares) | 10,737,000 | | 4,625 |
China Life Insurance Co. Ltd. (H Shares) | 10,031,000 | | 21,127 |
China Merchants Bank Co. Ltd. (H Shares) (a) | 552,500 | | 862 |
China Shenhua Energy Co. Ltd. (H Shares) | 5,943,500 | | 10,455 |
Home Inns & Hotels Management, Inc. sponsored ADR | 9,100 | | 223 |
Industrial & Commercial Bank of China | 10,494,000 | | 4,696 |
TOTAL CHINA | | 41,988 |
Denmark - 0.2% |
Vestas Wind Systems AS (a) | 670,200 | | 18,879 |
Finland - 1.2% |
Citycon Oyj | 692,322 | | 3,667 |
Fortum Oyj | 1,557,000 | | 42,847 |
Nokia Corp. sponsored ADR | 2,683,300 | | 53,344 |
TOTAL FINLAND | | 99,858 |
France - 12.3% |
Alcatel SA (RFD) | 1,089,900 | | 13,842 |
Alstom SA (a) | 427,300 | | 39,433 |
April Group | 280,900 | | 12,011 |
AXA SA | 1,209,666 | | 46,112 |
BNP Paribas SA | 650,139 | | 71,490 |
Carrefour SA | 776,600 | | 47,322 |
CNP Assurances | 217,100 | | 22,847 |
Electricite de France | 318,800 | | 19,333 |
Gaz de France (d) | 802,800 | | 32,278 |
Groupe Danone | 228,600 | | 33,497 |
Icade SA | 549,889 | | 32,644 |
L'Oreal SA | 336,200 | | 32,699 |
Common Stocks - continued |
| Shares | | Value (Note 1) (000s) |
France - continued |
Louis Vuitton Moet Hennessy (LVMH) | 338,000 | | $ 35,226 |
Neopost SA | 356,900 | | 43,641 |
Nexity | 362,750 | | 25,003 |
Orpea (a)(d) | 279,164 | | 23,393 |
Pernod Ricard SA | 230,900 | | 46,242 |
Pinault Printemps-Redoute SA | 160,200 | | 23,904 |
Renault SA | 541,500 | | 63,346 |
Sanofi-Aventis sponsored ADR | 482,100 | | 20,581 |
Schneider Electric SA | 197,100 | | 20,478 |
Societe Generale Series A | 366,620 | | 60,928 |
SR Teleperformance SA (d) | 475,900 | | 17,197 |
Suez SA (France) | 573,600 | | 25,669 |
Total SA Series B | 1,509,776 | | 102,876 |
Veolia Environnement | 416,100 | | 25,477 |
Vinci SA | 320,800 | | 36,136 |
Vivendi Universal SA | 1,039,400 | | 39,363 |
TOTAL FRANCE | | 1,012,968 |
Germany - 9.5% |
Allianz AG (Reg.) | 485,330 | | 90,223 |
Bayer AG sponsored ADR | 1,005,300 | | 50,456 |
Bilfinger Berger AG | 260,300 | | 16,227 |
Continental AG | 266,500 | | 29,805 |
Deutsche Bank AG | 349,400 | | 44,147 |
Deutsche Boerse AG | 243,700 | | 39,299 |
Deutsche Postbank AG | 277,100 | | 20,613 |
E.ON AG | 789,000 | | 94,988 |
Fresenius Medical Care AG | 144,900 | | 19,335 |
GFK AG | 288,897 | | 12,644 |
Hugo Boss AG | 43,200 | | 2,051 |
Hypo Real Estate Holding AG | 179,368 | | 11,276 |
KarstadtQuelle AG (a)(d) | 1,023,200 | | 24,031 |
Linde AG | 379,228 | | 37,591 |
Merck KGaA | 231,200 | | 24,376 |
MPC Muenchmeyer Petersen Capital AG | 50,500 | | 4,435 |
MTU Aero Engines Holding AG | 337,500 | | 13,850 |
Muenchener Rueckversicherungs-Gesellschaft AG (Reg.) | 311,800 | | 50,615 |
Pfleiderer AG (d) | 1,097,696 | | 29,815 |
Puma AG | 44,800 | | 15,887 |
Q-Cells AG (d) | 286,000 | | 11,317 |
RWE AG | 660,019 | | 65,231 |
SAP AG | 145,800 | | 28,950 |
Common Stocks - continued |
| Shares | | Value (Note 1) (000s) |
Germany - continued |
SGL Carbon AG (a) | 632,300 | | $ 13,849 |
SolarWorld AG (d) | 142,400 | | 7,659 |
Wincor Nixdorf AG | 173,700 | | 24,155 |
TOTAL GERMANY | | 782,825 |
Greece - 0.3% |
EFG Eurobank Ergasias SA | 374,100 | | 12,444 |
Greek Organization of Football Prognostics SA | 359,130 | | 12,826 |
TOTAL GREECE | | 25,270 |
Hong Kong - 1.3% |
BOC Hong Kong Holdings Ltd. | 3,447,000 | | 7,712 |
Chaoda Modern Agriculture (Holdings) Ltd. | 12,600,000 | | 7,631 |
China Resources Power Holdings Co. Ltd. | 4,984,000 | | 6,216 |
CNOOC Ltd. | 31,338,500 | | 26,268 |
Esprit Holdings Ltd. | 5,874,500 | | 56,878 |
TOTAL HONG KONG | | 104,705 |
India - 0.4% |
Infosys Technologies Ltd. | 711,488 | | 33,191 |
Pantaloon Retail India Ltd. | 60,499 | | 2,929 |
TOTAL INDIA | | 36,120 |
Indonesia - 0.1% |
PT Perusahaan Gas Negara Tbk Series B | 5,903,500 | | 7,387 |
Ireland - 1.2% |
AgCert International (a) | 1,462,000 | | 4,155 |
Allied Irish Banks PLC | 910,000 | | 24,881 |
C&C Group PLC | 2,070,005 | | 34,401 |
Paddy Power PLC (Ireland) | 623,197 | | 11,653 |
Ryanair Holdings PLC sponsored ADR (a) | 297,100 | | 19,852 |
TOTAL IRELAND | | 94,942 |
Israel - 0.4% |
Bank Hapoalim BM (Reg.) | 2,497,200 | | 12,445 |
Ormat Industries Ltd. | 1,771,900 | | 18,382 |
TOTAL ISRAEL | | 30,827 |
Italy - 3.1% |
Autostrade Spa | 629,100 | | 18,605 |
Banca Credit Firenze (d) | 2,548,526 | | 8,523 |
Common Stocks - continued |
| Shares | | Value (Note 1) (000s) |
Italy - continued |
ENI Spa | 288,800 | | $ 8,767 |
ENI Spa sponsored ADR (d) | 401,950 | | 24,402 |
Fiat Spa (a) | 2,195,000 | | 38,770 |
Lottomatica Spa | 869,825 | | 31,753 |
Mediobanca Spa | 391,500 | | 9,099 |
Milano Assicurazioni Spa | 1,947,700 | | 15,195 |
Pirelli & C. Real Estate Spa | 235,100 | | 15,382 |
Unicredito Italiano Spa | 10,053,500 | | 83,359 |
TOTAL ITALY | | 253,855 |
Japan - 17.7% |
Aeon Co. Ltd. | 1,796,700 | | 42,321 |
Aeon Fantasy Co. Ltd. | 19,400 | | 690 |
Aeon Mall Co. Ltd. | 396,800 | | 20,932 |
Asics Corp. | 2,315,000 | | 31,016 |
Canon, Inc. | 1,241,750 | | 66,297 |
Credit Saison Co. Ltd. | 430,600 | | 15,573 |
Daiwa House Industry Co. Ltd. | 939,000 | | 16,940 |
Daiwa Securities Group, Inc. | 3,275,000 | | 37,157 |
DCM Japan Holdings Co. Ltd. (a)(d) | 770,660 | | 8,829 |
East Japan Railway Co. | 3,017 | | 21,100 |
Fanuc Ltd. | 288,900 | | 25,071 |
Fast Retailing Co. Ltd. | 188,900 | | 17,879 |
Honda Motor Co. Ltd. | 536,700 | | 18,962 |
Hoya Corp. | 800,000 | | 30,917 |
Idemitsu Kosan Co., Ltd. | 18,200 | | 1,771 |
Japan Tobacco, Inc. | 10,045 | | 43,801 |
JSR Corp. | 718,900 | | 18,071 |
JTEKT Corp. | 659,000 | | 13,720 |
Kansai Urban Banking Corp. | 1,288,000 | | 5,682 |
Keyence Corp. | 82,600 | | 18,291 |
Kose Corp. | 175,300 | | 5,276 |
Matsushita Electric Industrial Co. Ltd. | 1,271,000 | | 26,437 |
Mitsubishi Estate Co. Ltd. | 1,508,400 | | 36,111 |
Mitsubishi UFJ Financial Group, Inc. | 3,395 | | 43,286 |
Mitsui & Co. Ltd. | 2,155,000 | | 29,425 |
Mitsui Fudosan Co. Ltd. | 1,711,000 | | 42,131 |
Mizuho Financial Group, Inc. | 11,121 | | 86,621 |
Nidec Corp. | 131,900 | | 10,093 |
Nikko Cordial Corp. | 620,000 | | 7,427 |
Nintendo Co. Ltd. | 320,900 | | 65,629 |
Nippon Electric Glass Co. Ltd. | 570,000 | | 12,281 |
Common Stocks - continued |
| Shares | | Value (Note 1) (000s) |
Japan - continued |
Nippon Oil Corp. | 1,544,000 | | $ 11,485 |
Nishimatsuya Chain Co. Ltd. | 141,800 | | 2,770 |
Nissan Motor Co. Ltd. | 1,373,400 | | 16,451 |
Nitto Denko Corp. | 307,400 | | 17,530 |
Nomura Holdings, Inc. | 433,500 | | 7,638 |
NSK Ltd. | 1,893,000 | | 15,861 |
OMC Card, Inc. | 600,100 | | 5,962 |
Omron Corp. | 555,800 | | 14,351 |
ORIX Corp. | 234,540 | | 66,075 |
Shin-Etsu Chemical Co. Ltd. | 57,600 | | 3,777 |
Sompo Japan Insurance, Inc. | 2,002,000 | | 26,634 |
Sony Corp. sponsored ADR | 741,200 | | 30,374 |
St. Marc Holdings Co. Ltd. | 83,900 | | 5,610 |
Sugi Pharmacy Co. Ltd. (d) | 546,800 | | 9,911 |
Sumco Corp. (d) | 373,900 | | 26,598 |
Sumitomo Electric Industries Ltd. | 1,786,100 | | 25,289 |
Sumitomo Metal Industries Ltd. | 4,099,000 | | 15,420 |
Sumitomo Mitsui Financial Group, Inc. | 5,877 | | 64,317 |
Sumitomo Trust & Banking Co. Ltd. | 3,570,800 | | 38,407 |
T&D Holdings, Inc. | 472,350 | | 34,530 |
Takeda Pharamaceutical Co. Ltd. | 698,600 | | 44,857 |
The Sumitomo Warehouse Co. Ltd. (d) | 338,000 | | 2,387 |
Token Corp. | 78,400 | | 5,919 |
Tokuyama Corp. | 523,000 | | 6,582 |
Tokyo Tomin Bank Ltd. | 40,700 | | 1,656 |
Toyota Motor Corp. | 1,815,800 | | 107,132 |
Valor Co. Ltd. | 147,400 | | 2,168 |
Yamada Denki Co. Ltd. | 325,600 | | 32,404 |
TOTAL JAPAN | | 1,461,832 |
Korea (South) - 1.6% |
Kookmin Bank | 258,550 | | 20,552 |
Korean Reinsurance Co. | 946,600 | | 10,699 |
KT&G Corp. | 169,400 | | 10,463 |
LG Household & Health Care Ltd. | 445,680 | | 41,151 |
NHN Corp. | 246,216 | | 24,432 |
Shinhan Financial Group Co. Ltd. | 397,520 | | 18,331 |
Shinsegae Co. Ltd. | 7,900 | | 4,553 |
TOTAL KOREA (SOUTH) | | 130,181 |
Common Stocks - continued |
| Shares | | Value (Note 1) (000s) |
Luxembourg - 0.2% |
GAGFAH SA | 35,000 | | $ 1,016 |
SES Global SA FDR | 1,085,903 | | 16,633 |
TOTAL LUXEMBOURG | | 17,649 |
Mexico - 0.5% |
America Movil SA de CV Series L sponsored ADR | 579,700 | | 24,852 |
Urbi, Desarrollos Urbanos, SA de CV (a) | 4,121,400 | | 12,631 |
TOTAL MEXICO | | 37,483 |
Netherlands - 1.7% |
ING Groep NV (Certificaten Van Aandelen) | 1,334,044 | | 59,138 |
Koninklijke KPN NV | 2,772,000 | | 37,045 |
Koninklijke Numico NV | 461,400 | | 20,630 |
Koninklijke Philips Electronics NV | 655,900 | | 22,845 |
Tele Atlas NV (Netherlands) (a) | 132,400 | | 2,483 |
TOTAL NETHERLANDS | | 142,141 |
Norway - 1.8% |
Aker Kvaerner ASA | 285,200 | | 29,669 |
DnB Nor ASA | 928,300 | | 12,157 |
Norsk Hydro ASA | 1,370,500 | | 31,727 |
ProSafe ASA | 154,600 | | 9,886 |
Renewable Energy Corp. AS (d) | 756,200 | | 12,552 |
Statoil ASA | 511,800 | | 12,939 |
Telenor ASA | 2,699,300 | | 42,637 |
TOTAL NORWAY | | 151,567 |
Portugal - 0.2% |
Energias de Portugal SA | 4,219,400 | | 18,957 |
Russia - 0.3% |
Novatek JSC GDR (e) | 66,900 | | 3,894 |
OAO Gazprom sponsored ADR | 427,000 | | 18,190 |
OAO TMK unit | 169,200 | | 4,272 |
TOTAL RUSSIA | | 26,356 |
Singapore - 0.5% |
Ascendas Real Estate Investment Trust (A-REIT) | 4,630,000 | | 6,451 |
HTL International Holdings Ltd. | 7,187,500 | | 5,446 |
Keppel Corp. Ltd. | 1,166,000 | | 11,829 |
Common Stocks - continued |
| Shares | | Value (Note 1) (000s) |
Singapore - continued |
SembCorp Marine Ltd. | 5,118,000 | | $ 11,239 |
Singapore Exchange Ltd. | 3,217,000 | | 9,295 |
TOTAL SINGAPORE | | 44,260 |
South Africa - 0.2% |
FirstRand Ltd. | 2,253,800 | | 5,896 |
Steinhoff International Holdings Ltd. | 2,419,100 | | 7,882 |
TOTAL SOUTH AFRICA | | 13,778 |
Spain - 3.2% |
Banco Bilbao Vizcaya Argentaria SA | 3,378,000 | | 81,748 |
Banco Santander Central Hispano SA | 3,660,200 | | 63,351 |
Gestevision Telecinco SA | 256,800 | | 6,749 |
Inditex SA | 1,032,600 | | 49,373 |
Telefonica SA | 3,291,100 | | 63,299 |
TOTAL SPAIN | | 264,520 |
Sweden - 0.9% |
Hennes & Mauritz AB (H&M) (B Shares) | 574,100 | | 24,761 |
Modern Times Group AB (MTG) (B Shares) | 792,100 | | 45,624 |
TOTAL SWEDEN | | 70,385 |
Switzerland - 9.5% |
ABB Ltd. sponsored ADR | 3,267,100 | | 48,745 |
Actelion Ltd. (Reg.) (a) | 156,158 | | 26,295 |
Compagnie Financiere Richemont unit | 525,208 | | 25,983 |
Credit Suisse Group sponsored ADR | 220,100 | | 13,312 |
Credit Suisse Group (Reg.) | 730,684 | | 44,192 |
Lindt & Spruengli AG (participation certificate) | 13,274 | | 28,988 |
Nestle SA (Reg.) | 264,143 | | 90,231 |
Nobel Biocare Holding AG (Switzerland) | 68,513 | | 18,751 |
Novartis AG (Reg.) | 1,871,819 | | 113,676 |
Pargesa Holding SA | 141,700 | | 13,587 |
Roche Holding AG (participation certificate) | 725,268 | | 126,895 |
Societe Generale de Surveillance Holding SA (SGS) (Reg.) | 12,915 | | 13,713 |
Swiss Life Holding | 98,975 | | 23,349 |
Syngenta AG (Switzerland) | 315,081 | | 50,775 |
Tecan Group AG | 197,600 | | 10,594 |
The Swatch Group AG (Reg.) | 389,573 | | 15,562 |
UBS AG (NY Shares) | 1,935,600 | | 115,826 |
TOTAL SWITZERLAND | | 780,474 |
Common Stocks - continued |
| Shares | | Value (Note 1) (000s) |
Taiwan - 1.0% |
Acer, Inc. | 11,506,000 | | $ 20,914 |
Holtek Semiconductor, Inc. | 3,887,044 | | 7,827 |
Hon Hai Precision Industry Co. Ltd. (Foxconn) | 6,633,890 | | 43,093 |
InnoLux Display Corp. | 1,051,000 | | 1,635 |
Shin Kong Financial Holding Co. Ltd. | 10,227,415 | | 9,064 |
TOTAL TAIWAN | | 82,533 |
Turkey - 0.3% |
Finansbank AS | 5,689,491 | | 22,450 |
United Kingdom - 16.5% |
Anglo American PLC (United Kingdom) | 913,600 | | 41,197 |
AstraZeneca PLC sponsored ADR | 864,200 | | 50,729 |
BAE Systems PLC | 4,081,909 | | 32,663 |
Barclays PLC | 1,458,400 | | 19,801 |
Benfield Group PLC | 2,897,300 | | 19,260 |
BG Group PLC | 1,368,000 | | 18,149 |
BG Group PLC sponsored ADR | 200,000 | | 13,290 |
BHP Billiton PLC | 1,397,300 | | 26,947 |
BP PLC sponsored ADR | 1,603,500 | | 107,595 |
British American Tobacco PLC | 1,309,500 | | 36,011 |
British American Tobacco PLC sponsored ADR | 402,700 | | 22,149 |
British Land Co. PLC | 627,900 | | 17,906 |
Cable & Wireless PLC | 8,734,800 | | 24,409 |
Capita Group PLC | 1,106,900 | | 11,381 |
Enterprise Inns PLC | 505,225 | | 10,389 |
Experian Group Ltd. | 1,543,300 | | 16,986 |
GlaxoSmithKline PLC | 249,400 | | 6,640 |
GlaxoSmithKline PLC sponsored ADR | 1,137,700 | | 60,583 |
HSBC Holdings PLC: | | | |
(Hong Kong) (Reg.) | 3,810,944 | | 72,766 |
(United Kingdom) (Reg.) | 700,000 | | 13,366 |
Imperial Energy PLC (a) | 372,200 | | 4,807 |
Imperial Tobacco Group PLC | 76,000 | | 2,692 |
Imperial Tobacco Group PLC sponsored ADR | 175,100 | | 12,492 |
Informa PLC | 1,379,400 | | 14,366 |
International Power PLC | 5,092,700 | | 32,519 |
Man Group PLC | 1,642,200 | | 15,287 |
Marks & Spencer Group PLC | 4,489,000 | | 56,215 |
National Grid PLC | 1,576,500 | | 20,148 |
NDS Group PLC sponsored ADR (a) | 112,400 | | 5,377 |
Pearson PLC | 2,075,500 | | 30,623 |
Common Stocks - continued |
| Shares | | Value (Note 1) (000s) |
United Kingdom - continued |
Prudential PLC | 1,178,448 | | $ 14,443 |
Reckitt Benckiser PLC | 1,303,300 | | 56,707 |
Reed Elsevier PLC | 2,071,800 | | 23,593 |
Renovo Group PLC | 4,990,300 | | 14,540 |
Reuters Group PLC sponsored ADR | 481,050 | | 24,673 |
Rio Tinto PLC sponsored ADR | 137,100 | | 30,353 |
Rolls-Royce Group PLC | 3,776,051 | | 33,835 |
Royal Bank of Scotland Group PLC | 759,471 | | 27,062 |
Royal Dutch Shell PLC Class B | 1,999,459 | | 71,981 |
Scottish & Southern Energy PLC | 1,387,700 | | 34,782 |
Shire PLC | 1,567,000 | | 28,590 |
SIG PLC | 536,100 | | 10,206 |
Smiths Group PLC | 913,000 | | 16,475 |
Tesco PLC | 9,498,512 | | 71,296 |
Unilever PLC | 1,075,400 | | 26,111 |
Vodafone Group PLC | 11,282,735 | | 29,166 |
VT Group PLC | 1,218,600 | | 11,181 |
Whatman PLC | 735,900 | | 4,071 |
William Hill PLC | 1,250,500 | | 15,528 |
TOTAL UNITED KINGDOM | | 1,361,336 |
United States of America - 0.4% |
Macquarie Infrastructure Co. Trust | 131,000 | | 3,908 |
NTL, Inc. | 943,200 | | 25,495 |
TOTAL UNITED STATES OF AMERICA | | 29,403 |
TOTAL COMMON STOCKS (Cost $6,291,807) | 7,790,994 |
Nonconvertible Preferred Stocks - 1.2% |
| | | |
Germany - 0.7% |
Fresenius AG (non-vtg.) | 94,600 | | 17,750 |
Hugo Boss AG (non-vtg.) | 332,800 | | 15,483 |
Porsche AG (non-vtg.) | 21,395 | | 24,946 |
TOTAL GERMANY | | 58,179 |
Italy - 0.5% |
Banca Intesa Spa (Risp) | 5,848,702 | | 38,775 |
Nonconvertible Preferred Stocks - continued |
| Shares | | Value (Note 1) (000s) |
United Kingdom - 0.0% |
Rolls-Royce Group PLC Series B | 138,581,071 | | $ 271 |
TOTAL NONCONVERTIBLE PREFERRED STOCKS (Cost $60,462) | 97,225 |
Government Obligations - 0.1% |
| Principal Amount (000s) | | |
United States of America - 0.1% |
U.S. Treasury Bills, yield at date of purchase 4.78% to 5.01% 12/7/06 to 1/11/07 (f)
(Cost $5,510) | | $ 5,550 | | 5,511 |
Money Market Funds - 5.5% |
| Shares | | |
Fidelity Cash Central Fund, 5.34% (b) | 334,895,573 | | 334,896 |
Fidelity Securities Lending Cash Central Fund, 5.35% (b)(c) | 123,395,664 | | 123,396 |
TOTAL MONEY MARKET FUNDS (Cost $458,292) | 458,292 |
TOTAL INVESTMENT PORTFOLIO - 101.3% (Cost $6,816,071) | 8,352,022 |
NET OTHER ASSETS - (1.3)% | | (109,919) |
NET ASSETS - 100% | $ 8,242,103 |
Futures Contracts |
| Expiration Date | | Underlying Face Amount at Value (000s) | | Unrealized
Appreciation/ (Depreciation) (000s) |
Purchased |
Equity Index Contracts |
1,382 Nikkei 225 Index Contracts (Japan) | Dec. 2006 | | $ 113,082 | | $ 1,285 |
|
The face value of futures purchased as a percentage of net assets - 1.4% |
Legend |
(a) Non-income producing |
(b) Affiliated fund that is available only to investment companies and other accounts managed by Fidelity Investments. The rate quoted is the annualized seven-day yield of the fund at period end. A complete unaudited listing of the fund's holdings as of its most recent quarter end is available upon request. |
(c) Investment made with cash collateral received from securities on loan. |
(d) Security or a portion of the security is on loan at period end. |
(e) Security exempt from registration under Rule 144A of the Securities Act of 1933. These securities may be resold in transactions exempt from registration, normally to qualified institutional buyers. At the end of the period, the value of these securities amounted to $6,639,000 or 0.1% of net assets. |
(f) Security or a portion of the security was pledged to cover margin requirements for futures contracts. At the period end, the value of securities pledged amounted to $5,511,000. |
Affiliated Central Funds |
Information regarding fiscal year to date income earned by the Fund from investments in Fidelity Central Funds is as follows: |
Fund | Income earned
(Amounts in thousands) |
Fidelity Cash Central Fund | $ 11,118 |
Fidelity Securities Lending Cash Central Fund | 5,746 |
Total | $ 16,864 |
Annual Report
See accompanying notes which are an integral part of the financial statements.
Financial Statements
Statement of Assets and Liabilities
Amounts in thousands (except per-share amounts) | October 31, 2006 |
| | |
Assets | | |
Investment in securities, at value (including securities loaned of $117,944) - See accompanying schedule: Unaffiliated issuers (cost $6,357,779) | $ 7,893,730 | |
Fidelity Central Funds (cost $458,292) | 458,292 | |
Total Investments (cost $6,816,071) | | $ 8,352,022 |
Foreign currency held at value (cost $1,001) | | 1,060 |
Receivable for investments sold | | 36,415 |
Receivable for fund shares sold | | 15,792 |
Dividends receivable | | 7,417 |
Interest receivable | | 1,414 |
Other receivables | | 796 |
Total assets | | 8,414,916 |
| | |
Liabilities | | |
Payable for investments purchased | $ 33,989 | |
Payable for fund shares redeemed | 5,884 | |
Accrued management fee | 5,123 | |
Distribution fees payable | 39 | |
Payable for daily variation on futures contracts | 518 | |
Other affiliated payables | 1,549 | |
Other payables and accrued expenses | 2,315 | |
Collateral on securities loaned, at value | 123,396 | |
Total liabilities | | 172,813 |
| | |
Net Assets | | $ 8,242,103 |
Net Assets consist of: | | |
Paid in capital | | $ 6,402,118 |
Undistributed net investment income | | 83,948 |
Accumulated undistributed net realized gain (loss) on investments and foreign currency transactions | | 220,510 |
Net unrealized appreciation (depreciation) on investments and assets and liabilities in foreign currencies | | 1,535,527 |
Net Assets | | $ 8,242,103 |
Annual Report
See accompanying notes which are an integral part of the financial statements.
Financial Statements - continued
Statement of Assets and Liabilities - continued
Amounts in thousands (except per-share amounts) | October 31, 2006 |
| | |
Calculation of Maximum Offering Price
Class A:
Net Asset Value and redemption price per share ($139,827 ÷ 3,835 shares) | | $ 36.47 |
| | |
Maximum offering price per share (100/94.25 of $36.47) | | $ 38.69 |
Class T:
Net Asset Value and redemption price per share ($10,065 ÷ 277.24 shares) | | $ 36.30 |
| | |
Maximum offering price per share (100/96.50 of $36.30) | | $ 37.62 |
Class B:
Net Asset Value and offering price per share ($4,477 ÷ 123.96 shares)A | | $ 36.12 |
| | |
Class C:
Net Asset Value and offering price per share ($5,846 ÷ 161.5 shares)A | | $ 36.19 |
| | |
| | |
International Discovery:
Net Asset Value, offering price and redemption price per share ($8,053,564 ÷ 219,645 shares) | | $ 36.67 |
| | |
Institutional Class:
Net Asset Value, offering price and redemption price per share ($28,324 ÷ 771.5 shares) | | $ 36.71 |
A Redemption price per share is equal to net asset value less any applicable contingent deferred sales charge.
Annual Report
See accompanying notes which are an integral part of the financial statements.
Statement of Operations
Amounts in thousand | Year ended October 31, 2006 |
| | |
Investment Income | | |
Dividends | | $ 149,831 |
Interest | | 315 |
Income from Fidelity Central Funds | | 16,864 |
| | 167,010 |
Less foreign taxes withheld | | (12,732) |
Total income | | 154,278 |
| | |
Expenses | | |
Management fee
Basic fee | $ 45,254 | |
Performance adjustment | 4,736 | |
Transfer agent fees | 14,071 | |
Distribution fees | 263 | |
Accounting and security lending fees | 1,726 | |
Custodian fees and expenses | 2,003 | |
Independent trustees' compensation | 23 | |
Registration fees | 661 | |
Audit | 114 | |
Legal | 94 | |
Interest | 2 | |
Miscellaneous | 46 | |
Total expenses before reductions | 68,993 | |
Expense reductions | (3,737) | 65,256 |
Net investment income (loss) | | 89,022 |
Realized and Unrealized Gain (Loss) Net realized gain (loss) on: | | |
Investment securities: | | |
Unaffiliated issuers (net of foreign taxes of $780) | 231,379 | |
Foreign currency transactions | (2,357) | |
Futures contracts | 9,977 | |
Total net realized gain (loss) | | 238,999 |
Change in net unrealized appreciation (depreciation) on: Investment securities (net of increase in deferred foreign taxes of $1,455) | 942,135 | |
Assets and liabilities in foreign currencies | 247 | |
Futures contracts | (2,186) | |
Total change in net unrealized appreciation (depreciation) | | 940,196 |
Net gain (loss) | | 1,179,195 |
Net increase (decrease) in net assets resulting from operations | | $ 1,268,217 |
Annual Report
See accompanying notes which are an integral part of the financial statements.
Financial Statements - continued
Statement of Changes in Net Assets
Amounts in thousands | Year ended
October 31,
2006 | Year ended
October 31,
2005 |
Increase (Decrease) in Net Assets | | |
Operations | | |
Net investment income (loss) | $ 89,022 | $ 41,777 |
Net realized gain (loss) | 238,999 | 194,174 |
Change in net unrealized appreciation (depreciation) | 940,196 | 324,844 |
Net increase (decrease) in net assets resulting
from operations | 1,268,217 | 560,795 |
Distributions to shareholders from net investment income | (41,324) | (12,813) |
Distributions to shareholders from net realized gain | (189,744) | (10,250) |
Total distributions | (231,068) | (23,063) |
Share transactions - net increase (decrease) | 3,239,823 | 1,234,164 |
Redemption fees | 380 | 193 |
Total increase (decrease) in net assets | 4,277,352 | 1,772,089 |
| | |
Net Assets | | |
Beginning of period | 3,964,751 | 2,192,662 |
End of period (including undistributed net investment income of $83,948 and undistributed net investment income of $40,185, respectively) | $ 8,242,103 | $ 3,964,751 |
Annual Report
See accompanying notes which are an integral part of the financial statements.
Financial Highlights - Class A
Years ended October 31, | 2006 | 2005 H |
Selected Per-Share Data | | |
Net asset value, beginning of period | $ 30.57 | $ 27.41 |
Income from Investment Operations | | |
Net investment income (loss) E | .42 | .28 |
Net realized and unrealized gain (loss) | 7.19 | 2.88 |
Total from investment operations | 7.61 | 3.16 |
Distributions from net investment income | (.31) | - |
Distributions from net realized gain | (1.40) | - |
Total distributions | (1.71) | - |
Redemption fees added to paid in capital E | - J | - J |
Net asset value, end of period | $ 36.47 | $ 30.57 |
Total Return B,C,D | 26.01% | 11.53% |
Ratios to Average Net Assets F,I | | |
Expenses before reductions | 1.27% | 1.42% A |
Expenses net of fee waivers, if any | 1.27% | 1.42% A |
Expenses net of all reductions | 1.21% | 1.36% A |
Net investment income (loss) | 1.22% | 1.15% A |
Supplemental Data | | |
Net assets, end of period (in millions) | $ 140 | $ 2 |
Portfolio turnover rate G | 56% | 75% |
A Annualized
B Total returns for periods of less than one year are not annualized.
C Total returns would have been lower had certain expenses not been reduced during the periods shown.
D Total returns do not include the effect of the sales charges.
E Calculated based on average shares outstanding during the period.
F Fees and expenses of the underlying Fidelity Central Funds are not included in the Fund's expense ratio. The Fund indirectly bears its proportionate share of the expenses of any underlying Fidelity Central Funds.
G Amount does not include the portfolio activity of any underlying Fidelity Central Funds.
H For the period January 6, 2005 (commencement of sale of shares) to October 31, 2005.
I Expense ratios reflect operating expenses of the class. Expenses before reductions do not reflect amounts reimbursed by the investment adviser or reductions from brokerage service arrangements or other expense offset arrangements and do not represent the amount paid by the class during periods when reimbursements or reductions occur. Expense ratios before reductions for start-up periods may not be representative of longer-term operating periods. Expenses net of fee waivers reflect expenses after reimbursement by the investment adviser but prior to reductions from brokerage service arrangements or other expense offset arrangements. Expenses net of all reductions represent the net expenses paid by the class.
J Amount represents less than $.01 per share.
Annual Report
See accompanying notes which are an integral part of the financial statements.
Financial Highlights - Class T
Years ended October 31, | 2006 | 2005 H |
Selected Per-Share Data | | |
Net asset value, beginning of period | $ 30.49 | $ 27.41 |
Income from Investment Operations | | |
Net investment income (loss) E | .27 | .20 |
Net realized and unrealized gain (loss) | 7.18 | 2.88 |
Total from investment operations | 7.45 | 3.08 |
Distributions from net investment income | (.24) | - |
Distributions from net realized gain | (1.40) | - |
Total distributions | (1.64) | - |
Redemption fees added to paid in capital E | - J | - J |
Net asset value, end of period | $ 36.30 | $ 30.49 |
Total Return B,C,D | 25.49% | 11.24% |
Ratios to Average Net Assets F,I | | |
Expenses before reductions | 1.71% | 1.75% A |
Expenses net of fee waivers, if any | 1.71% | 1.75% A |
Expenses net of all reductions | 1.65% | 1.69% A |
Net investment income (loss) | .78% | .83% A |
Supplemental Data | | |
Net assets, end of period (in millions) | $ 10 | $ 2 |
Portfolio turnover rate G | 56% | 75% |
A Annualized
B Total returns for periods of less than one year are not annualized.
C Total returns would have been lower had certain expenses not been reduced during the periods shown.
D Total returns do not include the effect of the sales charges.
E Calculated based on average shares outstanding during the period.
F Fees and expenses of the underlying Fidelity Central Funds are not included in the Fund's expense ratio. The Fund indirectly bears its proportionate share of the expenses of any underlying Fidelity Central Funds.
G Amount does not include the portfolio activity of any underlying Fidelity Central Funds.
H For the period January 6, 2005 (commencement of sale of shares) to October 31, 2005.
I Expense ratios reflect operating expenses of the class. Expenses before reductions do not reflect amounts reimbursed by the investment adviser or reductions from brokerage service arrangements or other expense offset arrangements and do not represent the amount paid by the class during periods when reimbursements or reductions occur. Expense ratios before reductions for start-up periods may not be representative of longer-term operating periods. Expenses net of fee waivers reflect expenses after reimbursement by the investment adviser but prior to reductions from brokerage service arrangements or other expense offset arrangements. Expenses net of all reductions represent the net expenses paid by the class.
J Amount represents less than $.01 per share.
Annual Report
See accompanying notes which are an integral part of the financial statements.
Financial Highlights - Class B
Years ended October 31, | 2006 | 2005 H |
Selected Per-Share Data | | |
Net asset value, beginning of period | $ 30.36 | $ 27.41 |
Income from Investment Operations | | |
Net investment income (loss) E | .08 | .08 |
Net realized and unrealized gain (loss) | 7.19 | 2.87 |
Total from investment operations | 7.27 | 2.95 |
Distributions from net investment income | (.11) | - |
Distributions from net realized gain | (1.40) | - |
Total distributions | (1.51) | - |
Redemption fees added to paid in capital E | - J | - J |
Net asset value, end of period | $ 36.12 | $ 30.36 |
Total Return B,C,D | 24.91% | 10.76% |
Ratios to Average Net Assets F,I | | |
Expenses before reductions | 2.27% | 2.24% A |
Expenses net of fee waivers, if any | 2.25% | 2.24% A |
Expenses net of all reductions | 2.19% | 2.18% A |
Net investment income (loss) | .24% | .33% A |
Supplemental Data | | |
Net assets, end of period (in millions) | $ 4 | $ 1 |
Portfolio turnover rate G | 56% | 75% |
A Annualized
B Total returns for periods of less than one year are not annualized.
C Total returns would have been lower had certain expenses not been reduced during the periods shown.
D Total returns do not include the effect of the contingent deferred sales charge.
E Calculated based on average shares outstanding during the period.
F Fees and expenses of the underlying Fidelity Central Funds are not included in the Fund's expense ratio. The Fund indirectly bears its proportionate share of the expenses of any underlying Fidelity Central Funds.
G Amount does not include the portfolio activity of any underlying Fidelity Central Funds.
H For the period January 6, 2005 (commencement of sale of shares) to October 31, 2005.
I Expense ratios reflect operating expenses of the class. Expenses before reductions do not reflect amounts reimbursed by the investment adviser or reductions from brokerage service arrangements or other expense offset arrangements and do not represent the amount paid by the class during periods when reimbursements or reductions occur. Expense ratios before reductions for start-up periods may not be representative of longer-term operating periods. Expenses net of fee waivers reflect expenses after reimbursement by the investment adviser but prior to reductions from brokerage service arrangements or other expense offset arrangements. Expenses net of all reductions represent the net expenses paid by the class.
J Amount represents less than $.01 per share.
Annual Report
See accompanying notes which are an integral part of the financial statements.
Financial Highlights - Class C
Years ended October 31, | 2006 | 2005 H |
Selected Per-Share Data | | |
Net asset value, beginning of period | $ 30.41 | $ 27.41 |
Income from Investment Operations | | |
Net investment income (loss) E | .11 | .13 |
Net realized and unrealized gain (loss) | 7.19 | 2.87 |
Total from investment operations | 7.30 | 3.00 |
Distributions from net investment income | (.12) | - |
Distributions from net realized gain | (1.40) | - |
Total distributions | (1.52) | - |
Redemption fees added to paid in capital E | - J | - J |
Net asset value, end of period | $ 36.19 | $ 30.41 |
Total Return B,C,D | 24.97% | 10.94% |
Ratios to Average Net Assets F,I | | |
Expenses before reductions | 2.16% | 2.04% A |
Expenses net of fee waivers, if any | 2.16% | 2.04% A |
Expenses net of all reductions | 2.11% | 1.98% A |
Net investment income (loss) | .33% | .53% A |
Supplemental Data | | |
Net assets, end of period (in millions) | $ 6 | $ 2 |
Portfolio turnover rate G | 56% | 75% |
A Annualized
B Total returns for periods of less than one year are not annualized.
C Total returns would have been lower had certain expenses not been reduced during the periods shown.
D Total returns do not include the effect of the contingent deferred sales charge.
E Calculated based on average shares outstanding during the period.
F Fees and expenses of the underlying Fidelity Central Funds are not included in the Fund's expense ratio. The Fund indirectly bears its proportionate share of the expenses of any underlying Fidelity Central Funds.
G Amount does not include the portfolio activity of any underlying Fidelity Central Funds.
H For the period January 6, 2005 (commencement of sale of shares) to October 31, 2005.
I Expense ratios reflect operating expenses of the class. Expenses before reductions do not reflect amounts reimbursed by the investment adviser or reductions from brokerage service arrangements or other expense offset arrangements and do not represent the amount paid by the class during periods when reimbursements or reductions occur. Expense ratios before reductions for start-up periods may not be representative of longer-term operating periods. Expenses net of fee waivers reflect expenses after reimbursement by the investment adviser but prior to reductions from brokerage service arrangements or other expense offset arrangements. Expenses net of all reductions represent the net expenses paid by the class.
J Amount represents less than $.01 per share.
Annual Report
See accompanying notes which are an integral part of the financial statements.
Financial Highlights - International Discovery
Years ended October 31, | 2006 | 2005 | 2004 | 2003 | 2002 |
Selected Per-Share Data | | | | | |
Net asset value, beginning of period | $ 30.65 | $ 25.31 | $ 21.87 | $ 16.66 | $ 17.61 |
Income from Investment Operations | | | | | |
Net investment income (loss) B | .48 | .37 | .22 | .19 | .11 |
Net realized and unrealized gain (loss) | 7.25 | 5.24 | 3.40 | 5.11 | (1.06) |
Total from investment operations | 7.73 | 5.61 | 3.62 | 5.30 | (.95) |
Distributions from net investment income | (.31) | (.15) | (.18) | (.09) | - |
Distributions from net realized gain | (1.40) | (.12) | - | - | - |
Total distributions | (1.71) | (.27) | (.18) | (.09) | - |
Redemption fees added to paid in capital B | - F | - F | - F | - F | - F |
Net asset value, end of period | $ 36.67 | $ 30.65 | $ 25.31 | $ 21.87 | $ 16.66 |
Total Return A | 26.34% | 22.29% | 16.65% | 31.97% | (5.39)% |
Ratios to Average Net Assets C,E | | | | | |
Expenses before reductions | 1.09% | 1.08% | 1.10% | 1.14% | 1.14% |
Expenses net of fee waivers, if any | 1.08% | 1.07% | 1.10% | 1.14% | 1.14% |
Expenses net of all reductions | 1.03% | 1.01% | 1.06% | 1.11% | 1.12% |
Net investment income (loss) | 1.41% | 1.35% | .92% | 1.08% | .59% |
Supplemental Data | | | | | |
Net assets, end of period (in millions) | $ 8,054 | $ 3,949 | $ 2,193 | $ 1,243 | $ 890 |
Portfolio turnover rate D | 56% | 75% | 87% | 81% | 63% |
A Total returns would have been lower had certain expenses not been reduced during the periods shown.
B Calculated based on average shares outstanding during the period.
C Fees and expenses of the underlying Fidelity Central Funds are not included in the Fund's expense ratio. The Fund indirectly bears its proportionate share of the expenses of any underlying Fidelity Central Funds.
D Amount does not include the portfolio activity of any underlying Fidelity Central Funds.
E Expense ratios reflect operating expenses of the class. Expenses before reductions do not reflect amounts reimbursed by the investment adviser or reductions from brokerage service arrangements or other expense offset arrangements and do not represent the amount paid by the class during periods when reimbursements or reductions occur. Expenses net of fee waivers reflect expenses after reimbursement by the investment adviser but prior to reductions from brokerage service arrangements or other expense offset arrangements. Expenses net of all reductions represent the net expenses paid by the class.
F Amount represents less than $.01 per share.
Annual Report
See accompanying notes which are an integral part of the financial statements.
Financial Highlights - Institutional Class
Years ended October 31, | 2006 | 2005 G |
Selected Per-Share Data | | |
Net asset value, beginning of period | $ 30.68 | $ 27.41 |
Income from Investment Operations | | |
Net investment income (loss) D | .51 | .38 |
Net realized and unrealized gain (loss) | 7.25 | 2.89 |
Total from investment operations | 7.76 | 3.27 |
Distributions from net investment income | (.33) | - |
Distributions from net realized gain | (1.40) | - |
Total distributions | (1.73) | - |
Redemption fees added to paid in capital D | - I | - I |
Net asset value, end of period | $ 36.71 | $ 30.68 |
Total Return B,C | 26.45% | 11.93% |
Ratios to Average Net Assets E,H | | |
Expenses before reductions | 1.00% | .97% A |
Expenses net of fee waivers, if any | 1.00% | .97% A |
Expenses net of all reductions | .95% | .90% A |
Net investment income (loss) | 1.49% | 1.60% A |
Supplemental Data | | |
Net assets, end of period (in millions) | $ 28 | $ 10 |
Portfolio turnover rate F | 56% | 75% |
A Annualized
B Total returns for periods of less than one year are not annualized.
C Total returns would have been lower had certain expenses not been reduced during the periods shown.
D Calculated based on average shares outstanding during the period.
E Fees and expenses of the underlying Fidelity Central Funds are not included in the Fund's expense ratio. The Fund indirectly bears its proportionate share of the expenses of any underlying Fidelity Central Funds.
F Amount does not include the portfolio activity of any underlying Fidelity Central Funds.
G For the period January 6, 2005 (commencement of sale of shares) to October 31, 2005.
H Expense ratios reflect operating expenses of the class. Expenses before reductions do not reflect amounts reimbursed by the investment adviser or reductions from brokerage service arrangements or other expense offset arrangements and do not represent the amount paid by the class during periods when reimbursements or reductions occur. Expense ratios before reductions for start-up periods may not be representative of longer-term operating periods. Expenses net of fee waivers reflect expenses after reimbursement by the investment adviser but prior to reductions from brokerage service arrangements or other expense offset arrangements. Expenses net of all reductions represent the net expenses paid by the class.
I Amount represents less than $.01 per share.
Annual Report
See accompanying notes which are an integral part of the financial statements.
Notes to Financial Statements
For the period ended October 31, 2006
(Amounts in thousands except ratios)
1. Significant Accounting Policies.
Fidelity International Discovery Fund (the Fund) is a fund of Fidelity Investment Trust (the trust) and is authorized to issue an unlimited number of shares. The trust is registered under the Investment Company Act of 1940, as amended (the 1940 Act), as an open-end management investment company organized as a Massachusetts business trust.
The Fund offers Class A, Class T, Class B, Class C, International Discovery and Institutional Class shares, each of which has equal rights as to assets and voting privileges. Each class has exclusive voting rights with respect to matters that affect that class. Class B shares will automatically convert to Class A shares after a holding period of seven years from the initial date of purchase. Investment income, realized and unrealized capital gains and losses, the common expenses of the Fund, and certain fund-level expense reductions, if any, are allocated on a pro rata basis to each class based on the relative net assets of each class to the total net assets of the Fund. Each class differs with respect to transfer agent and distribution and service plan fees incurred. Certain expense reductions also differ by class.
The Fund's investments in emerging markets can be subject to social, economic, regulatory, and political uncertainties and can be extremely volatile. The Fund may invest in Fidelity Central Funds which are open-end investment companies available to investment companies and other accounts managed by Fidelity Management & Research Company (FMR) and its affiliates. The financial statements have been prepared in conformity with accounting principles generally accepted in the United States of America, which require management to make certain estimates and assumptions at the date of the financial statements. The following summarizes the significant accounting policies of the Fund, which are also consistently followed by the Fidelity Central Funds:
Security Valuation. Investments are valued and net asset value (NAV) per share is calculated (NAV calculation) as of the close of business of the New York Stock Exchange (NYSE), normally 4:00 p.m. Eastern time. Wherever possible, the Fund uses independent pricing services approved by the Board of Trustees to value its investments.
Equity securities, including restricted securities, for which market quotations are readily available, are valued at the last reported sale price or official closing price as reported by an independent pricing service on the primary market or exchange on which they are traded. In the event there were no sales during the day or closing prices are not available, securities are valued at the last quoted bid price. Investments in open-end mutual funds, including the Fidelity Central Funds, are valued at their closing net asset value each business day. Short-term securities with remaining maturities of sixty days or less for which quotations are not readily available are valued at amortized cost, which approximates value.
Annual Report
Notes to Financial Statements - continued
(Amounts in thousands except ratios)
1. Significant Accounting Policies - continued
Security Valuation - continued
When current market prices or quotations are not readily available or do not accurately reflect fair value, valuations may be determined in accordance with procedures adopted by the Board of Trustees. For example, when developments occur between the close of a market and the close of the NYSE that may materially affect the value of some or all of the securities, or when trading in a security is halted, those securities may be fair valued. Factors used in the determination of fair value may include monitoring news to identify significant market or security specific events such as changes in the value of U.S. securities markets, reviewing developments in foreign markets and evaluating the performance of ADRs, futures contracts and exchange-traded funds. Because the Fund's utilization of fair value pricing depends on market activity, the frequency with which fair value pricing is used can not be predicted and may be utilized to a significant extent. The value of securities used for NAV calculation under fair value pricing may differ from published prices for the same securities.
Foreign Currency. The Fund uses foreign currency contracts to facilitate transactions in foreign-denominated securities. Losses from these transactions may arise from changes in the value of the foreign currency or if the counterparties do not perform under the contracts' terms.
Foreign-denominated assets, including investment securities, and liabilities are translated into U.S. dollars at the exchange rate at period end. Purchases and sales of investment securities, income and dividends received and expenses denominated in foreign currencies are translated into U.S. dollars at the exchange rate in effect on the transaction date.
The effects of exchange rate fluctuations on investments are included with the net realized and unrealized gain (loss) on investment securities. Other foreign currency transactions resulting in realized and unrealized gain (loss) are disclosed separately.
Investment Transactions and Income. Security transactions, including the Fund's investment activity in the Fidelity Central Funds, are accounted for as of trade date. Gains and losses on securities sold are determined on the basis of identified cost and may include proceeds received from litigation. Dividend income is recorded on the ex-dividend date, except for certain dividends from foreign securities where the ex-dividend date may have passed, which are recorded as soon as the Fund is informed of the ex-dividend date. Non-cash dividends included in dividend income, if any, are recorded at the fair market value of the securities received. Distributions received on securities that represent a return of capital or capital gain are recorded as a reduction of cost of investments and/or as a realized gain. The Fund estimates the components of distributions received that may be considered return of capital distributions or capital gain distributions. Interest income is accrued as earned. Interest income includes coupon interest and amortization of premium and accretion of discount on debt securities. Investment income is recorded net of foreign taxes withheld where recovery of such taxes is uncertain.
Annual Report
1. Significant Accounting Policies - continued
Expenses. Most expenses of the trust can be directly attributed to a fund. Expenses which cannot be directly attributed are apportioned among each Fund in the trust. Expense estimates are accrued in the period to which they relate and adjustments are made when actual amounts are known.
Income Tax Information and Distributions to Shareholders. Each year, the Fund intends to qualify as a regulated investment company by distributing all of its taxable income and realized gains under Subchapter M of the Internal Revenue Code. As a result, no provision for income taxes is required in the accompanying financial statements. Foreign taxes are provided for based on the Fund's understanding of the tax rules and rates that exist in the foreign markets in which it invests.
Distributions are recorded on the ex-dividend date. Income dividends and capital gain distributions are declared separately for each class. Income and capital gain distributions are determined in accordance with income tax regulations, which may differ from generally accepted accounting principles. In addition, the Fund will claim a portion of the payment made to redeeming shareholders as a distribution for income tax purposes.
Capital accounts within the financial statements are adjusted for permanent book-tax differences. These adjustments have no impact on net assets or the results of operations. Temporary book-tax differences will reverse in a subsequent period.
Book-tax differences are primarily due to futures transactions, foreign currency transactions, passive foreign investment companies (PFIC), and losses deferred due to wash sales.
The tax-basis components of distributable earnings and the federal tax cost as of period end were as follows:
Unrealized appreciation | $ 1,585,398 | |
Unrealized depreciation | (82,869) | |
Net unrealized appreciation (depreciation) | 1,502,529 | |
Undistributed ordinary income | 132,824 | |
Undistributed long-term capital gain | 165,476 | |
| | |
Cost for federal income tax purposes | $ 6,849,493 | |
The tax character of distributions paid was as follows:
| October 31, 2006 | October 31, 2005 |
Ordinary Income | $ 106,379 | $ 12,813 |
Long-term Capital Gains | 124,689 | 10,250 |
| | |
Total | $ 231,068 | $ 23,063 |
Annual Report
Notes to Financial Statements - continued
(Amounts in thousands except ratios)
1. Significant Accounting Policies - continued
Short-Term Trading (Redemption) Fees. Shares held in the Fund less than 30 days are subject to a redemption fee equal to 1.00% of the proceeds of the redeemed shares. All redemption fees, including any estimated redemption fees paid by FMR, are retained by the Fund and accounted for as an addition to paid in capital.
New Accounting Pronouncements. In July 2006, Financial Accounting Standards Board Interpretation No. 48, Accounting for Uncertainty in Income Taxes - an interpretation of FASB Statement 109 (FIN 48), was issued and is effective for fiscal years beginning after December 15, 2006. FIN 48 sets forth a threshold for financial statement recognition, measurement and disclosure of a tax position taken or expected to be taken on a tax return. Management is currently evaluating the impact, if any, the adoption of FIN 48 will have on the Fund's net assets, results of operations and financial statement disclosures.
In addition, in September 2006, Statement of Financial Accounting Standards No. 157, Fair Value Measurements (SFAS 157), was issued and is effective for fiscal years beginning after November 15, 2007. SFAS 157 defines fair value, establishes a framework for measuring fair value and expands disclosures about fair value measurements. Management is currently evaluating the impact the adoption of SFAS 157 will have on the Fund's financial statement disclosures.
2. Operating Policies.
Repurchase Agreements. FMR has received an Exemptive Order from the Securities and Exchange Commission (the SEC) which permits the Fund and other affiliated entities of FMR to transfer uninvested cash balances into joint trading accounts which are then invested in repurchase agreements. The Fund may also invest directly with institutions in repurchase agreements. Repurchase agreements are collateralized by government or non-government securities. Upon settlement date, collateral is held in segregated accounts with custodian banks and may be obtained in the event of a default of the counterparty. The Fund monitors, on a daily basis, the value of the collateral to ensure it is at least equal to the principal amount of the repurchase agreement (including accrued interest). In the event of a default by the counterparty, realization of the collateral proceeds could be delayed, during which time the value of the collateral may decline.
Futures Contracts. The Fund may use futures contracts to manage its exposure to the stock market. Buying futures tends to increase a fund's exposure to the underlying instrument, while selling futures tends to decrease a fund's exposure to the underlying instrument or hedge other fund investments. Upon entering into a futures contract, a fund is required to deposit with a clearing broker, no later than the following business day, an amount ("initial margin") equal to a certain percentage of the face value of the contract. The initial margin may be in the form of cash or securities and is transferred to a segregated account on settlement date. Subsequent payments ("variation margin") are made or
Annual Report
2. Operating Policies - continued
Futures Contracts - continued
received by a fund depending on the daily fluctuations in the value of the futures contract and are accounted for as unrealized gains or losses. Realized gains (losses) are recorded upon the expiration or closing of the futures contract. Securities deposited to meet margin requirements are identified in the Schedule of Investments. Futures contracts involve, to varying degrees, risk of loss in excess of any futures variation margin reflected in the Statement of Assets and Liabilities. The underlying face amount at value of any open futures contracts at period end is shown in the Schedule of Investments under the caption "Futures Contracts." This amount reflects each contract's exposure to the underlying instrument at period end. Losses may arise from changes in the value of the underlying instruments or if the counterparties do not perform under the contract's terms. Futures contracts are valued at the settlement price established each day by the board of trade or exchange on which they are traded.
Restricted Securities. The Fund may invest in securities that are subject to legal or contractual restrictions on resale. These securities generally may be resold in transactions exempt from registration or to the public if the securities are registered. Disposal of these securities may involve time-consuming negotiations and expense, and prompt sale at an acceptable price may be difficult. Information regarding restricted securities is included at the end of the Fund's Schedule of Investments.
3. Purchases and Sales of Investments.
Purchases and sales of securities, other than short-term securities, aggregated $6,247,376 and $3,418,782, respectively.
4. Fees and Other Transactions with Affiliates.
Management Fee. FMR and its affiliates provide the Fund with investment management related services for which the Fund pays a monthly management fee. The management fee is the sum of an individual fund fee rate that is based on an annual rate of .45% of the Fund's average net assets and a group fee rate that averaged .27% during the period. The group fee rate is based upon the average net assets of all the mutual funds advised by FMR.
The group fee rate decreases as assets under management increase and increases as assets under management decrease. In addition, the management fee is subject to a performance adjustment (up to a maximum of ± .20% of the Fund's average net assets over a 36 month performance period). The upward or downward adjustment to the management fee is based on the relative investment performance of the retail class of the Fund, International Discovery, as compared to an appropriate benchmark index. The Fund's performance adjustment took effect in September 2005. Subsequent months will be added until the performance period includes 36 months. For the period, the total annual management fee rate, including the performance adjustment, was .79% of the Fund's average net assets.
Annual Report
Notes to Financial Statements - continued
(Amounts in thousands except ratios)
4. Fees and Other Transactions with Affiliates - continued
Distribution and Service Plan. In accordance with Rule 12b-1 of the 1940 Act, the Fund has adopted separate Distribution and Service Plans for each class of shares. Certain classes pay Fidelity Distributors Corporation (FDC), an affiliate of FMR, separate Distribution and Service Fees, each of which is based on an annual percentage of each class' average net assets. In addition, FDC may pay financial intermediaries for selling shares of the Fund and providing shareholder support services. For the period, the Distribution and Service Fee rates and the total amounts paid to and retained by FDC were as follows:
| Distribution
Fee | Service
Fee | Paid to
FDC | Retained
by FDC |
Class A | 0% | .25% | $ 183 | $ - |
Class T | .25% | .25% | 26 | 2 |
Class B | .75% | .25% | 21 | 16 |
Class C | .75% | .25% | 33 | 19 |
| | | $ 263 | $ 37 |
Sales Load. FDC receives a front-end sales charge of up to 5.75% for selling Class A shares, and 3.50% for selling Class T shares, some of which is paid to financial intermediaries for selling shares of the Fund. FDC receives the proceeds of contingent deferred sales charges levied on Class A, Class T, Class B, and Class C redemptions. These charges depend on the holding period. The deferred sales charges range from 5% to 1% for Class B, 1% for Class C, 1.00% to .50% for certain purchases of Class A shares (.25% prior to February 24, 2006) and .25% for certain purchases of Class T shares.
For the period, sales charge amounts retained by FDC were as follows:
| Retained
by FDC |
Class A | $ 36 |
Class T | 7 |
Class B* | 3 |
Class C* | 1 |
| $ 47 |
* When Class B and Class C shares are initially sold, FDC pays commissions from its own resources to financial intermediaries through which the sales
are made.
Transfer Agent Fees. Fidelity Investments Institutional Operations Company, Inc. (FIIOC), an affiliate of FMR, is the transfer, dividend disbursing and shareholder servicing agent for each class of the Fund, except for International Discovery. Fidelity Service Company, Inc. (FSC), an affiliate of FMR, is the transfer agent for International Discovery shares. FIIOC and FSC receive account fees and asset-based fees that vary according to the account size and type of account of the shareholders of the respective classes of the Fund.
Annual Report
4. Fees and Other Transactions with Affiliates - continued
Transfer Agent Fees - continued
FIIOC and FSC pay for typesetting, printing and mailing of shareholder reports, except proxy statements. For the period, the total transfer agent fees paid by each class to FIIOC or FSC, were as follows:
| Amount | % of
Average
Net Assets |
Class A | $ 115 | .16 |
Class T | 18 | .35 |
Class B | 9 | .41 |
Class C | 10 | .31 |
International Discovery | 13,891 | .22 |
Institutional Class | 28 | .14 |
| $ 14,071 | |
Accounting and Security Lending Fees. FSC maintains the Fund's accounting records. The accounting fee is based on the level of average net assets for the month. Under a separate contract, FSC administers the security lending program. The security lending fee is based on the number and duration of lending transactions.
Investments in Fidelity Central Funds. The Fund may invest in Fidelity Central Funds. The Fund's Schedule of Investments lists each of the Fidelity Central Funds as an investment of the Fund but does not include the underlying holdings of each Fidelity Central Fund. As an Investing Fund, the Fund indirectly bears its proportionate share of the expenses of the underlying Fidelity Central Funds. A complete unaudited list of holdings for each Fidelity Central Fund is available upon request. In addition, the financial statements of the Fidelity Central Funds, which are not covered by the Fund's Report of Independent Registered Public Accounting Firm, are available on the EDGAR Database on the SEC's web site, www.sec.gov, or upon request.
The Money Market Central Funds seek preservation of capital and current income and are managed by Fidelity Investments Money Management, Inc. (FIMM), an affiliate of FMR.
5. Committed Line of Credit.
The Fund participates with other funds managed by FMR in a $4.2 billion credit facility (the "line of credit") to be utilized for temporary or emergency purposes to fund shareholder redemptions or for other short-term liquidity purposes. The Fund has agreed to pay commitment fees on its pro rata portion of the line of credit, which amounts to $16 and is reflected in Miscellaneous Expense on the Statement of Operations. During the period, there were no borrowings on this line of credit.
Annual Report
Notes to Financial Statements - continued
(Amounts in thousands except ratios)
6. Security Lending.
The Fund lends portfolio securities from time to time in order to earn additional income. On the settlement date of the loan, the Fund receives collateral (in the form of U.S. Treasury obligations, letters of credit and/or cash) against the loaned securities and maintains collateral in an amount not less than 100% of the market value of the loaned securities during the period of the loan. The market value of the loaned securities is determined at the close of business of the Fund and any additional required collateral is delivered to the Fund on the next business day. If the borrower defaults on its obligation to return the securities loaned because of insolvency or other reasons, a fund could experience delays and costs in recovering the securities loaned or in gaining access to the collateral. Any cash collateral received is invested in the Fidelity Securities Lending Cash Central Fund. The value of loaned securities and cash collateral at period end are disclosed on the Fund's Statement of Assets and Liabilities. Security lending income represents the income earned on investing cash collateral, less fees and expenses associated with the loan, plus any premium payments that may be received on the loan of certain types of securities. Net income from lending portfolio securities during the period amounted to $5,746.
7. Bank Borrowings.
The Fund is permitted to have bank borrowings for temporary or emergency purposes to fund shareholder redemptions. The Fund has established borrowing arrangements with certain banks. The interest rate on the borrowings is the bank's base rate, as revised from time to time. The average daily loan balance during the period for which loans were outstanding amounted to $6,674. The weighted average interest rate was 4.79%. At period end, there were no bank borrowings outstanding.
8. Expense Reductions.
FMR voluntarily agreed to reimburse a portion of Fidelity International Discovery's operating expenses. During the period, this reimbursement reduced the class expenses by $38.
FMR voluntarily agreed to reimburse each class to the extent annual operating expenses exceeded certain levels of average net assets as noted in the table below. Some expenses, for example interest expense, including commitment fees, are excluded from this reimbursement.
The following classes were in reimbursement during the period:
| Expense
Limitations | Reimbursement
from adviser |
Class B | 2.25% | $ 1 |
Annual Report
8. Expense Reductions - continued
Many of the brokers with whom FMR places trades on behalf of the Fund provided services to the Fund in addition to trade execution. These services included payments of certain expenses on behalf of the Fund totaling $3,493 for the period. In addition, through arrangements with the Fund's custodian and each class' transfer agent, credits realized as a result of uninvested cash balances were used to reduce the Fund's expenses. During the period, credits reduced each class' transfer agent expense as noted in the table below.
| Transfer Agent
expense reduction |
International Discovery | $ 205 |
9. Other.
The Fund's organizational documents provide former and current trustees and officers with a limited indemnification against liabilities arising in connection with the performance of their duties to the Fund. In the normal course of business, the Fund may also enter into contracts that provide general indemnifications. The Fund's maximum exposure under these arrangements is unknown as this would be dependent on future claims that may be made against the Fund. The risk of material loss from such claims is considered remote.
During the period, the Fund's transfer agent, Fidelity Investments Institutional Operations Company, Inc. (FIIOC), an affiliate of Fidelity Management & Research Company, notified the Fund that the fund's books and records did not reflect a conversion of certain Class B to Class A shares upon their conversion date. Management has determined that this did not have a material impact to the Fund's reported net assets or results of operations in the accompanying financial statements. FIIOC will cause the books and records of the Fund to reflect a conversion of the relevant Class B shares to Class A and is in the process of determining the impact to affected shareholder accounts for purposes of its remediation.
The United States Securities and Exchange Commission ("SEC") is conducting an investigation of FMR (covering the years 2002 to 2004) arising from gifts, gratuities and business entertainment provided by certain brokers to certain individuals who were employed on FMR's domestic equity trading desk during that period. FMR is in discussions with the SEC staff regarding the possible resolution of the matter, but as of period-end no final resolution has been reached.
Annual Report
Notes to Financial Statements - continued
(Amounts in thousands except ratios)
9. Other - continued
In December 2006, the Independent Trustees completed their own investigation of the matter with the assistance of independent counsel. The Independent Trustees and FMR agree that, despite the absence of proof that the Fidelity mutual funds experienced diminished execution quality as a result of the improper receipt of gifts and business entertainment, the conduct at issue was serious and is worthy of redress. Accordingly, the Independent Trustees have requested and FMR has agreed to pay $42 million to Fidelity mutual funds, plus interest to be determined at the time that payment is made. A method of allocating this payment among the funds has not yet been determined. In addition, FMR has agreed to reimburse related legal expenses. The total payment to the Fund is not anticipated to have a material impact on the Fund's net assets.
10. Distributions to Shareholders.
Distributions to shareholders of each class were as follows:
Years ended October 31, | 2006 | 2005 |
From net investment income | | |
Class A | $ 38 | $ - |
Class T | 18 | - |
Class B | 3 | - |
Class C | 8 | - |
International Discovery | 41,152 | 12,813 |
Institutional Class | 105 | - |
Total | $ 41,324 | $ 12,813 |
From net realized gain | | |
Class A | $ 173 | $ - |
Class T | 102 | - |
Class B | 40 | - |
Class C | 94 | - |
International Discovery | 188,890 | 10,250 |
Institutional Class | 445 | - |
Total | $ 189,744 | $ 10,250 |
Annual Report
11. Share Transactions.
Transactions for each class of shares were as follows:
| Shares | Dollars |
Years ended October 31, | 2006 | 2005 A | 2006 | 2005 A |
Class A | | | | |
Shares sold | 3,952 | 62 | $ 133,777 | $ 1,786 |
Reinvestment of distributions | 5 | - | 160 | - |
Shares redeemed | (183) | (1) | (6,217) | (30) |
Net increase (decrease) | 3,774 | 61 | $ 127,720 | $ 1,756 |
Class T | | | | |
Shares sold | 248 | 63 | $ 8,469 | $ 1,829 |
Reinvestment of distributions | 4 | - | 112 | - |
Shares redeemed | (36) | (2) | (1,223) | (58) |
Net increase (decrease) | 216 | 61 | $ 7,358 | $ 1,771 |
Class B | | | | |
Shares sold | 112 | 27 | $ 3,875 | $ 759 |
Reinvestment of distributions | 1 | - | 37 | - |
Shares redeemed | (14) | (2) | (489) | (53) |
Net increase (decrease) | 99 | 25 | $ 3,423 | $ 706 |
Class C | | | | |
Shares sold | 130 | 63 | $ 4,409 | $ 1,805 |
Reinvestment of distributions | 1 | - | 41 | - |
Shares redeemed | (32) | - | (1,088) | (1) |
Net increase (decrease) | 99 | 63 | $ 3,362 | $ 1,804 |
International Discovery | | | | |
Shares sold | 123,095 | 73,475 | $ 4,201,412 | $ 2,106,762 |
Reinvestment of distributions | 7,089 | 781 | 215,944 | 21,434 |
Shares redeemed | (39,365) | (32,072) | (1,334,783) | (909,132) |
Net increase (decrease) | 90,819 | 42,184 | $ 3,082,573 | $ 1,219,064 |
Institutional Class | | | | |
Shares sold | 512 | 365 | $ 17,352 | $ 10,479 |
Reinvestment of distributions | 4 | - | 121 | - |
Shares redeemed | (61) | (48) | (2,086) | (1,416) |
Net increase (decrease) | 455 | 317 | $ 15,387 | $ 9,063 |
A Share transactions for Class A, T, B, C and Institutional Class are for the period January 6, 2005 (commencement of sale of shares) to
October 31, 2005.
Annual Report
Report of Independent Registered Public Accounting Firm
To the Trustees of Fidelity Investment Trust and the Shareholders of Fidelity International Discovery Fund:
In our opinion, the accompanying statement of assets and liabilities, including the schedule of investments, and the related statements of operations and of changes in net assets and the financial highlights present fairly, in all material respects, the financial position of Fidelity International Discovery Fund (a fund of Fidelity Investment Trust) at October 31, 2006, the results of its operations for the year then ended, the changes in its net assets for each of the two years in the period then ended and the financial highlights for each of the periods indicated, in conformity with accounting principles generally accepted in the United States of America. These financial statements and financial highlights (hereafter referred to as "financial statements") are the responsibility of the Fidelity International Discovery Fund's management. Our responsibility is to express an opinion on these financial statements based on our audits. We conducted our audits of these financial statements in accordance with the standards of the Public Company Accounting Oversight Board (United States). Those standards require that we plan and perform the audit to obtain reasonable assurance about whether the financial statements are free of material misstatement. An audit includes examining, on a test basis, evidence supporting the amounts and disclosures in the financial statements, assessing the accounting principles used and significant estimates made by management, and evaluating the overall financial statement presentation. We believe that our audits, which included confirmation of securities at October 31, 2006 by correspondence with the custodian and brokers, provide a reasonable basis for our opinion.
/s/PricewaterhouseCoopers LLP
PricewaterhouseCoopers LLP
Boston, Massachusetts
December 21, 2006
Annual Report
Trustees and Officers
The Trustees, Members of the Advisory Board, and executive officers of the trust and fund, as applicable, are listed below. The Board of Trustees governs the fund and is responsible for protecting the interests of shareholders. The Trustees are experienced executives who meet periodically throughout the year to oversee the fund's activities, review contractual arrangements with companies that provide services to the fund, and review the fund's performance. Except for William O. McCoy, each of the Trustees oversees 348 funds advised by FMR or an affiliate. Mr. McCoy oversees 350 funds advised by FMR or an affiliate.
The Trustees hold office without limit in time except that (a) any Trustee may resign; (b) any Trustee may be removed by written instrument, signed by at least two-thirds of the number of Trustees prior to such removal; (c) any Trustee who requests to be retired or who has become incapacitated by illness or injury may be retired by written instrument signed by a majority of the other Trustees; and (d) any Trustee may be removed at any special meeting of shareholders by a two-thirds vote of the outstanding voting securities of the trust. Each Trustee who is not an interested person (as defined in the 1940 Act) (Independent Trustee), shall retire not later than the last day of the calendar year in which his or her 72nd birthday occurs. The Independent Trustees may waive this mandatory retirement age policy with respect to individual Trustees. The executive officers and Advisory Board Members hold office without limit in time, except that any officer and Advisory Board Member may resign or may be removed by a vote of a majority of the Trustees at any regular meeting or any special meeting of the Trustees. Except as indicated, each individual has held the office shown or other offices in the same company for the past five years.
The fund's Statement of Additional Information (SAI) includes more information about the Trustees. To request a free copy, call Fidelity at 1-877-208-0098.
Interested Trustees*:
Correspondence intended for each Trustee who is an interested person may be sent to Fidelity Investments, 82 Devonshire Street, Boston, Massachusetts 02109.
Name, Age; Principal Occupation |
Edward C. Johnson 3d (76) |
| Year of Election or Appointment: 1984 Mr. Johnson is Chairman of the Board of Trustees. Mr. Johnson serves as President (2006-present), Chief Executive Officer, Chairman, and a Director of FMR Corp.; Chairman and a Director of FMR; Chairman and a Director of Fidelity Research & Analysis Company (FRAC); Chairman and a Director of Fidelity Investments Money Management, Inc.; and Chairman (2001-present) and a Director of FMR Co., Inc. In addition, Mr. Johnson serves as Chairman and Director of Fidelity International Limited (FIL). |
Stephen P. Jonas (53) |
| Year of Election or Appointment: 2005 Mr. Jonas is Senior Vice President of the fund (2005-present). He also serves as Senior Vice President of other Fidelity funds (2005-present). Mr. Jonas is Executive Director of FMR (2005-present) and FMR Co., Inc. (2005-present). He also serves as a Director of Fidelity Investments Money Management, Inc. (2005-present) and FMR Corp. (2003- present). Previously, Mr. Jonas served as President of Fidelity Enterprise Operations and Risk Services (2004-2005), Chief Administrative Officer (2002-2004), and Chief Financial Officer of FMR Corp. (1998-2002). In addition, he serves on the Boards of Boston Ballet (2003-present) and Simmons College (2003-present). |
Robert L. Reynolds (54) |
| Year of Election or Appointment: 2003 Mr. Reynolds is President and a Director of FMR (2005-present), Fidelity Investments Money Management, Inc. (2005-present), and FMR Co., Inc. (2005-present). Mr. Reynolds also serves as Vice Chairman (2006-present), a Director (2003-present), and Chief Operating Officer of FMR Corp. and a Director of Strategic Advisers, Inc. (2005-present). He also serves on the Board at Fidelity Investments Canada, Ltd. |
* Trustees have been determined to be "Interested Trustees" by virtue of, among other things, their affiliation with the trust or various entities under common control with FMR.
Annual Report
Independent Trustees:
Correspondence intended for each Independent Trustee (that is, the Trustees other than the Interested Trustees) may be sent to Fidelity Investments, P.O. Box 55235, Boston, Massachusetts 02205-5235.
Name, Age; Principal Occupation |
Dennis J. Dirks (58) |
| Year of Election or Appointment: 2005 Prior to his retirement in May 2003, Mr. Dirks was Chief Operating Officer and a member of the Board of The Depository Trust & Clearing Corporation (DTCC) (1999-2003). He also served as President, Chief Operating Officer, and Board member of The Depository Trust Company (DTC) (1999-2003) and President and Board member of the National Securities Clearing Corporation (NSCC) (1999-2003). In addition, Mr. Dirks served as Chief Executive Officer and Board member of the Government Securities Clearing Corporation (2001- 2003) and Chief Executive Officer and Board member of the Mortgage-Backed Securities Clearing Corporation (2001-2003). Mr. Dirks also serves as a Trustee and a member of the Finance Committee of Manhattan College (2005-present) and a Trustee and a member of the Finance Committee of AHRC of Nassau County (2006-present). |
Albert R. Gamper, Jr. (64) |
| Year of Election or Appointment: 2006 Prior to his retirement in December 2004, Mr. Gamper served as Chairman of the Board of CIT Group Inc. (commercial finance). During his tenure with CIT Group Inc. Mr. Gamper served in numerous senior management positions, including Chairman (1987-1989; 1999-2001; 2002-2004), Chief Executive Officer (1987-2004), and President (1989-2002). He currently serves as a member of the Board of Directors of Public Service Enterprise Group (utilities, 2001-present), Chairman of the Board of Governors, Rutgers University (2004-present), and Chairman of the Board of Saint Barnabas Health Care System. |
George H. Heilmeier (70) |
| Year of Election or Appointment: 2004 Dr. Heilmeier is Chairman Emeritus of Telcordia Technologies (communication software and systems), where prior to his retirement, he served as company Chairman and Chief Executive Officer. He currently serves on the Boards of Directors of The Mitre Corporation (systems engineering and information technology support for the government), and HRL Laboratories (private research and development, 2004-present). He is Chairman of the General Motors Science & Technology Advisory Board and a Life Fellow of the Institute of Electrical and Electronics Engineers (IEEE). Dr. Heilmeier is a member of the Defense Science Board and the National Security Agency Advisory Board. He is also a member of the National Academy of Engineering, the American Academy of Arts and Sciences, and the Board of Overseers of the School of Engineering and Applied Science of the University of Pennsylvania. Previously, Dr. Heilmeier served as a Director of TRW Inc. (automotive, space, defense, and information technology, 1992-2002), Compaq (1994-2002), Automatic Data Processing, Inc. (ADP) (technology-based business outsourcing, 1995-2002), INET Technologies Inc. (telecommunications network surveillance, 2001-2004), and Teletech Holdings (customer management services). He is the recipient of the 2005 Kyoto Prize in Advanced Technology for his invention of the liquid crystal display, and a member of the Consumer Electronics Hall of Fame. |
Marie L. Knowles (60) |
| Year of Election or Appointment: 2001 Prior to Ms. Knowles' retirement in June 2000, she served as Executive Vice President and Chief Financial Officer of Atlantic Richfield Company (ARCO) (diversified energy, 1996-2000). From 1993 to 1996, she was a Senior Vice President of ARCO and President of ARCO Transportation Company. She served as a Director of ARCO from 1996 to 1998. She currently serves as a Director of Phelps Dodge Corporation (copper mining and manufacturing) and McKesson Corporation (healthcare service, 2002-present). Ms. Knowles is a Trustee of the Brookings Institution and the Catalina Island Conservancy and also serves as a member of the Advisory Board for the School of Engineering of the University of Southern California. |
Ned C. Lautenbach (62) |
| Year of Election or Appointment: 2000 Mr. Lautenbach is Chairman of the Independent Trustees (2006-present). Mr. Lautenbach has been a partner of Clayton, Dubilier & Rice, Inc. (private equity investment firm) since September 1998. Previously, Mr. Lautenbach was with the International Business Machines Corporation (IBM) from 1968 until his retirement in 1998. Mr. Lautenbach serves as a Director of Sony Corporation (2006-present) and Eaton Corporation (diversified industrial) as well as the Philharmonic Center for the Arts in Naples, Florida. He also is a member of the Board of Trustees of Fairfield University (2005-present), as well as a member of the Council on Foreign Relations. |
William O. McCoy (73) |
| Year of Election or Appointment: 1997 Prior to his retirement in December 1994, Mr. McCoy was Vice Chairman of the Board of BellSouth Corporation (telecommunications) and President of BellSouth Enterprises. He is currently a Director of Duke Realty Corporation (real estate). He is also a partner of Franklin Street Partners (private investment management firm). In addition, Mr. McCoy served as the Interim Chancellor (1999-2000) and a member of the Board of Visitors for the University of North Carolina at Chapel Hill and currently serves as Chairman of the Board of Directors of the University of North Carolina Health Care System. He also served as Vice President of Finance for the University of North Carolina (16-school system). |
Cornelia M. Small (62) |
| Year of Election or Appointment: 2005 Ms. Small is a member (2000-present) and Chairperson (2002-present) of the Investment Committee, and a member (2002-present) of the Board of Trustees of Smith College. Previously, she served as Chief Investment Officer (1999-2000), Director of Global Equity Investments (1996-1999), and a member of the Board of Directors of Scudder, Stevens & Clark (1990-1997) and Scudder Kemper Investments (1997-1999). In addition, Ms. Small served as Co-Chair (2000-2003) of the Annual Fund for the Fletcher School of Law and Diplomacy. |
William S. Stavropoulos (67) |
| Year of Election or Appointment: 2001 Mr. Stavropoulos is Chairman Emeritus of the Board of Directors of The Dow Chemical Company. Since joining The Dow Chemical Company in 1967, Mr. Stavropoulos served in numerous senior management positions, including President (1993-2000; 2002-2003), CEO (1995-2000; 2002-2004), and Chairman of the Executive Committee (2000-2004). Currently, he is a Director of NCR Corporation (data warehousing and technology solutions), BellSouth Corporation (telecommunications), Chemical Financial Corporation, Maersk Inc. (industrial conglomerate, 2002-present), and Metalmark Capital (private equity investment firm, 2005-present). He also serves as a member of the Board of Trustees of the American Enterprise Institute for Public Policy Research. In addition, Mr. Stavropoulos is a member of The Business Council, J.P. Morgan International Council and the University of Notre Dame Advisory Council for the College of Science. |
Kenneth L. Wolfe (67) |
| Year of Election or Appointment: 2005 Prior to his retirement in 2001, Mr. Wolfe was Chairman and Chief Executive Officer of Hershey Foods Corporation (1993-2001). He currently serves as a member of the boards of Adelphia Communications Corporation (2003-present), Bausch & Lomb, Inc., and Revlon Inc. (2004-present). |
Annual Report
Advisory Board Members and Executive Officers:
Correspondence intended for Mr. Keyes may be sent to Fidelity Investments, P.O. Box 55235, Boston, Massachusetts 02205-5235. Correspondence intended for each executive officer and Mr. Lynch may be sent to Fidelity Investments, 82 Devonshire Street, Boston, Massachusetts 02109.
Name, Age; Principal Occupation |
James H. Keyes (66) |
| Year of Election or Appointment: 2006 Member of the Advisory Board of Fidelity Investment Trust. Prior to his retirement in 2003, Mr. Keyes was Chairman, President, and Chief Executive Officer of Johnson Controls, Inc. (automotive supplier, 1993-2003). He currently serves as a member of the boards of LSI Logic Corporation (semiconductor technologies), Navistar International Corporation (manufacture and sale of trucks, buses, and diesel engines, 2002-present), and Pitney Bowes, Inc. (integrated mail, messaging, and document management solutions). |
Peter S. Lynch (62) |
| Year of Election or Appointment: 2003 Member of the Advisory Board of Fidelity Investment Trust. Mr. Lynch is Vice Chairman and a Director of FMR, and Vice Chairman (2001- present) and a Director of FMR Co., Inc. Previously, Mr. Lynch served as a Trustee of the Fidelity funds (1990-2003). In addition, he serves as a Trustee of Boston College and as the Chairman of the Inner-City Scholarship Fund. |
Dwight D. Churchill (52) |
| Year of Election or Appointment: 2005 Vice President of the fund. Mr. Churchill also serves as Vice President of certain Equity Funds (2005-present). Mr. Churchill is Executive Vice President of FMR (2005-present) and FMR Co., Inc. (2005-present). Previously, Mr. Churchill served as Senior Vice President of Fidelity Investments Money Management, Inc. (2005-2006), Head of Fidelity's Fixed-Income Division (2000-2005), Vice President of Fidelity's Money Market Funds (2000-2005), Vice President of Fidelity's Bond Funds, and Senior Vice President of FMR. |
Eric M. Wetlaufer (44) |
| Year of Election or Appointment: 2006 Vice President of the fund. Mr. Wetlaufer also serves as Vice President of certain International Equity Funds (2006-present). Mr. Wetlaufer is Senior Vice President of FMR (2006-present) and FMR Co., Inc. (2006-present), and President and Director of Fidelity Management & Research (U.K.) Inc. (2006-present) and Fidelity Research & Analysis Company (2006-present). Before joining Fidelity Investments in 2005, Mr. Wetlaufer was a partner in Oxhead Capital Management (2004-2005). Previously, Mr. Wetlaufer served as a Chief Investment Officer of Putnam Investments (1997-2003). |
William Kennedy (38) |
| Year of Election or Appointment: 2004 Vice President of the fund. Mr. Kennedy also serves as Vice President of other funds advised by FMR. Prior to assuming his current responsibilities, Mr. Kennedy worked as a research analyst and a portfolio manager. Mr. Kennedy also serves as a Vice President of FMR (2000) and FMR Co., Inc. (2001). |
Eric D. Roiter (57) |
| Year of Election or Appointment: 1998 Secretary of the fund. He also serves as Secretary of other Fidelity funds; Vice President, General Counsel, and Secretary of FMR Co., Inc. (2001-present) and FMR; Assistant Secretary of Fidelity Management & Research (U.K.) Inc. (2001-present), Fidelity Research & Analysis Company (2001-present), and Fidelity Investments Money Management, Inc. (2001-present). Mr. Roiter is an Adjunct Member, Faculty of Law, at Boston College Law School (2003-present). Previously, Mr. Roiter served as Vice President and Secretary of Fidelity Distributors Corporation (FDC) (1998-2005). |
Stuart Fross (47) |
| Year of Election or Appointment: 2003 Assistant Secretary of the fund. Mr. Fross also serves as Assistant Secretary of other Fidelity funds (2003-present), Vice President and Secretary of FDC (2005-present), and is an employee of FMR. |
Christine Reynolds (48) |
| Year of Election or Appointment: 2004 President and Treasurer of the fund. Ms. Reynolds also serves as President and Treasurer of other Fidelity funds (2004-present) and is a Vice President (2003-present) and an employee (2002-present) of FMR. Before joining Fidelity Investments, Ms. Reynolds worked at PricewaterhouseCoopers LLP (PwC) (1980-2002), where she was most recently an audit partner with PwC's investment management practice. |
R. Stephen Ganis (40) |
| Year of Election or Appointment: 2006 Anti-Money Laundering (AML) officer of the fund. Mr. Ganis also serves as AML officer of other Fidelity funds (2006-present) and FMR Corp. (2003-present). Before joining Fidelity Investments, Mr. Ganis practiced law at Goodwin Procter, LLP (2000-2002). |
Joseph B. Hollis (58) |
| Year of Election or Appointment: 2006 Chief Financial Officer of the fund. Mr. Hollis also serves as Chief Financial Officer of other Fidelity funds. Mr. Hollis is President of Fidelity Pricing and Cash Management Services (FPCMS) (2005-present). Mr. Hollis also serves as President and Director of Fidelity Service Company, Inc. (2006-present). Previously, Mr. Hollis served as Senior Vice President of Cash Management Services (1999-2002) and Investment Management Operations (2002-2005). |
Kenneth A. Rathgeber (59) |
| Year of Election or Appointment: 2004 Chief Compliance Officer of the fund. Mr. Rathgeber also serves as Chief Compliance Officer of other Fidelity funds (2004-present) and Executive Vice President of Risk Oversight for Fidelity Investments (2002-present). He is Chief Compliance Officer of FMR (2005-present), FMR Co., Inc. (2005-present), Fidelity Management & Research (U.K.) Inc. (2005-present), Fidelity Research & Analysis Company (2005- present), Fidelity Investments Money Management, Inc. (2005-present), and Strategic Advisers, Inc. (2005-present). Previously, Mr. Rathgeber served as Executive Vice President and Chief Operating Officer for Fidelity Investments Institutional Services Company, Inc. (1998-2002). |
Bryan A. Mehrmann (45) |
| Year of Election or Appointment: 2005 Deputy Treasurer of the fund. Mr. Mehrmann also serves as Deputy Treasurer of other Fidelity funds (2005-present) and is an employee of FMR. Previously, Mr. Mehrmann served as Vice President of Fidelity Investments Institutional Services Group (FIIS)/Fidelity Investments Institutional Operations Corporation, Inc. (FIIOC) Client Services (1998-2004). |
Kimberley H. Monasterio (42) |
| Year of Election or Appointment: 2004 Deputy Treasurer of the fund. Ms. Monasterio also serves as Deputy Treasurer of other Fidelity funds (2004) and is an employee of FMR (2004). Before joining Fidelity Investments, Ms. Monasterio served as Treasurer (2000-2004) and Chief Financial Officer (2002-2004) of the Franklin Templeton Funds and Senior Vice President of Franklin Templeton Services, LLC (2000-2004). |
Kenneth B. Robins (37) |
| Year of Election or Appointment: 2005 Deputy Treasurer of the fund. Mr. Robins also serves as Deputy Treasurer of other Fidelity funds (2005-present) and is an employee of FMR (2004-present). Before joining Fidelity Investments, Mr. Robins worked at KPMG LLP, where he was a partner in KPMG's department of professional practice (2002-2004) and a Senior Manager (1999-2000). In addition, Mr. Robins served as Assistant Chief Accountant, United States Securities and Exchange Commission (2000-2002). |
Robert G. Byrnes (39) |
| Year of Election or Appointment: 2005 Assistant Treasurer of the fund. Mr. Byrnes also serves as Assistant Treasurer of other Fidelity funds (2005-present) and is an employee of FMR (2005-present). Previously, Mr. Byrnes served as Vice President of FPCMS (2003-2005). Before joining Fidelity Investments, Mr. Byrnes worked at Deutsche Asset Management where he served as Vice President of the Investment Operations Group (2000-2003). |
John H. Costello (60) |
| Year of Election or Appointment: 1986 Assistant Treasurer of the fund. Mr. Costello also serves as Assistant Treasurer of other Fidelity funds and is an employee of FMR. |
Peter L. Lydecker (52) |
| Year of Election or Appointment: 2004 Assistant Treasurer of the fund. Mr. Lydecker also serves as Assistant Treasurer of other Fidelity funds (2004) and is an employee of FMR. |
Mark Osterheld (51) |
| Year of Election or Appointment: 2002 Assistant Treasurer of the fund. Mr. Osterheld also serves as Assistant Treasurer of other Fidelity funds (2002) and is an employee of FMR. |
Gary W. Ryan (48) |
| Year of Election or Appointment: 2005 Assistant Treasurer of the fund. Mr. Ryan also serves as Assistant Treasurer of other Fidelity funds (2005-present) and is an employee of FMR (2005-present). Previously, Mr. Ryan served as Vice President of Fund Reporting in FPCMS (1999-2005). |
Salvatore Schiavone (40) |
| Year of Election or Appointment: 2005 Assistant Treasurer of the fund. Mr. Schiavone also serves as Assistant Treasurer of other Fidelity funds (2005-present) and is an employee of FMR (2005-present). Before joining Fidelity Investments, Mr. Schiavone worked at Deutsche Asset Management, where he most recently served as Assistant Treasurer (2003-2005) of the Scudder Funds and Vice President and Head of Fund Reporting (1996-2003). |
Annual Report
Distributions
The Board of Trustees of Advisor International Discovery voted to pay to shareholders of record at the opening of business on record date, the following distributions per share derived from capital gains realized from sales of portfolio securities, and dividends derived from net investment income:
| Pay Date | Record Date | Dividends | Capital Gains |
Institutional Class | 12/04/06 | 12/01/06 | $0.401 | $0.98 |
The fund hereby designates as a capital gain dividend with respect to the taxable year ended October 31, 2006, $165,476,023, or, if subsequently determined to be different, the net capital gain of such year.
Class Institutional designates 43% of the dividends distributed during the fiscal year as amounts which may be taken into account as a dividend for purposes of the maximum rate under section 1(h)(11) of the Internal Revenue Code.
The amounts per share which represent income derived from sources within, and taxes paid to, foreign countries or possessions of the United States are as follows:
| Pay Date | Income | Taxes |
Institutional Class | 12/05/2005 | $.337 | $.03 |
The fund will notify shareholders in January 2007 of amounts for use in preparing 2006 income tax returns.
Annual Report
Board Approval of Investment Advisory Contracts and Management Fees
Fidelity International Discovery Fund
Each year, typically in July, the Board of Trustees, including the Independent Trustees (together, the Board), votes on the renewal of the management contract and sub-advisory agreements (together, the Advisory Contracts) for the fund. The Board, assisted by the advice of fund counsel and Independent Trustees' counsel, requests and considers a broad range of information throughout the year.
The Board meets regularly each month except August and takes into account throughout the year matters bearing on Advisory Contracts. The Board, acting directly and through its separate committees, considers at each of its meetings factors that are relevant to the annual renewal of the fund's Advisory Contracts, including the services and support provided to the fund and its shareholders. At the time of the renewal, the Board had 12 standing committees, each composed of Independent Trustees with varying backgrounds, to which the Board has assigned specific subject matter responsibilities in order to enhance effective decision-making by the Board. Each committee has adopted a written charter outlining the structure and purposes of the committee. One such committee, the Equity Contract Committee, meets periodically as needed throughout the year to consider matters specifically related to the annual renewal of Advisory Contracts. The committee requests and receives information on, and makes recommendations to the Independent Trustees concerning, the approval and annual review of the Advisory Contracts.
At its July 2006 meeting, the Board of Trustees, including the Independent Trustees, unanimously determined to renew the Advisory Contracts for the fund. In reaching its determination, the Board considered all factors it believed relevant, including (i) the nature, extent, and quality of the services to be provided to the fund and its shareholders (including the investment performance of the fund); (ii) the competitiveness of the management fee and total expenses of the fund; (iii) the total costs of the services to be provided by and the profits to be realized by the investment adviser and its affiliates from the relationship with the fund; (iv) the extent to which economies of scale would be realized as the fund grows; and (v) whether fee levels reflect these economies of scale, if any, for the benefit of fund shareholders.
In determining whether to renew the Advisory Contracts for the fund, the Board ultimately reached a determination, with the assistance of fund counsel and Independent Trustees' counsel, that the renewal of the Advisory Contracts and the compensation to be received by Fidelity under the management contract is consistent with Fidelity's fiduciary duty under applicable law. In addition to evaluating the specific factors noted above, the Board, in reaching its determination, is aware that shareholders in the fund have a broad range of investment choices available to them, including a wide choice among mutual funds offered by competitors to Fidelity, and that the fund's shareholders, with the opportunity to review and weigh the disclosure provided by the fund in its prospectus and other public disclosures, have chosen to invest in this fund, managed by Fidelity.
Annual Report
Board Approval of Investment Advisory Contracts and
Management Fees - continued
Nature, Extent, and Quality of Services Provided. The Board considered staffing within the investment adviser, FMR, and the sub-advisers (together, the Investment Advisers), including the background of the fund's portfolio manager and the fund's investment objective and discipline. The Independent Trustees also had discussions with senior management of Fidelity's investment operations and investment groups. The Board considered the structure of the portfolio manager compensation program and whether this structure provides appropriate incentives.
Resources Dedicated to Investment Management and Support Services. The Board reviewed the size, education, and experience of the Investment Advisers' investment staff, their use of technology, and the Investment Advisers' approach to recruiting, training, and retaining portfolio managers and other research, advisory, and management personnel. The Board considered Fidelity's extensive global research capabilities that enable the Investment Advisers to aggregate data from various sources in an effort to produce positive investment results. The Board noted that Fidelity's analysts have access to a variety of technological tools that enable them to perform both fundamental and quantitative analysis and to specialize in various disciplines. The Board also considered that Fidelity's portfolio managers and analysts have access to daily portfolio attribution that allows for monitoring of a fund's portfolio, as well as an electronic communication system that provides immediate real-time access to research concerning issuers and credit enhancers.
Shareholder and Administrative Services. The Board considered (i) the nature, extent, quality, and cost of administrative, distribution, and shareholder services performed by the Investment Advisers and their affiliates under the Advisory Contracts and under separate agreements covering transfer agency, pricing and bookkeeping, and securities lending services for the fund; (ii) the nature and extent of the Investment Advisers' supervision of third party service providers, principally custodians and subcustodians; and (iii) the resources devoted to, and the record of compliance with, the fund's compliance policies and procedures. The Board reviewed the allocation of fund brokerage, including allocations to brokers affiliated with the Investment Advisers, the use of brokerage commissions to pay fund expenses, and the use of "soft" commission dollars to pay for research services. The Board also considered that Fidelity voluntarily pays for market data out of its own resources.
The Board noted that the growth of fund assets across the complex allows Fidelity to reinvest in the development of services designed to enhance the value or convenience of the Fidelity funds as investment vehicles. These services include 24-hour access to account information and market information through phone representatives and over the Internet, and investor education materials and asset allocation tools.
Annual Report
Investment in a Large Fund Family. The Board considered the benefits to shareholders of investing in a Fidelity fund, including the benefits of investing in a fund that is part of a large family of funds offering a variety of investment disciplines and providing for a large variety of mutual fund investor services. For example, fund shareholders are offered the privilege of exchanging shares of the fund for shares of other Fidelity funds, as set forth in the fund's prospectus, without paying an additional sales charge. The Board noted that, since the last Advisory Contract renewals in July 2005, Fidelity has taken a number of actions that benefited particular funds, including (i) dedicating additional resources to investment research and to restructure the investment research teams; (ii) voluntarily entering into contractual arrangements with certain brokers pursuant to which Fidelity pays for research products and services separately out of its own resources, rather than bundling with fund commissions; (iii) launching the Fidelity Advantage Class of its five Spartan stock index funds and three Spartan bond index funds, which is a lower-fee class available to shareholders with higher account balances; (iv) contractually agreeing to impose expense limitations on Fidelity U.S. Bond Index Fund and reducing the fund's initial investment minimum; and (v) offering shareholders of each of the Fidelity Institutional Money Market Funds the privilege of exchanging shares of the fund for shares of other Fidelity funds.
Investment Performance and Compliance. The Board considered whether the fund has operated within its investment objective, as well as its record of compliance with its investment restrictions. It also reviewed the fund's absolute investment performance for Fidelity International Discovery (retail class), as well as the fund's relative investment performance for Fidelity International Discovery (retail class) measured against (i) a broad-based securities market index, and (ii) a peer group of mutual funds deemed appropriate by the Board over multiple periods. The following charts considered by the Board show, over the one-, three-, and five-year periods ended December 31, 2005, the cumulative total returns of Fidelity International Discovery (retail class), the cumulative total returns of a broad-based securities market index ("benchmark"), and a range of cumulative total returns of a peer group of mutual funds identified by Lipper Inc. as having an investment objective similar to that of the fund. (The Advisor classes of the fund had less than one year of performance as of December 31, 2005.) The box within each chart shows the 25th percentile return (bottom of box) and the 75th percentile return (top of box) of the Lipper peer group. Returns shown above the box are in the first quartile and returns shown below the box are in the fourth quartile. The percentage beaten numbers noted below each chart correspond to the percentile box and represent the percentage of funds in the Lipper peer group whose performance was equal to or lower than that of Fidelity International Discovery (retail class).
Annual Report
Board Approval of Investment Advisory Contracts and
Management Fees - continued
Fidelity International Discovery Fund

The Board reviewed the fund's relative investment performance against its Lipper peer group and stated that the performance of Fidelity International Discovery (retail class) was in the first quartile for all the periods shown. The Board also stated that the relative investment performance of Fidelity International Discovery (retail class) compared favorably to its benchmark for all the periods shown. The Board also reviewed the fund's relative investment performance against a peer group defined by Morningstar.
The Board also considered that the fund's management fee is subject to upward or downward adjustment depending upon whether, and to what extent, the fund's investment performance for the performance period exceeds, or is exceeded by, the record (over the same period) of a Board-approved performance adjustment index. The Board realizes that the performance adjustment provides FMR with a strong economic incentive to seek to achieve superior performance for the fund's shareholders and helps to more closely align the interests of FMR and the fund's shareholders.
The Board considered that FMR has taken steps to refocus and strengthen equity research, equity portfolio management, and compliance. The Board noted with favor FMR's reorganization of its senior management team in 2005 and FMR's dedication of additional resources to investment research, and participated in the process that led to those changes.
Based on its review, and giving particular weight to the nature and quality of the resources dedicated by the Investment Advisers to maintain and improve relative performance, the Board concluded that the nature, extent, and quality of the services provided to the fund will benefit the fund's shareholders, particularly in light of the Board's view that the fund's shareholders benefit from investing in a fund that is part of a large family of funds offering a variety of investment disciplines and services.
Annual Report
Competitiveness of Management Fee and Total Fund Expenses. The Board considered the fund's management fee and total expenses compared to "mapped groups" of competitive funds and classes. Fidelity creates "mapped groups" by combining similar Lipper investment objective categories that have comparable management fee characteristics. Combining Lipper investment objective categories aids the Board's management fee and total expense comparisons by broadening the competitive group used for comparison and by reducing the number of universes to which various Fidelity funds are compared.
The Board considered two proprietary management fee comparisons for the 12-month periods shown in the chart below. The group of Lipper funds used by the Board for management fee comparisons is referred to below as the "Total Mapped Group" and, for the reasons explained above, is broader than the Lipper peer group used by the Board for performance comparisons. The Total Mapped Group comparison focuses on a fund's standing relative to the total universe of comparable funds available to investors, in terms of gross management fees before expense reimbursements or caps, and without giving effect to the fund's performance adjustment. "TMG %" represents the percentage of funds in the Total Mapped Group that had management fees that were lower than the fund's. For example, a TMG % of 13% means that 87% of the funds in the Total Mapped Group had higher management fees than the fund. The "Asset-Size Peer Group" (ASPG) comparison focuses on a fund's standing relative to non-Fidelity funds similar in size to the fund within the Total Mapped Group. The ASPG represents at least 15% of the funds in the Total Mapped Group with comparable asset size and management fee characteristics, subject to a minimum of 50 funds (or all funds in the Total Mapped Group if fewer than 50). Additional information, such as the ASPG quartile in which the fund's management fee ranked and the impact of the fund's performance adjustment, is also included in the chart and considered by the Board.
Annual Report
Board Approval of Investment Advisory Contracts and
Management Fees - continued
Fidelity International Discovery Fund

The Board noted that the fund's management fee ranked below the median of its Total Mapped Group and below the median of its ASPG for 2005. The Board also noted the effect of the fund's positive performance adjustment on the fund's management fee ranking. The Board noted that the performance adjustment for 2005 represents calculations for rolling 36-month periods that differ from the periods shown in the performance charts above.
Based on its review, the Board concluded that the fund's management fee was fair and reasonable in light of the services that the fund receives and the other factors considered.
In its review of each class's total expenses, the Board considered the fund's management fee as well as other fund or class expenses, as applicable, such as transfer agent fees, pricing and bookkeeping fees, fund-paid 12b-1 fees, and custodial, legal, and audit fees. The Board also noted the effects of any waivers and reimbursements on fees and expenses, as well as the fund's positive performance adjustment. As part of its review, the Board also considered current and historical total expenses of each class of the fund compared to competitive fund median expenses. Each class of the fund is compared to those funds and classes in the Total Mapped Group (used by the Board for management fee comparisons) that have a similar sales load structure.
The Board noted that the total expenses of each of Class A, Class B, Class C, Institutional Class and Fidelity International Discovery (retail class) ranked below its competitive median for 2005, and the total expenses of Class T ranked above its competitive median for 2005. The Board noted that the fund offers multiple classes, each of which has a different sales load and 12b-1 fee structure, and that the multiple structures are intended to offer a range of pricing options for the intermediary market. The Board also noted that the total expenses of the classes vary primarily by the level of their 12b-1 fees, although differences in transfer agent fees may also cause expenses to vary from class to class.
Annual Report
In its review of total expenses, the Board also considered Fidelity fee structures and other information on clients that FMR and its affiliates service in other competitive markets, such as other mutual funds advised or subadvised by FMR or its affiliates, pension plan clients, and other institutional clients.
Based on its review, the Board concluded that the total expenses of each class of the fund were reasonable, although in one case above the median of the universe presented for comparison, in light of the services that the fund and its shareholders receive and the other factors considered.
Costs of the Services and Profitability. The Board considered the revenues earned and the expenses incurred by Fidelity in conducting the business of developing, marketing, distributing, managing, administering and servicing the fund and its shareholders. The Board also considered the level of Fidelity's profits in respect of all the Fidelity funds.
On an annual basis, FMR presents to the Board Fidelity's profitability for the fund. Fidelity calculates the profitability for each fund, as well as aggregate profitability for groups of Fidelity funds and all Fidelity funds, using a series of detailed revenue and cost allocation methodologies which originate with the audited books and records of Fidelity. The Audit Committee of the Board reviews any significant changes from the prior year's methodologies.
PricewaterhouseCoopers LLP (PwC), independent registered accounting firm and auditor to Fidelity and certain Fidelity funds, has been engaged annually by the Board as part of the Board's assessment of the results of Fidelity's profitability analysis. PwC's engagement includes the review and assessment of Fidelity's methodologies used in determining the revenues and expenses attributable to Fidelity's mutual fund business, and completion of agreed-upon procedures surrounding the mathematical accuracy of fund profitability and its conformity to allocation methodologies. After considering PwC's reports issued under the engagement and information provided by Fidelity, the Board believes that while other allocation methods may also be reasonable, Fidelity's profitability methodologies are reasonable in all material respects.
The Board has also reviewed Fidelity's non-fund businesses and any fall-out benefits related to the mutual fund business as well as cases where Fidelity's affiliates may benefit from or be related to the fund's business.
The Board considered the costs of the services provided by and the profits realized by Fidelity in connection with the operation of the fund and determined that the amount of profit is a fair entrepreneurial profit for the management of the fund.
Annual Report
Board Approval of Investment Advisory Contracts and
Management Fees - continued
Economies of Scale. The Board considered whether there have been economies of scale in respect of the management of the Fidelity funds, whether the Fidelity funds (including the fund) have appropriately benefited from any such economies of scale, and whether there is potential for realization of any further economies of scale. The Board considered the extent to which the fund will benefit from economies of scale through increased services to the fund, through waivers or reimbursements, or through fee or expense reductions, including reductions that occur through operation of the transfer agent agreement. The transfer agent fee varies in part based on the number of accounts in the fund. If the number of accounts decreases or the average account size increases, the overall transfer agent fee rate decreases.
The Board recognized that the fund's management contract incorporates a "group fee" structure, which provides for lower fee rates as total fund assets under FMR's management increase, and for higher fee rates as total fund assets under FMR's management decrease. The Board considered that the group fee is designed to deliver the benefits of economies of scale to fund shareholders when total fund assets increase, even if assets of any particular fund are unchanged or have declined, because some portion of Fidelity's costs are attributable to services provided to all Fidelity funds, and all funds benefit if those costs can be allocated among more assets. The Board concluded that, given the group fee structure, fund shareholders will achieve a certain level of economies of scale as assets under FMR's management increase at the fund complex level, regardless of whether Fidelity achieves any such economies of scale.
The Board further concluded that any potential economies of scale are being shared between fund shareholders and Fidelity in an appropriate manner.
Additional Information Requested by the Board. In order to develop fully the factual basis for consideration of the Advisory Contracts, the Board requested additional information on several topics, including (i) Fidelity's fund profitability methodology and profitability trends within certain funds; (ii) portfolio manager compensation; (iii) the extent to which any economies of scale exist and are shared between the funds and Fidelity; (iv) the total expenses of certain funds and classes relative to competitors, including the extent to which the expenses of certain funds have been or could be capped; (v) fund performance trends; and (vi) Fidelity's fee structures, including use of performance fees.
Based on its evaluation of all of the conclusions noted above, and after considering all material factors, the Board ultimately concluded that the advisory fee structures are fair and reasonable, and that the fund's Advisory Contracts should be renewed.
Annual Report
Annual Report
Annual Report
Annual Report
Annual Report
Annual Report
Annual Report
Annual Report
Investment Adviser
Fidelity Management & Research Company
Boston, MA
Investment Sub-Advisers
FMR Co., Inc.
Fidelity Management & Research
(U.K.) Inc.
Fidelity Research & Analysis Company (formerly Fidelity Management & Research (Far East) Inc.)
Fidelity International
Investment Advisors
Fidelity Investments Japan Limited
Fidelity International Investment Advisors (U.K.) Limited
General Distributor
Fidelity Distributors Corporation
Boston, MA
Transfer and Service Agents
Fidelity Investments Institutional Operations Company, Inc.
Boston, MA
Fidelity Service Company, Inc.
Boston, MA
Custodian
JPMorgan Chase Bank
New York, NY
(Fidelity Investment logo)(registered trademark)
Corporate Headquarters
82 Devonshire St., Boston, MA 02109
www.fidelity.com
AIDI-UANN-1206
1.806657.101
Fidelity®
International Value
Fund
Annual Report
October 31, 2006
(2_fidelity_logos) (Registered_Trademark)
Contents
Chairman's Message | 4 | Ned Johnson's message to shareholders. |
Shareholder Expense Example | 5 | An example of shareholder expenses. |
Investment Summary | 7 | A summary of major shifts in the fund's investments over the past six months. |
Investments | 9 | A complete list of the fund's investments with their market values. |
Financial Statements | 15 | Statements of assets and liabilities, operations, and changes in net assets,
as well as financial highlights. |
Notes | 25 | Notes to the financial statements. |
Report of Independent Registered Public Accounting Firm | 34 | |
Trustees and Officers | 35 | |
Distributions | 46 | |
Board Approval of Investment Advisory Contracts and Management Fees | 47 | |
To view a fund's proxy voting guidelines and proxy voting record for the 12-month period ended June 30, visit www.fidelity.com/proxyvotingresults or visit the Securities and Exchange Commission's (SEC) web site at www.sec.gov. You may also call 1-800-544-8544 to request a free copy of the proxy voting guidelines.
Standard & Poor's, S&P and S&P 500 are registered service marks of The McGraw-Hill Companies, Inc. and have been licensed for use by Fidelity Distributors Corporation.
Other third party marks appearing herein are the property of their respective owners.
All other marks appearing herein are registered or unregistered trademarks or service marks of FMR Corp. or an affiliated company.
Annual Report
This report and the financial statements contained herein are submitted for the general information of the shareholders of the fund. This report is not authorized for distribution to prospective investors in the fund unless preceded or accompanied by an effective prospectus.
A fund files its complete schedule of portfolio holdings with the SEC for the first and third quarters of each fiscal year on Form N-Q. Forms N-Q are available on the SEC's web site at http://www.sec.gov. A fund's Forms N-Q may be reviewed and copied at the SEC's Public Reference Room in Washington, DC. Information regarding the operation of the SEC's Public Reference Room may be obtained by calling 1-800-SEC-0330. For a complete list of a fund's portfolio holdings, view the most recent quarterly holdings report, semiannual report, or annual report on Fidelity's web site at http://www.fidelity.com/holdings.
NOT FDIC INSURED · MAY LOSE VALUE · NO BANK GUARANTEE
Neither the fund nor Fidelity Distributors Corporation is a bank.
Annual Report
Chairman's Message
(photo_of_Edward_C_Johnson_3d)
Dear Shareholder:
Stock and bond markets around the world have seen largely positive results year to date, although weakness in the technology sector and growth stocks in general have tempered performance. While financial markets are always unpredictable, there are a number of time-tested principles that can put the historical odds in your favor.
One of the basic tenets is to invest for the long term. Over time, riding out the markets' inevitable ups and downs has proven much more effective than selling into panic or chasing the hottest trend. Even missing only a few of the markets' best days can significantly diminish investor returns. Patience also affords the benefits of compounding - of earning interest on additional income or reinvested dividends and capital gains. There are tax advantages and cost benefits to consider as well. The more you sell, the more taxes you pay, and the more you trade, the higher the costs. While staying the course doesn't eliminate risk, it can considerably lessen the effect of short-term declines.
You can further manage your investing risk through diversification. And today, more than ever, geographic diversification should be taken into account. Studies indicate that asset allocation is the single most important determinant of a portfolio's long-term success. The right mix of stocks, bonds and cash - aligned to your particular risk tolerance and investment objective - is very important. Age-appropriate rebalancing is also an essential aspect of asset allocation. For younger investors, an emphasis on equities - which historically have been the best performing asset class over time - is encouraged. As investors near their specific goal, such as retirement or sending a child to college, consideration may be given to replacing volatile assets (e.g. common stocks) with more-stable fixed investments (bonds or savings plans).
A third investment principle - investing regularly - can help lower the average cost of your purchases. Investing a certain amount of money each month or quarter helps ensure you won't pay for all your shares at market highs. This strategy - known as dollar cost averaging - also reduces unconstructive "emotion" from investing, helping shareholders avoid selling weak performers just prior to an upswing, or chasing a hot performer just before a correction.
We invite you to contact us via the Internet, through our Investor Centers or over the phone. It is our privilege to provide you the information you need to make the investments that are right for you.
Sincerely,
/s/Edward C. Johnson 3d
Edward C. Johnson 3d
Annual Report
Shareholder Expense Example
As a shareholder of the Fund, you incur two types of costs: (1) transaction costs, including sales charges (loads) on purchase payments or redemption proceeds, redemption fees, and (2) ongoing costs, including management fees, distribution and/or service (12b-1) fees and other Fund expenses. This Example is intended to help you understand your ongoing costs (in dollars) of investing in the Fund and to compare these costs with the ongoing costs of investing in other mutual funds.
The actual expense Example is based on an investment of $1,000 invested at the beginning of the period and held for the entire period (May 18, 2006 to October 31, 2006). The hypothetical expense Example is based on an investment of $1,000 invested for the one-half year period (May 1, 2006 to October 31, 2006).
Actual Expenses
The first line of the accompanying table for each class of the Fund provides information about actual account values and actual expenses. You may use the information in this line, together with the amount you invested, to estimate the expenses that you paid over the period. Simply divide your account value by $1,000.00 (for example, an $8,600 account value divided by $1,000.00 = 8.6), then multiply the result by the number in the first line for a class of the Fund under the heading entitled "Expenses Paid During Period" to estimate the expenses you paid on your account during this period. A small balance maintenance fee of $12.00 that is charged once a year may apply for certain accounts with a value of less than $2,000. This fee is not included in the table below. If it was, the estimate of expenses you paid during the period would be higher, and your ending account value lower, by this amount.
Hypothetical Example for Comparison Purposes
The second line of the accompanying table for each class of the Fund provides information about hypothetical account values and hypothetical expenses based on a Class' actual expense ratio and an assumed rate of return of 5% per year before expenses, which is not the Class' actual return. The hypothetical account values and expenses may not be used to estimate the actual ending account balance or expenses you paid for the period. You may use this information to compare the ongoing costs of investing in the Fund and other funds. To do so, compare this 5% hypothetical example with the 5% hypothetical examples that appear in the shareholder reports of the other funds. A small balance maintenance fee of $12.00 that is charged once a year may apply for certain accounts with a value of less than $2,000. This fee is not included in the table below. If it was, the estimate of expenses you paid during the period would be higher, and your ending account value lower, by this amount.
Annual Report
Shareholder Expense Example - continued
Please note that the expenses shown in the table are meant to highlight your ongoing costs only and do not reflect any transaction costs. Therefore, the second line of the table is useful in comparing ongoing costs only, and will not help you determine the relative total costs of owning different funds. In addition, if these transactional costs were included, your costs would have been higher.
| Beginning
Account Value | Ending
Account Value | Expenses Paid
During Period |
Class A | | | |
Actual | $ 1,000.00 | $ 1,060.00 | $ 7.07 B |
HypotheticalA | $ 1,000.00 | $ 1,017.64 | $ 7.63 C |
Class T | | | |
Actual | $ 1,000.00 | $ 1,059.00 | $ 8.24 B |
HypotheticalA | $ 1,000.00 | $ 1,016.38 | $ 8.89 C |
Class B | | | |
Actual | $ 1,000.00 | $ 1,056.00 | $ 10.58 B |
HypotheticalA | $ 1,000.00 | $ 1,013.86 | $ 11.42 C |
Class C | | | |
Actual | $ 1,000.00 | $ 1,056.00 | $ 10.58 B |
HypotheticalA | $ 1,000.00 | $ 1,013.86 | $ 11.42 C |
International Value | | | |
Actual | $ 1,000.00 | $ 1,061.00 | $ 5.89 B |
HypotheticalA | $ 1,000.00 | $ 1,018.90 | $ 6.36 C |
Institutional Class | | | |
Actual | $ 1,000.00 | $ 1,061.00 | $ 5.89 B |
HypotheticalA | $ 1,000.00 | $ 1,018.90 | $ 6.36 C |
A 5% return per year before expenses
B Actual expenses are equal to each Class' annualized expense ratio (shown in the table below); multiplied by the average account value over the period, multiplied by 167/365 (to reflect the period May 18, 2006 to October 31, 2006).
C Hypothetical expenses are equal to each Class' annualized expense ratio (shown in the table below); multiplied by the average account value over the period, multiplied by 184/365 (to reflect the one-half year period).
| Annualized
Expense Ratio |
Class A | 1.50% |
Class T | 1.75% |
Class B | 2.25% |
Class C | 2.25% |
International Value | 1.25% |
Institutional Class | 1.25% |
Annual Report
Investment Summary
Geographic Diversification (% of fund's net assets) |
As of October 31, 2006 |
 | Japan 19.9% |
 | United Kingdom 17.8% |
 | Germany 10.2% |
 | Switzerland 9.4% |
 | France 8.6% |
 | Italy 4.6% |
 | Netherlands 3.3% |
 | Canada 3.3% |
 | Norway 2.9% |
 | Other 20.0% |

Percentages are adjusted for the effect of futures contracts, if applicable. |
Asset Allocation |
| % of fund's
net assets |
Stocks | 98.0 |
Short-Term Investments and Net Other Assets | 2.0 |
Top Ten Stocks as of October 31, 2006 |
| % of fund's
net assets |
Royal Bank of Scotland Group PLC (United Kingdom, Commercial Banks) | 4.0 |
HSBC Holdings PLC (United Kingdom) (Reg.) (United Kingdom, Commercial Banks) | 2.8 |
ENI Spa sponsored ADR (Italy, Oil, Gas & Consumable Fuels) | 2.6 |
Barclays PLC (United Kingdom, Commercial Banks) | 2.5 |
ING Groep NV sponsored ADR (Netherlands, Diversified Financial Services) | 2.4 |
UBS AG (NY Shares) (Switzerland, Capital Markets) | 2.3 |
Mitsui & Co. Ltd. (Japan, Trading Companies & Distributors) | 2.2 |
Allianz AG sponsored ADR (Germany, Insurance) | 2.2 |
GlobalSantaFe Corp. (Cayman Islands, Energy Equipment & Services) | 2.1 |
Toyota Motor Corp. (Japan, Automobiles) | 2.0 |
| 25.1 |
Market Sectors as of October 31, 2006 |
| % of fund's
net assets |
Financials | 40.3 |
Energy | 11.3 |
Industrials | 8.9 |
Consumer Discretionary | 7.5 |
Information Technology | 7.4 |
Utilities | 5.7 |
Consumer Staples | 5.8 |
Materials | 5.5 |
Health Care | 3.1 |
Telecommunication Services | 2.5 |
Annual Report
Investments October 31, 2006
Showing Percentage of Net Assets
Common Stocks - 98.0% |
| Shares | | Value (Note 1) |
Australia - 2.0% |
Australia & New Zealand Banking Group Ltd. | 35,900 | | $ 807,079 |
Macquarie Airports unit | 326,000 | | 810,117 |
National Australia Bank Ltd. | 82,300 | | 2,422,912 |
Zinifex Ltd. | 54,000 | | 634,168 |
TOTAL AUSTRALIA | | 4,674,276 |
Austria - 1.1% |
OMV AG | 46,400 | | 2,522,391 |
Brazil - 1.0% |
Companhia Vale do Rio Doce sponsored ADR | 50,000 | | 1,272,000 |
Uniao de Bancos Brasileiros SA (Unibanco) GDR | 13,300 | | 1,047,375 |
TOTAL BRAZIL | | 2,319,375 |
Canada - 3.3% |
Canadian Natural Resources Ltd. | 47,900 | | 2,493,881 |
Cognos, Inc. (a) | 52,700 | | 1,922,496 |
Finning International, Inc. | 25,500 | | 902,886 |
Power Corp. of Canada (sub. vtg.) | 36,000 | | 1,090,598 |
RONA, Inc. (a) | 56,500 | | 1,147,464 |
TOTAL CANADA | | 7,557,325 |
Cayman Islands - 2.1% |
GlobalSantaFe Corp. | 95,400 | | 4,951,260 |
China - 0.3% |
Dongfeng Motor Group Co. Ltd. (H Shares) | 1,748,000 | | 782,163 |
Czech Republic - 0.4% |
Ceske Energeticke Zavody AS | 23,600 | | 933,264 |
Finland - 0.5% |
Nokia Corp. sponsored ADR | 58,000 | | 1,153,040 |
France - 8.6% |
Accor SA | 21,300 | | 1,478,990 |
AXA SA sponsored ADR | 73,400 | | 2,798,008 |
BNP Paribas SA | 13,400 | | 1,473,489 |
Carrefour SA | 28,200 | | 1,718,376 |
Compagnie de St. Gobain | 48,200 | | 3,552,923 |
Pernod Ricard SA | 11,700 | | 2,343,126 |
Peugeot Citroen SA | 14,500 | | 833,036 |
Societe Generale Series A | 16,335 | | 2,714,669 |
Suez SA (France) | 20,800 | | 930,812 |
Total SA sponsored ADR | 29,700 | | 2,023,758 |
TOTAL FRANCE | | 19,867,187 |
Common Stocks - continued |
| Shares | | Value (Note 1) |
Germany - 10.2% |
Allianz AG sponsored ADR | 267,600 | | $ 4,974,684 |
BASF AG sponsored ADR | 49,300 | | 4,337,414 |
DaimlerChrysler AG | 31,600 | | 1,798,988 |
E.ON AG | 38,900 | | 4,683,171 |
Heidelberger Druckmaschinen AG | 24,700 | | 1,124,256 |
KarstadtQuelle AG (a)(d) | 70,000 | | 1,644,003 |
Muenchener Rueckversicherungs-Gesellschaft AG (Reg.) | 27,100 | | 4,399,212 |
RWE AG | 5,600 | | 553,457 |
TOTAL GERMANY | | 23,515,185 |
Greece - 0.4% |
Greek Organization of Football Prognostics SA | 24,800 | | 885,699 |
Hong Kong - 2.1% |
Swire Pacific Ltd. (A Shares) | 415,300 | | 4,386,784 |
Yue Yuen Industrial Holdings Ltd. | 158,000 | | 478,437 |
TOTAL HONG KONG | | 4,865,221 |
India - 0.5% |
Satyam Computer Services Ltd. | 22,028 | | 215,670 |
Satyam Computer Services Ltd. sponsored ADR | 41,400 | | 915,354 |
TOTAL INDIA | | 1,131,024 |
Ireland - 0.6% |
Bank of Ireland | 45,900 | | 922,590 |
Kerry Group PLC Class A | 19,200 | | 463,915 |
TOTAL IRELAND | | 1,386,505 |
Israel - 0.2% |
Teva Pharmaceutical Industries Ltd. sponsored ADR | 12,400 | | 408,828 |
Italy - 4.6% |
Banca Intesa Spa | 104,000 | | 710,985 |
ENI Spa sponsored ADR (d) | 100,800 | | 6,119,568 |
Mediaset Spa | 79,300 | | 889,711 |
San Paolo IMI Spa | 49,400 | | 1,053,949 |
Unicredito Italiano Spa | 229,000 | | 1,898,752 |
TOTAL ITALY | | 10,672,965 |
Japan - 19.9% |
Aeon Credit Service Co. Ltd. | 31,000 | | 693,100 |
Asahi Breweries Ltd. | 46,900 | | 668,453 |
Astellas Pharma, Inc. | 13,600 | | 612,791 |
Canon, Inc. | 86,850 | | 4,636,922 |
Common Stocks - continued |
| Shares | | Value (Note 1) |
Japan - continued |
Daiwa Securities Group, Inc. | 140,000 | | $ 1,588,406 |
East Japan Railway Co. | 530 | | 3,706,738 |
Fujitsu Ltd. | 85,000 | | 693,314 |
Japan Tobacco, Inc. | 200 | | 872,093 |
Konica Minolta Holdings, Inc. | 66,500 | | 885,833 |
Mitsui & Co. Ltd. | 373,000 | | 5,093,032 |
Mizuho Financial Group, Inc. | 598 | | 4,657,815 |
Nippon Oil Corp. | 448,000 | | 3,332,421 |
Nippon Steel Corp. | 124,000 | | 504,651 |
Nippon Yusen KK | 107,000 | | 694,366 |
ORIX Corp. | 12,430 | | 3,501,783 |
Ricoh Co. Ltd. | 64,000 | | 1,264,022 |
Shin-Etsu Chemical Co. Ltd. | 8,700 | | 570,528 |
Sumitomo Mitsui Financial Group, Inc. | 109 | | 1,192,887 |
Sumitomo Trust & Banking Co. Ltd. | 91,000 | | 978,779 |
Takeda Pharamaceutical Co. Ltd. | 16,700 | | 1,072,307 |
Tokyo Gas Co. Ltd. (d) | 784,000 | | 4,001,779 |
Toyota Motor Corp. | 79,400 | | 4,684,600 |
TOTAL JAPAN | | 45,906,620 |
Korea (South) - 1.6% |
Kookmin Bank sponsored ADR | 14,300 | | 1,134,848 |
Samsung Electronics Co. Ltd. GDR | 8,171 | | 2,649,447 |
TOTAL KOREA (SOUTH) | | 3,784,295 |
Netherlands - 3.3% |
ING Groep NV sponsored ADR | 124,900 | | 5,536,817 |
Royal DSM NV | 18,300 | | 834,118 |
TomTom Group BV (a) | 28,800 | | 1,216,767 |
TOTAL NETHERLANDS | | 7,587,702 |
Norway - 2.9% |
DnB Nor ASA | 212,600 | | 2,784,102 |
Fred Olsen Energy ASA (a)(d) | 47,500 | | 2,049,231 |
Petroleum Geo-Services ASA (a) | 18,500 | | 1,076,898 |
Statoil ASA | 31,300 | | 791,287 |
TOTAL NORWAY | | 6,701,518 |
Philippines - 0.3% |
Philippine Long Distance Telephone Co. sponsored ADR (d) | 13,600 | | 647,496 |
Common Stocks - continued |
| Shares | | Value (Note 1) |
Russia - 0.4% |
OAO Gazprom sponsored ADR | 20,500 | | $ 873,300 |
OAO TMK unit | 4,700 | | 118,675 |
TOTAL RUSSIA | | 991,975 |
Singapore - 0.5% |
DBS Group Holdings Ltd. | 89,000 | | 1,165,789 |
South Africa - 0.2% |
FirstRand Ltd. | 181,300 | | 474,275 |
Spain - 2.0% |
Banco Bilbao Vizcaya Argentaria SA sponsored ADR | 104,400 | | 2,526,480 |
Gestevision Telecinco SA | 18,900 | | 496,712 |
Telefonica SA sponsored ADR | 27,600 | | 1,592,520 |
TOTAL SPAIN | | 4,615,712 |
Sweden - 0.5% |
Atlas Copco AB (A Shares) | 35,800 | | 1,045,885 |
Switzerland - 9.4% |
Adecco SA (Reg.) | 19,534 | | 1,206,597 |
Credit Suisse Group sponsored ADR | 71,500 | | 4,324,320 |
Nestle SA (Reg.) | 10,517 | | 3,592,593 |
Novartis AG sponsored ADR | 52,100 | | 3,164,033 |
Roche Holding AG (participation certificate) | 9,058 | | 1,584,959 |
Swiss Reinsurance Co. (Reg.) | 15,857 | | 1,300,015 |
UBS AG (NY Shares) | 90,700 | | 5,427,488 |
Zurich Financial Services AG (Reg.) | 4,906 | | 1,212,551 |
TOTAL SWITZERLAND | | 21,812,556 |
Taiwan - 0.7% |
AU Optronics Corp. | 663,000 | | 895,325 |
Hon Hai Precision Industry Co. Ltd. (Foxconn) | 117,200 | | 761,314 |
TOTAL TAIWAN | | 1,656,639 |
Turkey - 0.3% |
Turkiye Garanti Bankasi AS | 157,000 | | 576,394 |
United Kingdom - 17.8% |
BAE Systems PLC | 125,100 | | 1,001,045 |
Barclays PLC | 422,200 | | 5,732,421 |
BHP Billiton PLC | 180,900 | | 3,488,625 |
British American Tobacco PLC | 90,900 | | 2,499,750 |
HSBC Holdings PLC (United Kingdom) (Reg.) | 337,400 | | 6,442,316 |
National Grid PLC | 173,100 | | 2,212,261 |
Prudential PLC | 150,028 | | 1,838,696 |
Common Stocks - continued |
| Shares | | Value (Note 1) |
United Kingdom - continued |
Royal Bank of Scotland Group PLC | 261,500 | | $ 9,317,797 |
SABMiller PLC | 24,900 | | 481,617 |
Smiths Group PLC | 78,500 | | 1,416,528 |
Taylor Woodrow PLC | 74,600 | | 517,614 |
Tesco PLC | 78,700 | | 590,723 |
Vedanta Resources PLC | 29,400 | | 819,897 |
Vodafone Group PLC sponsored ADR | 133,712 | | 3,456,455 |
Yell Group PLC | 104,400 | | 1,240,661 |
TOTAL UNITED KINGDOM | | 41,056,406 |
United States of America - 0.3% |
NTL, Inc. | 27,900 | | 754,137 |
TOTAL COMMON STOCKS (Cost $214,334,562) | 226,403,107 |
Money Market Funds - 6.6% |
| | | |
Fidelity Cash Central Fund, 5.34% (b) | 5,932,157 | | 5,932,157 |
Fidelity Securities Lending Cash Central Fund, 5.35% (b)(c) | 9,393,970 | | 9,393,970 |
TOTAL MONEY MARKET FUNDS (Cost $15,326,127) | 15,326,127 |
TOTAL INVESTMENT PORTFOLIO - 104.6% (Cost $229,660,689) | | 241,729,234 |
NET OTHER ASSETS - (4.6)% | | (10,722,305) |
NET ASSETS - 100% | $ 231,006,929 |
Legend |
(a) Non-income producing |
(b) Affiliated fund that is available only to investment companies and other accounts managed by Fidelity Investments. The rate quoted is the annualized seven-day yield of the fund at period end. A complete unaudited listing of the fund's holdings as of its most recent quarter end is available upon request. |
(c) Investment made with cash collateral received from securities on loan. |
(d) Security or a portion of the security is on loan at period end. |
Affiliated Central Funds |
Information regarding fiscal year to date income earned by the Fund from investments in Fidelity Central Funds is as follows: |
Fund | Income earned |
Fidelity Cash Central Fund | $ 100,857 |
Fidelity Securities Lending Cash Central Fund | 9,903 |
Total | $ 110,760 |
Annual Report
See accompanying notes which are an integral part of the financial statements.
Financial Statements
Statement of Assets and Liabilities
October 31, 2006 |
| | |
Assets | | |
Investment in securities, at value (including securities loaned of $9,036,737) - See accompanying schedule: Unaffiliated issuers (cost $214,334,562) | $ 226,403,107 | |
Fidelity Central Funds (cost $15,326,127) | 15,326,127 | |
Total Investments (cost $229,660,689) | | $ 241,729,234 |
Foreign currency held at value (cost $248,717) | | 248,942 |
Receivable for fund shares sold | | 1,750,129 |
Dividends receivable | | 323,734 |
Interest receivable | | 32,830 |
Prepaid expenses | | 43,035 |
Receivable from investment adviser for expense reductions | | 70,766 |
Other receivables | | 18,406 |
Total assets | | 244,217,076 |
| | |
Liabilities | | |
Payable to custodian bank | $ 1,035 | |
Payable for investments purchased | 3,232,815 | |
Payable for fund shares redeemed | 284,256 | |
Accrued management fee | 162,096 | |
Distribution fees payable | 3,724 | |
Other affiliated payables | 36,110 | |
Other payables and accrued expenses | 96,141 | |
Collateral on securities loaned, at value | 9,393,970 | |
Total liabilities | | 13,210,147 |
| | |
Net Assets | | $ 231,006,929 |
Net Assets consist of: | | |
Paid in capital | | $ 218,143,761 |
Undistributed net investment income | | 808,421 |
Accumulated undistributed net realized gain (loss) on investments and foreign currency transactions | | (6,746) |
Net unrealized appreciation (depreciation) on investments and assets and liabilities in foreign currencies | | 12,061,493 |
Net Assets | | $ 231,006,929 |
Annual Report
See accompanying notes which are an integral part of the financial statements.
Financial Statements - continued
Statement of Assets and Liabilities - continued
October 31, 2006 |
| | |
Calculation of Maximum Offering Price
Class A:
Net Asset Value and redemption price per share
($1,537,484 ÷ 145,057 shares) | | $ 10.60 |
| | |
Maximum offering price per share (100/94.25 of $10.60) | | $ 11.25 |
Class T:
Net Asset Value and redemption price per share
($1,788,679 ÷ 168,964 shares) | | $ 10.59 |
| | |
Maximum offering price per share (100/96.50 of $10.59) | | $ 10.97 |
Class B:
Net Asset Value and offering price per share
($1,303,770 ÷ 123,443 shares)A | | $ 10.56 |
| | |
Class C:
Net Asset Value and offering price per share
($2,183,270 ÷ 206,711 shares)A | | $ 10.56 |
| | |
International Value:
Net Asset Value, offering price and redemption price per
share ($221,129,843 ÷ 20,842,605 shares) | | $ 10.61 |
| | |
Institutional Class:
Net Asset Value, offering price and redemption price per
share ($3,063,883 ÷ 288,807 shares) | | $ 10.61 |
A Redemption price per share is equal to net asset value less any applicable contingent deferred sales charge.
Annual Report
See accompanying notes which are an integral part of the financial statements.
Statement of Operations
For the period May 18, 2006 (commencement of operations) to October 31, 2006 |
| | |
Investment Income | | |
Dividends | | $ 1,091,719 |
Special dividends | | 353,113 |
Interest | | 7,169 |
Income from Fidelity Central Funds | | 110,760 |
| | 1,562,761 |
Less foreign taxes withheld | | (90,621) |
Total income | | 1,472,140 |
| | |
Expenses | | |
Management fee | $ 380,865 | |
Transfer agent fees | 125,699 | |
Distribution fees | 15,801 | |
Accounting and security lending fees | 29,229 | |
Custodian fees and expenses | 132,076 | |
Independent trustees' compensation | 137 | |
Registration fees | 81,756 | |
Audit | 48,886 | |
Legal | 275 | |
Total expenses before reductions | 814,724 | |
Expense reductions | (151,005) | 663,719 |
Net investment income (loss) | | 808,421 |
Realized and Unrealized Gain (Loss) Net realized gain (loss) on: | | |
Investment securities: | | |
Unaffiliated issuers | 4,399 | |
Foreign currency transactions | (11,145) | |
Total net realized gain (loss) | | (6,746) |
Change in net unrealized appreciation (depreciation) on: Investment securities (net of increase in deferred foreign taxes of $7,086) | 12,061,459 | |
Assets and liabilities in foreign currencies | 34 | |
Total change in net unrealized appreciation (depreciation) | | 12,061,493 |
Net gain (loss) | | 12,054,747 |
Net increase (decrease) in net assets resulting from operations | | $ 12,863,168 |
Annual Report
See accompanying notes which are an integral part of the financial statements.
Financial Statements - continued
Statement of Changes in Net Assets
| For the period
May 18, 2006 (commencement of operations) to
October 31, 2006 |
Increase (Decrease) in Net Assets | |
Operations | |
Net investment income (loss) | $ 808,421 |
Net realized gain (loss) | (6,746) |
Change in net unrealized appreciation (depreciation) | 12,061,493 |
Net increase (decrease) in net assets resulting from operations | 12,863,168 |
Share transactions - net increase (decrease) | 218,123,163 |
Redemption fees | 20,598 |
Total increase (decrease) in net assets | 231,006,929 |
| |
Net Assets | |
Beginning of period | - |
End of period (including undistributed net investment
income of $808,421) | $ 231,006,929 |
Annual Report
See accompanying notes which are an integral part of the financial statements.
Financial Highlights - Class A
Period ended October 31, | 2006 I |
Selected Per-Share Data | |
Net asset value, beginning of period | $ 10.00 |
Income from Investment Operations | |
Net investment income (loss) E | .06 H |
Net realized and unrealized gain (loss) | .54 |
Total from investment operations | .60 |
Redemption fees added to paid in capital E | - K |
Net asset value, end of period | $ 10.60 |
Total Return B, C, D | 6.00% |
Ratios to Average Net Assets F, J | |
Expenses before reductions | 1.75% A |
Expenses net of fee waivers, if any | 1.50%A |
Expenses net of all reductions | 1.46%A |
Net investment income (loss) | 1.29%A, H |
Supplemental Data | |
Net assets, end of period (000 omitted) | $ 1,537 |
Portfolio turnover rate G | 29%A |
A Annualized
B Total returns for periods of less than one year are not annualized.
C Total returns would have been lower had certain expenses not been reduced during the periods shown.
D Total returns do not include the effect of the sales charges.
E Calculated based on average shares outstanding during the period.
F Fees and expenses of the underlying Fidelity Central Funds are not included in the Fund's expense ratio. The Fund indirectly bears its proportionate share of the expenses of any underlying Fidelity Central Funds.
G Amount does not include the portfolio activity of any underlying Fidelity Central Funds.
H Investment income per share reflects a special dividend which amounted to $.03 per share. Excluding the special dividend, the ratio of net investment income (loss) to average net assets would have been .63%.
I For the period May 18, 2006 (commencement of operations) to October 31, 2006.
J Expense ratios reflect operating expenses of the class. Expenses before reductions do not reflect amounts reimbursed by the investment adviser or reductions from brokerage service arrangements or other expense offset arrangements and do not represent the amount paid by the class during periods when reimbursements or reductions occur. Expense ratios before reductions for start-up periods may not be representative of longer-term operating periods. Expenses net of fee waivers reflect expenses after reimbursement by the investment adviser but prior to reductions from brokerage service arrangements or other expense offset arrangements. Expenses net of all reductions represent the net expenses paid by the class.
K Amount represents less than $.01 per share.
Annual Report
See accompanying notes which are an integral part of the financial statements.
Financial Highlights - Class T
Period ended October 31, | 2006 I |
Selected Per-Share Data | |
Net asset value, beginning of period | $ 10.00 |
Income from Investment Operations | |
Net investment income (loss) E | .05 H |
Net realized and unrealized gain (loss) | .54 |
Total from investment operations | .59 |
Redemption fees added to paid in capital E | - K |
Net asset value, end of period | $ 10.59 |
Total Return B, C, D | 5.90% |
Ratios to Average Net Assets F, J | |
Expenses before reductions | 2.01% A |
Expenses net of fee waivers, if any | 1.75%A |
Expenses net of all reductions | 1.71%A |
Net investment income (loss) | 1.04%A, H |
Supplemental Data | |
Net assets, end of period (000 omitted) | $ 1,789 |
Portfolio turnover rate G | 29%A |
A Annualized
B Total returns for periods of less than one year are not annualized.
C Total returns would have been lower had certain expenses not been reduced during the periods shown.
D Total returns do not include the effect of the sales charges.
E Calculated based on average shares outstanding during the period.
F Fees and expenses of the underlying Fidelity Central Funds are not included in the Fund's expense ratio. The Fund indirectly bears its proportionate share of the expenses of any underlying Fidelity Central Funds.
G Amount does not include the portfolio activity of any underlying Fidelity Central Funds.
H Investment income per share reflects a special dividend which amounted to $.03 per share. Excluding the special dividend, the ratio of net investment income (loss) to average net assets would have been .38%.
I For the period May 18, 2006 (commencement of operations) to October 31, 2006.
J Expense ratios reflect operating expenses of the class. Expenses before reductions do not reflect amounts reimbursed by the investment adviser or reductions from brokerage service arrangements or other expense offset arrangements and do not represent the amount paid by the class during periods when reimbursements or reductions occur. Expense ratios before reductions for start-up periods may not be representative of longer-term operating periods. Expenses net of fee waivers reflect expenses after reimbursement by the investment adviser but prior to reductions from brokerage service arrangements or other expense offset arrangements. Expenses net of all reductions represent the net expenses paid by the class.
K Amount represents less than $.01 per share.
Annual Report
See accompanying notes which are an integral part of the financial statements.
Financial Highlights - Class B
Period ended October 31, | 2006 I |
Selected Per-Share Data | |
Net asset value, beginning of period | $ 10.00 |
Income from Investment Operations | |
Net investment income (loss) E | .02 H |
Net realized and unrealized gain (loss) | .54 |
Total from investment operations | .56 |
Redemption fees added to paid in capital E | - K |
Net asset value, end of period | $ 10.56 |
Total Return B, C, D | 5.60% |
Ratios to Average Net Assets F, J | |
Expenses before reductions | 2.50%A |
Expenses net of fee waivers, if any | 2.25%A |
Expenses net of all reductions | 2.21%A |
Net investment income (loss) | .54%A, H |
Supplemental Data | |
Net assets, end of period (000 omitted) | $ 1,304 |
Portfolio turnover rate G | 29% A |
A Annualized
B Total returns for periods of less than one year are not annualized.
C Total returns would have been lower had certain expenses not been reduced during the periods shown.
D Total returns do not include the effect of the contingent deferred sales charge.
E Calculated based on average shares outstanding during the period.
F Fees and expenses of the underlying Fidelity Central Funds are not included in the Fund's expense ratio. The Fund indirectly bears its proportionate share of the expenses of any underlying Fidelity Central Funds.
G Amount does not include the portfolio activity of any underlying Fidelity Central Funds.
H Investment income per share reflects a special dividend which amounted to $.03 per share. Excluding the special dividend, the ratio of net investment income (loss) to average net assets would have been (.12)%.
I For the period May 18, 2006 (commencement of operations) to October 31, 2006.
J Expense ratios reflect operating expenses of the class. Expenses before reductions do not reflect amounts reimbursed by the investment adviser or reductions from brokerage service arrangements or other expense offset arrangements and do not represent the amount paid by the class during periods when reimbursements or reductions occur. Expense ratios before reductions for start-up periods may not be representative of longer-term operating periods. Expenses net of fee waivers reflect expenses after reimbursement by the investment adviser but prior to reductions from brokerage service arrangements or other expense offset arrangements. Expenses net of all reductions represent the net expenses paid by the class.
K Amount represents less than $.01 per share.
Annual Report
See accompanying notes which are an integral part of the financial statements.
Financial Highlights - Class C
Period ended October 31, | 2006 I |
Selected Per-Share Data | |
Net asset value, beginning of period | $ 10.00 |
Income from Investment Operations | |
Net investment income (loss) E | .02 H |
Net realized and unrealized gain (loss) | .54 |
Total from investment operations | .56 |
Redemption fees added to paid in capital E | - K |
Net asset value, end of period | $ 10.56 |
Total Return B, C, D | 5.60% |
Ratios to Average Net Assets F, J | |
Expenses before reductions | 2.47%A |
Expenses net of fee waivers, if any | 2.25%A |
Expenses net of all reductions | 2.21%A |
Net investment income (loss) | .54%A, H |
Supplemental Data | |
Net assets, end of period (000 omitted) | $ 2,183 |
Portfolio turnover rate G | 29%A |
A Annualized
B Total returns for periods of less than one year are not annualized.
C Total returns would have been lower had certain expenses not been reduced during the periods shown.
D Total returns do not include the effect of the contingent deferred sales charge.
E Calculated based on average shares outstanding during the period.
F Fees and expenses of the underlying Fidelity Central Funds are not included in the Fund's expense ratio. The Fund indirectly bears its proportionate share of the expenses of any underlying Fidelity Central Funds.
G Amount does not include the portfolio activity of any underlying Fidelity Central Funds.
H Investment income per share reflects a special dividend which amounted to $.03 per share. Excluding the special dividend, the ratio of net investment income (loss) to average net assets would have been (.12)%.
I For the period May 18, 2006 (commencement of operations) to October 31, 2006.
J Expense ratios reflect operating expenses of the class. Expenses before reductions do not reflect amounts reimbursed by the investment adviser or reductions from brokerage service arrangements or other expense offset arrangements and do not represent the amount paid by the class during periods when reimbursements or reductions occur. Expense ratios before reductions for start-up periods may not be representative of longer-term operating periods. Expenses net of fee waivers reflect expenses after reimbursement by the investment adviser but prior to reductions from brokerage service arrangements or other expense offset arrangements. Expenses net of all reductions represent the net expenses paid by the class.
K Amount represents less than $.01 per share.
Annual Report
See accompanying notes which are an integral part of the financial statements.
Financial Highlights - International Value
Period ended October 31, | 2006 H |
Selected Per-Share Data | |
Net asset value, beginning of period | $ 10.00 |
Income from Investment Operations | |
Net investment income (loss) D | .07 G |
Net realized and unrealized gain (loss) | .54 |
Total from investment operations | .61 |
Redemption fees added to paid in capital D | -J |
Net asset value, end of period | $ 10.61 |
Total Return B, C | 6.10% |
Ratios to Average Net Assets E, I | |
Expenses before reductions | 1.50%A |
Expenses net of fee waivers, if any | 1.25%A |
Expenses net of all reductions | 1.21%A |
Net investment income (loss) | 1.54%A, G |
Supplemental Data | |
Net assets, end of period (000 omitted) | $ 221,130 |
Portfolio turnover rate F | 29%A |
A Annualized
B Total returns for periods of less than one year are not annualized.
C Total returns would have been lower had certain expenses not been reduced during the periods shown.
D Calculated based on average shares outstanding during the period.
E Fees and expenses of the underlying Fidelity Central Funds are not included in the Fund's expense ratio. The Fund indirectly bears its proportionate share of the expenses of any underlying Fidelity Central Funds.
F Amount does not include the portfolio activity of any underlying Fidelity Central Funds.
G Investment income per share reflects a special dividend which amounted to $.03 per share. Excluding the special dividend, the ratio of net investment income (loss) to average net assets would have been .88%.
H For the period May 18, 2006 (commencement of operations) to October 31, 2006.
I Expense ratios reflect operating expenses of the class. Expenses before reductions do not reflect amounts reimbursed by the investment adviser or reductions from brokerage service arrangements or other expense offset arrangements and do not represent the amount paid by the class during periods when reimbursements or reductions occur. Expense ratios before reductions for start-up periods may not be representative of longer-term operating periods. Expenses net of fee waivers reflect expenses after reimbursement by the investment adviser but prior to reductions from brokerage service arrangements or other expense offset arrangements. Expenses net of all reductions represent the net expenses paid by the class.
J Amount represents less than $.01 per share.
Annual Report
See accompanying notes which are an integral part of the financial statements.
Financial Highlights - Institutional Class
Period ended October 31, | 2006 H |
Selected Per-Share Data | |
Net asset value, beginning of period | $ 10.00 |
Income from Investment Operations | |
Net investment income (loss) D | .07 G |
Net realized and unrealized gain (loss) | .54 |
Total from investment operations | .61 |
Redemption fees added to paid in capital D | - J |
Net asset value, end of period | $ 10.61 |
Total Return B, C | 6.10% |
Ratios to Average Net Assets E, I | |
Expenses before reductions | 1.38%A |
Expenses net of fee waivers, if any | 1.25%A |
Expenses net of all reductions | 1.21%A |
Net investment income (loss) | 1.54%A, G |
Supplemental Data | |
Net assets, end of period (000 omitted) | $ 3,064 |
Portfolio turnover rate F | 29%A |
A Annualized
B Total returns for periods of less than one year are not annualized.
C Total returns would have been lower had certain expenses not been reduced during the periods shown.
D Calculated based on average shares outstanding during the period.
E Fees and expenses of the underlying Fidelity Central Funds are not included in the Fund's expense ratio. The Fund indirectly bears its proportionate share of the expenses of any underlying Fidelity Central Funds.
F Amount does not include the portfolio activity of any underlying Fidelity Central Funds.
G Investment income per share reflects a special dividend which amounted to $.03 per share. Excluding the special dividend, the ratio of net investment income (loss) to average net assets would have been .88%.
H For the period May 18, 2006 (commencement of operations) to October 31, 2006.
I Expense ratios reflect operating expenses of the class. Expenses before reductions do not reflect amounts reimbursed by the investment adviser or reductions from brokerage service arrangements or other expense offset arrangements and do not represent the amount paid by the class during periods when reimbursements or reductions occur. Expense ratios before reductions for start-up periods may not be representative of longer-term operating periods. Expenses net of fee waivers reflect expenses after reimbursement by the investment adviser but prior to reductions from brokerage service arrangements or other expense offset arrangements. Expenses net of all reductions represent the net expenses paid by the class.
J Amount represents less than $.01 per share.
Annual Report
See accompanying notes which are an integral part of the financial statements.
Notes to Financial Statements
For the period ended October 31, 2006
1. Significant Accounting Policies.
Fidelity International Value Fund (the Fund) is a fund of Fidelity Investment Trust (the trust) and is authorized to issue an unlimited number of shares. The trust is registered under the Investment Company Act of 1940, as amended (the 1940 Act), as an open-end management investment company organized as a Massachusetts business trust.
The Fund offers Class A, Class T, Class B, Class C, International Value Fund and Institutional Class shares, each of which has equal rights as to assets and voting privileges. Each class has exclusive voting rights with respect to matters that affect that class. Class B shares will automatically convert to Class A shares after a holding period of seven years from the initial date of purchase. Investment income, realized and unrealized capital gains and losses, the common expenses of the Fund, and certain fund-level expense reductions, if any, are allocated on a pro rata basis to each class based on the relative net assets of each class to the total net assets of the Fund. Each class differs with respect to transfer agent and distribution and service plan fees incurred. Certain expense reductions also differ by class.
The Fund's investments in emerging markets can be subject to social, economic, regulatory, and political uncertainties and can be extremely volatile.
The Fund may invest in Fidelity Central Funds which are open-end investment companies available to investment companies and other accounts managed by Fidelity Management & Research Company (FMR) and its affiliates. The financial statements have been prepared in conformity with accounting principles generally accepted in the United States of America, which require management to make certain estimates and assumptions at the date of the financial statements. The following summarizes the significant accounting policies of the Fund, which are also consistently followed by the Fidelity Central Funds:
Security Valuation. Investments are valued and net asset value (NAV) per share is calculated (NAV calculation) as of the close of business of the New York Stock Exchange (NYSE), normally 4:00 p.m. Eastern time. Wherever possible, the Fund uses independent pricing services approved by the Board of Trustees to value its investments.
Equity securities, including restricted securities, for which market quotations are readily available, are valued at the last reported sale price or official closing price as reported by an independent pricing service on the primary market or exchange on which they are traded. In the event there were no sales during the day or closing prices are not available, securities are valued at the last quoted bid price. Investments in open-end mutual funds, including the Fidelity Central Funds, are valued at their closing net asset value each business day. Short-term securities with remaining maturities of sixty days or less for
Annual Report
Notes to Financial Statements - continued
1. Significant Accounting Policies - continued
Security Valuation - continued
which quotations are not readily available are valued at amortized cost, which approximates value.
When current market prices or quotations are not readily available or do not accurately reflect fair value, valuations may be determined in accordance with procedures adopted by the Board of Trustees. For example, when developments occur between the close of a market and the close of the NYSE that may materially affect the value of some or all of the securities, or when trading in a security is halted, those securities may be fair valued. Factors used in the determination of fair value may include monitoring news to identify significant market or security specific events such as changes in the value of U.S. securities markets, reviewing developments in foreign markets and evaluating the performance of ADRs, futures contracts and exchange-traded funds. Because the Fund's utilization of fair value pricing depends on market activity, the frequency with which fair value pricing is used can not be predicted and may be utilized to a significant extent. The value of securities used for NAV calculation under fair value pricing may differ from published prices for the same securities.
Foreign Currency. The Fund uses foreign currency contracts to facilitate transactions in foreign-denominated securities. Losses from these transactions may arise from changes in the value of the foreign currency or if the counterparties do not perform under the contracts' terms.
Foreign-denominated assets, including investment securities, and liabilities are translated into U.S. dollars at the exchange rate at period end. Purchases and sales of investment securities, income and dividends received and expenses denominated in foreign currencies are translated into U.S. dollars at the exchange rate in effect on the transaction date.
The effects of exchange rate fluctuations on investments are included with the net realized and unrealized gain (loss) on investment securities. Other foreign currency transactions resulting in realized and unrealized gain (loss) are disclosed separately.
Investment Transactions and Income. Security transactions, including the Fund's investment activity in the Fidelity Central Funds, are accounted for as of trade date. Gains and losses on securities sold are determined on the basis of identified cost. Dividend income is recorded on the ex-dividend date, except for certain dividends from foreign securities where the ex-dividend date may have passed, which are recorded as soon as the Fund is informed of the ex-dividend date. Non-cash dividends included in dividend income, if any, are recorded at the fair market value of the securities received. Large, non-recurring dividends recognized by the Fund are presented separately on the Statement of Operations as "Special Dividends" and the impact of these dividends is
Annual Report
1. Significant Accounting Policies - continued
Investment Transactions and Income - continued
presented in the Financial Highlights. Interest income distributions from the Fidelity Central Funds are accrued as earned. Interest income includes coupon interest and amortization of premium and accretion of discount on debt securities. Investment income is recorded net of foreign taxes withheld where recovery of such taxes is uncertain.
Expenses. Most expenses of the trust can be directly attributed to a fund. Expenses which cannot be directly attributed are apportioned among each Fund in the trust. Expense estimates are accrued in the period to which they relate and adjustments are made when actual amounts are known.
Income Tax Information and Distributions to Shareholders. Each year, the Fund intends to qualify as a regulated investment company by distributing all of its taxable income and realized gains under Subchapter M of the Internal Revenue Code. As a result, no provision for income taxes is required in the accompanying financial statements. Foreign taxes are provided for based on the Fund's understanding of the tax rules and rates that exist in the foreign markets in which it invests.
Distributions are recorded on the ex-dividend date. Income dividends and capital gain distributions are declared separately for each class. Income and capital gain distributions are determined in accordance with income tax regulations, which may differ from generally accepted accounting principles. In addition, the Fund will claim a portion of the payment made to redeeming shareholders as a distribution for income tax purposes.
Capital accounts within the financial statements are adjusted for permanent book-tax differences. These adjustments have no impact on net assets or the results of operations. Temporary book-tax differences will reverse in a subsequent period.
Book-tax differences are primarily due to short-term capital gains, foreign currency transactions, passive foreign investment companies (PFIC) and losses deferred due to wash sales.
The tax-basis components of distributable earnings and the federal tax cost as of period end were as follows:
Unrealized appreciation | $ 13,449,405 |
Unrealized depreciation | (1,923,189) |
Net unrealized appreciation (depreciation) | 11,526,216 |
Undistributed ordinary income | 1,247,939 |
| |
Cost for federal income tax purposes | $ 230,203,018 |
Annual Report
Notes to Financial Statements - continued
1. Significant Accounting Policies - continued
Short-Term Trading (Redemption) Fees. Shares purchased on or after May 18, 2006 and held in the Fund less than 30 days are subject to a redemption fee equal to 1.00% of the proceeds of the redeemed shares. All redemption fees, including any estimated redemption fees paid by FMR, are retained by the Fund and accounted for as an addition to paid in capital.
New Accounting Pronouncements. In July 2006, Financial Accounting Standards Board Interpretation No. 48, Accounting for Uncertainty in Income Taxes - an interpretation of FASB Statement 109 (FIN 48), was issued and is effective for fiscal years beginning after December 15, 2006. FIN 48 sets forth a threshold for financial statement recognition, measurement and disclosure of a tax position taken or expected to be taken on a tax return. Management is currently evaluating the impact, if any, the adoption of FIN 48 will have on the Fund's net assets, results of operations and financial statement disclosures.
In addition, in September 2006, Statement of Financial Accounting Standards No. 157, Fair Value Measurements (SFAS 157), was issued and is effective for fiscal years beginning after November 15, 2007. SFAS 157 defines fair value, establishes a framework for measuring fair value and expands disclosures about fair value measurements. Management is currently evaluating the impact the adoption of SFAS 157 will have on the Fund's financial statement disclosures.
2. Operating Policies.
Repurchase Agreements. FMR has received an Exemptive Order from the Securities and Exchange Commission (the SEC) which permits the Fund and other affiliated entities of FMR to transfer uninvested cash balances into joint trading accounts which are then invested in repurchase agreements. The Fund may also invest directly with institutions in repurchase agreements. Repurchase agreements are collateralized by government or non-government securities. Upon settlement date, collateral is held in segregated accounts with custodian banks and may be obtained in the event of a default of the counterparty. The Fund monitors, on a daily basis, the value of the collateral to ensure it is at least equal to the principal amount of the repurchase agreement (including accrued interest). In the event of a default by the counterparty, realization of the collateral proceeds could be delayed, during which time the value of the collateral may decline.
3. Purchases and Sales of Investments.
Purchases and sales of securities other than short-term securities, aggregated $230,223,505 and $15,893,342, respectively.
Annual Report
4. Fees and Other Transactions with Affiliates.
Management Fee. FMR and its affiliates provide the Fund with investment management related services for which the Fund pays a monthly management fee. The management fee is the sum of an individual fund fee rate that is based on an annual rate of .45% of the Fund's average net assets and a group fee rate that averaged ..27% during the period. The group fee rate is based upon the average net assets of all the mutual funds advised by FMR. The group fee rate decreases as assets under management increase and increases as assets under management decrease. In addition, the management fee is subject to a performance adjustment (up to a maximum of ± .20% of the Fund's average net assets over a 36 month performance period). The upward or downward adjustment to the management fee is based on the relative investment performance of the retail class of the Fund, International Value, as compared to an appropriate benchmark index. The Fund's performance adjustment will not take effect until May 1, 2007. Subsequent months will be added until the performance period includes 36 months. For the period, the total annualized management fee rate was .71% of the Fund's average net assets.
Distribution and Service Plan. In accordance with Rule 12b-1 of the 1940 Act, the Fund has adopted separate Distribution and Service Plans for each class of shares. Certain classes pay Fidelity Distributors Corporation (FDC), an affiliate of FMR, separate Distribution and Service Fees, each of which is based on an annual percentage of each class' average net assets. In addition, FDC may pay financial intermediaries for selling shares of the Fund and providing shareholder support services. For the period, the Distribution and Service Fee rates and the total amounts paid to and retained by FDC were as follows:
| Distribution
Fee | Service
Fee | Paid to
FDC | Retained
by FDC |
Class A | 0% | .25% | $ 1,322 | $ 1,115 |
Class T | .25% | .25% | 2,940 | 2,223 |
Class B | .75% | .25% | 4,917 | 4,804 |
Class C | .75% | .25% | 6,622 | 5,701 |
| | | $ 15,801 | $ 13,843 |
Sales Load. FDC receives a front-end sales charge of up to 5.75% for selling Class A shares, and 3.50% for selling Class T shares, some of which is paid to financial intermediaries for selling shares of the Fund. FDC receives the proceeds of contingent deferred sales charges levied on Class A, Class T, Class B, and Class C redemptions. These charges depend on the holding period. The deferred sales charges range from 5% to 1% for Class B, 1% for Class C, 1.00% to .50% for certain purchases of Class A shares and .25% for certain purchases of Class T shares.
Annual Report
Notes to Financial Statements - continued
4. Fees and Other Transactions with Affiliates - continued
Sales Load - continued
For the period, sales charge amounts retained by FDC were as follows:
| Retained
by FDC |
Class A | $ 1,104 |
Class T | 494 |
| $ 1,598 |
Transfer Agent Fees. Fidelity Investments Institutional Operations Company, Inc. (FIIOC), an affiliate of FMR, is the transfer, dividend disbursing and shareholder servicing agent for each class of the Fund. FIIOC receives account fees and asset-based fees that vary according to the account size and type of account of the shareholders of the respective classes of the Fund. FIIOC pays for typesetting, printing and mailing of shareholder reports, except proxy statements. For the period, the total transfer agent fees paid by each class to FIIOC, were as follows:
| Amount | % of
Average
Net Assets |
Class A | $ 1,113 | .21* |
Class T | 1,345 | .23* |
Class B | 965 | .20* |
Class C | 1,379 | .21* |
International Value | 119,359 | .24* |
Institutional Class | 1,538 | .15* |
| $ 125,699 | |
* Annualized
Accounting and Security Lending Fees. Fidelity Service Company, Inc. (FSC), an affiliate of FMR, maintains the Fund's accounting records. The accounting fee is based on the level of average net assets for the month. Under a separate contract, FSC administers the security lending program. The security lending fee is based on the number and duration of lending transactions.
Investments in Fidelity Central Funds. The Fund may invest in Fidelity Central Funds. The Fund's Schedule of Investments lists each of the Fidelity Central Funds as an investment of the Fund but does not include the underlying holdings of each Fidelity Central Fund. As an Investing Fund, the Fund indirectly bears its proportionate share of the expenses of the underlying Fidelity Central Funds. A complete unaudited list of holdings for each Fidelity Central Fund is available upon request. In addition, the financial statements of the Fidelity Central Funds,
Annual Report
4. Fees and Other Transactions with Affiliates - continued
Investments in Fidelity Central Funds - continued
which are not covered by the Fund's Report of Independent Registered Public Accounting Firm, are available on the EDGAR Database on the SEC's web site, www.sec.gov, or upon request.
The Money Market Central Funds seek preservation of capital and current income and are managed by Fidelity Investments Money Management, Inc. (FIMM), an affiliate of FMR.
Brokerage Commissions. The Fund placed a portion of its portfolio transactions with brokerage firms which are affiliates of the investment adviser. The commissions paid to these affiliated firms were $695 for the period.
5. Security Lending.
The Fund lends portfolio securities from time to time in order to earn additional income. On the settlement date of the loan, the Fund receives collateral (in the form of U.S. Treasury obligations, letters of credit and/or cash) against the loaned securities and maintains collateral in an amount not less than 100% of the market value of the loaned securities during the period of the loan. The market value of the loaned securities is determined at the close of business of the Fund and any additional required collateral is delivered to the Fund on the next business day. If the borrower defaults on its obligation to return the securities loaned because of insolvency or other reasons, a fund could experience delays and costs in recovering the securities loaned or in gaining access to the collateral. Any cash collateral received is invested in the Fidelity Securities Lending Cash Central Fund. The value of loaned securities and cash collateral at period end are disclosed on the Fund's Statement of Assets and Liabilities. Security lending income represents the income earned on investing cash collateral, less fees and expenses associated with the loan, plus any premium payments that may be received on the loan of certain types of securities. Security lending income is presented in the Statement of Operations as a component of interest income from Fidelity Central Funds. Net income from lending portfolio securities during the period amounted to $9,903.
6. Expense Reductions.
FMR voluntarily agreed to reimburse each class to the extent annual operating expenses exceeded certain levels of average net assets as noted in the table below. Some expenses, for example interest expense, including commitment fees, are excluded from this reimbursement.
Annual Report
Notes to Financial Statements - continued
6. Expense Reductions - continued
The following classes were in reimbursement during the period:
| Expense
Limitations | Reimbursement
from adviser |
Class A | 1.50% | $ 1,306 |
Class T | 1.75% | 1,514 |
Class B | 2.25% | 1,208 |
Class C | 2.25% | 1,432 |
International Value | 1.25% | 124,928 |
Institutional Class | 1.25% | 1,364 |
| | $ 131,752 |
Many of the brokers with whom FMR places trades on behalf of the Fund provided services to the Fund in addition to trade execution. These services included payments of certain expenses on behalf of the Fund totaling $18,428 for the period. In addition, through arrangements with the Fund's custodian credits realized as a result of uninvested cash balances were used to reduce the Fund's expenses. During the period, these credits reduced the Fund's custody expenses by $825.
7. Other.
The Fund's organizational documents provide former and current trustees and officers with a limited indemnification against liabilities arising in connection with the performance of their duties to the Fund. In the normal course of business, the Fund may also enter into contracts that provide general indemnifications. The Fund's maximum exposure under these arrangements is unknown as this would be dependent on future claims that may be made against the Fund. The risk of material loss from such claims is considered remote.
During the period, the Fund's transfer agent, Fidelity Investments Institutional Operations Company, Inc. (FIIOC), an affiliate of Fidelity Management & Research Company, notified the Fund that the fund's books and records did not reflect a conversion of certain Class B to Class A shares upon their conversion date. Management has determined that this did not have a material impact to the Fund's reported net assets or results of operations in the accompanying financial statements. FIIOC will cause the books and records of the Fund to reflect a conversion of the relevant Class B shares to Class A and is in the process of determining the impact to affected shareholder accounts for purposes of its remediation.
Annual Report
8. Share Transactions.
Transactions for each class of shares were as follows:
| Shares | Dollars |
| Period ended
October 31,
2006 A | Period ended
October 31,
2006 A |
Class A | | |
Shares sold | 146,231 | $ 1,461,870 |
Shares redeemed | (1,174) | (12,358) |
Net increase (decrease) | 145,057 | $ 1,449,512 |
Class T | | |
Shares sold | 169,119 | $ 1,688,142 |
Shares redeemed | (155) | (1,528) |
Net increase (decrease) | 168,964 | $ 1,686,614 |
Class B | | |
Shares sold | 123,455 | $ 1,231,876 |
Shares redeemed | (12) | (126) |
Net increase (decrease) | 123,443 | $ 1,231,750 |
Class C | | |
Shares sold | 207,502 | $ 2,072,374 |
Shares redeemed | (791) | (7,647) |
Net increase (decrease) | 206,711 | $ 2,064,727 |
International Value | | |
Shares sold | 22,776,737 | $ 228,163,833 |
Shares redeemed | (1,934,132) | (19,338,324) |
Net increase (decrease) | 20,842,605 | $ 208,825,509 |
Institutional Class | | |
Shares sold | 288,807 | $ 2,865,051 |
A For the period May 18, 2006 (commencement of operations) to October 31, 2006.
Annual Report
Report of Independent Registered Public Accounting Firm
To the Trustees of Fidelity Investment Trust and Shareholders of Fidelity International Value Fund:
We have audited the accompanying statement of assets and liabilities of Fidelity International Value Fund (the Fund), a fund of Fidelity Investment Trust, including the schedule of investments as of October 31, 2006, and the related statement of operations, the statement of changes in net assets and the financial highlights for the period May 18, 2006 (commencement of operations) to October 31, 2006. These financial statements and financial highlights are the responsibility of the Fund's management. Our responsibility is to express an opinion on these financial statements and financial highlights based on our audit.
We conducted our audit in accordance with standards of the Public Company Accounting Oversight Board (United States). Those standards require that we plan and perform the audit to obtain reasonable assurance about whether the financial statements and financial highlights are free of material misstatement. The Fund is not required to have, nor were we engaged to perform, an audit of its internal control over financial reporting. Our audits included consideration of internal control over financial reporting as a basis for designing audit procedures that are appropriate in the circumstances, but not for the purpose of expressing an opinion on the effectiveness of the Fund's internal control over financial reporting. Accordingly, we express no such opinion. An audit also includes examining, on a test basis, evidence supporting the amounts and disclosures in the financial statements, assessing the accounting principles used and significant estimates made by management, as well as evaluating the overall financial statement presentation. Our procedures included confirmation of securities owned as of October 31, 2006, by correspondence with the custodians and brokers; where replies were not received from brokers, we performed other auditing procedures. We believe that our audit provide a reasonable basis for our opinion.
In our opinion, the financial statements and financial highlights referred to above present fairly, in all material respects, the financial position of Fidelity International Value Fund as of October 31, 2006, the results of its operations, the changes in its net assets and its financial highlights for the period May 18, 2006 (commencement of operations) to October 31, 2006, in conformity with accounting principles generally accepted in the United States of America.
/s/ Deloitte & Touche LLP
DELOITTE & TOUCHE LLP
Boston, Massachusetts
December 15, 2006
Annual Report
Trustees and Officers
The Trustees, Members of the Advisory Board, and executive officers of the trust and fund, as applicable, are listed below. The Board of Trustees governs the fund and is responsible for protecting the interests of shareholders. The Trustees are experienced executives who meet periodically throughout the year to oversee the fund's activities, review contractual arrangements with companies that provide services to the fund, and review the fund's performance. Except for William O. McCoy, each of the Trustees oversees 348 funds advised by FMR or an affiliate. Mr. McCoy oversees 350 funds advised by FMR or an affiliate.
The Trustees hold office without limit in time except that (a) any Trustee may resign; (b) any Trustee may be removed by written instrument, signed by at least two-thirds of the number of Trustees prior to such removal; (c) any Trustee who requests to be retired or who has become incapacitated by illness or injury may be retired by written instrument signed by a majority of the other Trustees; and (d) any Trustee may be removed at any special meeting of shareholders by a two-thirds vote of the outstanding voting securities of the trust. Each Trustee who is not an interested person (as defined in the 1940 Act) (Independent Trustee), shall retire not later than the last day of the calendar year in which his or her 72nd birthday occurs. The Independent Trustees may waive this mandatory retirement age policy with respect to individual Trustees. The executive officers and Advisory Board Members hold office without limit in time, except that any officer and Advisory Board Member may resign or may be removed by a vote of a majority of the Trustees at any regular meeting or any special meeting of the Trustees. Except as indicated, each individual has held the office shown or other offices in the same company for the past five years.
The fund's Statement of Additional Information (SAI) includes more information about the Trustees. To request a free copy, call Fidelity at 1-800-544-8544.
Interested Trustees*:
Correspondence intended for each Trustee who is an interested person may be sent to Fidelity Investments, 82 Devonshire Street, Boston, Massachusetts 02109.
Name, Age; Principal Occupation |
Edward C. Johnson 3d (76) |
| Year of Election or Appointment: 1984 Mr. Johnson is Chairman of the Board of Trustees. Mr. Johnson serves as President (2006-present), Chief Executive Officer, Chairman, and a Director of FMR Corp.; Chairman and a Director of FMR; Chairman and a Director of Fidelity Research & Analysis Company (FRAC); Chairman and a Director of Fidelity Investments Money Management, Inc.; and Chairman (2001-present) and a Director of FMR Co., Inc. In addition, Mr. Johnson serves as Chairman and Director of Fidelity International Limited (FIL). |
Stephen P. Jonas (53) |
| Year of Election or Appointment: 2005 Mr. Jonas is Senior Vice President of International Value (2006-present). He also serves as Senior Vice President of other Fidelity funds (2005-present). Mr. Jonas is Executive Director of FMR (2005-present) and FMR Co., Inc. (2005-present). He also serves as a Director of Fidelity Investments Money Management, Inc. (2005-present) and FMR Corp. (2003-present). Previously, Mr. Jonas served as President of Fidelity Enterprise Operations and Risk Services (2004-2005), Chief Administrative Officer (2002-2004), and Chief Financial Officer of FMR Corp. (1998-2002). In addition, he serves on the Boards of Boston Ballet (2003-present) and Simmons College (2003-present). |
Robert L. Reynolds (54) |
| Year of Election or Appointment: 2003 Mr. Reynolds is President and a Director of FMR (2005-present), Fidelity Investments Money Management, Inc. (2005-present), and FMR Co., Inc. (2005-present). Mr. Reynolds also serves as Vice Chairman (2006-present), a Director (2003-present), and Chief Operating Officer of FMR Corp. and a Director of Strategic Advisers, Inc. (2005-present). He also serves on the Board at Fidelity Investments Canada, Ltd. |
* Trustees have been determined to be "Interested Trustees" by virtue of, among other things, their affiliation with the trust or various entities under common control with FMR.
Annual Report
Independent Trustees:
Correspondence intended for each Independent Trustee (that is, the Trustees other than the Interested Trustees) may be sent to Fidelity Investments, P.O. Box 55235, Boston, Massachusetts 02205-5235.
Name, Age; Principal Occupation |
Dennis J. Dirks (58) |
| Year of Election or Appointment: 2005 Prior to his retirement in May 2003, Mr. Dirks was Chief Operating Officer and a member of the Board of The Depository Trust & Clearing Corporation (DTCC) (1999-2003). He also served as President, Chief Operating Officer, and Board member of The Depository Trust Company (DTC) (1999-2003) and President and Board member of the National Securities Clearing Corporation (NSCC) (1999-2003). In addition, Mr. Dirks served as Chief Executive Officer and Board member of the Government Securities Clearing Corporation (2001-2003) and Chief Executive Officer and Board member of the Mortgage-Backed Securities Clearing Corporation (2001-2003). Mr. Dirks also serves as a Trustee and a member of the Finance Committee of Manhattan College (2005-present) and a Trustee and a member of the Finance Committee of AHRC of Nassau County (2006-present). |
Albert R. Gamper, Jr. (64) |
| Year of Election or Appointment: 2006 Prior to his retirement in December 2004, Mr. Gamper served as Chairman of the Board of CIT Group Inc. (commercial finance). During his tenure with CIT Group Inc. Mr. Gamper served in numerous senior management positions, including Chairman (1987-1989; 1999-2001; 2002-2004), Chief Executive Officer (1987-2004), and President (1989-2002). He currently serves as a member of the Board of Directors of Public Service Enterprise Group (utilities, 2001-present), Chairman of the Board of Governors, Rutgers University (2004-present), and Chairman of the Board of Saint Barnabas Health Care System. |
George H. Heilmeier (70) |
| Year of Election or Appointment: 2004 Dr. Heilmeier is Chairman Emeritus of Telcordia Technologies (communication software and systems), where prior to his retirement, he served as company Chairman and Chief Executive Officer. He currently serves on the Boards of Directors of The Mitre Corporation (systems engineering and information technology support for the government), and HRL Laboratories (private research and development, 2004-present). He is Chairman of the General Motors Science & Technology Advisory Board and a Life Fellow of the Institute of Electrical and Electronics Engineers (IEEE). Dr. Heilmeier is a member of the Defense Science Board and the National Security Agency Advisory Board. He is also a member of the National Academy of Engineering, the American Academy of Arts and Sciences, and the Board of Overseers of the School of Engineering and Applied Science of the University of Pennsylvania. Previously, Dr. Heilmeier served as a Director of TRW Inc. (automotive, space, defense, and information technology, 1992-2002), Compaq (1994-2002), Automatic Data Processing, Inc. (ADP) (technology-based business outsourcing, 1995-2002), INET Technologies Inc. (telecommunications network surveillance, 2001-2004), and Teletech Holdings (customer management services). He is the recipient of the 2005 Kyoto Prize in Advanced Technology for his invention of the liquid crystal display, and a member of the Consumer Electronics Hall of Fame. |
Marie L. Knowles (60) |
| Year of Election or Appointment: 2001 Prior to Ms. Knowles' retirement in June 2000, she served as Executive Vice President and Chief Financial Officer of Atlantic Richfield Company (ARCO) (diversified energy, 1996-2000). From 1993 to 1996, she was a Senior Vice President of ARCO and President of ARCO Transportation Company. She served as a Director of ARCO from 1996 to 1998. She currently serves as a Director of Phelps Dodge Corporation (copper mining and manufacturing) and McKesson Corporation (healthcare service, 2002-present). Ms. Knowles is a Trustee of the Brookings Institution and the Catalina Island Conservancy and also serves as a member of the Advisory Board for the School of Engineering of the University of Southern California. |
Ned C. Lautenbach (62) |
| Year of Election or Appointment: 2000 Mr. Lautenbach is Chairman of the Independent Trustees (2006-present). Mr. Lautenbach has been a partner of Clayton, Dubilier & Rice, Inc. (private equity investment firm) since September 1998. Previously, Mr. Lautenbach was with the International Business Machines Corporation (IBM) from 1968 until his retirement in 1998. Mr. Lautenbach serves as a Director of Sony Corporation (2006-present) and Eaton Corporation (diversified industrial) as well as the Philharmonic Center for the Arts in Naples, Florida. He also is a member of the Board of Trustees of Fairfield University (2005-present), as well as a member of the Council on Foreign Relations. |
William O. McCoy (73) |
| Year of Election or Appointment: 1997 Prior to his retirement in December 1994, Mr. McCoy was Vice Chairman of the Board of BellSouth Corporation (telecommunications) and President of BellSouth Enterprises. He is currently a Director of Duke Realty Corporation (real estate). He is also a partner of Franklin Street Partners (private investment management firm). In addition, Mr. McCoy served as the Interim Chancellor (1999-2000) and a member of the Board of Visitors for the University of North Carolina at Chapel Hill and currently serves as Chairman of the Board of Directors of the University of North Carolina Health Care System. He also served as Vice President of Finance for the University of North Carolina (16-school system). |
Cornelia M. Small (62) |
| Year of Election or Appointment: 2005 Ms. Small is a member (2000-present) and Chairperson (2002-present) of the Investment Committee, and a member (2002-present) of the Board of Trustees of Smith College. Previously, she served as Chief Investment Officer (1999-2000), Director of Global Equity Investments (1996-1999), and a member of the Board of Directors of Scudder, Stevens & Clark (1990-1997) and Scudder Kemper Investments (1997-1999). In addition, Ms. Small served as Co-Chair (2000-2003) of the Annual Fund for the Fletcher School of Law and Diplomacy. |
William S. Stavropoulos (67) |
| Year of Election or Appointment: 2001 Mr. Stavropoulos is Chairman Emeritus of the Board of Directors of The Dow Chemical Company. Since joining The Dow Chemical Company in 1967, Mr. Stavropoulos served in numerous senior management positions, including President (1993-2000; 2002-2003), CEO (1995-2000; 2002-2004), and Chairman of the Executive Committee (2000-2004). Currently, he is a Director of NCR Corporation (data warehousing and technology solutions), BellSouth Corporation (telecommunications), Chemical Financial Corporation, Maersk Inc. (industrial conglomerate, 2002-present), and Metalmark Capital (private equity investment firm, 2005-present). He also serves as a member of the Board of Trustees of the American Enterprise Institute for Public Policy Research. In addition, Mr. Stavropoulos is a member of The Business Council, J.P. Morgan International Council and the University of Notre Dame Advisory Council for the College of Science. |
Kenneth L. Wolfe (67) |
| Year of Election or Appointment: 2005 Prior to his retirement in 2001, Mr. Wolfe was Chairman and Chief Executive Officer of Hershey Foods Corporation (1993-2001). He currently serves as a member of the boards of Adelphia Communications Corporation (2003-present), Bausch & Lomb, Inc., and Revlon Inc. (2004-present). |
Annual Report
Advisory Board Members and Executive Officers:
Correspondence intended for Mr. Keyes may be sent to Fidelity Investments, P.O. Box 55235, Boston, Massachusetts 02205-5235. Correspondence intended for each executive officer and Mr. Lynch may be sent to Fidelity Investments, 82 Devonshire Street, Boston, Massachusetts 02109.
Name, Age; Principal Occupation |
James H. Keyes (66) |
| Year of Election or Appointment: 2006 Member of the Advisory Board of Fidelity Investment Trust. Prior to his retirement in 2003, Mr. Keyes was Chairman, President, and Chief Executive Officer of Johnson Controls, Inc. (automotive supplier, 1993-2003). He currently serves as a member of the boards of LSI Logic Corporation (semiconductor technologies), Navistar International Corporation (manufacture and sale of trucks, buses, and diesel engines, 2002-present), and Pitney Bowes, Inc. (integrated mail, messaging, and document management solutions). |
Peter S. Lynch (62) |
| Year of Election or Appointment: 2003 Member of the Advisory Board of Fidelity Investment Trust. Mr. Lynch is Vice Chairman and a Director of FMR, and Vice Chairman (2001- present) and a Director of FMR Co., Inc. Previously, Mr. Lynch served as a Trustee of the Fidelity funds (1990-2003). In addition, he serves as a Trustee of Boston College and as the Chairman of the Inner-City Scholarship Fund. |
Dwight D. Churchill (52) |
| Year of Election or Appointment: 2006 Vice President of International Value. Mr. Churchill also serves as Vice President of certain Equity Funds (2005-present). Mr. Churchill is Executive Vice President of FMR (2005-present) and FMR Co., Inc. (2005-present). Previously, Mr. Churchill served as Senior Vice President of Fidelity Investments Money Management, Inc. (2005-2006), Head of Fidelity's Fixed-Income Division (2000-2005), Vice President of Fidelity's Money Market Funds (2000-2005), Vice President of Fidelity's Bond Funds, and Senior Vice President of FMR. |
Eric M. Wetlaufer (44) |
| Year of Election or Appointment: 2006 Vice President of International Value. Mr. Wetlaufer also serves as Vice President of certain International Equity Funds (2006-present). Mr. Wetlaufer is Senior Vice President of FMR (2006-present) and FMR Co., Inc. (2006-present), and President and Director of Fidelity Management & Research (U.K.) Inc. (2006-present) and Fidelity Research & Analysis Company (2006-present). Before joining Fidelity Investments in 2005, Mr. Wetlaufer was a partner in Oxhead Capital Management (2004-2005). Previously, Mr. Wetlaufer served as a Chief Investment Officer of Putnam Investments (1997-2003). |
George Stairs (56) |
| Year of Election or Appointment: 2006 Vice President of International Value. Prior to his current responsibilities, Mr. Stairs worked as a portfolio manager. Prior to joining Fidelity, Mr. Stairs was a senior equity portfolio manager for Putnam. Mr. Stairs also serves as Vice President of FMR and FMR Co., Inc. (2006). |
Eric D. Roiter (57) |
| Year of Election or Appointment: 2006 Secretary of International Value. He also serves as Secretary of other Fidelity funds; Vice President, General Counsel, and Secretary of FMR Co., Inc. (2001-present) and FMR; Assistant Secretary of Fidelity Management & Research (U.K.) Inc. (2001-present), Fidelity Research & Analysis Company (2001-present), and Fidelity Investments Money Management, Inc. (2001-present). Mr. Roiter is an Adjunct Member, Faculty of Law, at Boston College Law School (2003-present). Previously, Mr. Roiter served as Vice President and Secretary of Fidelity Distributors Corporation (FDC) (1998-2005). |
Stuart Fross (47) |
| Year of Election or Appointment: 2006 Assistant Secretary of International Value. Mr. Fross also serves as Assistant Secretary of other Fidelity funds (2003-present), Vice President and Secretary of FDC (2005-present), and is an employee of FMR. |
Christine Reynolds (48) |
| Year of Election or Appointment: 2006 President and Treasurer of International Value. Ms. Reynolds also serves as President and Treasurer of other Fidelity funds (2004-present) and is a Vice President (2003-present) and an employee (2002-present) of FMR. Before joining Fidelity Investments, Ms. Reynolds worked at PricewaterhouseCoopers LLP (PwC) (1980-2002), where she was most recently an audit partner with PwC's investment management practice. |
R. Stephen Ganis (40) |
| Year of Election or Appointment: 2006 Anti-Money Laundering (AML) officer of International Value. Mr. Ganis also serves as AML officer of other Fidelity funds (2006-present) and FMR Corp. (2003-present). Before joining Fidelity Investments, Mr. Ganis practiced law at Goodwin Procter, LLP (2000-2002). |
Joseph B. Hollis (58) |
| Year of Election or Appointment: 2006 Chief Financial Officer of International Value. Mr. Hollis also serves as Chief Financial Officer of other Fidelity funds. Mr. Hollis is President of Fidelity Pricing and Cash Management Services (FPCMS) (2005- present). Mr. Hollis also serves as President and Director of Fidelity Service Company, Inc. (2006-present). Previously, Mr. Hollis served as Senior Vice President of Cash Management Services (1999-2002) and Investment Management Operations (2002-2005). |
Kenneth A. Rathgeber (59) |
| Year of Election or Appointment: 2006 Chief Compliance Officer of International Value. Mr. Rathgeber also serves as Chief Compliance Officer of other Fidelity funds (2004- present) and Executive Vice President of Risk Oversight for Fidelity Investments (2002-present). He is Chief Compliance Officer of FMR (2005-present), FMR Co., Inc. (2005-present), Fidelity Management & Research (U.K.) Inc. (2005-present), Fidelity Research & Analysis Company (2005-present), Fidelity Investments Money Management, Inc. (2005-present), and Strategic Advisers, Inc. (2005-present). Previously, Mr. Rathgeber served as Executive Vice President and Chief Operating Officer for Fidelity Investments Institutional Services Company, Inc. (1998-2002). |
Bryan A. Mehrmann (45) |
| Year of Election or Appointment: 2006 Deputy Treasurer of International Value. Mr. Mehrmann also serves as Deputy Treasurer of other Fidelity funds (2005-present) and is an employee of FMR. Previously, Mr. Mehrmann served as Vice President of Fidelity Investments Institutional Services Group (FIIS)/Fidelity Investments Institutional Operations Corporation, Inc. (FIIOC) Client Services (1998-2004). |
Kimberley H. Monasterio (42) |
| Year of Election or Appointment: 2006 Deputy Treasurer of International Value. Ms. Monasterio also serves as Deputy Treasurer of other Fidelity funds (2004) and is an employee of FMR (2004). Before joining Fidelity Investments, Ms. Monasterio served as Treasurer (2000-2004) and Chief Financial Officer (2002-2004) of the Franklin Templeton Funds and Senior Vice President of Franklin Templeton Services, LLC (2000-2004). |
Kenneth B. Robins (37) |
| Year of Election or Appointment: 2006 Deputy Treasurer of International Value. Mr. Robins also serves as Deputy Treasurer of other Fidelity funds (2005-present) and is an employee of FMR (2004-present). Before joining Fidelity Investments, Mr. Robins worked at KPMG LLP, where he was a partner in KPMG's department of professional practice (2002-2004) and a Senior Manager (1999-2000). In addition, Mr. Robins served as Assistant Chief Accountant, United States Securities and Exchange Commission (2000-2002). |
Robert G. Byrnes (39) |
| Year of Election or Appointment: 2006 Assistant Treasurer of International Value. Mr. Byrnes also serves as Assistant Treasurer of other Fidelity funds (2005-present) and is an employee of FMR (2005-present). Previously, Mr. Byrnes served as Vice President of FPCMS (2003-2005). Before joining Fidelity Investments, Mr. Byrnes worked at Deutsche Asset Management where he served as Vice President of the Investment Operations Group (2000-2003). |
John H. Costello (60) |
| Year of Election or Appointment: 2006 Assistant Treasurer of International Value. Mr. Costello also serves as Assistant Treasurer of other Fidelity funds and is an employee of FMR. |
Peter L. Lydecker (52) |
| Year of Election or Appointment: 2006 Assistant Treasurer of International Value. Mr. Lydecker also serves as Assistant Treasurer of other Fidelity funds (2004) and is an employee of FMR. |
Mark Osterheld (51) |
| Year of Election or Appointment: 2006 Assistant Treasurer of International Value. Mr. Osterheld also serves as Assistant Treasurer of other Fidelity funds (2002) and is an employee of FMR. |
Gary W. Ryan (48) |
| Year of Election or Appointment: 2006 Assistant Treasurer of International Value. Mr. Ryan also serves as Assistant Treasurer of other Fidelity funds (2005-present) and is an employee of FMR (2005-present). Previously, Mr. Ryan served as Vice President of Fund Reporting in FPCMS (1999-2005). |
Salvatore Schiavone (40) |
| Year of Election or Appointment: 2006 Assistant Treasurer of International Value. Mr. Schiavone also serves as Assistant Treasurer of other Fidelity funds (2005-present) and is an employee of FMR (2005-present). Before joining Fidelity Investments, Mr. Schiavone worked at Deutsche Asset Management, where he most recently served as Assistant Treasurer (2003-2005) of the Scudder Funds and Vice President and Head of Fund Reporting (1996-2003). |
Annual Report
Distributions
The Board of Trustees of International Value Fund voted to pay to shareholders of record at the opening of business on record date, the following distributions per share derived from capital gains realized from sales of portfolio securities, and dividends derived from net investment income:
| Pay Date | Record Date | Dividends | Capital Gains |
Fidelity International Value Fund | 12/11/06 | 12/08/06 | $.041 | $.023 |
The fund will notify shareholders in January 2007 of amounts for use in preparing 2006 income tax returns.
Annual Report
Board Approval of Investment Advisory Contracts and Management Fees
Fidelity International Value Fund
On April 20, 2006, the Board of Trustees, including the independent Trustees (together, the Board), voted to approve the management contract and subadvisory agreements (together, the Advisory Contracts) for the fund. The Board, assisted by the advice of fund counsel and independent Trustees' counsel, considered a broad range of information.
In determining whether to approve the Advisory Contracts for the fund, the Board was aware that shareholders have a broad range of investment choices available to them, including a wide choice among mutual funds offered by competitors to Fidelity, and that shareholders, with the opportunity to review and weigh the disclosure provided by the fund in its prospectus and other public disclosures, may choose to invest in this fund, managed by Fidelity.
Nature, Extent, and Quality of Services Provided. The Board considered staffing within the investment adviser, FMR, and the sub-advisers (together, the Investment Advisers), including the background of the fund's portfolio manager and the fund's investment objective and discipline.
Resources Dedicated to Investment Management and Support Services. The Board considered Fidelity's extensive global research capabilities that enable the Investment Advisers to aggregate data from various sources in an effort to produce positive investment results. The Board noted that Fidelity's analysts have access to a variety of technological tools that enable them to perform both fundamental and quantitative analysis and to specialize in various disciplines. The Board also considered that Fidelity's portfolio managers and analysts have access to daily portfolio attribution that allows for monitoring of a fund's portfolio, as well as an electronic communication system that provides immediate real-time access to research concerning issuers and credit enhancers.
Shareholder and Administrative Services. The Board considered the nature, extent, quality, and cost of administrative, distribution, and shareholder services performed by the Investment Advisers and their affiliates under the Advisory Contracts and under separate agreements covering transfer agency, pricing and bookkeeping, and securities lending services for the fund. The Board also considered the nature and extent of the Investment Advisers' supervision of third party service providers, principally custodians and subcustodians.
The Board noted that the growth of fund assets across the complex allows Fidelity to reinvest in the development of services designed to enhance the value or convenience of the Fidelity funds as investment vehicles. These services include 24-hour access to account information and market information through phone representatives and over the Internet, and investor education materials and asset allocation tools.
Investment in a Large Fund Family. The Board considered the benefits to shareholders of investing in a Fidelity fund, including the benefits of investing in a fund that is part of a large family of funds offering a variety of investment disciplines and providing for a large variety of mutual fund investor services. For example, fund shareholders are offered the privilege of exchanging shares of the fund for shares of other Fidelity funds, as set forth in the fund's prospectus, without paying an additional sales charge.
Annual Report
Board Approval of Investment Advisory Contracts and
Management Fees - continued
Investment Performance. Fidelity International Value Fund is a new fund and therefore had no historical performance for the Board to review at the time it approved the fund's Advisory Contracts. Once the fund has been in operation for at least one calendar year, the Board will review the fund's absolute investment performance for each class, as well as the fund's relative investment performance for each class measured against (i) a broad-based securities market index and (ii) a peer group of mutual funds deemed appropriate by the Board.
The Board considered that the fund's management fee is subject to upward or downward adjustment depending upon whether, and to what extent, the fund's investment performance for the performance period exceeds, or is exceeded by, the record (over the same period) of a Board-approved performance adjustment index. The Board realizes that the performance adjustment provides FMR with a strong economic incentive to seek to achieve superior performance for the fund's shareholders and helps to more closely align the interests of FMR and the fund's shareholders. The Board considered that the fund's performance adjustment fee is calculated based on the results of the retail class and does not take into account the performance of the Advisor classes. The Board considered FMR's belief that the retail class is the appropriate class on which to base the performance fee because: (i) the class does not have a 12b-1 fee; and (ii) distribution-related expenses should be excluded from the calculation because they are not related to evaluating an adviser's investment management skills.
Based on its review, the Board concluded that the nature, extent, and quality of the services provided by Fidelity will benefit the fund's shareholders, particularly in light of the Board's view that the fund's shareholders benefit from investing in a fund that is part of a large family of funds offering a variety of investment disciplines and services.
Competitiveness of Management Fee and Total Fund Expenses. The Board considered the fund's proposed management fee and projected total operating expenses for each class of the fund in reviewing the Advisory Contracts. The Board noted that the fund's proposed management fee rate is lower than the median fee rate of funds with similar Lipper investment objective categories and comparable management fee characteristics. The Board also considered that the projected total operating expenses are comparable to those of similar classes and funds that Fidelity offers to shareholders.
In its review of total expenses, the Board also noted that at previous meetings during the year it considered Fidelity fee structures and other information on clients that FMR and its affiliates service in other competitive markets, such as other mutual funds advised or subadvised by FMR or its affiliates, pension plan clients, and other institutional clients.
Annual Report
Based on its review, the Board concluded that the fund's proposed management fee and the projected total expenses for each class of the fund were fair and reasonable in light of the services that the fund and its shareholders receive and the other factors considered.
Costs of the Services and Profitability. The fund is a new fund and therefore no revenue, cost, or profitability data was available for the Board to review in respect of the fund at the time it approved the Advisory Contracts. In connection with its future renewal of the fund's management contract and sub-advisory agreements, the Board will consider the revenues earned and the expenses incurred by Fidelity in conducting the business of developing, marketing, distributing, managing, administering and servicing the fund and its shareholders.
Economies of Scale. The Board considered the extent to which the fund will benefit from economies of scale through increased services to the fund, through waivers or reimbursements, or through fee or expense reductions, including reductions that occur through operation of the transfer agent agreement. The transfer agent fee varies in part based on the number of accounts in the fund. If the number of accounts decreases or the average account size increases, the overall transfer agent fee rate decreases.
The Board recognized that the fund's management contract incorporates a "group fee" structure, which provides for lower fee rates as total fund assets under FMR's management increase, and for higher fee rates as total fund assets under FMR's management decrease. The Board considered that the group fee is designed to deliver the benefits of economies of scale to fund shareholders when total fund assets increase, even if assets of any particular fund are unchanged or have declined, because some portion of Fidelity's costs are attributable to services provided to all Fidelity funds, and all funds benefit if those costs can be allocated among more assets.
The Board concluded that, given the group fee structure, fund shareholders will achieve a certain level of economies of scale as assets under FMR's management increase at the fund complex level, regardless of whether Fidelity achieves any such economies of scale.
Additional Information Requested by the Board. In order to develop fully the factual basis for consideration of the Advisory Contracts, the Board received additional information regarding similar funds offered by other fund companies.
Based on its evaluation of all of the conclusions noted above, and after considering all material factors, the Board ultimately concluded that the advisory fee structures are fair and reasonable, and that the fund's Advisory Contracts should be approved.
Annual Report
Managing Your Investments
Fidelity offers several ways to conveniently manage your personal investments via your telephone or PC. You can access your account information, conduct trades and research your investments 24 hours a day.
By Phone
Fidelity Automated Service Telephone provides a single toll-free number to access account balances, positions, quotes and trading. It's easy to navigate the service, and on your first call, the system will help you create a personal identification number (PIN) for security.
(phone_graphic)Fidelity Automated
Service Telephone (FAST®)
1-800-544-5555
Press
1 For mutual fund and brokerage trading.
2 For quotes.*
3 For account balances and holdings.
4 To review orders and mutual
fund activity.
5 To change your PIN.
*0 To speak to a Fidelity representative.
By PC
Fidelity's web site on the Internet provides a wide range of information, including daily financial news, fund performance, interactive planning tools and news about Fidelity products and services.
(computer_graphic)Fidelity's Web Site
www.fidelity.com
* When you call the quotes line, please remember that a fund's yield and return will vary and, except for money market funds, share price will also vary. This means that you may have a gain or loss when you sell your shares. There is no assurance that money market funds will be able to maintain a stable $1 share price; an investment in a money market fund is not insured or guaranteed by the U.S. government. Total returns are historical and include changes in share price, reinvestment of dividends and capital gains, and the effects of any sales charges.
Annual Report
To Write Fidelity
We'll give your correspondence immediate attention and send you written confirmation upon completion of your request.
(letter_graphic)Making Changes
To Your Account
(such as changing name, address, bank, etc.)
Fidelity Investments
P.O. Box 770001
Cincinnati, OH 45277-0002
(letter_graphic)For Non-Retirement
Accounts
Buying shares
Fidelity Investments
P.O. Box 770001
Cincinnati, OH 45277-0003
Overnight Express
Fidelity Investments
Attn: Distribution Services
100 Crosby Parkway - KC1H
Covington, KY 41015
Selling shares
Fidelity Investments
P.O. Box 770001
Cincinnati, OH 45277-0035
Overnight Express
Fidelity Investments
Attn: Distribution Services
100 Crosby Parkway - KC1H
Covington, KY 41015
General Correspondence
Fidelity Investments
P.O. Box 500
Merrimack, NH 03054-0500
(letter_graphic)For Retirement
Accounts
Buying shares
Fidelity Investments
P.O. Box 770001
Cincinnati, OH 45277-0003
Selling shares
Fidelity Investments
P.O. Box 770001
Cincinnati, OH 45277-0035
Overnight Express
Fidelity Investments
Attn: Distribution Services
100 Crosby Parkway - KC1H
Covington, KY 41015
General Correspondence
Fidelity Investments
P.O. Box 500
Merrimack, NH 03054-0500
Annual Report
To Visit Fidelity
For directions and hours,
please call 1-800-544-9797.
Arizona
7001 West Ray Road
Chandler, AZ
15445 N. Scottsdale Road
Scottsdale, AZ
California
815 East Birch Street
Brea, CA
1411 Chapin Avenue
Burlingame, CA
851 East Hamilton Avenue
Campbell, CA
19200 Von Karman Avenue
Irvine, CA
601 Larkspur Landing Circle
Larkspur, CA
10100 Santa Monica Blvd.
Los Angeles, CA
27101 Puerta Real
Mission Viejo, CA
73-575 El Paseo
Palm Desert, CA
251 University Avenue
Palo Alto, CA
123 South Lake Avenue
Pasadena, CA
16995 Bernardo Ctr. Drive
Rancho Bernardo, CA
1220 Roseville Parkway
Roseville, CA
1740 Arden Way
Sacramento, CA
7676 Hazard Center Drive
San Diego, CA
11943 El Camino Real
San Diego, CA
8 Montgomery Street
San Francisco, CA
3793 State Street
Santa Barbara, CA
1200 Wilshire Boulevard
Santa Monica, CA
21701 Hawthorne Boulevard
Torrance, CA
2001 North Main Street
Walnut Creek, CA
6300 Canoga Avenue
Woodland Hills, CA
Colorado
1625 Broadway
Denver, CO
9185 Westview Road
Lone Tree, CO
Connecticut
48 West Putnam Avenue
Greenwich, CT
265 Church Street
New Haven, CT
300 Atlantic Street
Stamford, CT
29 South Main Street
West Hartford, CT
Delaware
400 Delaware Avenue
Wilmington, DE
Florida
4400 N. Federal Highway
Boca Raton, FL
121 Alhambra Plaza
Coral Gables, FL
2948 N. Federal Highway
Ft. Lauderdale, FL
4671 Town Center Parkway
Jacksonville, FL
1907 West State Road 434
Longwood, FL
8880 Tamiami Trail, North
Naples, FL
3501 PGA Boulevard
Palm Beach Gardens, FL
3550 Tamiami Trail, South
Sarasota, FL
1502 N. Westshore Blvd.
Tampa, FL
2465 State Road 7
Wellington, FL
Georgia
3445 Peachtree Road, N.E.
Atlanta, GA
1000 Abernathy Road
Atlanta, GA
Illinois
One North LaSalle Street
Chicago, IL
875 North Michigan Ave.
Chicago, IL
1415 West 22nd Street
Oak Brook, IL
1572 East Golf Road
Schaumburg, IL
3232 Lake Avenue
Wilmette, IL
Indiana
4729 East 82nd Street
Indianapolis, IN
Kansas
5400 College Boulevard
Overland Park, KS
Maine
Three Canal Plaza
Portland, ME
Maryland
7315 Wisconsin Avenue
Bethesda, MD
One W. Pennsylvania Ave.
Towson, MD
Massachusetts
801 Boylston Street
Boston, MA
155 Congress Street
Boston, MA
300 Granite Street
Braintree, MA
44 Mall Road
Burlington, MA
238 Main Street
Cambridge, MA
405 Cochituate Road
Framingham, MA
416 Belmont Street
Worcester, MA
Annual Report
Fidelity Brokerage Services, Inc., 100 Summer St., Boston, MA 02110 Member NYSE/SIPC
Michigan
500 E. Eisenhower Pkwy.
Ann Arbor, MI
280 Old N. Woodward Ave.
Birmingham, MI
43420 Grand River Avenue
Novi, MI
29155 Northwestern Hwy.
Southfield, MI
Minnesota
7600 France Avenue South
Edina, MN
Missouri
1524 South Lindbergh Blvd.
St. Louis, MO
Nevada
2225 Village Walk Drive
Henderson, NV
New Jersey
150 Essex Street
Millburn, NJ
56 South Street
Morristown, NJ
396 Route 17, North
Paramus, NJ
3518 Route 1 North
Princeton, NJ
530 Broad Street
Shrewsbury, NJ
New York
1055 Franklin Avenue
Garden City, NY
37 West Jericho Turnpike
Huntington Station, NY
1271 Avenue of the Americas
New York, NY
980 Madison Avenue
New York, NY
61 Broadway
New York, NY
350 Park Avenue
New York, NY
200 Fifth Avenue
New York, NY
733 Third Avenue
New York, NY
11 Penn Plaza
New York, NY
2070 Broadway
New York, NY
1075 Northern Blvd.
Roslyn, NY
799 Central Park Avenue
Scarsdale, NY
North Carolina
4611 Sharon Road
Charlotte, NC
7011 Fayetteville Road
Durham, NC
Ohio
3805 Edwards Road
Cincinnati, OH
1324 Polaris Parkway
Columbus, OH
28699 Chagrin Boulevard
Woodmere Village, OH
Oregon
7493 SW Bridgeport Road
Tigard, OR
Pennsylvania
600 West DeKalb Pike
King of Prussia, PA
1735 Market Street
Philadelphia, PA
12001 Perry Highway
Wexford, PA
Rhode Island
47 Providence Place
Providence, RI
Tennessee
6150 Poplar Avenue
Memphis, TN
Texas
10000 Research Boulevard
Austin, TX
4001 Northwest Parkway
Dallas, TX
12532 Memorial Drive
Houston, TX
2701 Drexel Drive
Houston, TX
6560 Fannin Street
Houston, TX
6500 N. MacArthur Blvd.
Irving, TX
6005 West Park Boulevard
Plano, TX
14100 San Pedro
San Antonio, TX
1576 East Southlake Blvd.
Southlake, TX
19740 IH 45 North
Spring, TX
Utah
279 West South Temple
Salt Lake City, UT
Virginia
1861 International Drive
McLean, VA
Washington
411 108th Avenue, N.E.
Bellevue, WA
1518 6th Avenue
Seattle, WA
Washington, DC
1900 K Street, N.W.
Washington, DC
Wisconsin
595 North Barker Road
Brookfield, WI
Annual Report
Annual Report
Annual Report
Investment Adviser
Fidelity Management & Research Company
Boston, MA
Investment Sub-Advisers
FMR Co., Inc.
Fidelity Management & Research
(U.K.) Inc.
Fidelity Research & Analysis Company
(formerly Fidelity Management &
Research (Far East) Inc.)
Fidelity International Investment
Advisors
Fidelity Investments Japan Limited
Fidelity International Investment
Advisors (U.K.) Limited
General Distributor
Fidelity Distributors Corporation
Boston, MA
Transfer and Service Agent
Fidelity Service Company, Inc.
Boston, MA
Custodian
Northern Trust
Chicago, Illinois
The Fidelity Telephone Connection
Mutual Fund 24-Hour Service
Exchanges/Redemptions
and Account Assistance 1-800-544-6666
Product Information 1-800-544-8888
Retirement Accounts 1-800-544-4774
(8 a.m. - 9 p.m.)
TDD Service 1-800-544-0118
for the deaf and hearing impaired
(9 a.m. - 9 p.m. Eastern time)
Fidelity Automated Service
Telephone (FAST®) (automated graphic) 1-800-544-5555
(automated graphic) Automated line for quickest service
(Fidelity Investment logo)(registered trademark)
Corporate Headquarters
82 Devonshire St., Boston, MA 02109
www.fidelity.com
FIV-UANN-1206
1.827481.100
(Fidelity Investment logo)(registered trademark)
Fidelity Advisor
International Value
Fund - Class A, Class T, Class B
and Class C
Annual Report
October 31, 2006
(2_fidelity_logos) (Registered_Trademark)
Class A, Class T, Class B, and Class C are classes of Fidelity® International Value Fund
Contents
Chairman's Message | 4 | Ned Johnson's message to shareholders. |
Shareholder Expense Example | 5 | An example of shareholder expenses. |
Investment Summary | 7 | A summary of major shifts in the fund's investments over the past six months. |
Investments | 9 | A complete list of the fund's investments with their market values. |
Financial Statements | 15 | Statements of assets and liabilities, operations, and changes in net assets,
as well as financial highlights. |
Notes | 25 | Notes to the financial statements. |
Report of Independent Registered Public Accounting Firm | 34 | |
Trustees and Officers | 35 | |
Distributions | 46 | |
Board Approval of Investment Advisory Contracts and Management Fees | 47 | |
To view a fund's proxy voting guidelines and proxy voting record for the 12-month period ended June 30, visit www.fidelity.com/proxyvotingresults or visit the Securities and Exchange Commission's (SEC) web site at www.sec.gov. You may also call 1-877-208-0098 to request a free copy of the proxy voting guidelines.
Standard & Poor's, S&P and S&P 500 are registered service marks of The McGraw-Hill Companies, Inc. and have been licensed for use by Fidelity Distributors Corporation.
Other third party marks appearing herein are the property of their respective owners.
All other marks appearing herein are registered or unregistered trademarks or service marks of FMR Corp. or an affiliated company.
Annual Report
This report and the financial statements contained herein are submitted for the general information of the shareholders of the fund. This report is not authorized for distribution to prospective investors in the fund unless preceded or accompanied by an effective prospectus.
A fund files its complete schedule of portfolio holdings with the SEC for the first and third quarters of each fiscal year on Form N-Q. Forms N-Q are available on the SEC's web site at http://www.sec.gov. A fund's Forms N-Q may be reviewed and copied at the SEC's Public Reference Room in Washington, DC. Information regarding the operation of the SEC's Public Reference Room may be obtained by calling 1-800-SEC-0330. For a complete list of a fund's portfolio holdings, view the most recent quarterly holdings report, semiannual report, or annual report on Fidelity's web site at http://www.advisor.fidelity.com.
NOT FDIC INSURED · MAY LOSE VALUE · NO BANK GUARANTEE
Neither the fund nor Fidelity Distributors Corporation is a bank.
Annual Report
Chairman's Message
(photo_of_Edward_C_Johnson_3d)
Dear Shareholder:
Stock and bond markets around the world have seen largely positive results year to date, although weakness in the technology sector and growth stocks in general have tempered performance. While financial markets are always unpredictable, there are a number of time-tested principles that can put the historical odds in your favor.
One of the basic tenets is to invest for the long term. Over time, riding out the markets' inevitable ups and downs has proven much more effective than selling into panic or chasing the hottest trend. Even missing only a few of the markets' best days can significantly diminish investor returns. Patience also affords the benefits of compounding - of earning interest on additional income or reinvested dividends and capital gains. There are tax advantages and cost benefits to consider as well. The more you sell, the more taxes you pay, and the more you trade, the higher the costs. While staying the course doesn't eliminate risk, it can considerably lessen the effect of short-term declines.
You can further manage your investing risk through diversification. And today, more than ever, geographic diversification should be taken into account. Studies indicate that asset allocation is the single most important determinant of a portfolio's long-term success. The right mix of stocks, bonds and cash - aligned to your particular risk tolerance and investment objective - is very important. Age-appropriate rebalancing is also an essential aspect of asset allocation. For younger investors, an emphasis on equities - which historically have been the best performing asset class over time - is encouraged. As investors near their specific goal, such as retirement or sending a child to college, consideration may be given to replacing volatile assets (e.g. common stocks) with more-stable fixed investments (bonds or savings plans).
A third investment principle - investing regularly - can help lower the average cost of your purchases. Investing a certain amount of money each month or quarter helps ensure you won't pay for all your shares at market highs. This strategy - known as dollar cost averaging - also reduces unconstructive "emotion" from investing, helping shareholders avoid selling weak performers just prior to an upswing, or chasing a hot performer just before a correction.
We invite you to contact us via the Internet, through our Investor Centers or over the phone. It is our privilege to provide you the information you need to make the investments that are right for you.
Sincerely,
/s/Edward C. Johnson 3d
Edward C. Johnson 3d
Annual Report
Shareholder Expense Example
As a shareholder of the Fund, you incur two types of costs: (1) transaction costs, including sales charges (loads) on purchase payments or redemption proceeds, redemption fees, and (2) ongoing costs, including management fees, distribution and/or service (12b-1) fees and other Fund expenses. This Example is intended to help you understand your ongoing costs (in dollars) of investing in the Fund and to compare these costs with the ongoing costs of investing in other mutual funds.
The actual expense Example is based on an investment of $1,000 invested at the beginning of the period and held for the entire period (May 18, 2006 to October 31, 2006). The hypothetical expense Example is based on an investment of $1,000 invested for the one-half year period (May 1, 2006 to October 31, 2006).
Actual Expenses
The first line of the accompanying table for each class of the Fund provides information about actual account values and actual expenses. You may use the information in this line, together with the amount you invested, to estimate the expenses that you paid over the period. Simply divide your account value by $1,000.00 (for example, an $8,600 account value divided by $1,000.00 = 8.6), then multiply the result by the number in the first line for a class of the Fund under the heading entitled "Expenses Paid During Period" to estimate the expenses you paid on your account during this period. A small balance maintenance fee of $12.00 that is charged once a year may apply for certain accounts with a value of less than $2,000. This fee is not included in the table below. If it was, the estimate of expenses you paid during the period would be higher, and your ending account value lower, by this amount.
Hypothetical Example for Comparison Purposes
The second line of the accompanying table for each class of the Fund provides information about hypothetical account values and hypothetical expenses based on a Class' actual expense ratio and an assumed rate of return of 5% per year before expenses, which is not the Class' actual return. The hypothetical account values and expenses may not be used to estimate the actual ending account balance or expenses you paid for the period. You may use this information to compare the ongoing costs of investing in the Fund and other funds. To do so, compare this 5% hypothetical example with the 5% hypothetical examples that appear in the shareholder reports of the other funds. A small balance maintenance fee of $12.00 that is charged once a year may apply for certain accounts with a value of less than $2,000. This fee is not included in the table below. If it was, the estimate of expenses you paid during the period would be higher, and your ending account value lower, by this amount.
Annual Report
Shareholder Expense Example - continued
Please note that the expenses shown in the table are meant to highlight your ongoing costs only and do not reflect any transaction costs. Therefore, the second line of the table is useful in comparing ongoing costs only, and will not help you determine the relative total costs of owning different funds. In addition, if these transactional costs were included, your costs would have been higher.
| Beginning
Account Value | Ending
Account Value | Expenses Paid
During Period |
Class A | | | |
Actual | $ 1,000.00 | $ 1,060.00 | $ 7.07 B |
HypotheticalA | $ 1,000.00 | $ 1,017.64 | $ 7.63 C |
Class T | | | |
Actual | $ 1,000.00 | $ 1,059.00 | $ 8.24 B |
HypotheticalA | $ 1,000.00 | $ 1,016.38 | $ 8.89 C |
Class B | | | |
Actual | $ 1,000.00 | $ 1,056.00 | $ 10.58 B |
HypotheticalA | $ 1,000.00 | $ 1,013.86 | $ 11.42 C |
Class C | | | |
Actual | $ 1,000.00 | $ 1,056.00 | $ 10.58 B |
HypotheticalA | $ 1,000.00 | $ 1,013.86 | $ 11.42 C |
International Value | | | |
Actual | $ 1,000.00 | $ 1,061.00 | $ 5.89 B |
HypotheticalA | $ 1,000.00 | $ 1,018.90 | $ 6.36 C |
Institutional Class | | | |
Actual | $ 1,000.00 | $ 1,061.00 | $ 5.89 B |
HypotheticalA | $ 1,000.00 | $ 1,018.90 | $ 6.36 C |
A 5% return per year before expenses
B Actual expenses are equal to each Class' annualized expense ratio (shown in the table below); multiplied by the average account value over the period, multiplied by 167/365 (to reflect the period May 18, 2006 to October 31, 2006).
C Hypothetical expenses are equal to each Class' annualized expense ratio (shown in the table below); multiplied by the average account value over the period, multiplied by 184/365 (to reflect the one-half year period).
| Annualized
Expense Ratio |
Class A | 1.50% |
Class T | 1.75% |
Class B | 2.25% |
Class C | 2.25% |
International Value | 1.25% |
Institutional Class | 1.25% |
Annual Report
Investment Summary
Geographic Diversification (% of fund's net assets) |
As of October 31, 2006 |
| Japan 19.9% |
| United Kingdom 17.8% |
| Germany 10.2% |
| Switzerland 9.4% |
| France 8.6% |
| Italy 4.6% |
| Netherlands 3.3% |
| Canada 3.3% |
| Norway 2.9% |
| Other 20.0% |

Percentages are adjusted for the effect of futures contracts, if applicable. |
Asset Allocation |
| % of fund's
net assets |
Stocks | 98.0 |
Short-Term Investments and Net Other Assets | 2.0 |
Top Ten Stocks as of October 31, 2006 |
| % of fund's
net assets |
Royal Bank of Scotland Group PLC (United Kingdom, Commercial Banks) | 4.0 |
HSBC Holdings PLC (United Kingdom) (Reg.) (United Kingdom, Commercial Banks) | 2.8 |
ENI Spa sponsored ADR (Italy, Oil, Gas & Consumable Fuels) | 2.6 |
Barclays PLC (United Kingdom, Commercial Banks) | 2.5 |
ING Groep NV sponsored ADR (Netherlands, Diversified Financial Services) | 2.4 |
UBS AG (NY Shares) (Switzerland, Capital Markets) | 2.3 |
Mitsui & Co. Ltd. (Japan, Trading Companies & Distributors) | 2.2 |
Allianz AG sponsored ADR (Germany, Insurance) | 2.2 |
GlobalSantaFe Corp. (Cayman Islands, Energy Equipment & Services) | 2.1 |
Toyota Motor Corp. (Japan, Automobiles) | 2.0 |
| 25.1 |
Market Sectors as of October 31, 2006 |
| % of fund's
net assets |
Financials | 40.3 |
Energy | 11.3 |
Industrials | 8.9 |
Consumer Discretionary | 7.5 |
Information Technology | 7.4 |
Utilities | 5.7 |
Consumer Staples | 5.8 |
Materials | 5.5 |
Health Care | 3.1 |
Telecommunication Services | 2.5 |
Annual Report
Investments October 31, 2006
Showing Percentage of Net Assets
Common Stocks - 98.0% |
| Shares | | Value (Note 1) |
Australia - 2.0% |
Australia & New Zealand Banking Group Ltd. | 35,900 | | $ 807,079 |
Macquarie Airports unit | 326,000 | | 810,117 |
National Australia Bank Ltd. | 82,300 | | 2,422,912 |
Zinifex Ltd. | 54,000 | | 634,168 |
TOTAL AUSTRALIA | | 4,674,276 |
Austria - 1.1% |
OMV AG | 46,400 | | 2,522,391 |
Brazil - 1.0% |
Companhia Vale do Rio Doce sponsored ADR | 50,000 | | 1,272,000 |
Uniao de Bancos Brasileiros SA (Unibanco) GDR | 13,300 | | 1,047,375 |
TOTAL BRAZIL | | 2,319,375 |
Canada - 3.3% |
Canadian Natural Resources Ltd. | 47,900 | | 2,493,881 |
Cognos, Inc. (a) | 52,700 | | 1,922,496 |
Finning International, Inc. | 25,500 | | 902,886 |
Power Corp. of Canada (sub. vtg.) | 36,000 | | 1,090,598 |
RONA, Inc. (a) | 56,500 | | 1,147,464 |
TOTAL CANADA | | 7,557,325 |
Cayman Islands - 2.1% |
GlobalSantaFe Corp. | 95,400 | | 4,951,260 |
China - 0.3% |
Dongfeng Motor Group Co. Ltd. (H Shares) | 1,748,000 | | 782,163 |
Czech Republic - 0.4% |
Ceske Energeticke Zavody AS | 23,600 | | 933,264 |
Finland - 0.5% |
Nokia Corp. sponsored ADR | 58,000 | | 1,153,040 |
France - 8.6% |
Accor SA | 21,300 | | 1,478,990 |
AXA SA sponsored ADR | 73,400 | | 2,798,008 |
BNP Paribas SA | 13,400 | | 1,473,489 |
Carrefour SA | 28,200 | | 1,718,376 |
Compagnie de St. Gobain | 48,200 | | 3,552,923 |
Pernod Ricard SA | 11,700 | | 2,343,126 |
Peugeot Citroen SA | 14,500 | | 833,036 |
Societe Generale Series A | 16,335 | | 2,714,669 |
Suez SA (France) | 20,800 | | 930,812 |
Total SA sponsored ADR | 29,700 | | 2,023,758 |
TOTAL FRANCE | | 19,867,187 |
Common Stocks - continued |
| Shares | | Value (Note 1) |
Germany - 10.2% |
Allianz AG sponsored ADR | 267,600 | | $ 4,974,684 |
BASF AG sponsored ADR | 49,300 | | 4,337,414 |
DaimlerChrysler AG | 31,600 | | 1,798,988 |
E.ON AG | 38,900 | | 4,683,171 |
Heidelberger Druckmaschinen AG | 24,700 | | 1,124,256 |
KarstadtQuelle AG (a)(d) | 70,000 | | 1,644,003 |
Muenchener Rueckversicherungs-Gesellschaft AG (Reg.) | 27,100 | | 4,399,212 |
RWE AG | 5,600 | | 553,457 |
TOTAL GERMANY | | 23,515,185 |
Greece - 0.4% |
Greek Organization of Football Prognostics SA | 24,800 | | 885,699 |
Hong Kong - 2.1% |
Swire Pacific Ltd. (A Shares) | 415,300 | | 4,386,784 |
Yue Yuen Industrial Holdings Ltd. | 158,000 | | 478,437 |
TOTAL HONG KONG | | 4,865,221 |
India - 0.5% |
Satyam Computer Services Ltd. | 22,028 | | 215,670 |
Satyam Computer Services Ltd. sponsored ADR | 41,400 | | 915,354 |
TOTAL INDIA | | 1,131,024 |
Ireland - 0.6% |
Bank of Ireland | 45,900 | | 922,590 |
Kerry Group PLC Class A | 19,200 | | 463,915 |
TOTAL IRELAND | | 1,386,505 |
Israel - 0.2% |
Teva Pharmaceutical Industries Ltd. sponsored ADR | 12,400 | | 408,828 |
Italy - 4.6% |
Banca Intesa Spa | 104,000 | | 710,985 |
ENI Spa sponsored ADR (d) | 100,800 | | 6,119,568 |
Mediaset Spa | 79,300 | | 889,711 |
San Paolo IMI Spa | 49,400 | | 1,053,949 |
Unicredito Italiano Spa | 229,000 | | 1,898,752 |
TOTAL ITALY | | 10,672,965 |
Japan - 19.9% |
Aeon Credit Service Co. Ltd. | 31,000 | | 693,100 |
Asahi Breweries Ltd. | 46,900 | | 668,453 |
Astellas Pharma, Inc. | 13,600 | | 612,791 |
Canon, Inc. | 86,850 | | 4,636,922 |
Common Stocks - continued |
| Shares | | Value (Note 1) |
Japan - continued |
Daiwa Securities Group, Inc. | 140,000 | | $ 1,588,406 |
East Japan Railway Co. | 530 | | 3,706,738 |
Fujitsu Ltd. | 85,000 | | 693,314 |
Japan Tobacco, Inc. | 200 | | 872,093 |
Konica Minolta Holdings, Inc. | 66,500 | | 885,833 |
Mitsui & Co. Ltd. | 373,000 | | 5,093,032 |
Mizuho Financial Group, Inc. | 598 | | 4,657,815 |
Nippon Oil Corp. | 448,000 | | 3,332,421 |
Nippon Steel Corp. | 124,000 | | 504,651 |
Nippon Yusen KK | 107,000 | | 694,366 |
ORIX Corp. | 12,430 | | 3,501,783 |
Ricoh Co. Ltd. | 64,000 | | 1,264,022 |
Shin-Etsu Chemical Co. Ltd. | 8,700 | | 570,528 |
Sumitomo Mitsui Financial Group, Inc. | 109 | | 1,192,887 |
Sumitomo Trust & Banking Co. Ltd. | 91,000 | | 978,779 |
Takeda Pharamaceutical Co. Ltd. | 16,700 | | 1,072,307 |
Tokyo Gas Co. Ltd. (d) | 784,000 | | 4,001,779 |
Toyota Motor Corp. | 79,400 | | 4,684,600 |
TOTAL JAPAN | | 45,906,620 |
Korea (South) - 1.6% |
Kookmin Bank sponsored ADR | 14,300 | | 1,134,848 |
Samsung Electronics Co. Ltd. GDR | 8,171 | | 2,649,447 |
TOTAL KOREA (SOUTH) | | 3,784,295 |
Netherlands - 3.3% |
ING Groep NV sponsored ADR | 124,900 | | 5,536,817 |
Royal DSM NV | 18,300 | | 834,118 |
TomTom Group BV (a) | 28,800 | | 1,216,767 |
TOTAL NETHERLANDS | | 7,587,702 |
Norway - 2.9% |
DnB Nor ASA | 212,600 | | 2,784,102 |
Fred Olsen Energy ASA (a)(d) | 47,500 | | 2,049,231 |
Petroleum Geo-Services ASA (a) | 18,500 | | 1,076,898 |
Statoil ASA | 31,300 | | 791,287 |
TOTAL NORWAY | | 6,701,518 |
Philippines - 0.3% |
Philippine Long Distance Telephone Co. sponsored ADR (d) | 13,600 | | 647,496 |
Common Stocks - continued |
| Shares | | Value (Note 1) |
Russia - 0.4% |
OAO Gazprom sponsored ADR | 20,500 | | $ 873,300 |
OAO TMK unit | 4,700 | | 118,675 |
TOTAL RUSSIA | | 991,975 |
Singapore - 0.5% |
DBS Group Holdings Ltd. | 89,000 | | 1,165,789 |
South Africa - 0.2% |
FirstRand Ltd. | 181,300 | | 474,275 |
Spain - 2.0% |
Banco Bilbao Vizcaya Argentaria SA sponsored ADR | 104,400 | | 2,526,480 |
Gestevision Telecinco SA | 18,900 | | 496,712 |
Telefonica SA sponsored ADR | 27,600 | | 1,592,520 |
TOTAL SPAIN | | 4,615,712 |
Sweden - 0.5% |
Atlas Copco AB (A Shares) | 35,800 | | 1,045,885 |
Switzerland - 9.4% |
Adecco SA (Reg.) | 19,534 | | 1,206,597 |
Credit Suisse Group sponsored ADR | 71,500 | | 4,324,320 |
Nestle SA (Reg.) | 10,517 | | 3,592,593 |
Novartis AG sponsored ADR | 52,100 | | 3,164,033 |
Roche Holding AG (participation certificate) | 9,058 | | 1,584,959 |
Swiss Reinsurance Co. (Reg.) | 15,857 | | 1,300,015 |
UBS AG (NY Shares) | 90,700 | | 5,427,488 |
Zurich Financial Services AG (Reg.) | 4,906 | | 1,212,551 |
TOTAL SWITZERLAND | | 21,812,556 |
Taiwan - 0.7% |
AU Optronics Corp. | 663,000 | | 895,325 |
Hon Hai Precision Industry Co. Ltd. (Foxconn) | 117,200 | | 761,314 |
TOTAL TAIWAN | | 1,656,639 |
Turkey - 0.3% |
Turkiye Garanti Bankasi AS | 157,000 | | 576,394 |
United Kingdom - 17.8% |
BAE Systems PLC | 125,100 | | 1,001,045 |
Barclays PLC | 422,200 | | 5,732,421 |
BHP Billiton PLC | 180,900 | | 3,488,625 |
British American Tobacco PLC | 90,900 | | 2,499,750 |
HSBC Holdings PLC (United Kingdom) (Reg.) | 337,400 | | 6,442,316 |
National Grid PLC | 173,100 | | 2,212,261 |
Prudential PLC | 150,028 | | 1,838,696 |
Common Stocks - continued |
| Shares | | Value (Note 1) |
United Kingdom - continued |
Royal Bank of Scotland Group PLC | 261,500 | | $ 9,317,797 |
SABMiller PLC | 24,900 | | 481,617 |
Smiths Group PLC | 78,500 | | 1,416,528 |
Taylor Woodrow PLC | 74,600 | | 517,614 |
Tesco PLC | 78,700 | | 590,723 |
Vedanta Resources PLC | 29,400 | | 819,897 |
Vodafone Group PLC sponsored ADR | 133,712 | | 3,456,455 |
Yell Group PLC | 104,400 | | 1,240,661 |
TOTAL UNITED KINGDOM | | 41,056,406 |
United States of America - 0.3% |
NTL, Inc. | 27,900 | | 754,137 |
TOTAL COMMON STOCKS (Cost $214,334,562) | 226,403,107 |
Money Market Funds - 6.6% |
| | | |
Fidelity Cash Central Fund, 5.34% (b) | 5,932,157 | | 5,932,157 |
Fidelity Securities Lending Cash Central Fund, 5.35% (b)(c) | 9,393,970 | | 9,393,970 |
TOTAL MONEY MARKET FUNDS (Cost $15,326,127) | 15,326,127 |
TOTAL INVESTMENT PORTFOLIO - 104.6% (Cost $229,660,689) | | 241,729,234 |
NET OTHER ASSETS - (4.6)% | | (10,722,305) |
NET ASSETS - 100% | $ 231,006,929 |
Legend |
(a) Non-income producing |
(b) Affiliated fund that is available only to investment companies and other accounts managed by Fidelity Investments. The rate quoted is the annualized seven-day yield of the fund at period end. A complete unaudited listing of the fund's holdings as of its most recent quarter end is available upon request. |
(c) Investment made with cash collateral received from securities on loan. |
(d) Security or a portion of the security is on loan at period end. |
Affiliated Central Funds |
Information regarding fiscal year to date income earned by the Fund from investments in Fidelity Central Funds is as follows: |
Fund | Income earned |
Fidelity Cash Central Fund | $ 100,857 |
Fidelity Securities Lending Cash Central Fund | 9,903 |
Total | $ 110,760 |
Annual Report
See accompanying notes which are an integral part of the financial statements.
Financial Statements
Statement of Assets and Liabilities
October 31, 2006 |
| | |
Assets | | |
Investment in securities, at value (including securities loaned of $9,036,737) - See accompanying schedule: Unaffiliated issuers (cost $214,334,562) | $ 226,403,107 | |
Fidelity Central Funds (cost $15,326,127) | 15,326,127 | |
Total Investments (cost $229,660,689) | | $ 241,729,234 |
Foreign currency held at value (cost $248,717) | | 248,942 |
Receivable for fund shares sold | | 1,750,129 |
Dividends receivable | | 323,734 |
Interest receivable | | 32,830 |
Prepaid expenses | | 43,035 |
Receivable from investment adviser for expense reductions | | 70,766 |
Other receivables | | 18,406 |
Total assets | | 244,217,076 |
| | |
Liabilities | | |
Payable to custodian bank | $ 1,035 | |
Payable for investments purchased | 3,232,815 | |
Payable for fund shares redeemed | 284,256 | |
Accrued management fee | 162,096 | |
Distribution fees payable | 3,724 | |
Other affiliated payables | 36,110 | |
Other payables and accrued expenses | 96,141 | |
Collateral on securities loaned, at value | 9,393,970 | |
Total liabilities | | 13,210,147 |
| | |
Net Assets | | $ 231,006,929 |
Net Assets consist of: | | |
Paid in capital | | $ 218,143,761 |
Undistributed net investment income | | 808,421 |
Accumulated undistributed net realized gain (loss) on investments and foreign currency transactions | | (6,746) |
Net unrealized appreciation (depreciation) on investments and assets and liabilities in foreign currencies | | 12,061,493 |
Net Assets | | $ 231,006,929 |
Annual Report
See accompanying notes which are an integral part of the financial statements.
Financial Statements - continued
Statement of Assets and Liabilities - continued
October 31, 2006 |
| | |
Calculation of Maximum Offering Price
Class A:
Net Asset Value and redemption price per share
($1,537,484 ÷ 145,057 shares) | | $ 10.60 |
| | |
Maximum offering price per share (100/94.25 of $10.60) | | $ 11.25 |
Class T:
Net Asset Value and redemption price per share
($1,788,679 ÷ 168,964 shares) | | $ 10.59 |
| | |
Maximum offering price per share (100/96.50 of $10.59) | | $ 10.97 |
Class B:
Net Asset Value and offering price per share
($1,303,770 ÷ 123,443 shares)A | | $ 10.56 |
| | |
Class C:
Net Asset Value and offering price per share
($2,183,270 ÷ 206,711 shares)A | | $ 10.56 |
| | |
International Value:
Net Asset Value, offering price and redemption price per
share ($221,129,843 ÷ 20,842,605 shares) | | $ 10.61 |
| | |
Institutional Class:
Net Asset Value, offering price and redemption price per
share ($3,063,883 ÷ 288,807 shares) | | $ 10.61 |
A Redemption price per share is equal to net asset value less any applicable contingent deferred sales charge.
Annual Report
See accompanying notes which are an integral part of the financial statements.
Statement of Operations
For the period May 18, 2006 (commencement of operations) to October 31, 2006 |
| | |
Investment Income | | |
Dividends | | $ 1,091,719 |
Special dividends | | 353,113 |
Interest | | 7,169 |
Income from Fidelity Central Funds | | 110,760 |
| | 1,562,761 |
Less foreign taxes withheld | | (90,621) |
Total income | | 1,472,140 |
| | |
Expenses | | |
Management fee | $ 380,865 | |
Transfer agent fees | 125,699 | |
Distribution fees | 15,801 | |
Accounting and security lending fees | 29,229 | |
Custodian fees and expenses | 132,076 | |
Independent trustees' compensation | 137 | |
Registration fees | 81,756 | |
Audit | 48,886 | |
Legal | 275 | |
Total expenses before reductions | 814,724 | |
Expense reductions | (151,005) | 663,719 |
Net investment income (loss) | | 808,421 |
Realized and Unrealized Gain (Loss) Net realized gain (loss) on: | | |
Investment securities: | | |
Unaffiliated issuers | 4,399 | |
Foreign currency transactions | (11,145) | |
Total net realized gain (loss) | | (6,746) |
Change in net unrealized appreciation (depreciation) on: Investment securities (net of increase in deferred foreign taxes of $7,086) | 12,061,459 | |
Assets and liabilities in foreign currencies | 34 | |
Total change in net unrealized appreciation (depreciation) | | 12,061,493 |
Net gain (loss) | | 12,054,747 |
Net increase (decrease) in net assets resulting from operations | | $ 12,863,168 |
Annual Report
See accompanying notes which are an integral part of the financial statements.
Financial Statements - continued
Statement of Changes in Net Assets
| For the period
May 18, 2006 (commencement of operations) to
October 31, 2006 |
Increase (Decrease) in Net Assets | |
Operations | |
Net investment income (loss) | $ 808,421 |
Net realized gain (loss) | (6,746) |
Change in net unrealized appreciation (depreciation) | 12,061,493 |
Net increase (decrease) in net assets resulting from operations | 12,863,168 |
Share transactions - net increase (decrease) | 218,123,163 |
Redemption fees | 20,598 |
Total increase (decrease) in net assets | 231,006,929 |
| |
Net Assets | |
Beginning of period | - |
End of period (including undistributed net investment
income of $808,421) | $ 231,006,929 |
Annual Report
See accompanying notes which are an integral part of the financial statements.
Financial Highlights - Class A
Period ended October 31, | 2006 I |
Selected Per-Share Data | |
Net asset value, beginning of period | $ 10.00 |
Income from Investment Operations | |
Net investment income (loss) E | .06 H |
Net realized and unrealized gain (loss) | .54 |
Total from investment operations | .60 |
Redemption fees added to paid in capital E | - K |
Net asset value, end of period | $ 10.60 |
Total Return B, C, D | 6.00% |
Ratios to Average Net Assets F, J | |
Expenses before reductions | 1.75% A |
Expenses net of fee waivers, if any | 1.50%A |
Expenses net of all reductions | 1.46%A |
Net investment income (loss) | 1.29%A, H |
Supplemental Data | |
Net assets, end of period (000 omitted) | $ 1,537 |
Portfolio turnover rate G | 29%A |
A Annualized
B Total returns for periods of less than one year are not annualized.
C Total returns would have been lower had certain expenses not been reduced during the periods shown.
D Total returns do not include the effect of the sales charges.
E Calculated based on average shares outstanding during the period.
F Fees and expenses of the underlying Fidelity Central Funds are not included in the Fund's expense ratio. The Fund indirectly bears its proportionate share of the expenses of any underlying Fidelity Central Funds.
G Amount does not include the portfolio activity of any underlying Fidelity Central Funds.
H Investment income per share reflects a special dividend which amounted to $.03 per share. Excluding the special dividend, the ratio of net investment income (loss) to average net assets would have been .63%.
I For the period May 18, 2006 (commencement of operations) to October 31, 2006.
J Expense ratios reflect operating expenses of the class. Expenses before reductions do not reflect amounts reimbursed by the investment adviser or reductions from brokerage service arrangements or other expense offset arrangements and do not represent the amount paid by the class during periods when reimbursements or reductions occur. Expense ratios before reductions for start-up periods may not be representative of longer-term operating periods. Expenses net of fee waivers reflect expenses after reimbursement by the investment adviser but prior to reductions from brokerage service arrangements or other expense offset arrangements. Expenses net of all reductions represent the net expenses paid by the class.
K Amount represents less than $.01 per share.
Annual Report
See accompanying notes which are an integral part of the financial statements.
Financial Highlights - Class T
Period ended October 31, | 2006 I |
Selected Per-Share Data | |
Net asset value, beginning of period | $ 10.00 |
Income from Investment Operations | |
Net investment income (loss) E | .05 H |
Net realized and unrealized gain (loss) | .54 |
Total from investment operations | .59 |
Redemption fees added to paid in capital E | - K |
Net asset value, end of period | $ 10.59 |
Total Return B, C, D | 5.90% |
Ratios to Average Net Assets F, J | |
Expenses before reductions | 2.01% A |
Expenses net of fee waivers, if any | 1.75%A |
Expenses net of all reductions | 1.71%A |
Net investment income (loss) | 1.04%A, H |
Supplemental Data | |
Net assets, end of period (000 omitted) | $ 1,789 |
Portfolio turnover rate G | 29%A |
A Annualized
B Total returns for periods of less than one year are not annualized.
C Total returns would have been lower had certain expenses not been reduced during the periods shown.
D Total returns do not include the effect of the sales charges.
E Calculated based on average shares outstanding during the period.
F Fees and expenses of the underlying Fidelity Central Funds are not included in the Fund's expense ratio. The Fund indirectly bears its proportionate share of the expenses of any underlying Fidelity Central Funds.
G Amount does not include the portfolio activity of any underlying Fidelity Central Funds.
H Investment income per share reflects a special dividend which amounted to $.03 per share. Excluding the special dividend, the ratio of net investment income (loss) to average net assets would have been .38%.
I For the period May 18, 2006 (commencement of operations) to October 31, 2006.
J Expense ratios reflect operating expenses of the class. Expenses before reductions do not reflect amounts reimbursed by the investment adviser or reductions from brokerage service arrangements or other expense offset arrangements and do not represent the amount paid by the class during periods when reimbursements or reductions occur. Expense ratios before reductions for start-up periods may not be representative of longer-term operating periods. Expenses net of fee waivers reflect expenses after reimbursement by the investment adviser but prior to reductions from brokerage service arrangements or other expense offset arrangements. Expenses net of all reductions represent the net expenses paid by the class.
K Amount represents less than $.01 per share.
Annual Report
See accompanying notes which are an integral part of the financial statements.
Financial Highlights - Class B
Period ended October 31, | 2006 I |
Selected Per-Share Data | |
Net asset value, beginning of period | $ 10.00 |
Income from Investment Operations | |
Net investment income (loss) E | .02 H |
Net realized and unrealized gain (loss) | .54 |
Total from investment operations | .56 |
Redemption fees added to paid in capital E | - K |
Net asset value, end of period | $ 10.56 |
Total Return B, C, D | 5.60% |
Ratios to Average Net Assets F, J | |
Expenses before reductions | 2.50%A |
Expenses net of fee waivers, if any | 2.25%A |
Expenses net of all reductions | 2.21%A |
Net investment income (loss) | .54%A, H |
Supplemental Data | |
Net assets, end of period (000 omitted) | $ 1,304 |
Portfolio turnover rate G | 29% A |
A Annualized
B Total returns for periods of less than one year are not annualized.
C Total returns would have been lower had certain expenses not been reduced during the periods shown.
D Total returns do not include the effect of the contingent deferred sales charge.
E Calculated based on average shares outstanding during the period.
F Fees and expenses of the underlying Fidelity Central Funds are not included in the Fund's expense ratio. The Fund indirectly bears its proportionate share of the expenses of any underlying Fidelity Central Funds.
G Amount does not include the portfolio activity of any underlying Fidelity Central Funds.
H Investment income per share reflects a special dividend which amounted to $.03 per share. Excluding the special dividend, the ratio of net investment income (loss) to average net assets would have been (.12)%.
I For the period May 18, 2006 (commencement of operations) to October 31, 2006.
J Expense ratios reflect operating expenses of the class. Expenses before reductions do not reflect amounts reimbursed by the investment adviser or reductions from brokerage service arrangements or other expense offset arrangements and do not represent the amount paid by the class during periods when reimbursements or reductions occur. Expense ratios before reductions for start-up periods may not be representative of longer-term operating periods. Expenses net of fee waivers reflect expenses after reimbursement by the investment adviser but prior to reductions from brokerage service arrangements or other expense offset arrangements. Expenses net of all reductions represent the net expenses paid by the class.
K Amount represents less than $.01 per share.
Annual Report
See accompanying notes which are an integral part of the financial statements.
Financial Highlights - Class C
Period ended October 31, | 2006 I |
Selected Per-Share Data | |
Net asset value, beginning of period | $ 10.00 |
Income from Investment Operations | |
Net investment income (loss) E | .02 H |
Net realized and unrealized gain (loss) | .54 |
Total from investment operations | .56 |
Redemption fees added to paid in capital E | - K |
Net asset value, end of period | $ 10.56 |
Total Return B, C, D | 5.60% |
Ratios to Average Net Assets F, J | |
Expenses before reductions | 2.47%A |
Expenses net of fee waivers, if any | 2.25%A |
Expenses net of all reductions | 2.21%A |
Net investment income (loss) | .54%A, H |
Supplemental Data | |
Net assets, end of period (000 omitted) | $ 2,183 |
Portfolio turnover rate G | 29%A |
A Annualized
B Total returns for periods of less than one year are not annualized.
C Total returns would have been lower had certain expenses not been reduced during the periods shown.
D Total returns do not include the effect of the contingent deferred sales charge.
E Calculated based on average shares outstanding during the period.
F Fees and expenses of the underlying Fidelity Central Funds are not included in the Fund's expense ratio. The Fund indirectly bears its proportionate share of the expenses of any underlying Fidelity Central Funds.
G Amount does not include the portfolio activity of any underlying Fidelity Central Funds.
H Investment income per share reflects a special dividend which amounted to $.03 per share. Excluding the special dividend, the ratio of net investment income (loss) to average net assets would have been (.12)%.
I For the period May 18, 2006 (commencement of operations) to October 31, 2006.
J Expense ratios reflect operating expenses of the class. Expenses before reductions do not reflect amounts reimbursed by the investment adviser or reductions from brokerage service arrangements or other expense offset arrangements and do not represent the amount paid by the class during periods when reimbursements or reductions occur. Expense ratios before reductions for start-up periods may not be representative of longer-term operating periods. Expenses net of fee waivers reflect expenses after reimbursement by the investment adviser but prior to reductions from brokerage service arrangements or other expense offset arrangements. Expenses net of all reductions represent the net expenses paid by the class.
K Amount represents less than $.01 per share.
Annual Report
See accompanying notes which are an integral part of the financial statements.
Financial Highlights - International Value
Period ended October 31, | 2006 H |
Selected Per-Share Data | |
Net asset value, beginning of period | $ 10.00 |
Income from Investment Operations | |
Net investment income (loss) D | .07 G |
Net realized and unrealized gain (loss) | .54 |
Total from investment operations | .61 |
Redemption fees added to paid in capital D | -J |
Net asset value, end of period | $ 10.61 |
Total Return B, C | 6.10% |
Ratios to Average Net Assets E, I | |
Expenses before reductions | 1.50%A |
Expenses net of fee waivers, if any | 1.25%A |
Expenses net of all reductions | 1.21%A |
Net investment income (loss) | 1.54%A, G |
Supplemental Data | |
Net assets, end of period (000 omitted) | $ 221,130 |
Portfolio turnover rate F | 29%A |
A Annualized
B Total returns for periods of less than one year are not annualized.
C Total returns would have been lower had certain expenses not been reduced during the periods shown.
D Calculated based on average shares outstanding during the period.
E Fees and expenses of the underlying Fidelity Central Funds are not included in the Fund's expense ratio. The Fund indirectly bears its proportionate share of the expenses of any underlying Fidelity Central Funds.
F Amount does not include the portfolio activity of any underlying Fidelity Central Funds.
G Investment income per share reflects a special dividend which amounted to $.03 per share. Excluding the special dividend, the ratio of net investment income (loss) to average net assets would have been .88%.
H For the period May 18, 2006 (commencement of operations) to October 31, 2006.
I Expense ratios reflect operating expenses of the class. Expenses before reductions do not reflect amounts reimbursed by the investment adviser or reductions from brokerage service arrangements or other expense offset arrangements and do not represent the amount paid by the class during periods when reimbursements or reductions occur. Expense ratios before reductions for start-up periods may not be representative of longer-term operating periods. Expenses net of fee waivers reflect expenses after reimbursement by the investment adviser but prior to reductions from brokerage service arrangements or other expense offset arrangements. Expenses net of all reductions represent the net expenses paid by the class.
J Amount represents less than $.01 per share.
Annual Report
See accompanying notes which are an integral part of the financial statements.
Financial Highlights - Institutional Class
Period ended October 31, | 2006 H |
Selected Per-Share Data | |
Net asset value, beginning of period | $ 10.00 |
Income from Investment Operations | |
Net investment income (loss) D | .07 G |
Net realized and unrealized gain (loss) | .54 |
Total from investment operations | .61 |
Redemption fees added to paid in capital D | - J |
Net asset value, end of period | $ 10.61 |
Total Return B, C | 6.10% |
Ratios to Average Net Assets E, I | |
Expenses before reductions | 1.38%A |
Expenses net of fee waivers, if any | 1.25%A |
Expenses net of all reductions | 1.21%A |
Net investment income (loss) | 1.54%A, G |
Supplemental Data | |
Net assets, end of period (000 omitted) | $ 3,064 |
Portfolio turnover rate F | 29%A |
A Annualized
B Total returns for periods of less than one year are not annualized.
C Total returns would have been lower had certain expenses not been reduced during the periods shown.
D Calculated based on average shares outstanding during the period.
E Fees and expenses of the underlying Fidelity Central Funds are not included in the Fund's expense ratio. The Fund indirectly bears its proportionate share of the expenses of any underlying Fidelity Central Funds.
F Amount does not include the portfolio activity of any underlying Fidelity Central Funds.
G Investment income per share reflects a special dividend which amounted to $.03 per share. Excluding the special dividend, the ratio of net investment income (loss) to average net assets would have been .88%.
H For the period May 18, 2006 (commencement of operations) to October 31, 2006.
I Expense ratios reflect operating expenses of the class. Expenses before reductions do not reflect amounts reimbursed by the investment adviser or reductions from brokerage service arrangements or other expense offset arrangements and do not represent the amount paid by the class during periods when reimbursements or reductions occur. Expense ratios before reductions for start-up periods may not be representative of longer-term operating periods. Expenses net of fee waivers reflect expenses after reimbursement by the investment adviser but prior to reductions from brokerage service arrangements or other expense offset arrangements. Expenses net of all reductions represent the net expenses paid by the class.
J Amount represents less than $.01 per share.
Annual Report
See accompanying notes which are an integral part of the financial statements.
Notes to Financial Statements
For the period ended October 31, 2006
1. Significant Accounting Policies.
Fidelity International Value Fund (the Fund) is a fund of Fidelity Investment Trust (the trust) and is authorized to issue an unlimited number of shares. The trust is registered under the Investment Company Act of 1940, as amended (the 1940 Act), as an open-end management investment company organized as a Massachusetts business trust.
The Fund offers Class A, Class T, Class B, Class C, International Value Fund and Institutional Class shares, each of which has equal rights as to assets and voting privileges. Each class has exclusive voting rights with respect to matters that affect that class. Class B shares will automatically convert to Class A shares after a holding period of seven years from the initial date of purchase. Investment income, realized and unrealized capital gains and losses, the common expenses of the Fund, and certain fund-level expense reductions, if any, are allocated on a pro rata basis to each class based on the relative net assets of each class to the total net assets of the Fund. Each class differs with respect to transfer agent and distribution and service plan fees incurred. Certain expense reductions also differ by class.
The Fund's investments in emerging markets can be subject to social, economic, regulatory, and political uncertainties and can be extremely volatile.
The Fund may invest in Fidelity Central Funds which are open-end investment companies available to investment companies and other accounts managed by Fidelity Management & Research Company (FMR) and its affiliates. The financial statements have been prepared in conformity with accounting principles generally accepted in the United States of America, which require management to make certain estimates and assumptions at the date of the financial statements. The following summarizes the significant accounting policies of the Fund, which are also consistently followed by the Fidelity Central Funds:
Security Valuation. Investments are valued and net asset value (NAV) per share is calculated (NAV calculation) as of the close of business of the New York Stock Exchange (NYSE), normally 4:00 p.m. Eastern time. Wherever possible, the Fund uses independent pricing services approved by the Board of Trustees to value its investments.
Equity securities, including restricted securities, for which market quotations are readily available, are valued at the last reported sale price or official closing price as reported by an independent pricing service on the primary market or exchange on which they are traded. In the event there were no sales during the day or closing prices are not available, securities are valued at the last quoted bid price. Investments in open-end mutual funds, including the Fidelity Central Funds, are valued at their closing net asset value each business day. Short-term securities with remaining maturities of sixty days or less for
Annual Report
Notes to Financial Statements - continued
1. Significant Accounting Policies - continued
Security Valuation - continued
which quotations are not readily available are valued at amortized cost, which approximates value.
When current market prices or quotations are not readily available or do not accurately reflect fair value, valuations may be determined in accordance with procedures adopted by the Board of Trustees. For example, when developments occur between the close of a market and the close of the NYSE that may materially affect the value of some or all of the securities, or when trading in a security is halted, those securities may be fair valued. Factors used in the determination of fair value may include monitoring news to identify significant market or security specific events such as changes in the value of U.S. securities markets, reviewing developments in foreign markets and evaluating the performance of ADRs, futures contracts and exchange-traded funds. Because the Fund's utilization of fair value pricing depends on market activity, the frequency with which fair value pricing is used can not be predicted and may be utilized to a significant extent. The value of securities used for NAV calculation under fair value pricing may differ from published prices for the same securities.
Foreign Currency. The Fund uses foreign currency contracts to facilitate transactions in foreign-denominated securities. Losses from these transactions may arise from changes in the value of the foreign currency or if the counterparties do not perform under the contracts' terms.
Foreign-denominated assets, including investment securities, and liabilities are translated into U.S. dollars at the exchange rate at period end. Purchases and sales of investment securities, income and dividends received and expenses denominated in foreign currencies are translated into U.S. dollars at the exchange rate in effect on the transaction date.
The effects of exchange rate fluctuations on investments are included with the net realized and unrealized gain (loss) on investment securities. Other foreign currency transactions resulting in realized and unrealized gain (loss) are disclosed separately.
Investment Transactions and Income. Security transactions, including the Fund's investment activity in the Fidelity Central Funds, are accounted for as of trade date. Gains and losses on securities sold are determined on the basis of identified cost. Dividend income is recorded on the ex-dividend date, except for certain dividends from foreign securities where the ex-dividend date may have passed, which are recorded as soon as the Fund is informed of the ex-dividend date. Non-cash dividends included in dividend income, if any, are recorded at the fair market value of the securities received. Large, non-recurring dividends recognized by the Fund are presented separately on the Statement of Operations as "Special Dividends" and the impact of these dividends is
Annual Report
1. Significant Accounting Policies - continued
Investment Transactions and Income - continued
presented in the Financial Highlights. Interest income distributions from the Fidelity Central Funds are accrued as earned. Interest income includes coupon interest and amortization of premium and accretion of discount on debt securities. Investment income is recorded net of foreign taxes withheld where recovery of such taxes is uncertain.
Expenses. Most expenses of the trust can be directly attributed to a fund. Expenses which cannot be directly attributed are apportioned among each Fund in the trust. Expense estimates are accrued in the period to which they relate and adjustments are made when actual amounts are known.
Income Tax Information and Distributions to Shareholders. Each year, the Fund intends to qualify as a regulated investment company by distributing all of its taxable income and realized gains under Subchapter M of the Internal Revenue Code. As a result, no provision for income taxes is required in the accompanying financial statements. Foreign taxes are provided for based on the Fund's understanding of the tax rules and rates that exist in the foreign markets in which it invests.
Distributions are recorded on the ex-dividend date. Income dividends and capital gain distributions are declared separately for each class. Income and capital gain distributions are determined in accordance with income tax regulations, which may differ from generally accepted accounting principles. In addition, the Fund will claim a portion of the payment made to redeeming shareholders as a distribution for income tax purposes.
Capital accounts within the financial statements are adjusted for permanent book-tax differences. These adjustments have no impact on net assets or the results of operations. Temporary book-tax differences will reverse in a subsequent period.
Book-tax differences are primarily due to short-term capital gains, foreign currency transactions, passive foreign investment companies (PFIC) and losses deferred due to wash sales.
The tax-basis components of distributable earnings and the federal tax cost as of period end were as follows:
Unrealized appreciation | $ 13,449,405 |
Unrealized depreciation | (1,923,189) |
Net unrealized appreciation (depreciation) | 11,526,216 |
Undistributed ordinary income | 1,247,939 |
| |
Cost for federal income tax purposes | $ 230,203,018 |
Annual Report
Notes to Financial Statements - continued
1. Significant Accounting Policies - continued
Short-Term Trading (Redemption) Fees. Shares purchased on or after May 18, 2006 and held in the Fund less than 30 days are subject to a redemption fee equal to 1.00% of the proceeds of the redeemed shares. All redemption fees, including any estimated redemption fees paid by FMR, are retained by the Fund and accounted for as an addition to paid in capital.
New Accounting Pronouncements. In July 2006, Financial Accounting Standards Board Interpretation No. 48, Accounting for Uncertainty in Income Taxes - an interpretation of FASB Statement 109 (FIN 48), was issued and is effective for fiscal years beginning after December 15, 2006. FIN 48 sets forth a threshold for financial statement recognition, measurement and disclosure of a tax position taken or expected to be taken on a tax return. Management is currently evaluating the impact, if any, the adoption of FIN 48 will have on the Fund's net assets, results of operations and financial statement disclosures.
In addition, in September 2006, Statement of Financial Accounting Standards No. 157, Fair Value Measurements (SFAS 157), was issued and is effective for fiscal years beginning after November 15, 2007. SFAS 157 defines fair value, establishes a framework for measuring fair value and expands disclosures about fair value measurements. Management is currently evaluating the impact the adoption of SFAS 157 will have on the Fund's financial statement disclosures.
2. Operating Policies.
Repurchase Agreements. FMR has received an Exemptive Order from the Securities and Exchange Commission (the SEC) which permits the Fund and other affiliated entities of FMR to transfer uninvested cash balances into joint trading accounts which are then invested in repurchase agreements. The Fund may also invest directly with institutions in repurchase agreements. Repurchase agreements are collateralized by government or non-government securities. Upon settlement date, collateral is held in segregated accounts with custodian banks and may be obtained in the event of a default of the counterparty. The Fund monitors, on a daily basis, the value of the collateral to ensure it is at least equal to the principal amount of the repurchase agreement (including accrued interest). In the event of a default by the counterparty, realization of the collateral proceeds could be delayed, during which time the value of the collateral may decline.
3. Purchases and Sales of Investments.
Purchases and sales of securities other than short-term securities, aggregated $230,223,505 and $15,893,342, respectively.
Annual Report
4. Fees and Other Transactions with Affiliates.
Management Fee. FMR and its affiliates provide the Fund with investment management related services for which the Fund pays a monthly management fee. The management fee is the sum of an individual fund fee rate that is based on an annual rate of .45% of the Fund's average net assets and a group fee rate that averaged ..27% during the period. The group fee rate is based upon the average net assets of all the mutual funds advised by FMR. The group fee rate decreases as assets under management increase and increases as assets under management decrease. In addition, the management fee is subject to a performance adjustment (up to a maximum of ± .20% of the Fund's average net assets over a 36 month performance period). The upward or downward adjustment to the management fee is based on the relative investment performance of the retail class of the Fund, International Value, as compared to an appropriate benchmark index. The Fund's performance adjustment will not take effect until May 1, 2007. Subsequent months will be added until the performance period includes 36 months. For the period, the total annualized management fee rate was .71% of the Fund's average net assets.
Distribution and Service Plan. In accordance with Rule 12b-1 of the 1940 Act, the Fund has adopted separate Distribution and Service Plans for each class of shares. Certain classes pay Fidelity Distributors Corporation (FDC), an affiliate of FMR, separate Distribution and Service Fees, each of which is based on an annual percentage of each class' average net assets. In addition, FDC may pay financial intermediaries for selling shares of the Fund and providing shareholder support services. For the period, the Distribution and Service Fee rates and the total amounts paid to and retained by FDC were as follows:
| Distribution
Fee | Service
Fee | Paid to
FDC | Retained
by FDC |
Class A | 0% | .25% | $ 1,322 | $ 1,115 |
Class T | .25% | .25% | 2,940 | 2,223 |
Class B | .75% | .25% | 4,917 | 4,804 |
Class C | .75% | .25% | 6,622 | 5,701 |
| | | $ 15,801 | $ 13,843 |
Sales Load. FDC receives a front-end sales charge of up to 5.75% for selling Class A shares, and 3.50% for selling Class T shares, some of which is paid to financial intermediaries for selling shares of the Fund. FDC receives the proceeds of contingent deferred sales charges levied on Class A, Class T, Class B, and Class C redemptions. These charges depend on the holding period. The deferred sales charges range from 5% to 1% for Class B, 1% for Class C, 1.00% to .50% for certain purchases of Class A shares and .25% for certain purchases of Class T shares.
Annual Report
Notes to Financial Statements - continued
4. Fees and Other Transactions with Affiliates - continued
Sales Load - continued
For the period, sales charge amounts retained by FDC were as follows:
| Retained
by FDC |
Class A | $ 1,104 |
Class T | 494 |
| $ 1,598 |
Transfer Agent Fees. Fidelity Investments Institutional Operations Company, Inc. (FIIOC), an affiliate of FMR, is the transfer, dividend disbursing and shareholder servicing agent for each class of the Fund. FIIOC receives account fees and asset-based fees that vary according to the account size and type of account of the shareholders of the respective classes of the Fund. FIIOC pays for typesetting, printing and mailing of shareholder reports, except proxy statements. For the period, the total transfer agent fees paid by each class to FIIOC, were as follows:
| Amount | % of
Average
Net Assets |
Class A | $ 1,113 | .21* |
Class T | 1,345 | .23* |
Class B | 965 | .20* |
Class C | 1,379 | .21* |
International Value | 119,359 | .24* |
Institutional Class | 1,538 | .15* |
| $ 125,699 | |
* Annualized
Accounting and Security Lending Fees. Fidelity Service Company, Inc. (FSC), an affiliate of FMR, maintains the Fund's accounting records. The accounting fee is based on the level of average net assets for the month. Under a separate contract, FSC administers the security lending program. The security lending fee is based on the number and duration of lending transactions.
Investments in Fidelity Central Funds. The Fund may invest in Fidelity Central Funds. The Fund's Schedule of Investments lists each of the Fidelity Central Funds as an investment of the Fund but does not include the underlying holdings of each Fidelity Central Fund. As an Investing Fund, the Fund indirectly bears its proportionate share of the expenses of the underlying Fidelity Central Funds. A complete unaudited list of holdings for each Fidelity Central Fund is available upon request. In addition, the financial statements of the Fidelity Central Funds,
Annual Report
4. Fees and Other Transactions with Affiliates - continued
Investments in Fidelity Central Funds - continued
which are not covered by the Fund's Report of Independent Registered Public Accounting Firm, are available on the EDGAR Database on the SEC's web site, www.sec.gov, or upon request.
The Money Market Central Funds seek preservation of capital and current income and are managed by Fidelity Investments Money Management, Inc. (FIMM), an affiliate of FMR.
Brokerage Commissions. The Fund placed a portion of its portfolio transactions with brokerage firms which are affiliates of the investment adviser. The commissions paid to these affiliated firms were $695 for the period.
5. Security Lending.
The Fund lends portfolio securities from time to time in order to earn additional income. On the settlement date of the loan, the Fund receives collateral (in the form of U.S. Treasury obligations, letters of credit and/or cash) against the loaned securities and maintains collateral in an amount not less than 100% of the market value of the loaned securities during the period of the loan. The market value of the loaned securities is determined at the close of business of the Fund and any additional required collateral is delivered to the Fund on the next business day. If the borrower defaults on its obligation to return the securities loaned because of insolvency or other reasons, a fund could experience delays and costs in recovering the securities loaned or in gaining access to the collateral. Any cash collateral received is invested in the Fidelity Securities Lending Cash Central Fund. The value of loaned securities and cash collateral at period end are disclosed on the Fund's Statement of Assets and Liabilities. Security lending income represents the income earned on investing cash collateral, less fees and expenses associated with the loan, plus any premium payments that may be received on the loan of certain types of securities. Security lending income is presented in the Statement of Operations as a component of interest income from Fidelity Central Funds. Net income from lending portfolio securities during the period amounted to $9,903.
6. Expense Reductions.
FMR voluntarily agreed to reimburse each class to the extent annual operating expenses exceeded certain levels of average net assets as noted in the table below. Some expenses, for example interest expense, including commitment fees, are excluded from this reimbursement.
Annual Report
Notes to Financial Statements - continued
6. Expense Reductions - continued
The following classes were in reimbursement during the period:
| Expense
Limitations | Reimbursement
from adviser |
Class A | 1.50% | $ 1,306 |
Class T | 1.75% | 1,514 |
Class B | 2.25% | 1,208 |
Class C | 2.25% | 1,432 |
International Value | 1.25% | 124,928 |
Institutional Class | 1.25% | 1,364 |
| | $ 131,752 |
Many of the brokers with whom FMR places trades on behalf of the Fund provided services to the Fund in addition to trade execution. These services included payments of certain expenses on behalf of the Fund totaling $18,428 for the period. In addition, through arrangements with the Fund's custodian credits realized as a result of uninvested cash balances were used to reduce the Fund's expenses. During the period, these credits reduced the Fund's custody expenses by $825.
7. Other.
The Fund's organizational documents provide former and current trustees and officers with a limited indemnification against liabilities arising in connection with the performance of their duties to the Fund. In the normal course of business, the Fund may also enter into contracts that provide general indemnifications. The Fund's maximum exposure under these arrangements is unknown as this would be dependent on future claims that may be made against the Fund. The risk of material loss from such claims is considered remote.
During the period, the Fund's transfer agent, Fidelity Investments Institutional Operations Company, Inc. (FIIOC), an affiliate of Fidelity Management & Research Company, notified the Fund that the fund's books and records did not reflect a conversion of certain Class B to Class A shares upon their conversion date. Management has determined that this did not have a material impact to the Fund's reported net assets or results of operations in the accompanying financial statements. FIIOC will cause the books and records of the Fund to reflect a conversion of the relevant Class B shares to Class A and is in the process of determining the impact to affected shareholder accounts for purposes of its remediation.
Annual Report
8. Share Transactions.
Transactions for each class of shares were as follows:
| Shares | Dollars |
| Period ended
October 31,
2006 A | Period ended
October 31,
2006 A |
Class A | | |
Shares sold | 146,231 | $ 1,461,870 |
Shares redeemed | (1,174) | (12,358) |
Net increase (decrease) | 145,057 | $ 1,449,512 |
Class T | | |
Shares sold | 169,119 | $ 1,688,142 |
Shares redeemed | (155) | (1,528) |
Net increase (decrease) | 168,964 | $ 1,686,614 |
Class B | | |
Shares sold | 123,455 | $ 1,231,876 |
Shares redeemed | (12) | (126) |
Net increase (decrease) | 123,443 | $ 1,231,750 |
Class C | | |
Shares sold | 207,502 | $ 2,072,374 |
Shares redeemed | (791) | (7,647) |
Net increase (decrease) | 206,711 | $ 2,064,727 |
International Value | | |
Shares sold | 22,776,737 | $ 228,163,833 |
Shares redeemed | (1,934,132) | (19,338,324) |
Net increase (decrease) | 20,842,605 | $ 208,825,509 |
Institutional Class | | |
Shares sold | 288,807 | $ 2,865,051 |
A For the period May 18, 2006 (commencement of operations) to October 31, 2006.
Annual Report
Report of Independent Registered Public Accounting Firm
To the Trustees of Fidelity Investment Trust and Shareholders of Fidelity International Value Fund:
We have audited the accompanying statement of assets and liabilities of Fidelity International Value Fund (the Fund), a fund of Fidelity Investment Trust, including the schedule of investments as of October 31, 2006, and the related statement of operations, the statement of changes in net assets and the financial highlights for the period May 18, 2006 (commencement of operations) to October 31, 2006. These financial statements and financial highlights are the responsibility of the Fund's management. Our responsibility is to express an opinion on these financial statements and financial highlights based on our audit.
We conducted our audit in accordance with standards of the Public Company Accounting Oversight Board (United States). Those standards require that we plan and perform the audit to obtain reasonable assurance about whether the financial statements and financial highlights are free of material misstatement. The Fund is not required to have, nor were we engaged to perform, an audit of its internal control over financial reporting. Our audits included consideration of internal control over financial reporting as a basis for designing audit procedures that are appropriate in the circumstances, but not for the purpose of expressing an opinion on the effectiveness of the Fund's internal control over financial reporting. Accordingly, we express no such opinion. An audit also includes examining, on a test basis, evidence supporting the amounts and disclosures in the financial statements, assessing the accounting principles used and significant estimates made by management, as well as evaluating the overall financial statement presentation. Our procedures included confirmation of securities owned as of October 31, 2006, by correspondence with the custodians and brokers; where replies were not received from brokers, we performed other auditing procedures. We believe that our audit provide a reasonable basis for our opinion.
In our opinion, the financial statements and financial highlights referred to above present fairly, in all material respects, the financial position of Fidelity International Value Fund as of October 31, 2006, the results of its operations, the changes in its net assets and its financial highlights for the period May 18, 2006 (commencement of operations) to October 31, 2006, in conformity with accounting principles generally accepted in the United States of America.
/s/ Deloitte & Touche LLP
DELOITTE & TOUCHE LLP
Boston, Massachusetts
December 15, 2006
Annual Report
Trustees and Officers
The Trustees, Members of the Advisory Board, and executive officers of the trust and fund, as applicable, are listed below. The Board of Trustees governs the fund and is responsible for protecting the interests of shareholders. The Trustees are experienced executives who meet periodically throughout the year to oversee the fund's activities, review contractual arrangements with companies that provide services to the fund, and review the fund's performance. Except for William O. McCoy, each of the Trustees oversees 348 funds advised by FMR or an affiliate. Mr. McCoy oversees 350 funds advised by FMR or an affiliate.
The Trustees hold office without limit in time except that (a) any Trustee may resign; (b) any Trustee may be removed by written instrument, signed by at least two-thirds of the number of Trustees prior to such removal; (c) any Trustee who requests to be retired or who has become incapacitated by illness or injury may be retired by written instrument signed by a majority of the other Trustees; and (d) any Trustee may be removed at any special meeting of shareholders by a two-thirds vote of the outstanding voting securities of the trust. Each Trustee who is not an interested person (as defined in the 1940 Act) (Independent Trustee), shall retire not later than the last day of the calendar year in which his or her 72nd birthday occurs. The Independent Trustees may waive this mandatory retirement age policy with respect to individual Trustees. The executive officers and Advisory Board Members hold office without limit in time, except that any officer and Advisory Board Member may resign or may be removed by a vote of a majority of the Trustees at any regular meeting or any special meeting of the Trustees. Except as indicated, each individual has held the office shown or other offices in the same company for the past five years.
The fund's Statement of Additional Information (SAI) includes more information about the Trustees. To request a free copy, call Fidelity at 1-877-208-0098.
Interested Trustees*:
Correspondence intended for each Trustee who is an interested person may be sent to Fidelity Investments, 82 Devonshire Street, Boston, Massachusetts 02109.
Name, Age; Principal Occupation |
Edward C. Johnson 3d (76) |
| Year of Election or Appointment: 1984 Mr. Johnson is Chairman of the Board of Trustees. Mr. Johnson serves as President (2006-present), Chief Executive Officer, Chairman, and a Director of FMR Corp.; Chairman and a Director of FMR; Chairman and a Director of Fidelity Research & Analysis Company (FRAC); Chairman and a Director of Fidelity Investments Money Management, Inc.; and Chairman (2001-present) and a Director of FMR Co., Inc. In addition, Mr. Johnson serves as Chairman and Director of Fidelity International Limited (FIL). |
Stephen P. Jonas (53) |
| Year of Election or Appointment: 2005 Mr. Jonas is Senior Vice President of the fund (2006-present). He also serves as Senior Vice President of other Fidelity funds (2005-present). Mr. Jonas is Executive Director of FMR (2005-present) and FMR Co., Inc. (2005-present). He also serves as a Director of Fidelity Investments Money Management, Inc. (2005-present) and FMR Corp. (2003- present). Previously, Mr. Jonas served as President of Fidelity Enterprise Operations and Risk Services (2004-2005), Chief Administrative Officer (2002-2004), and Chief Financial Officer of FMR Corp. (1998-2002). In addition, he serves on the Boards of Boston Ballet (2003-present) and Simmons College (2003-present). |
Robert L. Reynolds (54) |
| Year of Election or Appointment: 2003 Mr. Reynolds is President and a Director of FMR (2005-present), Fidelity Investments Money Management, Inc. (2005-present), and FMR Co., Inc. (2005-present). Mr. Reynolds also serves as Vice Chairman (2006-present), a Director (2003-present), and Chief Operating Officer of FMR Corp. and a Director of Strategic Advisers, Inc. (2005-present). He also serves on the Board at Fidelity Investments Canada, Ltd. |
* Trustees have been determined to be "Interested Trustees" by virtue of, among other things, their affiliation with the trust or various entities under common control with FMR.
Annual Report
Independent Trustees:
Correspondence intended for each Independent Trustee (that is, the Trustees other than the Interested Trustees) may be sent to Fidelity Investments, P.O. Box 55235, Boston, Massachusetts 02205-5235.
Name, Age; Principal Occupation |
Dennis J. Dirks (58) |
| Year of Election or Appointment: 2005 Prior to his retirement in May 2003, Mr. Dirks was Chief Operating Officer and a member of the Board of The Depository Trust & Clearing Corporation (DTCC) (1999-2003). He also served as President, Chief Operating Officer, and Board member of The Depository Trust Company (DTC) (1999-2003) and President and Board member of the National Securities Clearing Corporation (NSCC) (1999-2003). In addition, Mr. Dirks served as Chief Executive Officer and Board member of the Government Securities Clearing Corporation (2001-2003) and Chief Executive Officer and Board member of the Mortgage-Backed Securities Clearing Corporation (2001-2003). Mr. Dirks also serves as a Trustee and a member of the Finance Committee of Manhattan College (2005-present) and a Trustee and a member of the Finance Committee of AHRC of Nassau County (2006-present). |
Albert R. Gamper, Jr. (64) |
| Year of Election or Appointment: 2006 Prior to his retirement in December 2004, Mr. Gamper served as Chairman of the Board of CIT Group Inc. (commercial finance). During his tenure with CIT Group Inc. Mr. Gamper served in numerous senior management positions, including Chairman (1987-1989; 1999-2001; 2002-2004), Chief Executive Officer (1987-2004), and President (1989-2002). He currently serves as a member of the Board of Directors of Public Service Enterprise Group (utilities, 2001-present), Chairman of the Board of Governors, Rutgers University (2004-present), and Chairman of the Board of Saint Barnabas Health Care System. |
George H. Heilmeier (70) |
| Year of Election or Appointment: 2004 Dr. Heilmeier is Chairman Emeritus of Telcordia Technologies (communication software and systems), where prior to his retirement, he served as company Chairman and Chief Executive Officer. He currently serves on the Boards of Directors of The Mitre Corporation (systems engineering and information technology support for the government), and HRL Laboratories (private research and development, 2004-present). He is Chairman of the General Motors Science & Technology Advisory Board and a Life Fellow of the Institute of Electrical and Electronics Engineers (IEEE). Dr. Heilmeier is a member of the Defense Science Board and the National Security Agency Advisory Board. He is also a member of the National Academy of Engineering, the American Academy of Arts and Sciences, and the Board of Overseers of the School of Engineering and Applied Science of the University of Pennsylvania. Previously, Dr. Heilmeier served as a Director of TRW Inc. (automotive, space, defense, and information technology, 1992-2002), Compaq (1994-2002), Automatic Data Processing, Inc. (ADP) (technology-based business outsourcing, 1995-2002), INET Technologies Inc. (telecommunications network surveillance, 2001-2004), and Teletech Holdings (customer management services). He is the recipient of the 2005 Kyoto Prize in Advanced Technology for his invention of the liquid crystal display, and a member of the Consumer Electronics Hall of Fame. |
Marie L. Knowles (60) |
| Year of Election or Appointment: 2001 Prior to Ms. Knowles' retirement in June 2000, she served as Executive Vice President and Chief Financial Officer of Atlantic Richfield Company (ARCO) (diversified energy, 1996-2000). From 1993 to 1996, she was a Senior Vice President of ARCO and President of ARCO Transportation Company. She served as a Director of ARCO from 1996 to 1998. She currently serves as a Director of Phelps Dodge Corporation (copper mining and manufacturing) and McKesson Corporation (healthcare service, 2002-present). Ms. Knowles is a Trustee of the Brookings Institution and the Catalina Island Conservancy and also serves as a member of the Advisory Board for the School of Engineering of the University of Southern California. |
Ned C. Lautenbach (62) |
| Year of Election or Appointment: 2000 Mr. Lautenbach is Chairman of the Independent Trustees (2006-present). Mr. Lautenbach has been a partner of Clayton, Dubilier & Rice, Inc. (private equity investment firm) since September 1998. Previously, Mr. Lautenbach was with the International Business Machines Corporation (IBM) from 1968 until his retirement in 1998. Mr. Lautenbach serves as a Director of Sony Corporation (2006- present) and Eaton Corporation (diversified industrial) as well as the Philharmonic Center for the Arts in Naples, Florida. He also is a member of the Board of Trustees of Fairfield University (2005-present), as well as a member of the Council on Foreign Relations. |
William O. McCoy (73) |
| Year of Election or Appointment: 1997 Prior to his retirement in December 1994, Mr. McCoy was Vice Chairman of the Board of BellSouth Corporation (telecommunications) and President of BellSouth Enterprises. He is currently a Director of Duke Realty Corporation (real estate). He is also a partner of Franklin Street Partners (private investment management firm). In addition, Mr. McCoy served as the Interim Chancellor (1999-2000) and a member of the Board of Visitors for the University of North Carolina at Chapel Hill and currently serves as Chairman of the Board of Directors of the University of North Carolina Health Care System. He also served as Vice President of Finance for the University of North Carolina (16-school system). |
Cornelia M. Small (62) |
| Year of Election or Appointment: 2005 Ms. Small is a member (2000-present) and Chairperson (2002-present) of the Investment Committee, and a member (2002-present) of the Board of Trustees of Smith College. Previously, she served as Chief Investment Officer (1999-2000), Director of Global Equity Investments (1996-1999), and a member of the Board of Directors of Scudder, Stevens & Clark (1990-1997) and Scudder Kemper Investments (1997-1999). In addition, Ms. Small served as Co-Chair (2000-2003) of the Annual Fund for the Fletcher School of Law and Diplomacy. |
William S. Stavropoulos (67) |
| Year of Election or Appointment: 2001 Mr. Stavropoulos is Chairman Emeritus of the Board of Directors of The Dow Chemical Company. Since joining The Dow Chemical Company in 1967, Mr. Stavropoulos served in numerous senior management positions, including President (1993-2000; 2002-2003), CEO (1995-2000; 2002-2004), and Chairman of the Executive Committee (2000-2004). Currently, he is a Director of NCR Corporation (data warehousing and technology solutions), BellSouth Corporation (telecommunications), Chemical Financial Corporation, Maersk Inc. (industrial conglomerate, 2002-present), and Metalmark Capital (private equity investment firm, 2005-present). He also serves as a member of the Board of Trustees of the American Enterprise Institute for Public Policy Research. In addition, Mr. Stavropoulos is a member of The Business Council, J.P. Morgan International Council and the University of Notre Dame Advisory Council for the College of Science. |
Kenneth L. Wolfe (67) |
| Year of Election or Appointment: 2005 Prior to his retirement in 2001, Mr. Wolfe was Chairman and Chief Executive Officer of Hershey Foods Corporation (1993-2001). He currently serves as a member of the boards of Adelphia Communications Corporation (2003-present), Bausch & Lomb, Inc., and Revlon Inc. (2004-present). |
Annual Report
Advisory Board Members and Executive Officers:
Correspondence intended for Mr. Keyes may be sent to Fidelity Investments, P.O. Box 55235, Boston, Massachusetts 02205-5235. Correspondence intended for each executive officer and Mr. Lynch may be sent to Fidelity Investments, 82 Devonshire Street, Boston, Massachusetts 02109.
Name, Age; Principal Occupation |
James H. Keyes (66) |
| Year of Election or Appointment: 2006 Member of the Advisory Board of Fidelity Investment Trust. Prior to his retirement in 2003, Mr. Keyes was Chairman, President, and Chief Executive Officer of Johnson Controls, Inc. (automotive supplier, 1993-2003). He currently serves as a member of the boards of LSI Logic Corporation (semiconductor technologies), Navistar International Corporation (manufacture and sale of trucks, buses, and diesel engines, 2002-present), and Pitney Bowes, Inc. (integrated mail, messaging, and document management solutions). |
Peter S. Lynch (62) |
| Year of Election or Appointment: 2003 Member of the Advisory Board of Fidelity Investment Trust. Mr. Lynch is Vice Chairman and a Director of FMR, and Vice Chairman (2001- present) and a Director of FMR Co., Inc. Previously, Mr. Lynch served as a Trustee of the Fidelity funds (1990-2003). In addition, he serves as a Trustee of Boston College and as the Chairman of the Inner-City Scholarship Fund. |
Dwight D. Churchill (52) |
| Year of Election or Appointment: 2006 Vice President of the fund. Mr. Churchill also serves as Vice President of certain Equity Funds (2005-present). Mr. Churchill is Executive Vice President of FMR (2005-present) and FMR Co., Inc. (2005-present). Previously, Mr. Churchill served as Senior Vice President of Fidelity Investments Money Management, Inc. (2005-2006), Head of Fidelity's Fixed-Income Division (2000-2005), Vice President of Fidelity's Money Market Funds (2000-2005), Vice President of Fidelity's Bond Funds, and Senior Vice President of FMR. |
Eric M. Wetlaufer (44) |
| Year of Election or Appointment: 2006 Vice President of the fund. Mr. Wetlaufer also serves as Vice President of certain International Equity Funds (2006-present). Mr. Wetlaufer is Senior Vice President of FMR (2006-present) and FMR Co., Inc. (2006-present), and President and Director of Fidelity Management & Research (U.K.) Inc. (2006-present) and Fidelity Research & Analysis Company (2006-present). Before joining Fidelity Investments in 2005, Mr. Wetlaufer was a partner in Oxhead Capital Management (2004-2005). Previously, Mr. Wetlaufer served as a Chief Investment Officer of Putnam Investments (1997-2003). |
George Stairs (56) |
| Year of Election or Appointment: 2006 Vice President of the fund. Prior to his current responsibilities, Mr. Stairs worked as a portfolio manager. Prior to joining Fidelity Investments, Mr. Stairs was a senior equity portfolio manager for Putnam. Mr. Stairs also serves as Vice President of FMR and FMR Co., Inc. (2006). |
Eric D. Roiter (57) |
| Year of Election or Appointment: 2006 Secretary of the fund. He also serves as Secretary of other Fidelity funds; Vice President, General Counsel, and Secretary of FMR Co., Inc. (2001-present) and FMR; Assistant Secretary of Fidelity Management & Research (U.K.) Inc. (2001-present), Fidelity Research & Analysis Company (2001-present), and Fidelity Investments Money Management, Inc. (2001-present). Mr. Roiter is an Adjunct Member, Faculty of Law, at Boston College Law School (2003-present). Previously, Mr. Roiter served as Vice President and Secretary of Fidelity Distributors Corporation (FDC) (1998-2005). |
Stuart Fross (47) |
| Year of Election or Appointment: 2006 Assistant Secretary of the fund. Mr. Fross also serves as Assistant Secretary of other Fidelity funds (2003-present), Vice President and Secretary of FDC (2005-present), and is an employee of FMR. |
Christine Reynolds (48) |
| Year of Election or Appointment: 2006 President and Treasurer of the fund. Ms. Reynolds also serves as President and Treasurer of other Fidelity funds (2004-present) and is a Vice President (2003-present) and an employee (2002-present) of FMR. Before joining Fidelity Investments, Ms. Reynolds worked at PricewaterhouseCoopers LLP (PwC) (1980-2002), where she was most recently an audit partner with PwC's investment management practice. |
R. Stephen Ganis (40) |
| Year of Election or Appointment: 2006 Anti-Money Laundering (AML) officer of the fund. Mr. Ganis also serves as AML officer of other Fidelity funds (2006-present) and FMR Corp. (2003-present). Before joining Fidelity Investments, Mr. Ganis practiced law at Goodwin Procter, LLP (2000-2002). |
Joseph B. Hollis (58) |
| Year of Election or Appointment: 2006 Chief Financial Officer of the fund. Mr. Hollis also serves as Chief Financial Officer of other Fidelity funds. Mr. Hollis is President of Fidelity Pricing and Cash Management Services (FPCMS) (2005-present). Mr. Hollis also serves as President and Director of Fidelity Service Company, Inc. (2006-present). Previously, Mr. Hollis served as Senior Vice President of Cash Management Services (1999-2002) and Investment Management Operations (2002-2005). |
Kenneth A. Rathgeber (59) |
| Year of Election or Appointment: 2006 Chief Compliance Officer of the fund. Mr. Rathgeber also serves as Chief Compliance Officer of other Fidelity funds (2004-present) and Executive Vice President of Risk Oversight for Fidelity Investments (2002-present). He is Chief Compliance Officer of FMR (2005-present), FMR Co., Inc. (2005-present), Fidelity Management & Research (U.K.) Inc. (2005-present), Fidelity Research & Analysis Company (2005- present), Fidelity Investments Money Management, Inc. (2005-present), and Strategic Advisers, Inc. (2005-present). Previously, Mr. Rathgeber served as Executive Vice President and Chief Operating Officer for Fidelity Investments Institutional Services Company, Inc. (1998-2002). |
Bryan A. Mehrmann (45) |
| Year of Election or Appointment: 2006 Deputy Treasurer of the fund. Mr. Mehrmann also serves as Deputy Treasurer of other Fidelity funds (2005-present) and is an employee of FMR. Previously, Mr. Mehrmann served as Vice President of Fidelity Investments Institutional Services Group (FIIS)/Fidelity Investments Institutional Operations Corporation, Inc. (FIIOC) Client Services (1998-2004). |
Kimberley H. Monasterio (42) |
| Year of Election or Appointment: 2006 Deputy Treasurer of the fund. Ms. Monasterio also serves as Deputy Treasurer of other Fidelity funds (2004) and is an employee of FMR (2004). Before joining Fidelity Investments, Ms. Monasterio served as Treasurer (2000-2004) and Chief Financial Officer (2002-2004) of the Franklin Templeton Funds and Senior Vice President of Franklin Templeton Services, LLC (2000-2004). |
Kenneth B. Robins (37) |
| Year of Election or Appointment: 2006 Deputy Treasurer of the fund. Mr. Robins also serves as Deputy Treasurer of other Fidelity funds (2005-present) and is an employee of FMR (2004-present). Before joining Fidelity Investments, Mr. Robins worked at KPMG LLP, where he was a partner in KPMG's department of professional practice (2002-2004) and a Senior Manager (1999-2000). In addition, Mr. Robins served as Assistant Chief Accountant, United States Securities and Exchange Commission (2000-2002). |
Robert G. Byrnes (39) |
| Year of Election or Appointment: 2006 Assistant Treasurer of the fund. Mr. Byrnes also serves as Assistant Treasurer of other Fidelity funds (2005-present) and is an employee of FMR (2005-present). Previously, Mr. Byrnes served as Vice President of FPCMS (2003-2005). Before joining Fidelity Investments, Mr. Byrnes worked at Deutsche Asset Management where he served as Vice President of the Investment Operations Group (2000-2003). |
John H. Costello (60) |
| Year of Election or Appointment: 2006 Assistant Treasurer of the fund. Mr. Costello also serves as Assistant Treasurer of other Fidelity funds and is an employee of FMR. |
Peter L. Lydecker (52) |
| Year of Election or Appointment: 2006 Assistant Treasurer of the fund. Mr. Lydecker also serves as Assistant Treasurer of other Fidelity funds (2004) and is an employee of FMR. |
Mark Osterheld (51) |
| Year of Election or Appointment: 2006 Assistant Treasurer of the fund. Mr. Osterheld also serves as Assistant Treasurer of other Fidelity funds (2002) and is an employee of FMR. |
Gary W. Ryan (48) |
| Year of Election or Appointment: 2006 Assistant Treasurer of the fund. Mr. Ryan also serves as Assistant Treasurer of other Fidelity funds (2005-present) and is an employee of FMR (2005-present). Previously, Mr. Ryan served as Vice President of Fund Reporting in FPCMS (1999-2005). |
Salvatore Schiavone (40) |
| Year of Election or Appointment: 2006 Assistant Treasurer of the fund. Mr. Schiavone also serves as Assistant Treasurer of other Fidelity funds (2005-present) and is an employee of FMR (2005-present). Before joining Fidelity Investments, Mr. Schiavone worked at Deutsche Asset Management, where he most recently served as Assistant Treasurer (2003-2005) of the Scudder Funds and Vice President and Head of Fund Reporting (1996-2003). |
Annual Report
Distributions
The Board of Trustees of Advisor International Value Fund voted to pay to shareholders of record at the opening of business on record date, the following distributions per share derived from capital gains realized from sales of portfolio securities, and dividends derived from net investment income:
| Pay Date | Record Date | Dividends | Capital Gains |
Class A | 12/11/06 | 12/08/06 | $ .031 | $.022 |
Class T | 12/11/06 | 12/08/06 | $ .02 | $.022 |
Class B | 12/11/06 | 12/08/06 | $ 0 | $.013 |
Class C | 12/11/06 | 12/08/06 | $ 0 | $.019 |
The fund will notify shareholders in January 2007 of amounts for use in preparing 2006 income tax returns.
Annual Report
Board Approval of Investment Advisory Contracts and Management Fees
Fidelity International Value Fund
On April 20, 2006, the Board of Trustees, including the independent Trustees (together, the Board), voted to approve the management contract and subadvisory agreements (together, the Advisory Contracts) for the fund. The Board, assisted by the advice of fund counsel and independent Trustees' counsel, considered a broad range of information.
In determining whether to approve the Advisory Contracts for the fund, the Board was aware that shareholders have a broad range of investment choices available to them, including a wide choice among mutual funds offered by competitors to Fidelity, and that shareholders, with the opportunity to review and weigh the disclosure provided by the fund in its prospectus and other public disclosures, may choose to invest in this fund, managed by Fidelity.
Nature, Extent, and Quality of Services Provided. The Board considered staffing within the investment adviser, FMR, and the sub-advisers (together, the Investment Advisers), including the background of the fund's portfolio manager and the fund's investment objective and discipline.
Resources Dedicated to Investment Management and Support Services. The Board considered Fidelity's extensive global research capabilities that enable the Investment Advisers to aggregate data from various sources in an effort to produce positive investment results. The Board noted that Fidelity's analysts have access to a variety of technological tools that enable them to perform both fundamental and quantitative analysis and to specialize in various disciplines. The Board also considered that Fidelity's portfolio managers and analysts have access to daily portfolio attribution that allows for monitoring of a fund's portfolio, as well as an electronic communication system that provides immediate real-time access to research concerning issuers and credit enhancers.
Shareholder and Administrative Services. The Board considered the nature, extent, quality, and cost of administrative, distribution, and shareholder services performed by the Investment Advisers and their affiliates under the Advisory Contracts and under separate agreements covering transfer agency, pricing and bookkeeping, and securities lending services for the fund. The Board also considered the nature and extent of the Investment Advisers' supervision of third party service providers, principally custodians and subcustodians.
The Board noted that the growth of fund assets across the complex allows Fidelity to reinvest in the development of services designed to enhance the value or convenience of the Fidelity funds as investment vehicles. These services include 24-hour access to account information and market information through phone representatives and over the Internet, and investor education materials and asset allocation tools.
Investment in a Large Fund Family. The Board considered the benefits to shareholders of investing in a Fidelity fund, including the benefits of investing in a fund that is part of a large family of funds offering a variety of investment disciplines and providing for a large variety of mutual fund investor services. For example, fund shareholders are offered the privilege of exchanging shares of the fund for shares of other Fidelity funds, as set forth in the fund's prospectus, without paying an additional sales charge.
Annual Report
Board Approval of Investment Advisory Contracts and
Management Fees - continued
Investment Performance. Fidelity International Value Fund is a new fund and therefore had no historical performance for the Board to review at the time it approved the fund's Advisory Contracts. Once the fund has been in operation for at least one calendar year, the Board will review the fund's absolute investment performance for each class, as well as the fund's relative investment performance for each class measured against (i) a broad-based securities market index and (ii) a peer group of mutual funds deemed appropriate by the Board.
The Board considered that the fund's management fee is subject to upward or downward adjustment depending upon whether, and to what extent, the fund's investment performance for the performance period exceeds, or is exceeded by, the record (over the same period) of a Board-approved performance adjustment index. The Board realizes that the performance adjustment provides FMR with a strong economic incentive to seek to achieve superior performance for the fund's shareholders and helps to more closely align the interests of FMR and the fund's shareholders. The Board considered that the fund's performance adjustment fee is calculated based on the results of the retail class and does not take into account the performance of the Advisor classes. The Board considered FMR's belief that the retail class is the appropriate class on which to base the performance fee because: (i) the class does not have a 12b-1 fee; and (ii) distribution-related expenses should be excluded from the calculation because they are not related to evaluating an adviser's investment management skills.
Based on its review, the Board concluded that the nature, extent, and quality of the services provided by Fidelity will benefit the fund's shareholders, particularly in light of the Board's view that the fund's shareholders benefit from investing in a fund that is part of a large family of funds offering a variety of investment disciplines and services.
Competitiveness of Management Fee and Total Fund Expenses. The Board considered the fund's proposed management fee and projected total operating expenses for each class of the fund in reviewing the Advisory Contracts. The Board noted that the fund's proposed management fee rate is lower than the median fee rate of funds with similar Lipper investment objective categories and comparable management fee characteristics. The Board also considered that the projected total operating expenses are comparable to those of similar classes and funds that Fidelity offers to shareholders.
In its review of total expenses, the Board also noted that at previous meetings during the year it considered Fidelity fee structures and other information on clients that FMR and its affiliates service in other competitive markets, such as other mutual funds advised or subadvised by FMR or its affiliates, pension plan clients, and other institutional clients.
Annual Report
Based on its review, the Board concluded that the fund's proposed management fee and the projected total expenses for each class of the fund were fair and reasonable in light of the services that the fund and its shareholders receive and the other factors considered.
Costs of the Services and Profitability. The fund is a new fund and therefore no revenue, cost, or profitability data was available for the Board to review in respect of the fund at the time it approved the Advisory Contracts. In connection with its future renewal of the fund's management contract and sub-advisory agreements, the Board will consider the revenues earned and the expenses incurred by Fidelity in conducting the business of developing, marketing, distributing, managing, administering and servicing the fund and its shareholders.
Economies of Scale. The Board considered the extent to which the fund will benefit from economies of scale through increased services to the fund, through waivers or reimbursements, or through fee or expense reductions, including reductions that occur through operation of the transfer agent agreement. The transfer agent fee varies in part based on the number of accounts in the fund. If the number of accounts decreases or the average account size increases, the overall transfer agent fee rate decreases.
The Board recognized that the fund's management contract incorporates a "group fee" structure, which provides for lower fee rates as total fund assets under FMR's management increase, and for higher fee rates as total fund assets under FMR's management decrease. The Board considered that the group fee is designed to deliver the benefits of economies of scale to fund shareholders when total fund assets increase, even if assets of any particular fund are unchanged or have declined, because some portion of Fidelity's costs are attributable to services provided to all Fidelity funds, and all funds benefit if those costs can be allocated among more assets.
The Board concluded that, given the group fee structure, fund shareholders will achieve a certain level of economies of scale as assets under FMR's management increase at the fund complex level, regardless of whether Fidelity achieves any such economies of scale.
Additional Information Requested by the Board. In order to develop fully the factual basis for consideration of the Advisory Contracts, the Board received additional information regarding similar funds offered by other fund companies.
Based on its evaluation of all of the conclusions noted above, and after considering all material factors, the Board ultimately concluded that the advisory fee structures are fair and reasonable, and that the fund's Advisory Contracts should be approved.
Annual Report
Annual Report
Annual Report
Annual Report
Annual Report
Annual Report
Annual Report
Investment Adviser
Fidelity Management & Research Company
Boston, MA
Investment Sub-Advisers
FMR Co., Inc.
Fidelity Management & Research
(U.K.) Inc.
Fidelity Research & Analysis Company (formerly Fidelity Management & Research (Far East) Inc.)
Fidelity International
Investment Advisors
Fidelity Investments Japan Limited
Fidelity International Investment Advisors (U.K.) Limited
General Distributor
Fidelity Distributors Corporation
Boston, MA
Transfer and Service Agents
Fidelity Investments Institutional Operations Company, Inc.
Boston, MA
Fidelity Service Company, Inc.
Boston, MA
Custodian
The Northern Trust Company
Chicago, IL
(Fidelity Investment logo)(registered trademark)
Corporate Headquarters
82 Devonshire St., Boston, MA 02109
www.fidelity.com
AFIV-UANN-1206
1.827496.100
(Fidelity Investment logo)(registered trademark)
Fidelity Advisor
International Value
Fund - Institutional Class
Annual Report
October 31, 2006
(2_fidelity_logos) (Registered_Trademark)
Institutional Class is
a class of Fidelity®
International Value Fund
Contents
Chairman's Message | 4 | Ned Johnson's message to shareholders. |
Shareholder Expense Example | 5 | An example of shareholder expenses. |
Investment Summary | 7 | A summary of major shifts in the fund's investments over the past six months. |
Investments | 9 | A complete list of the fund's investments with their market values. |
Financial Statements | 15 | Statements of assets and liabilities, operations, and changes in net assets,
as well as financial highlights. |
Notes | 25 | Notes to the financial statements. |
Report of Independent Registered Public Accounting Firm | 34 | |
Trustees and Officers | 35 | |
Distributions | 46 | |
Board Approval of Investment Advisory Contracts and Management Fees | 47 | |
To view a fund's proxy voting guidelines and proxy voting record for the 12-month period ended June 30, visit www.fidelity.com/proxyvotingresults or visit the Securities and Exchange Commission's (SEC) web site at www.sec.gov. You may also call 1-877-208-0098 to request a free copy of the proxy voting guidelines.
Standard & Poor's, S&P and S&P 500 are registered service marks of The McGraw-Hill Companies, Inc. and have been licensed for use by Fidelity Distributors Corporation.
Other third party marks appearing herein are the property of their respective owners.
All other marks appearing herein are registered or unregistered trademarks or service marks of FMR Corp. or an affiliated company.
Annual Report
This report and the financial statements contained herein are submitted for the general information of the shareholders of the fund. This report is not authorized for distribution to prospective investors in the fund unless preceded or accompanied by an effective prospectus.
A fund files its complete schedule of portfolio holdings with the SEC for the first and third quarters of each fiscal year on Form N-Q. Forms N-Q are available on the SEC's web site at http://www.sec.gov. A fund's Forms N-Q may be reviewed and copied at the SEC's Public Reference Room in Washington, DC. Information regarding the operation of the SEC's Public Reference Room may be obtained by calling 1-800-SEC-0330. For a complete list of a fund's portfolio holdings, view the fund's most recent quarterly holdings report, semiannual report, or annual report on Fidelity's web site at http://www.advisor.fidelity.com.
NOT FDIC INSURED · MAY LOSE VALUE · NO BANK GUARANTEE
Neither the fund nor Fidelity Distributors Corporation is a bank.
Annual Report
Chairman's Message
(photo_of_Edward_C_Johnson_3d)
Dear Shareholder:
Stock and bond markets around the world have seen largely positive results year to date, although weakness in the technology sector and growth stocks in general have tempered performance. While financial markets are always unpredictable, there are a number of time-tested principles that can put the historical odds in your favor.
One of the basic tenets is to invest for the long term. Over time, riding out the markets' inevitable ups and downs has proven much more effective than selling into panic or chasing the hottest trend. Even missing only a few of the markets' best days can significantly diminish investor returns. Patience also affords the benefits of compounding - of earning interest on additional income or reinvested dividends and capital gains. There are tax advantages and cost benefits to consider as well. The more you sell, the more taxes you pay, and the more you trade, the higher the costs. While staying the course doesn't eliminate risk, it can considerably lessen the effect of short-term declines.
You can further manage your investing risk through diversification. And today, more than ever, geographic diversification should be taken into account. Studies indicate that asset allocation is the single most important determinant of a portfolio's long-term success. The right mix of stocks, bonds and cash - aligned to your particular risk tolerance and investment objective - is very important. Age-appropriate rebalancing is also an essential aspect of asset allocation. For younger investors, an emphasis on equities - which historically have been the best performing asset class over time - is encouraged. As investors near their specific goal, such as retirement or sending a child to college, consideration may be given to replacing volatile assets (e.g. common stocks) with more-stable fixed investments (bonds or savings plans).
A third investment principle - investing regularly - can help lower the average cost of your purchases. Investing a certain amount of money each month or quarter helps ensure you won't pay for all your shares at market highs. This strategy - known as dollar cost averaging - also reduces unconstructive "emotion" from investing, helping shareholders avoid selling weak performers just prior to an upswing, or chasing a hot performer just before a correction.
We invite you to contact us via the Internet, through our Investor Centers or over the phone. It is our privilege to provide you the information you need to make the investments that are right for you.
Sincerely,
/s/Edward C. Johnson 3d
Edward C. Johnson 3d
Annual Report
Shareholder Expense Example
As a shareholder of the Fund, you incur two types of costs: (1) transaction costs, including sales charges (loads) on purchase payments or redemption proceeds, redemption fees, and (2) ongoing costs, including management fees, distribution and/or service (12b-1) fees and other Fund expenses. This Example is intended to help you understand your ongoing costs (in dollars) of investing in the Fund and to compare these costs with the ongoing costs of investing in other mutual funds.
The actual expense Example is based on an investment of $1,000 invested at the beginning of the period and held for the entire period (May 18, 2006 to October 31, 2006). The hypothetical expense Example is based on an investment of $1,000 invested for the one-half year period (May 1, 2006 to October 31, 2006).
Actual Expenses
The first line of the accompanying table for each class of the Fund provides information about actual account values and actual expenses. You may use the information in this line, together with the amount you invested, to estimate the expenses that you paid over the period. Simply divide your account value by $1,000.00 (for example, an $8,600 account value divided by $1,000.00 = 8.6), then multiply the result by the number in the first line for a class of the Fund under the heading entitled "Expenses Paid During Period" to estimate the expenses you paid on your account during this period. A small balance maintenance fee of $12.00 that is charged once a year may apply for certain accounts with a value of less than $2,000. This fee is not included in the table below. If it was, the estimate of expenses you paid during the period would be higher, and your ending account value lower, by this amount.
Hypothetical Example for Comparison Purposes
The second line of the accompanying table for each class of the Fund provides information about hypothetical account values and hypothetical expenses based on a Class' actual expense ratio and an assumed rate of return of 5% per year before expenses, which is not the Class' actual return. The hypothetical account values and expenses may not be used to estimate the actual ending account balance or expenses you paid for the period. You may use this information to compare the ongoing costs of investing in the Fund and other funds. To do so, compare this 5% hypothetical example with the 5% hypothetical examples that appear in the shareholder reports of the other funds. A small balance maintenance fee of $12.00 that is charged once a year may apply for certain accounts with a value of less than $2,000. This fee is not included in the table below. If it was, the estimate of expenses you paid during the period would be higher, and your ending account value lower, by this amount.
Annual Report
Shareholder Expense Example - continued
Please note that the expenses shown in the table are meant to highlight your ongoing costs only and do not reflect any transaction costs. Therefore, the second line of the table is useful in comparing ongoing costs only, and will not help you determine the relative total costs of owning different funds. In addition, if these transactional costs were included, your costs would have been higher.
| Beginning
Account Value | Ending
Account Value | Expenses Paid
During Period |
Class A | | | |
Actual | $ 1,000.00 | $ 1,060.00 | $ 7.07 B |
HypotheticalA | $ 1,000.00 | $ 1,017.64 | $ 7.63 C |
Class T | | | |
Actual | $ 1,000.00 | $ 1,059.00 | $ 8.24 B |
HypotheticalA | $ 1,000.00 | $ 1,016.38 | $ 8.89 C |
Class B | | | |
Actual | $ 1,000.00 | $ 1,056.00 | $ 10.58 B |
HypotheticalA | $ 1,000.00 | $ 1,013.86 | $ 11.42 C |
Class C | | | |
Actual | $ 1,000.00 | $ 1,056.00 | $ 10.58 B |
HypotheticalA | $ 1,000.00 | $ 1,013.86 | $ 11.42 C |
International Value | | | |
Actual | $ 1,000.00 | $ 1,061.00 | $ 5.89 B |
HypotheticalA | $ 1,000.00 | $ 1,018.90 | $ 6.36 C |
Institutional Class | | | |
Actual | $ 1,000.00 | $ 1,061.00 | $ 5.89 B |
HypotheticalA | $ 1,000.00 | $ 1,018.90 | $ 6.36 C |
A 5% return per year before expenses
B Actual expenses are equal to each Class' annualized expense ratio (shown in the table below); multiplied by the average account value over the period, multiplied by 167/365 (to reflect the period May 18, 2006 to October 31, 2006).
C Hypothetical expenses are equal to each Class' annualized expense ratio (shown in the table below); multiplied by the average account value over the period, multiplied by 184/365 (to reflect the one-half year period).
| Annualized
Expense Ratio |
Class A | 1.50% |
Class T | 1.75% |
Class B | 2.25% |
Class C | 2.25% |
International Value | 1.25% |
Institutional Class | 1.25% |
Annual Report
Investment Summary
Geographic Diversification (% of fund's net assets) |
As of October 31, 2006 |
| Japan 19.9% |
| United Kingdom 17.8% |
| Germany 10.2% |
| Switzerland 9.4% |
| France 8.6% |
| Italy 4.6% |
| Netherlands 3.3% |
| Canada 3.3% |
| Norway 2.9% |
| Other 20.0% |

Percentages are adjusted for the effect of futures contracts, if applicable. |
Asset Allocation |
| % of fund's
net assets |
Stocks | 98.0 |
Short-Term Investments and Net Other Assets | 2.0 |
Top Ten Stocks as of October 31, 2006 |
| % of fund's
net assets |
Royal Bank of Scotland Group PLC (United Kingdom, Commercial Banks) | 4.0 |
HSBC Holdings PLC (United Kingdom) (Reg.) (United Kingdom, Commercial Banks) | 2.8 |
ENI Spa sponsored ADR (Italy, Oil, Gas & Consumable Fuels) | 2.6 |
Barclays PLC (United Kingdom, Commercial Banks) | 2.5 |
ING Groep NV sponsored ADR (Netherlands, Diversified Financial Services) | 2.4 |
UBS AG (NY Shares) (Switzerland, Capital Markets) | 2.3 |
Mitsui & Co. Ltd. (Japan, Trading Companies & Distributors) | 2.2 |
Allianz AG sponsored ADR (Germany, Insurance) | 2.2 |
GlobalSantaFe Corp. (Cayman Islands, Energy Equipment & Services) | 2.1 |
Toyota Motor Corp. (Japan, Automobiles) | 2.0 |
| 25.1 |
Market Sectors as of October 31, 2006 |
| % of fund's
net assets |
Financials | 40.3 |
Energy | 11.3 |
Industrials | 8.9 |
Consumer Discretionary | 7.5 |
Information Technology | 7.4 |
Utilities | 5.7 |
Consumer Staples | 5.8 |
Materials | 5.5 |
Health Care | 3.1 |
Telecommunication Services | 2.5 |
Annual Report
Investments October 31, 2006
Showing Percentage of Net Assets
Common Stocks - 98.0% |
| Shares | | Value (Note 1) |
Australia - 2.0% |
Australia & New Zealand Banking Group Ltd. | 35,900 | | $ 807,079 |
Macquarie Airports unit | 326,000 | | 810,117 |
National Australia Bank Ltd. | 82,300 | | 2,422,912 |
Zinifex Ltd. | 54,000 | | 634,168 |
TOTAL AUSTRALIA | | 4,674,276 |
Austria - 1.1% |
OMV AG | 46,400 | | 2,522,391 |
Brazil - 1.0% |
Companhia Vale do Rio Doce sponsored ADR | 50,000 | | 1,272,000 |
Uniao de Bancos Brasileiros SA (Unibanco) GDR | 13,300 | | 1,047,375 |
TOTAL BRAZIL | | 2,319,375 |
Canada - 3.3% |
Canadian Natural Resources Ltd. | 47,900 | | 2,493,881 |
Cognos, Inc. (a) | 52,700 | | 1,922,496 |
Finning International, Inc. | 25,500 | | 902,886 |
Power Corp. of Canada (sub. vtg.) | 36,000 | | 1,090,598 |
RONA, Inc. (a) | 56,500 | | 1,147,464 |
TOTAL CANADA | | 7,557,325 |
Cayman Islands - 2.1% |
GlobalSantaFe Corp. | 95,400 | | 4,951,260 |
China - 0.3% |
Dongfeng Motor Group Co. Ltd. (H Shares) | 1,748,000 | | 782,163 |
Czech Republic - 0.4% |
Ceske Energeticke Zavody AS | 23,600 | | 933,264 |
Finland - 0.5% |
Nokia Corp. sponsored ADR | 58,000 | | 1,153,040 |
France - 8.6% |
Accor SA | 21,300 | | 1,478,990 |
AXA SA sponsored ADR | 73,400 | | 2,798,008 |
BNP Paribas SA | 13,400 | | 1,473,489 |
Carrefour SA | 28,200 | | 1,718,376 |
Compagnie de St. Gobain | 48,200 | | 3,552,923 |
Pernod Ricard SA | 11,700 | | 2,343,126 |
Peugeot Citroen SA | 14,500 | | 833,036 |
Societe Generale Series A | 16,335 | | 2,714,669 |
Suez SA (France) | 20,800 | | 930,812 |
Total SA sponsored ADR | 29,700 | | 2,023,758 |
TOTAL FRANCE | | 19,867,187 |
Common Stocks - continued |
| Shares | | Value (Note 1) |
Germany - 10.2% |
Allianz AG sponsored ADR | 267,600 | | $ 4,974,684 |
BASF AG sponsored ADR | 49,300 | | 4,337,414 |
DaimlerChrysler AG | 31,600 | | 1,798,988 |
E.ON AG | 38,900 | | 4,683,171 |
Heidelberger Druckmaschinen AG | 24,700 | | 1,124,256 |
KarstadtQuelle AG (a)(d) | 70,000 | | 1,644,003 |
Muenchener Rueckversicherungs-Gesellschaft AG (Reg.) | 27,100 | | 4,399,212 |
RWE AG | 5,600 | | 553,457 |
TOTAL GERMANY | | 23,515,185 |
Greece - 0.4% |
Greek Organization of Football Prognostics SA | 24,800 | | 885,699 |
Hong Kong - 2.1% |
Swire Pacific Ltd. (A Shares) | 415,300 | | 4,386,784 |
Yue Yuen Industrial Holdings Ltd. | 158,000 | | 478,437 |
TOTAL HONG KONG | | 4,865,221 |
India - 0.5% |
Satyam Computer Services Ltd. | 22,028 | | 215,670 |
Satyam Computer Services Ltd. sponsored ADR | 41,400 | | 915,354 |
TOTAL INDIA | | 1,131,024 |
Ireland - 0.6% |
Bank of Ireland | 45,900 | | 922,590 |
Kerry Group PLC Class A | 19,200 | | 463,915 |
TOTAL IRELAND | | 1,386,505 |
Israel - 0.2% |
Teva Pharmaceutical Industries Ltd. sponsored ADR | 12,400 | | 408,828 |
Italy - 4.6% |
Banca Intesa Spa | 104,000 | | 710,985 |
ENI Spa sponsored ADR (d) | 100,800 | | 6,119,568 |
Mediaset Spa | 79,300 | | 889,711 |
San Paolo IMI Spa | 49,400 | | 1,053,949 |
Unicredito Italiano Spa | 229,000 | | 1,898,752 |
TOTAL ITALY | | 10,672,965 |
Japan - 19.9% |
Aeon Credit Service Co. Ltd. | 31,000 | | 693,100 |
Asahi Breweries Ltd. | 46,900 | | 668,453 |
Astellas Pharma, Inc. | 13,600 | | 612,791 |
Canon, Inc. | 86,850 | | 4,636,922 |
Common Stocks - continued |
| Shares | | Value (Note 1) |
Japan - continued |
Daiwa Securities Group, Inc. | 140,000 | | $ 1,588,406 |
East Japan Railway Co. | 530 | | 3,706,738 |
Fujitsu Ltd. | 85,000 | | 693,314 |
Japan Tobacco, Inc. | 200 | | 872,093 |
Konica Minolta Holdings, Inc. | 66,500 | | 885,833 |
Mitsui & Co. Ltd. | 373,000 | | 5,093,032 |
Mizuho Financial Group, Inc. | 598 | | 4,657,815 |
Nippon Oil Corp. | 448,000 | | 3,332,421 |
Nippon Steel Corp. | 124,000 | | 504,651 |
Nippon Yusen KK | 107,000 | | 694,366 |
ORIX Corp. | 12,430 | | 3,501,783 |
Ricoh Co. Ltd. | 64,000 | | 1,264,022 |
Shin-Etsu Chemical Co. Ltd. | 8,700 | | 570,528 |
Sumitomo Mitsui Financial Group, Inc. | 109 | | 1,192,887 |
Sumitomo Trust & Banking Co. Ltd. | 91,000 | | 978,779 |
Takeda Pharamaceutical Co. Ltd. | 16,700 | | 1,072,307 |
Tokyo Gas Co. Ltd. (d) | 784,000 | | 4,001,779 |
Toyota Motor Corp. | 79,400 | | 4,684,600 |
TOTAL JAPAN | | 45,906,620 |
Korea (South) - 1.6% |
Kookmin Bank sponsored ADR | 14,300 | | 1,134,848 |
Samsung Electronics Co. Ltd. GDR | 8,171 | | 2,649,447 |
TOTAL KOREA (SOUTH) | | 3,784,295 |
Netherlands - 3.3% |
ING Groep NV sponsored ADR | 124,900 | | 5,536,817 |
Royal DSM NV | 18,300 | | 834,118 |
TomTom Group BV (a) | 28,800 | | 1,216,767 |
TOTAL NETHERLANDS | | 7,587,702 |
Norway - 2.9% |
DnB Nor ASA | 212,600 | | 2,784,102 |
Fred Olsen Energy ASA (a)(d) | 47,500 | | 2,049,231 |
Petroleum Geo-Services ASA (a) | 18,500 | | 1,076,898 |
Statoil ASA | 31,300 | | 791,287 |
TOTAL NORWAY | | 6,701,518 |
Philippines - 0.3% |
Philippine Long Distance Telephone Co. sponsored ADR (d) | 13,600 | | 647,496 |
Common Stocks - continued |
| Shares | | Value (Note 1) |
Russia - 0.4% |
OAO Gazprom sponsored ADR | 20,500 | | $ 873,300 |
OAO TMK unit | 4,700 | | 118,675 |
TOTAL RUSSIA | | 991,975 |
Singapore - 0.5% |
DBS Group Holdings Ltd. | 89,000 | | 1,165,789 |
South Africa - 0.2% |
FirstRand Ltd. | 181,300 | | 474,275 |
Spain - 2.0% |
Banco Bilbao Vizcaya Argentaria SA sponsored ADR | 104,400 | | 2,526,480 |
Gestevision Telecinco SA | 18,900 | | 496,712 |
Telefonica SA sponsored ADR | 27,600 | | 1,592,520 |
TOTAL SPAIN | | 4,615,712 |
Sweden - 0.5% |
Atlas Copco AB (A Shares) | 35,800 | | 1,045,885 |
Switzerland - 9.4% |
Adecco SA (Reg.) | 19,534 | | 1,206,597 |
Credit Suisse Group sponsored ADR | 71,500 | | 4,324,320 |
Nestle SA (Reg.) | 10,517 | | 3,592,593 |
Novartis AG sponsored ADR | 52,100 | | 3,164,033 |
Roche Holding AG (participation certificate) | 9,058 | | 1,584,959 |
Swiss Reinsurance Co. (Reg.) | 15,857 | | 1,300,015 |
UBS AG (NY Shares) | 90,700 | | 5,427,488 |
Zurich Financial Services AG (Reg.) | 4,906 | | 1,212,551 |
TOTAL SWITZERLAND | | 21,812,556 |
Taiwan - 0.7% |
AU Optronics Corp. | 663,000 | | 895,325 |
Hon Hai Precision Industry Co. Ltd. (Foxconn) | 117,200 | | 761,314 |
TOTAL TAIWAN | | 1,656,639 |
Turkey - 0.3% |
Turkiye Garanti Bankasi AS | 157,000 | | 576,394 |
United Kingdom - 17.8% |
BAE Systems PLC | 125,100 | | 1,001,045 |
Barclays PLC | 422,200 | | 5,732,421 |
BHP Billiton PLC | 180,900 | | 3,488,625 |
British American Tobacco PLC | 90,900 | | 2,499,750 |
HSBC Holdings PLC (United Kingdom) (Reg.) | 337,400 | | 6,442,316 |
National Grid PLC | 173,100 | | 2,212,261 |
Prudential PLC | 150,028 | | 1,838,696 |
Common Stocks - continued |
| Shares | | Value (Note 1) |
United Kingdom - continued |
Royal Bank of Scotland Group PLC | 261,500 | | $ 9,317,797 |
SABMiller PLC | 24,900 | | 481,617 |
Smiths Group PLC | 78,500 | | 1,416,528 |
Taylor Woodrow PLC | 74,600 | | 517,614 |
Tesco PLC | 78,700 | | 590,723 |
Vedanta Resources PLC | 29,400 | | 819,897 |
Vodafone Group PLC sponsored ADR | 133,712 | | 3,456,455 |
Yell Group PLC | 104,400 | | 1,240,661 |
TOTAL UNITED KINGDOM | | 41,056,406 |
United States of America - 0.3% |
NTL, Inc. | 27,900 | | 754,137 |
TOTAL COMMON STOCKS (Cost $214,334,562) | 226,403,107 |
Money Market Funds - 6.6% |
| | | |
Fidelity Cash Central Fund, 5.34% (b) | 5,932,157 | | 5,932,157 |
Fidelity Securities Lending Cash Central Fund, 5.35% (b)(c) | 9,393,970 | | 9,393,970 |
TOTAL MONEY MARKET FUNDS (Cost $15,326,127) | 15,326,127 |
TOTAL INVESTMENT PORTFOLIO - 104.6% (Cost $229,660,689) | | 241,729,234 |
NET OTHER ASSETS - (4.6)% | | (10,722,305) |
NET ASSETS - 100% | $ 231,006,929 |
Legend |
(a) Non-income producing |
(b) Affiliated fund that is available only to investment companies and other accounts managed by Fidelity Investments. The rate quoted is the annualized seven-day yield of the fund at period end. A complete unaudited listing of the fund's holdings as of its most recent quarter end is available upon request. |
(c) Investment made with cash collateral received from securities on loan. |
(d) Security or a portion of the security is on loan at period end. |
Affiliated Central Funds |
Information regarding fiscal year to date income earned by the Fund from investments in Fidelity Central Funds is as follows: |
Fund | Income earned |
Fidelity Cash Central Fund | $ 100,857 |
Fidelity Securities Lending Cash Central Fund | 9,903 |
Total | $ 110,760 |
Annual Report
See accompanying notes which are an integral part of the financial statements.
Financial Statements
Statement of Assets and Liabilities
October 31, 2006 |
| | |
Assets | | |
Investment in securities, at value (including securities loaned of $9,036,737) - See accompanying schedule: Unaffiliated issuers (cost $214,334,562) | $ 226,403,107 | |
Fidelity Central Funds (cost $15,326,127) | 15,326,127 | |
Total Investments (cost $229,660,689) | | $ 241,729,234 |
Foreign currency held at value (cost $248,717) | | 248,942 |
Receivable for fund shares sold | | 1,750,129 |
Dividends receivable | | 323,734 |
Interest receivable | | 32,830 |
Prepaid expenses | | 43,035 |
Receivable from investment adviser for expense reductions | | 70,766 |
Other receivables | | 18,406 |
Total assets | | 244,217,076 |
| | |
Liabilities | | |
Payable to custodian bank | $ 1,035 | |
Payable for investments purchased | 3,232,815 | |
Payable for fund shares redeemed | 284,256 | |
Accrued management fee | 162,096 | |
Distribution fees payable | 3,724 | |
Other affiliated payables | 36,110 | |
Other payables and accrued expenses | 96,141 | |
Collateral on securities loaned, at value | 9,393,970 | |
Total liabilities | | 13,210,147 |
| | |
Net Assets | | $ 231,006,929 |
Net Assets consist of: | | |
Paid in capital | | $ 218,143,761 |
Undistributed net investment income | | 808,421 |
Accumulated undistributed net realized gain (loss) on investments and foreign currency transactions | | (6,746) |
Net unrealized appreciation (depreciation) on investments and assets and liabilities in foreign currencies | | 12,061,493 |
Net Assets | | $ 231,006,929 |
Annual Report
See accompanying notes which are an integral part of the financial statements.
Financial Statements - continued
Statement of Assets and Liabilities - continued
October 31, 2006 |
| | |
Calculation of Maximum Offering Price
Class A:
Net Asset Value and redemption price per share
($1,537,484 ÷ 145,057 shares) | | $ 10.60 |
| | |
Maximum offering price per share (100/94.25 of $10.60) | | $ 11.25 |
Class T:
Net Asset Value and redemption price per share
($1,788,679 ÷ 168,964 shares) | | $ 10.59 |
| | |
Maximum offering price per share (100/96.50 of $10.59) | | $ 10.97 |
Class B:
Net Asset Value and offering price per share
($1,303,770 ÷ 123,443 shares)A | | $ 10.56 |
| | |
Class C:
Net Asset Value and offering price per share
($2,183,270 ÷ 206,711 shares)A | | $ 10.56 |
| | |
International Value:
Net Asset Value, offering price and redemption price per
share ($221,129,843 ÷ 20,842,605 shares) | | $ 10.61 |
| | |
Institutional Class:
Net Asset Value, offering price and redemption price per
share ($3,063,883 ÷ 288,807 shares) | | $ 10.61 |
A Redemption price per share is equal to net asset value less any applicable contingent deferred sales charge.
Annual Report
See accompanying notes which are an integral part of the financial statements.
Statement of Operations
For the period May 18, 2006 (commencement of operations) to October 31, 2006 |
| | |
Investment Income | | |
Dividends | | $ 1,091,719 |
Special dividends | | 353,113 |
Interest | | 7,169 |
Income from Fidelity Central Funds | | 110,760 |
| | 1,562,761 |
Less foreign taxes withheld | | (90,621) |
Total income | | 1,472,140 |
| | |
Expenses | | |
Management fee | $ 380,865 | |
Transfer agent fees | 125,699 | |
Distribution fees | 15,801 | |
Accounting and security lending fees | 29,229 | |
Custodian fees and expenses | 132,076 | |
Independent trustees' compensation | 137 | |
Registration fees | 81,756 | |
Audit | 48,886 | |
Legal | 275 | |
Total expenses before reductions | 814,724 | |
Expense reductions | (151,005) | 663,719 |
Net investment income (loss) | | 808,421 |
Realized and Unrealized Gain (Loss) Net realized gain (loss) on: | | |
Investment securities: | | |
Unaffiliated issuers | 4,399 | |
Foreign currency transactions | (11,145) | |
Total net realized gain (loss) | | (6,746) |
Change in net unrealized appreciation (depreciation) on: Investment securities (net of increase in deferred foreign taxes of $7,086) | 12,061,459 | |
Assets and liabilities in foreign currencies | 34 | |
Total change in net unrealized appreciation (depreciation) | | 12,061,493 |
Net gain (loss) | | 12,054,747 |
Net increase (decrease) in net assets resulting from operations | | $ 12,863,168 |
Annual Report
See accompanying notes which are an integral part of the financial statements.
Financial Statements - continued
Statement of Changes in Net Assets
| For the period
May 18, 2006 (commencement of operations) to
October 31, 2006 |
Increase (Decrease) in Net Assets | |
Operations | |
Net investment income (loss) | $ 808,421 |
Net realized gain (loss) | (6,746) |
Change in net unrealized appreciation (depreciation) | 12,061,493 |
Net increase (decrease) in net assets resulting from operations | 12,863,168 |
Share transactions - net increase (decrease) | 218,123,163 |
Redemption fees | 20,598 |
Total increase (decrease) in net assets | 231,006,929 |
| |
Net Assets | |
Beginning of period | - |
End of period (including undistributed net investment
income of $808,421) | $ 231,006,929 |
Annual Report
See accompanying notes which are an integral part of the financial statements.
Financial Highlights - Class A
Period ended October 31, | 2006 I |
Selected Per-Share Data | |
Net asset value, beginning of period | $ 10.00 |
Income from Investment Operations | |
Net investment income (loss) E | .06 H |
Net realized and unrealized gain (loss) | .54 |
Total from investment operations | .60 |
Redemption fees added to paid in capital E | - K |
Net asset value, end of period | $ 10.60 |
Total Return B, C, D | 6.00% |
Ratios to Average Net Assets F, J | |
Expenses before reductions | 1.75% A |
Expenses net of fee waivers, if any | 1.50%A |
Expenses net of all reductions | 1.46%A |
Net investment income (loss) | 1.29%A, H |
Supplemental Data | |
Net assets, end of period (000 omitted) | $ 1,537 |
Portfolio turnover rate G | 29%A |
A Annualized
B Total returns for periods of less than one year are not annualized.
C Total returns would have been lower had certain expenses not been reduced during the periods shown.
D Total returns do not include the effect of the sales charges.
E Calculated based on average shares outstanding during the period.
F Fees and expenses of the underlying Fidelity Central Funds are not included in the Fund's expense ratio. The Fund indirectly bears its proportionate share of the expenses of any underlying Fidelity Central Funds.
G Amount does not include the portfolio activity of any underlying Fidelity Central Funds.
H Investment income per share reflects a special dividend which amounted to $.03 per share. Excluding the special dividend, the ratio of net investment income (loss) to average net assets would have been .63%.
I For the period May 18, 2006 (commencement of operations) to October 31, 2006.
J Expense ratios reflect operating expenses of the class. Expenses before reductions do not reflect amounts reimbursed by the investment adviser or reductions from brokerage service arrangements or other expense offset arrangements and do not represent the amount paid by the class during periods when reimbursements or reductions occur. Expense ratios before reductions for start-up periods may not be representative of longer-term operating periods. Expenses net of fee waivers reflect expenses after reimbursement by the investment adviser but prior to reductions from brokerage service arrangements or other expense offset arrangements. Expenses net of all reductions represent the net expenses paid by the class.
K Amount represents less than $.01 per share.
Annual Report
See accompanying notes which are an integral part of the financial statements.
Financial Highlights - Class T
Period ended October 31, | 2006 I |
Selected Per-Share Data | |
Net asset value, beginning of period | $ 10.00 |
Income from Investment Operations | |
Net investment income (loss) E | .05 H |
Net realized and unrealized gain (loss) | .54 |
Total from investment operations | .59 |
Redemption fees added to paid in capital E | - K |
Net asset value, end of period | $ 10.59 |
Total Return B, C, D | 5.90% |
Ratios to Average Net Assets F, J | |
Expenses before reductions | 2.01% A |
Expenses net of fee waivers, if any | 1.75%A |
Expenses net of all reductions | 1.71%A |
Net investment income (loss) | 1.04%A, H |
Supplemental Data | |
Net assets, end of period (000 omitted) | $ 1,789 |
Portfolio turnover rate G | 29%A |
A Annualized
B Total returns for periods of less than one year are not annualized.
C Total returns would have been lower had certain expenses not been reduced during the periods shown.
D Total returns do not include the effect of the sales charges.
E Calculated based on average shares outstanding during the period.
F Fees and expenses of the underlying Fidelity Central Funds are not included in the Fund's expense ratio. The Fund indirectly bears its proportionate share of the expenses of any underlying Fidelity Central Funds.
G Amount does not include the portfolio activity of any underlying Fidelity Central Funds.
H Investment income per share reflects a special dividend which amounted to $.03 per share. Excluding the special dividend, the ratio of net investment income (loss) to average net assets would have been .38%.
I For the period May 18, 2006 (commencement of operations) to October 31, 2006.
J Expense ratios reflect operating expenses of the class. Expenses before reductions do not reflect amounts reimbursed by the investment adviser or reductions from brokerage service arrangements or other expense offset arrangements and do not represent the amount paid by the class during periods when reimbursements or reductions occur. Expense ratios before reductions for start-up periods may not be representative of longer-term operating periods. Expenses net of fee waivers reflect expenses after reimbursement by the investment adviser but prior to reductions from brokerage service arrangements or other expense offset arrangements. Expenses net of all reductions represent the net expenses paid by the class.
K Amount represents less than $.01 per share.
Annual Report
See accompanying notes which are an integral part of the financial statements.
Financial Highlights - Class B
Period ended October 31, | 2006 I |
Selected Per-Share Data | |
Net asset value, beginning of period | $ 10.00 |
Income from Investment Operations | |
Net investment income (loss) E | .02 H |
Net realized and unrealized gain (loss) | .54 |
Total from investment operations | .56 |
Redemption fees added to paid in capital E | - K |
Net asset value, end of period | $ 10.56 |
Total Return B, C, D | 5.60% |
Ratios to Average Net Assets F, J | |
Expenses before reductions | 2.50%A |
Expenses net of fee waivers, if any | 2.25%A |
Expenses net of all reductions | 2.21%A |
Net investment income (loss) | .54%A, H |
Supplemental Data | |
Net assets, end of period (000 omitted) | $ 1,304 |
Portfolio turnover rate G | 29% A |
A Annualized
B Total returns for periods of less than one year are not annualized.
C Total returns would have been lower had certain expenses not been reduced during the periods shown.
D Total returns do not include the effect of the contingent deferred sales charge.
E Calculated based on average shares outstanding during the period.
F Fees and expenses of the underlying Fidelity Central Funds are not included in the Fund's expense ratio. The Fund indirectly bears its proportionate share of the expenses of any underlying Fidelity Central Funds.
G Amount does not include the portfolio activity of any underlying Fidelity Central Funds.
H Investment income per share reflects a special dividend which amounted to $.03 per share. Excluding the special dividend, the ratio of net investment income (loss) to average net assets would have been (.12)%.
I For the period May 18, 2006 (commencement of operations) to October 31, 2006.
J Expense ratios reflect operating expenses of the class. Expenses before reductions do not reflect amounts reimbursed by the investment adviser or reductions from brokerage service arrangements or other expense offset arrangements and do not represent the amount paid by the class during periods when reimbursements or reductions occur. Expense ratios before reductions for start-up periods may not be representative of longer-term operating periods. Expenses net of fee waivers reflect expenses after reimbursement by the investment adviser but prior to reductions from brokerage service arrangements or other expense offset arrangements. Expenses net of all reductions represent the net expenses paid by the class.
K Amount represents less than $.01 per share.
Annual Report
See accompanying notes which are an integral part of the financial statements.
Financial Highlights - Class C
Period ended October 31, | 2006 I |
Selected Per-Share Data | |
Net asset value, beginning of period | $ 10.00 |
Income from Investment Operations | |
Net investment income (loss) E | .02 H |
Net realized and unrealized gain (loss) | .54 |
Total from investment operations | .56 |
Redemption fees added to paid in capital E | - K |
Net asset value, end of period | $ 10.56 |
Total Return B, C, D | 5.60% |
Ratios to Average Net Assets F, J | |
Expenses before reductions | 2.47%A |
Expenses net of fee waivers, if any | 2.25%A |
Expenses net of all reductions | 2.21%A |
Net investment income (loss) | .54%A, H |
Supplemental Data | |
Net assets, end of period (000 omitted) | $ 2,183 |
Portfolio turnover rate G | 29%A |
A Annualized
B Total returns for periods of less than one year are not annualized.
C Total returns would have been lower had certain expenses not been reduced during the periods shown.
D Total returns do not include the effect of the contingent deferred sales charge.
E Calculated based on average shares outstanding during the period.
F Fees and expenses of the underlying Fidelity Central Funds are not included in the Fund's expense ratio. The Fund indirectly bears its proportionate share of the expenses of any underlying Fidelity Central Funds.
G Amount does not include the portfolio activity of any underlying Fidelity Central Funds.
H Investment income per share reflects a special dividend which amounted to $.03 per share. Excluding the special dividend, the ratio of net investment income (loss) to average net assets would have been (.12)%.
I For the period May 18, 2006 (commencement of operations) to October 31, 2006.
J Expense ratios reflect operating expenses of the class. Expenses before reductions do not reflect amounts reimbursed by the investment adviser or reductions from brokerage service arrangements or other expense offset arrangements and do not represent the amount paid by the class during periods when reimbursements or reductions occur. Expense ratios before reductions for start-up periods may not be representative of longer-term operating periods. Expenses net of fee waivers reflect expenses after reimbursement by the investment adviser but prior to reductions from brokerage service arrangements or other expense offset arrangements. Expenses net of all reductions represent the net expenses paid by the class.
K Amount represents less than $.01 per share.
Annual Report
See accompanying notes which are an integral part of the financial statements.
Financial Highlights - International Value
Period ended October 31, | 2006 H |
Selected Per-Share Data | |
Net asset value, beginning of period | $ 10.00 |
Income from Investment Operations | |
Net investment income (loss) D | .07 G |
Net realized and unrealized gain (loss) | .54 |
Total from investment operations | .61 |
Redemption fees added to paid in capital D | -J |
Net asset value, end of period | $ 10.61 |
Total Return B, C | 6.10% |
Ratios to Average Net Assets E, I | |
Expenses before reductions | 1.50%A |
Expenses net of fee waivers, if any | 1.25%A |
Expenses net of all reductions | 1.21%A |
Net investment income (loss) | 1.54%A, G |
Supplemental Data | |
Net assets, end of period (000 omitted) | $ 221,130 |
Portfolio turnover rate F | 29%A |
A Annualized
B Total returns for periods of less than one year are not annualized.
C Total returns would have been lower had certain expenses not been reduced during the periods shown.
D Calculated based on average shares outstanding during the period.
E Fees and expenses of the underlying Fidelity Central Funds are not included in the Fund's expense ratio. The Fund indirectly bears its proportionate share of the expenses of any underlying Fidelity Central Funds.
F Amount does not include the portfolio activity of any underlying Fidelity Central Funds.
G Investment income per share reflects a special dividend which amounted to $.03 per share. Excluding the special dividend, the ratio of net investment income (loss) to average net assets would have been .88%.
H For the period May 18, 2006 (commencement of operations) to October 31, 2006.
I Expense ratios reflect operating expenses of the class. Expenses before reductions do not reflect amounts reimbursed by the investment adviser or reductions from brokerage service arrangements or other expense offset arrangements and do not represent the amount paid by the class during periods when reimbursements or reductions occur. Expense ratios before reductions for start-up periods may not be representative of longer-term operating periods. Expenses net of fee waivers reflect expenses after reimbursement by the investment adviser but prior to reductions from brokerage service arrangements or other expense offset arrangements. Expenses net of all reductions represent the net expenses paid by the class.
J Amount represents less than $.01 per share.
Annual Report
See accompanying notes which are an integral part of the financial statements.
Financial Highlights - Institutional Class
Period ended October 31, | 2006 H |
Selected Per-Share Data | |
Net asset value, beginning of period | $ 10.00 |
Income from Investment Operations | |
Net investment income (loss) D | .07 G |
Net realized and unrealized gain (loss) | .54 |
Total from investment operations | .61 |
Redemption fees added to paid in capital D | - J |
Net asset value, end of period | $ 10.61 |
Total Return B, C | 6.10% |
Ratios to Average Net Assets E, I | |
Expenses before reductions | 1.38%A |
Expenses net of fee waivers, if any | 1.25%A |
Expenses net of all reductions | 1.21%A |
Net investment income (loss) | 1.54%A, G |
Supplemental Data | |
Net assets, end of period (000 omitted) | $ 3,064 |
Portfolio turnover rate F | 29%A |
A Annualized
B Total returns for periods of less than one year are not annualized.
C Total returns would have been lower had certain expenses not been reduced during the periods shown.
D Calculated based on average shares outstanding during the period.
E Fees and expenses of the underlying Fidelity Central Funds are not included in the Fund's expense ratio. The Fund indirectly bears its proportionate share of the expenses of any underlying Fidelity Central Funds.
F Amount does not include the portfolio activity of any underlying Fidelity Central Funds.
G Investment income per share reflects a special dividend which amounted to $.03 per share. Excluding the special dividend, the ratio of net investment income (loss) to average net assets would have been .88%.
H For the period May 18, 2006 (commencement of operations) to October 31, 2006.
I Expense ratios reflect operating expenses of the class. Expenses before reductions do not reflect amounts reimbursed by the investment adviser or reductions from brokerage service arrangements or other expense offset arrangements and do not represent the amount paid by the class during periods when reimbursements or reductions occur. Expense ratios before reductions for start-up periods may not be representative of longer-term operating periods. Expenses net of fee waivers reflect expenses after reimbursement by the investment adviser but prior to reductions from brokerage service arrangements or other expense offset arrangements. Expenses net of all reductions represent the net expenses paid by the class.
J Amount represents less than $.01 per share.
Annual Report
See accompanying notes which are an integral part of the financial statements.
Notes to Financial Statements
For the period ended October 31, 2006
1. Significant Accounting Policies.
Fidelity International Value Fund (the Fund) is a fund of Fidelity Investment Trust (the trust) and is authorized to issue an unlimited number of shares. The trust is registered under the Investment Company Act of 1940, as amended (the 1940 Act), as an open-end management investment company organized as a Massachusetts business trust.
The Fund offers Class A, Class T, Class B, Class C, International Value Fund and Institutional Class shares, each of which has equal rights as to assets and voting privileges. Each class has exclusive voting rights with respect to matters that affect that class. Class B shares will automatically convert to Class A shares after a holding period of seven years from the initial date of purchase. Investment income, realized and unrealized capital gains and losses, the common expenses of the Fund, and certain fund-level expense reductions, if any, are allocated on a pro rata basis to each class based on the relative net assets of each class to the total net assets of the Fund. Each class differs with respect to transfer agent and distribution and service plan fees incurred. Certain expense reductions also differ by class.
The Fund's investments in emerging markets can be subject to social, economic, regulatory, and political uncertainties and can be extremely volatile.
The Fund may invest in Fidelity Central Funds which are open-end investment companies available to investment companies and other accounts managed by Fidelity Management & Research Company (FMR) and its affiliates. The financial statements have been prepared in conformity with accounting principles generally accepted in the United States of America, which require management to make certain estimates and assumptions at the date of the financial statements. The following summarizes the significant accounting policies of the Fund, which are also consistently followed by the Fidelity Central Funds:
Security Valuation. Investments are valued and net asset value (NAV) per share is calculated (NAV calculation) as of the close of business of the New York Stock Exchange (NYSE), normally 4:00 p.m. Eastern time. Wherever possible, the Fund uses independent pricing services approved by the Board of Trustees to value its investments.
Equity securities, including restricted securities, for which market quotations are readily available, are valued at the last reported sale price or official closing price as reported by an independent pricing service on the primary market or exchange on which they are traded. In the event there were no sales during the day or closing prices are not available, securities are valued at the last quoted bid price. Investments in open-end mutual funds, including the Fidelity Central Funds, are valued at their closing net asset value each business day. Short-term securities with remaining maturities of sixty days or less for
Annual Report
Notes to Financial Statements - continued
1. Significant Accounting Policies - continued
Security Valuation - continued
which quotations are not readily available are valued at amortized cost, which approximates value.
When current market prices or quotations are not readily available or do not accurately reflect fair value, valuations may be determined in accordance with procedures adopted by the Board of Trustees. For example, when developments occur between the close of a market and the close of the NYSE that may materially affect the value of some or all of the securities, or when trading in a security is halted, those securities may be fair valued. Factors used in the determination of fair value may include monitoring news to identify significant market or security specific events such as changes in the value of U.S. securities markets, reviewing developments in foreign markets and evaluating the performance of ADRs, futures contracts and exchange-traded funds. Because the Fund's utilization of fair value pricing depends on market activity, the frequency with which fair value pricing is used can not be predicted and may be utilized to a significant extent. The value of securities used for NAV calculation under fair value pricing may differ from published prices for the same securities.
Foreign Currency. The Fund uses foreign currency contracts to facilitate transactions in foreign-denominated securities. Losses from these transactions may arise from changes in the value of the foreign currency or if the counterparties do not perform under the contracts' terms.
Foreign-denominated assets, including investment securities, and liabilities are translated into U.S. dollars at the exchange rate at period end. Purchases and sales of investment securities, income and dividends received and expenses denominated in foreign currencies are translated into U.S. dollars at the exchange rate in effect on the transaction date.
The effects of exchange rate fluctuations on investments are included with the net realized and unrealized gain (loss) on investment securities. Other foreign currency transactions resulting in realized and unrealized gain (loss) are disclosed separately.
Investment Transactions and Income. Security transactions, including the Fund's investment activity in the Fidelity Central Funds, are accounted for as of trade date. Gains and losses on securities sold are determined on the basis of identified cost. Dividend income is recorded on the ex-dividend date, except for certain dividends from foreign securities where the ex-dividend date may have passed, which are recorded as soon as the Fund is informed of the ex-dividend date. Non-cash dividends included in dividend income, if any, are recorded at the fair market value of the securities received. Large, non-recurring dividends recognized by the Fund are presented separately on the Statement of Operations as "Special Dividends" and the impact of these dividends is
Annual Report
1. Significant Accounting Policies - continued
Investment Transactions and Income - continued
presented in the Financial Highlights. Interest income distributions from the Fidelity Central Funds are accrued as earned. Interest income includes coupon interest and amortization of premium and accretion of discount on debt securities. Investment income is recorded net of foreign taxes withheld where recovery of such taxes is uncertain.
Expenses. Most expenses of the trust can be directly attributed to a fund. Expenses which cannot be directly attributed are apportioned among each Fund in the trust. Expense estimates are accrued in the period to which they relate and adjustments are made when actual amounts are known.
Income Tax Information and Distributions to Shareholders. Each year, the Fund intends to qualify as a regulated investment company by distributing all of its taxable income and realized gains under Subchapter M of the Internal Revenue Code. As a result, no provision for income taxes is required in the accompanying financial statements. Foreign taxes are provided for based on the Fund's understanding of the tax rules and rates that exist in the foreign markets in which it invests.
Distributions are recorded on the ex-dividend date. Income dividends and capital gain distributions are declared separately for each class. Income and capital gain distributions are determined in accordance with income tax regulations, which may differ from generally accepted accounting principles. In addition, the Fund will claim a portion of the payment made to redeeming shareholders as a distribution for income tax purposes.
Capital accounts within the financial statements are adjusted for permanent book-tax differences. These adjustments have no impact on net assets or the results of operations. Temporary book-tax differences will reverse in a subsequent period.
Book-tax differences are primarily due to short-term capital gains, foreign currency transactions, passive foreign investment companies (PFIC) and losses deferred due to wash sales.
The tax-basis components of distributable earnings and the federal tax cost as of period end were as follows:
Unrealized appreciation | $ 13,449,405 |
Unrealized depreciation | (1,923,189) |
Net unrealized appreciation (depreciation) | 11,526,216 |
Undistributed ordinary income | 1,247,939 |
| |
Cost for federal income tax purposes | $ 230,203,018 |
Annual Report
Notes to Financial Statements - continued
1. Significant Accounting Policies - continued
Short-Term Trading (Redemption) Fees. Shares purchased on or after May 18, 2006 and held in the Fund less than 30 days are subject to a redemption fee equal to 1.00% of the proceeds of the redeemed shares. All redemption fees, including any estimated redemption fees paid by FMR, are retained by the Fund and accounted for as an addition to paid in capital.
New Accounting Pronouncements. In July 2006, Financial Accounting Standards Board Interpretation No. 48, Accounting for Uncertainty in Income Taxes - an interpretation of FASB Statement 109 (FIN 48), was issued and is effective for fiscal years beginning after December 15, 2006. FIN 48 sets forth a threshold for financial statement recognition, measurement and disclosure of a tax position taken or expected to be taken on a tax return. Management is currently evaluating the impact, if any, the adoption of FIN 48 will have on the Fund's net assets, results of operations and financial statement disclosures.
In addition, in September 2006, Statement of Financial Accounting Standards No. 157, Fair Value Measurements (SFAS 157), was issued and is effective for fiscal years beginning after November 15, 2007. SFAS 157 defines fair value, establishes a framework for measuring fair value and expands disclosures about fair value measurements. Management is currently evaluating the impact the adoption of SFAS 157 will have on the Fund's financial statement disclosures.
2. Operating Policies.
Repurchase Agreements. FMR has received an Exemptive Order from the Securities and Exchange Commission (the SEC) which permits the Fund and other affiliated entities of FMR to transfer uninvested cash balances into joint trading accounts which are then invested in repurchase agreements. The Fund may also invest directly with institutions in repurchase agreements. Repurchase agreements are collateralized by government or non-government securities. Upon settlement date, collateral is held in segregated accounts with custodian banks and may be obtained in the event of a default of the counterparty. The Fund monitors, on a daily basis, the value of the collateral to ensure it is at least equal to the principal amount of the repurchase agreement (including accrued interest). In the event of a default by the counterparty, realization of the collateral proceeds could be delayed, during which time the value of the collateral may decline.
3. Purchases and Sales of Investments.
Purchases and sales of securities other than short-term securities, aggregated $230,223,505 and $15,893,342, respectively.
Annual Report
4. Fees and Other Transactions with Affiliates.
Management Fee. FMR and its affiliates provide the Fund with investment management related services for which the Fund pays a monthly management fee. The management fee is the sum of an individual fund fee rate that is based on an annual rate of .45% of the Fund's average net assets and a group fee rate that averaged ..27% during the period. The group fee rate is based upon the average net assets of all the mutual funds advised by FMR. The group fee rate decreases as assets under management increase and increases as assets under management decrease. In addition, the management fee is subject to a performance adjustment (up to a maximum of ± .20% of the Fund's average net assets over a 36 month performance period). The upward or downward adjustment to the management fee is based on the relative investment performance of the retail class of the Fund, International Value, as compared to an appropriate benchmark index. The Fund's performance adjustment will not take effect until May 1, 2007. Subsequent months will be added until the performance period includes 36 months. For the period, the total annualized management fee rate was .71% of the Fund's average net assets.
Distribution and Service Plan. In accordance with Rule 12b-1 of the 1940 Act, the Fund has adopted separate Distribution and Service Plans for each class of shares. Certain classes pay Fidelity Distributors Corporation (FDC), an affiliate of FMR, separate Distribution and Service Fees, each of which is based on an annual percentage of each class' average net assets. In addition, FDC may pay financial intermediaries for selling shares of the Fund and providing shareholder support services. For the period, the Distribution and Service Fee rates and the total amounts paid to and retained by FDC were as follows:
| Distribution
Fee | Service
Fee | Paid to
FDC | Retained
by FDC |
Class A | 0% | .25% | $ 1,322 | $ 1,115 |
Class T | .25% | .25% | 2,940 | 2,223 |
Class B | .75% | .25% | 4,917 | 4,804 |
Class C | .75% | .25% | 6,622 | 5,701 |
| | | $ 15,801 | $ 13,843 |
Sales Load. FDC receives a front-end sales charge of up to 5.75% for selling Class A shares, and 3.50% for selling Class T shares, some of which is paid to financial intermediaries for selling shares of the Fund. FDC receives the proceeds of contingent deferred sales charges levied on Class A, Class T, Class B, and Class C redemptions. These charges depend on the holding period. The deferred sales charges range from 5% to 1% for Class B, 1% for Class C, 1.00% to .50% for certain purchases of Class A shares and .25% for certain purchases of Class T shares.
Annual Report
Notes to Financial Statements - continued
4. Fees and Other Transactions with Affiliates - continued
Sales Load - continued
For the period, sales charge amounts retained by FDC were as follows:
| Retained
by FDC |
Class A | $ 1,104 |
Class T | 494 |
| $ 1,598 |
Transfer Agent Fees. Fidelity Investments Institutional Operations Company, Inc. (FIIOC), an affiliate of FMR, is the transfer, dividend disbursing and shareholder servicing agent for each class of the Fund. FIIOC receives account fees and asset-based fees that vary according to the account size and type of account of the shareholders of the respective classes of the Fund. FIIOC pays for typesetting, printing and mailing of shareholder reports, except proxy statements. For the period, the total transfer agent fees paid by each class to FIIOC, were as follows:
| Amount | % of
Average
Net Assets |
Class A | $ 1,113 | .21* |
Class T | 1,345 | .23* |
Class B | 965 | .20* |
Class C | 1,379 | .21* |
International Value | 119,359 | .24* |
Institutional Class | 1,538 | .15* |
| $ 125,699 | |
* Annualized
Accounting and Security Lending Fees. Fidelity Service Company, Inc. (FSC), an affiliate of FMR, maintains the Fund's accounting records. The accounting fee is based on the level of average net assets for the month. Under a separate contract, FSC administers the security lending program. The security lending fee is based on the number and duration of lending transactions.
Investments in Fidelity Central Funds. The Fund may invest in Fidelity Central Funds. The Fund's Schedule of Investments lists each of the Fidelity Central Funds as an investment of the Fund but does not include the underlying holdings of each Fidelity Central Fund. As an Investing Fund, the Fund indirectly bears its proportionate share of the expenses of the underlying Fidelity Central Funds. A complete unaudited list of holdings for each Fidelity Central Fund is available upon request. In addition, the financial statements of the Fidelity Central Funds,
Annual Report
4. Fees and Other Transactions with Affiliates - continued
Investments in Fidelity Central Funds - continued
which are not covered by the Fund's Report of Independent Registered Public Accounting Firm, are available on the EDGAR Database on the SEC's web site, www.sec.gov, or upon request.
The Money Market Central Funds seek preservation of capital and current income and are managed by Fidelity Investments Money Management, Inc. (FIMM), an affiliate of FMR.
Brokerage Commissions. The Fund placed a portion of its portfolio transactions with brokerage firms which are affiliates of the investment adviser. The commissions paid to these affiliated firms were $695 for the period.
5. Security Lending.
The Fund lends portfolio securities from time to time in order to earn additional income. On the settlement date of the loan, the Fund receives collateral (in the form of U.S. Treasury obligations, letters of credit and/or cash) against the loaned securities and maintains collateral in an amount not less than 100% of the market value of the loaned securities during the period of the loan. The market value of the loaned securities is determined at the close of business of the Fund and any additional required collateral is delivered to the Fund on the next business day. If the borrower defaults on its obligation to return the securities loaned because of insolvency or other reasons, a fund could experience delays and costs in recovering the securities loaned or in gaining access to the collateral. Any cash collateral received is invested in the Fidelity Securities Lending Cash Central Fund. The value of loaned securities and cash collateral at period end are disclosed on the Fund's Statement of Assets and Liabilities. Security lending income represents the income earned on investing cash collateral, less fees and expenses associated with the loan, plus any premium payments that may be received on the loan of certain types of securities. Security lending income is presented in the Statement of Operations as a component of interest income from Fidelity Central Funds. Net income from lending portfolio securities during the period amounted to $9,903.
6. Expense Reductions.
FMR voluntarily agreed to reimburse each class to the extent annual operating expenses exceeded certain levels of average net assets as noted in the table below. Some expenses, for example interest expense, including commitment fees, are excluded from this reimbursement.
Annual Report
Notes to Financial Statements - continued
6. Expense Reductions - continued
The following classes were in reimbursement during the period:
| Expense
Limitations | Reimbursement
from adviser |
Class A | 1.50% | $ 1,306 |
Class T | 1.75% | 1,514 |
Class B | 2.25% | 1,208 |
Class C | 2.25% | 1,432 |
International Value | 1.25% | 124,928 |
Institutional Class | 1.25% | 1,364 |
| | $ 131,752 |
Many of the brokers with whom FMR places trades on behalf of the Fund provided services to the Fund in addition to trade execution. These services included payments of certain expenses on behalf of the Fund totaling $18,428 for the period. In addition, through arrangements with the Fund's custodian credits realized as a result of uninvested cash balances were used to reduce the Fund's expenses. During the period, these credits reduced the Fund's custody expenses by $825.
7. Other.
The Fund's organizational documents provide former and current trustees and officers with a limited indemnification against liabilities arising in connection with the performance of their duties to the Fund. In the normal course of business, the Fund may also enter into contracts that provide general indemnifications. The Fund's maximum exposure under these arrangements is unknown as this would be dependent on future claims that may be made against the Fund. The risk of material loss from such claims is considered remote.
During the period, the Fund's transfer agent, Fidelity Investments Institutional Operations Company, Inc. (FIIOC), an affiliate of Fidelity Management & Research Company, notified the Fund that the fund's books and records did not reflect a conversion of certain Class B to Class A shares upon their conversion date. Management has determined that this did not have a material impact to the Fund's reported net assets or results of operations in the accompanying financial statements. FIIOC will cause the books and records of the Fund to reflect a conversion of the relevant Class B shares to Class A and is in the process of determining the impact to affected shareholder accounts for purposes of its remediation.
Annual Report
8. Share Transactions.
Transactions for each class of shares were as follows:
| Shares | Dollars |
| Period ended
October 31,
2006 A | Period ended
October 31,
2006 A |
Class A | | |
Shares sold | 146,231 | $ 1,461,870 |
Shares redeemed | (1,174) | (12,358) |
Net increase (decrease) | 145,057 | $ 1,449,512 |
Class T | | |
Shares sold | 169,119 | $ 1,688,142 |
Shares redeemed | (155) | (1,528) |
Net increase (decrease) | 168,964 | $ 1,686,614 |
Class B | | |
Shares sold | 123,455 | $ 1,231,876 |
Shares redeemed | (12) | (126) |
Net increase (decrease) | 123,443 | $ 1,231,750 |
Class C | | |
Shares sold | 207,502 | $ 2,072,374 |
Shares redeemed | (791) | (7,647) |
Net increase (decrease) | 206,711 | $ 2,064,727 |
International Value | | |
Shares sold | 22,776,737 | $ 228,163,833 |
Shares redeemed | (1,934,132) | (19,338,324) |
Net increase (decrease) | 20,842,605 | $ 208,825,509 |
Institutional Class | | |
Shares sold | 288,807 | $ 2,865,051 |
A For the period May 18, 2006 (commencement of operations) to October 31, 2006.
Annual Report
Report of Independent Registered Public Accounting Firm
To the Trustees of Fidelity Investment Trust and Shareholders of Fidelity International Value Fund:
We have audited the accompanying statement of assets and liabilities of Fidelity International Value Fund (the Fund), a fund of Fidelity Investment Trust, including the schedule of investments as of October 31, 2006, and the related statement of operations, the statement of changes in net assets and the financial highlights for the period May 18, 2006 (commencement of operations) to October 31, 2006. These financial statements and financial highlights are the responsibility of the Fund's management. Our responsibility is to express an opinion on these financial statements and financial highlights based on our audit.
We conducted our audit in accordance with standards of the Public Company Accounting Oversight Board (United States). Those standards require that we plan and perform the audit to obtain reasonable assurance about whether the financial statements and financial highlights are free of material misstatement. The Fund is not required to have, nor were we engaged to perform, an audit of its internal control over financial reporting. Our audits included consideration of internal control over financial reporting as a basis for designing audit procedures that are appropriate in the circumstances, but not for the purpose of expressing an opinion on the effectiveness of the Fund's internal control over financial reporting. Accordingly, we express no such opinion. An audit also includes examining, on a test basis, evidence supporting the amounts and disclosures in the financial statements, assessing the accounting principles used and significant estimates made by management, as well as evaluating the overall financial statement presentation. Our procedures included confirmation of securities owned as of October 31, 2006, by correspondence with the custodians and brokers; where replies were not received from brokers, we performed other auditing procedures. We believe that our audit provide a reasonable basis for our opinion.
In our opinion, the financial statements and financial highlights referred to above present fairly, in all material respects, the financial position of Fidelity International Value Fund as of October 31, 2006, the results of its operations, the changes in its net assets and its financial highlights for the period May 18, 2006 (commencement of operations) to October 31, 2006, in conformity with accounting principles generally accepted in the United States of America.
/s/ Deloitte & Touche LLP
DELOITTE & TOUCHE LLP
Boston, Massachusetts
December 15, 2006
Annual Report
Trustees and Officers
The Trustees, Members of the Advisory Board, and executive officers of the trust and fund, as applicable, are listed below. The Board of Trustees governs the fund and is responsible for protecting the interests of shareholders. The Trustees are experienced executives who meet periodically throughout the year to oversee the fund's activities, review contractual arrangements with companies that provide services to the fund, and review the fund's performance. Except for William O. McCoy, each of the Trustees oversees 348 funds advised by FMR or an affiliate. Mr. McCoy oversees 350 funds advised by FMR or an affiliate.
The Trustees hold office without limit in time except that (a) any Trustee may resign; (b) any Trustee may be removed by written instrument, signed by at least two-thirds of the number of Trustees prior to such removal; (c) any Trustee who requests to be retired or who has become incapacitated by illness or injury may be retired by written instrument signed by a majority of the other Trustees; and (d) any Trustee may be removed at any special meeting of shareholders by a two-thirds vote of the outstanding voting securities of the trust. Each Trustee who is not an interested person (as defined in the 1940 Act) (Independent Trustee), shall retire not later than the last day of the calendar year in which his or her 72nd birthday occurs. The Independent Trustees may waive this mandatory retirement age policy with respect to individual Trustees. The executive officers and Advisory Board Members hold office without limit in time, except that any officer and Advisory Board Member may resign or may be removed by a vote of a majority of the Trustees at any regular meeting or any special meeting of the Trustees. Except as indicated, each individual has held the office shown or other offices in the same company for the past five years.
The fund's Statement of Additional Information (SAI) includes more information about the Trustees. To request a free copy, call Fidelity at 1-877-208-0098.
Interested Trustees*:
Correspondence intended for each Trustee who is an interested person may be sent to Fidelity Investments, 82 Devonshire Street, Boston, Massachusetts 02109.
Name, Age; Principal Occupation |
Edward C. Johnson 3d (76) |
| Year of Election or Appointment: 1984 Mr. Johnson is Chairman of the Board of Trustees. Mr. Johnson serves as President (2006-present), Chief Executive Officer, Chairman, and a Director of FMR Corp.; Chairman and a Director of FMR; Chairman and a Director of Fidelity Research & Analysis Company (FRAC); Chairman and a Director of Fidelity Investments Money Management, Inc.; and Chairman (2001-present) and a Director of FMR Co., Inc. In addition, Mr. Johnson serves as Chairman and Director of Fidelity International Limited (FIL). |
Stephen P. Jonas (53) |
| Year of Election or Appointment: 2005 Mr. Jonas is Senior Vice President of the fund (2006-present). He also serves as Senior Vice President of other Fidelity funds (2005-present). Mr. Jonas is Executive Director of FMR (2005-present) and FMR Co., Inc. (2005-present). He also serves as a Director of Fidelity Investments Money Management, Inc. (2005-present) and FMR Corp. (2003- present). Previously, Mr. Jonas served as President of Fidelity Enterprise Operations and Risk Services (2004-2005), Chief Administrative Officer (2002-2004), and Chief Financial Officer of FMR Corp. (1998-2002). In addition, he serves on the Boards of Boston Ballet (2003-present) and Simmons College (2003-present). |
Robert L. Reynolds (54) |
| Year of Election or Appointment: 2003 Mr. Reynolds is President and a Director of FMR (2005-present), Fidelity Investments Money Management, Inc. (2005-present), and FMR Co., Inc. (2005-present). Mr. Reynolds also serves as Vice Chairman (2006-present), a Director (2003-present), and Chief Operating Officer of FMR Corp. and a Director of Strategic Advisers, Inc. (2005-present). He also serves on the Board at Fidelity Investments Canada, Ltd. |
* Trustees have been determined to be "Interested Trustees" by virtue of, among other things, their affiliation with the trust or various entities under common control with FMR.
Annual Report
Independent Trustees:
Correspondence intended for each Independent Trustee (that is, the Trustees other than the Interested Trustees) may be sent to Fidelity Investments, P.O. Box 55235, Boston, Massachusetts 02205-5235.
Name, Age; Principal Occupation |
Dennis J. Dirks (58) |
| Year of Election or Appointment: 2005 Prior to his retirement in May 2003, Mr. Dirks was Chief Operating Officer and a member of the Board of The Depository Trust & Clearing Corporation (DTCC) (1999-2003). He also served as President, Chief Operating Officer, and Board member of The Depository Trust Company (DTC) (1999-2003) and President and Board member of the National Securities Clearing Corporation (NSCC) (1999-2003). In addition, Mr. Dirks served as Chief Executive Officer and Board member of the Government Securities Clearing Corporation (2001-2003) and Chief Executive Officer and Board member of the Mortgage-Backed Securities Clearing Corporation (2001-2003). Mr. Dirks also serves as a Trustee and a member of the Finance Committee of Manhattan College (2005-present) and a Trustee and a member of the Finance Committee of AHRC of Nassau County (2006-present). |
Albert R. Gamper, Jr. (64) |
| Year of Election or Appointment: 2006 Prior to his retirement in December 2004, Mr. Gamper served as Chairman of the Board of CIT Group Inc. (commercial finance). During his tenure with CIT Group Inc. Mr. Gamper served in numerous senior management positions, including Chairman (1987-1989; 1999-2001; 2002-2004), Chief Executive Officer (1987-2004), and President (1989-2002). He currently serves as a member of the Board of Directors of Public Service Enterprise Group (utilities, 2001-present), Chairman of the Board of Governors, Rutgers University (2004-present), and Chairman of the Board of Saint Barnabas Health Care System. |
George H. Heilmeier (70) |
| Year of Election or Appointment: 2004 Dr. Heilmeier is Chairman Emeritus of Telcordia Technologies (communication software and systems), where prior to his retirement, he served as company Chairman and Chief Executive Officer. He currently serves on the Boards of Directors of The Mitre Corporation (systems engineering and information technology support for the government), and HRL Laboratories (private research and development, 2004-present). He is Chairman of the General Motors Science & Technology Advisory Board and a Life Fellow of the Institute of Electrical and Electronics Engineers (IEEE). Dr. Heilmeier is a member of the Defense Science Board and the National Security Agency Advisory Board. He is also a member of the National Academy of Engineering, the American Academy of Arts and Sciences, and the Board of Overseers of the School of Engineering and Applied Science of the University of Pennsylvania. Previously, Dr. Heilmeier served as a Director of TRW Inc. (automotive, space, defense, and information technology, 1992-2002), Compaq (1994-2002), Automatic Data Processing, Inc. (ADP) (technology-based business outsourcing, 1995-2002), INET Technologies Inc. (telecommunications network surveillance, 2001-2004), and Teletech Holdings (customer management services). He is the recipient of the 2005 Kyoto Prize in Advanced Technology for his invention of the liquid crystal display, and a member of the Consumer Electronics Hall of Fame. |
Marie L. Knowles (60) |
| Year of Election or Appointment: 2001 Prior to Ms. Knowles' retirement in June 2000, she served as Executive Vice President and Chief Financial Officer of Atlantic Richfield Company (ARCO) (diversified energy, 1996-2000). From 1993 to 1996, she was a Senior Vice President of ARCO and President of ARCO Transportation Company. She served as a Director of ARCO from 1996 to 1998. She currently serves as a Director of Phelps Dodge Corporation (copper mining and manufacturing) and McKesson Corporation (healthcare service, 2002-present). Ms. Knowles is a Trustee of the Brookings Institution and the Catalina Island Conservancy and also serves as a member of the Advisory Board for the School of Engineering of the University of Southern California. |
Ned C. Lautenbach (62) |
| Year of Election or Appointment: 2000 Mr. Lautenbach is Chairman of the Independent Trustees (2006-present). Mr. Lautenbach has been a partner of Clayton, Dubilier & Rice, Inc. (private equity investment firm) since September 1998. Previously, Mr. Lautenbach was with the International Business Machines Corporation (IBM) from 1968 until his retirement in 1998. Mr. Lautenbach serves as a Director of Sony Corporation (2006- present) and Eaton Corporation (diversified industrial) as well as the Philharmonic Center for the Arts in Naples, Florida. He also is a member of the Board of Trustees of Fairfield University (2005-present), as well as a member of the Council on Foreign Relations. |
William O. McCoy (73) |
| Year of Election or Appointment: 1997 Prior to his retirement in December 1994, Mr. McCoy was Vice Chairman of the Board of BellSouth Corporation (telecommunications) and President of BellSouth Enterprises. He is currently a Director of Duke Realty Corporation (real estate). He is also a partner of Franklin Street Partners (private investment management firm). In addition, Mr. McCoy served as the Interim Chancellor (1999-2000) and a member of the Board of Visitors for the University of North Carolina at Chapel Hill and currently serves as Chairman of the Board of Directors of the University of North Carolina Health Care System. He also served as Vice President of Finance for the University of North Carolina (16-school system). |
Cornelia M. Small (62) |
| Year of Election or Appointment: 2005 Ms. Small is a member (2000-present) and Chairperson (2002-present) of the Investment Committee, and a member (2002-present) of the Board of Trustees of Smith College. Previously, she served as Chief Investment Officer (1999-2000), Director of Global Equity Investments (1996-1999), and a member of the Board of Directors of Scudder, Stevens & Clark (1990-1997) and Scudder Kemper Investments (1997-1999). In addition, Ms. Small served as Co-Chair (2000-2003) of the Annual Fund for the Fletcher School of Law and Diplomacy. |
William S. Stavropoulos (67) |
| Year of Election or Appointment: 2001 Mr. Stavropoulos is Chairman Emeritus of the Board of Directors of The Dow Chemical Company. Since joining The Dow Chemical Company in 1967, Mr. Stavropoulos served in numerous senior management positions, including President (1993-2000; 2002-2003), CEO (1995-2000; 2002-2004), and Chairman of the Executive Committee (2000-2004). Currently, he is a Director of NCR Corporation (data warehousing and technology solutions), BellSouth Corporation (telecommunications), Chemical Financial Corporation, Maersk Inc. (industrial conglomerate, 2002-present), and Metalmark Capital (private equity investment firm, 2005-present). He also serves as a member of the Board of Trustees of the American Enterprise Institute for Public Policy Research. In addition, Mr. Stavropoulos is a member of The Business Council, J.P. Morgan International Council and the University of Notre Dame Advisory Council for the College of Science. |
Kenneth L. Wolfe (67) |
| Year of Election or Appointment: 2005 Prior to his retirement in 2001, Mr. Wolfe was Chairman and Chief Executive Officer of Hershey Foods Corporation (1993-2001). He currently serves as a member of the boards of Adelphia Communications Corporation (2003-present), Bausch & Lomb, Inc., and Revlon Inc. (2004-present). |
Annual Report
Advisory Board Members and Executive Officers:
Correspondence intended for Mr. Keyes may be sent to Fidelity Investments, P.O. Box 55235, Boston, Massachusetts 02205-5235. Correspondence intended for each executive officer and Mr. Lynch may be sent to Fidelity Investments, 82 Devonshire Street, Boston, Massachusetts 02109.
Name, Age; Principal Occupation |
James H. Keyes (66) |
| Year of Election or Appointment: 2006 Member of the Advisory Board of Fidelity Investment Trust. Prior to his retirement in 2003, Mr. Keyes was Chairman, President, and Chief Executive Officer of Johnson Controls, Inc. (automotive supplier, 1993-2003). He currently serves as a member of the boards of LSI Logic Corporation (semiconductor technologies), Navistar International Corporation (manufacture and sale of trucks, buses, and diesel engines, 2002-present), and Pitney Bowes, Inc. (integrated mail, messaging, and document management solutions). |
Peter S. Lynch (62) |
| Year of Election or Appointment: 2003 Member of the Advisory Board of Fidelity Investment Trust. Mr. Lynch is Vice Chairman and a Director of FMR, and Vice Chairman (2001- present) and a Director of FMR Co., Inc. Previously, Mr. Lynch served as a Trustee of the Fidelity funds (1990-2003). In addition, he serves as a Trustee of Boston College and as the Chairman of the Inner-City Scholarship Fund. |
Dwight D. Churchill (52) |
| Year of Election or Appointment: 2006 Vice President of the fund. Mr. Churchill also serves as Vice President of certain Equity Funds (2005-present). Mr. Churchill is Executive Vice President of FMR (2005-present) and FMR Co., Inc. (2005-present). Previously, Mr. Churchill served as Senior Vice President of Fidelity Investments Money Management, Inc. (2005-2006), Head of Fidelity's Fixed-Income Division (2000-2005), Vice President of Fidelity's Money Market Funds (2000-2005), Vice President of Fidelity's Bond Funds, and Senior Vice President of FMR. |
Eric M. Wetlaufer (44) |
| Year of Election or Appointment: 2006 Vice President of the fund. Mr. Wetlaufer also serves as Vice President of certain International Equity Funds (2006-present). Mr. Wetlaufer is Senior Vice President of FMR (2006-present) and FMR Co., Inc. (2006-present), and President and Director of Fidelity Management & Research (U.K.) Inc. (2006-present) and Fidelity Research & Analysis Company (2006-present). Before joining Fidelity Investments in 2005, Mr. Wetlaufer was a partner in Oxhead Capital Management (2004-2005). Previously, Mr. Wetlaufer served as a Chief Investment Officer of Putnam Investments (1997-2003). |
George Stairs (56) |
| Year of Election or Appointment: 2006 Vice President of the fund. Prior to his current responsibilities, Mr. Stairs worked as a portfolio manager. Prior to joining Fidelity Investments, Mr. Stairs was a senior equity portfolio manager for Putnam. Mr. Stairs also serves as Vice President of FMR and FMR Co., Inc. (2006). |
Eric D. Roiter (57) |
| Year of Election or Appointment: 2006 Secretary of the fund. He also serves as Secretary of other Fidelity funds; Vice President, General Counsel, and Secretary of FMR Co., Inc. (2001-present) and FMR; Assistant Secretary of Fidelity Management & Research (U.K.) Inc. (2001-present), Fidelity Research & Analysis Company (2001-present), and Fidelity Investments Money Management, Inc. (2001-present). Mr. Roiter is an Adjunct Member, Faculty of Law, at Boston College Law School (2003-present). Previously, Mr. Roiter served as Vice President and Secretary of Fidelity Distributors Corporation (FDC) (1998-2005). |
Stuart Fross (47) |
| Year of Election or Appointment: 2006 Assistant Secretary of the fund. Mr. Fross also serves as Assistant Secretary of other Fidelity funds (2003-present), Vice President and Secretary of FDC (2005-present), and is an employee of FMR. |
Christine Reynolds (48) |
| Year of Election or Appointment: 2006 President and Treasurer of the fund. Ms. Reynolds also serves as President and Treasurer of other Fidelity funds (2004-present) and is a Vice President (2003-present) and an employee (2002-present) of FMR. Before joining Fidelity Investments, Ms. Reynolds worked at PricewaterhouseCoopers LLP (PwC) (1980-2002), where she was most recently an audit partner with PwC's investment management practice. |
R. Stephen Ganis (40) |
| Year of Election or Appointment: 2006 Anti-Money Laundering (AML) officer of the fund. Mr. Ganis also serves as AML officer of other Fidelity funds (2006-present) and FMR Corp. (2003-present). Before joining Fidelity Investments, Mr. Ganis practiced law at Goodwin Procter, LLP (2000-2002). |
Joseph B. Hollis (58) |
| Year of Election or Appointment: 2006 Chief Financial Officer of the fund. Mr. Hollis also serves as Chief Financial Officer of other Fidelity funds. Mr. Hollis is President of Fidelity Pricing and Cash Management Services (FPCMS) (2005-present). Mr. Hollis also serves as President and Director of Fidelity Service Company, Inc. (2006-present). Previously, Mr. Hollis served as Senior Vice President of Cash Management Services (1999-2002) and Investment Management Operations (2002-2005). |
Kenneth A. Rathgeber (59) |
| Year of Election or Appointment: 2006 Chief Compliance Officer of the fund. Mr. Rathgeber also serves as Chief Compliance Officer of other Fidelity funds (2004-present) and Executive Vice President of Risk Oversight for Fidelity Investments (2002-present). He is Chief Compliance Officer of FMR (2005-present), FMR Co., Inc. (2005-present), Fidelity Management & Research (U.K.) Inc. (2005-present), Fidelity Research & Analysis Company (2005- present), Fidelity Investments Money Management, Inc. (2005-present), and Strategic Advisers, Inc. (2005-present). Previously, Mr. Rathgeber served as Executive Vice President and Chief Operating Officer for Fidelity Investments Institutional Services Company, Inc. (1998-2002). |
Bryan A. Mehrmann (45) |
| Year of Election or Appointment: 2006 Deputy Treasurer of the fund. Mr. Mehrmann also serves as Deputy Treasurer of other Fidelity funds (2005-present) and is an employee of FMR. Previously, Mr. Mehrmann served as Vice President of Fidelity Investments Institutional Services Group (FIIS)/Fidelity Investments Institutional Operations Corporation, Inc. (FIIOC) Client Services (1998-2004). |
Kimberley H. Monasterio (42) |
| Year of Election or Appointment: 2006 Deputy Treasurer of the fund. Ms. Monasterio also serves as Deputy Treasurer of other Fidelity funds (2004) and is an employee of FMR (2004). Before joining Fidelity Investments, Ms. Monasterio served as Treasurer (2000-2004) and Chief Financial Officer (2002-2004) of the Franklin Templeton Funds and Senior Vice President of Franklin Templeton Services, LLC (2000-2004). |
Kenneth B. Robins (37) |
| Year of Election or Appointment: 2006 Deputy Treasurer of the fund. Mr. Robins also serves as Deputy Treasurer of other Fidelity funds (2005-present) and is an employee of FMR (2004-present). Before joining Fidelity Investments, Mr. Robins worked at KPMG LLP, where he was a partner in KPMG's department of professional practice (2002-2004) and a Senior Manager (1999-2000). In addition, Mr. Robins served as Assistant Chief Accountant, United States Securities and Exchange Commission (2000-2002). |
Robert G. Byrnes (39) |
| Year of Election or Appointment: 2006 Assistant Treasurer of the fund. Mr. Byrnes also serves as Assistant Treasurer of other Fidelity funds (2005-present) and is an employee of FMR (2005-present). Previously, Mr. Byrnes served as Vice President of FPCMS (2003-2005). Before joining Fidelity Investments, Mr. Byrnes worked at Deutsche Asset Management where he served as Vice President of the Investment Operations Group (2000-2003). |
John H. Costello (60) |
| Year of Election or Appointment: 2006 Assistant Treasurer of the fund. Mr. Costello also serves as Assistant Treasurer of other Fidelity funds and is an employee of FMR. |
Peter L. Lydecker (52) |
| Year of Election or Appointment: 2006 Assistant Treasurer of the fund. Mr. Lydecker also serves as Assistant Treasurer of other Fidelity funds (2004) and is an employee of FMR. |
Mark Osterheld (51) |
| Year of Election or Appointment: 2006 Assistant Treasurer of the fund. Mr. Osterheld also serves as Assistant Treasurer of other Fidelity funds (2002) and is an employee of FMR. |
Gary W. Ryan (48) |
| Year of Election or Appointment: 2006 Assistant Treasurer of the fund. Mr. Ryan also serves as Assistant Treasurer of other Fidelity funds (2005-present) and is an employee of FMR (2005-present). Previously, Mr. Ryan served as Vice President of Fund Reporting in FPCMS (1999-2005). |
Salvatore Schiavone (40) |
| Year of Election or Appointment: 2006 Assistant Treasurer of the fund. Mr. Schiavone also serves as Assistant Treasurer of other Fidelity funds (2005-present) and is an employee of FMR (2005-present). Before joining Fidelity Investments, Mr. Schiavone worked at Deutsche Asset Management, where he most recently served as Assistant Treasurer (2003-2005) of the Scudder Funds and Vice President and Head of Fund Reporting (1996-2003). |
Annual Report
Distributions
The Board of Trustees of Advisor International Value Fund voted to pay to shareholders of record at the opening of business on record date, the following distributions per share derived from capital gains realized from sales of portfolio securities, and dividends derived from net investment income:
| Pay Date | Record Date | Dividends | Capital Gains |
Institutional Class | 12/11/06 | 12/08/06 | $.042 | $.022 |
The fund will notify shareholders in January 2007 of amounts for use in preparing 2006 income tax returns.
Annual Report
Board Approval of Investment Advisory Contracts and Management Fees
Fidelity International Value Fund
On April 20, 2006, the Board of Trustees, including the independent Trustees (together, the Board), voted to approve the management contract and subadvisory agreements (together, the Advisory Contracts) for the fund. The Board, assisted by the advice of fund counsel and independent Trustees' counsel, considered a broad range of information.
In determining whether to approve the Advisory Contracts for the fund, the Board was aware that shareholders have a broad range of investment choices available to them, including a wide choice among mutual funds offered by competitors to Fidelity, and that shareholders, with the opportunity to review and weigh the disclosure provided by the fund in its prospectus and other public disclosures, may choose to invest in this fund, managed by Fidelity.
Nature, Extent, and Quality of Services Provided. The Board considered staffing within the investment adviser, FMR, and the sub-advisers (together, the Investment Advisers), including the background of the fund's portfolio manager and the fund's investment objective and discipline.
Resources Dedicated to Investment Management and Support Services. The Board considered Fidelity's extensive global research capabilities that enable the Investment Advisers to aggregate data from various sources in an effort to produce positive investment results. The Board noted that Fidelity's analysts have access to a variety of technological tools that enable them to perform both fundamental and quantitative analysis and to specialize in various disciplines. The Board also considered that Fidelity's portfolio managers and analysts have access to daily portfolio attribution that allows for monitoring of a fund's portfolio, as well as an electronic communication system that provides immediate real-time access to research concerning issuers and credit enhancers.
Shareholder and Administrative Services. The Board considered the nature, extent, quality, and cost of administrative, distribution, and shareholder services performed by the Investment Advisers and their affiliates under the Advisory Contracts and under separate agreements covering transfer agency, pricing and bookkeeping, and securities lending services for the fund. The Board also considered the nature and extent of the Investment Advisers' supervision of third party service providers, principally custodians and subcustodians.
The Board noted that the growth of fund assets across the complex allows Fidelity to reinvest in the development of services designed to enhance the value or convenience of the Fidelity funds as investment vehicles. These services include 24-hour access to account information and market information through phone representatives and over the Internet, and investor education materials and asset allocation tools.
Investment in a Large Fund Family. The Board considered the benefits to shareholders of investing in a Fidelity fund, including the benefits of investing in a fund that is part of a large family of funds offering a variety of investment disciplines and providing for a large variety of mutual fund investor services. For example, fund shareholders are offered the privilege of exchanging shares of the fund for shares of other Fidelity funds, as set forth in the fund's prospectus, without paying an additional sales charge.
Annual Report
Board Approval of Investment Advisory Contracts and
Management Fees - continued
Investment Performance. Fidelity International Value Fund is a new fund and therefore had no historical performance for the Board to review at the time it approved the fund's Advisory Contracts. Once the fund has been in operation for at least one calendar year, the Board will review the fund's absolute investment performance for each class, as well as the fund's relative investment performance for each class measured against (i) a broad-based securities market index and (ii) a peer group of mutual funds deemed appropriate by the Board.
The Board considered that the fund's management fee is subject to upward or downward adjustment depending upon whether, and to what extent, the fund's investment performance for the performance period exceeds, or is exceeded by, the record (over the same period) of a Board-approved performance adjustment index. The Board realizes that the performance adjustment provides FMR with a strong economic incentive to seek to achieve superior performance for the fund's shareholders and helps to more closely align the interests of FMR and the fund's shareholders. The Board considered that the fund's performance adjustment fee is calculated based on the results of the retail class and does not take into account the performance of the Advisor classes. The Board considered FMR's belief that the retail class is the appropriate class on which to base the performance fee because: (i) the class does not have a 12b-1 fee; and (ii) distribution-related expenses should be excluded from the calculation because they are not related to evaluating an adviser's investment management skills.
Based on its review, the Board concluded that the nature, extent, and quality of the services provided by Fidelity will benefit the fund's shareholders, particularly in light of the Board's view that the fund's shareholders benefit from investing in a fund that is part of a large family of funds offering a variety of investment disciplines and services.
Competitiveness of Management Fee and Total Fund Expenses. The Board considered the fund's proposed management fee and projected total operating expenses for each class of the fund in reviewing the Advisory Contracts. The Board noted that the fund's proposed management fee rate is lower than the median fee rate of funds with similar Lipper investment objective categories and comparable management fee characteristics. The Board also considered that the projected total operating expenses are comparable to those of similar classes and funds that Fidelity offers to shareholders.
In its review of total expenses, the Board also noted that at previous meetings during the year it considered Fidelity fee structures and other information on clients that FMR and its affiliates service in other competitive markets, such as other mutual funds advised or subadvised by FMR or its affiliates, pension plan clients, and other institutional clients.
Annual Report
Based on its review, the Board concluded that the fund's proposed management fee and the projected total expenses for each class of the fund were fair and reasonable in light of the services that the fund and its shareholders receive and the other factors considered.
Costs of the Services and Profitability. The fund is a new fund and therefore no revenue, cost, or profitability data was available for the Board to review in respect of the fund at the time it approved the Advisory Contracts. In connection with its future renewal of the fund's management contract and sub-advisory agreements, the Board will consider the revenues earned and the expenses incurred by Fidelity in conducting the business of developing, marketing, distributing, managing, administering and servicing the fund and its shareholders.
Economies of Scale. The Board considered the extent to which the fund will benefit from economies of scale through increased services to the fund, through waivers or reimbursements, or through fee or expense reductions, including reductions that occur through operation of the transfer agent agreement. The transfer agent fee varies in part based on the number of accounts in the fund. If the number of accounts decreases or the average account size increases, the overall transfer agent fee rate decreases.
The Board recognized that the fund's management contract incorporates a "group fee" structure, which provides for lower fee rates as total fund assets under FMR's management increase, and for higher fee rates as total fund assets under FMR's management decrease. The Board considered that the group fee is designed to deliver the benefits of economies of scale to fund shareholders when total fund assets increase, even if assets of any particular fund are unchanged or have declined, because some portion of Fidelity's costs are attributable to services provided to all Fidelity funds, and all funds benefit if those costs can be allocated among more assets.
The Board concluded that, given the group fee structure, fund shareholders will achieve a certain level of economies of scale as assets under FMR's management increase at the fund complex level, regardless of whether Fidelity achieves any such economies of scale.
Additional Information Requested by the Board. In order to develop fully the factual basis for consideration of the Advisory Contracts, the Board received additional information regarding similar funds offered by other fund companies.
Based on its evaluation of all of the conclusions noted above, and after considering all material factors, the Board ultimately concluded that the advisory fee structures are fair and reasonable, and that the fund's Advisory Contracts should be approved.
Annual Report
Annual Report
Annual Report
Annual Report
Annual Report
Annual Report
Annual Report
Investment Adviser
Fidelity Management & Research Company
Boston, MA
Investment Sub-Advisers
FMR Co., Inc.
Fidelity Management & Research
(U.K.) Inc.
Fidelity Research & Analysis Company (formerly Fidelity Management & Research (Far East) Inc.)
Fidelity International
Investment Advisors
Fidelity Investments Japan Limited
Fidelity International Investment Advisors (U.K.) Limited
General Distributor
Fidelity Distributors Corporation
Boston, MA
Transfer and Service Agents
Fidelity Investments Institutional Operations Company, Inc.
Boston, MA
Fidelity Service Company, Inc.
Boston, MA
Custodian
The Northern Trust Company
Chicago, IL
(Fidelity Investment logo)(registered trademark)
Corporate Headquarters
82 Devonshire St., Boston, MA 02109
www.fidelity.com
AFIVI-UANN-1206
1.827488.100
Fidelity®
International Small Cap Opportunities
Fund
Annual Report
October 31, 2006
(2_fidelity_logos) (Registered_Trademark)
Contents
Chairman's Message | 4 | Ned Johnson's message to shareholders. |
Performance | 5 | How the fund has done over time. |
Management's Discussion | 6 | The manager's review of fund performance, strategy and outlook. |
Shareholder Expense Example | 7 | An example of shareholder expenses. |
Investment Changes | 9 | A summary of major shifts in the fund's investments over the past six months. |
Investments | 11 | A complete list of the fund's investments with their market values. |
Financial Statements | 17 | Statements of assets and liabilities, operations, and changes in net assets,
as well as financial highlights. |
Notes | 27 | Notes to the financial statements. |
Report of Independent Registered Public Accounting Firm | 37 | |
Trustees and Officers | 38 | |
Distributions | 49 | |
Board Approval of Investment Advisory Contracts and Management Fees | 50 | |
To view a fund's proxy voting guidelines and proxy voting record for the 12-month period ended June 30, visit www.fidelity.com/proxyvotingresults or visit the Securities and Exchange Commission's (SEC) web site at www.sec.gov. You may also call 1-800-544-8544 to request a free copy of the proxy voting guidelines.
Standard & Poor's, S&P and S&P 500 are registered service marks of The McGraw-Hill Companies, Inc. and have been licensed for use by Fidelity Distributors Corporation.
Other third party marks appearing herein are the property of their respective owners.
All other marks appearing herein are registered or unregistered trademarks or service marks of FMR Corp. or an affiliated company.
Annual Report
This report and the financial statements contained herein are submitted for the general information of the shareholders of the fund. This report is not authorized for distribution to prospective investors in the fund unless preceded or accompanied by an effective prospectus.
A fund files its complete schedule of portfolio holdings with the SEC for the first and third quarters of each fiscal year on Form N-Q. Forms N-Q are available on the SEC's web site at http://www.sec.gov. A fund's Forms N-Q may be reviewed and copied at the SEC's Public Reference Room in Washington, DC. Information regarding the operation of the SEC's Public Reference Room may be obtained by calling 1-800-SEC-0330. For a complete list of a fund's portfolio holdings, view the most recent quarterly holdings report, semiannual report, or annual report on Fidelity's web site at http://www.fidelity.com/holdings.
NOT FDIC INSURED · MAY LOSE VALUE · NO BANK GUARANTEE
Neither the fund nor Fidelity Distributors Corporation is a bank.
Annual Report
Chairman's Message
(photo_of_Edward_C_Johnson_3d)
Dear Shareholder:
Stock and bond markets around the world have seen largely positive results year to date, although weakness in the technology sector and growth stocks in general have tempered performance. While financial markets are always unpredictable, there are a number of time-tested principles that can put the historical odds in your favor.
One of the basic tenets is to invest for the long term. Over time, riding out the markets' inevitable ups and downs has proven much more effective than selling into panic or chasing the hottest trend. Even missing only a few of the markets' best days can significantly diminish investor returns. Patience also affords the benefits of compounding - of earning interest on additional income or reinvested dividends and capital gains. There are tax advantages and cost benefits to consider as well. The more you sell, the more taxes you pay, and the more you trade, the higher the costs. While staying the course doesn't eliminate risk, it can considerably lessen the effect of short-term declines.
You can further manage your investing risk through diversification. And today, more than ever, geographic diversification should be taken into account. Studies indicate that asset allocation is the single most important determinant of a portfolio's long-term success. The right mix of stocks, bonds and cash - aligned to your particular risk tolerance and investment objective - is very important. Age-appropriate rebalancing is also an essential aspect of asset allocation. For younger investors, an emphasis on equities - which historically have been the best performing asset class over time - is encouraged. As investors near their specific goal, such as retirement or sending a child to college, consideration may be given to replacing volatile assets (e.g. common stocks) with more-stable fixed investments (bonds or savings plans).
A third investment principle - investing regularly - can help lower the average cost of your purchases. Investing a certain amount of money each month or quarter helps ensure you won't pay for all your shares at market highs. This strategy - known as dollar cost averaging - also reduces unconstructive "emotion" from investing, helping shareholders avoid selling weak performers just prior to an upswing, or chasing a hot performer just before a correction.
We invite you to contact us via the Internet, through our Investor Centers or over the phone. It is our privilege to provide you the information you need to make the investments that are right for you.
Sincerely,
/s/Edward C. Johnson 3d
Edward C. Johnson 3d
Annual Report
Performance: The Bottom Line
Average annual total return reflects the change in the value of an investment, assuming reinvestment of International Small Cap Opportunities dividend income and capital gains (the profits earned upon the sale of securities that have grown in value) and assuming a constant rate of performance each year. The $10,000 table and the fund's returns do not reflect the deduction of taxes that a shareholder would pay on fund distributions or the redemption of fund shares. During periods of reimbursement by Fidelity, a fund's total return will be greater than it would be had the reimbursement not occurred. How a fund did yesterday is no guarantee of how it will do tomorrow.
Average Annual Total Returns
Periods ended October 31, 2006 | Past 1
year | Life of Fund A |
Fidelity® International Small Cap Opportunities Fund | 36.86% | 32.72% |
A From August 2, 2005
$10,000 Over Life of Fund
Let's say hypothetically that $10,000 was invested in International Small Cap Opportunities Fund on August 2, 2005, when the fund started. The chart shows how the value of your investment would have changed, and also shows how the Morgan Stanley Capital InternationalSM Europe, Australasia, Far East (MSCI® EAFE®) Index performed over the same period.
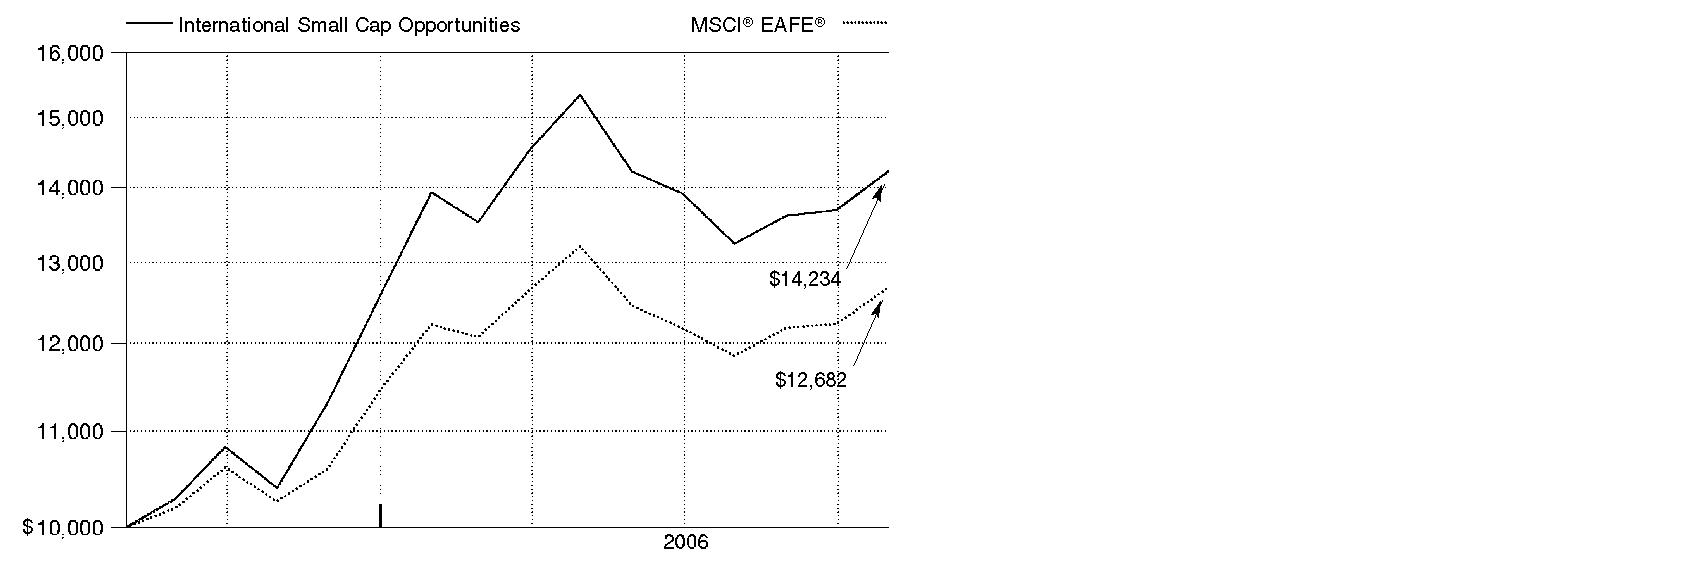
Annual Report
Management's Discussion of Fund Performance
Comments from Andrew Sassine, Portfolio Manager of Fidelity® International Small Cap Opportunities Fund
International equity markets as a whole outpaced their U.S. counterparts for the 12 months ending October 31, 2006 - partly as a result of favorable currency exchanges that boosted returns for U.S. investors. The Morgan Stanley Capital InternationalSM Europe, Australasia, Far East (MSCI® EAFE®) Index - a gauge of developed stock markets outside the United States and Canada - gained 27.72% during that time. European markets benefited from solid corporate profit growth and attractive dividends, which helped the MSCI Europe index advance 31.95%. Strong performing Latin American and Asian emerging markets drove the MSCI Emerging Markets index to a lofty 35.42% return. Japan was somewhat of an exception to the generally stellar foreign market performance after struggling in the middle part of the period. Still, its earlier gains helped the Tokyo Stock Exchange Stock Price Index (TOPIX) - a benchmark of the largest and better-established stocks traded on the Tokyo Stock Exchange - rise 12.47% overall. Natural-resources-rich Canada also struggled over the final six months as energy prices fell, but the S&P/TSX Composite Index managed a 12-month return of 28.21%.
International Small Cap Opportunities gained 36.86% for the period, easily outpacing the MSCI EAFE Small Cap index, which returned 23.55%. Overweightings and good stock selection in materials, productive selection in the industrials sector, and favorable picks within the fund's large stakes in European and Japanese small-cap stocks were the main drivers of performance relative to the index. Among the fund's top contributors were Titanium Metals, a U.S. producer of this stronger and lighter alternative to steel for the aerospace and automotive industries, and Vallourec, a French specialty steel company that makes seamless pipe for offshore oil drilling. Good stock picking in the information technology sector also helped, with GigaMedia, a multimedia company based in Singapore, making a healthy contribution to performance. Inopportune stock selection in financials - mainly in banks and real estate - coupled with an underweighting in real estate, hurt results. Detractors included Japanese finance company OMC Card, which underperformed due to concerns about a regulatory proposal to cap interest rates on outstanding debt, and Japanese software company Intelligent Wave.
The views expressed above reflect those of the portfolio manager(s) only through the end of the period as stated on the cover of this report and do not necessarily represent the views of Fidelity or any other person in the Fidelity organization. Any such views are subject to change at any time based upon market or other conditions and Fidelity disclaims any responsibility to update such views. These views may not be relied on as investment advice and, because investment decisions for a Fidelity fund are based on numerous factors, may not be relied on as an indication of trading intent on behalf of any Fidelity fund.
Annual Report
Shareholder Expense Example
As a shareholder of the Fund, you incur two types of costs: (1) transaction costs, including sales charges (loads) on purchase payments or redemption proceeds, redemption fees, and (2) ongoing costs, including management fees, distribution and/or service (12b-1) fees and other Fund expenses. This Example is intended to help you understand your ongoing costs (in dollars) of investing in the Fund and to compare these costs with the ongoing costs of investing in other mutual funds.
The Example is based on an investment of $1,000 invested at the beginning of the period and held for the entire period (May 1, 2006 to October 31, 2006).
Actual Expenses
The first line of the accompanying table for each class of the Fund provides information about actual account values and actual expenses. You may use the information in this line, together with the amount you invested, to estimate the expenses that you paid over the period. Simply divide your account value by $1,000.00 (for example, an $8,600 account value divided by $1,000.00 = 8.6), then multiply the result by the number in the first line for a class of the Fund under the heading entitled "Expenses Paid During Period" to estimate the expenses you paid on your account during this period.
Hypothetical Example for Comparison Purposes
The second line of the accompanying table for each class of the Fund provides information about hypothetical account values and hypothetical expenses based on a Class' actual expense ratio and an assumed rate of return of 5% per year before expenses, which is not the Class' actual return. The hypothetical account values and expenses may not be used to estimate the actual ending account balance or expenses you paid for the period. You may use this information to compare the ongoing costs of investing in the Fund and other funds. To do so, compare this 5% hypothetical example with the 5% hypothetical examples that appear in the shareholder reports of the other funds.
Annual Report
Shareholder Expense Example - continued
Please note that the expenses shown in the table are meant to highlight your ongoing costs only and do not reflect any transaction costs. Therefore, the second line of the table is useful in comparing ongoing costs only, and will not help you determine the relative total costs of owning different funds. In addition, if these transactional costs were included, your costs would have been higher.
| Beginning
Account Value
May 1, 2006 | Ending
Account Value
October 31, 2006 | Expenses Paid
During Period*
May 1, 2006
to October 31, 2006 |
Class A | | | |
Actual | $ 1,000.00 | $ 925.60 | $ 8.06 |
HypotheticalA | $ 1,000.00 | $ 1,016.84 | $ 8.44 |
Class T | | | |
Actual | $ 1,000.00 | $ 924.70 | $ 9.12 |
HypotheticalA | $ 1,000.00 | $ 1,015.73 | $ 9.55 |
Class B | | | |
Actual | $ 1,000.00 | $ 922.50 | $ 11.73 |
HypotheticalA | $ 1,000.00 | $ 1,013.01 | $ 12.28 |
Class C | | | |
Actual | $ 1,000.00 | $ 921.80 | $ 11.63 |
HypotheticalA | $ 1,000.00 | $ 1,013.11 | $ 12.18 |
Fidelity International Small Cap Opportunities | | | |
Actual | $ 1,000.00 | $ 927.60 | $ 6.27 |
HypotheticalA | $ 1,000.00 | $ 1,018.70 | $ 6.56 |
Institutional Class | | | |
Actual | $ 1,000.00 | $ 927.00 | $ 6.22 |
HypotheticalA | $ 1,000.00 | $ 1,018.75 | $ 6.51 |
A 5% return per year before expenses
* Expenses are equal to each Class' annualized expense ratio (shown in the table below); multiplied by the average account value over the period, multiplied by 184/365 (to reflect the one-half year period).
| Annualized
Expense Ratio |
Class A | 1.66% |
Class T | 1.88% |
Class B | 2.42% |
Class C | 2.40% |
Fidelity International Small Cap Opportunities | 1.29% |
Institutional Class | 1.28% |
Annual Report
Investment Changes
Geographic Diversification (% of fund's net assets) |
As of October 31, 2006 |
 | Japan 32.7% |
 | Germany 10.3% |
 | United States of America 10.0% |
 | France 6.8% |
 | United Kingdom 6.0% |
 | Australia 5.5% |
 | Spain 4.5% |
 | Italy 3.5% |
 | Sweden 3.4% |
 | Other 17.3% |

Percentages are adjusted for the effect of futures contracts, if applicable. |
|
As of April 30, 2006 |
 | Japan 38.9% | |
 | Germany 10.6% | |
 | France 8.0% | |
 | United States of America 6.6% | |
 | United Kingdom 5.5% | |
 | Korea (South) 5.4% | |
 | Australia 4.1% | |
 | Sweden 3.2% | |
 | Norway 2.2% | |
 | Other 15.5% | |

Percentages are adjusted for the effect of futures contracts, if applicable. |
Asset Allocation |
| % of fund's
net assets | % of fund's net assets
6 months ago |
Stocks | 99.1 | 97.9 |
Short-Term Investments and Net Other Assets | 0.9 | 2.1 |
Top Ten Stocks as of October 31, 2006 |
| % of fund's
net assets | % of fund's net assets
6 months ago |
Titanium Metals Corp. (United States of America, Metals & Mining) | 3.0 | 2.1 |
Silicon On Insulator Technologies SA (SOITEC) (France, Semiconductors & Semiconductor Equipment) | 2.3 | 1.4 |
Demag Cranes AG (Germany, Machinery) | 2.0 | 0.0 |
Neopost SA (France, Office Electronics) | 2.0 | 1.4 |
MG Technologies AG (Germany, Chemicals) | 1.9 | 1.0 |
Allegheny Technologies, Inc. (United States of America, Metals & Mining) | 1.9 | 0.4 |
Renovo Group PLC (United Kingdom, Pharmaceuticals) | 1.8 | 0.9 |
Abengoa SA (Spain, Construction & Engineering) | 1.8 | 0.4 |
KK daVinci Advisors (Japan, Real Estate Management & Development) | 1.8 | 1.2 |
Deutz AG (Germany, Machinery) | 1.8 | 1.2 |
| 20.3 | |
Market Sectors as of October 31, 2006 |
| % of fund's
net assets | % of fund's net assets
6 months ago |
Industrials | 23.4 | 28.1 |
Information Technology | 19.3 | 16.6 |
Materials | 16.5 | 16.1 |
Financials | 15.0 | 15.6 |
Consumer Staples | 6.9 | 2.4 |
Consumer Discretionary | 6.7 | 11.2 |
Health Care | 5.7 | 3.2 |
Energy | 3.8 | 4.7 |
Telecommunication Services | 1.8 | 0.0 |
Annual Report
Investments October 31, 2006
Showing Percentage of Net Assets
Common Stocks - 99.1% |
| Shares | | Value (Note 1) |
Australia - 5.5% |
Babcock & Brown Ltd. | 700,000 | | $ 11,824,367 |
CSL Ltd. | 423,300 | | 18,380,564 |
Oxiana Ltd. | 6,340,600 | | 16,247,385 |
United Group Ltd. | 1,196,308 | | 13,530,640 |
TOTAL AUSTRALIA | | 59,982,956 |
Austria - 0.8% |
Andritz AG | 49,974 | | 9,066,658 |
Brazil - 0.9% |
Cosan SA Industria E Comercio | 570,000 | | 9,744,045 |
China - 1.9% |
China Techfaith Wireless Communication Technology Ltd. sponsored ADR (a)(d) | 1,310,696 | | 9,620,509 |
Comba Telecom Systems Holdings Ltd. | 9,738,000 | | 3,380,728 |
Global Bio-Chem Technology Group Co. Ltd. | 15,633,300 | | 4,583,131 |
ZTE Corp. (H Shares) | 1,000,000 | | 3,703,132 |
TOTAL CHINA | | 21,287,500 |
Finland - 2.6% |
KCI Konecranes Oyj | 734,000 | | 15,814,494 |
Metso Corp. | 290,900 | | 12,642,927 |
TOTAL FINLAND | | 28,457,421 |
France - 6.8% |
Alstom SA (a) | 150,062 | | 13,848,280 |
Compagnie Generale de Geophysique SA (a)(d) | 40,902 | | 6,917,469 |
Neopost SA | 178,400 | | 21,814,595 |
Rhodia SA | 60,700 | | 167,351 |
Silicon On Insulator Technologies SA (SOITEC) (a)(d) | 857,812 | | 25,412,890 |
Vallourec SA | 23,300 | | 5,799,323 |
TOTAL FRANCE | | 73,959,908 |
Germany - 10.3% |
Demag Cranes AG | 600,000 | | 21,872,390 |
Deutz AG (a)(d) | 1,951,432 | | 19,652,474 |
K&S AG | 65,000 | | 6,151,929 |
MG Technologies AG | 1,169,800 | | 21,008,377 |
MTU Aero Engines Holding AG | 281,750 | | 11,561,966 |
Q-Cells AG (d) | 138,800 | | 5,492,094 |
SGL Carbon AG (a) | 320,000 | | 7,008,968 |
SolarWorld AG (d) | 103,000 | | 5,540,112 |
Common Stocks - continued |
| Shares | | Value (Note 1) |
Germany - continued |
Wacker Chemie AG | 27,200 | | $ 3,269,054 |
Wincor Nixdorf AG | 75,900 | | 10,554,941 |
TOTAL GERMANY | | 112,112,305 |
India - 0.4% |
Bajaj Hindusthan Ltd. | 700,000 | | 4,857,302 |
Ireland - 1.0% |
Ryanair Holdings PLC sponsored ADR (a) | 163,800 | | 10,945,116 |
Italy - 3.5% |
Banca Italease Spa | 339,240 | | 18,944,010 |
Eurotech Spa (d) | 400,000 | | 4,714,001 |
Lottomatica Spa | 220,000 | | 8,031,109 |
Nice Spa | 820,200 | | 7,014,252 |
TOTAL ITALY | | 38,703,372 |
Japan - 32.7% |
Acca Networks Co. Ltd. (a) | 2,661 | | 3,435,457 |
Access Co. Ltd. (a)(d) | 1,065 | | 7,093,323 |
Air Water, Inc. (d) | 941,000 | | 9,018,990 |
Ajinomoto Co., Inc. | 500,000 | | 5,784,029 |
Asics Corp. | 609,000 | | 8,159,226 |
Asset Managers Co. Ltd. (d) | 3,916 | | 10,714,091 |
Atrium Co. Ltd. (d) | 227,200 | | 7,750,753 |
Credit Saison Co. Ltd. | 285,800 | | 10,336,303 |
Daiei, Inc. (a)(d) | 162,700 | | 3,053,407 |
Dainippon Screen Manufacturing Co. Ltd. (d) | 516,000 | | 4,305,883 |
E*TRADE Securities Co. Ltd. (d) | 5,000 | | 5,258,208 |
Fujikura Ltd. | 1,142,000 | | 12,214,792 |
Furukawa Electric Co. Ltd. | 1,038,000 | | 7,410,483 |
Haseko Corp. (a)(d) | 1,451,000 | | 4,987,192 |
Hitachi Metals Ltd. | 685,000 | | 7,086,611 |
Intelligence Ltd. (d) | 2,882 | | 6,258,790 |
Intelligent Wave, Inc. (d) | 7,474 | | 6,965,339 |
Japan Asia Investment Co. Ltd. | 500,000 | | 2,800,103 |
Japan General Estate Co. Ltd. | 565,400 | | 14,840,784 |
Joint Corp. | 378,600 | | 14,890,220 |
Kenedix, Inc. | 2,500 | | 14,043,263 |
KK daVinci Advisors (a)(d) | 18,098 | | 19,806,294 |
Komatsu Electron Metals Co. Ltd. | 1,100 | | 44,015 |
Meiko Electronics Co. Ltd. | 70,900 | | 2,849,094 |
Miraial Co. Ltd. | 49,400 | | 5,097,965 |
Nabtesco Corp. | 488,000 | | 5,862,175 |
Common Stocks - continued |
| Shares | | Value (Note 1) |
Japan - continued |
NEOMAX Co. Ltd. (d) | 464,000 | | $ 8,529,412 |
NGK Insulators Ltd. | 387,000 | | 5,251,103 |
Nidec Corp. | 100,000 | | 7,652,189 |
Nidec Sankyo Corp. (d) | 242,000 | | 2,702,223 |
Nintendo Co. Ltd. | 70,000 | | 14,316,006 |
Nippon Electric Glass Co. Ltd. | 382,000 | | 8,230,507 |
OMC Card, Inc. (d) | 1,846,500 | | 18,345,016 |
Organo Corp. | 595,000 | | 5,611,192 |
ORIX Corp. | 45,760 | | 12,891,519 |
Rakuten, Inc. | 13,000 | | 5,779,754 |
Stanley Electric Co. Ltd. | 200,000 | | 3,967,168 |
Sumco Corp. | 138,600 | | 9,859,371 |
Takeuchi Manufacturing Co. Ltd. | 100,000 | | 4,249,316 |
Toho Tenax Co. Ltd. (a)(d) | 1,262,000 | | 9,657,063 |
Tokai Carbon Co. Ltd. (d) | 500,000 | | 3,377,223 |
Tokuyama Corp. | 1,035,000 | | 13,025,992 |
Toray Industries, Inc. | 1,064,000 | | 7,668,879 |
Ufj Nicos Co. Ltd. (d) | 933,000 | | 4,211,902 |
Urban Corp. (d) | 266,700 | | 4,083,958 |
Valor Co. Ltd. | 144,000 | | 2,117,647 |
Yahoo! Japan Corp. | 15,000 | | 5,835,329 |
TOTAL JAPAN | | 357,429,559 |
Luxembourg - 0.9% |
Acergy SA (a)(d) | 560,400 | | 10,171,260 |
Netherlands - 0.8% |
Nutreco Holding NV | 140,000 | | 8,343,316 |
Norway - 2.9% |
Cermaq ASA | 400,000 | | 4,926,108 |
Fred Olsen Energy ASA (a)(d) | 98,900 | | 4,266,714 |
PAN Fish ASA (a) | 7,500,000 | | 5,874,614 |
Petroleum Geo-Services ASA (a) | 177,200 | | 10,314,934 |
ProSafe ASA | 100,000 | | 6,394,762 |
TOTAL NORWAY | | 31,777,132 |
Papua New Guinea - 1.0% |
Lihir Gold Ltd. (a) | 4,361,900 | | 9,286,103 |
Lihir Gold Ltd. sponsored ADR (a) | 70,000 | | 1,514,100 |
TOTAL PAPUA NEW GUINEA | | 10,800,203 |
Singapore - 1.2% |
GigaMedia Ltd. (a) | 1,300,000 | | 12,571,000 |
Common Stocks - continued |
| Shares | | Value (Note 1) |
South Africa - 0.5% |
Gold Fields Ltd. | 314,600 | | $ 5,272,696 |
Spain - 4.5% |
Abengoa SA | 658,324 | | 20,099,611 |
Azucarera Ebro Agricolas SA | 470,000 | | 10,438,399 |
Grifols SA | 1,777,380 | | 18,602,912 |
TOTAL SPAIN | | 49,140,922 |
Sweden - 3.4% |
Axfood AB | 185,000 | | 6,070,697 |
Bergman & Beving AB (B Shares) | 300,000 | | 6,729,065 |
Lindex AB | 1,000,000 | | 13,326,595 |
Modern Times Group AB (MTG) (B Shares) | 193,100 | | 11,122,286 |
TOTAL SWEDEN | | 37,248,643 |
Switzerland - 0.5% |
Sulzer AG (Reg.) | 6,000 | | 5,280,714 |
Taiwan - 1.9% |
Macronix International Co. Ltd. (a) | 19,049,000 | | 6,431,011 |
PixArt Imaging, Inc. | 1,467,000 | | 12,072,072 |
Prime View International Co. Ltd. (a) | 5,413,000 | | 2,529,058 |
TOTAL TAIWAN | | 21,032,141 |
United Kingdom - 6.0% |
Autonomy Corp. PLC (a) | 700,000 | | 6,415,876 |
Benfield Group PLC | 950,000 | | 6,315,256 |
Expro International Group PLC | 244,005 | | 3,555,958 |
Meggitt PLC | 1,495,431 | | 9,541,728 |
Michael Page International PLC | 869,827 | | 6,703,148 |
Optos PLC | 1,700,000 | | 5,707,240 |
Renovo Group PLC | 6,901,363 | | 20,108,544 |
Xansa PLC | 5,150,000 | | 7,760,664 |
TOTAL UNITED KINGDOM | | 66,108,414 |
United States of America - 9.1% |
Allegheny Technologies, Inc. | 266,100 | | 20,950,053 |
Chiquita Brands International, Inc. | 900,000 | | 12,330,000 |
NII Holdings, Inc. (a) | 116,800 | | 7,595,504 |
RTI International Metals, Inc. (a) | 228,300 | | 13,999,356 |
Common Stocks - continued |
| Shares | | Value (Note 1) |
United States of America - continued |
Time Warner Telecom, Inc. Class A (sub. vtg.) (a) | 587,000 | | $ 11,704,780 |
Titanium Metals Corp. | 1,122,250 | | 33,083,931 |
TOTAL UNITED STATES OF AMERICA | | 99,663,624 |
TOTAL COMMON STOCKS (Cost $967,524,817) | 1,083,956,207 |
Money Market Funds - 9.5% |
| | | |
Fidelity Cash Central Fund, 5.34% (b) | 12,721,965 | | 12,721,965 |
Fidelity Securities Lending Cash Central Fund, 5.35% (b)(c) | 90,676,921 | | 90,676,921 |
TOTAL MONEY MARKET FUNDS (Cost $103,398,886) | 103,398,886 |
TOTAL INVESTMENT PORTFOLIO - 108.6% (Cost $1,070,923,703) | | 1,187,355,093 |
NET OTHER ASSETS - (8.6)% | | (94,179,549) |
NET ASSETS - 100% | $ 1,093,175,544 |
Legend |
(a) Non-income producing |
(b) Affiliated fund that is available only to investment companies and other accounts managed by Fidelity Investments. The rate quoted is the annualized seven-day yield of the fund at period end. A complete unaudited listing of the fund's holdings as of its most recent quarter end is available upon request. |
(c) Investment made with cash collateral received from securities on loan. |
(d) Security or a portion of the security is on loan at period end. |
Affiliated Central Funds |
Information regarding fiscal year to date income earned by the Fund from investments in Fidelity Central Funds is as follows: |
Fund | Income earned |
Fidelity Cash Central Fund | $ 889,896 |
Fidelity Securities Lending Cash Central Fund | 1,936,235 |
Total | $ 2,826,131 |
Income Tax Information |
At October 31, 2006, the fund had a capital loss carryforward of approximately $516,738 all of which will expire on October 31, 2013. |
Annual Report
See accompanying notes which are an integral part of the financial statements.
Financial Statements
Statement of Assets and Liabilities
October 31, 2006 |
Assets | | |
Investment in securities, at value (including securities loaned of $86,550,679) - See accompanying schedule: Unaffiliated issuers (cost $967,524,817) | $ 1,083,956,207 | |
Fidelity Central Funds (cost $103,398,886) | 103,398,886 | |
Total Investments (cost $1,070,923,703) | | $ 1,187,355,093 |
Receivable for investments sold | | 15,259,934 |
Receivable for fund shares sold | | 2,444,674 |
Dividends receivable | | 1,156,965 |
Interest receivable | | 74,208 |
Receivable from investment adviser for expense reductions | | 605 |
Other receivables | | 358,682 |
Total assets | | 1,206,650,161 |
| | |
Liabilities | | |
Payable for investments purchased | $ 18,817,648 | |
Payable for fund shares redeemed | 2,609,641 | |
Accrued management fee | 924,055 | |
Distribution fees payable | 45,153 | |
Other affiliated payables | 249,592 | |
Other payables and accrued expenses | 151,607 | |
Collateral on securities loaned, at value | 90,676,921 | |
Total liabilities | | 113,474,617 |
| | |
Net Assets | | $ 1,093,175,544 |
Net Assets consist of: | | |
Paid in capital | | $ 977,894,603 |
Undistributed net investment income | | 3,179,958 |
Accumulated undistributed net realized gain (loss) on investments and foreign currency transactions | | (4,329,237) |
Net unrealized appreciation (depreciation) on investments and assets and liabilities in foreign currencies | | 116,430,220 |
Net Assets | | $ 1,093,175,544 |
Annual Report
See accompanying notes which are an integral part of the financial statements.
Financial Statements - continued
Statement of Assets and Liabilities - continued
October 31, 2006 |
Calculation of Maximum Offering Price
Class A:
Net Asset Value and redemption price per share
($35,673,926 ÷ 2,515,423 shares) | | $ 14.18 |
| | |
Maximum offering price per share (100/94.25 of $14.18) | | $ 15.05 |
Class T:
Net Asset Value and redemption price per share
($28,308,901 ÷ 2,004,382 shares) | | $ 14.12 |
| | |
Maximum offering price per share (100/96.50 of $14.12) | | $ 14.63 |
Class B:
Net Asset Value and offering price per share
($7,708,704 ÷ 549,104 shares)A | | $ 14.04 |
| | |
Class C:
Net Asset Value and offering price per share
($26,320,302 ÷ 1,875,885 shares)A | | $ 14.03 |
| | |
| | |
Fidelity International Small Cap Opportunities:
Net Asset Value, offering price and redemption price per
share ($981,210,056 ÷ 68,977,418 shares) | | $ 14.23 |
| | |
Institutional Class:
Net Asset Value, offering price and redemption price per
share ($13,953,655 ÷ 981,185 shares) | | $ 14.22 |
A Redemption price per share is equal to net asset value less any applicable contingent deferred sales charge.
Annual Report
See accompanying notes which are an integral part of the financial statements.
Statement of Operations
Year ended October 31, 2006 |
| | |
Investment Income | | |
Dividends | | $ 13,145,566 |
Interest | | 3,266 |
Income from Fidelity Central Funds (including $1,936,235 from security lending) | | 2,826,131 |
| | 15,974,963 |
Less foreign taxes withheld | | (1,197,058) |
Total income | | 14,777,905 |
| | |
Expenses | | |
Management fee
Basic fee | $ 8,300,425 | |
Performance adjustment | 423,756 | |
Transfer agent fees | 2,163,979 | |
Distribution fees | 348,181 | |
Accounting and security lending fees | 492,883 | |
Custodian fees and expenses | 398,385 | |
Independent trustees' compensation | 3,317 | |
Registration fees | 327,338 | |
Audit | 56,012 | |
Legal | 14,931 | |
Interest | 139,137 | |
Miscellaneous | 4,124 | |
Total expenses before reductions | 12,672,468 | |
Expense reductions | (1,072,152) | 11,600,316 |
Net investment income (loss) | | 3,177,589 |
Realized and Unrealized Gain (Loss) Net realized gain (loss) on: | | |
Investment securities: | | |
Unaffiliated issuers | (559,117) | |
Investment not meeting investment restrictions | 35,982 | |
Foreign currency transactions | (430,569) | |
Total net realized gain (loss) | | (953,704) |
Change in net unrealized appreciation (depreciation) on: Investment securities | 115,233,371 | |
Assets and liabilities in foreign currencies | 1,829 | |
Total change in net unrealized appreciation (depreciation) | | 115,235,200 |
Net gain (loss) | | 114,281,496 |
Net increase (decrease) in net assets resulting from operations | | $ 117,459,085 |
Annual Report
See accompanying notes which are an integral part of the financial statements.
Financial Statements - continued
Statement of Changes in Net Assets
| Year ended
October 31,
2006 | August 2, 2005 (commencement
of operations)
to October 31, 2005 |
Increase (Decrease) in Net Assets | | |
Operations | | |
Net investment income (loss) | $ 3,177,589 | $ 25,230 |
Net realized gain (loss) | (953,704) | (3,306,632) |
Change in net unrealized appreciation (depreciation) | 115,235,200 | 1,195,020 |
Net increase (decrease) in net assets resulting
from operations | 117,459,085 | (2,086,382) |
Distributions to shareholders from net realized gain | (90,957) | - |
Share transactions - net increase (decrease) | 760,497,703 | 215,410,790 |
Redemption fees | 1,853,226 | 132,079 |
Total increase (decrease) in net assets | 879,719,057 | 213,456,487 |
| | |
Net Assets | | |
Beginning of period | 213,456,487 | - |
End of period (including undistributed net investment income of $3,179,958 and undistributed net investment income of $25,213, respectively) | $ 1,093,175,544 | $ 213,456,487 |
Annual Report
See accompanying notes which are an integral part of the financial statements.
Financial Highlights - Class A
Years ended October 31, | 2006 | 2005 I |
Selected Per-Share Data | | |
Net asset value, beginning of period | $ 10.41 | $ 10.00 |
Income from Investment Operations | | |
Net investment income (loss) E | - K | - K |
Net realized and unrealized gain (loss) | 3.74 | .40 H |
Total from investment operations | 3.74 | .40 |
Distributions from net realized gain | -K | - |
Redemption fees added to paid in capital E | .03 | .01 |
Net asset value, end of period | $ 14.18 | $ 10.41 |
Total Return B, C, D | 36.25% | 4.10% |
Ratios to Average Net Assets F, J | | |
Expenses before reductions | 1.63% | 2.67% A |
Expenses net of fee waivers, if any | 1.63% | 1.65%A |
Expenses net of all reductions | 1.51% | 1.54%A |
Net investment income (loss) | .02% | (.09)%A |
Supplemental Data | | |
Net assets, end of period (000 omitted) | $ 35,674 | $ 5,533 |
Portfolio turnover rate G | 164% | 46% |
A Annualized
B Total returns for periods of less than one year are not annualized.
C Total returns would have been lower had certain expenses not been reduced during the periods shown.
D Total returns do not include the effect of the sales charges.
E Calculated based on average shares outstanding during the period.
F Fees and expenses of the underlying Fidelity Central Funds are not included in the Fund's expense ratio. The Fund indirectly bears its proportionate share of the expenses of any underlying Fidelity Central Funds.
G Amount does not include the portfolio activity of any underlying Fidelity Central Funds.
H The amount shown for a share outstanding does not correspond with the aggregate net gain (loss) on investments for the period due to the timing of sales and repurchases of shares in relation to fluctuating market values of the investments of the Fund.
I For the period August 2, 2005 (commencement of operations) to October 31, 2005.
J Expense ratios reflect operating expenses of the class. Expenses before reductions do not reflect amounts reimbursed by the investment adviser or reductions from brokerage service arrangements or other expense offset arrangements and do not represent the amount paid by the class during periods when reimbursements or reductions occur. Expense ratios before reductions for start-up periods may not be representative of longer-term operating periods. Expenses net of fee waivers reflect expenses after reimbursement by the investment adviser but prior to reductions from brokerage service arrangements or other expense offset arrangements. Expenses net of all reductions represent the net expenses paid by the class.
K Amount represents less than $.01 per share.
Annual Report
See accompanying notes which are an integral part of the financial statements.
Financial Highlights - Class T
Years ended October 31, | 2006 | 2005 I |
Selected Per-Share Data | | |
Net asset value, beginning of period | $ 10.38 | $ 10.00 |
Income from Investment Operations | | |
Net investment income (loss) E | (.03) | (.01) |
Net realized and unrealized gain (loss) | 3.74 | .38 H |
Total from investment operations | 3.71 | .37 |
Redemption fees added to paid in capital E | .03 | .01 |
Net asset value, end of period | $ 14.12 | $ 10.38 |
Total Return B, C, D | 36.03% | 3.80% |
Ratios to Average Net Assets F, J | | |
Expenses before reductions | 1.85% | 2.92%A |
Expenses net of fee waivers, if any | 1.85% | 1.90%A |
Expenses net of all reductions | 1.74% | 1.78%A |
Net investment income (loss) | (.20)% | (.33)%A |
Supplemental Data | | |
Net assets, end of period (000 omitted) | $ 28,309 | $ 2,704 |
Portfolio turnover rate G | 164% | 46% |
A Annualized
B Total returns for periods of less than one year are not annualized.
C Total returns would have been lower had certain expenses not been reduced during the periods shown.
D Total returns do not include the effect of the sales charges.
E Calculated based on average shares outstanding during the period.
F Fees and expenses of the underlying Fidelity Central Funds are not included in the Fund's expense ratio. The Fund indirectly bears its proportionate share of the expenses of any underlying Fidelity Central Funds.
G Amount does not include the portfolio activity of any underlying Fidelity Central Funds.
H The amount shown for a share outstanding does not correspond with the aggregate net gain (loss) on investments for the period due to the timing of sales and repurchases of shares in relation to fluctuating market values of the investments of the Fund.
I For the period August 2, 2005 (commencement of operations) to October 31, 2005.
J Expense ratios reflect operating expenses of the class. Expenses before reductions do not reflect amounts reimbursed by the investment adviser or reductions from brokerage service arrangements or other expense offset arrangements and do not represent the amount paid by the class during periods when reimbursements or reductions occur. Expense ratios before reductions for start-up periods may not be representative of longer-term operating periods. Expenses net of fee waivers reflect expenses after reimbursement by the investment adviser but prior to reductions from brokerage service arrangements or other expense offset arrangements. Expenses net of all reductions represent the net expenses paid by the class.
Annual Report
See accompanying notes which are an integral part of the financial statements.
Financial Highlights - Class B
Years ended October 31, | 2006 | 2005 I |
Selected Per-Share Data | | |
Net asset value, beginning of period | $ 10.37 | $ 10.00 |
Income from Investment Operations | | |
Net investment income (loss) E | (.10) | (.02) |
Net realized and unrealized gain (loss) | 3.74 | .38 H |
Total from investment operations | 3.64 | .36 |
Redemption fees added to paid in capital E | .03 | .01 |
Net asset value, end of period | $ 14.04 | $ 10.37 |
Total Return B, C, D | 35.39% | 3.70% |
Ratios to Average Net Assets F, J | | |
Expenses before reductions | 2.45% | 3.43% A |
Expenses net of fee waivers, if any | 2.41% | 2.40%A |
Expenses net of all reductions | 2.30% | 2.27%A |
Net investment income (loss) | (.76)% | (.82)%A |
Supplemental Data | | |
Net assets, end of period (000 omitted) | $ 7,709 | $ 1,705 |
Portfolio turnover rate G | 164% | 46% |
A Annualized
B Total returns for periods of less than one year are not annualized.
C Total returns would have been lower had certain expenses not been reduced during the periods shown.
D Total returns do not include the effect of the contingent deferred sales charge.
E Calculated based on average shares outstanding during the period.
F Fees and expenses of the underlying Fidelity Central Funds are not included in the Fund's expense ratio. The Fund indirectly bears its proportionate share of the expenses of any underlying Fidelity Central Funds.
G Amount does not include the portfolio activity of any underlying Fidelity Central Funds.
H The amount shown for a share outstanding does not correspond with the aggregate net gain (loss) on investments for the period due to the timing of sales and repurchases of shares in relation to fluctuating market values of the investments of the Fund.
I For the period August 2, 2005 (commencement of operations) to October 31, 2005.
J Expense ratios reflect operating expenses of the class. Expenses before reductions do not reflect amounts reimbursed by the investment adviser or reductions from brokerage service arrangements or other expense offset arrangements and do not represent the amount paid by the class during periods when reimbursements or reductions occur. Expense ratios before reductions for start-up periods may not be representative of longer-term operating periods. Expenses net of fee waivers reflect expenses after reimbursement by the investment adviser but prior to reductions from brokerage service arrangements or other expense offset arrangements. Expenses net of all reductions represent the net expenses paid by the class.
Annual Report
See accompanying notes which are an integral part of the financial statements.
Financial Highlights - Class C
Years ended October 31, | 2006 | 2005 I |
Selected Per-Share Data | | |
Net asset value, beginning of period | $ 10.37 | $ 10.00 |
Income from Investment Operations | | |
Net investment income (loss) E | (.10) | (.02) |
Net realized and unrealized gain (loss) | 3.73 | .38 H |
Total from investment operations | 3.63 | .36 |
Redemption fees added to paid in capital E | .03 | .01 |
Net asset value, end of period | $ 14.03 | $ 10.37 |
Total Return B, C, D | 35.29% | 3.70% |
Ratios to Average Net Assets F, J | | |
Expenses before reductions | 2.38% | 3.32% A |
Expenses net of fee waivers, if any | 2.38% | 2.40%A |
Expenses net of all reductions | 2.27% | 2.29%A |
Net investment income (loss) | (.73)% | (.84)%A |
Supplemental Data | | |
Net assets, end of period (000 omitted) | $ 26,320 | $ 3,317 |
Portfolio turnover rate G | 164% | 46% |
A Annualized
B Total returns for periods of less than one year are not annualized.
C Total returns would have been lower had certain expenses not been reduced during the periods shown.
D Total returns do not include the effect of the contingent deferred sales charge.
E Calculated based on average shares outstanding during the period.
F Fees and expenses of the underlying Fidelity Central Funds are not included in the Fund's expense ratio. The Fund indirectly bears its proportionate share of the expenses of any underlying Fidelity Central Funds.
G Amount does not include the portfolio activity of any underlying Fidelity Central Funds.
H The amount shown for a share outstanding does not correspond with the aggregate net gain (loss) on investments for the period due to the timing of sales and repurchases of shares in relation to fluctuating market values of the investments of the Fund.
I For the period August 2, 2005 (commencement of operations) to October 31, 2005.
J Expense ratios reflect operating expenses of the class. Expenses before reductions do not reflect amounts reimbursed by the investment adviser or reductions from brokerage service arrangements or other expense offset arrangements and do not represent the amount paid by the class during periods when reimbursements or reductions occur. Expense ratios before reductions for start-up periods may not be representative of longer-term operating periods. Expenses net of fee waivers reflect expenses after reimbursement by the investment adviser but prior to reductions from brokerage service arrangements or other expense offset arrangements. Expenses net of all reductions represent the net expenses paid by the class.
Annual Report
See accompanying notes which are an integral part of the financial statements.
Financial Highlights - Fidelity International Small Cap Opportunities
Years ended October 31, | 2006 | 2005 H |
Selected Per-Share Data | | |
Net asset value, beginning of period | $ 10.40 | $ 10.00 |
Income from Investment Operations | | |
Net investment income (loss) D | .05 | - J |
Net realized and unrealized gain (loss) | 3.75 | .39 G |
Total from investment operations | 3.80 | .39 |
Distributions from net realized gain | -J | - |
Redemption fees added to paid in capital D | .03 | .01 |
Net asset value, end of period | $ 14.23 | $ 10.40 |
Total Return B, C | 36.86% | 4.00% |
Ratios to Average Net AssetsE, I | | |
Expenses before reductions | 1.28% | 2.25% A |
Expenses net of fee waivers, if any | 1.28% | 1.40%A |
Expenses net of all reductions | 1.16% | 1.31%A |
Net investment income (loss) | .37% | .14%A |
Supplemental Data | | |
Net assets, end of period (000 omitted) | $ 981,210 | $ 197,349 |
Portfolio turnover rate F | 164% | 46% |
A Annualized
B Total returns for periods of less than one year are not annualized.
C Total returns would have been lower had certain expenses not been reduced during the periods shown.
D Calculated based on average shares outstanding during the period.
E Fees and expenses of the underlying Fidelity Central Funds are not included in the Fund's expense ratio. The Fund indirectly bears its proportionate share of the expenses of any underlying Fidelity Central Funds.
F Amount does not include the portfolio activity of any underlying Fidelity Central Funds.
G The amount shown for a share outstanding does not correspond with the aggregate net gain (loss) on investments for the period due to the timing of sales and repurchases of shares in relation to fluctuating market values of the investments of the Fund.
H For the period August 2, 2005 (commencement of operations) to October 31, 2005.
I Expense ratios reflect operating expenses of the class. Expenses before reductions do not reflect amounts reimbursed by the investment adviser or reductions from brokerage service arrangements or other expense offset arrangements and do not represent the amount paid by the class during periods when reimbursements or reductions occur. Expense ratios before reductions for start-up periods may not be representative of longer-term operating periods. Expenses net of fee waivers reflect expenses after reimbursement by the investment adviser but prior to reductions from brokerage service arrangements or other expense offset arrangements. Expenses net of all reductions represent the net expenses paid by the class.
J Amount represents less than $.01 per share.
Annual Report
See accompanying notes which are an integral part of the financial statements.
Financial Highlights - Institutional Class
Years ended October 31, | 2006 | 2005 H |
Selected Per-Share Data | | |
Net asset value, beginning of period | $ 10.40 | $ 10.00 |
Income from Investment Operations | | |
Net investment income (loss)D | .05 | - J |
Net realized and unrealized gain (loss) | 3.74 | .39 G |
Total from investment operations | 3.79 | .39 |
Distributions from net realized gain | - J | - |
Redemption fees added to paid in capitalD | .03 | .01 |
Net asset value, end of period | $ 14.22 | $ 10.40 |
Total Return B, C | 36.77% | 4.00% |
Ratios to Average Net Assets E, I | | |
Expenses before reductions | 1.25% | 2.25% A |
Expenses net of fee waivers, if any | 1.25% | 1.40%A |
Expenses net of all reductions | 1.14% | 1.29%A |
Net investment income (loss) | .40% | .16%A |
Supplemental Data | | |
Net assets, end of period (000 omitted) | $ 13,954 | $ 2,849 |
Portfolio turnover rate F | 164% | 46% |
A Annualized
B Total returns for periods of less than one year are not annualized.
C Total returns would have been lower had certain expenses not been reduced during the periods shown.
D Calculated based on average shares outstanding during the period.
E Fees and expenses of the underlying Fidelity Central Funds are not included in the Fund's expense ratio. The Fund indirectly bears its proportionate share of the expenses of any underlying Fidelity Central Funds.
F Amount does not include the portfolio activity of any underlying Fidelity Central Funds.
G The amount shown for a share outstanding does not correspond with the aggregate net gain (loss) on investments for the period due to the timing of sales and repurchases of shares in relation to fluctuating market values of the investments of the Fund.
H For the period August 2, 2005 (commencement of operations) to October 31, 2005.
I Expense ratios reflect operating expenses of the class. Expenses before reductions do not reflect amounts reimbursed by the investment adviser or reductions from brokerage service arrangements or other expense offset arrangements and do not represent the amount paid by the class during periods when reimbursements or reductions occur. Expense ratios before reductions for start-up periods may not be representative of longer-term operating periods. Expenses net of fee waivers reflect expenses after reimbursement by the investment adviser but prior to reductions from brokerage service arrangements or other expense offset arrangements. Expenses net of all reductions represent the net expenses paid by the class.
J Amount represents less than $.01 per share.
Annual Report
See accompanying notes which are an integral part of the financial statements.
Notes to Financial Statements
For the period ended October 31, 2006
1. Significant Accounting Policies.
Fidelity International Small Cap Opportunities Fund (the Fund) is a fund of Fidelity Investment Trust (the trust) and is authorized to issue an unlimited number of shares. The trust is registered under the Investment Company Act of 1940, as amended (the 1940 Act), as an open-end management investment company organized as a Massachusetts business trust.
The Fund offers Class A, Class T, Class B, Class C, International Small Cap Opportunities and Institutional Class shares, each of which has equal rights as to assets and voting privileges. Each class has exclusive voting rights with respect to matters that affect that class. Class B shares will automatically convert to Class A shares after a holding period of seven years from the initial date of purchase. Investment income, realized and unrealized capital gains and losses, the common expenses of the Fund, and certain fund-level expense reductions, if any, are allocated on a pro rata basis to each class based on the relative net assets of each class to the total net assets of the Fund. Each class differs with respect to transfer agent and distribution and service plan fees incurred. Certain expense reductions also differ by class.
The Fund may invest in Fidelity Central Funds which are open-end investment companies available to investment companies and other accounts managed by Fidelity Management & Research Company (FMR) and its affiliates. The financial statements have been prepared in conformity with accounting principles generally accepted in the United States of America, which require management to make certain estimates and assumptions at the date of the financial statements. The following summarizes the significant accounting policies of the Fund, which are also consistently followed by the Fidelity Central Funds:
Security Valuation. Investments are valued and net asset value (NAV) per share is calculated (NAV calculation) as of the close of business of the New York Stock Exchange (NYSE), normally 4:00 p.m. Eastern time. Wherever possible, the Fund uses independent pricing services approved by the Board of Trustees to value its investments.
Equity securities, including restricted securities, for which market quotations are readily available, are valued at the last reported sale price or official closing price as reported by an independent pricing service on the primary market or exchange on which they are traded. In the event there were no sales during the day or closing prices are not available, securities are valued at the last quoted bid price. Investments in open-end mutual funds, including the Fidelity Central Funds, are valued at their closing net asset value each business day. Short-term securities with remaining maturities of sixty days or less for which quotations are not readily available are valued at amortized cost, which approximates value.
Annual Report
Notes to Financial Statements - continued
1. Significant Accounting Policies - continued
Security Valuation - continued
When current market prices or quotations are not readily available or do not accurately reflect fair value, valuations may be determined in accordance with procedures adopted by the Board of Trustees. For example, when developments occur between the close of a market and the close of the NYSE that may materially affect the value of some or all of the securities, or when trading in a security is halted, those securities may be fair valued. Factors used in the determination of fair value may include monitoring news to identify significant market or security specific events such as changes in the value of U.S. securities markets, reviewing developments in foreign markets and evaluating the performance of ADRs, futures contracts and exchange-traded funds. Because the Fund's utilization of fair value pricing depends on market activity, the frequency with which fair value pricing is used can not be predicted and may be utilized to a significant extent. The value of securities used for NAV calculation under fair value pricing may differ from published prices for the same securities.
Foreign Currency. The Fund uses foreign currency contracts to facilitate transactions in foreign-denominated securities. Losses from these transactions may arise from changes in the value of the foreign currency or if the counterparties do not perform under the contracts' terms.
Foreign-denominated assets, including investment securities, and liabilities are translated into U.S. dollars at the exchange rate at period end. Purchases and sales of investment securities, income and dividends received and expenses denominated in foreign currencies are translated into U.S. dollars at the exchange rate in effect on the transaction date.
The effects of exchange rate fluctuations on investments are included with the net realized and unrealized gain (loss) on investment securities. Other foreign currency transactions resulting in realized and unrealized gain (loss) are disclosed separately.
Investment Transactions and Income. Security transactions, including the Fund's investment activity in the Fidelity Central Funds, are accounted for as of trade date. Gains and losses on securities sold are determined on the basis of identified cost. Dividend income is recorded on the ex-dividend date, except for certain dividends from foreign securities where the ex-dividend date may have passed, which are recorded as soon as the Fund is informed of the ex-dividend date. Non-cash dividends included in dividend income, if any, are recorded at the fair market value of the securities received. Interest income and distributions from the Fidelity Central Funds are accrued as earned. Interest income includes coupon interest and amortization of premium and accretion of discount on debt securities. Investment income is recorded net of foreign taxes withheld where recovery of such taxes is uncertain.
Annual Report
1. Significant Accounting Policies - continued
Expenses. Most expenses of the trust can be directly attributed to a fund. Expenses which cannot be directly attributed are apportioned among each Fund in the trust. Expense estimates are accrued in the period to which they relate and adjustments are made when actual amounts are known.
Income Tax Information and Distributions to Shareholders. Each year, the Fund intends to qualify as a regulated investment company by distributing all of its taxable income and realized gains under Subchapter M of the Internal Revenue Code. As a result, no provision for income taxes is required in the accompanying financial statements. Foreign taxes are provided for based on the Fund's understanding of the tax rules and rates that exist in the foreign markets in which it invests.
Distributions are recorded on the ex-dividend date. Income dividends and capital gain distributions are declared separately for each class. Income and capital gain distributions are determined in accordance with income tax regulations, which may differ from generally accepted accounting principles. In addition, the Fund will claim a portion of the payment made to redeeming shareholders as a distribution for income tax purposes.
Capital accounts within the financial statements are adjusted for permanent book-tax differences. These adjustments have no impact on net assets or the results of operations. Temporary book-tax differences will reverse in a subsequent period.
Book-tax differences are primarily due to foreign currency transactions, passive foreign investment companies (PFIC), capital loss carryforwards and losses deferred due to wash sales.
The tax-basis components of distributable earnings and the federal tax cost as of period end were as follows:
Unrealized appreciation | $ 169,153,678 | |
Unrealized depreciation | (59,160,398) | |
Net unrealized appreciation (depreciation) | 109,993,280 | |
Capital loss carryforward | (516,738) | |
| | |
Cost for federal income tax purposes | $ 1,077,361,813 | |
The tax character of distributions paid was as follows:
| October 31,
2006 | October 31,
2005 |
Ordinary Income | $ 90,957 | $ - |
Short-Term Trading (Redemption) Fees. Shares held in the Fund less than 90 days are subject to a redemption fee equal to 2.00% of the proceeds of the redeemed shares. All redemption fees, including any estimated redemption fees paid by FMR, are retained by the Fund and accounted for as an addition to paid in capital.
Annual Report
Notes to Financial Statements - continued
1. Significant Accounting Policies - continued
New Accounting Pronouncements. In July 2006, Financial Accounting Standards Board Interpretation No. 48, Accounting for Uncertainty in Income Taxes - an interpretation of FASB Statement 109 (FIN 48), was issued and is effective for fiscal years beginning after December 15, 2006. FIN 48 sets forth a threshold for financial statement recognition, measurement and disclosure of a tax position taken or expected to be taken on a tax return. Management is currently evaluating the impact, if any, the adoption of FIN 48 will have on the Fund's net assets, results of operations and financial statement disclosures.
In addition, in September 2006, Statement of Financial Accounting Standards No. 157, Fair Value Measurements (SFAS 157), was issued and is effective for fiscal years beginning after November 15, 2007. SFAS 157 defines fair value, establishes a framework for measuring fair value and expands disclosures about fair value measurements. Management is currently evaluating the impact the adoption of SFAS 157 will have on the Fund's financial statement disclosures.
2. Operating Policies.
Repurchase Agreements. FMR has received an Exemptive Order from the Securities and Exchange Commission (the SEC) which permits the Fund and other affiliated entities of FMR to transfer uninvested cash balances into joint trading accounts which are then invested in repurchase agreements. The Fund may also invest directly with institutions in repurchase agreements. Repurchase agreements are collateralized by government or non-government securities. Upon settlement date, collateral is held in segregated accounts with custodian banks and may be obtained in the event of a default of the counterparty. The Fund monitors, on a daily basis, the value of the collateral to ensure it is at least equal to the principal amount of the repurchase agreement (including accrued interest). In the event of a default by the counterparty, realization of the collateral proceeds could be delayed, during which time the value of the collateral may decline.
3. Purchases and Sales of Investments.
Purchases and sales of securities, other than short-term securities, aggregated $2,275,575,976 and $1,521,126,280, respectively.
The Fund realized a gain on the sale of an investment not meeting the investment restrictions of the Fund.
Annual Report
4. Fees and Other Transactions with Affiliates.
Management Fee. FMR and its affiliates provide the Fund with investment management related services for which the Fund pays a monthly management fee. The management fee is the sum of an individual fund fee rate that is based on an annual rate of .60% of the Fund's average net assets and a group fee rate that averaged ..27% during the period. The group fee rate is based upon the average net assets of all the mutual funds advised by FMR. The group fee rate decreases as assets under management increase and increases as assets under management decrease. In addition, the management fee is subject to a performance adjustment (up to a maximum of ± .20% of the Fund's average net assets over a 36 month performance period). The upward or downward adjustment to the management fee is based on the relative investment performance of the retail class of the Fund, Fidelity International Small Cap Opportunities, as compared to an appropriate benchmark index. The Fund's performance adjustment took effect in August 2006. Subsequent months will be added until the performance period includes 36 months. For the period, the total annual management fee rate, including the performance adjustment, was .91% of the Fund's average net assets.
Distribution and Service Plan. In accordance with Rule 12b-1 of the 1940 Act, the Fund has adopted separate Distribution and Service Plans for each class of shares. Certain classes pay Fidelity Distributors Corporation (FDC), an affiliate of FMR, separate Distribution and Service Fees, each of which is based on an annual percentage of each class' average net assets. In addition, FDC may pay financial intermediaries for selling shares of the Fund and providing shareholder support services. For the period the Distribution and Service Fee rates and the total amounts paid to and retained by FDC were as follows:
| Distribution
Fee | Service
Fee | Paid to
FDC | Retained
by FDC |
Class A | 0% | .25% | $ 60,381 | $ 5,079 |
Class T | .25% | .25% | 84,746 | 10,636 |
Class B | .75% | .25% | 56,129 | 44,686 |
Class C | .75% | .25% | 146,925 | 120,497 |
| | | $ 348,181 | $ 180,898 |
Sales Load. FDC receives a front-end sales charge of up to 5.75% for selling Class A shares, and 3.50% for selling Class T shares, some of which is paid to financial intermediaries for selling shares of the Fund. FDC receives the proceeds of contingent deferred sales charges levied on Class A, Class T, Class B, and Class C redemptions. These charges depend on the holding period. The deferred sales charges range from 5% to 1% for Class B, 1% for Class C, 1.00% to .50% for certain purchases of Class A shares (.25% prior to February 24, 2006) and .25% for certain purchases of Class T shares.
Annual Report
Notes to Financial Statements - continued
4. Fees and Other Transactions with Affiliates - continued
Sales Load - continued
For the period, sales charge amounts retained by FDC were as follows:
| Retained
by FDC |
Class A | $ 94,260 |
Class T | 19,610 |
Class B* | 9,295 |
Class C* | 5,107 |
| $ 128,272 |
* When Class B and Class C shares are initially sold, FDC pays commissions from its own resources to financial intermediaries through which the sales are made.
Transfer Agent Fees. Fidelity Investments Institutional Operations Company, Inc. (FIIOC), an affiliate of FMR, is the transfer, dividend disbursing and shareholder servicing agent for each class of the Fund, except for Fidelity International Small Cap Opportunities. Fidelity Service Company, Inc. (FSC), an affiliate of FMR, is the transfer agent for Fidelity International Small Cap Opportunities shares. FIIOC and FSC receive account fees and asset-based fees that vary according to the account size and type of account of the shareholders of the respective classes of the Fund. FIIOC and FSC pay for typesetting, printing and mailing of shareholder reports, except proxy statements. For the period, the total transfer agent fees paid by each class to FIIOC or FSC, were as follows:
| Amount | % of
Average
Net Assets |
Class A | $ 77,944 | .32 |
Class T | 50,163 | .29 |
Class B | 22,462 | .40 |
Class C | 49,167 | .33 |
Fidelity International Small Cap Opportunities | 1,941,743 | .22 |
Institutional Class | 22,500 | .19 |
| $ 2,163,979 | |
Accounting and Security Lending Fees. FSC maintains the Fund's accounting records. The accounting fee is based on the level of average net assets for the month. Under a separate contract, FSC administers the security lending program. The security lending fee is based on the number and duration of lending transactions.
Annual Report
4. Fees and Other Transactions with Affiliates - continued
Investments in Fidelity Central Funds. The Fund may invest in Fidelity Central Funds. The Fund's Schedule of Investments lists each of the Fidelity Central Funds as an investment of the Fund but does not include the underlying holdings of each Fidelity Central Fund. As an Investing Fund, the Fund indirectly bears its proportionate share of the expenses of the underlying Fidelity Central Funds. A complete unaudited list of holdings for each Fidelity Central Fund, is available upon request. In addition, the financial statements of the Fidelity Central Funds, which are not covered by the Fund's Report of Independent Registered Public Accounting Firm, are available on the EDGAR Database on the SEC's web site, www.sec.gov, or upon request.
The Money Market Central Funds seek preservation of capital and current income and are managed by Fidelity Investments Money Management, Inc. (FIMM), an affiliate of FMR.
Brokerage Commissions. The Fund placed a portion of its portfolio transactions with brokerage firms which are affiliates of the investment adviser. The commissions paid to these affiliated firms were $10,168 for the period.
Interfund Lending Program. Pursuant to an Exemptive Order issued by the SEC, the Fund, along with other registered investment companies having management contracts with FMR, may participate in an interfund lending program. This program provides an alternative credit facility allowing the Funds to borrow from, or lend money to, other participating affiliated funds. At period end, there were no interfund loans outstanding. The Fund's activity in this program during the period for which loans were outstanding was as follows:
Borrower or Lender | Average Daily
Loan Balance | Weighted Average Interest Rate | Interest
Expense |
Borrower | $ 11,990,313 | 5.22% | $ 111,231 |
5. Committed Line of Credit.
The Fund participates with other funds managed by FMR in a $4.2 billion credit facility (the "line of credit") to be utilized for temporary or emergency purposes to fund shareholder redemptions or for other short-term liquidity purposes. The Fund has agreed to pay commitment fees on its pro rata portion of the line of credit, which amounts to $1,727 and is reflected in Miscellaneous Expense on the Statement of Operations. During the period, there were no borrowings on this line of credit.
Annual Report
Notes to Financial Statements - continued
6. Security Lending.
The Fund lends portfolio securities from time to time in order to earn additional income. On the settlement date of the loan, the Fund receives collateral (in the form of U.S. Treasury obligations, letters of credit and/or cash) against the loaned securities and maintains collateral in an amount not less than 100% of the market value of the loaned securities during the period of the loan. The market value of the loaned securities is determined at the close of business of the Fund and any additional required collateral is delivered to the Fund on the next business day. If the borrower defaults on its obligation to return the securities loaned because of insolvency or other reasons, a fund could experience delays and costs in recovering the securities loaned or in gaining access to the collateral. Any cash collateral received is invested in the Fidelity Securities Lending Cash Central Fund. The value of loaned securities and cash collateral at period end are disclosed on the Fund's Statement of Assets and Liabilities. Security lending income represents the income earned on investing cash collateral, less fees and expenses associated with the loan, plus any premium payments that may be received on the loan of certain types of securities.
7. Bank Borrowings.
The Fund is permitted to have bank borrowings for temporary or emergency purposes to fund shareholder redemptions. The Fund has established borrowing arrangements with certain banks. The interest rate on the borrowings is the bank's base rate, as revised from time to time. The average daily loan balance during the period for which loans were outstanding amounted to $8,950,571. The weighted average interest rate was 5.34%. At period end, there were no bank borrowings outstanding.
8. Expense Reductions.
FMR voluntarily agreed to reimburse each class to the extent annual operating expenses exceeded certain levels of average net assets as noted in the table below. Some expenses, for example interest expense, including commitment fees, are excluded from this reimbursement.
The following class was in reimbursement during the period:
| Expense
Limitations | Reimbursement
from adviser |
Class B | 2.40% | $ 2,310 |
Annual Report
8. Expense Reductions - continued
Many of the brokers with whom FMR places trades on behalf of the Fund provided services to the Fund in addition to trade execution. These services included payments of certain expenses on behalf of the Fund totaling $1,069,602 for the period. In addition, through arrangements with each class' transfer agent, credits realized as a result of uninvested cash balances were used to reduce the Fund's expenses. During the period, credits reduced each class' transfer agent expense as noted in the table below.
| Transfer Agent
expense reduction |
Fidelity International Small Cap Opportunities | $ 240 |
9. Other.
The Fund's organizational documents provide former and current trustees and officers with a limited indemnification against liabilities arising in connection with the performance of their duties to the Fund. In the normal course of business, the Fund may also enter into contracts that provide general indemnifications. The Fund's maximum exposure under these arrangements is unknown as this would be dependent on future claims that may be made against the Fund. The risk of material loss from such claims is considered remote.
During the period, the Fund's transfer agent, Fidelity Investments Institutional Operations Company, Inc. (FIIOC), an affiliate of Fidelity Management & Research Company, notified the Fund that the fund's books and records did not reflect a conversion of certain Class B to Class A shares upon their conversion date. Management has determined that this did not have a material impact to the Fund's reported net assets or results of operations in the accompanying financial statements. FIIOC will cause the books and records of the Fund to reflect a conversion of the relevant Class B shares to Class A and is in the process of determining the impact to affected shareholder accounts for purposed of its remediation.
10. Distributions to Shareholders.
Distributions to shareholders of each class were as follows:
Years ended October 31, | 2006 | 2005 |
From net realized gain | | |
Class A | $ 2,067 | $ - |
Fidelity International Small Cap Opportunities | 87,898 | - |
Institutional Class | 992 | - |
Total | $ 90,957 | $ - |
Annual Report
Notes to Financial Statements - continued
11. Share Transactions.
Transactions for each class of shares were as follows:
| Shares | Dollars |
| Year ended
October 31,
2006 | Year ended
October 31,
2005 A | Year ended
October 31,
2006 | Year ended
October 31,
2005 A |
Class A | | | | |
Shares sold | 2,562,140 | 533,911 | $ 35,143,597 | $ 5,543,122 |
Reinvestment of distributions | 162 | - | 1,916 | - |
Shares redeemed | (578,488) | (2,302) | (7,816,655) | (24,252) |
Net increase (decrease) | 1,983,814 | 531,609 | $ 27,328,858 | $ 5,518,870 |
Class T | | | | |
Shares sold | 1,977,012 | 262,396 | $ 27,202,466 | $ 2,707,886 |
Shares redeemed | (233,065) | (1,961) | (3,118,693) | (19,686) |
Net increase (decrease) | 1,743,947 | 260,435 | $ 24,083,773 | $ 2,688,200 |
Class B | | | | |
Shares sold | 498,394 | 169,923 | $ 6,815,227 | $ 1,745,697 |
Shares redeemed | (113,628) | (5,585) | (1,550,424) | (57,751) |
Net increase (decrease) | 384,766 | 164,338 | $ 5,264,803 | $ 1,687,946 |
Class C | | | | |
Shares sold | 1,745,210 | 322,125 | $ 24,032,601 | $ 3,329,826 |
Shares redeemed | (189,077) | (2,373) | (2,515,739) | (24,472) |
Net increase (decrease) | 1,556,133 | 319,752 | $ 21,516,862 | $ 3,305,354 |
Fidelity International Small Cap Opportunities | | | | |
Shares sold | 93,068,555 | 19,620,455 | $ 1,259,777,775 | $ 205,992,728 |
Reinvestment of distributions | 6,974 | - | 82,435 | - |
Shares redeemed | (43,072,008) | (646,558) | (586,736,058) | (6,587,124) |
Net increase (decrease) | 50,003,521 | 18,973,897 | $ 673,124,152 | $ 199,405,604 |
Institutional Class | | | | |
Shares sold | 1,299,662 | 274,003 | $ 17,883,260 | $ 2,804,816 |
Reinvestment of distributions | 83 | - | 980 | - |
Shares redeemed | (592,563) | - | (8,704,985) | - |
Net increase (decrease) | 707,182 | 274,003 | $ 9,179,255 | $ 2,804,816 |
A For the period August 2, 2005 (commencement of operations) to October 31, 2005.
Annual Report
Report of Independent Registered Public Accounting Firm
To the Trustees of Fidelity Investment Trust and Shareholders of Fidelity International Small Cap Opportunities Fund:
We have audited the accompanying statement of assets and liabilities of Fidelity International Small Cap Opportunities Fund (the Fund), a fund of Fidelity Investment Trust, including the schedule of investments as of October 31, 2006, and the related statement of operations for the year then ended, and the statement of changes in net assets, and the financial highlights for the year then ended and for the period August 2, 2005 (commencement of operations) to October 31, 2005. These financial statements and financial highlights are the responsibility of the Fund's management. Our responsibility is to express an opinion on these financial statements and financial highlights based on our audits.
We conducted our audits in accordance with standards of the Public Company Accounting Oversight Board (United States). Those standards require that we plan and perform the audit to obtain reasonable assurance about whether the financial statements and financial highlights are free of material misstatement. The Fund is not required to have, nor were we engaged to perform, an audit of its internal control over financial reporting. Our audits included consideration of internal control over financial reporting as a basis for designing audit procedures that are appropriate in the circumstances, but not for the purpose of expressing an opinion on the effectiveness of the Fund's internal control over financial reporting. Accordingly, we express no such opinion. An audit also includes examining, on a test basis, evidence supporting the amounts and disclosures in the financial statements, assessing the accounting principles used and significant estimates made by management, as well as evaluating the overall financial statement presentation. Our procedures included confirmation of securities owned as of October 31, 2006, by correspondence with the custodians and brokers; where replies were not received from brokers, we performed other auditing procedures. We believe that our audits provide a reasonable basis for our opinion.
In our opinion, the financial statements and financial highlights referred to above present fairly, in all material respects, the financial position of Fidelity International Small Cap Opportunities Fund as of October 31, 2006, the results of its operations for the year then ended, and the changes in its net assets and its financial highlights the year then ended and for the period August 2, 2005 (commencement of operations) to October 31, 2005, in conformity with accounting principles generally accepted in the United States of America.
/s/ Deloitte & Touche LLP
DELOITTE & TOUCHE LLP
Boston, Massachusetts
December 15, 2006
Annual Report
Trustees and Officers
The Trustees, Members of the Advisory Board, and executive officers of the trust and fund, as applicable, are listed below. The Board of Trustees governs the fund and is responsible for protecting the interests of shareholders. The Trustees are experienced executives who meet periodically throughout the year to oversee the fund's activities, review contractual arrangements with companies that provide services to the fund, and review the fund's performance. Except for William O. McCoy, each of the Trustees oversees 348 funds advised by FMR or an affiliate. Mr. McCoy oversees 350 funds advised by FMR or an affiliate.
The Trustees hold office without limit in time except that (a) any Trustee may resign; (b) any Trustee may be removed by written instrument, signed by at least two-thirds of the number of Trustees prior to such removal; (c) any Trustee who requests to be retired or who has become incapacitated by illness or injury may be retired by written instrument signed by a majority of the other Trustees; and (d) any Trustee may be removed at any special meeting of shareholders by a two-thirds vote of the outstanding voting securities of the trust. Each Trustee who is not an interested person (as defined in the 1940 Act) (Independent Trustee), shall retire not later than the last day of the calendar year in which his or her 72nd birthday occurs. The Independent Trustees may waive this mandatory retirement age policy with respect to individual Trustees. The executive officers and Advisory Board Members hold office without limit in time, except that any officer and Advisory Board Member may resign or may be removed by a vote of a majority of the Trustees at any regular meeting or any special meeting of the Trustees. Except as indicated, each individual has held the office shown or other offices in the same company for the past five years.
The fund's Statement of Additional Information (SAI) include more information about the Trustees. To request a free copy, call Fidelity at 1-800-544-8544.
Interested Trustees*:
Correspondence intended for each Trustee who is an interested person may be sent to Fidelity Investments, 82 Devonshire Street, Boston, Massachusetts 02109.
Name, Age; Principal Occupation |
Edward C. Johnson 3d (76) |
| Year of Election or Appointment: 1984 Mr. Johnson is Chairman of the Board of Trustees. Mr. Johnson serves as President (2006-present), Chief Executive Officer, Chairman, and a Director of FMR Corp.; Chairman and a Director of FMR; Chairman and a Director of Fidelity Research & Analysis Company (FRAC); Chairman and a Director of Fidelity Investments Money Management, Inc.; and Chairman (2001-present) and a Director of FMR Co., Inc. In addition, Mr. Johnson serves as Chairman and Director of Fidelity International Limited (FIL). |
Stephen P. Jonas (53) |
| Year of Election or Appointment: 2005 Mr. Jonas is Senior Vice President of International Small Cap Opportunities (2005-present). He also serves as Senior Vice President of other Fidelity funds (2005-present). Mr. Jonas is Executive Director of FMR (2005-present) and FMR Co., Inc. (2005-present). He also serves as a Director of Fidelity Investments Money Management, Inc. (2005-present) and FMR Corp. (2003-present). Previously, Mr. Jonas served as President of Fidelity Enterprise Operations and Risk Services (2004-2005), Chief Administrative Officer (2002-2004), and Chief Financial Officer of FMR Corp. (1998-2002). In addition, he serves on the Boards of Boston Ballet (2003-present) and Simmons College (2003-present). |
Robert L. Reynolds (54) |
| Year of Election or Appointment: 2003 Mr. Reynolds is President and a Director of FMR (2005-present), Fidelity Investments Money Management, Inc. (2005-present), and FMR Co., Inc. (2005-present). Mr. Reynolds also serves as Vice Chairman (2006-present), a Director (2003-present), and Chief Operating Officer of FMR Corp. and a Director of Strategic Advisers, Inc. (2005-present). He also serves on the Board at Fidelity Investments Canada, Ltd. |
* Trustees have been determined to be "Interested Trustees" by virtue of, among other things, their affiliation with the trust or various entities under common control with FMR.
Annual Report
Independent Trustees:
Correspondence intended for each Independent Trustee (that is, the Trustees other than the Interested Trustees) may be sent to Fidelity Investments, P.O. Box 55235, Boston, Massachusetts 02205-5235.
Name, Age; Principal Occupation |
Dennis J. Dirks (58) |
| Year of Election or Appointment: 2005 Prior to his retirement in May 2003, Mr. Dirks was Chief Operating Officer and a member of the Board of The Depository Trust & Clearing Corporation (DTCC) (1999-2003). He also served as President, Chief Operating Officer, and Board member of The Depository Trust Company (DTC) (1999-2003) and President and Board member of the National Securities Clearing Corporation (NSCC) (1999-2003). In addition, Mr. Dirks served as Chief Executive Officer and Board member of the Government Securities Clearing Corporation (2001-2003) and Chief Executive Officer and Board member of the Mortgage-Backed Securities Clearing Corporation (2001-2003). Mr. Dirks also serves as a Trustee and a member of the Finance Committee of Manhattan College (2005-present) and a Trustee and a member of the Finance Committee of AHRC of Nassau County (2006-present). |
Albert R. Gamper, Jr. (64) |
| Year of Election or Appointment: 2006 Prior to his retirement in December 2004, Mr. Gamper served as Chairman of the Board of CIT Group Inc. (commercial finance). During his tenure with CIT Group Inc. Mr. Gamper served in numerous senior management positions, including Chairman (1987-1989; 1999-2001; 2002-2004), Chief Executive Officer (1987-2004), and President (1989-2002). He currently serves as a member of the Board of Directors of Public Service Enterprise Group (utilities, 2001-present), Chairman of the Board of Governors, Rutgers University (2004-present), and Chairman of the Board of Saint Barnabas Health Care System. |
George H. Heilmeier (70) |
| Year of Election or Appointment: 2004 Dr. Heilmeier is Chairman Emeritus of Telcordia Technologies (communication software and systems), where prior to his retirement, he served as company Chairman and Chief Executive Officer. He currently serves on the Boards of Directors of The Mitre Corporation (systems engineering and information technology support for the government), and HRL Laboratories (private research and development, 2004-present). He is Chairman of the General Motors Science & Technology Advisory Board and a Life Fellow of the Institute of Electrical and Electronics Engineers (IEEE). Dr. Heilmeier is a member of the Defense Science Board and the National Security Agency Advisory Board. He is also a member of the National Academy of Engineering, the American Academy of Arts and Sciences, and the Board of Overseers of the School of Engineering and Applied Science of the University of Pennsylvania. Previously, Dr. Heilmeier served as a Director of TRW Inc. (automotive, space, defense, and information technology, 1992-2002), Compaq (1994-2002), Automatic Data Processing, Inc. (ADP) (technology-based business outsourcing, 1995-2002), INET Technologies Inc. (telecommunications network surveillance, 2001-2004), and Teletech Holdings (customer management services). He is the recipient of the 2005 Kyoto Prize in Advanced Technology for his invention of the liquid crystal display, and a member of the Consumer Electronics Hall of Fame. |
Marie L. Knowles (60) |
| Year of Election or Appointment: 2001 Prior to Ms. Knowles' retirement in June 2000, she served as Executive Vice President and Chief Financial Officer of Atlantic Richfield Company (ARCO) (diversified energy, 1996-2000). From 1993 to 1996, she was a Senior Vice President of ARCO and President of ARCO Transportation Company. She served as a Director of ARCO from 1996 to 1998. She currently serves as a Director of Phelps Dodge Corporation (copper mining and manufacturing) and McKesson Corporation (healthcare service, 2002-present). Ms. Knowles is a Trustee of the Brookings Institution and the Catalina Island Conservancy and also serves as a member of the Advisory Board for the School of Engineering of the University of Southern California. |
Ned C. Lautenbach (62) |
| Year of Election or Appointment: 2000 Mr. Lautenbach is Chairman of the Independent Trustees (2006-present). Mr. Lautenbach has been a partner of Clayton, Dubilier & Rice, Inc. (private equity investment firm) since September 1998. Previously, Mr. Lautenbach was with the International Business Machines Corporation (IBM) from 1968 until his retirement in 1998. Mr. Lautenbach serves as a Director of Sony Corporation (2006-present) and Eaton Corporation (diversified industrial) as well as the Philharmonic Center for the Arts in Naples, Florida. He also is a member of the Board of Trustees of Fairfield University (2005-present), as well as a member of the Council on Foreign Relations. |
William O. McCoy (73) |
| Year of Election or Appointment: 1997 Prior to his retirement in December 1994, Mr. McCoy was Vice Chairman of the Board of BellSouth Corporation (telecommunications) and President of BellSouth Enterprises. He is currently a Director of Duke Realty Corporation (real estate). He is also a partner of Franklin Street Partners (private investment management firm). In addition, Mr. McCoy served as the Interim Chancellor (1999-2000) and a member of the Board of Visitors for the University of North Carolina at Chapel Hill and currently serves as Chairman of the Board of Directors of the University of North Carolina Health Care System. He also served as Vice President of Finance for the University of North Carolina (16-school system). |
Cornelia M. Small (62) |
| Year of Election or Appointment: 2005 Ms. Small is a member (2000-present) and Chairperson (2002-present) of the Investment Committee, and a member (2002-present) of the Board of Trustees of Smith College. Previously, she served as Chief Investment Officer (1999-2000), Director of Global Equity Investments (1996-1999), and a member of the Board of Directors of Scudder, Stevens & Clark (1990-1997) and Scudder Kemper Investments (1997-1999). In addition, Ms. Small served as Co-Chair (2000-2003) of the Annual Fund for the Fletcher School of Law and Diplomacy. |
William S. Stavropoulos (67) |
| Year of Election or Appointment: 2001 Mr. Stavropoulos is Chairman Emeritus of the Board of Directors of The Dow Chemical Company. Since joining The Dow Chemical Company in 1967, Mr. Stavropoulos served in numerous senior management positions, including President (1993-2000; 2002-2003), CEO (1995-2000; 2002-2004), and Chairman of the Executive Committee (2000-2004). Currently, he is a Director of NCR Corporation (data warehousing and technology solutions), BellSouth Corporation (telecommunications), Chemical Financial Corporation, Maersk Inc. (industrial conglomerate, 2002-present), and Metalmark Capital (private equity investment firm, 2005-present). He also serves as a member of the Board of Trustees of the American Enterprise Institute for Public Policy Research. In addition, Mr. Stavropoulos is a member of The Business Council, J.P. Morgan International Council and the University of Notre Dame Advisory Council for the College of Science. |
Kenneth L. Wolfe (67) |
| Year of Election or Appointment: 2005 Prior to his retirement in 2001, Mr. Wolfe was Chairman and Chief Executive Officer of Hershey Foods Corporation (1993-2001). He currently serves as a member of the boards of Adelphia Communications Corporation (2003-present), Bausch & Lomb, Inc., and Revlon Inc. (2004-present). |
Advisory Board Members and Executive Officers:
Correspondence intended for Mr. Keyes may be sent to Fidelity Investments, P.O. Box 55235, Boston, Massachusetts 02205-5235. Correspondence intended for each executive officer and Mr. Lynch may be sent to Fidelity Investments, 82 Devonshire Street, Boston, Massachusetts 02109.
Annual Report
Name, Age; Principal Occupation |
James H. Keyes (66) |
| Year of Election or Appointment: 2006 Member of the Advisory Board of Fidelity Investment Trust. Prior to his retirement in 2003, Mr. Keyes was Chairman, President, and Chief Executive Officer of Johnson Controls, Inc. (automotive supplier, 1993-2003). He currently serves as a member of the boards of LSI Logic Corporation (semiconductor technologies), Navistar International Corporation (manufacture and sale of trucks, buses, and diesel engines, 2002-present), and Pitney Bowes, Inc. (integrated mail, messaging, and document management solutions). |
Peter S. Lynch (62) |
| Year of Election or Appointment: 2003 Member of the Advisory Board of Fidelity Investment Trust. Mr. Lynch is Vice Chairman and a Director of FMR, and Vice Chairman (2001-present) and a Director of FMR Co., Inc. Previously, Mr. Lynch served as a Trustee of the Fidelity funds (1990-2003). In addition, he serves as a Trustee of Boston College and as the Chairman of the Inner-City Scholarship Fund. |
Dwight D. Churchill (52) |
| Year of Election or Appointment: 2005 Vice President of International Small Cap Opportunities. Mr. Churchill also serves as Vice President of certain Equity Funds (2005-present). Mr. Churchill is Executive Vice President of FMR (2005-present) and FMR Co., Inc. (2005-present). Previously, Mr. Churchill served as Senior Vice President of Fidelity Investments Money Management, Inc. (2005-2006), Head of Fidelity's Fixed-Income Division (2000-2005), Vice President of Fidelity's Money Market Funds (2000-2005), Vice President of Fidelity's Bond Funds, and Senior Vice President of FMR. |
Eric M. Wetlaufer (44) |
| Year of Election or Appointment: 2006 Vice President of International Small Cap Opportunities. Mr. Wetlaufer also serves as Vice President of certain International Equity Funds (2006-present). Mr. Wetlaufer is Senior Vice President of FMR (2006-present) and FMR Co., Inc. (2006-present), and President and Director of Fidelity Management & Research (U.K.) Inc. (2006-present) and Fidelity Research & Analysis Company (2006-present). Before joining Fidelity Investments in 2005, Mr. Wetlaufer was a partner in Oxhead Capital Management (2004-2005). Previously, Mr. Wetlaufer served as a Chief Investment Officer of Putnam Investments (1997-2003). |
Andrew Sassine (42) |
| Year of Election or Appointment: 2005 Vice President of International Small Cap Opportunities. Mr. Sassine also serves as Vice President for other funds advised by FMR. Prior to his current responsibilities, Mr. Sassine worked as a research analyst and portfolio manager. Mr. Sassine also serves as a Vice President of FMR and FMR Co., Inc. (2006). |
Eric D. Roiter (57) |
| Year of Election or Appointment: 2005 Secretary of International Small Cap Opportunities. He also serves as Secretary of other Fidelity funds; Vice President, General Counsel, and Secretary of FMR Co., Inc. (2001-present) and FMR; Assistant Secretary of Fidelity Management & Research (U.K.) Inc. (2001-present), Fidelity Research & Analysis Company (2001-present), and Fidelity Investments Money Management, Inc. (2001-present). Mr. Roiter is an Adjunct Member, Faculty of Law, at Boston College Law School (2003-present). Previously, Mr. Roiter served as Vice President and Secretary of Fidelity Distributors Corporation (FDC) (1998-2005). |
Stuart Fross (47) |
| Year of Election or Appointment: 2005 Assistant Secretary of International Small Cap Opportunities. Mr. Fross also serves as Assistant Secretary of other Fidelity funds (2003-present), Vice President and Secretary of FDC (2005-present), and is an employee of FMR. |
Christine Reynolds (48) |
| Year of Election or Appointment: 2005 President and Treasurer of International Small Cap Opportunities. Ms. Reynolds also serves as President and Treasurer of other Fidelity funds (2004-present) and is a Vice President (2003-present) and an employee (2002-present) of FMR. Before joining Fidelity Investments, Ms. Reynolds worked at PricewaterhouseCoopers LLP (PwC) (1980-2002), where she was most recently an audit partner with PwC's investment management practice. |
R. Stephen Ganis (40) |
| Year of Election or Appointment: 2006 Anti-Money Laundering (AML) officer of International Small Cap Opportunities. Mr. Ganis also serves as AML officer of other Fidelity funds (2006-present) and FMR Corp. (2003-present). Before joining Fidelity Investments, Mr. Ganis practiced law at Goodwin Procter, LLP (2000-2002). |
Joseph B. Hollis (58) |
| Year of Election or Appointment: 2006 Chief Financial Officer of International Small Cap Opportunities. Mr. Hollis also serves as Chief Financial Officer of other Fidelity funds. Mr. Hollis is President of Fidelity Pricing and Cash Management Services (FPCMS) (2005-present). Mr. Hollis also serves as President and Director of Fidelity Service Company, Inc. (2006-present). Previously, Mr. Hollis served as Senior Vice President of Cash Management Services (1999-2002) and Investment Management Operations (2002-2005). |
Kenneth A. Rathgeber (59) |
| Year of Election or Appointment: 2005 Chief Compliance Officer of International Small Cap Opportunities. Mr. Rathgeber also serves as Chief Compliance Officer of other Fidelity funds (2004-present) and Executive Vice President of Risk Oversight for Fidelity Investments (2002-present). He is Chief Compliance Officer of FMR (2005-present), FMR Co., Inc. (2005-present), Fidelity Management & Research (U.K.) Inc. (2005-present), Fidelity Research & Analysis Company (2005-present), Fidelity Investments Money Management, Inc. (2005-present), and Strategic Advisers, Inc. (2005-present). Previously, Mr. Rathgeber served as Executive Vice President and Chief Operating Officer for Fidelity Investments Institutional Services Company, Inc. (1998-2002). |
Bryan A. Mehrmann (45) |
| Year of Election or Appointment: 2005 Deputy Treasurer of International Small Cap Opportunities. Mr. Mehrmann also serves as Deputy Treasurer of other Fidelity funds (2005-present) and is an employee of FMR. Previously, Mr. Mehrmann served as Vice President of Fidelity Investments Institutional Services Group (FIIS)/Fidelity Investments Institutional Operations Corporation, Inc. (FIIOC) Client Services (1998-2004). |
Kimberley H. Monasterio (43) |
| Year of Election or Appointment: 2005 Deputy Treasurer of International Small Cap Opportunities. Ms. Monasterio also serves as Deputy Treasurer of other Fidelity funds (2004) and is an employee of FMR (2004). Before joining Fidelity Investments, Ms. Monasterio served as Treasurer (2000-2004) and Chief Financial Officer (2002-2004) of the Franklin Templeton Funds and Senior Vice President of Franklin Templeton Services, LLC (2000-2004). |
Kenneth B. Robins (37) |
| Year of Election or Appointment: 2005 Deputy Treasurer of International Small Cap Opportunities. Mr. Robins also serves as Deputy Treasurer of other Fidelity funds (2005-present) and is an employee of FMR (2004-present). Before joining Fidelity Investments, Mr. Robins worked at KPMG LLP, where he was a partner in KPMG's department of professional practice (2002-2004) and a Senior Manager (1999-2000). In addition, Mr. Robins served as Assistant Chief Accountant, United States Securities and Exchange Commission (2000-2002). |
Robert G. Byrnes (39) |
| Year of Election or Appointment: 2005 Assistant Treasurer of International Small Cap Opportunities. Mr. Byrnes also serves as Assistant Treasurer of other Fidelity funds (2005-present) and is an employee of FMR (2005-present). Previously, Mr. Byrnes served as Vice President of FPCMS (2003-2005). Before joining Fidelity Investments, Mr. Byrnes worked at Deutsche Asset Management where he served as Vice President of the Investment Operations Group (2000-2003). |
John H. Costello (60) |
| Year of Election or Appointment: 2005 Assistant Treasurer of International Small Cap Opportunities. Mr. Costello also serves as Assistant Treasurer of other Fidelity funds and is an employee of FMR. |
Peter L. Lydecker (52) |
| Year of Election or Appointment: 2005 Assistant Treasurer of International Small Cap Opportunities. Mr. Lydecker also serves as Assistant Treasurer of other Fidelity funds (2004) and is an employee of FMR. |
Mark Osterheld (51) |
| Year of Election or Appointment: 2005 Assistant Treasurer of International Small Cap Opportunities. Mr. Osterheld also serves as Assistant Treasurer of other Fidelity funds (2002) and is an employee of FMR. |
Gary W. Ryan (48) |
| Year of Election or Appointment: 2005 Assistant Treasurer of International Small Cap Opportunities. Mr. Ryan also serves as Assistant Treasurer of other Fidelity funds (2005-present) and is an employee of FMR (2005-present). Previously, Mr. Ryan served as Vice President of Fund Reporting in FPCMS (1999-2005). |
Salvatore Schiavone (40) |
| Year of Election or Appointment: 2005 Assistant Treasurer of International Small Cap Opportunities. Mr. Schiavone also serves as Assistant Treasurer of other Fidelity funds (2005-present) and is an employee of FMR (2005-present). Before joining Fidelity Investments, Mr. Schiavone worked at Deutsche Asset Management, where he most recently served as Assistant Treasurer (2003-2005) of the Scudder Funds and Vice President and Head of Fund Reporting (1996-2003). |
Annual Report
Distributions
The fund designates 100% of the dividends distributed during the fiscal year as amounts which may be taken into account as a dividend for purposes of the maximum rate under section 1(h)(11) of the Internal Revenue Code.
The amounts per share which represent income derived from sources within, and taxes paid to, foreign countries or possessions of the United States are $.004 and $.001 for the dividend paid within the current fiscal year, ending October 31, 2006.
The fund will notify shareholders in January 2007 of amounts for use in preparing 2006 income tax returns.
Annual Report
Board Approval of Investment Advisory Contracts and Management Fees
Fidelity International Small Cap Opportunities Fund
Each year, typically in July, the Board of Trustees, including the Independent Trustees (together, the Board), votes on the renewal of the management contract and sub-advisory agreements (together, the Advisory Contracts) for the fund. The Board, assisted by the advice of fund counsel and Independent Trustees' counsel, requests and considers a broad range of information throughout the year.
The Board meets regularly each month except August and takes into account throughout the year matters bearing on Advisory Contracts. The Board, acting directly and through its separate committees, considers at each of its meetings factors that are relevant to the annual renewal of the fund's Advisory Contracts, including the services and support provided to the fund and its shareholders. At the time of the renewal, the Board had 12 standing committees, each composed of Independent Trustees with varying backgrounds, to which the Board has assigned specific subject matter responsibilities in order to enhance effective decision-making by the Board. Each committee has adopted a written charter outlining the structure and purposes of the committee. One such committee, the Equity Contract Committee, meets periodically as needed throughout the year to consider matters specifically related to the annual renewal of Advisory Contracts. The committee requests and receives information on, and makes recommendations to the Independent Trustees concerning, the approval and annual review of the Advisory Contracts.
At its July 2006 meeting, the Board of Trustees, including the Independent Trustees, unanimously determined to renew the Advisory Contracts for the fund. In reaching its determination, the Board considered all factors it believed relevant, including (i) the nature, extent, and quality of the services to be provided to the fund and its shareholders (including the investment performance of the fund); (ii) the competitiveness of the management fee and total expenses of the fund; (iii) the total costs of the services to be provided by and the profits to be realized by the investment adviser and its affiliates from the relationship with the fund; (iv) the extent to which economies of scale would be realized as the fund grows; and (v) whether fee levels reflect these economies of scale, if any, for the benefit of fund shareholders.
In determining whether to renew the Advisory Contracts for the fund, the Board ultimately reached a determination, with the assistance of fund counsel and Independent Trustees' counsel, that the renewal of the Advisory Contracts and the compensation to be received by Fidelity under the management contract is consistent with Fidelity's fiduciary duty under applicable law. In addition to evaluating the specific factors noted above, the Board, in reaching its determination, is aware that shareholders in the fund have a broad range of investment choices available to them, including a wide choice among mutual funds offered by competitors to Fidelity, and that the fund's shareholders, with the opportunity to review and weigh the disclosure provided by the fund in its prospectus and other public disclosures, have chosen to invest in this fund, managed by Fidelity.
Annual Report
Board Approval of Investment Advisory Contracts and
Management Fees - continued
Nature, Extent, and Quality of Services Provided. The Board considered staffing within the investment adviser, FMR, and the sub-advisers (together, the Investment Advisers), including the background of the fund's portfolio manager and the fund's investment objective and discipline. The Independent Trustees also had discussions with senior management of Fidelity's investment operations and investment groups. The Board considered the structure of the portfolio manager compensation program and whether this structure provides appropriate incentives.
Resources Dedicated to Investment Management and Support Services. The Board reviewed the size, education, and experience of the Investment Advisers' investment staff, their use of technology, and the Investment Advisers' approach to recruiting, training, and retaining portfolio managers and other research, advisory, and management personnel. The Board considered Fidelity's extensive global research capabilities that enable the Investment Advisers to aggregate data from various sources in an effort to produce positive investment results. The Board noted that Fidelity's analysts have access to a variety of technological tools that enable them to perform both fundamental and quantitative analysis and to specialize in various disciplines. The Board also considered that Fidelity's portfolio managers and analysts have access to daily portfolio attribution that allows for monitoring of a fund's portfolio, as well as an electronic communication system that provides immediate real-time access to research concerning issuers and credit enhancers.
Shareholder and Administrative Services. The Board considered (i) the nature, extent, quality, and cost of administrative, distribution, and shareholder services performed by the Investment Advisers and their affiliates under the Advisory Contracts and under separate agreements covering transfer agency, pricing and bookkeeping, and securities lending services for the fund; (ii) the nature and extent of the Investment Advisers' supervision of third party service providers, principally custodians and subcustodians; and (iii) the resources devoted to, and the record of compliance with, the fund's compliance policies and procedures. The Board reviewed the allocation of fund brokerage, including allocations to brokers affiliated with the Investment Advisers, the use of brokerage commissions to pay fund expenses, and the use of "soft" commission dollars to pay for research services. The Board also considered that Fidelity voluntarily pays for market data out of its own resources.
The Board noted that the growth of fund assets across the complex allows Fidelity to reinvest in the development of services designed to enhance the value or convenience of the Fidelity funds as investment vehicles. These services include 24-hour access to account information and market information through phone representatives and over the Internet, and investor education materials and asset allocation tools.
Annual Report
Investment in a Large Fund Family. The Board considered the benefits to shareholders of investing in a Fidelity fund, including the benefits of investing in a fund that is part of a large family of funds offering a variety of investment disciplines and providing for a large variety of mutual fund investor services. For example, fund shareholders are offered the privilege of exchanging shares of the fund for shares of other Fidelity funds, as set forth in the fund's prospectus, without paying an additional sales charge. The Board noted that, since July 2005, Fidelity has taken a number of actions that benefited particular funds, including (i) dedicating additional resources to investment research and to restructure the investment research teams; (ii) voluntarily entering into contractual arrangements with certain brokers pursuant to which Fidelity pays for research products and services separately out of its own resources, rather than bundling with fund commissions; (iii) launching the Fidelity Advantage Class of its five Spartan stock index funds and three Spartan bond index funds, which is a lower-fee class available to shareholders with higher account balances; (iv) contractually agreeing to impose expense limitations on Fidelity U.S. Bond Index Fund and reducing the fund's initial investment minimum; and (v) offering shareholders of each of the Fidelity Institutional Money Market Funds the privilege of exchanging shares of the fund for shares of other Fidelity funds
Investment Performance and Compliance. The Board considered whether the fund has operated within its investment objective, as well as its record of compliance with its investment restrictions. The Board noted that it is not possible to evaluate performance in any comprehensive fashion because the fund had been in operation for less than one calendar year. Once the fund has been in operation for at least one calendar year, the Board will review the fund's absolute investment performance for each class, as well as the fund's relative investment performance for each class measured against a broad-based securities market index and a peer group of mutual funds.
The Board considered that FMR has taken steps to refocus and strengthen equity research, equity portfolio management, and compliance. The Board noted with favor FMR's reorganization of its senior management team in 2005 and FMR's dedication of additional resources to investment research, and participated in the process that led to those changes.
Based on its review, and giving particular weight to the nature and quality of the resources dedicated by the Investment Advisers to maintain and improve relative performance, the Board concluded that the nature, extent, and quality of the services provided to the fund will benefit the fund's shareholders, particularly in light of the Board's view that the fund's shareholders benefit from investing in a fund that is part of a large family of funds offering a variety of investment disciplines and services.
Competitiveness of Management Fee and Total Fund Expenses. The Board considered the fund's management fee and total expenses compared to "mapped groups" of competitive funds and classes. Fidelity creates "mapped groups" by combining similar Lipper investment objective categories that have comparable management fee characteristics. Combining Lipper investment objective categories aids the Board's management fee and total expense comparisons by broadening the competitive group used for comparison and by reducing the number of universes to which various Fidelity funds are compared.
Annual Report
Board Approval of Investment Advisory Contracts and
Management Fees - continued
The Board considered two proprietary management fee comparisons for the period of the fund's operations shown in the chart below. The group of Lipper funds used by the Board for management fee comparisons is referred to below as the "Total Mapped Group" and, for the reasons explained above, is broader than the Lipper peer group used by the Board for performance comparisons. The Total Mapped Group comparison focuses on a fund's standing relative to the total universe of comparable funds available to investors, in terms of gross management fees before expense reimbursements or caps. "TMG %" represents the percentage of funds in the Total Mapped Group that had management fees that were lower than the fund's. For example, a TMG % of 38% means that 62% of the funds in the Total Mapped Group had higher management fees than the fund. The "Asset-Size Peer Group" (ASPG) comparison focuses on a fund's standing relative to non-Fidelity funds similar in size to the fund within the Total Mapped Group. The ASPG represents at least 15% of the funds in the Total Mapped Group with comparable asset size and management fee characteristics, subject to a minimum of 50 funds (or all funds in the Total Mapped Group if fewer than 50). Additional information, such as the ASPG quartile in which the fund's management fee ranked, is also included in the chart and considered by the Board.
Fidelity International Small Cap Opportunities Fund

Annual Report
The Board noted that the fund's management fee ranked below the median of its Total Mapped Group and below the median of its ASPG for the period.
Based on its review, the Board concluded that the fund's management fee was fair and reasonable in light of the services that the fund receives and the other factors considered.
In its review of each class's total expenses, the Board considered the fund's management fee as well as other fund or class expenses, as applicable, such as transfer agent fees, pricing and bookkeeping fees, fund-paid 12b-1 fees, and custodial, legal, and audit fees. The Board also noted the effects of any waivers and reimbursements on fees and expenses. As part of its review, the Board also considered current and historical total expenses of each class of the fund compared to competitive fund median expenses. Each class of the fund is compared to those funds and classes in the Total Mapped Group (used by the Board for management fee comparisons) that have a similar sales load structure.
The Board noted that the total expenses of Fidelity International Small Cap Opportunities (retail class) ranked equal to its competitive median for the period, and the total expenses of each of Class A, Class B, Class C, Class T and Institutional Class ranked above its competitive median for the period. The Board considered that the fund commenced operations in August 2005 and that the Advisor classes were above median primarily because of relatively high expenses in basis points due to small fund size. The Board noted that the fund offers multiple classes, each of which has a different sales load and 12b-1 fee structure, and that the multiple structures are intended to offer a range of pricing options for the intermediary market. The Board also noted that the total expenses of the classes vary primarily by the level of their 12b-1 fees, although differences in transfer agent fees may also cause expenses to vary from class to class.
In its review of total expenses, the Board also considered Fidelity fee structures and other information on clients that FMR and its affiliates service in other competitive markets, such as other mutual funds advised or subadvised by FMR or its affiliates, pension plan clients, and other institutional clients.
Based on its review, the Board concluded that the total expenses of each class of the fund were reasonable, although in some cases above the median of the universe presented for comparison, in light of the services that the fund and its shareholders receive and the other factors considered.
Costs of the Services and Profitability. The Board considered the revenues earned and the expenses incurred by Fidelity in conducting the business of developing, marketing, distributing, managing, administering and servicing the fund and its shareholders. The Board also considered the level of Fidelity's profits in respect of all the Fidelity funds.
Annual Report
Board Approval of Investment Advisory Contracts and
Management Fees - continued
On an annual basis, FMR presents to the Board Fidelity's profitability for the fund. Fidelity calculates the profitability for each fund, as well as aggregate profitability for groups of Fidelity funds and all Fidelity funds, using a series of detailed revenue and cost allocation methodologies which originate with the audited books and records of Fidelity. The Audit Committee of the Board reviews any significant changes from the prior year's methodologies.
PricewaterhouseCoopers LLP (PwC), independent registered accounting firm and auditor to Fidelity and certain Fidelity funds, has been engaged annually by the Board as part of the Board's assessment of the results of Fidelity's profitability analysis. PwC's engagement includes the review and assessment of Fidelity's methodologies used in determining the revenues and expenses attributable to Fidelity's mutual fund business, and completion of agreed-upon procedures surrounding the mathematical accuracy of fund profitability and its conformity to allocation methodologies. After considering PwC's reports issued under the engagement and information provided by Fidelity, the Board believes that while other allocation methods may also be reasonable, Fidelity's profitability methodologies are reasonable in all material respects.
The Board has also reviewed Fidelity's non-fund businesses and any fall-out benefits related to the mutual fund business as well as cases where Fidelity's affiliates may benefit from or be related to the fund's business.
The Board considered the costs of the services provided by and the profits realized by Fidelity in connection with the operation of the fund and determined that the amount of profit is a fair entrepreneurial profit for the management of the fund.
Economies of Scale. The Board considered whether there have been economies of scale in respect of the management of the Fidelity funds, whether the Fidelity funds (including the fund) have appropriately benefited from any such economies of scale, and whether there is potential for realization of any further economies of scale. The Board considered the extent to which the fund will benefit from economies of scale through increased services to the fund, through waivers or reimbursements, or through fee or expense reductions, including reductions that occur through operation of the transfer agent agreement. The transfer agent fee varies in part based on the number of accounts in the fund. If the number of accounts decreases or the average account size increases, the overall transfer agent fee rate decreases.
The Board recognized that the fund's management contract incorporates a "group fee" structure, which provides for lower fee rates as total fund assets under FMR's management increase, and for higher fee rates as total fund assets under FMR's management decrease. The Board considered that the group fee is designed to deliver the benefits of economies of scale to fund shareholders when total fund assets increase, even if assets of any particular fund are unchanged or have declined, because some portion of Fidelity's costs are attributable to services provided to all Fidelity funds, and all funds benefit if those costs can be allocated among more assets. The Board concluded that, given the group fee structure, fund shareholders will achieve a certain level of economies of scale as assets under FMR's management increase at the fund complex level, regardless of whether Fidelity achieves any such economies of scale.
Annual Report
The Board further concluded that any potential economies of scale are being shared between fund shareholders and Fidelity in an appropriate manner.
Additional Information Requested by the Board. In order to develop fully the factual basis for consideration of the Advisory Contracts, the Board requested additional information on several topics, including (i) Fidelity's fund profitability methodology and profitability trends within certain funds; (ii) portfolio manager compensation; (iii) the extent to which any economies of scale exist and are shared between the funds and Fidelity; (iv) the total expenses of certain funds and classes relative to competitors, including the extent to which the expenses of certain funds have been or could be capped; (v) fund performance trends; and (vi) Fidelity's fee structures, including use of performance fees.
Based on its evaluation of all of the conclusions noted above, and after considering all material factors, the Board ultimately concluded that the advisory fee structures are fair and reasonable, and that the fund's Advisory Contracts should be renewed.
Annual Report
Managing Your Investments
Fidelity offers several ways to conveniently manage your personal investments via your telephone or PC. You can access your account information, conduct trades and research your investments 24 hours a day.
By Phone
Fidelity Automated Service Telephone provides a single toll-free number to access account balances, positions, quotes and trading. It's easy to navigate the service, and on your first call, the system will help you create a personal identification number (PIN) for security.
(phone_graphic)Fidelity Automated
Service Telephone (FAST®)
1-800-544-5555
Press
1 For mutual fund and brokerage trading.
2 For quotes.*
3 For account balances and holdings.
4 To review orders and mutual
fund activity.
5 To change your PIN.
*0 To speak to a Fidelity representative.
By PC
Fidelity's web site on the Internet provides a wide range of information, including daily financial news, fund performance, interactive planning tools and news about Fidelity products and services.
(computer_graphic)Fidelity's Web Site
www.fidelity.com
* When you call the quotes line, please remember that a fund's yield and return will vary and, except for money market funds, share price will also vary. This means that you may have a gain or loss when you sell your shares. There is no assurance that money market funds will be able to maintain a stable $1 share price; an investment in a money market fund is not insured or guaranteed by the U.S. government. Total returns are historical and include changes in share price, reinvestment of dividends and capital gains, and the effects of any sales charges.
Annual Report
To Visit Fidelity
For directions and hours,
please call 1-800-544-9797.
Arizona
7001 West Ray Road
Chandler, AZ
15445 N. Scottsdale Road
Scottsdale, AZ
California
815 East Birch Street
Brea, CA
1411 Chapin Avenue
Burlingame, CA
851 East Hamilton Avenue
Campbell, CA
19200 Von Karman Avenue
Irvine, CA
601 Larkspur Landing Circle
Larkspur, CA
10100 Santa Monica Blvd.
Los Angeles, CA
27101 Puerta Real
Mission Viejo, CA
73-575 El Paseo
Palm Desert, CA
251 University Avenue
Palo Alto, CA
123 South Lake Avenue
Pasadena, CA
16995 Bernardo Ctr. Drive
Rancho Bernardo, CA
1220 Roseville Parkway
Roseville, CA
1740 Arden Way
Sacramento, CA
7676 Hazard Center Drive
San Diego, CA
11943 El Camino Real
San Diego, CA
8 Montgomery Street
San Francisco, CA
3793 State Street
Santa Barbara, CA
1200 Wilshire Boulevard
Santa Monica, CA
21701 Hawthorne Boulevard
Torrance, CA
2001 North Main Street
Walnut Creek, CA
6300 Canoga Avenue
Woodland Hills, CA
Colorado
1625 Broadway
Denver, CO
9185 Westview Road
Lone Tree, CO
Connecticut
48 West Putnam Avenue
Greenwich, CT
265 Church Street
New Haven, CT
300 Atlantic Street
Stamford, CT
29 South Main Street
West Hartford, CT
Delaware
400 Delaware Avenue
Wilmington, DE
Florida
4400 N. Federal Highway
Boca Raton, FL
121 Alhambra Plaza
Coral Gables, FL
2948 N. Federal Highway
Ft. Lauderdale, FL
4671 Town Center Parkway
Jacksonville, FL
1907 West State Road 434
Longwood, FL
8880 Tamiami Trail, North
Naples, FL
3501 PGA Boulevard
Palm Beach Gardens, FL
3550 Tamiami Trail, South
Sarasota, FL
1502 N. Westshore Blvd.
Tampa, FL
2465 State Road 7
Wellington, FL
Georgia
3445 Peachtree Road, N.E.
Atlanta, GA
1000 Abernathy Road
Atlanta, GA
Illinois
One North LaSalle Street
Chicago, IL
875 North Michigan Ave.
Chicago, IL
1415 West 22nd Street
Oak Brook, IL
1572 East Golf Road
Schaumburg, IL
3232 Lake Avenue
Wilmette, IL
Indiana
4729 East 82nd Street
Indianapolis, IN
Kansas
5400 College Boulevard
Overland Park, KS
Maine
Three Canal Plaza
Portland, ME
Maryland
7315 Wisconsin Avenue
Bethesda, MD
One W. Pennsylvania Ave.
Towson, MD
Massachusetts
801 Boylston Street
Boston, MA
155 Congress Street
Boston, MA
300 Granite Street
Braintree, MA
44 Mall Road
Burlington, MA
238 Main Street
Cambridge, MA
405 Cochituate Road
Framingham, MA
416 Belmont Street
Worcester, MA
Annual Report
Fidelity Brokerage Services, Inc., 100 Summer St., Boston, MA 02110 Member NYSE/SIPC
Michigan
500 E. Eisenhower Pkwy.
Ann Arbor, MI
280 Old N. Woodward Ave.
Birmingham, MI
43420 Grand River Avenue
Novi, MI
29155 Northwestern Hwy.
Southfield, MI
Minnesota
7600 France Avenue South
Edina, MN
Missouri
1524 South Lindbergh Blvd.
St. Louis, MO
Nevada
2225 Village Walk Drive
Henderson, NV
New Jersey
150 Essex Street
Millburn, NJ
56 South Street
Morristown, NJ
396 Route 17, North
Paramus, NJ
3518 Route 1 North
Princeton, NJ
530 Broad Street
Shrewsbury, NJ
New York
1055 Franklin Avenue
Garden City, NY
37 West Jericho Turnpike
Huntington Station, NY
1271 Avenue of the Americas
New York, NY
980 Madison Avenue
New York, NY
61 Broadway
New York, NY
350 Park Avenue
New York, NY
200 Fifth Avenue
New York, NY
733 Third Avenue
New York, NY
11 Penn Plaza
New York, NY
2070 Broadway
New York, NY
1075 Northern Blvd.
Roslyn, NY
799 Central Park Avenue
Scarsdale, NY
North Carolina
4611 Sharon Road
Charlotte, NC
7011 Fayetteville Road
Durham, NC
Ohio
3805 Edwards Road
Cincinnati, OH
1324 Polaris Parkway
Columbus, OH
28699 Chagrin Boulevard
Woodmere Village, OH
Oregon
7493 SW Bridgeport Road
Tigard, OR
Pennsylvania
600 West DeKalb Pike
King of Prussia, PA
1735 Market Street
Philadelphia, PA
12001 Perry Highway
Wexford, PA
Rhode Island
47 Providence Place
Providence, RI
Tennessee
6150 Poplar Avenue
Memphis, TN
Texas
10000 Research Boulevard
Austin, TX
4001 Northwest Parkway
Dallas, TX
12532 Memorial Drive
Houston, TX
2701 Drexel Drive
Houston, TX
6560 Fannin Street
Houston, TX
6500 N. MacArthur Blvd.
Irving, TX
6005 West Park Boulevard
Plano, TX
14100 San Pedro
San Antonio, TX
1576 East Southlake Blvd.
Southlake, TX
19740 IH 45 North
Spring, TX
Utah
279 West South Temple
Salt Lake City, UT
Virginia
1861 International Drive
McLean, VA
Washington
411 108th Avenue, N.E.
Bellevue, WA
1518 6th Avenue
Seattle, WA
Washington, DC
1900 K Street, N.W.
Washington, DC
Wisconsin
595 North Barker Road
Brookfield, WI
Annual Report
To Write Fidelity
We'll give your correspondence immediate attention and send you written confirmation upon completion of your request.
(letter_graphic)Making Changes
To Your Account
(such as changing name, address, bank, etc.)
Fidelity Investments
P.O. Box 770001
Cincinnati, OH 45277-0002
(letter_graphic)For Non-Retirement
Accounts
Buying shares
Fidelity Investments
P.O. Box 770001
Cincinnati, OH 45277-0003
Overnight Express
Fidelity Investments
Attn: Distribution Services
100 Crosby Parkway - KC1H
Covington, KY 41015
Selling shares
Fidelity Investments
P.O. Box 770001
Cincinnati, OH 45277-0035
Overnight Express
Fidelity Investments
Attn: Distribution Services
100 Crosby Parkway - KC1H
Covington, KY 41015
General Correspondence
Fidelity Investments
P.O. Box 500
Merrimack, NH 03054-0500
(letter_graphic)For Retirement
Accounts
Buying shares
Fidelity Investments
P.O. Box 770001
Cincinnati, OH 45277-0003
Selling shares
Fidelity Investments
P.O. Box 770001
Cincinnati, OH 45277-0035
Overnight Express
Fidelity Investments
Attn: Distribution Services
100 Crosby Parkway - KC1H
Covington, KY 41015
General Correspondence
Fidelity Investments
P.O. Box 500
Merrimack, NH 03054-0500
Annual Report
Annual Report
Annual Report
Annual Report
Investment Adviser
Fidelity Management & Research Company
Boston, MA
Investment Sub-Advisers
FMR Co., Inc.
Fidelity Research & Analysis Company
(formerly Fidelity Management &
Research (Far East) Inc.)
Fidelity Management & Research
(U.K.) Inc.
Fidelity Investments Japan Limited
Fidelity International Investment
Advisors
Fidelity International Investment
Advisors (U.K.) Limited
General Distributor
Fidelity Distributors Corporation
Boston, MA
Transfer and Service Agent
Fidelity Service Company, Inc.
Boston, MA
Custodian
The Northern Trust Company
Chicago, IL
The Fidelity Telephone Connection
Mutual Fund 24-Hour Service
Exchanges/Redemptions
and Account Assistance 1-800-544-6666
Product Information 1-800-544-6666
Retirement Accounts 1-800-544-4774
(8 a.m. - 9 p.m.)
TDD Service 1-800-544-0118
for the deaf and hearing impaired
(9 a.m. - 9 p.m. Eastern time)
Fidelity Automated Service
Telephone (FAST®) (automated graphic) 1-800-544-5555
(automated graphic) Automated line for quickest service
(Fidelity Investment logo)(registered trademark)
Corporate Headquarters
82 Devonshire St., Boston, MA 02109
www.fidelity.com
ILS-UANN-1206
1.815061.102
(Fidelity Investment logo)(registered trademark)
Fidelity Advisor
International Small Cap Opportunities
Fund - Class A, Class T, Class B
and Class C
Annual Report
October 31, 2006
(2_fidelity_logos) (Registered_Trademark)
Class A, Class T, Class B
and Class C are classes of
Fidelity® International
Small Cap Opportunities Fund
Contents
Chairman's Message | 4 | Ned Johnson's message to shareholders. |
Performance | 5 | How the fund has done over time. |
Management's Discussion | 7 | The manager's review of fund performance, strategy and outlook. |
Shareholder Expense Example | 8 | An example of shareholder expenses. |
Investment Changes | 10 | A summary of major shifts in the fund's investments over the past six months. |
Investments | 12 | A complete list of the fund's investments with their market values. |
Financial Statements | 18 | Statements of assets and liabilities, operations, and changes in net assets,
as well as financial highlights. |
Notes | 28 | Notes to the financial statements. |
Report of Independent Registered Public Accounting Firm | 38 | |
Trustees and Officers | 39 | |
Distributions | 50 | |
Board Approval of Investment Advisory Contracts and Management Fees | 51 | |
To view a fund's proxy voting guidelines and proxy voting record for the 12-month period ended June 30, visit www.fidelity.com/proxyvotingresults or visit the Securities and Exchange Commission's (SEC) web site at www.sec.gov. You may also call 1-877-208-0098 to request a free copy of the proxy voting guidelines.
Standard & Poor's, S&P and S&P 500 are registered service marks of The McGraw-Hill Companies, Inc. and have been licensed for use by Fidelity Distributors Corporation.
Other third party marks appearing herein are the property of their respective owners.
All other marks appearing herein are registered or unregistered trademarks or service marks of FMR Corp. or an affiliated company.
Annual Report
This report and the financial statements contained herein are submitted for the general information of the shareholders of the fund. This report is not authorized for distribution to prospective investors in the fund unless preceded or accompanied by an effective prospectus.
A fund files its complete schedule of portfolio holdings with the SEC for the first and third quarters of each fiscal year on Form N-Q. Forms N-Q are available on the SEC's web site at http://www.sec.gov. A fund's Forms N-Q may be reviewed and copied at the SEC's Public Reference Room in Washington, DC. Information regarding the operation of the SEC's Public Reference Room may be obtained by calling 1-800-SEC-0330. For a complete list of a fund's portfolio holdings, view the most recent quarterly holdings report, semiannual report, or annual report on Fidelity's web site at http://www.advisor.fidelity.com.
NOT FDIC INSURED · MAY LOSE VALUE · NO BANK GUARANTEE
Neither the fund nor Fidelity Distributors Corporation is a bank.
Annual Report
Chairman's Message
(photo_of_Edward_C_Johnson_3d)
Dear Shareholder:
Stock and bond markets around the world have seen largely positive results year to date, although weakness in the technology sector and growth stocks in general have tempered performance. While financial markets are always unpredictable, there are a number of time-tested principles that can put the historical odds in your favor.
One of the basic tenets is to invest for the long term. Over time, riding out the markets' inevitable ups and downs has proven much more effective than selling into panic or chasing the hottest trend. Even missing only a few of the markets' best days can significantly diminish investor returns. Patience also affords the benefits of compounding - of earning interest on additional income or reinvested dividends and capital gains. There are tax advantages and cost benefits to consider as well. The more you sell, the more taxes you pay, and the more you trade, the higher the costs. While staying the course doesn't eliminate risk, it can considerably lessen the effect of short-term declines.
You can further manage your investing risk through diversification. And today, more than ever, geographic diversification should be taken into account. Studies indicate that asset allocation is the single most important determinant of a portfolio's long-term success. The right mix of stocks, bonds and cash - aligned to your particular risk tolerance and investment objective - is very important. Age-appropriate rebalancing is also an essential aspect of asset allocation. For younger investors, an emphasis on equities - which historically have been the best performing asset class over time - is encouraged. As investors near their specific goal, such as retirement or sending a child to college, consideration may be given to replacing volatile assets (e.g. common stocks) with more-stable fixed investments (bonds or savings plans).
A third investment principle - investing regularly - can help lower the average cost of your purchases. Investing a certain amount of money each month or quarter helps ensure you won't pay for all your shares at market highs. This strategy - known as dollar cost averaging - also reduces unconstructive "emotion" from investing, helping shareholders avoid selling weak performers just prior to an upswing, or chasing a hot performer just before a correction.
We invite you to contact us via the Internet, through our Investor Centers or over the phone. It is our privilege to provide you the information you need to make the investments that are right for you.
Sincerely,
/s/Edward C. Johnson 3d
Edward C. Johnson 3d
Annual Report
Performance: The Bottom Line
Average annual total return reflects the change in the value of an investment, assuming reinvestment of the class' dividend income and capital gains (the profits earned upon the sale of securities that have grown in value) and assuming a constant rate of performance each year. The $10,000 table and the fund's returns do not reflect the deduction of taxes that a shareholder would pay on fund distributions or the redemption of fund shares. During periods of reimbursement by Fidelity, a fund's total return will be greater than it would be had the reimbursement not occurred. How a fund did yesterday is no guarantee of how it will do tomorrow.
Average Annual Total Returns
Periods ended October 31, 2006 | | Past 1
year | Life of
fund A |
Class A (incl. 5.75% sales charge) | | 28.42% | 26.21% |
Class T (incl. 3.50% sales charge) | | 31.27% | 28.16% |
Class B (incl. contingent deferred sales charge) B | | 30.39% | 28.27% |
Class C (incl. contingent deferred sales charge) C | | 34.29% | 31.20% |
A From August 2, 2005.
B Class B shares' contingent deferred sales charges included in the past one year and life of fund total return figures are 5% and 4%, respectively.
C Class C shares' contingent deferred sales charge included in the past one year and life of fund total return figures are 1% and 0%, respectively.
Annual Report
Fidelity Advisor International Small Cap Opportunities Fund -
Class A, T, B, and C
Performance - continued
$10,000 Over Life of Fund
Let's say hypothetically that $10,000 was invested in Fidelity Advisor International Small Cap Opportunities Fund - Class T on August 2, 2005, when the fund started, and the current 3.50% sales charge was paid. The chart shows how the value of your investment would have changed, and also shows how the Morgan Stanley Capital InternationalSM Europe, Australia, Far East (MSCI® EAFE® ) Small Cap Index performed over the same period.
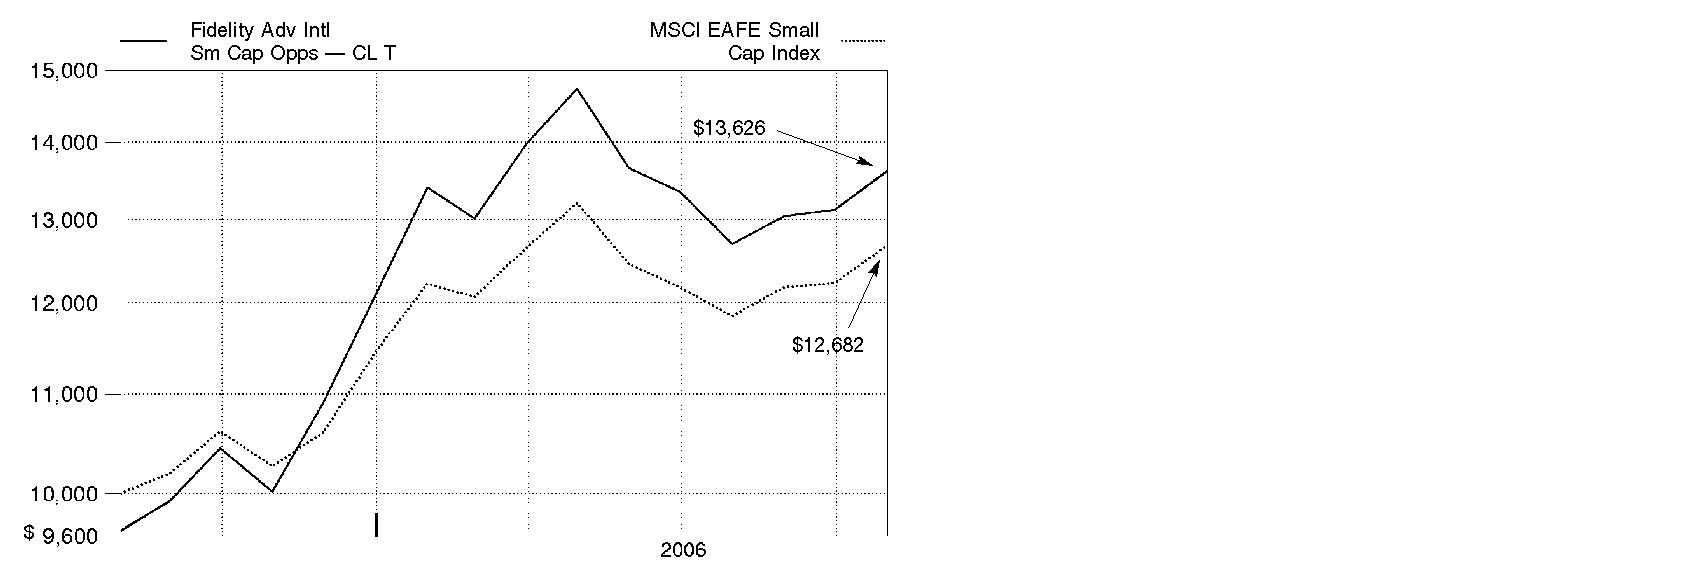
Annual Report
Management's Discussion of Fund Performance
Comments from Andrew Sassine, Portfolio Manager of Fidelity Advisor International Small Cap Opportunities Fund
International equity markets as a whole outpaced their U.S. counterparts for the 12 months ending October 31, 2006 - partly as a result of favorable currency exchanges that boosted returns for U.S. investors. The Morgan Stanley Capital InternationalSM Europe, Australasia, Far East (MSCI® EAFE®) Index - a gauge of developed stock markets outside the United States and Canada - gained 27.72% during that time. European markets benefited from solid corporate profit growth and attractive dividends, which helped the MSCI Europe index advance 31.95%. Strong performing Latin American and Asian emerging markets drove the MSCI Emerging Markets index to a lofty 35.42% return. Japan was somewhat of an exception to the generally stellar foreign market performance after struggling in the middle part of the period. Still, its earlier gains helped the Tokyo Stock Exchange Stock Price Index (TOPIX) - a benchmark of the largest and better-established stocks traded on the Tokyo Stock Exchange - rise 12.47% overall. Natural-resources-rich Canada also struggled over the final six months as energy prices fell, but the S&P/TSX Composite Index managed a 12-month return of 28.21%.
The fund's Class A, Class T, Class B and Class C shares gained 36.25%, 36.03%, 35.39% and 35.29%, respectively (excluding sales charges), easily outpacing the MSCI EAFE Small Cap index, which returned 23.55%. Overweightings and good stock selection in the strong performing materials and industrials sectors, along with favorable picks within the fund's large stakes in European and Japanese small-cap stocks, were the main drivers of performance relative to the index. Among the fund's top contributors were Titanium Metals, a U.S. producer of this stronger and lighter alternative to steel for the aerospace and automotive industries, and Vallourec, a French specialty steel company that makes seamless pipe for offshore oil drilling. Good stock picking in the information technology sector also helped, with GigaMedia, a multimedia company based in Singapore, making a healthy contribution to performance. Inopportune stock selection in financials - mainly in banks and real estate - coupled with an underweighting in real estate, hurt results. Detractors included Japanese finance company OMC Card, which underperformed due to concerns about a regulatory proposal to cap interest rates on outstanding debt, and Japanese software company Intelligent Wave.
The views expressed above reflect those of the portfolio manager(s) only through the end of the period as stated on the cover of this report and do not necessarily represent the views of Fidelity or any other person in the Fidelity organization. Any such views are subject to change at any time based upon market or other conditions and Fidelity disclaims any responsibility to update such views. These views may not be relied on as investment advice and, because investment decisions for a Fidelity fund are based on numerous factors, may not be relied on as an indication of trading intent on behalf of any Fidelity fund.
Annual Report
Shareholder Expense Example
As a shareholder of the Fund, you incur two types of costs: (1) transaction costs, including sales charges (loads) on purchase payments or redemption proceeds, redemption fees, and (2) ongoing costs, including management fees, distribution and/or service (12b-1) fees and other Fund expenses. This Example is intended to help you understand your ongoing costs (in dollars) of investing in the Fund and to compare these costs with the ongoing costs of investing in other mutual funds.
The Example is based on an investment of $1,000 invested at the beginning of the period and held for the entire period (May 1, 2006 to October 31, 2006).
Actual Expenses
The first line of the accompanying table for each class of the Fund provides information about actual account values and actual expenses. You may use the information in this line, together with the amount you invested, to estimate the expenses that you paid over the period. Simply divide your account value by $1,000.00 (for example, an $8,600 account value divided by $1,000.00 = 8.6), then multiply the result by the number in the first line for a class of the Fund under the heading entitled "Expenses Paid During Period" to estimate the expenses you paid on your account during this period.
Hypothetical Example for Comparison Purposes
The second line of the accompanying table for each class of the Fund provides information about hypothetical account values and hypothetical expenses based on a Class' actual expense ratio and an assumed rate of return of 5% per year before expenses, which is not the Class' actual return. The hypothetical account values and expenses may not be used to estimate the actual ending account balance or expenses you paid for the period. You may use this information to compare the ongoing costs of investing in the Fund and other funds. To do so, compare this 5% hypothetical example with the 5% hypothetical examples that appear in the shareholder reports of the other funds.
Annual Report
Shareholder Expense Example - continued
Please note that the expenses shown in the table are meant to highlight your ongoing costs only and do not reflect any transaction costs. Therefore, the second line of the table is useful in comparing ongoing costs only, and will not help you determine the relative total costs of owning different funds. In addition, if these transactional costs were included, your costs would have been higher.
| Beginning
Account Value
May 1, 2006 | Ending
Account Value
October 31, 2006 | Expenses Paid
During Period*
May 1, 2006
to October 31, 2006 |
Class A | | | |
Actual | $ 1,000.00 | $ 925.60 | $ 8.06 |
HypotheticalA | $ 1,000.00 | $ 1,016.84 | $ 8.44 |
Class T | | | |
Actual | $ 1,000.00 | $ 924.70 | $ 9.12 |
HypotheticalA | $ 1,000.00 | $ 1,015.73 | $ 9.55 |
Class B | | | |
Actual | $ 1,000.00 | $ 922.50 | $ 11.73 |
HypotheticalA | $ 1,000.00 | $ 1,013.01 | $ 12.28 |
Class C | | | |
Actual | $ 1,000.00 | $ 921.80 | $ 11.63 |
HypotheticalA | $ 1,000.00 | $ 1,013.11 | $ 12.18 |
Fidelity International Small Cap Opportunities | | | |
Actual | $ 1,000.00 | $ 927.60 | $ 6.27 |
HypotheticalA | $ 1,000.00 | $ 1,018.70 | $ 6.56 |
Institutional Class | | | |
Actual | $ 1,000.00 | $ 927.00 | $ 6.22 |
HypotheticalA | $ 1,000.00 | $ 1,018.75 | $ 6.51 |
A 5% return per year before expenses
* Expenses are equal to each Class' annualized expense ratio (shown in the table below); multiplied by the average account value over the period, multiplied by 184/365 (to reflect the one-half year period).
| Annualized
Expense Ratio |
Class A | 1.66% |
Class T | 1.88% |
Class B | 2.42% |
Class C | 2.40% |
Fidelity International Small Cap Opportunities | 1.29% |
Institutional Class | 1.28% |
Annual Report
Investment Changes
Geographic Diversification (% of fund's net assets) |
As of October 31, 2006 |
| Japan 32.7% |
| Germany 10.3% |
| United States of America 10.0% |
| France 6.8% |
| United Kingdom 6.0% |
| Australia 5.5% |
| Spain 4.5% |
| Italy 3.5% |
| Sweden 3.4% |
| Other 17.3% |

Percentages are adjusted for the effect of futures contracts, if applicable. |
|
As of April 30, 2006 |
| Japan 38.9% | |
| Germany 10.6% | |
| France 8.0% | |
| United States of America 6.6% | |
| United Kingdom 5.5% | |
| Korea (South) 5.4% | |
| Australia 4.1% | |
| Sweden 3.2% | |
| Norway 2.2% | |
| Other 15.5% | |

Percentages are adjusted for the effect of futures contracts, if applicable. |
Asset Allocation |
| % of fund's
net assets | % of fund's net assets
6 months ago |
Stocks | 99.1 | 97.9 |
Short-Term Investments and Net Other Assets | 0.9 | 2.1 |
Top Ten Stocks as of October 31, 2006 |
| % of fund's
net assets | % of fund's net assets
6 months ago |
Titanium Metals Corp. (United States of America, Metals & Mining) | 3.0 | 2.1 |
Silicon On Insulator Technologies SA (SOITEC) (France, Semiconductors & Semiconductor Equipment) | 2.3 | 1.4 |
Demag Cranes AG (Germany, Machinery) | 2.0 | 0.0 |
Neopost SA (France, Office Electronics) | 2.0 | 1.4 |
MG Technologies AG (Germany, Chemicals) | 1.9 | 1.0 |
Allegheny Technologies, Inc. (United States of America, Metals & Mining) | 1.9 | 0.4 |
Renovo Group PLC (United Kingdom, Pharmaceuticals) | 1.8 | 0.9 |
Abengoa SA (Spain, Construction & Engineering) | 1.8 | 0.4 |
KK daVinci Advisors (Japan, Real Estate Management & Development) | 1.8 | 1.2 |
Deutz AG (Germany, Machinery) | 1.8 | 1.2 |
| 20.3 | |
Market Sectors as of October 31, 2006 |
| % of fund's
net assets | % of fund's net assets
6 months ago |
Industrials | 23.4 | 28.1 |
Information Technology | 19.3 | 16.6 |
Materials | 16.5 | 16.1 |
Financials | 15.0 | 15.6 |
Consumer Staples | 6.9 | 2.4 |
Consumer Discretionary | 6.7 | 11.2 |
Health Care | 5.7 | 3.2 |
Energy | 3.8 | 4.7 |
Telecommunication Services | 1.8 | 0.0 |
Annual Report
Investments October 31, 2006
Showing Percentage of Net Assets
Common Stocks - 99.1% |
| Shares | | Value (Note 1) |
Australia - 5.5% |
Babcock & Brown Ltd. | 700,000 | | $ 11,824,367 |
CSL Ltd. | 423,300 | | 18,380,564 |
Oxiana Ltd. | 6,340,600 | | 16,247,385 |
United Group Ltd. | 1,196,308 | | 13,530,640 |
TOTAL AUSTRALIA | | 59,982,956 |
Austria - 0.8% |
Andritz AG | 49,974 | | 9,066,658 |
Brazil - 0.9% |
Cosan SA Industria E Comercio | 570,000 | | 9,744,045 |
China - 1.9% |
China Techfaith Wireless Communication Technology Ltd. sponsored ADR (a)(d) | 1,310,696 | | 9,620,509 |
Comba Telecom Systems Holdings Ltd. | 9,738,000 | | 3,380,728 |
Global Bio-Chem Technology Group Co. Ltd. | 15,633,300 | | 4,583,131 |
ZTE Corp. (H Shares) | 1,000,000 | | 3,703,132 |
TOTAL CHINA | | 21,287,500 |
Finland - 2.6% |
KCI Konecranes Oyj | 734,000 | | 15,814,494 |
Metso Corp. | 290,900 | | 12,642,927 |
TOTAL FINLAND | | 28,457,421 |
France - 6.8% |
Alstom SA (a) | 150,062 | | 13,848,280 |
Compagnie Generale de Geophysique SA (a)(d) | 40,902 | | 6,917,469 |
Neopost SA | 178,400 | | 21,814,595 |
Rhodia SA | 60,700 | | 167,351 |
Silicon On Insulator Technologies SA (SOITEC) (a)(d) | 857,812 | | 25,412,890 |
Vallourec SA | 23,300 | | 5,799,323 |
TOTAL FRANCE | | 73,959,908 |
Germany - 10.3% |
Demag Cranes AG | 600,000 | | 21,872,390 |
Deutz AG (a)(d) | 1,951,432 | | 19,652,474 |
K&S AG | 65,000 | | 6,151,929 |
MG Technologies AG | 1,169,800 | | 21,008,377 |
MTU Aero Engines Holding AG | 281,750 | | 11,561,966 |
Q-Cells AG (d) | 138,800 | | 5,492,094 |
SGL Carbon AG (a) | 320,000 | | 7,008,968 |
SolarWorld AG (d) | 103,000 | | 5,540,112 |
Common Stocks - continued |
| Shares | | Value (Note 1) |
Germany - continued |
Wacker Chemie AG | 27,200 | | $ 3,269,054 |
Wincor Nixdorf AG | 75,900 | | 10,554,941 |
TOTAL GERMANY | | 112,112,305 |
India - 0.4% |
Bajaj Hindusthan Ltd. | 700,000 | | 4,857,302 |
Ireland - 1.0% |
Ryanair Holdings PLC sponsored ADR (a) | 163,800 | | 10,945,116 |
Italy - 3.5% |
Banca Italease Spa | 339,240 | | 18,944,010 |
Eurotech Spa (d) | 400,000 | | 4,714,001 |
Lottomatica Spa | 220,000 | | 8,031,109 |
Nice Spa | 820,200 | | 7,014,252 |
TOTAL ITALY | | 38,703,372 |
Japan - 32.7% |
Acca Networks Co. Ltd. (a) | 2,661 | | 3,435,457 |
Access Co. Ltd. (a)(d) | 1,065 | | 7,093,323 |
Air Water, Inc. (d) | 941,000 | | 9,018,990 |
Ajinomoto Co., Inc. | 500,000 | | 5,784,029 |
Asics Corp. | 609,000 | | 8,159,226 |
Asset Managers Co. Ltd. (d) | 3,916 | | 10,714,091 |
Atrium Co. Ltd. (d) | 227,200 | | 7,750,753 |
Credit Saison Co. Ltd. | 285,800 | | 10,336,303 |
Daiei, Inc. (a)(d) | 162,700 | | 3,053,407 |
Dainippon Screen Manufacturing Co. Ltd. (d) | 516,000 | | 4,305,883 |
E*TRADE Securities Co. Ltd. (d) | 5,000 | | 5,258,208 |
Fujikura Ltd. | 1,142,000 | | 12,214,792 |
Furukawa Electric Co. Ltd. | 1,038,000 | | 7,410,483 |
Haseko Corp. (a)(d) | 1,451,000 | | 4,987,192 |
Hitachi Metals Ltd. | 685,000 | | 7,086,611 |
Intelligence Ltd. (d) | 2,882 | | 6,258,790 |
Intelligent Wave, Inc. (d) | 7,474 | | 6,965,339 |
Japan Asia Investment Co. Ltd. | 500,000 | | 2,800,103 |
Japan General Estate Co. Ltd. | 565,400 | | 14,840,784 |
Joint Corp. | 378,600 | | 14,890,220 |
Kenedix, Inc. | 2,500 | | 14,043,263 |
KK daVinci Advisors (a)(d) | 18,098 | | 19,806,294 |
Komatsu Electron Metals Co. Ltd. | 1,100 | | 44,015 |
Meiko Electronics Co. Ltd. | 70,900 | | 2,849,094 |
Miraial Co. Ltd. | 49,400 | | 5,097,965 |
Nabtesco Corp. | 488,000 | | 5,862,175 |
Common Stocks - continued |
| Shares | | Value (Note 1) |
Japan - continued |
NEOMAX Co. Ltd. (d) | 464,000 | | $ 8,529,412 |
NGK Insulators Ltd. | 387,000 | | 5,251,103 |
Nidec Corp. | 100,000 | | 7,652,189 |
Nidec Sankyo Corp. (d) | 242,000 | | 2,702,223 |
Nintendo Co. Ltd. | 70,000 | | 14,316,006 |
Nippon Electric Glass Co. Ltd. | 382,000 | | 8,230,507 |
OMC Card, Inc. (d) | 1,846,500 | | 18,345,016 |
Organo Corp. | 595,000 | | 5,611,192 |
ORIX Corp. | 45,760 | | 12,891,519 |
Rakuten, Inc. | 13,000 | | 5,779,754 |
Stanley Electric Co. Ltd. | 200,000 | | 3,967,168 |
Sumco Corp. | 138,600 | | 9,859,371 |
Takeuchi Manufacturing Co. Ltd. | 100,000 | | 4,249,316 |
Toho Tenax Co. Ltd. (a)(d) | 1,262,000 | | 9,657,063 |
Tokai Carbon Co. Ltd. (d) | 500,000 | | 3,377,223 |
Tokuyama Corp. | 1,035,000 | | 13,025,992 |
Toray Industries, Inc. | 1,064,000 | | 7,668,879 |
Ufj Nicos Co. Ltd. (d) | 933,000 | | 4,211,902 |
Urban Corp. (d) | 266,700 | | 4,083,958 |
Valor Co. Ltd. | 144,000 | | 2,117,647 |
Yahoo! Japan Corp. | 15,000 | | 5,835,329 |
TOTAL JAPAN | | 357,429,559 |
Luxembourg - 0.9% |
Acergy SA (a)(d) | 560,400 | | 10,171,260 |
Netherlands - 0.8% |
Nutreco Holding NV | 140,000 | | 8,343,316 |
Norway - 2.9% |
Cermaq ASA | 400,000 | | 4,926,108 |
Fred Olsen Energy ASA (a)(d) | 98,900 | | 4,266,714 |
PAN Fish ASA (a) | 7,500,000 | | 5,874,614 |
Petroleum Geo-Services ASA (a) | 177,200 | | 10,314,934 |
ProSafe ASA | 100,000 | | 6,394,762 |
TOTAL NORWAY | | 31,777,132 |
Papua New Guinea - 1.0% |
Lihir Gold Ltd. (a) | 4,361,900 | | 9,286,103 |
Lihir Gold Ltd. sponsored ADR (a) | 70,000 | | 1,514,100 |
TOTAL PAPUA NEW GUINEA | | 10,800,203 |
Singapore - 1.2% |
GigaMedia Ltd. (a) | 1,300,000 | | 12,571,000 |
Common Stocks - continued |
| Shares | | Value (Note 1) |
South Africa - 0.5% |
Gold Fields Ltd. | 314,600 | | $ 5,272,696 |
Spain - 4.5% |
Abengoa SA | 658,324 | | 20,099,611 |
Azucarera Ebro Agricolas SA | 470,000 | | 10,438,399 |
Grifols SA | 1,777,380 | | 18,602,912 |
TOTAL SPAIN | | 49,140,922 |
Sweden - 3.4% |
Axfood AB | 185,000 | | 6,070,697 |
Bergman & Beving AB (B Shares) | 300,000 | | 6,729,065 |
Lindex AB | 1,000,000 | | 13,326,595 |
Modern Times Group AB (MTG) (B Shares) | 193,100 | | 11,122,286 |
TOTAL SWEDEN | | 37,248,643 |
Switzerland - 0.5% |
Sulzer AG (Reg.) | 6,000 | | 5,280,714 |
Taiwan - 1.9% |
Macronix International Co. Ltd. (a) | 19,049,000 | | 6,431,011 |
PixArt Imaging, Inc. | 1,467,000 | | 12,072,072 |
Prime View International Co. Ltd. (a) | 5,413,000 | | 2,529,058 |
TOTAL TAIWAN | | 21,032,141 |
United Kingdom - 6.0% |
Autonomy Corp. PLC (a) | 700,000 | | 6,415,876 |
Benfield Group PLC | 950,000 | | 6,315,256 |
Expro International Group PLC | 244,005 | | 3,555,958 |
Meggitt PLC | 1,495,431 | | 9,541,728 |
Michael Page International PLC | 869,827 | | 6,703,148 |
Optos PLC | 1,700,000 | | 5,707,240 |
Renovo Group PLC | 6,901,363 | | 20,108,544 |
Xansa PLC | 5,150,000 | | 7,760,664 |
TOTAL UNITED KINGDOM | | 66,108,414 |
United States of America - 9.1% |
Allegheny Technologies, Inc. | 266,100 | | 20,950,053 |
Chiquita Brands International, Inc. | 900,000 | | 12,330,000 |
NII Holdings, Inc. (a) | 116,800 | | 7,595,504 |
RTI International Metals, Inc. (a) | 228,300 | | 13,999,356 |
Common Stocks - continued |
| Shares | | Value (Note 1) |
United States of America - continued |
Time Warner Telecom, Inc. Class A (sub. vtg.) (a) | 587,000 | | $ 11,704,780 |
Titanium Metals Corp. | 1,122,250 | | 33,083,931 |
TOTAL UNITED STATES OF AMERICA | | 99,663,624 |
TOTAL COMMON STOCKS (Cost $967,524,817) | 1,083,956,207 |
Money Market Funds - 9.5% |
| | | |
Fidelity Cash Central Fund, 5.34% (b) | 12,721,965 | | 12,721,965 |
Fidelity Securities Lending Cash Central Fund, 5.35% (b)(c) | 90,676,921 | | 90,676,921 |
TOTAL MONEY MARKET FUNDS (Cost $103,398,886) | 103,398,886 |
TOTAL INVESTMENT PORTFOLIO - 108.6% (Cost $1,070,923,703) | | 1,187,355,093 |
NET OTHER ASSETS - (8.6)% | | (94,179,549) |
NET ASSETS - 100% | $ 1,093,175,544 |
Legend |
(a) Non-income producing |
(b) Affiliated fund that is available only to investment companies and other accounts managed by Fidelity Investments. The rate quoted is the annualized seven-day yield of the fund at period end. A complete unaudited listing of the fund's holdings as of its most recent quarter end is available upon request. |
(c) Investment made with cash collateral received from securities on loan. |
(d) Security or a portion of the security is on loan at period end. |
Affiliated Central Funds |
Information regarding fiscal year to date income earned by the Fund from investments in Fidelity Central Funds is as follows: |
Fund | Income earned |
Fidelity Cash Central Fund | $ 889,896 |
Fidelity Securities Lending Cash Central Fund | 1,936,235 |
Total | $ 2,826,131 |
Income Tax Information |
At October 31, 2006, the fund had a capital loss carryforward of approximately $516,738 all of which will expire on October 31, 2013. |
Annual Report
See accompanying notes which are an integral part of the financial statements.
Financial Statements
Statement of Assets and Liabilities
October 31, 2006 |
Assets | | |
Investment in securities, at value (including securities loaned of $86,550,679) - See accompanying schedule: Unaffiliated issuers (cost $967,524,817) | $ 1,083,956,207 | |
Fidelity Central Funds (cost $103,398,886) | 103,398,886 | |
Total Investments (cost $1,070,923,703) | | $ 1,187,355,093 |
Receivable for investments sold | | 15,259,934 |
Receivable for fund shares sold | | 2,444,674 |
Dividends receivable | | 1,156,965 |
Interest receivable | | 74,208 |
Receivable from investment adviser for expense reductions | | 605 |
Other receivables | | 358,682 |
Total assets | | 1,206,650,161 |
| | |
Liabilities | | |
Payable for investments purchased | $ 18,817,648 | |
Payable for fund shares redeemed | 2,609,641 | |
Accrued management fee | 924,055 | |
Distribution fees payable | 45,153 | |
Other affiliated payables | 249,592 | |
Other payables and accrued expenses | 151,607 | |
Collateral on securities loaned, at value | 90,676,921 | |
Total liabilities | | 113,474,617 |
| | |
Net Assets | | $ 1,093,175,544 |
Net Assets consist of: | | |
Paid in capital | | $ 977,894,603 |
Undistributed net investment income | | 3,179,958 |
Accumulated undistributed net realized gain (loss) on investments and foreign currency transactions | | (4,329,237) |
Net unrealized appreciation (depreciation) on investments and assets and liabilities in foreign currencies | | 116,430,220 |
Net Assets | | $ 1,093,175,544 |
Annual Report
See accompanying notes which are an integral part of the financial statements.
Financial Statements - continued
Statement of Assets and Liabilities - continued
October 31, 2006 |
Calculation of Maximum Offering Price
Class A:
Net Asset Value and redemption price per share
($35,673,926 ÷ 2,515,423 shares) | | $ 14.18 |
| | |
Maximum offering price per share (100/94.25 of $14.18) | | $ 15.05 |
Class T:
Net Asset Value and redemption price per share
($28,308,901 ÷ 2,004,382 shares) | | $ 14.12 |
| | |
Maximum offering price per share (100/96.50 of $14.12) | | $ 14.63 |
Class B:
Net Asset Value and offering price per share
($7,708,704 ÷ 549,104 shares)A | | $ 14.04 |
| | |
Class C:
Net Asset Value and offering price per share
($26,320,302 ÷ 1,875,885 shares)A | | $ 14.03 |
| | |
| | |
Fidelity International Small Cap Opportunities:
Net Asset Value, offering price and redemption price per
share ($981,210,056 ÷ 68,977,418 shares) | | $ 14.23 |
| | |
Institutional Class:
Net Asset Value, offering price and redemption price per
share ($13,953,655 ÷ 981,185 shares) | | $ 14.22 |
A Redemption price per share is equal to net asset value less any applicable contingent deferred sales charge.
Annual Report
See accompanying notes which are an integral part of the financial statements.
Statement of Operations
Year ended October 31, 2006 |
| | |
Investment Income | | |
Dividends | | $ 13,145,566 |
Interest | | 3,266 |
Income from Fidelity Central Funds (including $1,936,235 from security lending) | | 2,826,131 |
| | 15,974,963 |
Less foreign taxes withheld | | (1,197,058) |
Total income | | 14,777,905 |
| | |
Expenses | | |
Management fee
Basic fee | $ 8,300,425 | |
Performance adjustment | 423,756 | |
Transfer agent fees | 2,163,979 | |
Distribution fees | 348,181 | |
Accounting and security lending fees | 492,883 | |
Custodian fees and expenses | 398,385 | |
Independent trustees' compensation | 3,317 | |
Registration fees | 327,338 | |
Audit | 56,012 | |
Legal | 14,931 | |
Interest | 139,137 | |
Miscellaneous | 4,124 | |
Total expenses before reductions | 12,672,468 | |
Expense reductions | (1,072,152) | 11,600,316 |
Net investment income (loss) | | 3,177,589 |
Realized and Unrealized Gain (Loss) Net realized gain (loss) on: | | |
Investment securities: | | |
Unaffiliated issuers | (559,117) | |
Investment not meeting investment restrictions | 35,982 | |
Foreign currency transactions | (430,569) | |
Total net realized gain (loss) | | (953,704) |
Change in net unrealized appreciation (depreciation) on: Investment securities | 115,233,371 | |
Assets and liabilities in foreign currencies | 1,829 | |
Total change in net unrealized appreciation (depreciation) | | 115,235,200 |
Net gain (loss) | | 114,281,496 |
Net increase (decrease) in net assets resulting from operations | | $ 117,459,085 |
Annual Report
See accompanying notes which are an integral part of the financial statements.
Financial Statements - continued
Statement of Changes in Net Assets
| Year ended
October 31,
2006 | August 2, 2005 (commencement
of operations)
to October 31, 2005 |
Increase (Decrease) in Net Assets | | |
Operations | | |
Net investment income (loss) | $ 3,177,589 | $ 25,230 |
Net realized gain (loss) | (953,704) | (3,306,632) |
Change in net unrealized appreciation (depreciation) | 115,235,200 | 1,195,020 |
Net increase (decrease) in net assets resulting
from operations | 117,459,085 | (2,086,382) |
Distributions to shareholders from net realized gain | (90,957) | - |
Share transactions - net increase (decrease) | 760,497,703 | 215,410,790 |
Redemption fees | 1,853,226 | 132,079 |
Total increase (decrease) in net assets | 879,719,057 | 213,456,487 |
| | |
Net Assets | | |
Beginning of period | 213,456,487 | - |
End of period (including undistributed net investment income of $3,179,958 and undistributed net investment income of $25,213, respectively) | $ 1,093,175,544 | $ 213,456,487 |
Annual Report
See accompanying notes which are an integral part of the financial statements.
Financial Highlights - Class A
Years ended October 31, | 2006 | 2005 I |
Selected Per-Share Data | | |
Net asset value, beginning of period | $ 10.41 | $ 10.00 |
Income from Investment Operations | | |
Net investment income (loss) E | - K | - K |
Net realized and unrealized gain (loss) | 3.74 | .40 H |
Total from investment operations | 3.74 | .40 |
Distributions from net realized gain | -K | - |
Redemption fees added to paid in capital E | .03 | .01 |
Net asset value, end of period | $ 14.18 | $ 10.41 |
Total Return B, C, D | 36.25% | 4.10% |
Ratios to Average Net Assets F, J | | |
Expenses before reductions | 1.63% | 2.67% A |
Expenses net of fee waivers, if any | 1.63% | 1.65%A |
Expenses net of all reductions | 1.51% | 1.54%A |
Net investment income (loss) | .02% | (.09)%A |
Supplemental Data | | |
Net assets, end of period (000 omitted) | $ 35,674 | $ 5,533 |
Portfolio turnover rate G | 164% | 46% |
A Annualized
B Total returns for periods of less than one year are not annualized.
C Total returns would have been lower had certain expenses not been reduced during the periods shown.
D Total returns do not include the effect of the sales charges.
E Calculated based on average shares outstanding during the period.
F Fees and expenses of the underlying Fidelity Central Funds are not included in the Fund's expense ratio. The Fund indirectly bears its proportionate share of the expenses of any underlying Fidelity Central Funds.
G Amount does not include the portfolio activity of any underlying Fidelity Central Funds.
H The amount shown for a share outstanding does not correspond with the aggregate net gain (loss) on investments for the period due to the timing of sales and repurchases of shares in relation to fluctuating market values of the investments of the Fund.
I For the period August 2, 2005 (commencement of operations) to October 31, 2005.
J Expense ratios reflect operating expenses of the class. Expenses before reductions do not reflect amounts reimbursed by the investment adviser or reductions from brokerage service arrangements or other expense offset arrangements and do not represent the amount paid by the class during periods when reimbursements or reductions occur. Expense ratios before reductions for start-up periods may not be representative of longer-term operating periods. Expenses net of fee waivers reflect expenses after reimbursement by the investment adviser but prior to reductions from brokerage service arrangements or other expense offset arrangements. Expenses net of all reductions represent the net expenses paid by the class.
K Amount represents less than $.01 per share.
Annual Report
See accompanying notes which are an integral part of the financial statements.
Financial Highlights - Class T
Years ended October 31, | 2006 | 2005 I |
Selected Per-Share Data | | |
Net asset value, beginning of period | $ 10.38 | $ 10.00 |
Income from Investment Operations | | |
Net investment income (loss) E | (.03) | (.01) |
Net realized and unrealized gain (loss) | 3.74 | .38 H |
Total from investment operations | 3.71 | .37 |
Redemption fees added to paid in capital E | .03 | .01 |
Net asset value, end of period | $ 14.12 | $ 10.38 |
Total Return B, C, D | 36.03% | 3.80% |
Ratios to Average Net Assets F, J | | |
Expenses before reductions | 1.85% | 2.92%A |
Expenses net of fee waivers, if any | 1.85% | 1.90%A |
Expenses net of all reductions | 1.74% | 1.78%A |
Net investment income (loss) | (.20)% | (.33)%A |
Supplemental Data | | |
Net assets, end of period (000 omitted) | $ 28,309 | $ 2,704 |
Portfolio turnover rate G | 164% | 46% |
A Annualized
B Total returns for periods of less than one year are not annualized.
C Total returns would have been lower had certain expenses not been reduced during the periods shown.
D Total returns do not include the effect of the sales charges.
E Calculated based on average shares outstanding during the period.
F Fees and expenses of the underlying Fidelity Central Funds are not included in the Fund's expense ratio. The Fund indirectly bears its proportionate share of the expenses of any underlying Fidelity Central Funds.
G Amount does not include the portfolio activity of any underlying Fidelity Central Funds.
H The amount shown for a share outstanding does not correspond with the aggregate net gain (loss) on investments for the period due to the timing of sales and repurchases of shares in relation to fluctuating market values of the investments of the Fund.
I For the period August 2, 2005 (commencement of operations) to October 31, 2005.
J Expense ratios reflect operating expenses of the class. Expenses before reductions do not reflect amounts reimbursed by the investment adviser or reductions from brokerage service arrangements or other expense offset arrangements and do not represent the amount paid by the class during periods when reimbursements or reductions occur. Expense ratios before reductions for start-up periods may not be representative of longer-term operating periods. Expenses net of fee waivers reflect expenses after reimbursement by the investment adviser but prior to reductions from brokerage service arrangements or other expense offset arrangements. Expenses net of all reductions represent the net expenses paid by the class.
Annual Report
See accompanying notes which are an integral part of the financial statements.
Financial Highlights - Class B
Years ended October 31, | 2006 | 2005 I |
Selected Per-Share Data | | |
Net asset value, beginning of period | $ 10.37 | $ 10.00 |
Income from Investment Operations | | |
Net investment income (loss) E | (.10) | (.02) |
Net realized and unrealized gain (loss) | 3.74 | .38 H |
Total from investment operations | 3.64 | .36 |
Redemption fees added to paid in capital E | .03 | .01 |
Net asset value, end of period | $ 14.04 | $ 10.37 |
Total Return B, C, D | 35.39% | 3.70% |
Ratios to Average Net Assets F, J | | |
Expenses before reductions | 2.45% | 3.43% A |
Expenses net of fee waivers, if any | 2.41% | 2.40%A |
Expenses net of all reductions | 2.30% | 2.27%A |
Net investment income (loss) | (.76)% | (.82)%A |
Supplemental Data | | |
Net assets, end of period (000 omitted) | $ 7,709 | $ 1,705 |
Portfolio turnover rate G | 164% | 46% |
A Annualized
B Total returns for periods of less than one year are not annualized.
C Total returns would have been lower had certain expenses not been reduced during the periods shown.
D Total returns do not include the effect of the contingent deferred sales charge.
E Calculated based on average shares outstanding during the period.
F Fees and expenses of the underlying Fidelity Central Funds are not included in the Fund's expense ratio. The Fund indirectly bears its proportionate share of the expenses of any underlying Fidelity Central Funds.
G Amount does not include the portfolio activity of any underlying Fidelity Central Funds.
H The amount shown for a share outstanding does not correspond with the aggregate net gain (loss) on investments for the period due to the timing of sales and repurchases of shares in relation to fluctuating market values of the investments of the Fund.
I For the period August 2, 2005 (commencement of operations) to October 31, 2005.
J Expense ratios reflect operating expenses of the class. Expenses before reductions do not reflect amounts reimbursed by the investment adviser or reductions from brokerage service arrangements or other expense offset arrangements and do not represent the amount paid by the class during periods when reimbursements or reductions occur. Expense ratios before reductions for start-up periods may not be representative of longer-term operating periods. Expenses net of fee waivers reflect expenses after reimbursement by the investment adviser but prior to reductions from brokerage service arrangements or other expense offset arrangements. Expenses net of all reductions represent the net expenses paid by the class.
Annual Report
See accompanying notes which are an integral part of the financial statements.
Financial Highlights - Class C
Years ended October 31, | 2006 | 2005 I |
Selected Per-Share Data | | |
Net asset value, beginning of period | $ 10.37 | $ 10.00 |
Income from Investment Operations | | |
Net investment income (loss) E | (.10) | (.02) |
Net realized and unrealized gain (loss) | 3.73 | .38 H |
Total from investment operations | 3.63 | .36 |
Redemption fees added to paid in capital E | .03 | .01 |
Net asset value, end of period | $ 14.03 | $ 10.37 |
Total Return B, C, D | 35.29% | 3.70% |
Ratios to Average Net Assets F, J | | |
Expenses before reductions | 2.38% | 3.32% A |
Expenses net of fee waivers, if any | 2.38% | 2.40%A |
Expenses net of all reductions | 2.27% | 2.29%A |
Net investment income (loss) | (.73)% | (.84)%A |
Supplemental Data | | |
Net assets, end of period (000 omitted) | $ 26,320 | $ 3,317 |
Portfolio turnover rate G | 164% | 46% |
A Annualized
B Total returns for periods of less than one year are not annualized.
C Total returns would have been lower had certain expenses not been reduced during the periods shown.
D Total returns do not include the effect of the contingent deferred sales charge.
E Calculated based on average shares outstanding during the period.
F Fees and expenses of the underlying Fidelity Central Funds are not included in the Fund's expense ratio. The Fund indirectly bears its proportionate share of the expenses of any underlying Fidelity Central Funds.
G Amount does not include the portfolio activity of any underlying Fidelity Central Funds.
H The amount shown for a share outstanding does not correspond with the aggregate net gain (loss) on investments for the period due to the timing of sales and repurchases of shares in relation to fluctuating market values of the investments of the Fund.
I For the period August 2, 2005 (commencement of operations) to October 31, 2005.
J Expense ratios reflect operating expenses of the class. Expenses before reductions do not reflect amounts reimbursed by the investment adviser or reductions from brokerage service arrangements or other expense offset arrangements and do not represent the amount paid by the class during periods when reimbursements or reductions occur. Expense ratios before reductions for start-up periods may not be representative of longer-term operating periods. Expenses net of fee waivers reflect expenses after reimbursement by the investment adviser but prior to reductions from brokerage service arrangements or other expense offset arrangements. Expenses net of all reductions represent the net expenses paid by the class.
Annual Report
See accompanying notes which are an integral part of the financial statements.
Financial Highlights - Fidelity International Small Cap Opportunities
Years ended October 31, | 2006 | 2005 H |
Selected Per-Share Data | | |
Net asset value, beginning of period | $ 10.40 | $ 10.00 |
Income from Investment Operations | | |
Net investment income (loss) D | .05 | - J |
Net realized and unrealized gain (loss) | 3.75 | .39 G |
Total from investment operations | 3.80 | .39 |
Distributions from net realized gain | -J | - |
Redemption fees added to paid in capital D | .03 | .01 |
Net asset value, end of period | $ 14.23 | $ 10.40 |
Total Return B, C | 36.86% | 4.00% |
Ratios to Average Net AssetsE, I | | |
Expenses before reductions | 1.28% | 2.25% A |
Expenses net of fee waivers, if any | 1.28% | 1.40%A |
Expenses net of all reductions | 1.16% | 1.31%A |
Net investment income (loss) | .37% | .14%A |
Supplemental Data | | |
Net assets, end of period (000 omitted) | $ 981,210 | $ 197,349 |
Portfolio turnover rate F | 164% | 46% |
A Annualized
B Total returns for periods of less than one year are not annualized.
C Total returns would have been lower had certain expenses not been reduced during the periods shown.
D Calculated based on average shares outstanding during the period.
E Fees and expenses of the underlying Fidelity Central Funds are not included in the Fund's expense ratio. The Fund indirectly bears its proportionate share of the expenses of any underlying Fidelity Central Funds.
F Amount does not include the portfolio activity of any underlying Fidelity Central Funds.
G The amount shown for a share outstanding does not correspond with the aggregate net gain (loss) on investments for the period due to the timing of sales and repurchases of shares in relation to fluctuating market values of the investments of the Fund.
H For the period August 2, 2005 (commencement of operations) to October 31, 2005.
I Expense ratios reflect operating expenses of the class. Expenses before reductions do not reflect amounts reimbursed by the investment adviser or reductions from brokerage service arrangements or other expense offset arrangements and do not represent the amount paid by the class during periods when reimbursements or reductions occur. Expense ratios before reductions for start-up periods may not be representative of longer-term operating periods. Expenses net of fee waivers reflect expenses after reimbursement by the investment adviser but prior to reductions from brokerage service arrangements or other expense offset arrangements. Expenses net of all reductions represent the net expenses paid by the class.
J Amount represents less than $.01 per share.
Annual Report
See accompanying notes which are an integral part of the financial statements.
Financial Highlights - Institutional Class
Years ended October 31, | 2006 | 2005 H |
Selected Per-Share Data | | |
Net asset value, beginning of period | $ 10.40 | $ 10.00 |
Income from Investment Operations | | |
Net investment income (loss)D | .05 | - J |
Net realized and unrealized gain (loss) | 3.74 | .39 G |
Total from investment operations | 3.79 | .39 |
Distributions from net realized gain | - J | - |
Redemption fees added to paid in capitalD | .03 | .01 |
Net asset value, end of period | $ 14.22 | $ 10.40 |
Total Return B, C | 36.77% | 4.00% |
Ratios to Average Net Assets E, I | | |
Expenses before reductions | 1.25% | 2.25% A |
Expenses net of fee waivers, if any | 1.25% | 1.40%A |
Expenses net of all reductions | 1.14% | 1.29%A |
Net investment income (loss) | .40% | .16%A |
Supplemental Data | | |
Net assets, end of period (000 omitted) | $ 13,954 | $ 2,849 |
Portfolio turnover rate F | 164% | 46% |
A Annualized
B Total returns for periods of less than one year are not annualized.
C Total returns would have been lower had certain expenses not been reduced during the periods shown.
D Calculated based on average shares outstanding during the period.
E Fees and expenses of the underlying Fidelity Central Funds are not included in the Fund's expense ratio. The Fund indirectly bears its proportionate share of the expenses of any underlying Fidelity Central Funds.
F Amount does not include the portfolio activity of any underlying Fidelity Central Funds.
G The amount shown for a share outstanding does not correspond with the aggregate net gain (loss) on investments for the period due to the timing of sales and repurchases of shares in relation to fluctuating market values of the investments of the Fund.
H For the period August 2, 2005 (commencement of operations) to October 31, 2005.
I Expense ratios reflect operating expenses of the class. Expenses before reductions do not reflect amounts reimbursed by the investment adviser or reductions from brokerage service arrangements or other expense offset arrangements and do not represent the amount paid by the class during periods when reimbursements or reductions occur. Expense ratios before reductions for start-up periods may not be representative of longer-term operating periods. Expenses net of fee waivers reflect expenses after reimbursement by the investment adviser but prior to reductions from brokerage service arrangements or other expense offset arrangements. Expenses net of all reductions represent the net expenses paid by the class.
J Amount represents less than $.01 per share.
Annual Report
See accompanying notes which are an integral part of the financial statements.
Notes to Financial Statements
For the period ended October 31, 2006
1. Significant Accounting Policies.
Fidelity International Small Cap Opportunities Fund (the Fund) is a fund of Fidelity Investment Trust (the trust) and is authorized to issue an unlimited number of shares. The trust is registered under the Investment Company Act of 1940, as amended (the 1940 Act), as an open-end management investment company organized as a Massachusetts business trust.
The Fund offers Class A, Class T, Class B, Class C, International Small Cap Opportunities and Institutional Class shares, each of which has equal rights as to assets and voting privileges. Each class has exclusive voting rights with respect to matters that affect that class. Class B shares will automatically convert to Class A shares after a holding period of seven years from the initial date of purchase. Investment income, realized and unrealized capital gains and losses, the common expenses of the Fund, and certain fund-level expense reductions, if any, are allocated on a pro rata basis to each class based on the relative net assets of each class to the total net assets of the Fund. Each class differs with respect to transfer agent and distribution and service plan fees incurred. Certain expense reductions also differ by class.
The Fund may invest in Fidelity Central Funds which are open-end investment companies available to investment companies and other accounts managed by Fidelity Management & Research Company (FMR) and its affiliates. The financial statements have been prepared in conformity with accounting principles generally accepted in the United States of America, which require management to make certain estimates and assumptions at the date of the financial statements. The following summarizes the significant accounting policies of the Fund, which are also consistently followed by the Fidelity Central Funds:
Security Valuation. Investments are valued and net asset value (NAV) per share is calculated (NAV calculation) as of the close of business of the New York Stock Exchange (NYSE), normally 4:00 p.m. Eastern time. Wherever possible, the Fund uses independent pricing services approved by the Board of Trustees to value its investments.
Equity securities, including restricted securities, for which market quotations are readily available, are valued at the last reported sale price or official closing price as reported by an independent pricing service on the primary market or exchange on which they are traded. In the event there were no sales during the day or closing prices are not available, securities are valued at the last quoted bid price. Investments in open-end mutual funds, including the Fidelity Central Funds, are valued at their closing net asset value each business day. Short-term securities with remaining maturities of sixty days or less for which quotations are not readily available are valued at amortized cost, which approximates value.
Annual Report
Notes to Financial Statements - continued
1. Significant Accounting Policies - continued
Security Valuation - continued
When current market prices or quotations are not readily available or do not accurately reflect fair value, valuations may be determined in accordance with procedures adopted by the Board of Trustees. For example, when developments occur between the close of a market and the close of the NYSE that may materially affect the value of some or all of the securities, or when trading in a security is halted, those securities may be fair valued. Factors used in the determination of fair value may include monitoring news to identify significant market or security specific events such as changes in the value of U.S. securities markets, reviewing developments in foreign markets and evaluating the performance of ADRs, futures contracts and exchange-traded funds. Because the Fund's utilization of fair value pricing depends on market activity, the frequency with which fair value pricing is used can not be predicted and may be utilized to a significant extent. The value of securities used for NAV calculation under fair value pricing may differ from published prices for the same securities.
Foreign Currency. The Fund uses foreign currency contracts to facilitate transactions in foreign-denominated securities. Losses from these transactions may arise from changes in the value of the foreign currency or if the counterparties do not perform under the contracts' terms.
Foreign-denominated assets, including investment securities, and liabilities are translated into U.S. dollars at the exchange rate at period end. Purchases and sales of investment securities, income and dividends received and expenses denominated in foreign currencies are translated into U.S. dollars at the exchange rate in effect on the transaction date.
The effects of exchange rate fluctuations on investments are included with the net realized and unrealized gain (loss) on investment securities. Other foreign currency transactions resulting in realized and unrealized gain (loss) are disclosed separately.
Investment Transactions and Income. Security transactions, including the Fund's investment activity in the Fidelity Central Funds, are accounted for as of trade date. Gains and losses on securities sold are determined on the basis of identified cost. Dividend income is recorded on the ex-dividend date, except for certain dividends from foreign securities where the ex-dividend date may have passed, which are recorded as soon as the Fund is informed of the ex-dividend date. Non-cash dividends included in dividend income, if any, are recorded at the fair market value of the securities received. Interest income and distributions from the Fidelity Central Funds are accrued as earned. Interest income includes coupon interest and amortization of premium and accretion of discount on debt securities. Investment income is recorded net of foreign taxes withheld where recovery of such taxes is uncertain.
Annual Report
1. Significant Accounting Policies - continued
Expenses. Most expenses of the trust can be directly attributed to a fund. Expenses which cannot be directly attributed are apportioned among each Fund in the trust. Expense estimates are accrued in the period to which they relate and adjustments are made when actual amounts are known.
Income Tax Information and Distributions to Shareholders. Each year, the Fund intends to qualify as a regulated investment company by distributing all of its taxable income and realized gains under Subchapter M of the Internal Revenue Code. As a result, no provision for income taxes is required in the accompanying financial statements. Foreign taxes are provided for based on the Fund's understanding of the tax rules and rates that exist in the foreign markets in which it invests.
Distributions are recorded on the ex-dividend date. Income dividends and capital gain distributions are declared separately for each class. Income and capital gain distributions are determined in accordance with income tax regulations, which may differ from generally accepted accounting principles. In addition, the Fund will claim a portion of the payment made to redeeming shareholders as a distribution for income tax purposes.
Capital accounts within the financial statements are adjusted for permanent book-tax differences. These adjustments have no impact on net assets or the results of operations. Temporary book-tax differences will reverse in a subsequent period.
Book-tax differences are primarily due to foreign currency transactions, passive foreign investment companies (PFIC), capital loss carryforwards and losses deferred due to wash sales.
The tax-basis components of distributable earnings and the federal tax cost as of period end were as follows:
Unrealized appreciation | $ 169,153,678 | |
Unrealized depreciation | (59,160,398) | |
Net unrealized appreciation (depreciation) | 109,993,280 | |
Capital loss carryforward | (516,738) | |
| | |
Cost for federal income tax purposes | $ 1,077,361,813 | |
The tax character of distributions paid was as follows:
| October 31,
2006 | October 31,
2005 |
Ordinary Income | $ 90,957 | $ - |
Short-Term Trading (Redemption) Fees. Shares held in the Fund less than 90 days are subject to a redemption fee equal to 2.00% of the proceeds of the redeemed shares. All redemption fees, including any estimated redemption fees paid by FMR, are retained by the Fund and accounted for as an addition to paid in capital.
Annual Report
Notes to Financial Statements - continued
1. Significant Accounting Policies - continued
New Accounting Pronouncements. In July 2006, Financial Accounting Standards Board Interpretation No. 48, Accounting for Uncertainty in Income Taxes - an interpretation of FASB Statement 109 (FIN 48), was issued and is effective for fiscal years beginning after December 15, 2006. FIN 48 sets forth a threshold for financial statement recognition, measurement and disclosure of a tax position taken or expected to be taken on a tax return. Management is currently evaluating the impact, if any, the adoption of FIN 48 will have on the Fund's net assets, results of operations and financial statement disclosures.
In addition, in September 2006, Statement of Financial Accounting Standards No. 157, Fair Value Measurements (SFAS 157), was issued and is effective for fiscal years beginning after November 15, 2007. SFAS 157 defines fair value, establishes a framework for measuring fair value and expands disclosures about fair value measurements. Management is currently evaluating the impact the adoption of SFAS 157 will have on the Fund's financial statement disclosures.
2. Operating Policies.
Repurchase Agreements. FMR has received an Exemptive Order from the Securities and Exchange Commission (the SEC) which permits the Fund and other affiliated entities of FMR to transfer uninvested cash balances into joint trading accounts which are then invested in repurchase agreements. The Fund may also invest directly with institutions in repurchase agreements. Repurchase agreements are collateralized by government or non-government securities. Upon settlement date, collateral is held in segregated accounts with custodian banks and may be obtained in the event of a default of the counterparty. The Fund monitors, on a daily basis, the value of the collateral to ensure it is at least equal to the principal amount of the repurchase agreement (including accrued interest). In the event of a default by the counterparty, realization of the collateral proceeds could be delayed, during which time the value of the collateral may decline.
3. Purchases and Sales of Investments.
Purchases and sales of securities, other than short-term securities, aggregated $2,275,575,976 and $1,521,126,280, respectively.
The Fund realized a gain on the sale of an investment not meeting the investment restrictions of the Fund.
Annual Report
4. Fees and Other Transactions with Affiliates.
Management Fee. FMR and its affiliates provide the Fund with investment management related services for which the Fund pays a monthly management fee. The management fee is the sum of an individual fund fee rate that is based on an annual rate of .60% of the Fund's average net assets and a group fee rate that averaged ..27% during the period. The group fee rate is based upon the average net assets of all the mutual funds advised by FMR. The group fee rate decreases as assets under management increase and increases as assets under management decrease. In addition, the management fee is subject to a performance adjustment (up to a maximum of ± .20% of the Fund's average net assets over a 36 month performance period). The upward or downward adjustment to the management fee is based on the relative investment performance of the retail class of the Fund, Fidelity International Small Cap Opportunities, as compared to an appropriate benchmark index. The Fund's performance adjustment took effect in August 2006. Subsequent months will be added until the performance period includes 36 months. For the period, the total annual management fee rate, including the performance adjustment, was .91% of the Fund's average net assets.
Distribution and Service Plan. In accordance with Rule 12b-1 of the 1940 Act, the Fund has adopted separate Distribution and Service Plans for each class of shares. Certain classes pay Fidelity Distributors Corporation (FDC), an affiliate of FMR, separate Distribution and Service Fees, each of which is based on an annual percentage of each class' average net assets. In addition, FDC may pay financial intermediaries for selling shares of the Fund and providing shareholder support services. For the period the Distribution and Service Fee rates and the total amounts paid to and retained by FDC were as follows:
| Distribution
Fee | Service
Fee | Paid to
FDC | Retained
by FDC |
Class A | 0% | .25% | $ 60,381 | $ 5,079 |
Class T | .25% | .25% | 84,746 | 10,636 |
Class B | .75% | .25% | 56,129 | 44,686 |
Class C | .75% | .25% | 146,925 | 120,497 |
| | | $ 348,181 | $ 180,898 |
Sales Load. FDC receives a front-end sales charge of up to 5.75% for selling Class A shares, and 3.50% for selling Class T shares, some of which is paid to financial intermediaries for selling shares of the Fund. FDC receives the proceeds of contingent deferred sales charges levied on Class A, Class T, Class B, and Class C redemptions. These charges depend on the holding period. The deferred sales charges range from 5% to 1% for Class B, 1% for Class C, 1.00% to .50% for certain purchases of Class A shares (.25% prior to February 24, 2006) and .25% for certain purchases of Class T shares.
Annual Report
Notes to Financial Statements - continued
4. Fees and Other Transactions with Affiliates - continued
Sales Load - continued
For the period, sales charge amounts retained by FDC were as follows:
| Retained
by FDC |
Class A | $ 94,260 |
Class T | 19,610 |
Class B* | 9,295 |
Class C* | 5,107 |
| $ 128,272 |
* When Class B and Class C shares are initially sold, FDC pays commissions from its own resources to financial intermediaries through which the sales are made.
Transfer Agent Fees. Fidelity Investments Institutional Operations Company, Inc. (FIIOC), an affiliate of FMR, is the transfer, dividend disbursing and shareholder servicing agent for each class of the Fund, except for Fidelity International Small Cap Opportunities. Fidelity Service Company, Inc. (FSC), an affiliate of FMR, is the transfer agent for Fidelity International Small Cap Opportunities shares. FIIOC and FSC receive account fees and asset-based fees that vary according to the account size and type of account of the shareholders of the respective classes of the Fund. FIIOC and FSC pay for typesetting, printing and mailing of shareholder reports, except proxy statements. For the period, the total transfer agent fees paid by each class to FIIOC or FSC, were as follows:
| Amount | % of
Average
Net Assets |
Class A | $ 77,944 | .32 |
Class T | 50,163 | .29 |
Class B | 22,462 | .40 |
Class C | 49,167 | .33 |
Fidelity International Small Cap Opportunities | 1,941,743 | .22 |
Institutional Class | 22,500 | .19 |
| $ 2,163,979 | |
Accounting and Security Lending Fees. FSC maintains the Fund's accounting records. The accounting fee is based on the level of average net assets for the month. Under a separate contract, FSC administers the security lending program. The security lending fee is based on the number and duration of lending transactions.
Annual Report
4. Fees and Other Transactions with Affiliates - continued
Investments in Fidelity Central Funds. The Fund may invest in Fidelity Central Funds. The Fund's Schedule of Investments lists each of the Fidelity Central Funds as an investment of the Fund but does not include the underlying holdings of each Fidelity Central Fund. As an Investing Fund, the Fund indirectly bears its proportionate share of the expenses of the underlying Fidelity Central Funds. A complete unaudited list of holdings for each Fidelity Central Fund, is available upon request. In addition, the financial statements of the Fidelity Central Funds, which are not covered by the Fund's Report of Independent Registered Public Accounting Firm, are available on the EDGAR Database on the SEC's web site, www.sec.gov, or upon request.
The Money Market Central Funds seek preservation of capital and current income and are managed by Fidelity Investments Money Management, Inc. (FIMM), an affiliate of FMR.
Brokerage Commissions. The Fund placed a portion of its portfolio transactions with brokerage firms which are affiliates of the investment adviser. The commissions paid to these affiliated firms were $10,168 for the period.
Interfund Lending Program. Pursuant to an Exemptive Order issued by the SEC, the Fund, along with other registered investment companies having management contracts with FMR, may participate in an interfund lending program. This program provides an alternative credit facility allowing the Funds to borrow from, or lend money to, other participating affiliated funds. At period end, there were no interfund loans outstanding. The Fund's activity in this program during the period for which loans were outstanding was as follows:
Borrower or Lender | Average Daily
Loan Balance | Weighted Average Interest Rate | Interest
Expense |
Borrower | $ 11,990,313 | 5.22% | $ 111,231 |
5. Committed Line of Credit.
The Fund participates with other funds managed by FMR in a $4.2 billion credit facility (the "line of credit") to be utilized for temporary or emergency purposes to fund shareholder redemptions or for other short-term liquidity purposes. The Fund has agreed to pay commitment fees on its pro rata portion of the line of credit, which amounts to $1,727 and is reflected in Miscellaneous Expense on the Statement of Operations. During the period, there were no borrowings on this line of credit.
Annual Report
Notes to Financial Statements - continued
6. Security Lending.
The Fund lends portfolio securities from time to time in order to earn additional income. On the settlement date of the loan, the Fund receives collateral (in the form of U.S. Treasury obligations, letters of credit and/or cash) against the loaned securities and maintains collateral in an amount not less than 100% of the market value of the loaned securities during the period of the loan. The market value of the loaned securities is determined at the close of business of the Fund and any additional required collateral is delivered to the Fund on the next business day. If the borrower defaults on its obligation to return the securities loaned because of insolvency or other reasons, a fund could experience delays and costs in recovering the securities loaned or in gaining access to the collateral. Any cash collateral received is invested in the Fidelity Securities Lending Cash Central Fund. The value of loaned securities and cash collateral at period end are disclosed on the Fund's Statement of Assets and Liabilities. Security lending income represents the income earned on investing cash collateral, less fees and expenses associated with the loan, plus any premium payments that may be received on the loan of certain types of securities.
7. Bank Borrowings.
The Fund is permitted to have bank borrowings for temporary or emergency purposes to fund shareholder redemptions. The Fund has established borrowing arrangements with certain banks. The interest rate on the borrowings is the bank's base rate, as revised from time to time. The average daily loan balance during the period for which loans were outstanding amounted to $8,950,571. The weighted average interest rate was 5.34%. At period end, there were no bank borrowings outstanding.
8. Expense Reductions.
FMR voluntarily agreed to reimburse each class to the extent annual operating expenses exceeded certain levels of average net assets as noted in the table below. Some expenses, for example interest expense, including commitment fees, are excluded from this reimbursement.
The following class was in reimbursement during the period:
| Expense
Limitations | Reimbursement
from adviser |
Class B | 2.40% | $ 2,310 |
Annual Report
8. Expense Reductions - continued
Many of the brokers with whom FMR places trades on behalf of the Fund provided services to the Fund in addition to trade execution. These services included payments of certain expenses on behalf of the Fund totaling $1,069,602 for the period. In addition, through arrangements with each class' transfer agent, credits realized as a result of uninvested cash balances were used to reduce the Fund's expenses. During the period, credits reduced each class' transfer agent expense as noted in the table below.
| Transfer Agent
expense reduction |
Fidelity International Small Cap Opportunities | $ 240 |
9. Other.
The Fund's organizational documents provide former and current trustees and officers with a limited indemnification against liabilities arising in connection with the performance of their duties to the Fund. In the normal course of business, the Fund may also enter into contracts that provide general indemnifications. The Fund's maximum exposure under these arrangements is unknown as this would be dependent on future claims that may be made against the Fund. The risk of material loss from such claims is considered remote.
During the period, the Fund's transfer agent, Fidelity Investments Institutional Operations Company, Inc. (FIIOC), an affiliate of Fidelity Management & Research Company, notified the Fund that the fund's books and records did not reflect a conversion of certain Class B to Class A shares upon their conversion date. Management has determined that this did not have a material impact to the Fund's reported net assets or results of operations in the accompanying financial statements. FIIOC will cause the books and records of the Fund to reflect a conversion of the relevant Class B shares to Class A and is in the process of determining the impact to affected shareholder accounts for purposed of its remediation.
10. Distributions to Shareholders.
Distributions to shareholders of each class were as follows:
Years ended October 31, | 2006 | 2005 |
From net realized gain | | |
Class A | $ 2,067 | $ - |
Fidelity International Small Cap Opportunities | 87,898 | - |
Institutional Class | 992 | - |
Total | $ 90,957 | $ - |
Annual Report
Notes to Financial Statements - continued
11. Share Transactions.
Transactions for each class of shares were as follows:
| Shares | Dollars |
| Year ended
October 31,
2006 | Year ended
October 31,
2005 A | Year ended
October 31,
2006 | Year ended
October 31,
2005 A |
Class A | | | | |
Shares sold | 2,562,140 | 533,911 | $ 35,143,597 | $ 5,543,122 |
Reinvestment of distributions | 162 | - | 1,916 | - |
Shares redeemed | (578,488) | (2,302) | (7,816,655) | (24,252) |
Net increase (decrease) | 1,983,814 | 531,609 | $ 27,328,858 | $ 5,518,870 |
Class T | | | | |
Shares sold | 1,977,012 | 262,396 | $ 27,202,466 | $ 2,707,886 |
Shares redeemed | (233,065) | (1,961) | (3,118,693) | (19,686) |
Net increase (decrease) | 1,743,947 | 260,435 | $ 24,083,773 | $ 2,688,200 |
Class B | | | | |
Shares sold | 498,394 | 169,923 | $ 6,815,227 | $ 1,745,697 |
Shares redeemed | (113,628) | (5,585) | (1,550,424) | (57,751) |
Net increase (decrease) | 384,766 | 164,338 | $ 5,264,803 | $ 1,687,946 |
Class C | | | | |
Shares sold | 1,745,210 | 322,125 | $ 24,032,601 | $ 3,329,826 |
Shares redeemed | (189,077) | (2,373) | (2,515,739) | (24,472) |
Net increase (decrease) | 1,556,133 | 319,752 | $ 21,516,862 | $ 3,305,354 |
Fidelity International Small Cap Opportunities | | | | |
Shares sold | 93,068,555 | 19,620,455 | $ 1,259,777,775 | $ 205,992,728 |
Reinvestment of distributions | 6,974 | - | 82,435 | - |
Shares redeemed | (43,072,008) | (646,558) | (586,736,058) | (6,587,124) |
Net increase (decrease) | 50,003,521 | 18,973,897 | $ 673,124,152 | $ 199,405,604 |
Institutional Class | | | | |
Shares sold | 1,299,662 | 274,003 | $ 17,883,260 | $ 2,804,816 |
Reinvestment of distributions | 83 | - | 980 | - |
Shares redeemed | (592,563) | - | (8,704,985) | - |
Net increase (decrease) | 707,182 | 274,003 | $ 9,179,255 | $ 2,804,816 |
A For the period August 2, 2005 (commencement of operations) to October 31, 2005.
Annual Report
Report of Independent Registered Public Accounting Firm
To the Trustees of Fidelity Investment Trust and Shareholders of Fidelity International Small Cap Opportunities Fund:
We have audited the accompanying statement of assets and liabilities of Fidelity International Small Cap Opportunities Fund (the Fund), a fund of Fidelity Investment Trust, including the schedule of investments as of October 31, 2006, and the related statement of operations for the year then ended, and the statement of changes in net assets, and the financial highlights for the year then ended and for the period August 2, 2005 (commencement of operations) to October 31, 2005. These financial statements and financial highlights are the responsibility of the Fund's management. Our responsibility is to express an opinion on these financial statements and financial highlights based on our audits.
We conducted our audits in accordance with standards of the Public Company Accounting Oversight Board (United States). Those standards require that we plan and perform the audit to obtain reasonable assurance about whether the financial statements and financial highlights are free of material misstatement. The Fund is not required to have, nor were we engaged to perform, an audit of its internal control over financial reporting. Our audits included consideration of internal control over financial reporting as a basis for designing audit procedures that are appropriate in the circumstances, but not for the purpose of expressing an opinion on the effectiveness of the Fund's internal control over financial reporting. Accordingly, we express no such opinion. An audit also includes examining, on a test basis, evidence supporting the amounts and disclosures in the financial statements, assessing the accounting principles used and significant estimates made by management, as well as evaluating the overall financial statement presentation. Our procedures included confirmation of securities owned as of October 31, 2006, by correspondence with the custodians and brokers; where replies were not received from brokers, we performed other auditing procedures. We believe that our audits provide a reasonable basis for our opinion.
In our opinion, the financial statements and financial highlights referred to above present fairly, in all material respects, the financial position of Fidelity International Small Cap Opportunities Fund as of October 31, 2006, the results of its operations for the year then ended, and the changes in its net assets and its financial highlights the year then ended and for the period August 2, 2005 (commencement of operations) to October 31, 2005, in conformity with accounting principles generally accepted in the United States of America.
/s/ Deloitte & Touche LLP
DELOITTE & TOUCHE LLP
Boston, Massachusetts
December 15, 2006
Annual Report
Trustees and Officers
The Trustees, Members of the Advisory Board, and executive officers of the trust and fund, as applicable, are listed below. The Board of Trustees governs the fund and is responsible for protecting the interests of shareholders. The Trustees are experienced executives who meet periodically throughout the year to oversee the fund's activities, review contractual arrangements with companies that provide services to the fund, and review the fund's performance. Except for William O. McCoy, each of the Trustees oversees 348 funds advised by FMR or an affiliate. Mr. McCoy oversees 350 funds advised by FMR or an affiliate.
The Trustees hold office without limit in time except that (a) any Trustee may resign; (b) any Trustee may be removed by written instrument, signed by at least two-thirds of the number of Trustees prior to such removal; (c) any Trustee who requests to be retired or who has become incapacitated by illness or injury may be retired by written instrument signed by a majority of the other Trustees; and (d) any Trustee may be removed at any special meeting of shareholders by a two-thirds vote of the outstanding voting securities of the trust. Each Trustee who is not an interested person (as defined in the 1940 Act) (Independent Trustee), shall retire not later than the last day of the calendar year in which his or her 72nd birthday occurs. The Independent Trustees may waive this mandatory retirement age policy with respect to individual Trustees. The executive officers and Advisory Board Members hold office without limit in time, except that any officer and Advisory Board Member may resign or may be removed by a vote of a majority of the Trustees at any regular meeting or any special meeting of the Trustees. Except as indicated, each individual has held the office shown or other offices in the same company for the past five years.
The fund's Statement of Additional Information (SAI) includes more information about the Trustees. To request a free copy, call Fidelity at 1-877-208-0098.
Interested Trustees*:
Correspondence intended for each Trustee who is an interested person may be sent to Fidelity Investments, 82 Devonshire Street, Boston, Massachusetts 02109.
Name, Age; Principal Occupation |
Edward C. Johnson 3d (76) |
| Year of Election or Appointment: 1984 Mr. Johnson is Chairman of the Board of Trustees. Mr. Johnson serves as President (2006-present), Chief Executive Officer, Chairman, and a Director of FMR Corp.; Chairman and a Director of FMR; Chairman and a Director of Fidelity Research & Analysis Company (FRAC); Chairman and a Director of Fidelity Investments Money Management, Inc.; and Chairman (2001-present) and a Director of FMR Co., Inc. In addition, Mr. Johnson serves as Chairman and Director of Fidelity International Limited (FIL). |
Stephen P. Jonas (53) |
| Year of Election or Appointment: 2005 Mr. Jonas is Senior Vice President of the fund (2005-present). He also serves as Senior Vice President of other Fidelity funds (2005-present). Mr. Jonas is Executive Director of FMR (2005-present) and FMR Co., Inc. (2005-present). He also serves as a Director of Fidelity Investments Money Management, Inc. (2005-present) and FMR Corp. (2003- present). Previously, Mr. Jonas served as President of Fidelity Enterprise Operations and Risk Services (2004-2005), Chief Administrative Officer (2002-2004), and Chief Financial Officer of FMR Corp. (1998-2002). In addition, he serves on the Boards of Boston Ballet (2003-present) and Simmons College (2003-present). |
Robert L. Reynolds (54) |
| Year of Election or Appointment: 2003 Mr. Reynolds is President and a Director of FMR (2005-present), Fidelity Investments Money Management, Inc. (2005-present), and FMR Co., Inc. (2005-present). Mr. Reynolds also serves as Vice Chairman (2006-present), a Director (2003-present), and Chief Operating Officer of FMR Corp. and a Director of Strategic Advisers, Inc. (2005-present). He also serves on the Board at Fidelity Investments Canada, Ltd. |
* Trustees have been determined to be "Interested Trustees" by virtue of, among other things, their affiliation with the trust or various entities under common control with FMR.
Annual Report
Independent Trustees:
Correspondence intended for each Independent Trustee (that is, the Trustees other than the Interested Trustees) may be sent to Fidelity Investments, P.O. Box 55235, Boston, Massachusetts 02205-5235.
Name, Age; Principal Occupation |
Dennis J. Dirks (58) |
| Year of Election or Appointment: 2005 Prior to his retirement in May 2003, Mr. Dirks was Chief Operating Officer and a member of the Board of The Depository Trust & Clearing Corporation (DTCC) (1999-2003). He also served as President, Chief Operating Officer, and Board member of The Depository Trust Company (DTC) (1999-2003) and President and Board member of the National Securities Clearing Corporation (NSCC) (1999-2003). In addition, Mr. Dirks served as Chief Executive Officer and Board member of the Government Securities Clearing Corporation (2001-2003) and Chief Executive Officer and Board member of the Mortgage-Backed Securities Clearing Corporation (2001-2003). Mr. Dirks also serves as a Trustee and a member of the Finance Committee of Manhattan College (2005-present) and a Trustee and a member of the Finance Committee of AHRC of Nassau County (2006-present). |
Albert R. Gamper, Jr. (64) |
| Year of Election or Appointment: 2006 Prior to his retirement in December 2004, Mr. Gamper served as Chairman of the Board of CIT Group Inc. (commercial finance). During his tenure with CIT Group Inc. Mr. Gamper served in numerous senior management positions, including Chairman (1987-1989; 1999-2001; 2002-2004), Chief Executive Officer (1987-2004), and President (1989-2002). He currently serves as a member of the Board of Directors of Public Service Enterprise Group (utilities, 2001-present), Chairman of the Board of Governors, Rutgers University (2004-present), and Chairman of the Board of Saint Barnabas Health Care System. |
George H. Heilmeier (70) |
| Year of Election or Appointment: 2004 Dr. Heilmeier is Chairman Emeritus of Telcordia Technologies (communication software and systems), where prior to his retirement, he served as company Chairman and Chief Executive Officer. He currently serves on the Boards of Directors of The Mitre Corporation (systems engineering and information technology support for the government), and HRL Laboratories (private research and development, 2004-present). He is Chairman of the General Motors Science & Technology Advisory Board and a Life Fellow of the Institute of Electrical and Electronics Engineers (IEEE). Dr. Heilmeier is a member of the Defense Science Board and the National Security Agency Advisory Board. He is also a member of the National Academy of Engineering, the American Academy of Arts and Sciences, and the Board of Overseers of the School of Engineering and Applied Science of the University of Pennsylvania. Previously, Dr. Heilmeier served as a Director of TRW Inc. (automotive, space, defense, and information technology, 1992-2002), Compaq (1994-2002), Automatic Data Processing, Inc. (ADP) (technology-based business outsourcing, 1995-2002), INET Technologies Inc. (telecommunications network surveillance, 2001-2004), and Teletech Holdings (customer management services). He is the recipient of the 2005 Kyoto Prize in Advanced Technology for his invention of the liquid crystal display, and a member of the Consumer Electronics Hall of Fame. |
Marie L. Knowles (60) |
| Year of Election or Appointment: 2001 Prior to Ms. Knowles' retirement in June 2000, she served as Executive Vice President and Chief Financial Officer of Atlantic Richfield Company (ARCO) (diversified energy, 1996-2000). From 1993 to 1996, she was a Senior Vice President of ARCO and President of ARCO Transportation Company. She served as a Director of ARCO from 1996 to 1998. She currently serves as a Director of Phelps Dodge Corporation (copper mining and manufacturing) and McKesson Corporation (healthcare service, 2002-present). Ms. Knowles is a Trustee of the Brookings Institution and the Catalina Island Conservancy and also serves as a member of the Advisory Board for the School of Engineering of the University of Southern California. |
Ned C. Lautenbach (62) |
| Year of Election or Appointment: 2000 Mr. Lautenbach is Chairman of the Independent Trustees (2006-present). Mr. Lautenbach has been a partner of Clayton, Dubilier & Rice, Inc. (private equity investment firm) since September 1998. Previously, Mr. Lautenbach was with the International Business Machines Corporation (IBM) from 1968 until his retirement in 1998. Mr. Lautenbach serves as a Director of Sony Corporation (2006-present) and Eaton Corporation (diversified industrial) as well as the Philharmonic Center for the Arts in Naples, Florida. He also is a member of the Board of Trustees of Fairfield University (2005-present), as well as a member of the Council on Foreign Relations. |
William O. McCoy (73) |
| Year of Election or Appointment: 1997 Prior to his retirement in December 1994, Mr. McCoy was Vice Chairman of the Board of BellSouth Corporation (telecommunications) and President of BellSouth Enterprises. He is currently a Director of Duke Realty Corporation (real estate). He is also a partner of Franklin Street Partners (private investment management firm). In addition, Mr. McCoy served as the Interim Chancellor (1999-2000) and a member of the Board of Visitors for the University of North Carolina at Chapel Hill and currently serves as Chairman of the Board of Directors of the University of North Carolina Health Care System. He also served as Vice President of Finance for the University of North Carolina (16-school system). |
Cornelia M. Small (62) |
| Year of Election or Appointment: 2005 Ms. Small is a member (2000-present) and Chairperson (2002-present) of the Investment Committee, and a member (2002-present) of the Board of Trustees of Smith College. Previously, she served as Chief Investment Officer (1999-2000), Director of Global Equity Investments (1996-1999), and a member of the Board of Directors of Scudder, Stevens & Clark (1990-1997) and Scudder Kemper Investments (1997-1999). In addition, Ms. Small served as Co-Chair (2000-2003) of the Annual Fund for the Fletcher School of Law and Diplomacy. |
William S. Stavropoulos (67) |
| Year of Election or Appointment: 2001 Mr. Stavropoulos is Chairman Emeritus of the Board of Directors of The Dow Chemical Company. Since joining The Dow Chemical Company in 1967, Mr. Stavropoulos served in numerous senior management positions, including President (1993-2000; 2002-2003), CEO (1995-2000; 2002-2004), and Chairman of the Executive Committee (2000-2004). Currently, he is a Director of NCR Corporation (data warehousing and technology solutions), BellSouth Corporation (telecommunications), Chemical Financial Corporation, Maersk Inc. (industrial conglomerate, 2002-present), and Metalmark Capital (private equity investment firm, 2005-present). He also serves as a member of the Board of Trustees of the American Enterprise Institute for Public Policy Research. In addition, Mr. Stavropoulos is a member of The Business Council, J.P. Morgan International Council and the University of Notre Dame Advisory Council for the College of Science. |
Kenneth L. Wolfe (67) |
| Year of Election or Appointment: 2005 Prior to his retirement in 2001, Mr. Wolfe was Chairman and Chief Executive Officer of Hershey Foods Corporation (1993-2001). He currently serves as a member of the boards of Adelphia Communications Corporation (2003-present), Bausch & Lomb, Inc., and Revlon Inc. (2004-present). |
Annual Report
Advisory Board Members and Executive Officers:
Correspondence intended for Mr. Keyes may be sent to Fidelity Investments, P.O. Box 55235, Boston, Massachusetts 02205-5235. Correspondence intended for each executive officer and Mr. Lynch may be sent to Fidelity Investments, 82 Devonshire Street, Boston, Massachusetts 02109.
Name, Age; Principal Occupation |
James H. Keyes (66) |
| Year of Election or Appointment: 2006 Member of the Advisory Board of Fidelity Investment Trust. Prior to his retirement in 2003, Mr. Keyes was Chairman, President, and Chief Executive Officer of Johnson Controls, Inc. (automotive supplier, 1993-2003). He currently serves as a member of the boards of LSI Logic Corporation (semiconductor technologies), Navistar International Corporation (manufacture and sale of trucks, buses, and diesel engines, 2002-present), and Pitney Bowes, Inc. (integrated mail, messaging, and document management solutions). |
Peter S. Lynch (62) |
| Year of Election or Appointment: 2003 Member of the Advisory Board of Fidelity Investment Trust. Mr. Lynch is Vice Chairman and a Director of FMR, and Vice Chairman (2001- present) and a Director of FMR Co., Inc. Previously, Mr. Lynch served as a Trustee of the Fidelity funds (1990-2003). In addition, he serves as a Trustee of Boston College and as the Chairman of the Inner-City Scholarship Fund. |
Dwight D. Churchill (52) |
| Year of Election or Appointment: 2005 Vice President of the fund. Mr. Churchill also serves as Vice President of certain Equity Funds (2005-present). Mr. Churchill is Executive Vice President of FMR (2005-present) and FMR Co., Inc. (2005-present). Previously, Mr. Churchill served as Senior Vice President of Fidelity Investments Money Management, Inc. (2005-2006), Head of Fidelity's Fixed-Income Division (2000-2005), Vice President of Fidelity's Money Market Funds (2000-2005), Vice President of Fidelity's Bond Funds, and Senior Vice President of FMR. |
Eric M. Wetlaufer (44) |
| Year of Election or Appointment: 2006 Vice President of the fund. Mr. Wetlaufer also serves as Vice President of certain International Equity Funds (2006-present). Mr. Wetlaufer is Senior Vice President of FMR (2006-present) and FMR Co., Inc. (2006-present), and President and Director of Fidelity Management & Research (U.K.) Inc. (2006-present) and Fidelity Research & Analysis Company (2006-present). Before joining Fidelity Investments in 2005, Mr. Wetlaufer was a partner in Oxhead Capital Management (2004-2005). Previously, Mr. Wetlaufer served as a Chief Investment Officer of Putnam Investments (1997-2003). |
Andrew Sassine (42) |
| Year of Election or Appointment: 2005 Vice President of the fund. Mr. Sassine also serves as Vice President for other funds advised by FMR. Prior to his current responsibilities, Mr. Sassine worked as a research analyst and portfolio manager. Mr. Sassine also serves as a Vice President of FMR and FMR Co., Inc. (2006). |
Eric D. Roiter (57) |
| Year of Election or Appointment: 2005 Secretary of the fund. He also serves as Secretary of other Fidelity funds; Vice President, General Counsel, and Secretary of FMR Co., Inc. (2001-present) and FMR; Assistant Secretary of Fidelity Management & Research (U.K.) Inc. (2001-present), Fidelity Research & Analysis Company (2001-present), and Fidelity Investments Money Management, Inc. (2001-present). Mr. Roiter is an Adjunct Member, Faculty of Law, at Boston College Law School (2003-present). Previously, Mr. Roiter served as Vice President and Secretary of Fidelity Distributors Corporation (FDC) (1998-2005). |
Stuart Fross (47) |
| Year of Election or Appointment: 2005 Assistant Secretary of the fund. Mr. Fross also serves as Assistant Secretary of other Fidelity funds (2003-present), Vice President and Secretary of FDC (2005-present), and is an employee of FMR. |
Christine Reynolds (48) |
| Year of Election or Appointment: 2005 President and Treasurer of the fund. Ms. Reynolds also serves as President and Treasurer of other Fidelity funds (2004-present) and is a Vice President (2003-present) and an employee (2002-present) of FMR. Before joining Fidelity Investments, Ms. Reynolds worked at PricewaterhouseCoopers LLP (PwC) (1980-2002), where she was most recently an audit partner with PwC's investment management practice. |
R. Stephen Ganis (40) |
| Year of Election or Appointment: 2006 Anti-Money Laundering (AML) officer of the fund. Mr. Ganis also serves as AML officer of other Fidelity funds (2006-present) and FMR Corp. (2003-present). Before joining Fidelity Investments, Mr. Ganis practiced law at Goodwin Procter, LLP (2000-2002). |
Joseph B. Hollis (58) |
| Year of Election or Appointment: 2006 Chief Financial Officer of the fund. Mr. Hollis also serves as Chief Financial Officer of other Fidelity funds. Mr. Hollis is President of Fidelity Pricing and Cash Management Services (FPCMS) (2005-present). Mr. Hollis also serves as President and Director of Fidelity Service Company, Inc. (2006-present). Previously, Mr. Hollis served as Senior Vice President of Cash Management Services (1999-2002) and Investment Management Operations (2002-2005). |
Kenneth A. Rathgeber (59) |
| Year of Election or Appointment: 2005 Chief Compliance Officer of the fund. Mr. Rathgeber also serves as Chief Compliance Officer of other Fidelity funds (2004-present) and Executive Vice President of Risk Oversight for Fidelity Investments (2002-present). He is Chief Compliance Officer of FMR (2005-present), FMR Co., Inc. (2005-present), Fidelity Management & Research (U.K.) Inc. (2005-present), Fidelity Research & Analysis Company (2005- present), Fidelity Investments Money Management, Inc. (2005-present), and Strategic Advisers, Inc. (2005-present). Previously, Mr. Rathgeber served as Executive Vice President and Chief Operating Officer for Fidelity Investments Institutional Services Company, Inc. (1998-2002). |
Bryan A. Mehrmann (45) |
| Year of Election or Appointment: 2005 Deputy Treasurer of the fund. Mr. Mehrmann also serves as Deputy Treasurer of other Fidelity funds (2005-present) and is an employee of FMR. Previously, Mr. Mehrmann served as Vice President of Fidelity Investments Institutional Services Group (FIIS)/Fidelity Investments Institutional Operations Corporation, Inc. (FIIOC) Client Services (1998-2004). |
Kimberley H. Monasterio (42) |
| Year of Election or Appointment: 2005 Deputy Treasurer of the fund. Ms. Monasterio also serves as Deputy Treasurer of other Fidelity funds (2004) and is an employee of FMR (2004). Before joining Fidelity Investments, Ms. Monasterio served as Treasurer (2000-2004) and Chief Financial Officer (2002-2004) of the Franklin Templeton Funds and Senior Vice President of Franklin Templeton Services, LLC (2000-2004). |
Kenneth B. Robins (37) |
| Year of Election or Appointment: 2005 Deputy Treasurer of the fund. Mr. Robins also serves as Deputy Treasurer of other Fidelity funds (2005-present) and is an employee of FMR (2004-present). Before joining Fidelity Investments, Mr. Robins worked at KPMG LLP, where he was a partner in KPMG's department of professional practice (2002-2004) and a Senior Manager (1999-2000). In addition, Mr. Robins served as Assistant Chief Accountant, United States Securities and Exchange Commission (2000-2002). |
Robert G. Byrnes (39) |
| Year of Election or Appointment: 2005 Assistant Treasurer of the fund. Mr. Byrnes also serves as Assistant Treasurer of other Fidelity funds (2005-present) and is an employee of FMR (2005-present). Previously, Mr. Byrnes served as Vice President of FPCMS (2003-2005). Before joining Fidelity Investments, Mr. Byrnes worked at Deutsche Asset Management where he served as Vice President of the Investment Operations Group (2000-2003). |
John H. Costello (60) |
| Year of Election or Appointment: 2005 Assistant Treasurer of the fund. Mr. Costello also serves as Assistant Treasurer of other Fidelity funds and is an employee of FMR. |
Peter L. Lydecker (52) |
| Year of Election or Appointment: 2005 Assistant Treasurer of the fund. Mr. Lydecker also serves as Assistant Treasurer of other Fidelity funds (2004) and is an employee of FMR. |
Mark Osterheld (51) |
| Year of Election or Appointment: 2005 Assistant Treasurer of the fund. Mr. Osterheld also serves as Assistant Treasurer of other Fidelity funds (2002) and is an employee of FMR. |
Gary W. Ryan (48) |
| Year of Election or Appointment: 2005 Assistant Treasurer of the fund. Mr. Ryan also serves as Assistant Treasurer of other Fidelity funds (2005-present) and is an employee of FMR (2005-present). Previously, Mr. Ryan served as Vice President of Fund Reporting in FPCMS (1999-2005). |
Salvatore Schiavone (40) |
| Year of Election or Appointment: 2005 Assistant Treasurer of the fund. Mr. Schiavone also serves as Assistant Treasurer of other Fidelity funds (2005-present) and is an employee of FMR (2005-present). Before joining Fidelity Investments, Mr. Schiavone worked at Deutsche Asset Management, where he most recently served as Assistant Treasurer (2003-2005) of the Scudder Funds and Vice President and Head of Fund Reporting (1996-2003). |
Annual Report
Distributions
Class A designates 100% of the dividend distributed during the fiscal year as amounts which may be taken into account as a dividend for purposes of the maximum rate under section 1(h)(11) of the Internal Revenue Code.
The amounts per share which represent income derived from sources within, and taxes paid to, foreign countries or possessions of the United States are as follows:
| Pay Date | Income | Taxes |
Class A | 12/12/05 | $.004 | $.001 |
Class T | 12/12/05 | $0.00 | $0.00 |
Class B | 12/12/05 | $0.00 | $0.00 |
Class C | 12/12/05 | $0.00 | $0.00 |
The fund will notify shareholders in January 2007 of amounts for use in preparing 2006 income tax returns.
Annual Report
Board Approval of Investment Advisory Contracts and Management Fees
Fidelity International Small Cap Opportunities Fund
Each year, typically in July, the Board of Trustees, including the Independent Trustees (together, the Board), votes on the renewal of the management contract and sub-advisory agreements (together, the Advisory Contracts) for the fund. The Board, assisted by the advice of fund counsel and Independent Trustees' counsel, requests and considers a broad range of information throughout the year.
The Board meets regularly each month except August and takes into account throughout the year matters bearing on Advisory Contracts. The Board, acting directly and through its separate committees, considers at each of its meetings factors that are relevant to the annual renewal of the fund's Advisory Contracts, including the services and support provided to the fund and its shareholders. At the time of the renewal, the Board had 12 standing committees, each composed of Independent Trustees with varying backgrounds, to which the Board has assigned specific subject matter responsibilities in order to enhance effective decision-making by the Board. Each committee has adopted a written charter outlining the structure and purposes of the committee. One such committee, the Equity Contract Committee, meets periodically as needed throughout the year to consider matters specifically related to the annual renewal of Advisory Contracts. The committee requests and receives information on, and makes recommendations to the Independent Trustees concerning, the approval and annual review of the Advisory Contracts.
At its July 2006 meeting, the Board of Trustees, including the Independent Trustees, unanimously determined to renew the Advisory Contracts for the fund. In reaching its determination, the Board considered all factors it believed relevant, including (i) the nature, extent, and quality of the services to be provided to the fund and its shareholders (including the investment performance of the fund); (ii) the competitiveness of the management fee and total expenses of the fund; (iii) the total costs of the services to be provided by and the profits to be realized by the investment adviser and its affiliates from the relationship with the fund; (iv) the extent to which economies of scale would be realized as the fund grows; and (v) whether fee levels reflect these economies of scale, if any, for the benefit of fund shareholders.
In determining whether to renew the Advisory Contracts for the fund, the Board ultimately reached a determination, with the assistance of fund counsel and Independent Trustees' counsel, that the renewal of the Advisory Contracts and the compensation to be received by Fidelity under the management contract is consistent with Fidelity's fiduciary duty under applicable law. In addition to evaluating the specific factors noted above, the Board, in reaching its determination, is aware that shareholders in the fund have a broad range of investment choices available to them, including a wide choice among mutual funds offered by competitors to Fidelity, and that the fund's shareholders, with the opportunity to review and weigh the disclosure provided by the fund in its prospectus and other public disclosures, have chosen to invest in this fund, managed by Fidelity.
Annual Report
Board Approval of Investment Advisory Contracts and
Management Fees - continued
Nature, Extent, and Quality of Services Provided. The Board considered staffing within the investment adviser, FMR, and the sub-advisers (together, the Investment Advisers), including the background of the fund's portfolio manager and the fund's investment objective and discipline. The Independent Trustees also had discussions with senior management of Fidelity's investment operations and investment groups. The Board considered the structure of the portfolio manager compensation program and whether this structure provides appropriate incentives.
Resources Dedicated to Investment Management and Support Services. The Board reviewed the size, education, and experience of the Investment Advisers' investment staff, their use of technology, and the Investment Advisers' approach to recruiting, training, and retaining portfolio managers and other research, advisory, and management personnel. The Board considered Fidelity's extensive global research capabilities that enable the Investment Advisers to aggregate data from various sources in an effort to produce positive investment results. The Board noted that Fidelity's analysts have access to a variety of technological tools that enable them to perform both fundamental and quantitative analysis and to specialize in various disciplines. The Board also considered that Fidelity's portfolio managers and analysts have access to daily portfolio attribution that allows for monitoring of a fund's portfolio, as well as an electronic communication system that provides immediate real-time access to research concerning issuers and credit enhancers.
Shareholder and Administrative Services. The Board considered (i) the nature, extent, quality, and cost of administrative, distribution, and shareholder services performed by the Investment Advisers and their affiliates under the Advisory Contracts and under separate agreements covering transfer agency, pricing and bookkeeping, and securities lending services for the fund; (ii) the nature and extent of the Investment Advisers' supervision of third party service providers, principally custodians and subcustodians; and (iii) the resources devoted to, and the record of compliance with, the fund's compliance policies and procedures. The Board reviewed the allocation of fund brokerage, including allocations to brokers affiliated with the Investment Advisers, the use of brokerage commissions to pay fund expenses, and the use of "soft" commission dollars to pay for research services. The Board also considered that Fidelity voluntarily pays for market data out of its own resources.
The Board noted that the growth of fund assets across the complex allows Fidelity to reinvest in the development of services designed to enhance the value or convenience of the Fidelity funds as investment vehicles. These services include 24-hour access to account information and market information through phone representatives and over the Internet, and investor education materials and asset allocation tools.
Annual Report
Investment in a Large Fund Family. The Board considered the benefits to shareholders of investing in a Fidelity fund, including the benefits of investing in a fund that is part of a large family of funds offering a variety of investment disciplines and providing for a large variety of mutual fund investor services. For example, fund shareholders are offered the privilege of exchanging shares of the fund for shares of other Fidelity funds, as set forth in the fund's prospectus, without paying an additional sales charge. The Board noted that, since July 2005, Fidelity has taken a number of actions that benefited particular funds, including (i) dedicating additional resources to investment research and to restructure the investment research teams; (ii) voluntarily entering into contractual arrangements with certain brokers pursuant to which Fidelity pays for research products and services separately out of its own resources, rather than bundling with fund commissions; (iii) launching the Fidelity Advantage Class of its five Spartan stock index funds and three Spartan bond index funds, which is a lower-fee class available to shareholders with higher account balances; (iv) contractually agreeing to impose expense limitations on Fidelity U.S. Bond Index Fund and reducing the fund's initial investment minimum; and (v) offering shareholders of each of the Fidelity Institutional Money Market Funds the privilege of exchanging shares of the fund for shares of other Fidelity funds
Investment Performance and Compliance. The Board considered whether the fund has operated within its investment objective, as well as its record of compliance with its investment restrictions. The Board noted that it is not possible to evaluate performance in any comprehensive fashion because the fund had been in operation for less than one calendar year. Once the fund has been in operation for at least one calendar year, the Board will review the fund's absolute investment performance for each class, as well as the fund's relative investment performance for each class measured against a broad-based securities market index and a peer group of mutual funds.
The Board considered that FMR has taken steps to refocus and strengthen equity research, equity portfolio management, and compliance. The Board noted with favor FMR's reorganization of its senior management team in 2005 and FMR's dedication of additional resources to investment research, and participated in the process that led to those changes.
Based on its review, and giving particular weight to the nature and quality of the resources dedicated by the Investment Advisers to maintain and improve relative performance, the Board concluded that the nature, extent, and quality of the services provided to the fund will benefit the fund's shareholders, particularly in light of the Board's view that the fund's shareholders benefit from investing in a fund that is part of a large family of funds offering a variety of investment disciplines and services.
Competitiveness of Management Fee and Total Fund Expenses. The Board considered the fund's management fee and total expenses compared to "mapped groups" of competitive funds and classes. Fidelity creates "mapped groups" by combining similar Lipper investment objective categories that have comparable management fee characteristics. Combining Lipper investment objective categories aids the Board's management fee and total expense comparisons by broadening the competitive group used for comparison and by reducing the number of universes to which various Fidelity funds are compared.
Annual Report
Board Approval of Investment Advisory Contracts and
Management Fees - continued
The Board considered two proprietary management fee comparisons for the period of the fund's operations shown in the chart below. The group of Lipper funds used by the Board for management fee comparisons is referred to below as the "Total Mapped Group" and, for the reasons explained above, is broader than the Lipper peer group used by the Board for performance comparisons. The Total Mapped Group comparison focuses on a fund's standing relative to the total universe of comparable funds available to investors, in terms of gross management fees before expense reimbursements or caps. "TMG %" represents the percentage of funds in the Total Mapped Group that had management fees that were lower than the fund's. For example, a TMG % of 38% means that 62% of the funds in the Total Mapped Group had higher management fees than the fund. The "Asset-Size Peer Group" (ASPG) comparison focuses on a fund's standing relative to non-Fidelity funds similar in size to the fund within the Total Mapped Group. The ASPG represents at least 15% of the funds in the Total Mapped Group with comparable asset size and management fee characteristics, subject to a minimum of 50 funds (or all funds in the Total Mapped Group if fewer than 50). Additional information, such as the ASPG quartile in which the fund's management fee ranked, is also included in the chart and considered by the Board.
Fidelity International Small Cap Opportunities Fund

Annual Report
The Board noted that the fund's management fee ranked below the median of its Total Mapped Group and below the median of its ASPG for the period.
Based on its review, the Board concluded that the fund's management fee was fair and reasonable in light of the services that the fund receives and the other factors considered.
In its review of each class's total expenses, the Board considered the fund's management fee as well as other fund or class expenses, as applicable, such as transfer agent fees, pricing and bookkeeping fees, fund-paid 12b-1 fees, and custodial, legal, and audit fees. The Board also noted the effects of any waivers and reimbursements on fees and expenses. As part of its review, the Board also considered current and historical total expenses of each class of the fund compared to competitive fund median expenses. Each class of the fund is compared to those funds and classes in the Total Mapped Group (used by the Board for management fee comparisons) that have a similar sales load structure.
The Board noted that the total expenses of Fidelity International Small Cap Opportunities (retail class) ranked equal to its competitive median for the period, and the total expenses of each of Class A, Class B, Class C, Class T and Institutional Class ranked above its competitive median for the period. The Board considered that the fund commenced operations in August 2005 and that the Advisor classes were above median primarily because of relatively high expenses in basis points due to small fund size. The Board noted that the fund offers multiple classes, each of which has a different sales load and 12b-1 fee structure, and that the multiple structures are intended to offer a range of pricing options for the intermediary market. The Board also noted that the total expenses of the classes vary primarily by the level of their 12b-1 fees, although differences in transfer agent fees may also cause expenses to vary from class to class.
In its review of total expenses, the Board also considered Fidelity fee structures and other information on clients that FMR and its affiliates service in other competitive markets, such as other mutual funds advised or subadvised by FMR or its affiliates, pension plan clients, and other institutional clients.
Based on its review, the Board concluded that the total expenses of each class of the fund were reasonable, although in some cases above the median of the universe presented for comparison, in light of the services that the fund and its shareholders receive and the other factors considered.
Costs of the Services and Profitability. The Board considered the revenues earned and the expenses incurred by Fidelity in conducting the business of developing, marketing, distributing, managing, administering and servicing the fund and its shareholders. The Board also considered the level of Fidelity's profits in respect of all the Fidelity funds.
Annual Report
Board Approval of Investment Advisory Contracts and
Management Fees - continued
On an annual basis, FMR presents to the Board Fidelity's profitability for the fund. Fidelity calculates the profitability for each fund, as well as aggregate profitability for groups of Fidelity funds and all Fidelity funds, using a series of detailed revenue and cost allocation methodologies which originate with the audited books and records of Fidelity. The Audit Committee of the Board reviews any significant changes from the prior year's methodologies.
PricewaterhouseCoopers LLP (PwC), independent registered accounting firm and auditor to Fidelity and certain Fidelity funds, has been engaged annually by the Board as part of the Board's assessment of the results of Fidelity's profitability analysis. PwC's engagement includes the review and assessment of Fidelity's methodologies used in determining the revenues and expenses attributable to Fidelity's mutual fund business, and completion of agreed-upon procedures surrounding the mathematical accuracy of fund profitability and its conformity to allocation methodologies. After considering PwC's reports issued under the engagement and information provided by Fidelity, the Board believes that while other allocation methods may also be reasonable, Fidelity's profitability methodologies are reasonable in all material respects.
The Board has also reviewed Fidelity's non-fund businesses and any fall-out benefits related to the mutual fund business as well as cases where Fidelity's affiliates may benefit from or be related to the fund's business.
The Board considered the costs of the services provided by and the profits realized by Fidelity in connection with the operation of the fund and determined that the amount of profit is a fair entrepreneurial profit for the management of the fund.
Economies of Scale. The Board considered whether there have been economies of scale in respect of the management of the Fidelity funds, whether the Fidelity funds (including the fund) have appropriately benefited from any such economies of scale, and whether there is potential for realization of any further economies of scale. The Board considered the extent to which the fund will benefit from economies of scale through increased services to the fund, through waivers or reimbursements, or through fee or expense reductions, including reductions that occur through operation of the transfer agent agreement. The transfer agent fee varies in part based on the number of accounts in the fund. If the number of accounts decreases or the average account size increases, the overall transfer agent fee rate decreases.
The Board recognized that the fund's management contract incorporates a "group fee" structure, which provides for lower fee rates as total fund assets under FMR's management increase, and for higher fee rates as total fund assets under FMR's management decrease. The Board considered that the group fee is designed to deliver the benefits of economies of scale to fund shareholders when total fund assets increase, even if assets of any particular fund are unchanged or have declined, because some portion of Fidelity's costs are attributable to services provided to all Fidelity funds, and all funds benefit if those costs can be allocated among more assets. The Board concluded that, given the group fee structure, fund shareholders will achieve a certain level of economies of scale as assets under FMR's management increase at the fund complex level, regardless of whether Fidelity achieves any such economies of scale.
Annual Report
The Board further concluded that any potential economies of scale are being shared between fund shareholders and Fidelity in an appropriate manner.
Additional Information Requested by the Board. In order to develop fully the factual basis for consideration of the Advisory Contracts, the Board requested additional information on several topics, including (i) Fidelity's fund profitability methodology and profitability trends within certain funds; (ii) portfolio manager compensation; (iii) the extent to which any economies of scale exist and are shared between the funds and Fidelity; (iv) the total expenses of certain funds and classes relative to competitors, including the extent to which the expenses of certain funds have been or could be capped; (v) fund performance trends; and (vi) Fidelity's fee structures, including use of performance fees.
Based on its evaluation of all of the conclusions noted above, and after considering all material factors, the Board ultimately concluded that the advisory fee structures are fair and reasonable, and that the fund's Advisory Contracts should be renewed.
Annual Report
Annual Report
Annual Report
Annual Report
Annual Report
Investment Adviser
Fidelity Management & Research Company
Boston, MA
Investment Sub-Advisers
FMR Co., Inc.
Fidelity Management & Research
(U.K.) Inc.
Fidelity Research & Analysis Company
(formerly Fidelity Management &
Research (Far East) Inc.)
Fidelity International Investment Advisors
Fidelity Investments Japan Limited
Fidelity International Investment Advisors (U.K.) Limited
General Distributor
Fidelity Distributors Corporation
Boston, MA
Transfer and Service Agents
Fidelity Investments Institutional
Operations Company, Inc.
Boston, MA
Fidelity Service Company, Inc.
Boston, MA
Custodian
The Northern Trust Company
Chicago, IL
(Fidelity Investment logo)(registered trademark)
Corporate Headquarters
82 Devonshire St., Boston, MA 02109
www.fidelity.com
AILS-UANN-1206
1.815089.101
(Fidelity Investment logo)(registered trademark)
Fidelity Advisor
International Small Cap Opportunities
Fund - Institutional Class
Annual Report
October 31, 2006
(2_fidelity_logos) (Registered_Trademark)
Institutional Class
is a class of Fidelity®
International Small Cap
Opportunities Fund
Contents
Chairman's Message | 4 | Ned Johnson's message to shareholders. |
Performance | 5 | How the fund has done over time. |
Management's Discussion | 6 | The manager's review of fund performance, strategy and outlook. |
Shareholder Expense Example | 7 | An example of shareholder expenses. |
Investment Changes | 9 | A summary of major shifts in the fund's investments over the past six months. |
Investments | 11 | A complete list of the fund's investments with their market values. |
Financial Statements | 17 | Statements of assets and liabilities, operations, and changes in net assets,
as well as financial highlights. |
Notes | 27 | Notes to the financial statements. |
Report of Independent Registered Public Accounting Firm | 37 | |
Trustees and Officers | 38 | |
Distributions | 49 | |
Board Approval of Investment Advisory Contracts and Management Fees | 50 | |
To view a fund's proxy voting guidelines and proxy voting record for the 12-month period ended June 30, visit www.fidelity.com/proxyvotingresults or visit the Securities and Exchange Commission's (SEC) web site at www.sec.gov. You may also call 1-877-208-0098 to request a free copy of the proxy voting guidelines.
Standard & Poor's, S&P and S&P 500 are registered service marks of The McGraw-Hill Companies, Inc. and have been licensed for use by Fidelity Distributors Corporation.
Other third party marks appearing herein are the property of their respective owners.
All other marks appearing herein are registered or unregistered trademarks or service marks of FMR Corp. or an affiliated company.
Annual Report
This report and the financial statements contained herein are submitted for the general information of the shareholders of the fund. This report is not authorized for distribution to prospective investors in the fund unless preceded or accompanied by an effective prospectus.
A fund files its complete schedule of portfolio holdings with the SEC for the first and third quarters of each fiscal year on Form N-Q. Forms N-Q are available on the SEC's web site at http://www.sec.gov. A fund's Forms N-Q may be reviewed and copied at the SEC's Public Reference Room in Washington, DC. Information regarding the operation of the SEC's Public Reference Room may be obtained by calling 1-800-SEC-0330. For a complete list of a fund's portfolio holdings, view the most recent quarterly holdings report, semiannual report, or annual report on Fidelity's web site at http://www.advisor.fidelity.com.
NOT FDIC INSURED · MAY LOSE VALUE · NO BANK GUARANTEE
Neither the fund nor Fidelity Distributors Corporation is a bank.
Annual Report
Chairman's Message
(photo_of_Edward_C_Johnson_3d)
Dear Shareholder:
Stock and bond markets around the world have seen largely positive results year to date, although weakness in the technology sector and growth stocks in general have tempered performance. While financial markets are always unpredictable, there are a number of time-tested principles that can put the historical odds in your favor.
One of the basic tenets is to invest for the long term. Over time, riding out the markets' inevitable ups and downs has proven much more effective than selling into panic or chasing the hottest trend. Even missing only a few of the markets' best days can significantly diminish investor returns. Patience also affords the benefits of compounding - of earning interest on additional income or reinvested dividends and capital gains. There are tax advantages and cost benefits to consider as well. The more you sell, the more taxes you pay, and the more you trade, the higher the costs. While staying the course doesn't eliminate risk, it can considerably lessen the effect of short-term declines.
You can further manage your investing risk through diversification. And today, more than ever, geographic diversification should be taken into account. Studies indicate that asset allocation is the single most important determinant of a portfolio's long-term success. The right mix of stocks, bonds and cash - aligned to your particular risk tolerance and investment objective - is very important. Age-appropriate rebalancing is also an essential aspect of asset allocation. For younger investors, an emphasis on equities - which historically have been the best performing asset class over time - is encouraged. As investors near their specific goal, such as retirement or sending a child to college, consideration may be given to replacing volatile assets (e.g. common stocks) with more-stable fixed investments (bonds or savings plans).
A third investment principle - investing regularly - can help lower the average cost of your purchases. Investing a certain amount of money each month or quarter helps ensure you won't pay for all your shares at market highs. This strategy - known as dollar cost averaging - also reduces unconstructive "emotion" from investing, helping shareholders avoid selling weak performers just prior to an upswing, or chasing a hot performer just before a correction.
We invite you to contact us via the Internet, through our Investor Centers or over the phone. It is our privilege to provide you the information you need to make the investments that are right for you.
Sincerely,
/s/Edward C. Johnson 3d
Edward C. Johnson 3d
Annual Report
Performance: The Bottom Line
Average annual total return reflects the change in the value of an investment, assuming reinvestment of the class' dividend income and capital gains (the profits earned upon the sale of securities that have grown in value) and assuming a constant rate of performance each year. The $10,000 table and the fund's returns do not reflect the deduction of taxes that a shareholder would pay on fund distributions or the redemption of fund shares. During periods of reimbursement by Fidelity, a fund's total return will be greater than it would be had the reimbursement not occurred. How a fund did yesterday is no guarantee of how it will do tomorrow.
Average Annual Total Returns
Periods ended October 31, 2006 | | Past 1
year | Life of
fund A |
Institutional Class | | 36.77% | 32.65% |
A From August 2, 2005.
$10,000 Over Life of Fund
Let's say hypothetically that $10,000 was invested in Fidelity Advisor International Small Cap Opportunities Fund - Institutional Class on August 2, 2005, when the fund started. The chart shows how the value of your investment would have changed, and also shows how the Morgan Stanley Capital InternationalSM Europe, Australia, Far East (MSCI® EAFE®) Small Cap Index performed over the same period.
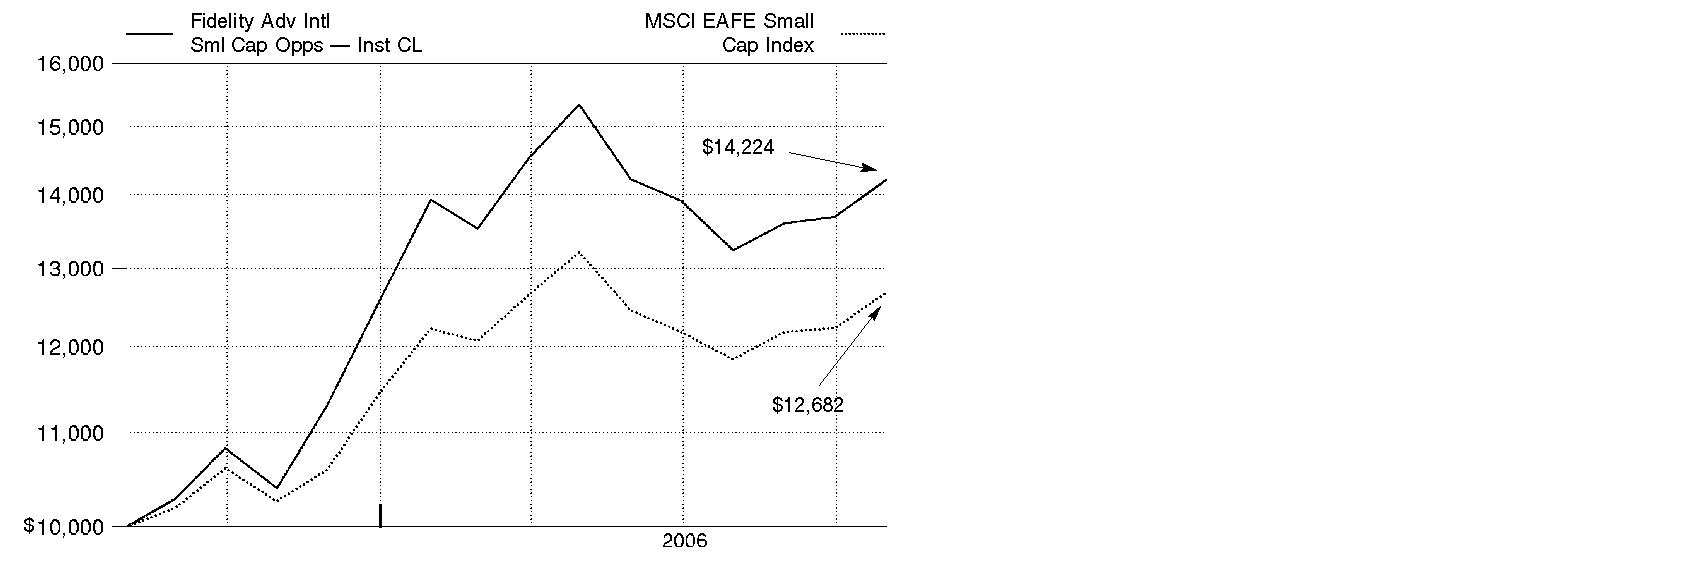
Annual Report
Management's Discussion of Fund Performance
Comments from Andrew Sassine, Portfolio Manager of Fidelity Advisor International Small Cap Opportunities Fund
International equity markets as a whole outpaced their U.S. counterparts for the 12 months ending October 31, 2006 - partly as a result of favorable currency exchanges that boosted returns for U.S. investors. The Morgan Stanley Capital InternationalSM Europe, Australasia, Far East (MSCI® EAFE®) Index - a gauge of developed stock markets outside the United States and Canada - gained 27.72% during that time. European markets benefited from solid corporate profit growth and attractive dividends, which helped the MSCI Europe index advance 31.95%. Strong performing Latin American and Asian emerging markets drove the MSCI Emerging Markets index to a lofty 35.42% return. Japan was somewhat of an exception to the generally stellar foreign market performance after struggling in the middle part of the period. Still, its earlier gains helped the Tokyo Stock Exchange Stock Price Index (TOPIX) - a benchmark of the largest and better-established stocks traded on the Tokyo Stock Exchange - rise 12.47% overall. Natural-resources-rich Canada also struggled over the final six months as energy prices fell, but the S&P/TSX Composite Index managed a 12-month return of 28.21%.
The fund's Institutional Class shares gained 36.77% for the period, easily outpacing the MSCI EAFE Small Cap index, which returned 23.55%. Overweightings and good stock selection in the strong performing materials and industrials sectors, along with favorable picks within the fund's large stakes in European and Japanese small-cap stocks, were the main drivers of performance relative to the index. Among the fund's top contributors were Titanium Metals, a U.S. producer of this stronger and lighter alternative to steel for the aerospace and automotive industries, and Vallourec, a French specialty steel company that makes seamless pipe for offshore oil drilling. Good stock picking in the information technology sector also helped, with GigaMedia, a multimedia company based in Singapore, making a healthy contribution to performance. Inopportune stock selection in financials - mainly in banks and real estate - coupled with an underweighting in real estate, hurt results. Detractors included Japanese finance company OMC Card, which underperformed due to concerns about a regulatory proposal to cap interest rates on outstanding debt, and Japanese software company Intelligent Wave.
The views expressed above reflect those of the portfolio manager(s) only through the end of the period as stated on the cover of this report and do not necessarily represent the views of Fidelity or any other person in the Fidelity organization. Any such views are subject to change at any time based upon market or other conditions and Fidelity disclaims any responsibility to update such views. These views may not be relied on as investment advice and, because investment decisions for a Fidelity fund are based on numerous factors, may not be relied on as an indication of trading intent on behalf of any Fidelity fund.
Annual Report
Shareholder Expense Example
As a shareholder of the Fund, you incur two types of costs: (1) transaction costs, including sales charges (loads) on purchase payments or redemption proceeds, redemption fees, and (2) ongoing costs, including management fees, distribution and/or service (12b-1) fees and other Fund expenses. This Example is intended to help you understand your ongoing costs (in dollars) of investing in the Fund and to compare these costs with the ongoing costs of investing in other mutual funds.
The Example is based on an investment of $1,000 invested at the beginning of the period and held for the entire period (May 1, 2006 to October 31, 2006).
Actual Expenses
The first line of the accompanying table for each class of the Fund provides information about actual account values and actual expenses. You may use the information in this line, together with the amount you invested, to estimate the expenses that you paid over the period. Simply divide your account value by $1,000.00 (for example, an $8,600 account value divided by $1,000.00 = 8.6), then multiply the result by the number in the first line for a class of the Fund under the heading entitled "Expenses Paid During Period" to estimate the expenses you paid on your account during this period.
Hypothetical Example for Comparison Purposes
The second line of the accompanying table for each class of the Fund provides information about hypothetical account values and hypothetical expenses based on a Class' actual expense ratio and an assumed rate of return of 5% per year before expenses, which is not the Class' actual return. The hypothetical account values and expenses may not be used to estimate the actual ending account balance or expenses you paid for the period. You may use this information to compare the ongoing costs of investing in the Fund and other funds. To do so, compare this 5% hypothetical example with the 5% hypothetical examples that appear in the shareholder reports of the other funds.
Annual Report
Shareholder Expense Example - continued
Please note that the expenses shown in the table are meant to highlight your ongoing costs only and do not reflect any transaction costs. Therefore, the second line of the table is useful in comparing ongoing costs only, and will not help you determine the relative total costs of owning different funds. In addition, if these transactional costs were included, your costs would have been higher.
| Beginning
Account Value
May 1, 2006 | Ending
Account Value
October 31, 2006 | Expenses Paid
During Period*
May 1, 2006
to October 31, 2006 |
Class A | | | |
Actual | $ 1,000.00 | $ 925.60 | $ 8.06 |
HypotheticalA | $ 1,000.00 | $ 1,016.84 | $ 8.44 |
Class T | | | |
Actual | $ 1,000.00 | $ 924.70 | $ 9.12 |
HypotheticalA | $ 1,000.00 | $ 1,015.73 | $ 9.55 |
Class B | | | |
Actual | $ 1,000.00 | $ 922.50 | $ 11.73 |
HypotheticalA | $ 1,000.00 | $ 1,013.01 | $ 12.28 |
Class C | | | |
Actual | $ 1,000.00 | $ 921.80 | $ 11.63 |
HypotheticalA | $ 1,000.00 | $ 1,013.11 | $ 12.18 |
Fidelity International Small Cap Opportunities | | | |
Actual | $ 1,000.00 | $ 927.60 | $ 6.27 |
HypotheticalA | $ 1,000.00 | $ 1,018.70 | $ 6.56 |
Institutional Class | | | |
Actual | $ 1,000.00 | $ 927.00 | $ 6.22 |
HypotheticalA | $ 1,000.00 | $ 1,018.75 | $ 6.51 |
A 5% return per year before expenses
* Expenses are equal to each Class' annualized expense ratio (shown in the table below); multiplied by the average account value over the period, multiplied by 184/365 (to reflect the one-half year period).
| Annualized
Expense Ratio |
Class A | 1.66% |
Class T | 1.88% |
Class B | 2.42% |
Class C | 2.40% |
Fidelity International Small Cap Opportunities | 1.29% |
Institutional Class | 1.28% |
Annual Report
Investment Changes
Geographic Diversification (% of fund's net assets) |
As of October 31, 2006 |
| Japan 32.7% |
| Germany 10.3% |
| United States of America 10.0% |
| France 6.8% |
| United Kingdom 6.0% |
| Australia 5.5% |
| Spain 4.5% |
| Italy 3.5% |
| Sweden 3.4% |
| Other 17.3% |

Percentages are adjusted for the effect of futures contracts, if applicable. |
|
As of April 30, 2006 |
| Japan 38.9% | |
| Germany 10.6% | |
| France 8.0% | |
| United States of America 6.6% | |
| United Kingdom 5.5% | |
| Korea (South) 5.4% | |
| Australia 4.1% | |
| Sweden 3.2% | |
| Norway 2.2% | |
| Other 15.5% | |

Percentages are adjusted for the effect of futures contracts, if applicable. |
Asset Allocation |
| % of fund's
net assets | % of fund's net assets
6 months ago |
Stocks | 99.1 | 97.9 |
Short-Term Investments and Net Other Assets | 0.9 | 2.1 |
Top Ten Stocks as of October 31, 2006 |
| % of fund's
net assets | % of fund's net assets
6 months ago |
Titanium Metals Corp. (United States of America, Metals & Mining) | 3.0 | 2.1 |
Silicon On Insulator Technologies SA (SOITEC) (France, Semiconductors & Semiconductor Equipment) | 2.3 | 1.4 |
Demag Cranes AG (Germany, Machinery) | 2.0 | 0.0 |
Neopost SA (France, Office Electronics) | 2.0 | 1.4 |
MG Technologies AG (Germany, Chemicals) | 1.9 | 1.0 |
Allegheny Technologies, Inc. (United States of America, Metals & Mining) | 1.9 | 0.4 |
Renovo Group PLC (United Kingdom, Pharmaceuticals) | 1.8 | 0.9 |
Abengoa SA (Spain, Construction & Engineering) | 1.8 | 0.4 |
KK daVinci Advisors (Japan, Real Estate Management & Development) | 1.8 | 1.2 |
Deutz AG (Germany, Machinery) | 1.8 | 1.2 |
| 20.3 | |
Market Sectors as of October 31, 2006 |
| % of fund's
net assets | % of fund's net assets
6 months ago |
Industrials | 23.4 | 28.1 |
Information Technology | 19.3 | 16.6 |
Materials | 16.5 | 16.1 |
Financials | 15.0 | 15.6 |
Consumer Staples | 6.9 | 2.4 |
Consumer Discretionary | 6.7 | 11.2 |
Health Care | 5.7 | 3.2 |
Energy | 3.8 | 4.7 |
Telecommunication Services | 1.8 | 0.0 |
Annual Report
Investments October 31, 2006
Showing Percentage of Net Assets
Common Stocks - 99.1% |
| Shares | | Value (Note 1) |
Australia - 5.5% |
Babcock & Brown Ltd. | 700,000 | | $ 11,824,367 |
CSL Ltd. | 423,300 | | 18,380,564 |
Oxiana Ltd. | 6,340,600 | | 16,247,385 |
United Group Ltd. | 1,196,308 | | 13,530,640 |
TOTAL AUSTRALIA | | 59,982,956 |
Austria - 0.8% |
Andritz AG | 49,974 | | 9,066,658 |
Brazil - 0.9% |
Cosan SA Industria E Comercio | 570,000 | | 9,744,045 |
China - 1.9% |
China Techfaith Wireless Communication Technology Ltd. sponsored ADR (a)(d) | 1,310,696 | | 9,620,509 |
Comba Telecom Systems Holdings Ltd. | 9,738,000 | | 3,380,728 |
Global Bio-Chem Technology Group Co. Ltd. | 15,633,300 | | 4,583,131 |
ZTE Corp. (H Shares) | 1,000,000 | | 3,703,132 |
TOTAL CHINA | | 21,287,500 |
Finland - 2.6% |
KCI Konecranes Oyj | 734,000 | | 15,814,494 |
Metso Corp. | 290,900 | | 12,642,927 |
TOTAL FINLAND | | 28,457,421 |
France - 6.8% |
Alstom SA (a) | 150,062 | | 13,848,280 |
Compagnie Generale de Geophysique SA (a)(d) | 40,902 | | 6,917,469 |
Neopost SA | 178,400 | | 21,814,595 |
Rhodia SA | 60,700 | | 167,351 |
Silicon On Insulator Technologies SA (SOITEC) (a)(d) | 857,812 | | 25,412,890 |
Vallourec SA | 23,300 | | 5,799,323 |
TOTAL FRANCE | | 73,959,908 |
Germany - 10.3% |
Demag Cranes AG | 600,000 | | 21,872,390 |
Deutz AG (a)(d) | 1,951,432 | | 19,652,474 |
K&S AG | 65,000 | | 6,151,929 |
MG Technologies AG | 1,169,800 | | 21,008,377 |
MTU Aero Engines Holding AG | 281,750 | | 11,561,966 |
Q-Cells AG (d) | 138,800 | | 5,492,094 |
SGL Carbon AG (a) | 320,000 | | 7,008,968 |
SolarWorld AG (d) | 103,000 | | 5,540,112 |
Common Stocks - continued |
| Shares | | Value (Note 1) |
Germany - continued |
Wacker Chemie AG | 27,200 | | $ 3,269,054 |
Wincor Nixdorf AG | 75,900 | | 10,554,941 |
TOTAL GERMANY | | 112,112,305 |
India - 0.4% |
Bajaj Hindusthan Ltd. | 700,000 | | 4,857,302 |
Ireland - 1.0% |
Ryanair Holdings PLC sponsored ADR (a) | 163,800 | | 10,945,116 |
Italy - 3.5% |
Banca Italease Spa | 339,240 | | 18,944,010 |
Eurotech Spa (d) | 400,000 | | 4,714,001 |
Lottomatica Spa | 220,000 | | 8,031,109 |
Nice Spa | 820,200 | | 7,014,252 |
TOTAL ITALY | | 38,703,372 |
Japan - 32.7% |
Acca Networks Co. Ltd. (a) | 2,661 | | 3,435,457 |
Access Co. Ltd. (a)(d) | 1,065 | | 7,093,323 |
Air Water, Inc. (d) | 941,000 | | 9,018,990 |
Ajinomoto Co., Inc. | 500,000 | | 5,784,029 |
Asics Corp. | 609,000 | | 8,159,226 |
Asset Managers Co. Ltd. (d) | 3,916 | | 10,714,091 |
Atrium Co. Ltd. (d) | 227,200 | | 7,750,753 |
Credit Saison Co. Ltd. | 285,800 | | 10,336,303 |
Daiei, Inc. (a)(d) | 162,700 | | 3,053,407 |
Dainippon Screen Manufacturing Co. Ltd. (d) | 516,000 | | 4,305,883 |
E*TRADE Securities Co. Ltd. (d) | 5,000 | | 5,258,208 |
Fujikura Ltd. | 1,142,000 | | 12,214,792 |
Furukawa Electric Co. Ltd. | 1,038,000 | | 7,410,483 |
Haseko Corp. (a)(d) | 1,451,000 | | 4,987,192 |
Hitachi Metals Ltd. | 685,000 | | 7,086,611 |
Intelligence Ltd. (d) | 2,882 | | 6,258,790 |
Intelligent Wave, Inc. (d) | 7,474 | | 6,965,339 |
Japan Asia Investment Co. Ltd. | 500,000 | | 2,800,103 |
Japan General Estate Co. Ltd. | 565,400 | | 14,840,784 |
Joint Corp. | 378,600 | | 14,890,220 |
Kenedix, Inc. | 2,500 | | 14,043,263 |
KK daVinci Advisors (a)(d) | 18,098 | | 19,806,294 |
Komatsu Electron Metals Co. Ltd. | 1,100 | | 44,015 |
Meiko Electronics Co. Ltd. | 70,900 | | 2,849,094 |
Miraial Co. Ltd. | 49,400 | | 5,097,965 |
Nabtesco Corp. | 488,000 | | 5,862,175 |
Common Stocks - continued |
| Shares | | Value (Note 1) |
Japan - continued |
NEOMAX Co. Ltd. (d) | 464,000 | | $ 8,529,412 |
NGK Insulators Ltd. | 387,000 | | 5,251,103 |
Nidec Corp. | 100,000 | | 7,652,189 |
Nidec Sankyo Corp. (d) | 242,000 | | 2,702,223 |
Nintendo Co. Ltd. | 70,000 | | 14,316,006 |
Nippon Electric Glass Co. Ltd. | 382,000 | | 8,230,507 |
OMC Card, Inc. (d) | 1,846,500 | | 18,345,016 |
Organo Corp. | 595,000 | | 5,611,192 |
ORIX Corp. | 45,760 | | 12,891,519 |
Rakuten, Inc. | 13,000 | | 5,779,754 |
Stanley Electric Co. Ltd. | 200,000 | | 3,967,168 |
Sumco Corp. | 138,600 | | 9,859,371 |
Takeuchi Manufacturing Co. Ltd. | 100,000 | | 4,249,316 |
Toho Tenax Co. Ltd. (a)(d) | 1,262,000 | | 9,657,063 |
Tokai Carbon Co. Ltd. (d) | 500,000 | | 3,377,223 |
Tokuyama Corp. | 1,035,000 | | 13,025,992 |
Toray Industries, Inc. | 1,064,000 | | 7,668,879 |
Ufj Nicos Co. Ltd. (d) | 933,000 | | 4,211,902 |
Urban Corp. (d) | 266,700 | | 4,083,958 |
Valor Co. Ltd. | 144,000 | | 2,117,647 |
Yahoo! Japan Corp. | 15,000 | | 5,835,329 |
TOTAL JAPAN | | 357,429,559 |
Luxembourg - 0.9% |
Acergy SA (a)(d) | 560,400 | | 10,171,260 |
Netherlands - 0.8% |
Nutreco Holding NV | 140,000 | | 8,343,316 |
Norway - 2.9% |
Cermaq ASA | 400,000 | | 4,926,108 |
Fred Olsen Energy ASA (a)(d) | 98,900 | | 4,266,714 |
PAN Fish ASA (a) | 7,500,000 | | 5,874,614 |
Petroleum Geo-Services ASA (a) | 177,200 | | 10,314,934 |
ProSafe ASA | 100,000 | | 6,394,762 |
TOTAL NORWAY | | 31,777,132 |
Papua New Guinea - 1.0% |
Lihir Gold Ltd. (a) | 4,361,900 | | 9,286,103 |
Lihir Gold Ltd. sponsored ADR (a) | 70,000 | | 1,514,100 |
TOTAL PAPUA NEW GUINEA | | 10,800,203 |
Singapore - 1.2% |
GigaMedia Ltd. (a) | 1,300,000 | | 12,571,000 |
Common Stocks - continued |
| Shares | | Value (Note 1) |
South Africa - 0.5% |
Gold Fields Ltd. | 314,600 | | $ 5,272,696 |
Spain - 4.5% |
Abengoa SA | 658,324 | | 20,099,611 |
Azucarera Ebro Agricolas SA | 470,000 | | 10,438,399 |
Grifols SA | 1,777,380 | | 18,602,912 |
TOTAL SPAIN | | 49,140,922 |
Sweden - 3.4% |
Axfood AB | 185,000 | | 6,070,697 |
Bergman & Beving AB (B Shares) | 300,000 | | 6,729,065 |
Lindex AB | 1,000,000 | | 13,326,595 |
Modern Times Group AB (MTG) (B Shares) | 193,100 | | 11,122,286 |
TOTAL SWEDEN | | 37,248,643 |
Switzerland - 0.5% |
Sulzer AG (Reg.) | 6,000 | | 5,280,714 |
Taiwan - 1.9% |
Macronix International Co. Ltd. (a) | 19,049,000 | | 6,431,011 |
PixArt Imaging, Inc. | 1,467,000 | | 12,072,072 |
Prime View International Co. Ltd. (a) | 5,413,000 | | 2,529,058 |
TOTAL TAIWAN | | 21,032,141 |
United Kingdom - 6.0% |
Autonomy Corp. PLC (a) | 700,000 | | 6,415,876 |
Benfield Group PLC | 950,000 | | 6,315,256 |
Expro International Group PLC | 244,005 | | 3,555,958 |
Meggitt PLC | 1,495,431 | | 9,541,728 |
Michael Page International PLC | 869,827 | | 6,703,148 |
Optos PLC | 1,700,000 | | 5,707,240 |
Renovo Group PLC | 6,901,363 | | 20,108,544 |
Xansa PLC | 5,150,000 | | 7,760,664 |
TOTAL UNITED KINGDOM | | 66,108,414 |
United States of America - 9.1% |
Allegheny Technologies, Inc. | 266,100 | | 20,950,053 |
Chiquita Brands International, Inc. | 900,000 | | 12,330,000 |
NII Holdings, Inc. (a) | 116,800 | | 7,595,504 |
RTI International Metals, Inc. (a) | 228,300 | | 13,999,356 |
Common Stocks - continued |
| Shares | | Value (Note 1) |
United States of America - continued |
Time Warner Telecom, Inc. Class A (sub. vtg.) (a) | 587,000 | | $ 11,704,780 |
Titanium Metals Corp. | 1,122,250 | | 33,083,931 |
TOTAL UNITED STATES OF AMERICA | | 99,663,624 |
TOTAL COMMON STOCKS (Cost $967,524,817) | 1,083,956,207 |
Money Market Funds - 9.5% |
| | | |
Fidelity Cash Central Fund, 5.34% (b) | 12,721,965 | | 12,721,965 |
Fidelity Securities Lending Cash Central Fund, 5.35% (b)(c) | 90,676,921 | | 90,676,921 |
TOTAL MONEY MARKET FUNDS (Cost $103,398,886) | 103,398,886 |
TOTAL INVESTMENT PORTFOLIO - 108.6% (Cost $1,070,923,703) | | 1,187,355,093 |
NET OTHER ASSETS - (8.6)% | | (94,179,549) |
NET ASSETS - 100% | $ 1,093,175,544 |
Legend |
(a) Non-income producing |
(b) Affiliated fund that is available only to investment companies and other accounts managed by Fidelity Investments. The rate quoted is the annualized seven-day yield of the fund at period end. A complete unaudited listing of the fund's holdings as of its most recent quarter end is available upon request. |
(c) Investment made with cash collateral received from securities on loan. |
(d) Security or a portion of the security is on loan at period end. |
Affiliated Central Funds |
Information regarding fiscal year to date income earned by the Fund from investments in Fidelity Central Funds is as follows: |
Fund | Income earned |
Fidelity Cash Central Fund | $ 889,896 |
Fidelity Securities Lending Cash Central Fund | 1,936,235 |
Total | $ 2,826,131 |
Income Tax Information |
At October 31, 2006, the fund had a capital loss carryforward of approximately $516,738 all of which will expire on October 31, 2013. |
Annual Report
See accompanying notes which are an integral part of the financial statements.
Financial Statements
Statement of Assets and Liabilities
October 31, 2006 |
Assets | | |
Investment in securities, at value (including securities loaned of $86,550,679) - See accompanying schedule: Unaffiliated issuers (cost $967,524,817) | $ 1,083,956,207 | |
Fidelity Central Funds (cost $103,398,886) | 103,398,886 | |
Total Investments (cost $1,070,923,703) | | $ 1,187,355,093 |
Receivable for investments sold | | 15,259,934 |
Receivable for fund shares sold | | 2,444,674 |
Dividends receivable | | 1,156,965 |
Interest receivable | | 74,208 |
Receivable from investment adviser for expense reductions | | 605 |
Other receivables | | 358,682 |
Total assets | | 1,206,650,161 |
| | |
Liabilities | | |
Payable for investments purchased | $ 18,817,648 | |
Payable for fund shares redeemed | 2,609,641 | |
Accrued management fee | 924,055 | |
Distribution fees payable | 45,153 | |
Other affiliated payables | 249,592 | |
Other payables and accrued expenses | 151,607 | |
Collateral on securities loaned, at value | 90,676,921 | |
Total liabilities | | 113,474,617 |
| | |
Net Assets | | $ 1,093,175,544 |
Net Assets consist of: | | |
Paid in capital | | $ 977,894,603 |
Undistributed net investment income | | 3,179,958 |
Accumulated undistributed net realized gain (loss) on investments and foreign currency transactions | | (4,329,237) |
Net unrealized appreciation (depreciation) on investments and assets and liabilities in foreign currencies | | 116,430,220 |
Net Assets | | $ 1,093,175,544 |
Annual Report
See accompanying notes which are an integral part of the financial statements.
Financial Statements - continued
Statement of Assets and Liabilities - continued
October 31, 2006 |
Calculation of Maximum Offering Price
Class A:
Net Asset Value and redemption price per share
($35,673,926 ÷ 2,515,423 shares) | | $ 14.18 |
| | |
Maximum offering price per share (100/94.25 of $14.18) | | $ 15.05 |
Class T:
Net Asset Value and redemption price per share
($28,308,901 ÷ 2,004,382 shares) | | $ 14.12 |
| | |
Maximum offering price per share (100/96.50 of $14.12) | | $ 14.63 |
Class B:
Net Asset Value and offering price per share
($7,708,704 ÷ 549,104 shares)A | | $ 14.04 |
| | |
Class C:
Net Asset Value and offering price per share
($26,320,302 ÷ 1,875,885 shares)A | | $ 14.03 |
| | |
| | |
Fidelity International Small Cap Opportunities:
Net Asset Value, offering price and redemption price per
share ($981,210,056 ÷ 68,977,418 shares) | | $ 14.23 |
| | |
Institutional Class:
Net Asset Value, offering price and redemption price per
share ($13,953,655 ÷ 981,185 shares) | | $ 14.22 |
A Redemption price per share is equal to net asset value less any applicable contingent deferred sales charge.
Annual Report
See accompanying notes which are an integral part of the financial statements.
Statement of Operations
Year ended October 31, 2006 |
| | |
Investment Income | | |
Dividends | | $ 13,145,566 |
Interest | | 3,266 |
Income from Fidelity Central Funds (including $1,936,235 from security lending) | | 2,826,131 |
| | 15,974,963 |
Less foreign taxes withheld | | (1,197,058) |
Total income | | 14,777,905 |
| | |
Expenses | | |
Management fee
Basic fee | $ 8,300,425 | |
Performance adjustment | 423,756 | |
Transfer agent fees | 2,163,979 | |
Distribution fees | 348,181 | |
Accounting and security lending fees | 492,883 | |
Custodian fees and expenses | 398,385 | |
Independent trustees' compensation | 3,317 | |
Registration fees | 327,338 | |
Audit | 56,012 | |
Legal | 14,931 | |
Interest | 139,137 | |
Miscellaneous | 4,124 | |
Total expenses before reductions | 12,672,468 | |
Expense reductions | (1,072,152) | 11,600,316 |
Net investment income (loss) | | 3,177,589 |
Realized and Unrealized Gain (Loss) Net realized gain (loss) on: | | |
Investment securities: | | |
Unaffiliated issuers | (559,117) | |
Investment not meeting investment restrictions | 35,982 | |
Foreign currency transactions | (430,569) | |
Total net realized gain (loss) | | (953,704) |
Change in net unrealized appreciation (depreciation) on: Investment securities | 115,233,371 | |
Assets and liabilities in foreign currencies | 1,829 | |
Total change in net unrealized appreciation (depreciation) | | 115,235,200 |
Net gain (loss) | | 114,281,496 |
Net increase (decrease) in net assets resulting from operations | | $ 117,459,085 |
Annual Report
See accompanying notes which are an integral part of the financial statements.
Financial Statements - continued
Statement of Changes in Net Assets
| Year ended
October 31,
2006 | August 2, 2005 (commencement
of operations)
to October 31, 2005 |
Increase (Decrease) in Net Assets | | |
Operations | | |
Net investment income (loss) | $ 3,177,589 | $ 25,230 |
Net realized gain (loss) | (953,704) | (3,306,632) |
Change in net unrealized appreciation (depreciation) | 115,235,200 | 1,195,020 |
Net increase (decrease) in net assets resulting
from operations | 117,459,085 | (2,086,382) |
Distributions to shareholders from net realized gain | (90,957) | - |
Share transactions - net increase (decrease) | 760,497,703 | 215,410,790 |
Redemption fees | 1,853,226 | 132,079 |
Total increase (decrease) in net assets | 879,719,057 | 213,456,487 |
| | |
Net Assets | | |
Beginning of period | 213,456,487 | - |
End of period (including undistributed net investment income of $3,179,958 and undistributed net investment income of $25,213, respectively) | $ 1,093,175,544 | $ 213,456,487 |
Annual Report
See accompanying notes which are an integral part of the financial statements.
Financial Highlights - Class A
Years ended October 31, | 2006 | 2005 I |
Selected Per-Share Data | | |
Net asset value, beginning of period | $ 10.41 | $ 10.00 |
Income from Investment Operations | | |
Net investment income (loss) E | - K | - K |
Net realized and unrealized gain (loss) | 3.74 | .40 H |
Total from investment operations | 3.74 | .40 |
Distributions from net realized gain | -K | - |
Redemption fees added to paid in capital E | .03 | .01 |
Net asset value, end of period | $ 14.18 | $ 10.41 |
Total Return B, C, D | 36.25% | 4.10% |
Ratios to Average Net Assets F, J | | |
Expenses before reductions | 1.63% | 2.67% A |
Expenses net of fee waivers, if any | 1.63% | 1.65%A |
Expenses net of all reductions | 1.51% | 1.54%A |
Net investment income (loss) | .02% | (.09)%A |
Supplemental Data | | |
Net assets, end of period (000 omitted) | $ 35,674 | $ 5,533 |
Portfolio turnover rate G | 164% | 46% |
A Annualized
B Total returns for periods of less than one year are not annualized.
C Total returns would have been lower had certain expenses not been reduced during the periods shown.
D Total returns do not include the effect of the sales charges.
E Calculated based on average shares outstanding during the period.
F Fees and expenses of the underlying Fidelity Central Funds are not included in the Fund's expense ratio. The Fund indirectly bears its proportionate share of the expenses of any underlying Fidelity Central Funds.
G Amount does not include the portfolio activity of any underlying Fidelity Central Funds.
H The amount shown for a share outstanding does not correspond with the aggregate net gain (loss) on investments for the period due to the timing of sales and repurchases of shares in relation to fluctuating market values of the investments of the Fund.
I For the period August 2, 2005 (commencement of operations) to October 31, 2005.
J Expense ratios reflect operating expenses of the class. Expenses before reductions do not reflect amounts reimbursed by the investment adviser or reductions from brokerage service arrangements or other expense offset arrangements and do not represent the amount paid by the class during periods when reimbursements or reductions occur. Expense ratios before reductions for start-up periods may not be representative of longer-term operating periods. Expenses net of fee waivers reflect expenses after reimbursement by the investment adviser but prior to reductions from brokerage service arrangements or other expense offset arrangements. Expenses net of all reductions represent the net expenses paid by the class.
K Amount represents less than $.01 per share.
Annual Report
See accompanying notes which are an integral part of the financial statements.
Financial Highlights - Class T
Years ended October 31, | 2006 | 2005 I |
Selected Per-Share Data | | |
Net asset value, beginning of period | $ 10.38 | $ 10.00 |
Income from Investment Operations | | |
Net investment income (loss) E | (.03) | (.01) |
Net realized and unrealized gain (loss) | 3.74 | .38 H |
Total from investment operations | 3.71 | .37 |
Redemption fees added to paid in capital E | .03 | .01 |
Net asset value, end of period | $ 14.12 | $ 10.38 |
Total Return B, C, D | 36.03% | 3.80% |
Ratios to Average Net Assets F, J | | |
Expenses before reductions | 1.85% | 2.92%A |
Expenses net of fee waivers, if any | 1.85% | 1.90%A |
Expenses net of all reductions | 1.74% | 1.78%A |
Net investment income (loss) | (.20)% | (.33)%A |
Supplemental Data | | |
Net assets, end of period (000 omitted) | $ 28,309 | $ 2,704 |
Portfolio turnover rate G | 164% | 46% |
A Annualized
B Total returns for periods of less than one year are not annualized.
C Total returns would have been lower had certain expenses not been reduced during the periods shown.
D Total returns do not include the effect of the sales charges.
E Calculated based on average shares outstanding during the period.
F Fees and expenses of the underlying Fidelity Central Funds are not included in the Fund's expense ratio. The Fund indirectly bears its proportionate share of the expenses of any underlying Fidelity Central Funds.
G Amount does not include the portfolio activity of any underlying Fidelity Central Funds.
H The amount shown for a share outstanding does not correspond with the aggregate net gain (loss) on investments for the period due to the timing of sales and repurchases of shares in relation to fluctuating market values of the investments of the Fund.
I For the period August 2, 2005 (commencement of operations) to October 31, 2005.
J Expense ratios reflect operating expenses of the class. Expenses before reductions do not reflect amounts reimbursed by the investment adviser or reductions from brokerage service arrangements or other expense offset arrangements and do not represent the amount paid by the class during periods when reimbursements or reductions occur. Expense ratios before reductions for start-up periods may not be representative of longer-term operating periods. Expenses net of fee waivers reflect expenses after reimbursement by the investment adviser but prior to reductions from brokerage service arrangements or other expense offset arrangements. Expenses net of all reductions represent the net expenses paid by the class.
Annual Report
See accompanying notes which are an integral part of the financial statements.
Financial Highlights - Class B
Years ended October 31, | 2006 | 2005 I |
Selected Per-Share Data | | |
Net asset value, beginning of period | $ 10.37 | $ 10.00 |
Income from Investment Operations | | |
Net investment income (loss) E | (.10) | (.02) |
Net realized and unrealized gain (loss) | 3.74 | .38 H |
Total from investment operations | 3.64 | .36 |
Redemption fees added to paid in capital E | .03 | .01 |
Net asset value, end of period | $ 14.04 | $ 10.37 |
Total Return B, C, D | 35.39% | 3.70% |
Ratios to Average Net Assets F, J | | |
Expenses before reductions | 2.45% | 3.43% A |
Expenses net of fee waivers, if any | 2.41% | 2.40%A |
Expenses net of all reductions | 2.30% | 2.27%A |
Net investment income (loss) | (.76)% | (.82)%A |
Supplemental Data | | |
Net assets, end of period (000 omitted) | $ 7,709 | $ 1,705 |
Portfolio turnover rate G | 164% | 46% |
A Annualized
B Total returns for periods of less than one year are not annualized.
C Total returns would have been lower had certain expenses not been reduced during the periods shown.
D Total returns do not include the effect of the contingent deferred sales charge.
E Calculated based on average shares outstanding during the period.
F Fees and expenses of the underlying Fidelity Central Funds are not included in the Fund's expense ratio. The Fund indirectly bears its proportionate share of the expenses of any underlying Fidelity Central Funds.
G Amount does not include the portfolio activity of any underlying Fidelity Central Funds.
H The amount shown for a share outstanding does not correspond with the aggregate net gain (loss) on investments for the period due to the timing of sales and repurchases of shares in relation to fluctuating market values of the investments of the Fund.
I For the period August 2, 2005 (commencement of operations) to October 31, 2005.
J Expense ratios reflect operating expenses of the class. Expenses before reductions do not reflect amounts reimbursed by the investment adviser or reductions from brokerage service arrangements or other expense offset arrangements and do not represent the amount paid by the class during periods when reimbursements or reductions occur. Expense ratios before reductions for start-up periods may not be representative of longer-term operating periods. Expenses net of fee waivers reflect expenses after reimbursement by the investment adviser but prior to reductions from brokerage service arrangements or other expense offset arrangements. Expenses net of all reductions represent the net expenses paid by the class.
Annual Report
See accompanying notes which are an integral part of the financial statements.
Financial Highlights - Class C
Years ended October 31, | 2006 | 2005 I |
Selected Per-Share Data | | |
Net asset value, beginning of period | $ 10.37 | $ 10.00 |
Income from Investment Operations | | |
Net investment income (loss) E | (.10) | (.02) |
Net realized and unrealized gain (loss) | 3.73 | .38 H |
Total from investment operations | 3.63 | .36 |
Redemption fees added to paid in capital E | .03 | .01 |
Net asset value, end of period | $ 14.03 | $ 10.37 |
Total Return B, C, D | 35.29% | 3.70% |
Ratios to Average Net Assets F, J | | |
Expenses before reductions | 2.38% | 3.32% A |
Expenses net of fee waivers, if any | 2.38% | 2.40%A |
Expenses net of all reductions | 2.27% | 2.29%A |
Net investment income (loss) | (.73)% | (.84)%A |
Supplemental Data | | |
Net assets, end of period (000 omitted) | $ 26,320 | $ 3,317 |
Portfolio turnover rate G | 164% | 46% |
A Annualized
B Total returns for periods of less than one year are not annualized.
C Total returns would have been lower had certain expenses not been reduced during the periods shown.
D Total returns do not include the effect of the contingent deferred sales charge.
E Calculated based on average shares outstanding during the period.
F Fees and expenses of the underlying Fidelity Central Funds are not included in the Fund's expense ratio. The Fund indirectly bears its proportionate share of the expenses of any underlying Fidelity Central Funds.
G Amount does not include the portfolio activity of any underlying Fidelity Central Funds.
H The amount shown for a share outstanding does not correspond with the aggregate net gain (loss) on investments for the period due to the timing of sales and repurchases of shares in relation to fluctuating market values of the investments of the Fund.
I For the period August 2, 2005 (commencement of operations) to October 31, 2005.
J Expense ratios reflect operating expenses of the class. Expenses before reductions do not reflect amounts reimbursed by the investment adviser or reductions from brokerage service arrangements or other expense offset arrangements and do not represent the amount paid by the class during periods when reimbursements or reductions occur. Expense ratios before reductions for start-up periods may not be representative of longer-term operating periods. Expenses net of fee waivers reflect expenses after reimbursement by the investment adviser but prior to reductions from brokerage service arrangements or other expense offset arrangements. Expenses net of all reductions represent the net expenses paid by the class.
Annual Report
See accompanying notes which are an integral part of the financial statements.
Financial Highlights - Fidelity International Small Cap Opportunities
Years ended October 31, | 2006 | 2005 H |
Selected Per-Share Data | | |
Net asset value, beginning of period | $ 10.40 | $ 10.00 |
Income from Investment Operations | | |
Net investment income (loss) D | .05 | - J |
Net realized and unrealized gain (loss) | 3.75 | .39 G |
Total from investment operations | 3.80 | .39 |
Distributions from net realized gain | -J | - |
Redemption fees added to paid in capital D | .03 | .01 |
Net asset value, end of period | $ 14.23 | $ 10.40 |
Total Return B, C | 36.86% | 4.00% |
Ratios to Average Net AssetsE, I | | |
Expenses before reductions | 1.28% | 2.25% A |
Expenses net of fee waivers, if any | 1.28% | 1.40%A |
Expenses net of all reductions | 1.16% | 1.31%A |
Net investment income (loss) | .37% | .14%A |
Supplemental Data | | |
Net assets, end of period (000 omitted) | $ 981,210 | $ 197,349 |
Portfolio turnover rate F | 164% | 46% |
A Annualized
B Total returns for periods of less than one year are not annualized.
C Total returns would have been lower had certain expenses not been reduced during the periods shown.
D Calculated based on average shares outstanding during the period.
E Fees and expenses of the underlying Fidelity Central Funds are not included in the Fund's expense ratio. The Fund indirectly bears its proportionate share of the expenses of any underlying Fidelity Central Funds.
F Amount does not include the portfolio activity of any underlying Fidelity Central Funds.
G The amount shown for a share outstanding does not correspond with the aggregate net gain (loss) on investments for the period due to the timing of sales and repurchases of shares in relation to fluctuating market values of the investments of the Fund.
H For the period August 2, 2005 (commencement of operations) to October 31, 2005.
I Expense ratios reflect operating expenses of the class. Expenses before reductions do not reflect amounts reimbursed by the investment adviser or reductions from brokerage service arrangements or other expense offset arrangements and do not represent the amount paid by the class during periods when reimbursements or reductions occur. Expense ratios before reductions for start-up periods may not be representative of longer-term operating periods. Expenses net of fee waivers reflect expenses after reimbursement by the investment adviser but prior to reductions from brokerage service arrangements or other expense offset arrangements. Expenses net of all reductions represent the net expenses paid by the class.
J Amount represents less than $.01 per share.
Annual Report
See accompanying notes which are an integral part of the financial statements.
Financial Highlights - Institutional Class
Years ended October 31, | 2006 | 2005 H |
Selected Per-Share Data | | |
Net asset value, beginning of period | $ 10.40 | $ 10.00 |
Income from Investment Operations | | |
Net investment income (loss)D | .05 | - J |
Net realized and unrealized gain (loss) | 3.74 | .39 G |
Total from investment operations | 3.79 | .39 |
Distributions from net realized gain | - J | - |
Redemption fees added to paid in capitalD | .03 | .01 |
Net asset value, end of period | $ 14.22 | $ 10.40 |
Total Return B, C | 36.77% | 4.00% |
Ratios to Average Net Assets E, I | | |
Expenses before reductions | 1.25% | 2.25% A |
Expenses net of fee waivers, if any | 1.25% | 1.40%A |
Expenses net of all reductions | 1.14% | 1.29%A |
Net investment income (loss) | .40% | .16%A |
Supplemental Data | | |
Net assets, end of period (000 omitted) | $ 13,954 | $ 2,849 |
Portfolio turnover rate F | 164% | 46% |
A Annualized
B Total returns for periods of less than one year are not annualized.
C Total returns would have been lower had certain expenses not been reduced during the periods shown.
D Calculated based on average shares outstanding during the period.
E Fees and expenses of the underlying Fidelity Central Funds are not included in the Fund's expense ratio. The Fund indirectly bears its proportionate share of the expenses of any underlying Fidelity Central Funds.
F Amount does not include the portfolio activity of any underlying Fidelity Central Funds.
G The amount shown for a share outstanding does not correspond with the aggregate net gain (loss) on investments for the period due to the timing of sales and repurchases of shares in relation to fluctuating market values of the investments of the Fund.
H For the period August 2, 2005 (commencement of operations) to October 31, 2005.
I Expense ratios reflect operating expenses of the class. Expenses before reductions do not reflect amounts reimbursed by the investment adviser or reductions from brokerage service arrangements or other expense offset arrangements and do not represent the amount paid by the class during periods when reimbursements or reductions occur. Expense ratios before reductions for start-up periods may not be representative of longer-term operating periods. Expenses net of fee waivers reflect expenses after reimbursement by the investment adviser but prior to reductions from brokerage service arrangements or other expense offset arrangements. Expenses net of all reductions represent the net expenses paid by the class.
J Amount represents less than $.01 per share.
Annual Report
See accompanying notes which are an integral part of the financial statements.
Notes to Financial Statements
For the period ended October 31, 2006
1. Significant Accounting Policies.
Fidelity International Small Cap Opportunities Fund (the Fund) is a fund of Fidelity Investment Trust (the trust) and is authorized to issue an unlimited number of shares. The trust is registered under the Investment Company Act of 1940, as amended (the 1940 Act), as an open-end management investment company organized as a Massachusetts business trust.
The Fund offers Class A, Class T, Class B, Class C, International Small Cap Opportunities and Institutional Class shares, each of which has equal rights as to assets and voting privileges. Each class has exclusive voting rights with respect to matters that affect that class. Class B shares will automatically convert to Class A shares after a holding period of seven years from the initial date of purchase. Investment income, realized and unrealized capital gains and losses, the common expenses of the Fund, and certain fund-level expense reductions, if any, are allocated on a pro rata basis to each class based on the relative net assets of each class to the total net assets of the Fund. Each class differs with respect to transfer agent and distribution and service plan fees incurred. Certain expense reductions also differ by class.
The Fund may invest in Fidelity Central Funds which are open-end investment companies available to investment companies and other accounts managed by Fidelity Management & Research Company (FMR) and its affiliates. The financial statements have been prepared in conformity with accounting principles generally accepted in the United States of America, which require management to make certain estimates and assumptions at the date of the financial statements. The following summarizes the significant accounting policies of the Fund, which are also consistently followed by the Fidelity Central Funds:
Security Valuation. Investments are valued and net asset value (NAV) per share is calculated (NAV calculation) as of the close of business of the New York Stock Exchange (NYSE), normally 4:00 p.m. Eastern time. Wherever possible, the Fund uses independent pricing services approved by the Board of Trustees to value its investments.
Equity securities, including restricted securities, for which market quotations are readily available, are valued at the last reported sale price or official closing price as reported by an independent pricing service on the primary market or exchange on which they are traded. In the event there were no sales during the day or closing prices are not available, securities are valued at the last quoted bid price. Investments in open-end mutual funds, including the Fidelity Central Funds, are valued at their closing net asset value each business day. Short-term securities with remaining maturities of sixty days or less for which quotations are not readily available are valued at amortized cost, which approximates value.
Annual Report
Notes to Financial Statements - continued
1. Significant Accounting Policies - continued
Security Valuation - continued
When current market prices or quotations are not readily available or do not accurately reflect fair value, valuations may be determined in accordance with procedures adopted by the Board of Trustees. For example, when developments occur between the close of a market and the close of the NYSE that may materially affect the value of some or all of the securities, or when trading in a security is halted, those securities may be fair valued. Factors used in the determination of fair value may include monitoring news to identify significant market or security specific events such as changes in the value of U.S. securities markets, reviewing developments in foreign markets and evaluating the performance of ADRs, futures contracts and exchange-traded funds. Because the Fund's utilization of fair value pricing depends on market activity, the frequency with which fair value pricing is used can not be predicted and may be utilized to a significant extent. The value of securities used for NAV calculation under fair value pricing may differ from published prices for the same securities.
Foreign Currency. The Fund uses foreign currency contracts to facilitate transactions in foreign-denominated securities. Losses from these transactions may arise from changes in the value of the foreign currency or if the counterparties do not perform under the contracts' terms.
Foreign-denominated assets, including investment securities, and liabilities are translated into U.S. dollars at the exchange rate at period end. Purchases and sales of investment securities, income and dividends received and expenses denominated in foreign currencies are translated into U.S. dollars at the exchange rate in effect on the transaction date.
The effects of exchange rate fluctuations on investments are included with the net realized and unrealized gain (loss) on investment securities. Other foreign currency transactions resulting in realized and unrealized gain (loss) are disclosed separately.
Investment Transactions and Income. Security transactions, including the Fund's investment activity in the Fidelity Central Funds, are accounted for as of trade date. Gains and losses on securities sold are determined on the basis of identified cost. Dividend income is recorded on the ex-dividend date, except for certain dividends from foreign securities where the ex-dividend date may have passed, which are recorded as soon as the Fund is informed of the ex-dividend date. Non-cash dividends included in dividend income, if any, are recorded at the fair market value of the securities received. Interest income and distributions from the Fidelity Central Funds are accrued as earned. Interest income includes coupon interest and amortization of premium and accretion of discount on debt securities. Investment income is recorded net of foreign taxes withheld where recovery of such taxes is uncertain.
Annual Report
1. Significant Accounting Policies - continued
Expenses. Most expenses of the trust can be directly attributed to a fund. Expenses which cannot be directly attributed are apportioned among each Fund in the trust. Expense estimates are accrued in the period to which they relate and adjustments are made when actual amounts are known.
Income Tax Information and Distributions to Shareholders. Each year, the Fund intends to qualify as a regulated investment company by distributing all of its taxable income and realized gains under Subchapter M of the Internal Revenue Code. As a result, no provision for income taxes is required in the accompanying financial statements. Foreign taxes are provided for based on the Fund's understanding of the tax rules and rates that exist in the foreign markets in which it invests.
Distributions are recorded on the ex-dividend date. Income dividends and capital gain distributions are declared separately for each class. Income and capital gain distributions are determined in accordance with income tax regulations, which may differ from generally accepted accounting principles. In addition, the Fund will claim a portion of the payment made to redeeming shareholders as a distribution for income tax purposes.
Capital accounts within the financial statements are adjusted for permanent book-tax differences. These adjustments have no impact on net assets or the results of operations. Temporary book-tax differences will reverse in a subsequent period.
Book-tax differences are primarily due to foreign currency transactions, passive foreign investment companies (PFIC), capital loss carryforwards and losses deferred due to wash sales.
The tax-basis components of distributable earnings and the federal tax cost as of period end were as follows:
Unrealized appreciation | $ 169,153,678 | |
Unrealized depreciation | (59,160,398) | |
Net unrealized appreciation (depreciation) | 109,993,280 | |
Capital loss carryforward | (516,738) | |
| | |
Cost for federal income tax purposes | $ 1,077,361,813 | |
The tax character of distributions paid was as follows:
| October 31,
2006 | October 31,
2005 |
Ordinary Income | $ 90,957 | $ - |
Short-Term Trading (Redemption) Fees. Shares held in the Fund less than 90 days are subject to a redemption fee equal to 2.00% of the proceeds of the redeemed shares. All redemption fees, including any estimated redemption fees paid by FMR, are retained by the Fund and accounted for as an addition to paid in capital.
Annual Report
Notes to Financial Statements - continued
1. Significant Accounting Policies - continued
New Accounting Pronouncements. In July 2006, Financial Accounting Standards Board Interpretation No. 48, Accounting for Uncertainty in Income Taxes - an interpretation of FASB Statement 109 (FIN 48), was issued and is effective for fiscal years beginning after December 15, 2006. FIN 48 sets forth a threshold for financial statement recognition, measurement and disclosure of a tax position taken or expected to be taken on a tax return. Management is currently evaluating the impact, if any, the adoption of FIN 48 will have on the Fund's net assets, results of operations and financial statement disclosures.
In addition, in September 2006, Statement of Financial Accounting Standards No. 157, Fair Value Measurements (SFAS 157), was issued and is effective for fiscal years beginning after November 15, 2007. SFAS 157 defines fair value, establishes a framework for measuring fair value and expands disclosures about fair value measurements. Management is currently evaluating the impact the adoption of SFAS 157 will have on the Fund's financial statement disclosures.
2. Operating Policies.
Repurchase Agreements. FMR has received an Exemptive Order from the Securities and Exchange Commission (the SEC) which permits the Fund and other affiliated entities of FMR to transfer uninvested cash balances into joint trading accounts which are then invested in repurchase agreements. The Fund may also invest directly with institutions in repurchase agreements. Repurchase agreements are collateralized by government or non-government securities. Upon settlement date, collateral is held in segregated accounts with custodian banks and may be obtained in the event of a default of the counterparty. The Fund monitors, on a daily basis, the value of the collateral to ensure it is at least equal to the principal amount of the repurchase agreement (including accrued interest). In the event of a default by the counterparty, realization of the collateral proceeds could be delayed, during which time the value of the collateral may decline.
3. Purchases and Sales of Investments.
Purchases and sales of securities, other than short-term securities, aggregated $2,275,575,976 and $1,521,126,280, respectively.
The Fund realized a gain on the sale of an investment not meeting the investment restrictions of the Fund.
Annual Report
4. Fees and Other Transactions with Affiliates.
Management Fee. FMR and its affiliates provide the Fund with investment management related services for which the Fund pays a monthly management fee. The management fee is the sum of an individual fund fee rate that is based on an annual rate of .60% of the Fund's average net assets and a group fee rate that averaged ..27% during the period. The group fee rate is based upon the average net assets of all the mutual funds advised by FMR. The group fee rate decreases as assets under management increase and increases as assets under management decrease. In addition, the management fee is subject to a performance adjustment (up to a maximum of ± .20% of the Fund's average net assets over a 36 month performance period). The upward or downward adjustment to the management fee is based on the relative investment performance of the retail class of the Fund, Fidelity International Small Cap Opportunities, as compared to an appropriate benchmark index. The Fund's performance adjustment took effect in August 2006. Subsequent months will be added until the performance period includes 36 months. For the period, the total annual management fee rate, including the performance adjustment, was .91% of the Fund's average net assets.
Distribution and Service Plan. In accordance with Rule 12b-1 of the 1940 Act, the Fund has adopted separate Distribution and Service Plans for each class of shares. Certain classes pay Fidelity Distributors Corporation (FDC), an affiliate of FMR, separate Distribution and Service Fees, each of which is based on an annual percentage of each class' average net assets. In addition, FDC may pay financial intermediaries for selling shares of the Fund and providing shareholder support services. For the period the Distribution and Service Fee rates and the total amounts paid to and retained by FDC were as follows:
| Distribution
Fee | Service
Fee | Paid to
FDC | Retained
by FDC |
Class A | 0% | .25% | $ 60,381 | $ 5,079 |
Class T | .25% | .25% | 84,746 | 10,636 |
Class B | .75% | .25% | 56,129 | 44,686 |
Class C | .75% | .25% | 146,925 | 120,497 |
| | | $ 348,181 | $ 180,898 |
Sales Load. FDC receives a front-end sales charge of up to 5.75% for selling Class A shares, and 3.50% for selling Class T shares, some of which is paid to financial intermediaries for selling shares of the Fund. FDC receives the proceeds of contingent deferred sales charges levied on Class A, Class T, Class B, and Class C redemptions. These charges depend on the holding period. The deferred sales charges range from 5% to 1% for Class B, 1% for Class C, 1.00% to .50% for certain purchases of Class A shares (.25% prior to February 24, 2006) and .25% for certain purchases of Class T shares.
Annual Report
Notes to Financial Statements - continued
4. Fees and Other Transactions with Affiliates - continued
Sales Load - continued
For the period, sales charge amounts retained by FDC were as follows:
| Retained
by FDC |
Class A | $ 94,260 |
Class T | 19,610 |
Class B* | 9,295 |
Class C* | 5,107 |
| $ 128,272 |
* When Class B and Class C shares are initially sold, FDC pays commissions from its own resources to financial intermediaries through which the sales are made.
Transfer Agent Fees. Fidelity Investments Institutional Operations Company, Inc. (FIIOC), an affiliate of FMR, is the transfer, dividend disbursing and shareholder servicing agent for each class of the Fund, except for Fidelity International Small Cap Opportunities. Fidelity Service Company, Inc. (FSC), an affiliate of FMR, is the transfer agent for Fidelity International Small Cap Opportunities shares. FIIOC and FSC receive account fees and asset-based fees that vary according to the account size and type of account of the shareholders of the respective classes of the Fund. FIIOC and FSC pay for typesetting, printing and mailing of shareholder reports, except proxy statements. For the period, the total transfer agent fees paid by each class to FIIOC or FSC, were as follows:
| Amount | % of
Average
Net Assets |
Class A | $ 77,944 | .32 |
Class T | 50,163 | .29 |
Class B | 22,462 | .40 |
Class C | 49,167 | .33 |
Fidelity International Small Cap Opportunities | 1,941,743 | .22 |
Institutional Class | 22,500 | .19 |
| $ 2,163,979 | |
Accounting and Security Lending Fees. FSC maintains the Fund's accounting records. The accounting fee is based on the level of average net assets for the month. Under a separate contract, FSC administers the security lending program. The security lending fee is based on the number and duration of lending transactions.
Annual Report
4. Fees and Other Transactions with Affiliates - continued
Investments in Fidelity Central Funds. The Fund may invest in Fidelity Central Funds. The Fund's Schedule of Investments lists each of the Fidelity Central Funds as an investment of the Fund but does not include the underlying holdings of each Fidelity Central Fund. As an Investing Fund, the Fund indirectly bears its proportionate share of the expenses of the underlying Fidelity Central Funds. A complete unaudited list of holdings for each Fidelity Central Fund, is available upon request. In addition, the financial statements of the Fidelity Central Funds, which are not covered by the Fund's Report of Independent Registered Public Accounting Firm, are available on the EDGAR Database on the SEC's web site, www.sec.gov, or upon request.
The Money Market Central Funds seek preservation of capital and current income and are managed by Fidelity Investments Money Management, Inc. (FIMM), an affiliate of FMR.
Brokerage Commissions. The Fund placed a portion of its portfolio transactions with brokerage firms which are affiliates of the investment adviser. The commissions paid to these affiliated firms were $10,168 for the period.
Interfund Lending Program. Pursuant to an Exemptive Order issued by the SEC, the Fund, along with other registered investment companies having management contracts with FMR, may participate in an interfund lending program. This program provides an alternative credit facility allowing the Funds to borrow from, or lend money to, other participating affiliated funds. At period end, there were no interfund loans outstanding. The Fund's activity in this program during the period for which loans were outstanding was as follows:
Borrower or Lender | Average Daily
Loan Balance | Weighted Average Interest Rate | Interest
Expense |
Borrower | $ 11,990,313 | 5.22% | $ 111,231 |
5. Committed Line of Credit.
The Fund participates with other funds managed by FMR in a $4.2 billion credit facility (the "line of credit") to be utilized for temporary or emergency purposes to fund shareholder redemptions or for other short-term liquidity purposes. The Fund has agreed to pay commitment fees on its pro rata portion of the line of credit, which amounts to $1,727 and is reflected in Miscellaneous Expense on the Statement of Operations. During the period, there were no borrowings on this line of credit.
Annual Report
Notes to Financial Statements - continued
6. Security Lending.
The Fund lends portfolio securities from time to time in order to earn additional income. On the settlement date of the loan, the Fund receives collateral (in the form of U.S. Treasury obligations, letters of credit and/or cash) against the loaned securities and maintains collateral in an amount not less than 100% of the market value of the loaned securities during the period of the loan. The market value of the loaned securities is determined at the close of business of the Fund and any additional required collateral is delivered to the Fund on the next business day. If the borrower defaults on its obligation to return the securities loaned because of insolvency or other reasons, a fund could experience delays and costs in recovering the securities loaned or in gaining access to the collateral. Any cash collateral received is invested in the Fidelity Securities Lending Cash Central Fund. The value of loaned securities and cash collateral at period end are disclosed on the Fund's Statement of Assets and Liabilities. Security lending income represents the income earned on investing cash collateral, less fees and expenses associated with the loan, plus any premium payments that may be received on the loan of certain types of securities.
7. Bank Borrowings.
The Fund is permitted to have bank borrowings for temporary or emergency purposes to fund shareholder redemptions. The Fund has established borrowing arrangements with certain banks. The interest rate on the borrowings is the bank's base rate, as revised from time to time. The average daily loan balance during the period for which loans were outstanding amounted to $8,950,571. The weighted average interest rate was 5.34%. At period end, there were no bank borrowings outstanding.
8. Expense Reductions.
FMR voluntarily agreed to reimburse each class to the extent annual operating expenses exceeded certain levels of average net assets as noted in the table below. Some expenses, for example interest expense, including commitment fees, are excluded from this reimbursement.
The following class was in reimbursement during the period:
| Expense
Limitations | Reimbursement
from adviser |
Class B | 2.40% | $ 2,310 |
Annual Report
8. Expense Reductions - continued
Many of the brokers with whom FMR places trades on behalf of the Fund provided services to the Fund in addition to trade execution. These services included payments of certain expenses on behalf of the Fund totaling $1,069,602 for the period. In addition, through arrangements with each class' transfer agent, credits realized as a result of uninvested cash balances were used to reduce the Fund's expenses. During the period, credits reduced each class' transfer agent expense as noted in the table below.
| Transfer Agent
expense reduction |
Fidelity International Small Cap Opportunities | $ 240 |
9. Other.
The Fund's organizational documents provide former and current trustees and officers with a limited indemnification against liabilities arising in connection with the performance of their duties to the Fund. In the normal course of business, the Fund may also enter into contracts that provide general indemnifications. The Fund's maximum exposure under these arrangements is unknown as this would be dependent on future claims that may be made against the Fund. The risk of material loss from such claims is considered remote.
During the period, the Fund's transfer agent, Fidelity Investments Institutional Operations Company, Inc. (FIIOC), an affiliate of Fidelity Management & Research Company, notified the Fund that the fund's books and records did not reflect a conversion of certain Class B to Class A shares upon their conversion date. Management has determined that this did not have a material impact to the Fund's reported net assets or results of operations in the accompanying financial statements. FIIOC will cause the books and records of the Fund to reflect a conversion of the relevant Class B shares to Class A and is in the process of determining the impact to affected shareholder accounts for purposed of its remediation.
10. Distributions to Shareholders.
Distributions to shareholders of each class were as follows:
Years ended October 31, | 2006 | 2005 |
From net realized gain | | |
Class A | $ 2,067 | $ - |
Fidelity International Small Cap Opportunities | 87,898 | - |
Institutional Class | 992 | - |
Total | $ 90,957 | $ - |
Annual Report
Notes to Financial Statements - continued
11. Share Transactions.
Transactions for each class of shares were as follows:
| Shares | Dollars |
| Year ended
October 31,
2006 | Year ended
October 31,
2005 A | Year ended
October 31,
2006 | Year ended
October 31,
2005 A |
Class A | | | | |
Shares sold | 2,562,140 | 533,911 | $ 35,143,597 | $ 5,543,122 |
Reinvestment of distributions | 162 | - | 1,916 | - |
Shares redeemed | (578,488) | (2,302) | (7,816,655) | (24,252) |
Net increase (decrease) | 1,983,814 | 531,609 | $ 27,328,858 | $ 5,518,870 |
Class T | | | | |
Shares sold | 1,977,012 | 262,396 | $ 27,202,466 | $ 2,707,886 |
Shares redeemed | (233,065) | (1,961) | (3,118,693) | (19,686) |
Net increase (decrease) | 1,743,947 | 260,435 | $ 24,083,773 | $ 2,688,200 |
Class B | | | | |
Shares sold | 498,394 | 169,923 | $ 6,815,227 | $ 1,745,697 |
Shares redeemed | (113,628) | (5,585) | (1,550,424) | (57,751) |
Net increase (decrease) | 384,766 | 164,338 | $ 5,264,803 | $ 1,687,946 |
Class C | | | | |
Shares sold | 1,745,210 | 322,125 | $ 24,032,601 | $ 3,329,826 |
Shares redeemed | (189,077) | (2,373) | (2,515,739) | (24,472) |
Net increase (decrease) | 1,556,133 | 319,752 | $ 21,516,862 | $ 3,305,354 |
Fidelity International Small Cap Opportunities | | | | |
Shares sold | 93,068,555 | 19,620,455 | $ 1,259,777,775 | $ 205,992,728 |
Reinvestment of distributions | 6,974 | - | 82,435 | - |
Shares redeemed | (43,072,008) | (646,558) | (586,736,058) | (6,587,124) |
Net increase (decrease) | 50,003,521 | 18,973,897 | $ 673,124,152 | $ 199,405,604 |
Institutional Class | | | | |
Shares sold | 1,299,662 | 274,003 | $ 17,883,260 | $ 2,804,816 |
Reinvestment of distributions | 83 | - | 980 | - |
Shares redeemed | (592,563) | - | (8,704,985) | - |
Net increase (decrease) | 707,182 | 274,003 | $ 9,179,255 | $ 2,804,816 |
A For the period August 2, 2005 (commencement of operations) to October 31, 2005.
Annual Report
Report of Independent Registered Public Accounting Firm
To the Trustees of Fidelity Investment Trust and Shareholders of Fidelity International Small Cap Opportunities Fund:
We have audited the accompanying statement of assets and liabilities of Fidelity International Small Cap Opportunities Fund (the Fund), a fund of Fidelity Investment Trust, including the schedule of investments as of October 31, 2006, and the related statement of operations for the year then ended, and the statement of changes in net assets, and the financial highlights for the year then ended and for the period August 2, 2005 (commencement of operations) to October 31, 2005. These financial statements and financial highlights are the responsibility of the Fund's management. Our responsibility is to express an opinion on these financial statements and financial highlights based on our audits.
We conducted our audits in accordance with standards of the Public Company Accounting Oversight Board (United States). Those standards require that we plan and perform the audit to obtain reasonable assurance about whether the financial statements and financial highlights are free of material misstatement. The Fund is not required to have, nor were we engaged to perform, an audit of its internal control over financial reporting. Our audits included consideration of internal control over financial reporting as a basis for designing audit procedures that are appropriate in the circumstances, but not for the purpose of expressing an opinion on the effectiveness of the Fund's internal control over financial reporting. Accordingly, we express no such opinion. An audit also includes examining, on a test basis, evidence supporting the amounts and disclosures in the financial statements, assessing the accounting principles used and significant estimates made by management, as well as evaluating the overall financial statement presentation. Our procedures included confirmation of securities owned as of October 31, 2006, by correspondence with the custodians and brokers; where replies were not received from brokers, we performed other auditing procedures. We believe that our audits provide a reasonable basis for our opinion.
In our opinion, the financial statements and financial highlights referred to above present fairly, in all material respects, the financial position of Fidelity International Small Cap Opportunities Fund as of October 31, 2006, the results of its operations for the year then ended, and the changes in its net assets and its financial highlights the year then ended and for the period August 2, 2005 (commencement of operations) to October 31, 2005, in conformity with accounting principles generally accepted in the United States of America.
/s/ Deloitte & Touche LLP
DELOITTE & TOUCHE LLP
Boston, Massachusetts
December 15, 2006
Annual Report
Trustees and Officers
The Trustees, Members of the Advisory Board, and executive officers of the trust and fund, as applicable, are listed below. The Board of Trustees governs the fund and is responsible for protecting the interests of shareholders. The Trustees are experienced executives who meet periodically throughout the year to oversee the fund's activities, review contractual arrangements with companies that provide services to the fund, and review the fund's performance. Except for William O. McCoy, each of the Trustees oversees 348 funds advised by FMR or an affiliate. Mr. McCoy oversees 350 funds advised by FMR or an affiliate.
The Trustees hold office without limit in time except that (a) any Trustee may resign; (b) any Trustee may be removed by written instrument, signed by at least two-thirds of the number of Trustees prior to such removal; (c) any Trustee who requests to be retired or who has become incapacitated by illness or injury may be retired by written instrument signed by a majority of the other Trustees; and (d) any Trustee may be removed at any special meeting of shareholders by a two-thirds vote of the outstanding voting securities of the trust. Each Trustee who is not an interested person (as defined in the 1940 Act) (Independent Trustee), shall retire not later than the last day of the calendar year in which his or her 72nd birthday occurs. The Independent Trustees may waive this mandatory retirement age policy with respect to individual Trustees. The executive officers and Advisory Board Members hold office without limit in time, except that any officer and Advisory Board Member may resign or may be removed by a vote of a majority of the Trustees at any regular meeting or any special meeting of the Trustees. Except as indicated, each individual has held the office shown or other offices in the same company for the past five years.
The fund's Statement of Additional Information (SAI) includes more information about the Trustees. To request a free copy, call Fidelity at 1-877-208-0098.
Interested Trustees*:
Correspondence intended for each Trustee who is an interested person may be sent to Fidelity Investments, 82 Devonshire Street, Boston, Massachusetts 02109.
Name, Age; Principal Occupation |
Edward C. Johnson 3d (76) |
| Year of Election or Appointment: 1984 Mr. Johnson is Chairman of the Board of Trustees. Mr. Johnson serves as President (2006-present), Chief Executive Officer, Chairman, and a Director of FMR Corp.; Chairman and a Director of FMR; Chairman and a Director of Fidelity Research & Analysis Company (FRAC); Chairman and a Director of Fidelity Investments Money Management, Inc.; and Chairman (2001-present) and a Director of FMR Co., Inc. In addition, Mr. Johnson serves as Chairman and Director of Fidelity International Limited (FIL). |
Stephen P. Jonas (53) |
| Year of Election or Appointment: 2005 Mr. Jonas is Senior Vice President of the fund (2005-present). He also serves as Senior Vice President of other Fidelity funds (2005-present). Mr. Jonas is Executive Director of FMR (2005-present) and FMR Co., Inc. (2005-present). He also serves as a Director of Fidelity Investments Money Management, Inc. (2005-present) and FMR Corp. (2003- present). Previously, Mr. Jonas served as President of Fidelity Enterprise Operations and Risk Services (2004-2005), Chief Administrative Officer (2002-2004), and Chief Financial Officer of FMR Corp. (1998-2002). In addition, he serves on the Boards of Boston Ballet (2003-present) and Simmons College (2003-present). |
Robert L. Reynolds (54) |
| Year of Election or Appointment: 2003 Mr. Reynolds is President and a Director of FMR (2005-present), Fidelity Investments Money Management, Inc. (2005-present), and FMR Co., Inc. (2005-present). Mr. Reynolds also serves as Vice Chairman (2006-present), a Director (2003-present), and Chief Operating Officer of FMR Corp. and a Director of Strategic Advisers, Inc. (2005-present). He also serves on the Board at Fidelity Investments Canada, Ltd. |
* Trustees have been determined to be "Interested Trustees" by virtue of, among other things, their affiliation with the trust or various entities under common control with FMR.
Annual Report
Independent Trustees:
Correspondence intended for each Independent Trustee (that is, the Trustees other than the Interested Trustees) may be sent to Fidelity Investments, P.O. Box 55235, Boston, Massachusetts 02205-5235.
Name, Age; Principal Occupation |
Dennis J. Dirks (58) |
| Year of Election or Appointment: 2005 Prior to his retirement in May 2003, Mr. Dirks was Chief Operating Officer and a member of the Board of The Depository Trust & Clearing Corporation (DTCC) (1999-2003). He also served as President, Chief Operating Officer, and Board member of The Depository Trust Company (DTC) (1999-2003) and President and Board member of the National Securities Clearing Corporation (NSCC) (1999-2003). In addition, Mr. Dirks served as Chief Executive Officer and Board member of the Government Securities Clearing Corporation (2001-2003) and Chief Executive Officer and Board member of the Mortgage-Backed Securities Clearing Corporation (2001-2003). Mr. Dirks also serves as a Trustee and a member of the Finance Committee of Manhattan College (2005-present) and a Trustee and a member of the Finance Committee of AHRC of Nassau County (2006-present). |
Albert R. Gamper, Jr. (64) |
| Year of Election or Appointment: 2006 Prior to his retirement in December 2004, Mr. Gamper served as Chairman of the Board of CIT Group Inc. (commercial finance). During his tenure with CIT Group Inc. Mr. Gamper served in numerous senior management positions, including Chairman (1987-1989; 1999-2001; 2002-2004), Chief Executive Officer (1987-2004), and President (1989-2002). He currently serves as a member of the Board of Directors of Public Service Enterprise Group (utilities, 2001-present), Chairman of the Board of Governors, Rutgers University (2004-present), and Chairman of the Board of Saint Barnabas Health Care System. |
George H. Heilmeier (70) |
| Year of Election or Appointment: 2004 Dr. Heilmeier is Chairman Emeritus of Telcordia Technologies (communication software and systems), where prior to his retirement, he served as company Chairman and Chief Executive Officer. He currently serves on the Boards of Directors of The Mitre Corporation (systems engineering and information technology support for the government), and HRL Laboratories (private research and development, 2004-present). He is Chairman of the General Motors Science & Technology Advisory Board and a Life Fellow of the Institute of Electrical and Electronics Engineers (IEEE). Dr. Heilmeier is a member of the Defense Science Board and the National Security Agency Advisory Board. He is also a member of the National Academy of Engineering, the American Academy of Arts and Sciences, and the Board of Overseers of the School of Engineering and Applied Science of the University of Pennsylvania. Previously, Dr. Heilmeier served as a Director of TRW Inc. (automotive, space, defense, and information technology, 1992-2002), Compaq (1994-2002), Automatic Data Processing, Inc. (ADP) (technology-based business outsourcing, 1995-2002), INET Technologies Inc. (telecommunications network surveillance, 2001-2004), and Teletech Holdings (customer management services). He is the recipient of the 2005 Kyoto Prize in Advanced Technology for his invention of the liquid crystal display, and a member of the Consumer Electronics Hall of Fame. |
Marie L. Knowles (60) |
| Year of Election or Appointment: 2001 Prior to Ms. Knowles' retirement in June 2000, she served as Executive Vice President and Chief Financial Officer of Atlantic Richfield Company (ARCO) (diversified energy, 1996-2000). From 1993 to 1996, she was a Senior Vice President of ARCO and President of ARCO Transportation Company. She served as a Director of ARCO from 1996 to 1998. She currently serves as a Director of Phelps Dodge Corporation (copper mining and manufacturing) and McKesson Corporation (healthcare service, 2002-present). Ms. Knowles is a Trustee of the Brookings Institution and the Catalina Island Conservancy and also serves as a member of the Advisory Board for the School of Engineering of the University of Southern California. |
Ned C. Lautenbach (62) |
| Year of Election or Appointment: 2000 Mr. Lautenbach is Chairman of the Independent Trustees (2006-present). Mr. Lautenbach has been a partner of Clayton, Dubilier & Rice, Inc. (private equity investment firm) since September 1998. Previously, Mr. Lautenbach was with the International Business Machines Corporation (IBM) from 1968 until his retirement in 1998. Mr. Lautenbach serves as a Director of Sony Corporation (2006-present) and Eaton Corporation (diversified industrial) as well as the Philharmonic Center for the Arts in Naples, Florida. He also is a member of the Board of Trustees of Fairfield University (2005-present), as well as a member of the Council on Foreign Relations. |
William O. McCoy (73) |
| Year of Election or Appointment: 1997 Prior to his retirement in December 1994, Mr. McCoy was Vice Chairman of the Board of BellSouth Corporation (telecommunications) and President of BellSouth Enterprises. He is currently a Director of Duke Realty Corporation (real estate). He is also a partner of Franklin Street Partners (private investment management firm). In addition, Mr. McCoy served as the Interim Chancellor (1999-2000) and a member of the Board of Visitors for the University of North Carolina at Chapel Hill and currently serves as Chairman of the Board of Directors of the University of North Carolina Health Care System. He also served as Vice President of Finance for the University of North Carolina (16-school system). |
Cornelia M. Small (62) |
| Year of Election or Appointment: 2005 Ms. Small is a member (2000-present) and Chairperson (2002-present) of the Investment Committee, and a member (2002-present) of the Board of Trustees of Smith College. Previously, she served as Chief Investment Officer (1999-2000), Director of Global Equity Investments (1996-1999), and a member of the Board of Directors of Scudder, Stevens & Clark (1990-1997) and Scudder Kemper Investments (1997-1999). In addition, Ms. Small served as Co-Chair (2000-2003) of the Annual Fund for the Fletcher School of Law and Diplomacy. |
William S. Stavropoulos (67) |
| Year of Election or Appointment: 2001 Mr. Stavropoulos is Chairman Emeritus of the Board of Directors of The Dow Chemical Company. Since joining The Dow Chemical Company in 1967, Mr. Stavropoulos served in numerous senior management positions, including President (1993-2000; 2002-2003), CEO (1995-2000; 2002-2004), and Chairman of the Executive Committee (2000-2004). Currently, he is a Director of NCR Corporation (data warehousing and technology solutions), BellSouth Corporation (telecommunications), Chemical Financial Corporation, Maersk Inc. (industrial conglomerate, 2002-present), and Metalmark Capital (private equity investment firm, 2005-present). He also serves as a member of the Board of Trustees of the American Enterprise Institute for Public Policy Research. In addition, Mr. Stavropoulos is a member of The Business Council, J.P. Morgan International Council and the University of Notre Dame Advisory Council for the College of Science. |
Kenneth L. Wolfe (67) |
| Year of Election or Appointment: 2005 Prior to his retirement in 2001, Mr. Wolfe was Chairman and Chief Executive Officer of Hershey Foods Corporation (1993-2001). He currently serves as a member of the boards of Adelphia Communications Corporation (2003-present), Bausch & Lomb, Inc., and Revlon Inc. (2004-present). |
Annual Report
Advisory Board Members and Executive Officers:
Correspondence intended for Mr. Keyes may be sent to Fidelity Investments, P.O. Box 55235, Boston, Massachusetts 02205-5235. Correspondence intended for each executive officer and Mr. Lynch may be sent to Fidelity Investments, 82 Devonshire Street, Boston, Massachusetts 02109.
Name, Age; Principal Occupation |
James H. Keyes (66) |
| Year of Election or Appointment: 2006 Member of the Advisory Board of Fidelity Investment Trust. Prior to his retirement in 2003, Mr. Keyes was Chairman, President, and Chief Executive Officer of Johnson Controls, Inc. (automotive supplier, 1993-2003). He currently serves as a member of the boards of LSI Logic Corporation (semiconductor technologies), Navistar International Corporation (manufacture and sale of trucks, buses, and diesel engines, 2002-present), and Pitney Bowes, Inc. (integrated mail, messaging, and document management solutions). |
Peter S. Lynch (62) |
| Year of Election or Appointment: 2003 Member of the Advisory Board of Fidelity Investment Trust. Mr. Lynch is Vice Chairman and a Director of FMR, and Vice Chairman (2001- present) and a Director of FMR Co., Inc. Previously, Mr. Lynch served as a Trustee of the Fidelity funds (1990-2003). In addition, he serves as a Trustee of Boston College and as the Chairman of the Inner-City Scholarship Fund. |
Dwight D. Churchill (52) |
| Year of Election or Appointment: 2005 Vice President of the fund. Mr. Churchill also serves as Vice President of certain Equity Funds (2005-present). Mr. Churchill is Executive Vice President of FMR (2005-present) and FMR Co., Inc. (2005-present). Previously, Mr. Churchill served as Senior Vice President of Fidelity Investments Money Management, Inc. (2005-2006), Head of Fidelity's Fixed-Income Division (2000-2005), Vice President of Fidelity's Money Market Funds (2000-2005), Vice President of Fidelity's Bond Funds, and Senior Vice President of FMR. |
Eric M. Wetlaufer (44) |
| Year of Election or Appointment: 2006 Vice President of the fund. Mr. Wetlaufer also serves as Vice President of certain International Equity Funds (2006-present). Mr. Wetlaufer is Senior Vice President of FMR (2006-present) and FMR Co., Inc. (2006-present), and President and Director of Fidelity Management & Research (U.K.) Inc. (2006-present) and Fidelity Research & Analysis Company (2006-present). Before joining Fidelity Investments in 2005, Mr. Wetlaufer was a partner in Oxhead Capital Management (2004-2005). Previously, Mr. Wetlaufer served as a Chief Investment Officer of Putnam Investments (1997-2003). |
Andrew Sassine (42) |
| Year of Election or Appointment: 2005 Vice President of the fund. Mr. Sassine also serves as Vice President for other funds advised by FMR. Prior to his current responsibilities, Mr. Sassine worked as a research analyst and portfolio manager. Mr. Sassine also serves as a Vice President of FMR and FMR Co., Inc. (2006). |
Eric D. Roiter (57) |
| Year of Election or Appointment: 2005 Secretary of the fund. He also serves as Secretary of other Fidelity funds; Vice President, General Counsel, and Secretary of FMR Co., Inc. (2001-present) and FMR; Assistant Secretary of Fidelity Management & Research (U.K.) Inc. (2001-present), Fidelity Research & Analysis Company (2001-present), and Fidelity Investments Money Management, Inc. (2001-present). Mr. Roiter is an Adjunct Member, Faculty of Law, at Boston College Law School (2003-present). Previously, Mr. Roiter served as Vice President and Secretary of Fidelity Distributors Corporation (FDC) (1998-2005). |
Stuart Fross (47) |
| Year of Election or Appointment: 2005 Assistant Secretary of the fund. Mr. Fross also serves as Assistant Secretary of other Fidelity funds (2003-present), Vice President and Secretary of FDC (2005-present), and is an employee of FMR. |
Christine Reynolds (48) |
| Year of Election or Appointment: 2005 President and Treasurer of the fund. Ms. Reynolds also serves as President and Treasurer of other Fidelity funds (2004-present) and is a Vice President (2003-present) and an employee (2002-present) of FMR. Before joining Fidelity Investments, Ms. Reynolds worked at PricewaterhouseCoopers LLP (PwC) (1980-2002), where she was most recently an audit partner with PwC's investment management practice. |
R. Stephen Ganis (40) |
| Year of Election or Appointment: 2006 Anti-Money Laundering (AML) officer of the fund. Mr. Ganis also serves as AML officer of other Fidelity funds (2006-present) and FMR Corp. (2003-present). Before joining Fidelity Investments, Mr. Ganis practiced law at Goodwin Procter, LLP (2000-2002). |
Joseph B. Hollis (58) |
| Year of Election or Appointment: 2006 Chief Financial Officer of the fund. Mr. Hollis also serves as Chief Financial Officer of other Fidelity funds. Mr. Hollis is President of Fidelity Pricing and Cash Management Services (FPCMS) (2005-present). Mr. Hollis also serves as President and Director of Fidelity Service Company, Inc. (2006-present). Previously, Mr. Hollis served as Senior Vice President of Cash Management Services (1999-2002) and Investment Management Operations (2002-2005). |
Kenneth A. Rathgeber (59) |
| Year of Election or Appointment: 2005 Chief Compliance Officer of the fund. Mr. Rathgeber also serves as Chief Compliance Officer of other Fidelity funds (2004-present) and Executive Vice President of Risk Oversight for Fidelity Investments (2002-present). He is Chief Compliance Officer of FMR (2005-present), FMR Co., Inc. (2005-present), Fidelity Management & Research (U.K.) Inc. (2005-present), Fidelity Research & Analysis Company (2005- present), Fidelity Investments Money Management, Inc. (2005-present), and Strategic Advisers, Inc. (2005-present). Previously, Mr. Rathgeber served as Executive Vice President and Chief Operating Officer for Fidelity Investments Institutional Services Company, Inc. (1998-2002). |
Bryan A. Mehrmann (45) |
| Year of Election or Appointment: 2005 Deputy Treasurer of the fund. Mr. Mehrmann also serves as Deputy Treasurer of other Fidelity funds (2005-present) and is an employee of FMR. Previously, Mr. Mehrmann served as Vice President of Fidelity Investments Institutional Services Group (FIIS)/Fidelity Investments Institutional Operations Corporation, Inc. (FIIOC) Client Services (1998-2004). |
Kimberley H. Monasterio (42) |
| Year of Election or Appointment: 2005 Deputy Treasurer of the fund. Ms. Monasterio also serves as Deputy Treasurer of other Fidelity funds (2004) and is an employee of FMR (2004). Before joining Fidelity Investments, Ms. Monasterio served as Treasurer (2000-2004) and Chief Financial Officer (2002-2004) of the Franklin Templeton Funds and Senior Vice President of Franklin Templeton Services, LLC (2000-2004). |
Kenneth B. Robins (37) |
| Year of Election or Appointment: 2005 Deputy Treasurer of the fund. Mr. Robins also serves as Deputy Treasurer of other Fidelity funds (2005-present) and is an employee of FMR (2004-present). Before joining Fidelity Investments, Mr. Robins worked at KPMG LLP, where he was a partner in KPMG's department of professional practice (2002-2004) and a Senior Manager (1999-2000). In addition, Mr. Robins served as Assistant Chief Accountant, United States Securities and Exchange Commission (2000-2002). |
Robert G. Byrnes (39) |
| Year of Election or Appointment: 2005 Assistant Treasurer of the fund. Mr. Byrnes also serves as Assistant Treasurer of other Fidelity funds (2005-present) and is an employee of FMR (2005-present). Previously, Mr. Byrnes served as Vice President of FPCMS (2003-2005). Before joining Fidelity Investments, Mr. Byrnes worked at Deutsche Asset Management where he served as Vice President of the Investment Operations Group (2000-2003). |
John H. Costello (60) |
| Year of Election or Appointment: 2005 Assistant Treasurer of the fund. Mr. Costello also serves as Assistant Treasurer of other Fidelity funds and is an employee of FMR. |
Peter L. Lydecker (52) |
| Year of Election or Appointment: 2005 Assistant Treasurer of the fund. Mr. Lydecker also serves as Assistant Treasurer of other Fidelity funds (2004) and is an employee of FMR. |
Mark Osterheld (51) |
| Year of Election or Appointment: 2005 Assistant Treasurer of the fund. Mr. Osterheld also serves as Assistant Treasurer of other Fidelity funds (2002) and is an employee of FMR. |
Gary W. Ryan (48) |
| Year of Election or Appointment: 2005 Assistant Treasurer of the fund. Mr. Ryan also serves as Assistant Treasurer of other Fidelity funds (2005-present) and is an employee of FMR (2005-present). Previously, Mr. Ryan served as Vice President of Fund Reporting in FPCMS (1999-2005). |
Salvatore Schiavone (40) |
| Year of Election or Appointment: 2005 Assistant Treasurer of the fund. Mr. Schiavone also serves as Assistant Treasurer of other Fidelity funds (2005-present) and is an employee of FMR (2005-present). Before joining Fidelity Investments, Mr. Schiavone worked at Deutsche Asset Management, where he most recently served as Assistant Treasurer (2003-2005) of the Scudder Funds and Vice President and Head of Fund Reporting (1996-2003). |
Annual Report
Distributions
Institutional Class designates 100% of the dividends distributed during the fiscal year as amounts which may be taken into account as a dividend for purposes of the maximum rate under section 1(h)(11) of the Internal Revenue Code.
The amounts per share which represent income derived from sources within, and taxes paid to, foreign countries or possessions of the United States are $.004 and $.001 for the dividend paid within the current fiscal year, ending October 31, 2006.
The fund will notify shareholders in January 2007 of amounts for use in preparing 2006 income tax returns.
Annual Report
Board Approval of Investment Advisory Contracts and Management Fees
Fidelity International Small Cap Opportunities Fund
Each year, typically in July, the Board of Trustees, including the Independent Trustees (together, the Board), votes on the renewal of the management contract and sub-advisory agreements (together, the Advisory Contracts) for the fund. The Board, assisted by the advice of fund counsel and Independent Trustees' counsel, requests and considers a broad range of information throughout the year.
The Board meets regularly each month except August and takes into account throughout the year matters bearing on Advisory Contracts. The Board, acting directly and through its separate committees, considers at each of its meetings factors that are relevant to the annual renewal of the fund's Advisory Contracts, including the services and support provided to the fund and its shareholders. At the time of the renewal, the Board had 12 standing committees, each composed of Independent Trustees with varying backgrounds, to which the Board has assigned specific subject matter responsibilities in order to enhance effective decision-making by the Board. Each committee has adopted a written charter outlining the structure and purposes of the committee. One such committee, the Equity Contract Committee, meets periodically as needed throughout the year to consider matters specifically related to the annual renewal of Advisory Contracts. The committee requests and receives information on, and makes recommendations to the Independent Trustees concerning, the approval and annual review of the Advisory Contracts.
At its July 2006 meeting, the Board of Trustees, including the Independent Trustees, unanimously determined to renew the Advisory Contracts for the fund. In reaching its determination, the Board considered all factors it believed relevant, including (i) the nature, extent, and quality of the services to be provided to the fund and its shareholders (including the investment performance of the fund); (ii) the competitiveness of the management fee and total expenses of the fund; (iii) the total costs of the services to be provided by and the profits to be realized by the investment adviser and its affiliates from the relationship with the fund; (iv) the extent to which economies of scale would be realized as the fund grows; and (v) whether fee levels reflect these economies of scale, if any, for the benefit of fund shareholders.
In determining whether to renew the Advisory Contracts for the fund, the Board ultimately reached a determination, with the assistance of fund counsel and Independent Trustees' counsel, that the renewal of the Advisory Contracts and the compensation to be received by Fidelity under the management contract is consistent with Fidelity's fiduciary duty under applicable law. In addition to evaluating the specific factors noted above, the Board, in reaching its determination, is aware that shareholders in the fund have a broad range of investment choices available to them, including a wide choice among mutual funds offered by competitors to Fidelity, and that the fund's shareholders, with the opportunity to review and weigh the disclosure provided by the fund in its prospectus and other public disclosures, have chosen to invest in this fund, managed by Fidelity.
Annual Report
Board Approval of Investment Advisory Contracts and
Management Fees - continued
Nature, Extent, and Quality of Services Provided. The Board considered staffing within the investment adviser, FMR, and the sub-advisers (together, the Investment Advisers), including the background of the fund's portfolio manager and the fund's investment objective and discipline. The Independent Trustees also had discussions with senior management of Fidelity's investment operations and investment groups. The Board considered the structure of the portfolio manager compensation program and whether this structure provides appropriate incentives.
Resources Dedicated to Investment Management and Support Services. The Board reviewed the size, education, and experience of the Investment Advisers' investment staff, their use of technology, and the Investment Advisers' approach to recruiting, training, and retaining portfolio managers and other research, advisory, and management personnel. The Board considered Fidelity's extensive global research capabilities that enable the Investment Advisers to aggregate data from various sources in an effort to produce positive investment results. The Board noted that Fidelity's analysts have access to a variety of technological tools that enable them to perform both fundamental and quantitative analysis and to specialize in various disciplines. The Board also considered that Fidelity's portfolio managers and analysts have access to daily portfolio attribution that allows for monitoring of a fund's portfolio, as well as an electronic communication system that provides immediate real-time access to research concerning issuers and credit enhancers.
Shareholder and Administrative Services. The Board considered (i) the nature, extent, quality, and cost of administrative, distribution, and shareholder services performed by the Investment Advisers and their affiliates under the Advisory Contracts and under separate agreements covering transfer agency, pricing and bookkeeping, and securities lending services for the fund; (ii) the nature and extent of the Investment Advisers' supervision of third party service providers, principally custodians and subcustodians; and (iii) the resources devoted to, and the record of compliance with, the fund's compliance policies and procedures. The Board reviewed the allocation of fund brokerage, including allocations to brokers affiliated with the Investment Advisers, the use of brokerage commissions to pay fund expenses, and the use of "soft" commission dollars to pay for research services. The Board also considered that Fidelity voluntarily pays for market data out of its own resources.
The Board noted that the growth of fund assets across the complex allows Fidelity to reinvest in the development of services designed to enhance the value or convenience of the Fidelity funds as investment vehicles. These services include 24-hour access to account information and market information through phone representatives and over the Internet, and investor education materials and asset allocation tools.
Annual Report
Investment in a Large Fund Family. The Board considered the benefits to shareholders of investing in a Fidelity fund, including the benefits of investing in a fund that is part of a large family of funds offering a variety of investment disciplines and providing for a large variety of mutual fund investor services. For example, fund shareholders are offered the privilege of exchanging shares of the fund for shares of other Fidelity funds, as set forth in the fund's prospectus, without paying an additional sales charge. The Board noted that, since July 2005, Fidelity has taken a number of actions that benefited particular funds, including (i) dedicating additional resources to investment research and to restructure the investment research teams; (ii) voluntarily entering into contractual arrangements with certain brokers pursuant to which Fidelity pays for research products and services separately out of its own resources, rather than bundling with fund commissions; (iii) launching the Fidelity Advantage Class of its five Spartan stock index funds and three Spartan bond index funds, which is a lower-fee class available to shareholders with higher account balances; (iv) contractually agreeing to impose expense limitations on Fidelity U.S. Bond Index Fund and reducing the fund's initial investment minimum; and (v) offering shareholders of each of the Fidelity Institutional Money Market Funds the privilege of exchanging shares of the fund for shares of other Fidelity funds
Investment Performance and Compliance. The Board considered whether the fund has operated within its investment objective, as well as its record of compliance with its investment restrictions. The Board noted that it is not possible to evaluate performance in any comprehensive fashion because the fund had been in operation for less than one calendar year. Once the fund has been in operation for at least one calendar year, the Board will review the fund's absolute investment performance for each class, as well as the fund's relative investment performance for each class measured against a broad-based securities market index and a peer group of mutual funds.
The Board considered that FMR has taken steps to refocus and strengthen equity research, equity portfolio management, and compliance. The Board noted with favor FMR's reorganization of its senior management team in 2005 and FMR's dedication of additional resources to investment research, and participated in the process that led to those changes.
Based on its review, and giving particular weight to the nature and quality of the resources dedicated by the Investment Advisers to maintain and improve relative performance, the Board concluded that the nature, extent, and quality of the services provided to the fund will benefit the fund's shareholders, particularly in light of the Board's view that the fund's shareholders benefit from investing in a fund that is part of a large family of funds offering a variety of investment disciplines and services.
Competitiveness of Management Fee and Total Fund Expenses. The Board considered the fund's management fee and total expenses compared to "mapped groups" of competitive funds and classes. Fidelity creates "mapped groups" by combining similar Lipper investment objective categories that have comparable management fee characteristics. Combining Lipper investment objective categories aids the Board's management fee and total expense comparisons by broadening the competitive group used for comparison and by reducing the number of universes to which various Fidelity funds are compared.
Annual Report
Board Approval of Investment Advisory Contracts and
Management Fees - continued
The Board considered two proprietary management fee comparisons for the period of the fund's operations shown in the chart below. The group of Lipper funds used by the Board for management fee comparisons is referred to below as the "Total Mapped Group" and, for the reasons explained above, is broader than the Lipper peer group used by the Board for performance comparisons. The Total Mapped Group comparison focuses on a fund's standing relative to the total universe of comparable funds available to investors, in terms of gross management fees before expense reimbursements or caps. "TMG %" represents the percentage of funds in the Total Mapped Group that had management fees that were lower than the fund's. For example, a TMG % of 38% means that 62% of the funds in the Total Mapped Group had higher management fees than the fund. The "Asset-Size Peer Group" (ASPG) comparison focuses on a fund's standing relative to non-Fidelity funds similar in size to the fund within the Total Mapped Group. The ASPG represents at least 15% of the funds in the Total Mapped Group with comparable asset size and management fee characteristics, subject to a minimum of 50 funds (or all funds in the Total Mapped Group if fewer than 50). Additional information, such as the ASPG quartile in which the fund's management fee ranked, is also included in the chart and considered by the Board.
Fidelity International Small Cap Opportunities Fund
Annual Report
The Board noted that the fund's management fee ranked below the median of its Total Mapped Group and below the median of its ASPG for the period.
Based on its review, the Board concluded that the fund's management fee was fair and reasonable in light of the services that the fund receives and the other factors considered.
In its review of each class's total expenses, the Board considered the fund's management fee as well as other fund or class expenses, as applicable, such as transfer agent fees, pricing and bookkeeping fees, fund-paid 12b-1 fees, and custodial, legal, and audit fees. The Board also noted the effects of any waivers and reimbursements on fees and expenses. As part of its review, the Board also considered current and historical total expenses of each class of the fund compared to competitive fund median expenses. Each class of the fund is compared to those funds and classes in the Total Mapped Group (used by the Board for management fee comparisons) that have a similar sales load structure.
The Board noted that the total expenses of Fidelity International Small Cap Opportunities (retail class) ranked equal to its competitive median for the period, and the total expenses of each of Class A, Class B, Class C, Class T and Institutional Class ranked above its competitive median for the period. The Board considered that the fund commenced operations in August 2005 and that the Advisor classes were above median primarily because of relatively high expenses in basis points due to small fund size. The Board noted that the fund offers multiple classes, each of which has a different sales load and 12b-1 fee structure, and that the multiple structures are intended to offer a range of pricing options for the intermediary market. The Board also noted that the total expenses of the classes vary primarily by the level of their 12b-1 fees, although differences in transfer agent fees may also cause expenses to vary from class to class.
In its review of total expenses, the Board also considered Fidelity fee structures and other information on clients that FMR and its affiliates service in other competitive markets, such as other mutual funds advised or subadvised by FMR or its affiliates, pension plan clients, and other institutional clients.
Based on its review, the Board concluded that the total expenses of each class of the fund were reasonable, although in some cases above the median of the universe presented for comparison, in light of the services that the fund and its shareholders receive and the other factors considered.
Costs of the Services and Profitability. The Board considered the revenues earned and the expenses incurred by Fidelity in conducting the business of developing, marketing, distributing, managing, administering and servicing the fund and its shareholders. The Board also considered the level of Fidelity's profits in respect of all the Fidelity funds.
Annual Report
Board Approval of Investment Advisory Contracts and
Management Fees - continued
On an annual basis, FMR presents to the Board Fidelity's profitability for the fund. Fidelity calculates the profitability for each fund, as well as aggregate profitability for groups of Fidelity funds and all Fidelity funds, using a series of detailed revenue and cost allocation methodologies which originate with the audited books and records of Fidelity. The Audit Committee of the Board reviews any significant changes from the prior year's methodologies.
PricewaterhouseCoopers LLP (PwC), independent registered accounting firm and auditor to Fidelity and certain Fidelity funds, has been engaged annually by the Board as part of the Board's assessment of the results of Fidelity's profitability analysis. PwC's engagement includes the review and assessment of Fidelity's methodologies used in determining the revenues and expenses attributable to Fidelity's mutual fund business, and completion of agreed-upon procedures surrounding the mathematical accuracy of fund profitability and its conformity to allocation methodologies. After considering PwC's reports issued under the engagement and information provided by Fidelity, the Board believes that while other allocation methods may also be reasonable, Fidelity's profitability methodologies are reasonable in all material respects.
The Board has also reviewed Fidelity's non-fund businesses and any fall-out benefits related to the mutual fund business as well as cases where Fidelity's affiliates may benefit from or be related to the fund's business.
The Board considered the costs of the services provided by and the profits realized by Fidelity in connection with the operation of the fund and determined that the amount of profit is a fair entrepreneurial profit for the management of the fund.
Economies of Scale. The Board considered whether there have been economies of scale in respect of the management of the Fidelity funds, whether the Fidelity funds (including the fund) have appropriately benefited from any such economies of scale, and whether there is potential for realization of any further economies of scale. The Board considered the extent to which the fund will benefit from economies of scale through increased services to the fund, through waivers or reimbursements, or through fee or expense reductions, including reductions that occur through operation of the transfer agent agreement. The transfer agent fee varies in part based on the number of accounts in the fund. If the number of accounts decreases or the average account size increases, the overall transfer agent fee rate decreases.
The Board recognized that the fund's management contract incorporates a "group fee" structure, which provides for lower fee rates as total fund assets under FMR's management increase, and for higher fee rates as total fund assets under FMR's management decrease. The Board considered that the group fee is designed to deliver the benefits of economies of scale to fund shareholders when total fund assets increase, even if assets of any particular fund are unchanged or have declined, because some portion of Fidelity's costs are attributable to services provided to all Fidelity funds, and all funds benefit if those costs can be allocated among more assets. The Board concluded that, given the group fee structure, fund shareholders will achieve a certain level of economies of scale as assets under FMR's management increase at the fund complex level, regardless of whether Fidelity achieves any such economies of scale.
Annual Report
The Board further concluded that any potential economies of scale are being shared between fund shareholders and Fidelity in an appropriate manner.
Additional Information Requested by the Board. In order to develop fully the factual basis for consideration of the Advisory Contracts, the Board requested additional information on several topics, including (i) Fidelity's fund profitability methodology and profitability trends within certain funds; (ii) portfolio manager compensation; (iii) the extent to which any economies of scale exist and are shared between the funds and Fidelity; (iv) the total expenses of certain funds and classes relative to competitors, including the extent to which the expenses of certain funds have been or could be capped; (v) fund performance trends; and (vi) Fidelity's fee structures, including use of performance fees.
Based on its evaluation of all of the conclusions noted above, and after considering all material factors, the Board ultimately concluded that the advisory fee structures are fair and reasonable, and that the fund's Advisory Contracts should be renewed.
Annual Report
Annual Report
Annual Report
Annual Report
Annual Report
Annual Report
Annual Report
Annual Report
Investment Adviser
Fidelity Management & Research Company
Boston, MA
Investment Sub-Advisers
FMR Co., Inc.
Fidelity Management & Research
(U.K.) Inc.
Fidelity Research & Analysis Company
(formerly Fidelity Management &
Research (Far East) Inc.)
Fidelity International Investment Advisors
Fidelity Investments Japan Limited
Fidelity International Investment Advisors (U.K.) Limited
General Distributor
Fidelity Distributors Corporation
Boston, MA
Transfer and Service Agents
Fidelity Investments Institutional
Operations Company, Inc.
Boston, MA
Fidelity Service Company, Inc.
Boston, MA
Custodian
The Northern Trust Company
Chicago, IL
(Fidelity Investment logo)(registered trademark)
Corporate Headquarters
82 Devonshire St., Boston, MA 02109
www.fidelity.com
AILSI-UANN-1206
1.815081.101
(Fidelity Investment logo)(registered trademark)
Fidelity Advisor
International Small Cap
Fund - Class A, Class T, Class B
and Class C
Annual Report
October 31, 2006
(2_fidelity_logos) (Registered_Trademark)
Class A, Class T, Class B, and Class C are classes of Fidelity®
International Small Cap Fund
Contents
Chairman's Message | 4 | Ned Johnson's message to shareholders. |
Performance | 5 | How the fund has done over time. |
Management's Discussion | 7 | The managers' review of fund performance, strategy and outlook. |
Shareholder Expense Example | 8 | An example of shareholder expenses. |
Investment Changes | 10 | A summary of major shifts in the fund's investments over the past six months. |
Investments | 12 | A complete list of the fund's investments with their market values. |
Financial Statements | 36 | Statements of assets and liabilities, operations, and changes in net assets,
as well as financial highlights. |
Notes | 46 | Notes to the financial statements. |
Report of Independent Registered Public Accounting Firm | 56 | |
Trustees and Officers | 57 | |
Distributions | 68 | |
Board Approval of Investment Advisory Contracts and Management Fees | 69 | |
To view a fund's proxy voting guidelines and proxy voting record for the 12-month period ended June 30, visit www.fidelity.com/proxyvotingresults or visit the Securities and Exchange Commission's (SEC) web site at www.sec.gov. You may also call 1-877-208-0098 to request a free copy of the proxy voting guidelines.
Standard & Poor's, S&P and S&P 500 are registered service marks of The McGraw-Hill Companies, Inc. and have been licensed for use by Fidelity Distributors Corporation.
Other third party marks appearing herein are the property of their respective owners.
All other marks appearing herein are registered or unregistered trademarks or service marks of FMR Corp. or an affiliated company.
Annual Report
This report and the financial statements contained herein are submitted for the general information of the shareholders of the fund. This report is not authorized for distribution to prospective investors in the fund unless preceded or accompanied by an effective prospectus.
A fund files its complete schedule of portfolio holdings with the SEC for the first and third quarters of each fiscal year on Form N-Q. Forms N-Q are available on the SEC's web site at http://www.sec.gov. A fund's Forms N-Q may be reviewed and copied at the SEC's Public Reference Room in Washington, DC. Information regarding the operation of the SEC's Public Reference Room may be obtained by calling 1-800-SEC-0330. For a complete list of a fund's portfolio holdings, view the most recent quarterly holdings report, semiannual report, or annual report on Fidelity's web site at http://www.advisor.fidelity.com.
NOT FDIC INSURED · MAY LOSE VALUE · NO BANK GUARANTEE
Neither the fund nor Fidelity Distributors Corporation is a bank.
Annual Report
Chairman's Message
(photo_of_Edward_C_Johnson_3d)
Dear Shareholder:
Stock and bond markets around the world have seen largely positive results year to date, although weakness in the technology sector and growth stocks in general have tempered performance. While financial markets are always unpredictable, there are a number of time-tested principles that can put the historical odds in your favor.
One of the basic tenets is to invest for the long term. Over time, riding out the markets' inevitable ups and downs has proven much more effective than selling into panic or chasing the hottest trend. Even missing only a few of the markets' best days can significantly diminish investor returns. Patience also affords the benefits of compounding - of earning interest on additional income or reinvested dividends and capital gains. There are tax advantages and cost benefits to consider as well. The more you sell, the more taxes you pay, and the more you trade, the higher the costs. While staying the course doesn't eliminate risk, it can considerably lessen the effect of short-term declines.
You can further manage your investing risk through diversification. And today, more than ever, geographic diversification should be taken into account. Studies indicate that asset allocation is the single most important determinant of a portfolio's long-term success. The right mix of stocks, bonds and cash - aligned to your particular risk tolerance and investment objective - is very important. Age-appropriate rebalancing is also an essential aspect of asset allocation. For younger investors, an emphasis on equities - which historically have been the best performing asset class over time - is encouraged. As investors near their specific goal, such as retirement or sending a child to college, consideration may be given to replacing volatile assets (e.g. common stocks) with more-stable fixed investments (bonds or savings plans).
A third investment principle - investing regularly - can help lower the average cost of your purchases. Investing a certain amount of money each month or quarter helps ensure you won't pay for all your shares at market highs. This strategy - known as dollar cost averaging - also reduces unconstructive "emotion" from investing, helping shareholders avoid selling weak performers just prior to an upswing, or chasing a hot performer just before a correction.
We invite you to contact us via the Internet, through our Investor Centers or over the phone. It is our privilege to provide you the information you need to make the investments that are right for you.
Sincerely,
/s/Edward C. Johnson 3d
Edward C. Johnson 3d
Annual Report
Fidelity Advisor International Small Cap Fund - Class A, T, B, and C
Performance: The Bottom Line
Average annual total return reflects the change in the value of an investment, assuming reinvestment of the class' dividend income and capital gains (the profits earned upon the sale of securities that have grown in value) and assuming a constant rate of performance each year. The $10,000 table and the fund's returns do not reflect the deduction of taxes that a shareholder would pay on fund distributions or the redemption of fund shares. During periods of reimbursement by Fidelity, a fund's total return will be greater than it would be had the reimbursement not occurred. How a fund did yesterday is no guarantee of how it will do tomorrow.
Average Annual Total Returns
Periods ended October 31, 2006 | Past 1
year | Life of
Fund A |
Class A (incl. 5.75% sales charge) B | 13.31% | 32.59% |
Class T (incl. 3.50% sales charge) C | 15.73% | 33.07% |
Class B (incl. contingent deferred sales charge) D | 14.28% | 33.37% |
Class C (incl. contingent deferred sales charge) E | 18.34% | 33.70% |
A From September 18, 2002.
B Class A shares bear a 0.25% 12b-1 fee. The initial offering of Class A shares took place on May 27, 2003. Returns prior to May 27, 2003 are those of International Small Cap, the original class of the fund, which has no 12b-1 fee. Had Class A shares' 12b-1 fee been reflected, returns prior to May 27, 2003 would have been lower.
C Class T shares bear a 0.50% 12b-1 fee. The initial offering of Class T shares took place on May 27, 2003. Returns prior to May 27, 2003 are those of International Small Cap, the original class of the fund, which has no 12b-1 fee. Had Class T shares' 12b-1 fee been reflected, returns prior to May 27, 2003 would have been lower.
D Class B shares bear a 1.00% 12b-1 fee. The initial offering of Class B shares took place on May 27, 2003. Returns prior to May 27, 2003 are those of International Small Cap, the original class of the fund, which has no 12b-1 fee. Had Class B shares' 12b-1 fee been reflected, returns prior to May 27, 2003 would have been lower. Class B shares' contingent deferred sales charge included in the past one year and life of fund total return figures are 5% and 2%, respectively.
E Class C shares bear a 1.00% 12b-1 fee. The initial offering of Class C shares took place on May 27, 2003. Returns prior to May 27, 2003 are those of International Small Cap, the original class of the fund, which has no 12b-1 fee. Had Class C shares' 12b-1 fee been reflected, returns prior to May 27, 2003 would have been lower. Class C shares' contingent deferred sales charge included in the past one year and life of fund total return figures are 1% and 0%, respectively.
Annual Report
$10,000 Over Life of Fund
Let's say hypothetically that $10,000 was invested in Fidelity Advisor International Small Cap Fund - Class T on September 18, 2002, when the fund started, and the current 3.50% sales charge was paid. The chart shows how the value of your investment would have changed, and also shows how the MSCI® EAFE® Small Cap Index performed over the same period.
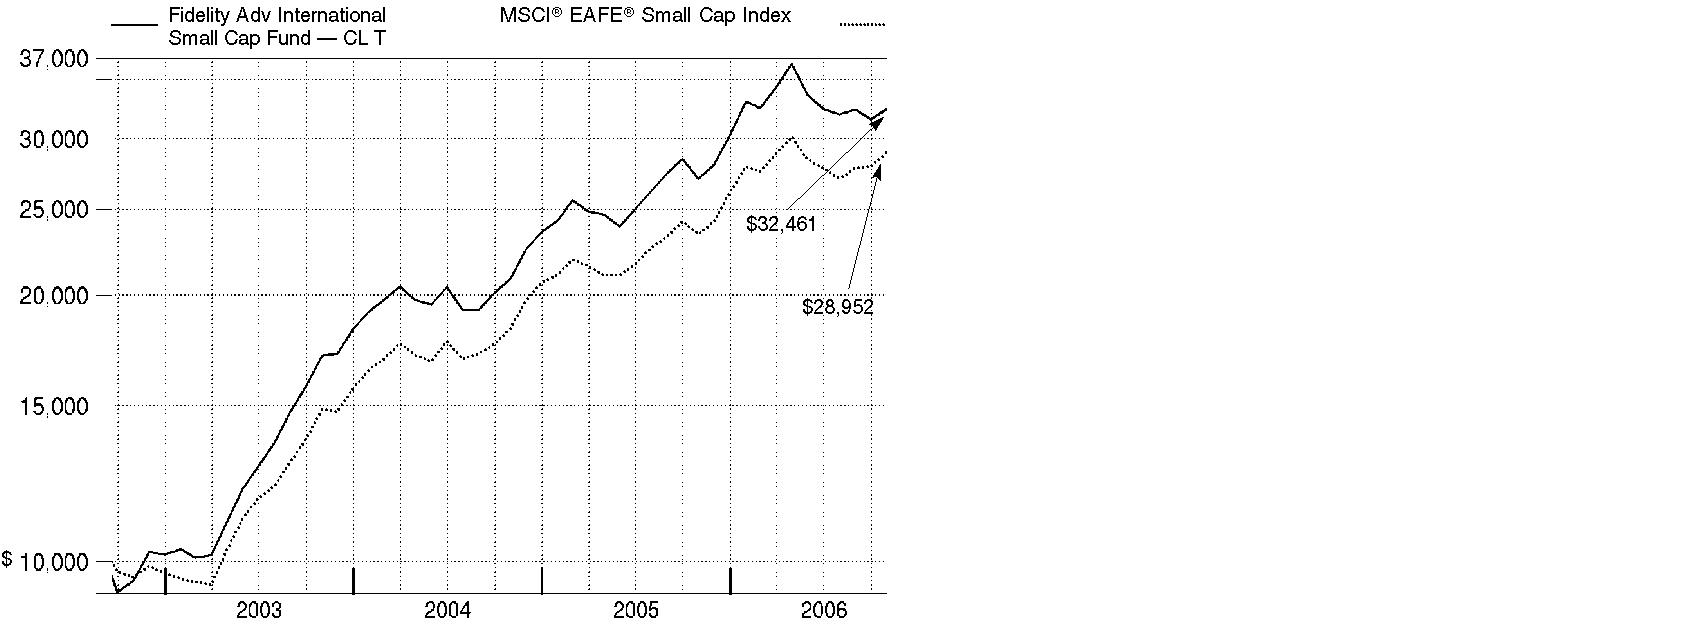
Annual Report
Management's Discussion of Fund Performance
Comments from Ben Paton, Tokuya Sano and Wilson Wong, Co-Portfolio Managers of Fidelity Advisor International Small Cap Fund
International equity markets as a whole outpaced their U.S. counterparts for the 12 months ending October 31, 2006 - partly as a result of favorable currency exchanges that boosted returns for U.S. investors. The Morgan Stanley Capital InternationalSM Europe, Australasia, Far East (MSCI® EAFE®) Index - a gauge of developed stock markets outside the United States and Canada - gained 27.72% during that time. European markets benefited from solid corporate profit growth and attractive dividends, which helped the MSCI Europe index advance 31.95%. Strong performing Latin American and Asian emerging markets drove the MSCI Emerging Markets index to a lofty 35.42% return. Japan was somewhat of an exception to the generally stellar foreign market performance after struggling in the middle part of the period. Still, its earlier gains helped the Tokyo Stock Exchange Stock Price Index (TOPIX) - a benchmark of the largest and better-established stocks traded on the Tokyo Stock Exchange - rise 12.47% overall. Natural-resources-rich Canada also struggled over the final six months as energy prices fell, but the S&P/TSX Composite Index managed a 12-month return of 28.21%.
During the past year, the fund's Class A, Class T, Class B and Class C shares rose 20.22%, 19.93%, 19.28% and 19.34%, respectively (excluding sales charges), versus 23.55% for the MSCI EAFE Small Cap index. Weak results in the Europe/Africa/Middle East subportfolio - in particular, unsuccessful positions in the United Kingdom and in energy and materials stocks - hurt the most versus the index. For example, not owning Swedish zinc producer Boliden was costly, as zinc prices soared, causing the stock to follow suit. Healthcare Enterprise Group, a U.K. health care device company, faltered because of an acquisition that reported unexpected losses. Performance also suffered due to Japan-based Kura Corp., a restaurant operator; Tanzanite One, a Bermuda-incorporated miner of the blue gemstone tanzanite; and Downer EDI, an Australian engineering company. Conversely, both the Japanese and Pacific Basin ex Japan subportfolios outperformed their respective index components. On a sector basis, financials and information technology helped, with Italian stock Banca Italease leading the way. Other positives included Japanese auto parts maker Nissin Kogyo and the timely sale of DaVinci Advisors, a real estate stock. In the Pacific Basin ex Japan subportfolio, contributors included two Australian companies: engineering services provider WorleyParsons and Bradken, a supplier of consumable products to the mining and rail industries. In absolute terms, currency fluctuations bolstered the fund's gains.
The views expressed above reflect those of the portfolio manager(s) only through the end of the period as stated on the cover of this report and do not necessarily represent the views of Fidelity or any other person in the Fidelity organization. Any such views are subject to change at any time based upon market or other conditions and Fidelity disclaims any responsibility to update such views. These views may not be relied on as investment advice and, because investment decisions for a Fidelity fund are based on numerous factors, may not be relied on as an indication of trading intent on behalf of any Fidelity fund.
Annual Report
Shareholder Expense Example
As a shareholder of the Fund, you incur two types of costs: (1) transaction costs, including sales charges (loads) on purchase payments or redemption proceeds, redemption fees, and (2) ongoing costs, including management fees, distribution and/or service (12b-1) fees and other Fund expenses. This Example is intended to help you understand your ongoing costs (in dollars) of investing in the Fund and to compare these costs with the ongoing costs of investing in other mutual funds.
The Example is based on an investment of $1,000 invested at the beginning of the period and held for the entire period (May 1, 2006 to October 31, 2006).
Actual Expenses
The first line of the accompanying table for each class of the Fund provides information about actual account values and actual expenses. You may use the information in this line, together with the amount you invested, to estimate the expenses that you paid over the period. Simply divide your account value by $1,000.00 (for example, an $8,600 account value divided by $1,000.00 = 8.6), then multiply the result by the number in the first line for a class of the Fund under the heading entitled "Expenses Paid During Period" to estimate the expenses you paid on your account during this period. A small balance maintenance fee of $12.00 that is charged once a year may apply for certain accounts with a value of less than $2,000. This fee is not included in the table below. If it was, the estimate of expenses you paid during the period would be higher, and your ending account value lower, by this amount.
Hypothetical Example for Comparison Purposes
The second line of the accompanying table for each class of the Fund provides information about hypothetical account values and hypothetical expenses based on a Class' actual expense ratio and an assumed rate of return of 5% per year before expenses, which is not the Class' actual return. The hypothetical account values and expenses may not be used to estimate the actual ending account balance or expenses you paid for the period. You may use this information to compare the ongoing costs of investing in the Fund and other funds. To do so, compare this 5% hypothetical example with the 5% hypothetical examples that appear in the shareholder reports of the other funds. A small balance maintenance fee of $12.00 that is charged once a year may apply for certain accounts with a value of less than $2,000. This fee is not included in the table below. If it was, the estimate of expenses you paid during the period would be higher, and your ending account value lower, by this amount.
Annual Report
Shareholder Expense Example - continued
Please note that the expenses shown in the table are meant to highlight your ongoing costs only and do not reflect any transaction costs. Therefore, the second line of the table is useful in comparing ongoing costs only, and will not help you determine the relative total costs of owning different funds. In addition, if these transactional costs were included, your costs would have been higher.
| Beginning
Account Value
May 1, 2006 | Ending
Account Value
October 31, 2006 | Expenses Paid
During Period*
May 1, 2006
to October 31, 2006 |
Class A | | | |
Actual | $ 1,000.00 | $ 890.50 | $ 7.86 |
Hypothetical A | $ 1,000.00 | $ 1,016.89 | $ 8.39 |
Class T | | | |
Actual | $ 1,000.00 | $ 889.40 | $ 9.00 |
Hypothetical A | $ 1,000.00 | $ 1,015.68 | $ 9.60 |
Class B | | | |
Actual | $ 1,000.00 | $ 887.30 | $ 11.42 |
Hypothetical A | $ 1,000.00 | $ 1,013.11 | $ 12.18 |
Class C | | | |
Actual | $ 1,000.00 | $ 887.30 | $ 11.32 |
Hypothetical A | $ 1,000.00 | $ 1,013.21 | $ 12.08 |
International Small Cap | | | |
Actual | $ 1,000.00 | $ 892.40 | $ 6.11 |
Hypothetical A | $ 1,000.00 | $ 1,018.75 | $ 6.51 |
Institutional Class | | | |
Actual | $ 1,000.00 | $ 892.30 | $ 6.20 |
Hypothetical A | $ 1,000.00 | $ 1,018.65 | $ 6.61 |
A 5% return per year before expenses
* Expenses are equal to each Class' annualized expense ratio (shown in the table below); multiplied by the average account value over the period, multiplied by 184/365 (to reflect the one-half year period).
| Annualized
Expense Ratio |
Class A | 1.65% |
Class T | 1.89% |
Class B | 2.40% |
Class C | 2.38% |
International Small Cap | 1.28% |
Institutional Class | 1.30% |
Annual Report
Investment Changes
Geographic Diversification (% of fund's net assets) |
As of October 31, 2006 |
| Japan 31.2% | |
| United Kingdom 19.2% | |
| Australia 10.5% | |
| United States of America 5.1% | |
| Canada 3.7% | |
| France 3.2% | |
 | Germany 3.1% | |
 | Italy 2.9% | |
 | Bermuda 2.5% | |
| Other 18.6% | |

Percentages are adjusted for the effect of futures contracts, if applicable. |
|
As of April 30, 2006 |
| Japan 32.2% | |
| United Kingdom 18.1% | |
| Australia 9.6% | |
| Canada 3.9% | |
| South Africa 3.8% | |
| United States of America 2.8% | |
| Italy 2.8% | |
| Bermuda 2.4% | |
| Germany 2.2% | |
| Other 22.2% | |

Percentages are adjusted for the effect of futures contracts, if applicable. |
Asset Allocation |
| % of fund's
net assets | % of fund's net assets
6 months ago |
Stocks and Investment Companies | 96.1 | 98.7 |
Bonds | 0.3 | 0.3 |
Short-Term Investments and Net Other Assets | 3.6 | 1.0 |
Top Ten Stocks as of October 31, 2006 |
| % of fund's
net assets | % of fund's net assets
6 months ago |
Banca Italease Spa (Italy, Diversified Financial Services) | 2.3 | 1.9 |
Icade SA (France, Real Estate Management & Development) | 1.3 | 0.1 |
Nissin Kogyo Co. Ltd. (Japan, Auto Components) | 1.2 | 0.9 |
Steinhoff International Holdings Ltd. (South Africa, Household Durables) | 1.1 | 1.5 |
Fujikura Ltd. (Japan, Electrical Equipment) | 1.1 | 0.8 |
Ceske Energeticke Zavody AS (Czech Republic, Electric Utilities) | 1.1 | 0.0 |
Max Petroleum PLC (United Kingdom, Oil, Gas & Consumable Fuels) | 1.1 | 1.0 |
NOK Corp. (Japan, Auto Components) | 1.0 | 0.1 |
Nippon Seiki Co. Ltd. (Japan, Auto Components) | 0.9 | 0.7 |
International Ferro Metals (Australia, Metals & Mining) | 0.9 | 0.6 |
| 12.0 | |
Market Sectors as of October 31, 2006 |
| % of fund's
net assets | % of fund's net assets
6 months ago |
Consumer Discretionary | 16.8 | 16.5 |
Materials | 16.7 | 18.7 |
Industrials | 15.1 | 15.7 |
Information Technology | 11.4 | 12.8 |
Financials | 11.3 | 9.8 |
Energy | 10.3 | 14.5 |
Health Care | 5.4 | 5.0 |
Utilities | 4.6 | 1.2 |
Consumer Staples | 3.7 | 3.7 |
Telecommunication Services | 1.1 | 1.1 |
Annual Report
Investments October 31, 2006
Showing Percentage of Net Assets
Common Stocks - 96.0% |
| Shares | | Value (Note 1) (000s) |
Australia - 10.5% |
Allied Gold Ltd. (a) | 11,880,000 | | $ 3,863 |
AMP Ltd. | 398,700 | | 2,932 |
Aristocrat Leisure Ltd. | 38,800 | | 418 |
Austbrokers Holdings Ltd. | 1,012,159 | | 3,173 |
Australian Stock Exchange Ltd. | 191,909 | | 5,259 |
Australian Wealth Management Ltd. | 2,709,087 | | 5,453 |
Babcock & Brown Japan Property Trust | 1,297,100 | | 1,943 |
Billabong International Ltd. | 307,700 | | 3,735 |
Bradken Ltd. | 1,417,195 | | 6,703 |
Brambles Industries Ltd. (d) | 308,500 | | 2,981 |
Caltex Australia Ltd. | 36,000 | | 617 |
Capital-XX Ltd. | 2,262,572 | | 3,129 |
Centamin Egypt Ltd. (a) | 5,903,500 | | 2,984 |
Cochlear Ltd. | 163,900 | | 7,064 |
Computershare Ltd. | 1,284,572 | | 7,657 |
David Jones Ltd. | 590,500 | | 1,655 |
Dominos Pizza Australia New Zealand Ltd. | 2,778,220 | | 6,990 |
Downer EDI Ltd. | 581,057 | | 2,897 |
Dwyka Diamonds Ltd. (a) | 6,949,000 | | 2,717 |
Elixir Petroleum Ltd. (a) | 2,002,140 | | 630 |
Elkedra Diamonds NL (a) | 5,953,671 | | 2,470 |
Energy Resources of Australia Ltd. | 129,200 | | 1,774 |
European Gas Ltd. (a) | 1,673,600 | | 894 |
Fox Resources Ltd. warrants 6/30/07 (a) | 342,636 | | 252 |
Hastie Group Ltd. | 2,126,299 | | 4,000 |
HFA Holdings Ltd. | 2,152,000 | | 3,099 |
IBT Education Ltd. | 153,450 | | 227 |
International Ferro Metals (e) | 24,719,526 | | 17,682 |
Invocare Ltd. | 67,700 | | 278 |
Jumbuck Entertainment Ltd. (a) | 841,100 | | 1,205 |
Kimberley Diamond Co. NL (a) | 855,800 | | 696 |
Macquarie Goodman Group unit | 295,700 | | 1,515 |
Metcash Ltd. | 2,138,000 | | 7,084 |
Mineral Commodities Ltd. (a)(e) | 7,900,000 | | 948 |
Mineral Deposits Ltd. (a) | 4,233,200 | | 5,112 |
Mintails Ltd. (a) | 6,289,600 | | 974 |
Monto Minerals Ltd. (a) | 8,525,252 | | 1,504 |
Monto Minerals Ltd. warrants 5/25/09 (a) | 1,485,934 | | 11 |
Mortgage Choice Ltd. | 2,133,191 | | 4,426 |
Multiplex Group unit | 1,238,000 | | 3,527 |
Newcrest Mining Ltd. | 23,800 | | 439 |
Novera Energy Ltd. (a) | 488,000 | | 521 |
Common Stocks - continued |
| Shares | | Value (Note 1) (000s) |
Australia - continued |
Oakton Ltd. | 130,715 | | $ 419 |
Paladin Resources Ltd. (a)(d) | 1,443,600 | | 6,448 |
Patties Food Ltd. | 1,035,200 | | 1,402 |
Phosphagenics Ltd. (a) | 9,040,000 | | 2,449 |
QBE Insurance Group Ltd. | 257,323 | | 4,920 |
Reverse Corp. Ltd. | 1,073,700 | | 2,934 |
Rinker Group Ltd. | 82,700 | | 1,188 |
Roc Oil Co. Ltd. (United Kingdom) (a) | 3,700,112 | | 10,022 |
SAI Global Ltd. | 98,900 | | 274 |
Seek Ltd. | 1,350,239 | | 5,561 |
Sigma Pharmaceuticals Ltd. | 1,517,600 | | 3,031 |
SMS Management & Technology Ltd. | 166,300 | | 530 |
Sonic Healthcare Ltd. | 89,400 | | 910 |
Sphere Investments Ltd. (a) | 2,038,159 | | 1,988 |
Summit Resources Ltd. (a) | 1,039,620 | | 1,787 |
Sylvania Resources Ltd. (a) | 7,484,597 | | 5,331 |
Sylvania Resources Ltd. (United Kingdom) (a) | 4,923,630 | | 3,616 |
Tanami Gold NL | 19,652,484 | | 2,815 |
Tattersall's Ltd. | 665,464 | | 1,875 |
United Group Ltd. | 320,421 | | 3,624 |
Woodside Petroleum Ltd. | 45,600 | | 1,326 |
Woolworths Ltd. | 394,926 | | 6,326 |
WorleyParsons Ltd. | 172,430 | | 2,423 |
TOTAL AUSTRALIA | | 202,637 |
Austria - 0.3% |
Oesterreichische Elektrizitaetswirtschafts AG (Verbund) | 106,900 | | 5,336 |
Belgium - 0.1% |
Punch International NV (a) | 17,350 | | 2,024 |
Bermuda - 2.5% |
Aquarius Platinum Ltd. (United Kingdom) | 539,400 | | 10,052 |
Hi Sun Technology (China) Ltd. (a) | 2,106,000 | | 406 |
Katanga Mining Ltd. (a) | 233,800 | | 1,320 |
Pacific Basin Shipping Ltd. | 2,030,000 | | 1,305 |
Peace Mark Holdings Ltd. | 3,750,000 | | 2,556 |
Petra Diamonds Ltd. (a) | 2,502,406 | | 5,847 |
Ports Design Ltd. | 1,798,000 | | 3,126 |
RC Group (Holdings) Ltd. | 2,139,000 | | 2,693 |
SeaDrill Ltd. (a) | 502,921 | | 7,132 |
Tanzanite One Ltd. (e) | 5,808,701 | | 9,086 |
Trefoil Ltd. (a) | 385,100 | | 2,698 |
Common Stocks - continued |
| Shares | | Value (Note 1) (000s) |
Bermuda - continued |
Xceldiam Ltd. (e) | 3,318,255 | | $ 1,946 |
Xceldiam Ltd. warrants 11/16/07 (a) | 1,659,127 | | 222 |
TOTAL BERMUDA | | 48,389 |
British Virgin Islands - 0.4% |
Albidon Ltd. unit (a) | 1,469,000 | | 1,646 |
BDI Mining Corp. (a)(e) | 8,728,890 | | 3,288 |
Kalahari Energy (a)(g) | 1,451,000 | | 1,814 |
Titanium Resources Group Ltd. | 959,090 | | 1,134 |
TOTAL BRITISH VIRGIN ISLANDS | | 7,882 |
Canada - 3.4% |
AirSea Lines (g) | 1,862,300 | | 1,189 |
AirSea Lines warrants 6/14/08 (a)(g) | 1,862,300 | | 0 |
Altius Minerals Corp. (a) | 533,806 | | 3,842 |
Antrim Energy, Inc. (a) | 714,540 | | 2,482 |
Antrim Energy, Inc. (United Kingdom) | 800,000 | | 2,762 |
Bankers Petroleum Ltd. (a) | 3,767,000 | | 2,282 |
Brazilian Diamonds Ltd. (a) | 332,000 | | 41 |
First Quantum Minerals Ltd. | 190,271 | | 10,872 |
Grove Energy Ltd. (a) | 1,964,140 | | 1,161 |
Lionore Mining International Ltd. (a) | 474,540 | | 4,003 |
MagIndustries Corp. (a) | 7,216,960 | | 6,107 |
Oilexco, Inc. (a) | 1,394,525 | | 8,360 |
Platinum Group Metals Ltd. (a) | 407,100 | | 696 |
Rock Well Petroleum, Inc. (g) | 770,400 | | 1,029 |
Starfield Resources, Inc. (a)(e) | 13,019,181 | | 3,247 |
Starfield Resources, Inc.: | | | |
warrants 5/9/07 (a)(g) | 1,313,025 | | 9 |
warrants 1/21/08 (a)(g) | 1,678,100 | | 89 |
Stealth Ventures Ltd. (a) | 966,500 | | 1,178 |
Stealth Ventures Ltd. warrants 3/12/08 (a)(g) | 483,250 | | 110 |
StrataGold Corp. (a) | 2,976,400 | | 2,704 |
SXR Uranium One, Inc. (a) | 475,740 | | 5,409 |
Tenke Mining Corp. (a) | 103,000 | | 1,373 |
Visual Defence, Inc. (a)(e) | 5,963,100 | | 2,673 |
Western Canadian Coal Corp. | 1,554,418 | | 2,894 |
Western Canadian Coal Corp. (United Kingdom) (a) | 548,286 | | 1,098 |
TOTAL CANADA | | 65,610 |
Cayman Islands - 0.4% |
Computime Group Ltd. | 2,048,000 | | 761 |
EcoGreen Fine Chemical Group Ltd. | 2,346,000 | | 573 |
Common Stocks - continued |
| Shares | | Value (Note 1) (000s) |
Cayman Islands - continued |
Hopefluent Group Holdings Ltd. | 20,000 | | $ 8 |
Kingboard Chemical Holdings Ltd. | 149,000 | | 530 |
New World China Land Ltd. | 3,470,000 | | 1,664 |
Prime Success International Group Ltd. | 2,718,000 | | 2,230 |
Shimao Property Holdings Ltd. | 648,000 | | 873 |
Wasion Meters Group Ltd. | 2,030,000 | | 848 |
TOTAL CAYMAN ISLANDS | | 7,487 |
China - 0.9% |
BYD Co. Ltd. (H Shares) (a) | 363,000 | | 978 |
China International Marine Containers Co. Ltd. (B Shares) | 1,115,800 | | 1,571 |
China Merchants Bank Co. Ltd. (H Shares) (a) | 1,663,500 | | 2,597 |
China Oilfield Services Ltd. (H Shares) | 2,664,000 | | 1,497 |
China Shipping Development Co. Ltd. (H Shares) | 1,286,000 | | 1,399 |
Dalian Port (PDA) Co. Ltd. (H Shares) | 2,188,000 | | 1,058 |
Guangzhou R&F Properties Co. Ltd. (H Shares) | 696,000 | | 1,137 |
Home Inns & Hotels Management, Inc. sponsored ADR | 2,200 | | 54 |
Hunan Non-Ferrous Metals Corp. Ltd. (H Shares) | 3,026,000 | | 1,432 |
Industrial & Commercial Bank of China | 2,524,000 | | 1,129 |
London Asia Chinese Private Equity Fund Ltd. (a) | 473,800 | | 1,008 |
Nine Dragons Paper (Holdings) Ltd. | 1,154,000 | | 1,469 |
Parkson Retail Group Ltd. | 36,000 | | 150 |
Shenzhou International Group Holdings Ltd. | 2,768,000 | | 1,146 |
Yantai Changyu Pioneer Wine Co. (B Shares) | 327,210 | | 1,115 |
TOTAL CHINA | | 17,740 |
Cyprus - 0.1% |
Buried Hill Energy (Cyprus) PLC (g) | 1,947,000 | | 2,142 |
Czech Republic - 1.1% |
Ceske Energeticke Zavody AS | 533,600 | | 21,101 |
Finland - 0.6% |
Inion OY (a)(e) | 3,740,300 | | 1,677 |
Nokian Tyres Ltd. | 348,000 | | 6,663 |
Tekla Oyj (A Shares) | 344,180 | | 2,886 |
TOTAL FINLAND | | 11,226 |
France - 3.2% |
BVRP Software SA (a) | 98,706 | | 1,914 |
Carbone Lorraine | 27,400 | | 1,526 |
Carrefour SA | 50,000 | | 3,047 |
Constructions Industrielles dela Mediterranee SA | 9,300 | | 1,319 |
Common Stocks - continued |
| Shares | | Value (Note 1) (000s) |
France - continued |
Electricite de France | 90,900 | | $ 5,512 |
Groupe Open SA (a)(d) | 51,442 | | 867 |
Groupe Promeo | 32,130 | | 1,538 |
Guerbet SA | 8,400 | | 1,406 |
Icade SA | 435,318 | | 25,843 |
Sechilienne-Sidec | 94,320 | | 3,612 |
Tessi SA | 43,953 | | 2,776 |
The Lisi Group | 22,500 | | 1,581 |
Veolia Environnement | 166,000 | | 10,164 |
TOTAL FRANCE | | 61,105 |
Germany - 3.1% |
Articon-Integralis AG (Reg.) (a) | 195,779 | | 825 |
Deutz AG (a)(d) | 1,027,100 | | 10,344 |
E.ON AG | 93,000 | | 11,196 |
ElringKlinger AG | 18,284 | | 972 |
Fresenius Medical Care AG | 108,100 | | 14,424 |
Grenkeleasing AG | 25,918 | | 1,069 |
Kontron AG | 120,300 | | 1,749 |
Merck KGaA | 18,831 | | 1,985 |
Parsytec AG (a) | 153,836 | | 1,198 |
Pfleiderer AG | 164,259 | | 4,462 |
PSI AG (a) | 387,761 | | 2,227 |
Pulsion Medical Systems AG (a) | 98,511 | | 742 |
RWE AG | 52,000 | | 5,139 |
SGL Carbon AG (a) | 200,700 | | 4,396 |
TOTAL GERMANY | | 60,728 |
Greece - 0.9% |
Autohellas SA | 259,430 | | 1,556 |
Fourlis Holdings SA | 110,000 | | 2,134 |
Marfin Financial Group Holdings SA | 45,000 | | 2,270 |
Sarantis SA (Reg.) | 1,159,018 | | 11,243 |
TOTAL GREECE | | 17,203 |
Hong Kong - 1.2% |
Bank of East Asia Ltd. | 275,000 | | 1,314 |
Cafe de Coral Holdings Ltd. | 976,000 | | 1,526 |
China Overseas Land & Investment Ltd. | 1,424,000 | | 1,298 |
Citic International Financial Holdings Ltd. | 858,000 | | 576 |
CNPC (Hong Kong) Ltd. | 3,180,000 | | 1,595 |
Esprit Holdings Ltd. | 389,000 | | 3,766 |
Common Stocks - continued |
| Shares | | Value (Note 1) (000s) |
Hong Kong - continued |
Fairwood Holdings Ltd. (f) | 928,500 | | $ 920 |
Hong Kong Aircraft & Engineering Co. | 11,200 | | 142 |
Industrial & Commercial Bank of China (Asia) Ltd. | 820,000 | | 1,421 |
Li & Fung Ltd. | 924,000 | | 2,418 |
Lifestyle International Holdings Ltd. | 451,000 | | 874 |
Sa Sa International Holdings Ltd. | 1,028,000 | | 365 |
Tai Cheung Holdings Ltd. | 1,384,000 | | 683 |
Vtech Holdings Ltd. | 882,000 | | 4,434 |
Wing Lung Bank Ltd. | 122,700 | | 1,167 |
TOTAL HONG KONG | | 22,499 |
India - 0.2% |
Great Eastern Energy Corp. Ltd. GDR | 909,000 | | 2,124 |
Noida Toll Bridge Co. Ltd. GDR | 454,051 | | 1,975 |
TOTAL INDIA | | 4,099 |
Indonesia - 0.1% |
PT Bank Niaga Tbk | 15,019,000 | | 1,434 |
PT Perushahaan Perkebunan London Sumatra Tbk | 1,526,500 | | 775 |
PT Telkomunikasi Indonesia Tbk Series B | 592,000 | | 546 |
TOTAL INDONESIA | | 2,755 |
Ireland - 0.7% |
Adwalker PLC (a)(e) | 9,125,000 | | 413 |
Glanbia PLC | 1,135,500 | | 4,348 |
Kenmare Resources PLC (a) | 2,640,000 | | 1,964 |
Kenmare Resources PLC warrants 7/23/09 (a) | 1,712,500 | | 751 |
Minco PLC (a) | 300,000 | | 47 |
Petroceltic International PLC (a)(d) | 13,644,934 | | 3,384 |
Providence Resources PLC (a) | 1,675,130 | | 141 |
Trinity Biotech PLC sponsored ADR (a) | 227,325 | | 2,085 |
Vimio PLC (a) | 867,300 | | 935 |
TOTAL IRELAND | | 14,068 |
Israel - 0.6% |
Advanced Vision Technology Ltd. (a) | 133,900 | | 1,786 |
Israel Chemicals Ltd. | 611,900 | | 3,495 |
Leadcom Integrated Solutions | 3,601,400 | | 4,053 |
Metal-Tech Ltd. | 575,500 | | 1,756 |
MTI Wireless Edge Ltd. | 705,128 | | 632 |
TOTAL ISRAEL | | 11,722 |
Common Stocks - continued |
| Shares | | Value (Note 1) (000s) |
Italy - 2.9% |
Banca Italease Spa | 790,700 | | $ 44,157 |
Bastogi Spa (a) | 3,339,200 | | 861 |
Enel Spa ADR | 543,800 | | 5,220 |
ERG Spa | 109,100 | | 2,285 |
Lottomatica Spa | 81,000 | | 2,957 |
Teleunit Spa (e) | 12,719,158 | | 1,122 |
TOTAL ITALY | | 56,602 |
Japan - 31.2% |
Abc-Mart, Inc. | 320,300 | | 7,230 |
Access Co. Ltd. (a) | 515 | | 1,013 |
Access Co. Ltd. (a)(d) | 181 | | 1,206 |
Advanced Media, Inc. (a) | 64 | | 167 |
Aeon Fantasy Co. Ltd. | 55,300 | | 1,967 |
Aichi Steel Corp. (d) | 280,000 | | 1,666 |
Ain Pharmaciez, Inc. | 38,000 | | 695 |
Alpen Co. Ltd. | 51,200 | | 1,541 |
AOC Holdings, Inc. | 70,500 | | 1,278 |
AOI Electronics Co. Ltd. | 79,000 | | 1,800 |
Ariake Japan Co. Ltd. (d) | 115,300 | | 2,119 |
Asahi Diamond Industrial Co. Ltd. | 231,000 | | 1,523 |
Asics Corp. | 137,000 | | 1,835 |
Asset Managers Co. Ltd. (d) | 931 | | 2,547 |
Atect Corp. | 17,100 | | 224 |
Atrium Co. Ltd. | 98,700 | | 3,367 |
Axell Corp. | 490 | | 1,550 |
Bic Camera, Inc. | 48 | | 67 |
Bit-isle, Inc. | 284 | | 1,428 |
Bookoff Corp. | 151,200 | | 2,760 |
C. Uyemura & Co. Ltd. | 42,400 | | 2,799 |
Canon Fintech, Inc. | 72,900 | | 1,318 |
Casio Micronics Co. Ltd. | 181,900 | | 2,003 |
Chiba Bank Ltd. | 458,000 | | 4,104 |
Chiyoda Corp. | 129,000 | | 2,338 |
Chugoku Marine Paints Ltd. | 49,000 | | 307 |
Chuo Denki Kogyo Co. Ltd. (d) | 30,000 | | 114 |
CMIC Co. Ltd. (d) | 1,990 | | 521 |
Create SD Co. Ltd. | 65,900 | | 1,076 |
Daido Metal Co. Ltd. (d) | 784,000 | | 5,175 |
Daido Steel Co. Ltd. | 1,192,000 | | 7,776 |
Daikokutenbussan Co. Ltd. | 44,100 | | 914 |
Daiseki Co. Ltd. | 79,500 | | 1,920 |
Common Stocks - continued |
| Shares | | Value (Note 1) (000s) |
Japan - continued |
Daito Gyorui Co. Ltd. | 93,000 | | $ 200 |
Daiwa Securities Group, Inc. | 158,000 | | 1,793 |
Daiwabo Information System Ltd. (d) | 285,500 | | 3,586 |
Denyo Co. Ltd. | 49,600 | | 537 |
Descente Ltd. (d) | 220,000 | | 1,117 |
Ebara Corp. (d) | 311,000 | | 1,215 |
Eiken Chemical Co. Ltd. | 122,700 | | 1,194 |
Elpida Memory, Inc. (a) | 41,100 | | 1,919 |
Endo Lighting Corp. | 177,900 | | 1,688 |
EPS Co. Ltd. (d) | 996 | | 2,333 |
Fast Retailing Co. Ltd. | 48,500 | | 4,590 |
FCC Co. Ltd. (d) | 71,800 | | 1,651 |
FinTech Global, Inc. (d) | 1,812 | | 1,642 |
Fujikura Ltd. (d) | 1,999,000 | | 21,381 |
Fullcast Co. Ltd. (d) | 1,033 | | 3,047 |
Furukawa Electric Co. Ltd. | 956,000 | | 6,825 |
Futaba Industrial Co. Ltd. (d) | 102,000 | | 2,333 |
Gentosha, Inc. (d) | 111 | | 459 |
Hamamatsu Photonics KK (d) | 145,100 | | 4,193 |
Harmonic Drive Systems, Inc. | 306 | | 1,672 |
Haseko Corp. (a)(d) | 876,500 | | 3,013 |
Heiwa Real Estate Co. Ltd. (d) | 290,000 | | 1,946 |
Hikari Tsushin, Inc. | 247,800 | | 13,051 |
Hioki EE Corp. | 32,300 | | 994 |
Hiroshima Bank Ltd. | 451,000 | | 2,695 |
Hitachi Construction Machinery Co. Ltd. | 369,900 | | 8,792 |
Hitachi Maxell Ltd. | 138,500 | | 2,031 |
Hokuriku Electric Industry (d) | 882,000 | | 2,519 |
Hokuto Corp. | 178,900 | | 2,941 |
Ibiden Co. Ltd. | 34,000 | | 1,782 |
Inpex Holdings, Inc. | 235 | | 1,921 |
Intelligence Ltd. (d) | 718 | | 1,559 |
Internet Research Institute, Inc. (d) | 1,474 | | 916 |
Iriso Electronics Co. Ltd. | 62,400 | | 2,241 |
Ishihara Chemical Co. Ltd. | 38,500 | | 762 |
Ishikawajima-Harima Heavy Industries Co. Ltd. | 1,408,000 | | 4,743 |
Itochu Corp. | 734,000 | | 5,849 |
ITOCHU Techno-Solutions Corp. (d) | 21,600 | | 1,208 |
Japan Communications, Inc. (a)(d) | 333 | | 104 |
Japan Digital Contents Trust, Inc. (a) | 725 | | 209 |
Jastec Co. Ltd. | 141,300 | | 1,258 |
JGC Corp. | 108,000 | | 1,681 |
Common Stocks - continued |
| Shares | | Value (Note 1) (000s) |
Japan - continued |
Joint Corp. | 33,000 | | $ 1,298 |
JSR Corp. | 126,300 | | 3,175 |
Juroku Bank Ltd. | 179,000 | | 1,015 |
Kakaku.com, Inc. (d) | 607 | | 1,806 |
Kenedix, Inc. | 312 | | 1,753 |
Kibun Food Chemifa Co. Ltd. (d) | 66,900 | | 677 |
Kitagawa Seiki Co. Ltd. | 31,500 | | 225 |
KK daVinci Advisors (a) | 2,823 | | 3,089 |
Kobayashi Pharmaceutical Co. Ltd. | 109,400 | | 4,200 |
Koito Manufacturing Co. Ltd. | 149,000 | | 2,106 |
Konica Minolta Holdings, Inc. (d) | 479,000 | | 6,381 |
Kubota Corp. | 59,000 | | 516 |
Kura Corp. Ltd. | 4,979 | | 11,537 |
Kurita Water Industries Ltd. | 86,800 | | 1,774 |
Link Theory Holdings Co. Ltd. (d) | 120 | | 228 |
Lintec Corp. | 150,300 | | 3,431 |
Mandom Corp. | 25,200 | | 614 |
Mazda Motor Corp. | 940,000 | | 6,357 |
Media Global Links Co. Ltd. | 473 | | 1,209 |
Meganesuper Co. Ltd. | 20 | | 0 |
Meiko Electronics Co. Ltd. | 141,300 | | 5,678 |
Micronics Japan Co. Ltd. (d) | 200,100 | | 5,680 |
Mitsuba Corp. | 277,000 | | 2,027 |
Mitsubishi Gas Chemical Co., Inc. | 985,000 | | 9,382 |
Mitsubishi Materials Corp. (d) | 433,000 | | 1,707 |
Mitsubishi Rayon Co. Ltd. | 99,000 | | 625 |
Mitsui Engineering & Shipbuilding Co. | 770,000 | | 2,870 |
Mitsui O.S.K. Lines Ltd. | 705,000 | | 5,877 |
Miyachi Corp. | 39,100 | | 690 |
Mori Seiki Co. Ltd. (d) | 93,600 | | 1,957 |
Murata Manufacturing Co. Ltd. | 131,000 | | 9,162 |
Nabtesco Corp. | 132,000 | | 1,586 |
Nachi-Fujikoshi Corp. | 1,045,000 | | 5,191 |
Nafco Co. Ltd. | 34,600 | | 958 |
NEOMAX Co. Ltd. (d) | 325,000 | | 5,974 |
NGK Spark Plug Co. Ltd. (d) | 631,000 | | 13,299 |
NHK Spring Co. Ltd. | 321,000 | | 3,549 |
NIC Corp. | 224,900 | | 1,850 |
Nidec Copal Electronics Corp. (d) | 308,900 | | 2,113 |
Nidec Corp. | 44,100 | | 3,375 |
Nihon Ceratec Co. Ltd. (d) | 283 | | 733 |
Nihon Dempa Kogyo Co. Ltd. (d) | 327,400 | | 13,436 |
Common Stocks - continued |
| Shares | | Value (Note 1) (000s) |
Japan - continued |
Nihon Micro Coating Co. Ltd. | 35,600 | | $ 258 |
Nihon Trim Co. Ltd. (d) | 193,500 | | 9,314 |
Nihonwasou Holdings, Inc. | 6 | | 6 |
Nikkiso Co. Ltd. | 316,000 | | 2,713 |
Nippon Chemiphar Co. Ltd. (a)(d) | 301,000 | | 1,969 |
Nippon Denko Co. Ltd. (d) | 1,904,000 | | 7,456 |
Nippon Mining Holdings, Inc. | 77,000 | | 575 |
Nippon Oil Corp. | 204,000 | | 1,517 |
Nippon Paint Co. Ltd. | 970,000 | | 5,208 |
Nippon Seiki Co. Ltd. | 757,000 | | 18,090 |
Nippon Soda Co. Ltd. (a) | 330,000 | | 1,744 |
Nissei Corp. | 97,900 | | 963 |
Nissin Kogyo Co. Ltd. | 968,100 | | 23,176 |
NOK Corp. | 732,700 | | 19,232 |
Noritake Co. Ltd. | 287,000 | | 1,453 |
NTN Corp. | 165,000 | | 1,359 |
Obara Corp. | 1,100 | | 43 |
Oiles Corp. | 64,500 | | 1,530 |
Optex Co. Ltd. (d) | 32,400 | | 906 |
Optoelectronics Co. Ltd. | 37,100 | | 980 |
Otaki Gas Co. Ltd. | 15,000 | | 78 |
Otsuka Corp. (d) | 23,100 | | 2,536 |
Pacific Metals Co. Ltd. | 154,000 | | 1,323 |
Phoenix Electric Co. Ltd. (d) | 238,100 | | 1,460 |
Pigeon Corp. (d) | 68,800 | | 1,259 |
Produce Co. Ltd. | 364 | | 2,652 |
Ray Corp. | 189,100 | | 404 |
Rex Holdings Co. Ltd. (d) | 1,683 | | 2,921 |
Round One Corp. | 569 | | 2,325 |
Royal Holdings Co. Ltd. | 84,700 | | 1,167 |
Ryobi Ltd. | 254,000 | | 2,026 |
Saison Information Systems Co. Ltd. | 118,300 | | 1,135 |
Saizeriya Co. Ltd. (d) | 73,700 | | 965 |
Sammy NetWorks Co. Ltd. (d) | 1,083 | | 5,648 |
Sanyo Special Steel Co. Ltd. | 143,000 | | 952 |
Sato Corp. | 201,200 | | 3,819 |
Sawai Pharmaceutical Co. Ltd. (d) | 48,800 | | 2,257 |
SBI Holdings, Inc. | 2,969 | | 1,084 |
Sega Sammy Holdings, Inc. | 62,100 | | 1,561 |
Sekisui Plastics Co. Ltd. | 128,000 | | 439 |
Seria Co. Ltd. | 577 | | 977 |
Common Stocks - continued |
| Shares | | Value (Note 1) (000s) |
Japan - continued |
Shaddy Co. Ltd. (d) | 142,000 | | $ 1,808 |
Shibaura Electronics Co. Ltd. | 121,300 | | 2,152 |
Shikoku Chemicals Corp. (d) | 105,000 | | 614 |
Shin-Kobe Electric Machinery Co. Ltd. | 104,000 | | 554 |
Shinohara Systems of Construction Co. Ltd. (a) | 345 | | 767 |
Shizuki Electric Co., Inc. | 405,000 | | 1,766 |
Showa Denko KK | 569,000 | | 2,481 |
St. Marc Holdings Co. Ltd. | 18,500 | | 1,237 |
Star Micronics Co. Ltd. | 256,400 | | 4,768 |
Starbucks Coffee Japan Ltd. | 2,348 | | 1,016 |
Stella Chemifa Corp. (d) | 58,200 | | 1,951 |
Sumco Corp. | 42,400 | | 3,016 |
Sumitomo Corp. | 481,100 | | 6,326 |
Sumitomo Metal Industries Ltd. | 827,000 | | 3,111 |
Sumitomo Metal Mining Co. Ltd. | 290,000 | | 3,811 |
Sumitomo Titanium Corp. (d) | 15,200 | | 1,805 |
Sumitomo Trust & Banking Co. Ltd. | 186,000 | | 2,001 |
Sun Frontier Fudousan Co. Ltd. | 450 | | 1,027 |
Sunx Ltd. | 284,100 | | 3,031 |
Sysmex Corp. (d) | 84,100 | | 3,387 |
T&D Holdings, Inc. | 21,800 | | 1,594 |
Taisei Corp. | 283,000 | | 963 |
Taiyo Ink Manufacturing Co. Ltd. | 58,000 | | 3,065 |
Taiyo Kagaku | 87,800 | | 897 |
Taiyo Nippon Sanso Corp. Tokyo | 366,000 | | 3,217 |
Takiron Co. Ltd. | 337,000 | | 1,184 |
Telewave, Inc. (d) | 3,307 | | 6,588 |
The First Energy Service Co. Ltd. (a)(d) | 165 | | 175 |
Toagosei Co. Ltd. | 423,000 | | 1,624 |
Toc Co. Ltd. | 78,500 | | 428 |
Tohcello Co. Ltd. | 135,500 | | 1,732 |
Tokai Carbon Co. Ltd. (d) | 180,000 | | 1,216 |
Token Corp. (d) | 153,710 | | 11,604 |
Tokuyama Corp. | 122,000 | | 1,535 |
Tokyo Gas Co. Ltd. (d) | 297,000 | | 1,516 |
Tokyo Seimitsu Co. Ltd. | 12,600 | | 609 |
Tomen Devices Corp. | 65,100 | | 1,350 |
TonenGeneral Sekiyu KK (d) | 147,000 | | 1,400 |
Toray Industries, Inc. | 188,000 | | 1,355 |
Toshiba Machine Co. Ltd. | 328,000 | | 2,961 |
Toyo Ink Manufacturing Co. Ltd. | 127,000 | | 513 |
Trancom Co. Ltd. | 83,800 | | 1,594 |
Common Stocks - continued |
| Shares | | Value (Note 1) (000s) |
Japan - continued |
Trend Micro, Inc. | 57,500 | | $ 1,844 |
Tyo Productions, Inc. (d) | 101,500 | | 399 |
Ulvac, Inc. | 55,600 | | 1,631 |
Unicom Group Holdings, Inc. | 154,500 | | 1,878 |
Usen Corp. (d) | 205,690 | | 2,040 |
V Technology Co. Ltd. (d) | 145 | | 707 |
Village Vanguard Co. Ltd. (d) | 163 | | 985 |
Wacom Co. Ltd. (d) | 334 | | 742 |
Wiz Co. Ltd. | 297 | | 853 |
Yachiyo Industry Co. Ltd. | 76,600 | | 1,772 |
Yahoo! Japan Corp. | 1,836 | | 714 |
Yamada Denki Co. Ltd. | 123,990 | | 12,340 |
Yaskawa Electric Corp. (d) | 271,000 | | 2,892 |
Yokogawa Electric Corp. | 247,900 | | 3,402 |
Yoshimoto Kogyo Co. Ltd. | 52,900 | | 963 |
TOTAL JAPAN | | 603,439 |
Korea (South) - 0.7% |
CDNetworks Co. Ltd. (a) | 827 | | 28 |
Hite Brewery Co. Ltd. | 4,633 | | 551 |
Korean Reinsurance Co. | 61,966 | | 700 |
LG Dacom Corp. | 70,720 | | 1,644 |
LG Household & Health Care Ltd. | 28,820 | | 2,661 |
NHN Corp. | 8,466 | | 840 |
Nice e-Banking Services | 8,970 | | 371 |
Orion Corp. | 3,590 | | 972 |
Pyeong San Co. Ltd. | 14,925 | | 384 |
SFA Engineering Corp. | 25,920 | | 812 |
SK Corp. | 11,180 | | 820 |
STX Pan Ocean Co. Ltd. | 2,327,000 | | 1,285 |
Taewoong Co. Ltd. | 49,925 | | 1,380 |
YBM Sisa.com, Inc. | 71,707 | | 1,549 |
TOTAL KOREA (SOUTH) | | 13,997 |
Luxembourg - 0.3% |
SES Global SA FDR (France) | 319,100 | | 4,892 |
Malaysia - 0.2% |
Kulim Malaysia BHD | 1,300,400 | | 1,659 |
Steppe Cement Ltd. (a) | 636,100 | | 2,305 |
TOTAL MALAYSIA | | 3,964 |
Common Stocks - continued |
| Shares | | Value (Note 1) (000s) |
Netherlands - 0.3% |
Bateman Engineering NV | 349,377 | | $ 2,006 |
Engel East Europe NV | 1,448,532 | | 3,295 |
TOTAL NETHERLANDS | | 5,301 |
New Zealand - 0.6% |
Fisher & Paykel Healthcare Corp. | 1,509,151 | | 4,227 |
Freightways Ltd. | 353,460 | | 959 |
Sky City Entertainment Group Ltd. | 1,781,777 | | 6,149 |
TOTAL NEW ZEALAND | | 11,335 |
Norway - 2.3% |
Aker Kvaerner ASA | 22,550 | | 2,346 |
Camillo Eitzen & Co. ASA (d) | 252,400 | | 2,848 |
Eitzen Maritime Services ASA (a)(d) | 68,425 | | 25 |
Fred Olsen Energy ASA (a)(d) | 25,500 | | 1,100 |
Hafslund ASA (B Shares) | 369,270 | | 6,779 |
Pertra AS (A Shares) (a) | 175,642 | | 1,720 |
ProSafe ASA | 172,000 | | 10,999 |
Schibsted ASA (B Shares) | 48,600 | | 1,472 |
Songa Offshore ASA (a) | 751,186 | | 6,694 |
Stepstone ASA (a) | 4,710,000 | | 8,286 |
TANDBERG ASA | 263,700 | | 3,046 |
TOTAL NORWAY | | 45,315 |
Papua New Guinea - 0.2% |
Oil Search Ltd. | 1,136,300 | | 3,008 |
Singapore - 2.3% |
Advent Air Ltd. (e) | 14,719,299 | | 2,948 |
Banyan Tree Holdings Ltd. | 1,038,000 | | 627 |
Cosco Corp. Singapore Ltd. | 3,949,000 | | 4,868 |
CSE Global Ltd. | 1,038,000 | | 766 |
DBS Group Holdings Ltd. | 87,000 | | 1,140 |
GigaMedia Ltd. (a) | 355,600 | | 3,439 |
HTL International Holdings Ltd. | 673,375 | | 510 |
Keppel Corp. Ltd. | 174,000 | | 1,765 |
Keppel Land Ltd. | 823,000 | | 2,906 |
Osim International Ltd. | 1,741,000 | | 1,889 |
Parkway Holdings Ltd. | 3,746,000 | | 6,663 |
SembCorp Marine Ltd. | 809,000 | | 1,777 |
SIA Engineering Co. Ltd. | 1,538,000 | | 3,693 |
Singapore Petroleum Co. Ltd. | 199,000 | | 580 |
Uol Group Ltd. | 2,329,000 | | 5,982 |
Common Stocks - continued |
| Shares | | Value (Note 1) (000s) |
Singapore - continued |
Want Want Holdings Ltd. | 2,077,000 | | $ 3,718 |
Yanlord Land Group Ltd. | 547,000 | | 509 |
TOTAL SINGAPORE | | 43,780 |
South Africa - 1.7% |
Barnard Jacobs Mellet Holdings Ltd. | 2,661,840 | | 1,742 |
MTN Group Ltd. | 377,102 | | 3,430 |
Steinhoff International Holdings Ltd. | 6,659,732 | | 21,698 |
Telkom SA Ltd. | 146,300 | | 2,716 |
Wilson Bayly Holmes-Ovcon Ltd. | 446,856 | | 4,198 |
TOTAL SOUTH AFRICA | | 33,784 |
Sweden - 1.1% |
Hexagon AB (B Shares) (d) | 239,511 | | 8,921 |
Modern Times Group AB (MTG) (B Shares) | 227,750 | | 13,118 |
TOTAL SWEDEN | | 22,039 |
Switzerland - 0.3% |
Actelion Ltd. (Reg.) (a) | 16,588 | | 2,793 |
Arpida Ltd. (a) | 8,195 | | 192 |
Bucher Holding AG | 15,811 | | 1,601 |
Sulzer AG (Reg.) | 2,070 | | 1,822 |
TOTAL SWITZERLAND | | 6,408 |
Taiwan - 0.6% |
China Life Insurance Co. Ltd. (a) | 2,916,000 | | 1,433 |
High Tech Computer Corp. | 33,000 | | 821 |
Hung Poo Real Estate Development Co. Ltd. | 966,000 | | 1,069 |
KEE TAI Properties Co. Ltd. (a) | 1,920,000 | | 1,126 |
Shin Kong Financial Holding Co. Ltd. | 1,896,700 | | 1,681 |
Sinyi Realty, Inc. | 697,000 | | 1,681 |
Taiwan Chi Cheng Enterprise Co. Ltd. | 580,000 | | 1,547 |
Taiwan Fertilizer Co. Ltd. | 910,000 | | 1,481 |
TOTAL TAIWAN | | 10,839 |
Thailand - 0.3% |
Aromatics (Thailand) PCL | 931,500 | | 889 |
Bumrungrad Hospital PCL (For. Reg.) | 2,926,900 | | 2,932 |
Robinson Department Store PCL (For. Reg.) (a) | 1,281,100 | | 395 |
Total Access Communication PCL (a) | 311,200 | | 1,245 |
TOTAL THAILAND | | 5,461 |
Common Stocks - continued |
| Shares | | Value (Note 1) (000s) |
Turkey - 0.2% |
Dogan Gazetecilik AS (a) | 1,979,955 | | $ 3,777 |
KOZA, Inc. (a) | 93,000 | | 578 |
TOTAL TURKEY | | 4,355 |
United Kingdom - 19.1% |
Accuma Group PLC (a) | 507,663 | | 2,445 |
Advanced Fluid Connection PLC (a) | 7,009,687 | | 0 |
Advanced Technology PLC (a)(e) | 7,355,000 | | 0 |
ADVFN PLC (a) | 20,254,200 | | 1,120 |
AeroBox PLC (a) | 5,694,657 | | 57 |
Afren PLC (a)(d) | 8,430,660 | | 7,679 |
African Consolidated Resources PLC | 7,758,334 | | 1,295 |
African Copper PLC (a) | 1,677,884 | | 2,096 |
Air Partner PLC | 45,000 | | 698 |
Alliance Pharma PLC (a) | 7,984,200 | | 2,132 |
Alterian PLC (a) | 1,020,800 | | 2,230 |
Amlin PLC | 206,973 | | 1,189 |
Andor Technology Ltd. (a) | 313,644 | | 515 |
Anglo Asian Mining PLC (a) | 4,744,400 | | 1,855 |
Angus & Ross PLC (a) | 4,124,200 | | 1,357 |
Angus & Ross PLC (a)(g) | 2,566,117 | | 760 |
Appian Technology PLC (a) | 4,869,178 | | 720 |
Appian Technology PLC warrants 2/28/08 (a)(g) | 479,045 | | 58 |
Ascent Resources PLC (a) | 11,792,400 | | 2,812 |
Ascent Resources PLC warrants 12/22/07 (a) | 1,500,000 | | 102 |
Asia Energy PLC (a) | 1,478,451 | | 2,623 |
Atrium Underwriting PLC | 257,060 | | 1,109 |
Autoclenz Holdings PLC | 422,000 | | 910 |
Avanti Screenmedia Group PLC (a)(e) | 1,410,260 | | 9,335 |
Avation PLC (a) | 1,526,929 | | 0 |
Baltic Oil Terminals PLC | 1,758,000 | | 6,707 |
Belitung Zinc Corp. PLC (g) | 7,435,490 | | 1,418 |
BioCare Solutions plc (e) | 5,174,719 | | 2,270 |
Bioprogress PLC (a)(e) | 8,454,910 | | 9,152 |
Blackstar Investors PLC | 2,870,000 | | 5,885 |
Block Shield Corp. PLC (a) | 1,103,400 | | 2,547 |
BowLeven PLC (a) | 1,115,160 | | 4,159 |
British Energy Group PLC (a) | 302,200 | | 2,424 |
Cambrian Mining PLC (e) | 6,402,100 | | 15,845 |
Camco International Ltd. | 868,900 | | 854 |
Cardpoint PLC (a) | 345,300 | | 566 |
CareCapital Group PLC | 1,847,500 | | 1,163 |
Common Stocks - continued |
| Shares | | Value (Note 1) (000s) |
United Kingdom - continued |
Celsis International PLC (a) | 788,248 | | $ 2,842 |
Central African Mining & Exploration Co. PLC (a) | 12,663,119 | | 10,749 |
Centurion Electronics PLC (a)(e) | 880,024 | | 432 |
Ceres Power Holding PLC (a) | 329,370 | | 1,520 |
Chaco Resources PLC (a) | 10,430,720 | | 2,437 |
Clapham House Group PLC (a) | 494,150 | | 2,295 |
Cobra Biomanufacturing PLC (a) | 396,900 | | 352 |
Coffeeheaven International PLC (a) | 4,440,240 | | 2,880 |
Corac Group PLC (a)(e) | 5,224,104 | | 3,538 |
Corin Group PLC | 742,614 | | 3,683 |
Countermine PLC (a)(g) | 4,939 | | 243 |
Countermine PLC warrants 7/26/06 (a)(g) | 4,939 | | 0 |
CustomVis PLC (a) | 1,558,936 | | 134 |
DA Group PLC (a)(e) | 1,800,165 | | 1,236 |
Datacash Group PLC | 720,000 | | 2,019 |
Dominion Energy PLC (a) | 10,531,300 | | 1,708 |
Domino's Pizza UK & IRL PLC | 1 | | 0 |
Dream Direct Group PLC (a) | 145,000 | | 90 |
Eclipse Energy Co. Ltd. (a)(g) | 102,000 | | 1,459 |
Econergy International PLC | 675,000 | | 1,178 |
Emerald Energy PLC (a) | 552,500 | | 2,034 |
EnCore Oil PLC (a) | 2,690,530 | | 1,527 |
Eureka Mining PLC (a) | 381,700 | | 419 |
Europa Oil & Gas Holdings PLC (a) | 1,000,000 | | 463 |
Europa Oil & Gas Holdings PLC warrants 11/11/07 (a) | 500,000 | | 36 |
European Diamonds PLC (a) | 124,300 | | 25 |
Faroe Petroleum PLC (a) | 1,439,666 | | 3,295 |
Financial Payment Systems Ltd. (a)(e) | 7,787,504 | | 1,485 |
Firestone Diamonds PLC (a) | 1,518,100 | | 3,316 |
Flomerics Group PLC | 449,658 | | 643 |
Forum Energy PLC (a) | 1,419,770 | | 2,383 |
Gasol PLC (a)(e) | 7,750,800 | | 1,257 |
Gemfields Resources PLC (e) | 6,234,200 | | 5,589 |
GMA Resources PLC (a)(e) | 22,946,083 | | 3,939 |
Goals Soccer Centres PLC | 438,850 | | 2,323 |
Golden Prospect PLC | 1,457,800 | | 1,439 |
Goldshield Group PLC | 297,470 | | 1,406 |
Gyrus Group PLC (a) | 486,400 | | 3,363 |
Hallin Marine Subsea International PLC | 1,047,700 | | 1,109 |
Hambledon Mining PLC (a) | 6,343,200 | | 1,512 |
Hardide Ltd. (a)(e) | 8,154,400 | | 1,711 |
Healthcare Enterprise Group PLC (a)(e) | 16,540,108 | | 1,010 |
Common Stocks - continued |
| Shares | | Value (Note 1) (000s) |
United Kingdom - continued |
Hot Tuna International PLC (a) | 2,349,400 | | $ 851 |
Hot Tuna International PLC warrants 2/25/08 (a)(g) | 1,179,700 | | 10 |
Hydrodec Group PLC (a)(e) | 13,277,286 | | 8,231 |
ID Data PLC (a)(e) | 84,350,500 | | 925 |
Ideal Shopping Direct PLC | 661,592 | | 3,231 |
Impact Holdings PLC (a)(e) | 10,414,000 | | 2,086 |
Indago Petroleum Ltd. | 2,939,846 | | 2,523 |
Inova Holding PLC | 1,443,461 | | 771 |
Intec Telecom Systems PLC (a) | 1,950,570 | | 1,488 |
Interbulk Investments PLC (a)(e) | 4,899,600 | | 1,682 |
International Con Minerals Ltd. (a)(g) | 2,659,964 | | 798 |
International Con Minerals Ltd. warrants 10/31/07 (a)(g) | 1,329,982 | | 0 |
Intertek Group PLC | 94,110 | | 1,477 |
iomart Group PLC | 2,037,940 | | 3,207 |
IPSA Group PLC (a) | 2,184,605 | | 1,823 |
Irvine Energy PLC (a) | 12,895,900 | | 524 |
ITE Group PLC | 2,420,640 | | 6,568 |
ITM Power PLC (a) | 3,196,490 | | 8,094 |
Jubilee Platinum PLC (a)(e) | 7,171,303 | | 8,789 |
Kalahari Minerals PLC | 3,563,200 | | 1,054 |
KBC Advanced Technologies PLC (a) | 917,600 | | 630 |
Keronite PLC (a)(g) | 13,620,267 | | 1,559 |
KimCor Diamonds PLC (e) | 4,285,000 | | 1,185 |
KimCor Diamonds PLC warrants 3/15/08 (a) | 2,185,000 | | 240 |
Landround PLC (a)(e) | 358,600 | | 188 |
Lansdowne Oil & Gas PLC | 907,620 | | 1,039 |
Lawrence PLC | 964,599 | | 5,465 |
London Asia Chinese Private Equity Fund Ltd. warrants 3/31/11 (a) | 105,400 | | 53 |
LTG Technologies PLC (a)(e) | 19,449,772 | | 1,948 |
Max Petroleum PLC (d) | 11,461,320 | | 21,097 |
Metals Exploration PLC (a)(e) | 3,945,316 | | 2,126 |
Michelmersh Brick Holdings PLC | 109,600 | | 225 |
MicroEmissive Displays (a)(e) | 3,022,300 | | 1,672 |
Motivcom PLC (e) | 1,936,600 | | 3,085 |
NeutraHealth PLC (a) | 6,488,100 | | 1,176 |
Pan African Resources PLC (a) | 3,455,600 | | 338 |
Peninsular Gold Ltd. (a) | 350,000 | | 327 |
PetroLatina Energy PLC (a) | 4,545,755 | | 1,626 |
PetroLatina Energy PLC warrants 4/30/07 (a) | 2,279,573 | | 7 |
Pilat Media Global PLC (a) | 1,026,000 | | 1,365 |
Common Stocks - continued |
| Shares | | Value (Note 1) (000s) |
United Kingdom - continued |
Platinum Mining Corp. of India PLC (a)(e) | 12,070,800 | | $ 2,418 |
Plethora Solutions Holdings PLC (a) | 431,818 | | 1,594 |
PlusNet Technologies Ltd. (a) | 1,409,404 | | 5,242 |
Proteome Sciences PLC (a) | 780,842 | | 957 |
Pureprofile Media PLC (g) | 1,108,572 | | 1,057 |
Pursuit Dynamics PLC (a) | 666,667 | | 1,055 |
Rambler Metals & Mining PLC (a) | 1,300,000 | | 1,017 |
Rheochem PLC (a)(e) | 7,753,300 | | 2,034 |
Rheochem PLC warrants 12/21/07 (a) | 4,364,150 | | 105 |
Ridge Mining PLC (a) | 1,739,800 | | 1,477 |
Sarantel Group PLC Class A (a) | 1,819,000 | | 677 |
Scottish & Southern Energy PLC | 209,000 | | 5,238 |
SDL PLC (a) | 948,100 | | 3,979 |
Serabi Mining PLC (a) | 1,590,800 | | 910 |
Sibir Energy PLC (a) | 84,580 | | 653 |
Sinclair Pharma PLC (a) | 2,521,696 | | 5,556 |
Sinosoft Technology PLC | 4,618,900 | | 1,498 |
Solomon Gold PLC (e) | 1,824,300 | | 905 |
SPI Lasers PLC | 565,800 | | 2,024 |
Spice Holdings PLC | 662,000 | | 4,284 |
SR Pharma plc (a) | 2,245,200 | | 749 |
Stem Cell Sciences PLC (a) | 716,649 | | 601 |
Sterling Energy PLC (a) | 3,389,267 | | 1,148 |
Stratex International PLC | 4,191,100 | | 630 |
SubSea Resources PLC (a)(e) | 7,879,100 | | 2,630 |
SubSea Resources PLC warrants 11/4/09 (a) | 1,805,625 | | 284 |
Synchronica PLC (a) | 1,447,320 | | 511 |
Synergy Healthcare PLC | 135,840 | | 1,775 |
Tanfield Group PLC (a) | 6,543,261 | | 5,429 |
Target Resources PLC | 1,020,000 | | 817 |
Target Resources PLC warrants 7/12/08 (a) | 1,020,000 | | 78 |
Tersus Energy PLC (a) | 1,420,122 | | 799 |
Theratase PLC | 1,725,000 | | 2,007 |
Third Advance Value Realisation Co. Ltd. (a) | 507,108 | | 933 |
Tikit Group PLC | 446,100 | | 2,034 |
TMO Biotec (g) | 10,000 | | 572 |
Toledo Mining Corp. PLC (a)(e) | 1,608,144 | | 3,742 |
Triple Plate Junction PLC (a) | 2,463,000 | | 799 |
Triple Plate Junction PLC warrants 5/9/07 (a) | 1,818,750 | | 0 |
Tristel PLC | 30,000 | | 26 |
UK Coal PLC | 809,200 | | 3,774 |
Unibet Group PLC unit | 214,356 | | 4,689 |
Common Stocks - continued |
| Shares | | Value (Note 1) (000s) |
United Kingdom - continued |
Vectura Group PLC (a) | 2,489,400 | | $ 4,392 |
Victoria Oil & Gas PLC (a) | 1,855,000 | | 2,618 |
Virotec International PLC (a) | 6,788,332 | | 2,104 |
Whatman PLC | 280,100 | | 1,549 |
William Ransom & Son PLC | 2,973,100 | | 2,637 |
Windsor PLC | 333,530 | | 309 |
York Pharma PLC (a) | 1,070,000 | | 1,970 |
ZincOx Resources PLC (a) | 693,100 | | 3,305 |
TOTAL UNITED KINGDOM | | 370,240 |
United States of America - 1.5% |
121Media, Inc. (a) | 644,900 | | 11,748 |
Cyberscan Technology, Inc. (a)(e) | 996,527 | | 4,562 |
Frontera Resources Corp. (a) | 1,892,700 | | 1,950 |
Frontier Mining Ltd. (a)(e) | 6,771,600 | | 1,808 |
Solar Integrated Technologies, Inc. (a) | 1,345,573 | | 667 |
Spacelabs Healthcare, Inc. | 707,250 | | 1,727 |
Uramin, Inc. warrants 7/26/08 (a)(g) | 666,666 | | 330 |
UTEK Corp. (d) | 22,500 | | 320 |
XL TechGroup, Inc. (a) | 1,365,380 | | 5,886 |
TOTAL UNITED STATES OF AMERICA | | 28,998 |
TOTAL COMMON STOCKS (Cost $1,554,654) | 1,859,510 |
Nonconvertible Preferred Stocks - 0.1% |
| | | |
United Kingdom - 0.1% |
Third Advance Value Realisation Co. Ltd. (a)
(Cost $1,344) | 757,164 | | 1,401 |
Investment Companies - 0.0% |
| | | |
United Kingdom - 0.0% |
The Greenhouse Fund Ltd. (a)
(Cost $404) | 2,175,000 | | 456 |
Corporate Bonds - 0.3% |
| Principal Amount (000s)(h) | | Value (Note 1) (000s) |
Convertible Bonds - 0.3% |
Canada - 0.3% |
Western Canadian Coal Corp. 7.5% 3/24/11 | CAD | 7,354 | | $ 5,830 |
Nonconvertible Bonds - 0.0% |
Norway - 0.0% |
Songa Offshore ASA 9% 9/8/10 (f) | | $ 600 | | 600 |
TOTAL CORPORATE BONDS (Cost $6,935) | 6,430 |
Money Market Funds - 9.0% |
| Shares | | |
Fidelity Cash Central Fund, 5.34% (b) | 76,978,461 | | 76,978 |
Fidelity Securities Lending Cash Central Fund, 5.35% (b)(c) | 96,528,195 | | 96,528 |
TOTAL MONEY MARKET FUNDS (Cost $173,506) | 173,506 |
TOTAL INVESTMENT PORTFOLIO - 105.4% (Cost $1,736,843) | | 2,041,303 |
NET OTHER ASSETS - (5.4)% | | (104,822) |
NET ASSETS - 100% | $ 1,936,481 |
Currency Abbreviations |
CAD | - | Canadian dollar |
Legend |
(a) Non-income producing |
(b) Affiliated fund that is available only to investment companies and other accounts managed by Fidelity Investments. The rate quoted is the annualized seven-day yield of the fund at period end. A complete unaudited listing of the fund's holdings as of its most recent quarter end is available upon request. |
(c) Investment made with cash collateral received from securities on loan. |
(d) Security or a portion of the security is on loan at period end. |
(e) Affiliated company |
(f) Security exempt from registration under Rule 144A of the Securities Act of 1933. These securities may be resold in transactions exempt from registration, normally to qualified institutional buyers. At the end of the period, the value of these securities amounted to $1,520,000 or 0.1% of net assets. |
(g) Restricted securities - Investment in securities not registered under the Securities Act of 1933 (excluding 144A issues). At the end of the period, the value of restricted securities (excluding 144A issues) amounted to $14,646,000 or 0.8% of net assets. |
Additional information on each holding is as follows: |
Security | Acquisition Date | Acquisition Cost (000s) |
AirSea Lines | 8/4/06 | $ 1,199 |
AirSea Lines warrants 6/14/08 | 8/4/06 | $ 0 |
Angus & Ross PLC | 8/3/06 | $ 969 |
Appian Technology PLC warrants 2/28/08 | 2/18/05 | $ 0 |
Belitung Zinc Corp. PLC | 1/12/06 | $ 1,308 |
Buried Hill Energy (Cyprus) PCL | 8/18/06 | $ 2,142 |
Countermine PLC | 12/22/05 | $ 443 |
Countermine PLC warrants 7/26/06 | 12/22/05 | $ 0 |
Security | Acquisition Date | Acquisition Cost (000s) |
Eclipse Energy Co. Ltd. | 4/28/05 | $ 1,459 |
Hot Tuna International PLC warrants 2/25/08 | 2/14/06 | $ 0 |
International Con Minerals Ltd. | 1/30/06 | $ 798 |
International Con Minerals Ltd. warrants 10/31/07 | 1/30/06 | $ 0 |
Kalahari Energy | 9/1/06 | $ 1,814 |
Keronite PLC | 8/16/06 | $ 1,549 |
Pureprofile Media PLC | 5/3/05 - 1/11/06 | $ 1,173 |
Rock Well Petroleum, Inc. | 4/13/06 | $ 1,004 |
Starfield Resources, Inc. warrants 5/9/07 | 5/18/06 | $ 0 |
Starfield Resources, Inc. warrants 1/21/08 | 1/17/06 | $ 0 |
Stealth Ventures Ltd. warrants 3/12/08 | 9/21/06 | $ 0 |
TMO Biotec | 10/27/05 | $ 535 |
Uramin, Inc. warrants 7/26/08 | 8/24/05 | $ 0 |
(h) Principal amount is stated in United States dollars unless otherwise noted. |
Affiliated Central Funds |
Information regarding fiscal year to date income earned by the Fund from investments in Fidelity Central Funds is as follows: |
Fund | Income earned
(Amounts in thousands) |
Fidelity Cash Central Fund | $ 1,843 |
Fidelity Securities Lending Cash Central Fund | 2,546 |
Total | $ 4,389 |
Other Affiliated Issuers |
An affiliated company is a company in which the fund has ownership of at least 5% of the voting securities. Fiscal year to date transactions with companies which are or were affiliates are as follows: |
Affiliates
(Amounts in thousands) | Value, beginning of period | Purchases | Sales Proceeds | Dividend Income | Value,
end of
period |
121Media, Inc. | $ 1,832 | $ 915 | $ 704 | $ - | $ - |
Advanced Technology PLC | - | - | - | - | - |
Advent Air Ltd. | - | 2,523 | 121 | 19 | 2,948 |
Adwalker PLC | 1,292 | - | - | - | 413 |
Afren PLC | 12,040 | 2,657 | 7,151 | - | - |
Alliance Pharma PLC | 2,924 | - | 318 | - | - |
Ascent Resources PLC | 2,603 | 526 | 1,215 | - | - |
Autoclenz Holdings PLC | - | 1,213 | 290 | 15 | - |
Avanti Screenmedia Group PLC | - | 7,564 | 1,837 | - | 9,335 |
BDI Mining Corp. | 4,646 | 494 | - | - | 3,288 |
BioCare Solutions PLC | - | 439 | - | - | 2,270 |
Bioprogress PLC | 2,479 | 4,927 | 1,571 | - | 9,152 |
Blackstar Investors PLC | - | 5,074 | - | - | - |
BowLeven PLC | 9,158 | 2,970 | 4,238 | - | - |
Cambrian Mining PLC | 15,024 | 3,024 | 2,644 | 156 | 15,845 |
Centurion Electronics PLC | 574 | 366 | - | - | 432 |
Coffeeheaven International PLC | 1,580 | 1,537 | 1,731 | - | - |
Corac Group PLC | 2,146 | 283 | 88 | - | 3,538 |
Cyberscan Technology, Inc. | 1,725 | 8,966 | - | - | 4,562 |
DA Group PLC | 2,490 | - | 64 | - | 1,236 |
Dominion Energy PLC | - | 932 | - | - | - |
Financial Payment Systems Ltd. | - | 1,729 | - | - | 1,485 |
Forum Energy PLC | 2,505 | 1,207 | 479 | - | - |
Affiliates
(Amounts in thousands) | Value, beginning of period | Purchases | Sales Proceeds | Dividend Income | Value,
end of
period |
Fox Resources Ltd. | $ 844 | $ - | $ 4,134 | $ - | $ - |
Frontier Mining Ltd. | 2,220 | 256 | - | - | 1,808 |
Gasol PLC | - | 2,620 | 263 | - | 1,257 |
Gemfields Resources PLC | - | 5,312 | 532 | - | 5,589 |
GMA Resources PLC | 3,026 | 1,455 | 354 | - | 3,939 |
Hardide Ltd. | 2,909 | - | 1,050 | - | 1,711 |
Healthcare Enterprise Group PLC | 10,604 | 2,028 | - | - | 1,010 |
Hot Tuna International PLC | - | 2,049 | 6 | - | - |
Hydrodec Group PLC | 2,730 | 5,558 | 1,670 | - | 8,231 |
ID Data PLC | 1,344 | - | - | - | 925 |
Impact Holdings PLC | - | 1,944 | - | - | 2,086 |
Inion OY | 3,466 | 2,117 | - | - | 1,677 |
Interbulk Investments PLC | - | 2,006 | 298 | - | 1,682 |
International Ferro Metals | 15,854 | 600 | 1,630 | - | 17,682 |
IPSA Group PLC | 2,128 | - | 1,223 | - | - |
Jubilee Platinum PLC | 3,339 | 4,414 | 791 | - | 8,789 |
KimCor Diamonds PLC | - | 1,147 | 23 | - | 1,185 |
Kura Corp. Ltd. | 18,905 | 588 | 2,593 | 15 | - |
Lambert Howarth Group PLC | 6,291 | - | 5,227 | 131 | - |
Landround PLC | 582 | 54 | - | - | 188 |
Leadcom Integrated Solutions | 4,705 | - | 1,445 | 64 | - |
LTG Technologies PLC | 2,294 | 1,300 | 16 | - | 1,948 |
MagIndustries Corp. | - | 13,459 | 4,582 | - | - |
Metals Exploration PLC | 624 | 533 | 194 | - | 2,126 |
MicroEmissive Displays | - | 1,141 | - | - | 1,672 |
Mineral Commodities Ltd. | - | 1,802 | - | - | 948 |
Mintails Ltd. | - | 1,466 | 244 | - | - |
Motivcom PLC | 3,423 | - | 147 | 40 | 3,085 |
NeutraHealth PLC | 1,719 | - | 193 | - | - |
Oil Quest Resources PLC (OLD) | 596 | - | - | - | - |
Pertra AS (A Shares) | - | 3,513 | 1,508 | - | - |
PetroLatina Energy PLC | - | - | 34 | - | - |
Pilat Media Global PLC | 2,244 | - | 1,894 | - | - |
Platinum Mining Corp. of India PLC | 3,602 | - | 91 | - | 2,418 |
Affiliates
(Amounts in thousands) | Value, beginning of period | Purchases | Sales Proceeds | Dividend Income | Value,
end of
period |
PlusNet Technologies Ltd. | $ 7,340 | $ 720 | $ 845 | $ - | $ - |
PSI AG | 3,396 | - | 1,893 | - | - |
Rheochem PLC | 1,854 | - | 258 | - | 2,034 |
Solomon Gold PLC | - | 1,588 | - | - | 905 |
Sphere Investments Ltd. | 2,552 | - | 2,544 | - | - |
Starfield Resources, Inc. | 3,741 | 1,819 | 1,083 | - | 3,247 |
Stepstone ASA | 5,719 | - | - | - | - |
SubSea Resources PLC | 4,362 | 52 | 461 | - | 2,630 |
Sylvania Resources Ltd. | 2,738 | 557 | 109 | - | - |
Sylvania Resources Ltd. (United Kingdom) | - | 3,084 | - | - | - |
Synchronica PLC (formerly, Dat Group PLC) | 1,263 | - | 117 | - | - |
Taghmen Energy PLC | 5,671 | - | 102 | - | - |
Tanfield Group PLC | 2,911 | 2,114 | 5,156 | - | - |
Tanzanite One Ltd. | 4,936 | 10,260 | 184 | 414 | 9,086 |
Teleunit Spa | 3,683 | 710 | 28 | 94 | 1,122 |
Tikit Group PLC | 2,436 | - | 1,014 | 33 | - |
Toledo Mining Corp. PLC | 982 | 2,614 | 313 | - | 3,742 |
Visual Defence, Inc. | 1,379 | 1,024 | - | - | 2,673 |
Xceldiam Ltd. | 2,643 | - | - | - | 1,946 |
Total | $ 214,073 | $ 127,250 | $ 66,700 | $ 981 | $ 151,845 |
Annual Report
See accompanying notes which are an integral part of the financial statements.
Financial Statements
Statement of Assets and Liabilities
Amounts in thousands (except per-share amounts) | October 31, 2006 |
| | |
Assets | | |
Investment in securities, at value (including securities loaned of $91,236) - See accompanying schedule: Unaffiliated issuers (cost $1,381,890) | $ 1,715,952 | |
Fidelity Central Funds (cost $173,506) | 173,506 | |
Other affiliated issuers (cost $181,447) | 151,845 | |
Total Investments (cost $1,736,843) | | $ 2,041,303 |
Cash | | 79 |
Foreign currency held at value (cost $464) | | 464 |
Receivable for investments sold | | 41,977 |
Receivable for fund shares sold | | 566 |
Dividends receivable | | 2,857 |
Interest receivable | | 359 |
Receivable from investment adviser for expense reductions | | 3 |
Other receivables | | 414 |
Total assets | | 2,088,022 |
| | |
Liabilities | | |
Payable for investments purchased | $ 46,615 | |
Payable for fund shares redeemed | 6,294 | |
Accrued management fee | 1,457 | |
Distribution fees payable | 54 | |
Other affiliated payables | 445 | |
Other payables and accrued expenses | 148 | |
Collateral on securities loaned, at value | 96,528 | |
Total liabilities | | 151,541 |
| | |
Net Assets | | $ 1,936,481 |
Net Assets consist of: | | |
Paid in capital | | $ 1,186,953 |
Undistributed net investment income | | 5,133 |
Accumulated undistributed net realized gain (loss) on investments and foreign currency transactions | | 440,012 |
Net unrealized appreciation (depreciation) on investments and assets and liabilities in foreign currencies | | 304,383 |
Net Assets | | $ 1,936,481 |
Annual Report
See accompanying notes which are an integral part of the financial statements.
Financial Statements - continued
Statement of Assets and Liabilities - continued
Amounts in thousands (except per-share amounts) | October 31, 2006 |
| | |
Calculation of Maximum Offering Price
Class A:
Net Asset Value and redemption price per share ($36,701 ÷ 1,274.8 shares) | | $ 28.79 |
| | |
Maximum offering price per share (100/94.25 of $28.79) | | $ 30.55 |
Class T:
Net Asset Value and redemption price per share ($41,982 ÷ 1,465.7 shares) | | $ 28.64 |
| | |
Maximum offering price per share (100/96.50 of $28.64) | | $ 29.68 |
Class B:
Net Asset Value and offering price per share ($11,354 ÷ 401.7 shares) A | | $ 28.26 |
| | |
Class C:
Net Asset Value and offering price per share ($21,335 ÷ 753.2 shares) A | | $ 28.33 |
| | |
| | |
International Small Cap:
Net Asset Value, offering price and redemption price per share ($1,816,059 ÷ 62,562.3 shares) | | $ 29.03 |
| | |
Institutional Class:
Net Asset Value, offering price and redemption price per share ($9,050 ÷ 312.2 shares) | | $ 28.99 |
A Redemption price per share is equal to net asset value less any applicable contingent deferred sales charge.
Annual Report
See accompanying notes which are an integral part of the financial statements.
Statement of Operations
Amounts in thousands Year ended October 31, 2006 |
Investment Income | | |
Dividends (including $981 received from other affiliated issuers) | | $ 33,534 |
Interest | | 499 |
Income from Fidelity Central Funds (including $2,546 from security lending) | | 4,389 |
| | 38,422 |
Less foreign taxes withheld | | (1,795) |
Total income | | 36,627 |
| | |
Expenses | | |
Management fee
Basic fee | $ 21,102 | |
Performance adjustment | 2,444 | |
Transfer agent fees | 4,929 | |
Distribution fees | 752 | |
Accounting and security lending fees | 1,162 | |
Custodian fees and expenses | 1,238 | |
Independent trustees' compensation | 10 | |
Registration fees | 88 | |
Audit | 102 | |
Legal | 48 | |
Interest | 38 | |
Miscellaneous | 20 | |
Total expenses before reductions | 31,933 | |
Expense reductions | (1,487) | 30,446 |
Net investment income (loss) | | 6,181 |
Realized and Unrealized Gain (Loss) Net realized gain (loss) on: | | |
Investment securities: | | |
Unaffiliated issuers (net of foreign taxes of $427) | 461,328 | |
Other affiliated issuers | 367 | |
Foreign currency transactions | (494) | |
Total net realized gain (loss) | | 461,201 |
Change in net unrealized appreciation (depreciation) on: Investment securities (net of decrease in deferred foreign taxes of $314) | (42,284) | |
Assets and liabilities in foreign currencies | (54) | |
Total change in net unrealized appreciation (depreciation) | | (42,338) |
Net gain (loss) | | 418,863 |
Net increase (decrease) in net assets resulting from operations | | $ 425,044 |
Annual Report
See accompanying notes which are an integral part of the financial statements.
Financial Statements - continued
Statement of Changes in Net Assets
Amounts in thousands | Year ended
October 31,
2006 | Year ended
October 31,
2005 |
Increase (Decrease) in Net Assets | | |
Operations | | |
Net investment income (loss) | $ 6,181 | $ 10,862 |
Net realized gain (loss) | 461,201 | 242,238 |
Change in net unrealized appreciation (depreciation) | (42,338) | 169,248 |
Net increase (decrease) in net assets resulting
from operations | 425,044 | 422,348 |
Distributions to shareholders from net investment income | (10,829) | (3,406) |
Distributions to shareholders from net realized gain | (234,438) | (45,235) |
Total distributions | (245,267) | (48,641) |
Share transactions - net increase (decrease) | (456,221) | 701,403 |
Redemption fees | 565 | 1,213 |
Total increase (decrease) in net assets | (275,879) | 1,076,323 |
| | |
Net Assets | | |
Beginning of period | 2,212,360 | 1,136,037 |
End of period (including undistributed net investment income of $5,133 and undistributed net investment income of $10,862, respectively) | $ 1,936,481 | $ 2,212,360 |
Annual Report
See accompanying notes which are an integral part of the financial statements.
Financial Highlights - Class A
Years ended October 31, | 2006 | 2005 | 2004 | 2003 I |
Selected Per-Share Data | | | | |
Net asset value, beginning of period | $ 26.69 | $ 21.25 | $ 17.69 | $ 12.35 |
Income from Investment Operations | | | | |
Net investment income (loss) E | (.02) | .05 | .02 | .02 H |
Net realized and unrealized gain (loss) | 5.05 | 6.16 | 3.83 | 5.30 |
Total from investment operations | 5.03 | 6.21 | 3.85 | 5.32 |
Distributions from net investment income | (.05) | (.02) | (.02) | - |
Distributions from net realized gain | (2.89) | (.77) | (.31) | - |
Total distributions | (2.94) | (.79) | (.33) | - |
Redemption fees added to paid in capital E | .01 | .02 | .04 | .02 |
Net asset value, end of period | $ 28.79 | $ 26.69 | $ 21.25 | $ 17.71 |
Total Return B, C, D | 20.22% | 30.16% | 22.36% | 43.24% |
Ratios to Average Net Assets F, J | | | | |
Expenses before reductions | 1.64% | 1.66% | 1.71% | 1.77% A |
Expenses net of fee waivers, if any | 1.64% | 1.66% | 1.71% | 1.77% A |
Expenses net of all reductions | 1.58% | 1.63% | 1.69% | 1.74% A |
Net investment income (loss) | (.08)% | .21% | .09% | .28% A |
Supplemental Data | | | | |
Net assets, end of period (in millions) | $ 37 | $ 35 | $ 13 | $ 5 |
Portfolio turnover rate G | 84% | 79% | 77% | 84% A |
A Annualized
B Total returns for periods of less than one year are not annualized.
C Total returns would have been lower had certain expenses not been reduced during the periods shown.
D Total returns do not include the effect of the sales charges.
E Calculated based on average shares outstanding during the period.
F Fees and expenses of the underlying Fidelity Central Funds are not included in the Fund's expense ratio. The Fund indirectly bears its proportionate share of the expenses of any underlying Fidelity Central Funds.
G Amount does not include the portfolio activity of any underlying Fidelity Central Funds.
H Investment income per share reflects a special dividend which amounted to $.01 per share.
I For the period May 27, 2003 (commencement of sale of shares) to October 31, 2003.
J Expense ratios reflect operating expenses of the class. Expenses before reductions do not reflect amounts reimbursed by the investment adviser or reductions from brokerage service arrangements or other expense offset arrangements and do not represent the amount paid by the class during periods when reimbursements or reductions occur. Expense ratios before reductions for start-up periods may not be representative of longer-term operating periods. Expenses net of fee waivers reflect expenses after reimbursement by the investment adviser but prior to reductions from brokerage service arrangements or other expense offset arrangements. Expenses net of all reductions represent the net expenses paid by the class.
Annual Report
See accompanying notes which are an integral part of the financial statements.
Financial Highlights - Class T
Years ended October 31, | 2006 | 2005 | 2004 | 2003 I |
Selected Per-Share Data | | | | |
Net asset value, beginning of period | $ 26.57 | $ 21.20 | $ 17.68 | $ 12.35 |
Income from Investment Operations | | | | |
Net investment income (loss) E | (.09) | (.01) | (.03) | - H, K |
Net realized and unrealized gain (loss) | 5.03 | 6.12 | 3.83 | 5.31 |
Total from investment operations | 4.94 | 6.11 | 3.80 | 5.31 |
Distributions from net investment income | - | - | (.01) | - |
Distributions from net realized gain | (2.88) | (.76) | (.31) | - |
Total distributions | (2.88) | (.76) | (.32) | - |
Redemption fees added to paid in capital E | .01 | .02 | .04 | .02 |
Net asset value, end of period | $ 28.64 | $ 26.57 | $ 21.20 | $ 17.65 |
Total Return B, C, D | 19.93% | 29.72% | 22.07% | 43.16% |
Ratios to Average Net Assets F, J | | | | |
Expenses before reductions | 1.89% | 1.92% | 1.94% | 2.12% A |
Expenses net of fee waivers, if any | 1.89% | 1.91% | 1.94% | 2.12% A |
Expenses net of all reductions | 1.83% | 1.88% | 1.92% | 2.09% A |
Net investment income (loss) | (.32)% | (.04)% | (.14)% | (.07)% A |
Supplemental Data | | | | |
Net assets, end of period (in millions) | $ 42 | $ 42 | $ 15 | $ 4 |
Portfolio turnover rate G | 84% | 79% | 77% | 84% A |
A Annualized
B Total returns for periods of less than one year are not annualized.
C Total returns would have been lower had certain expenses not been reduced during the periods shown.
D Total returns do not include the effect of the sales charges.
E Calculated based on average shares outstanding during the period.
F Fees and expenses of the underlying Fidelity Central Funds are not included in the Fund's expense ratio. The Fund indirectly bears its proportionate share of the expenses of any underlying Fidelity Central Funds.
G Amount does not include the portfolio activity of any underlying Fidelity Central Funds.
H Investment income per share reflects a special dividend which amounted to $.01 per share.
I For the period May 27, 2003 (commencement of sale of shares) to October 31, 2003.
J Expense ratios reflect operating expenses of the class. Expenses before reductions do not reflect amounts reimbursed by the investment adviser or reductions from brokerage service arrangements or other expense offset arrangements and do not represent the amount paid by the class during periods when reimbursements or reductions occur. Expense ratios before reductions for start-up periods may not be representative of longer-term operating periods. Expenses net of fee waivers reflect expenses after reimbursement by the investment adviser but prior to reductions from brokerage service arrangements or other expense offset arrangements. Expenses net of all reductions represent the net expenses paid by the class.
K Amount represents less than $.01 per share.
Annual Report
See accompanying notes which are an integral part of the financial statements.
Financial Highlights - Class B
Years ended October 31, | 2006 | 2005 | 2004 | 2003 I |
Selected Per-Share Data | | | | |
Net asset value, beginning of period | $ 26.24 | $ 20.99 | $ 17.62 | $ 12.35 |
Income from Investment Operations | | | | |
Net investment income (loss) E | (.24) | (.14) | (.16) | (.05) H |
Net realized and unrealized gain (loss) | 4.98 | 6.08 | 3.80 | 5.30 |
Total from investment operations | 4.74 | 5.94 | 3.64 | 5.25 |
Distributions from net realized gain | (2.73) | (.71) | (.31) | - |
Redemption fees added to paid in capital E | .01 | .02 | .04 | .02 |
Net asset value, end of period | $ 28.26 | $ 26.24 | $ 20.99 | $ 17.52 |
Total Return B, C, D | 19.28% | 29.13% | 21.21% | 42.67% |
Ratios to Average Net Assets F, J | | | | |
Expenses before reductions | 2.48% | 2.49% | 2.63% | 2.76% A |
Expenses net of fee waivers, if any | 2.40% | 2.43% | 2.63% | 2.76% A |
Expenses net of all reductions | 2.34% | 2.40% | 2.60% | 2.73% A |
Net investment income (loss) | (.84)% | (.56)% | (.83)% | (.71)% A |
Supplemental Data | | | | |
Net assets, end of period (in millions) | $ 11 | $ 13 | $ 5 | $ 1 |
Portfolio turnover rate G | 84% | 79% | 77% | 84% A |
A Annualized
B Total returns for periods of less than one year are not annualized.
C Total returns would have been lower had certain expenses not been reduced during the periods shown.
D Total returns do not include the effect of the contingent deferred sales charge.
E Calculated based on average shares outstanding during the period.
F Fees and expenses of the underlying Fidelity Central Funds are not included in the Fund's expense ratio. The Fund indirectly bears its proportionate share of the expenses of any underlying Fidelity Central Funds.
G Amount does not include the portfolio activity of any underlying Fidelity Central Funds.
H Investment income per share reflects a special dividend which amounted to $.01 per share.
I For the period May 27, 2003 (commencement of sale of shares) to October 31, 2003.
J Expense ratios reflect operating expenses of the class. Expenses before reductions do not reflect amounts reimbursed by the investment adviser or reductions from brokerage service arrangements or other expense offset arrangements and do not represent the amount paid by the class during periods when reimbursements or reductions occur. Expense ratios before reductions for start-up periods may not be representative of longer-term operating periods. Expenses net of fee waivers reflect expenses after reimbursement by the investment adviser but prior to reductions from brokerage service arrangements or other expense offset arrangements. Expenses net of all reductions represent the net expenses paid by the class.
Annual Report
See accompanying notes which are an integral part of the financial statements.
Financial Highlights - Class C
Years ended October 31, | 2006 | 2005 | 2004 | 2003 I |
Selected Per-Share Data | | | | |
Net asset value, beginning of period | $ 26.31 | $ 21.04 | $ 17.64 | $ 12.35 |
Income from Investment Operations | | | | |
Net investment income (loss) E | (.23) | (.13) | (.12) | (.04) H |
Net realized and unrealized gain (loss) | 4.99 | 6.10 | 3.80 | 5.31 |
Total from investment operations | 4.76 | 5.97 | 3.68 | 5.27 |
Distributions from net investment income | - | - | (.01) | - |
Distributions from net realized gain | (2.75) | (.72) | (.31) | - |
Total distributions | (2.75) | (.72) | (.32) | - |
Redemption fees added to paid in capital E | .01 | .02 | .04 | .02 |
Net asset value, end of period | $ 28.33 | $ 26.31 | $ 21.04 | $ 17.64 |
Total Return B, C, D | 19.34% | 29.22% | 21.43% | 42.83% |
Ratios to Average Net Assets F, J | | | | |
Expenses before reductions | 2.38% | 2.41% | 2.43% | 2.57% A |
Expenses net of fee waivers, if any | 2.38% | 2.41% | 2.43% | 2.57% A |
Expenses net of all reductions | 2.32% | 2.38% | 2.40% | 2.55% A |
Net investment income (loss) | (.81)% | (.54)% | (.62)% | (.52)% A |
Supplemental Data | | | | |
Net assets, end of period (in millions) | $ 21 | $ 25 | $ 9 | $ 1 |
Portfolio turnover rate G | 84% | 79% | 77% | 84% A |
A Annualized
B Total returns for periods of less than one year are not annualized.
C Total returns would have been lower had certain expenses not been reduced during the periods shown.
D Total returns do not include the effect of the contingent deferred sales charge.
E Calculated based on average shares outstanding during the period.
F Fees and expenses of the underlying Fidelity Central Funds are not included in the Fund's expense ratio. The Fund indirectly bears its proportionate share of the expenses of any underlying Fidelity Central Funds.
G Amount does not include the portfolio activity of any underlying Fidelity Central Funds.
H Investment income per share reflects a special dividend which amounted to $.01 per share.
I For the period May 27, 2003 (commencement of sale of shares) to October 31, 2003.
J Expense ratios reflect operating expenses of the class. Expenses before reductions do not reflect amounts reimbursed by the investment adviser or reductions from brokerage service arrangements or other expense offset arrangements and do not represent the amount paid by the class during periods when reimbursements or reductions occur. Expense ratios before reductions for start-up periods may not be representative of longer-term operating periods. Expenses net of fee waivers reflect expenses after reimbursement by the investment adviser but prior to reductions from brokerage service arrangements or other expense offset arrangements. Expenses net of all reductions represent the net expenses paid by the class.
Annual Report
See accompanying notes which are an integral part of the financial statements.
Financial Highlights - International Small Cap
Years ended October 31, | 2006 | 2005 | 2004 | 2003 | 2002 H |
Selected Per-Share Data | | | | | |
Net asset value, beginning of period | $ 26.89 | $ 21.36 | $ 17.71 | $ 9.87 | $ 10.00 |
Income from Investment Operations | | | | | |
Net investment income (loss) D | .08 | .15 | .10 | .07 G | (.01) |
Net realized and unrealized gain (loss) | 5.08 | 6.19 | 3.84 | 7.75 | (.12) |
Total from investment operations | 5.16 | 6.34 | 3.94 | 7.82 | (.13) |
Distributions from net investment income | (.14) | (.06) | (.02) | - | - |
Distributions from net realized gain | (2.89) | (.77) | (.31) | (.02) | - |
Total distributions | (3.03) | (.83) | (.33) | (.02) | - |
Redemption fees added to
paid in capital D | .01 | .02 | .04 | .04 | - J |
Net asset value, end of period | $ 29.03 | $ 26.89 | $ 21.36 | $ 17.71 | $ 9.87 |
Total Return B, C | 20.65% | 30.67% | 22.84% | 79.78% | (1.30)% |
Ratios to Average Net Assets E, I | | | | |
Expenses before reductions | 1.28% | 1.28% | 1.30% | 1.54% | 13.70% A |
Expenses net of fee waivers, if any | 1.28% | 1.28% | 1.30% | 1.54% | 1.80% A |
Expenses net of all
reductions | 1.22% | 1.25% | 1.28% | 1.51% | 1.80% A |
Net investment income (loss) | .29% | .59% | .50% | .46% | (.56)% A |
Supplemental Data | | | | | |
Net assets, end of period
(in millions) | $ 1,816 | $ 2,090 | $ 1,091 | $ 547 | $ 3 |
Portfolio turnover rate F | 84% | 79% | 77% | 84% | 85% A |
A Annualized
B Total returns for periods of less than one year are not annualized.
C Total returns would have been lower had certain expenses not been reduced during the periods shown.
D Calculated based on average shares outstanding during the period.
E Fees and expenses of the underlying Fidelity Central Funds are not included in the Fund's expense ratio. The Fund indirectly bears its proportionate share of the expenses of any underlying Fidelity Central Funds.
F Amount does not include the portfolio activity of any underlying Fidelity Central Funds.
G Investment income per share reflects a special dividend which amounted to $.03 per share.
H For the period September 18, 2002 (commencement of operations) to October 31, 2002.
I Expense ratios reflect operating expenses of the class. Expenses before reductions do not reflect amounts reimbursed by the investment adviser or reductions from brokerage service arrangements or other expense offset arrangements and do not represent the amount paid by the class during periods when reimbursements or reductions occur. Expense ratios before reductions for start-up periods may not be representative of longer-term operating periods. Expenses net of fee waivers reflect expenses after reimbursement by the investment adviser but prior to reductions from brokerage service arrangements or other expense offset arrangements. Expenses net of all reductions represent the net expenses paid by the class.
J Amount represents less than $.01 per share.
Annual Report
See accompanying notes which are an integral part of the financial statements.
Financial Highlights - Institutional Class
Years ended October 31, | 2006 | 2005 | 2004 | 2003 H |
Selected Per-Share Data | | | | |
Net asset value, beginning of period | $ 26.86 | $ 21.36 | $ 17.72 | $ 12.35 |
Income from Investment Operations | | | | |
Net investment income (loss) D | .08 | .14 | .10 | .04 G |
Net realized and unrealized gain (loss) | 5.07 | 6.18 | 3.84 | 5.31 |
Total from investment operations | 5.15 | 6.32 | 3.94 | 5.35 |
Distributions from net investment income | (.14) | (.07) | (.03) | - |
Distributions from net realized gain | (2.89) | (.77) | (.31) | - |
Total distributions | (3.03) | (.84) | (.34) | - |
Redemption fees added to paid in capital D | .01 | .02 | .04 | .02 |
Net asset value, end of period | $ 28.99 | $ 26.86 | $ 21.36 | $ 17.72 |
Total Return B, C | 20.65% | 30.59% | 22.84% | 43.48% |
Ratios to Average Net Assets E, I | | | | |
Expenses before reductions | 1.29% | 1.30% | 1.32% | 1.51% A |
Expenses net of fee waivers, if any | 1.29% | 1.30% | 1.32% | 1.51% A |
Expenses net of all reductions | 1.23% | 1.27% | 1.29% | 1.48% A |
Net investment income (loss) | .28% | .57% | .49% | .54% A |
Supplemental Data | | | | |
Net assets, end of period (in millions) | $ 9 | $ 7 | $ 3 | $ .4 |
Portfolio turnover rate F | 84% | 79% | 77% | 84% A |
A Annualized
B Total returns for periods of less than one year are not annualized.
C Total returns would have been lower had certain expenses not been reduced during the periods shown.
D Calculated based on average shares outstanding during the period.
E Fees and expenses of the underlying Fidelity Central Funds are not included in the Fund's expense ratio. The Fund indirectly bears its proportionate share of the expenses of any underlying Fidelity Central Funds.
F Amount does not include the portfolio activity of any underlying Fidelity Central Funds.
G Investment income per share reflects a special dividend which amounted to $.01 per share.
H For the period May 27, 2003 (commencement of sale of shares) to October 31, 2003.
I Expense ratios reflect operating expenses of the class. Expenses before reductions do not reflect amounts reimbursed by the investment adviser or reductions from brokerage service arrangements or other expense offset arrangements and do not represent the amount paid by the class during periods when reimbursements or reductions occur. Expense ratios before reductions for start-up periods may not be representative of longer-term operating periods. Expenses net of fee waivers reflect expenses after reimbursement by the investment adviser but prior to reductions from brokerage service arrangements or other expense offset arrangements. Expenses net of all reductions represent the net expenses paid by the class.
Annual Report
See accompanying notes which are an integral part of the financial statements.
Notes to Financial Statements
For the period ended October 31, 2006
(Amounts in thousands except ratios)
1. Significant Accounting Policies.
Fidelity International Small Cap Fund (the Fund) is a fund of Fidelity Investment Trust (the trust) and is authorized to issue an unlimited number of shares. The trust is registered under the Investment Company Act of 1940, as amended (the 1940 Act), as an open-end management investment company organized as a Massachusetts business trust.
The Fund offers Class A, Class T, Class B, Class C, International Small Cap and Institutional Class shares, each of which has equal rights as to assets and voting privileges. Each class has exclusive voting rights with respect to matters that affect that class. Class B shares will automatically convert to Class A shares after a holding period of seven years from the initial date of purchase. Investment income, realized and unrealized capital gains and losses, the common expenses of the Fund, and certain fund-level expense reductions, if any, are allocated on a pro rata basis to each class based on the relative net assets of each class to the total net assets of the Fund. Each class differs with respect to transfer agent and distribution and service plan fees incurred. Certain expense reductions also differ by class.
The Fund may invest in Fidelity Central Funds which are open-end investment companies available to investment companies and other accounts managed by Fidelity Management & Research Company (FMR) and its affiliates. The financial statements have been prepared in conformity with accounting principles generally accepted in the United States of America, which require management to make certain estimates and assumptions at the date of the financial statements. The following summarizes the significant accounting policies of the Fund, which are also consistently followed by the Fidelity Central Funds:
Security Valuation. Investments are valued and net asset value (NAV) per share is calculated (NAV calculation) as of the close of business of the New York Stock Exchange (NYSE), normally 4:00 p.m. Eastern time. Wherever possible, the Fund uses independent pricing services approved by the Board of Trustees to value its investments.
Equity securities, including restricted securities, for which market quotations are readily available, are valued at the last reported sale price or official closing price as reported by an independent pricing service on the primary market or exchange on which they are traded. In the event there were no sales during the day or closing prices are not available, securities are valued at the last quoted bid price. Debt securities, including restricted securities, for which quotations are readily available, are valued by independent pricing services or by dealers who make markets in such securities. Pricing services consider yield or price of bonds of comparable quality, coupon, maturity and type as well as dealer supplied prices. Investments in open-end mutual funds, including the Fidelity Central Funds, are valued at their closing net asset value each business day. Short-term securities with remaining maturities of sixty days or less for which quotations are not readily available are valued at amortized cost, which approximates value.
Annual Report
Notes to Financial Statements - continued
(Amounts in thousands except ratios)
1. Significant Accounting Policies - continued
Security Valuation - continued
When current market prices or quotations are not readily available or do not accurately reflect fair value, valuations may be determined in accordance with procedures adopted by the Board of Trustees. For example, when developments occur between the close of a market and the close of the NYSE that may materially affect the value of some or all of the securities, or when trading in a security is halted, those securities may be fair valued. Factors used in the determination of fair value may include monitoring news to identify significant market or security specific events such as changes in the value of U.S. securities markets, reviewing developments in foreign markets and evaluating the performance of ADRs, futures contracts and exchange-traded funds. Because the Fund's utilization of fair value pricing depends on market activity, the frequency with which fair value pricing is used can not be predicted and may be utilized to a significant extent. The value of securities used for NAV calculation under fair value pricing may differ from published prices for the same securities.
Foreign Currency. The Fund uses foreign currency contracts to facilitate transactions in foreign-denominated securities. Losses from these transactions may arise from changes in the value of the foreign currency or if the counterparties do not perform under the contracts' terms.
Foreign-denominated assets, including investment securities, and liabilities are translated into U.S. dollars at the exchange rate at period end. Purchases and sales of investment securities, income and dividends received and expenses denominated in foreign currencies are translated into U.S. dollars at the exchange rate in effect on the transaction date.
The effects of exchange rate fluctuations on investments are included with the net realized and unrealized gain (loss) on investment securities. Other foreign currency transactions resulting in realized and unrealized gain (loss) are disclosed separately.
Investment Transactions and Income. Security transactions, including the Fund's investment activity in the Fidelity Central Funds, are accounted for as of trade date. Gains and losses on securities sold are determined on the basis of identified cost. Dividend income is recorded on the ex-dividend date, except for certain dividends from foreign securities where the ex-dividend date may have passed, which are recorded as soon as the Fund is informed of the ex-dividend date. Non-cash dividends included in dividend income, if any, are recorded at the fair market value of the securities received. Interest income and distributions from the Fidelity Central Funds are accrued as earned. Interest income includes coupon interest and amortization of premium and accretion of discount on debt securities. Investment income is recorded net of foreign taxes withheld where recovery of such taxes is uncertain.
Annual Report
1. Significant Accounting Policies - continued
Expenses. Most expenses of the trust can be directly attributed to a fund. Expenses which cannot be directly attributed are apportioned among each Fund in the trust. Expense estimates are accrued in the period to which they relate and adjustments are made when actual amounts are known.
Income Tax Information and Distributions to Shareholders. Each year, the Fund intends to qualify as a regulated investment company by distributing all of its taxable income and realized gains under Subchapter M of the Internal Revenue Code. As a result, no provision for income taxes is required in the accompanying financial statements. Foreign taxes are provided for based on the Fund's understanding of the tax rules and rates that exist in the foreign markets in which it invests.
Distributions are recorded on the ex-dividend date. Income dividends and capital gain distributions are declared separately for each class. Income and capital gain distributions are determined in accordance with income tax regulations, which may differ from generally accepted accounting principles. In addition, the Fund will claim a portion of the payment made to redeeming shareholders as a distribution for income tax purposes.
Capital accounts within the financial statements are adjusted for permanent book-tax differences. These adjustments have no impact on net assets or the results of operations. Temporary book-tax differences will reverse in a subsequent period.
Book-tax differences are primarily due to foreign currency transactions, passive foreign investment companies (PFIC) and losses deferred due to wash sales.
The tax-basis components of distributable earnings and the federal tax cost as of period end were as follows:
Unrealized appreciation | $ 444,995 | |
Unrealized depreciation | (177,521) | |
Net unrealized appreciation (depreciation) | 267,474 | |
Undistributed ordinary income | 43,513 | |
Undistributed long-term capital gain | 310,524 | |
| | |
Cost for federal income tax purposes | $ 1,773,829 | |
The tax character of distributions paid was as follows:
| October 31, 2006 | October 31, 2005 |
Ordinary Income | $ 66,631 | $ 30,409 |
Long-term Capital Gains | 178,636 | 18,232 |
Total | $ 245,267 | $ 48,641 |
Annual Report
Notes to Financial Statements - continued
(Amounts in thousands except ratios)
1. Significant Accounting Policies - continued
Short-Term Trading (Redemption) Fees. Shares held in the Fund less than 90 days are subject to a redemption fee equal to 2.00% of the proceeds of the redeemed shares. All redemption fees, including any estimated redemption fees paid by FMR, are retained by the Fund and accounted for as an addition to paid in capital.
New Accounting Pronouncements. In July 2006, Financial Accounting Standards Board Interpretation No. 48, Accounting for Uncertainty in Income Taxes - an interpretation of FASB Statement 109 (FIN 48), was issued and is effective for fiscal years beginning after December 15, 2006. FIN 48 sets forth a threshold for financial statement recognition, measurement and disclosure of a tax position taken or expected to be taken on a tax return. Management is currently evaluating the impact, if any, the adoption of FIN 48 will have on the Fund's net assets, results of operations and financial statement disclosures.
In addition, in September 2006, Statement of Financial Accounting Standards No. 157, Fair Value Measurements (SFAS 157), was issued and is effective for fiscal years beginning after November 15, 2007. SFAS 157 defines fair value, establishes a framework for measuring fair value and expands disclosures about fair value measurements. Management is currently evaluating the impact the adoption of SFAS 157 will have on the Fund's financial statement disclosures.
2. Operating Policies.
Repurchase Agreements. FMR has received an Exemptive Order from the Securities and Exchange Commission (the SEC) which permits the Fund and other affiliated entities of FMR to transfer uninvested cash balances into joint trading accounts which are then invested in repurchase agreements. The Fund may also invest directly with institutions in repurchase agreements. Repurchase agreements are collateralized by government or non-government securities. Upon settlement date, collateral is held in segregated accounts with custodian banks and may be obtained in the event of a default of the counterparty. The Fund monitors, on a daily basis, the value of the collateral to ensure it is at least equal to the principal amount of the repurchase agreement (including accrued interest). In the event of a default by the counterparty, realization of the collateral proceeds could be delayed, during which time the value of the collateral may decline.
Restricted Securities. The Fund may invest in securities that are subject to legal or contractual restrictions on resale. These securities generally may be resold in transactions exempt from registration or to the public if the securities are registered. Disposal of these securities may involve time-consuming negotiations and expense, and prompt sale at an acceptable price may be difficult. Information regarding restricted securities is included at the end of the Fund's Schedule of Investments.
Annual Report
3. Purchases and Sales of Investments.
Purchases and sales of securities, other than short-term securities, aggregated $1,999,351 and $2,719,149, respectively.
4. Fees and Other Transactions with Affiliates.
Management Fee. FMR and its affiliates provide the Fund with investment management related services for which the Fund pays a monthly management fee. The management fee is the sum of an individual fund fee rate that is based on an annual rate of .60% of the Fund's average net assets and a group fee rate that averaged .27% during the period. The group fee rate is based upon the average net assets of all the mutual funds advised by FMR. The group fee rate decreases as assets under management increase and increases as assets under management decrease. In addition, the management fee is subject to a performance adjustment (up to a maximum of ± .20% of the Fund's average net assets over a 36 month performance period). The upward or downward adjustment to the management fee is based on the investment performance of the asset-weighted return of the retail class of the Fund, International Small Cap, as compared to an appropriate benchmark index. For the period, the total annual management fee rate, including the performance adjustment, was .97% of the Fund's average net assets.
Distribution and Service Plan. In accordance with Rule 12b-1 of the 1940 Act, the Fund has adopted separate Distribution and Service Plans for each class of shares. Certain classes pay Fidelity Distributors Corporation (FDC), an affiliate of FMR, separate Distribution and Service Fees, each of which is based on an annual percentage of each class' average net assets. In addition, FDC may pay financial intermediaries for selling shares of the Fund and providing shareholder support services. For the period, the Distribution and Service Fee rates and the total amounts paid to and retained by FDC were as follows:
| Distribution
Fee | Service
Fee | Paid to
FDC | Retained
by FDC |
Class A | 0% | .25% | $ 99 | $ 2 |
Class T | .25% | .25% | 240 | - |
Class B | .75% | .25% | 137 | 103 |
Class C | .75% | .25% | 276 | 41 |
| | | $ 752 | $ 146 |
Annual Report
Notes to Financial Statements - continued
(Amounts in thousands except ratios)
4. Fees and Other Transactions with Affiliates - continued
Sales Load. FDC receives a front-end sales charge of up to 5.75% for selling Class A shares, and 3.50% for selling Class T shares, some of which is paid to financial intermediaries for selling shares of the Fund. FDC receives the proceeds of contingent deferred sales charges levied on Class A, Class T, Class B, and Class C redemptions. These charges depend on the holding period. The deferred sales charges range from 5% to 1% for Class B, 1% for Class C, 1.00% to .50% for certain purchases of Class A shares (.25% prior to February 24, 2006) and .25% for certain purchases of Class T shares.
For the period, sales charge amounts retained by FDC were as follows:
| Retained
by FDC |
Class A | $ 8 |
Class T | 6 |
Class B* | 42 |
Class C* | 2 |
| $ 58 |
* When Class B and Class C shares are initially sold, FDC pays commissions from its own resources to financial intermediaries through which the sales are made.
Transfer Agent Fees. Fidelity Investments Institutional Operations Company, Inc. (FIIOC), an affiliate of FMR, is the transfer, dividend disbursing and shareholder servicing agent for each class of the Fund, except for International Small Cap. Fidelity Service Company, Inc. (FSC), an affiliate of FMR, is the transfer agent for International Small Cap shares. FIIOC and FSC receive account fees and asset-based fees that vary according to the account size and type of account of the shareholders of the respective classes of the Fund. FIIOC and FSC pay for typesetting, printing and mailing of shareholder reports, except proxy statements. For the period, the total transfer agent fees paid by each class to FIIOC or FSC, were as follows:
| Amount | % of
Average
Net Assets |
Class A | $ 124 | .31 |
Class T | 148 | .31 |
Class B | 55 | .40 |
Class C | 82 | .30 |
International Small Cap | 4,500 | .20 |
Institutional Class | 20 | .21 |
| $ 4,929 | |
Accounting and Security Lending Fees. FSC maintains the Fund's accounting records. The accounting fee is based on the level of average net assets for the month. Under a separate contract, FSC administers the security lending program. The security lending fee is based on the number and duration of lending transactions.
Annual Report
4. Fees and Other Transactions with Affiliates - continued
Investments in Fidelity Central Funds. The Fund may invest in Fidelity Central Funds. The Fund's Schedule of Investments lists each of the Fidelity Central Funds as an investment of the Fund but does not include the underlying holdings of each Fidelity Central Fund. As an Investing Fund, the Fund indirectly bears its proportionate share of the expenses of the underlying Fidelity Central Funds. A complete unaudited list of holdings for each Fidelity Central Fund is available upon request. In addition, the financial statements of the Fidelity Central Funds, which are not covered by the Fund's Report of Independent Registered Public Accounting Firm, are available on the EDGAR Database on the SEC's web site, www.sec.gov, or upon request.
The Money Market Central Funds seek preservation of capital and current income and are managed by Fidelity Investments Money Management, Inc. (FIMM), an affiliate of FMR.
Interfund Lending Program. Pursuant to an Exemptive Order issued by the SEC, the Fund, along with other registered investment companies having management contracts with FMR, may participate in an interfund lending program. This program provides an alternative credit facility allowing the Funds to borrow from, or lend money to, other participating affiliated funds. At period end, there were no interfund loans outstanding. The Fund's activity in this program during the period for which loans were outstanding was as follows:
Borrower or Lender | Average Daily
Loan Balance | Weighted Average
Interest Rate | Interest
Expense |
Borrower | $ 23,977 | 5.14% | $ 38 |
5. Committed Line of Credit.
The Fund participates with other funds managed by FMR in a $4.2 billion credit facility (the "line of credit") to be utilized for temporary or emergency purposes to fund shareholder redemptions or for other short-term liquidity purposes. The Fund has agreed to pay commitment fees on its pro rata portion of the line of credit, which amounts to $7 and is reflected in Miscellaneous Expense on the Statement of Operations. During the period, there were no borrowings on this line of credit.
6. Security Lending.
The Fund lends portfolio securities from time to time in order to earn additional income. On the settlement date of the loan, the Fund receives collateral (in the form of U.S. Treasury obligations, letters of credit and/or cash) against the loaned securities and maintains collateral in an amount not less than 100% of the market value of the loaned securities during the period of the loan. The market value of the loaned securities is determined at the close of business of the Fund and any additional required collateral is delivered to the Fund on the next business day. If the borrower defaults on its obligation to
Annual Report
Notes to Financial Statements - continued
(Amounts in thousands except ratios)
6. Security Lending - continued
return the securities loaned because of insolvency or other reasons, a fund could experience delays and costs in recovering the securities loaned or in gaining access to the collateral. Any cash collateral received is invested in the Fidelity Securities Lending Cash Central Fund. The value of loaned securities and cash collateral at period end are disclosed on the Fund's Statement of Assets and Liabilities. Security lending income represents the income earned on investing cash collateral, less fees and expenses associated with the loan, plus any premium payments that may be received on the loan of certain types of securities. Security lending income is presented in the Statement of Operations as a component of income from Fidelity Central Funds.
7. Expense Reductions.
FMR voluntarily agreed to reimburse each class to the extent annual operating expenses exceeded certain levels of average net assets as noted in the table below. Some expenses, for example interest expense, including commitment fees, are excluded from this reimbursement.
The following classes were in reimbursement during the period:
| Expense
Limitations | Reimbursement
from adviser |
Class B | 2.40% | $ 10 |
Many of the brokers with whom FMR places trades on behalf of the Fund provided services to the Fund in addition to trade execution. These services included payments of certain expenses on behalf of the Fund totaling $1,455 for the period. During the period, credits reduced each class' transfer agent expense as noted in the table below.
| Transfer Agent
expense reduction |
International Small Cap | $ 22 |
8. Other.
The Fund's organizational documents provide former and current trustees and officers with a limited indemnification against liabilities arising in connection with the performance of their duties to the Fund. In the normal course of business, the Fund may also enter into contracts that provide general indemnifications. The Fund's maximum exposure under these arrangements is unknown as this would be dependent on future claims that may be made against the Fund. The risk of material loss from such claims is considered remote.
During the period, the Fund's transfer agent, Fidelity Investments Institutional Operations Company, Inc. (FIIOC), an affiliate of Fidelity Management & Research Company, notified
Annual Report
8. Other - continued
the Fund that the fund's books and records did not reflect a conversion of certain Class B to Class A shares upon their conversion date. Management has determined that this did not have a material impact to the Fund's reported net assets or results of operations in the accompanying financial statements. FIIOC will cause the books and records of the Fund to reflect a conversion of the relevant Class B shares to Class A and is in the process of determining the impact to affected shareholder accounts for purposes of its remediation.
The United States Securities and Exchange Commission ("SEC") is conducting an investigation of FMR (covering the years 2002 to 2004) arising from gifts, gratuities and business entertainment provided by certain brokers to certain individuals who were employed on FMR's domestic equity trading desk during that period. FMR is in discussions with the SEC staff regarding the possible resolution of the matter, but as of period-end no final resolution has been reached.
In December 2006, the Independent Trustees completed their own investigation of the matter with the assistance of independent counsel. The Independent Trustees and FMR agree that, despite the absence of proof that the Fidelity mutual funds experienced diminished execution quality as a result of the improper receipt of gifts and business entertainment, the conduct at issue was serious and is worthy of redress. Accordingly, the Independent Trustees have requested and FMR has agreed to pay $42 million to Fidelity mutual funds, plus interest to be determined at the time that payment is made. A method of allocating this payment among the funds has not yet been determined. In addition, FMR has agreed to reimburse related legal expenses. The total payment to the Fund is not anticipated to have a material impact on the Fund's net assets.
9. Distributions to Shareholders.
Distributions to shareholders of each class were as follows:
Years ended October 31, | 2006 | 2005 |
From net investment income | | |
Class A | $ 62 | $ 14 |
International Small Cap | 10,726 | 3,381 |
Institutional Class | 41 | 11 |
Total | $ 10,829 | $ 3,406 |
From net realized gain | | |
Class A | $ 3,713 | $ 542 |
Class T | 4,531 | 602 |
Class B | 1,339 | 221 |
Class C | 2,560 | 359 |
International Small Cap | 221,459 | 43,388 |
Institutional Class | 836 | 123 |
Total | $ 234,438 | $ 45,235 |
Annual Report
Notes to Financial Statements - continued
(Amounts in thousands except ratios)
10. Share Transactions.
Transactions for each class of shares were as follows:
| Shares | Dollars |
Years ended | 2006 | 2005 | 2006 | 2005 |
Class A | | | | |
Shares sold | 335 | 915 | $ 9,788 | $ 22,252 |
Reinvestment of distributions | 125 | 20 | 3,194 | 427 |
Shares redeemed | (490) | (255) | (14,008) | (6,421) |
Net increase (decrease) | (30) | 680 | $ (1,026) | $ 16,258 |
| | | | |
Class T | | | | |
Shares sold | 413 | 1,286 | $ 11,877 | $ 31,179 |
Reinvestment of distributions | 165 | 24 | 4,209 | 531 |
Shares redeemed | (679) | (457) | (19,325) | (11,453) |
Net increase (decrease) | (101) | 853 | $ (3,239) | $ 20,257 |
| | | | |
Class B | | | | |
Shares sold | 69 | 415 | $ 1,926 | $ 9,882 |
Reinvestment of distributions | 48 | 9 | 1,211 | 199 |
Shares redeemed | (202) | (178) | (5,665) | (4,336) |
Net increase (decrease) | (85) | 246 | $ (2,528) | $ 5,745 |
| | | | |
Class C | | | | |
Shares sold | 146 | 680 | $ 4,106 | $ 16,301 |
Reinvestment of distributions | 80 | 13 | 2,033 | 272 |
Shares redeemed | (431) | (147) | (11,929) | (3,591) |
Net increase (decrease) | (205) | 546 | $ (5,790) | $ 12,982 |
| | | | |
International Small Cap | | | | |
Shares sold | 17,580 | 51,579 | $ 512,574 | $ 1,266,283 |
Reinvestment of distributions | 8,379 | 2,008 | 216,010 | 43,867 |
Shares redeemed | (41,151) | (26,924) | (1,173,251) | (667,826) |
Net increase (decrease) | (15,192) | 26,663 | $ (444,667) | $ 642,324 |
| | | | |
Institutional Class | | | | |
Shares sold | 124 | 259 | $ 3,656 | $ 6,323 |
Reinvestment of distributions | 20 | 3 | 506 | 59 |
Shares redeemed | (109) | (105) | (3,132) | (2,545) |
Net increase (decrease) | 35 | 157 | $ 1,030 | $ 3,837 |
Annual Report
Report of Independent Registered Public Accounting Firm
To the Trustees of Fidelity Investment Trust and Shareholders of Fidelity International Small Cap Fund:
We have audited the accompanying statement of assets and liabilities of Fidelity International Small Cap Fund (the Fund), a fund of Fidelity Investment Trust, including the schedule of investments, as of October 31, 2006, and the related statement of operations for the year then ended, the statement of changes in net assets for each of the two years in the period then ended, and the financial highlights for each of the five years in the period then ended. These financial statements and financial highlights are the responsibility of the Fund's management. Our responsibility is to express an opinion on these financial statements and financial highlights based on our audits.
We conducted our audits in accordance with standards of the Public Company Accounting Oversight Board (United States). Those standards require that we plan and perform the audit to obtain reasonable assurance about whether the financial statements and financial highlights are free of material misstatement. The Fund is not required to have, nor were we engaged to perform, an audit of its internal control over financial reporting. Our audits included consideration of internal control over financial reporting as a basis for designing audit procedures that are appropriate in the circumstances, but not for the purpose of expressing an opinion on the effectiveness of the Fund's internal control over financial reporting. Accordingly, we express no such opinion. An audit also includes examining, on a test basis, evidence supporting the amounts and disclosures in the financial statements, assessing the accounting principles used and significant estimates made by management, as well as evaluating the overall financial statement presentation. Our procedures included confirmation of securities owned as of October 31, 2006, by correspondence with the custodians and brokers; where replies were not received from brokers, we performed other auditing procedures. We believe that our audits provide a reasonable basis for our opinion.
In our opinion, the financial statements and financial highlights referred to above present fairly, in all material respects, the financial position of Fidelity International Small Cap Fund as of October 31, 2006, the results of its operations for the year then ended, the changes in its net assets for each of the two years in the period then ended, and its financial highlights for each of the five years in the period then ended, in conformity with accounting principles generally accepted in the United States of America.
/s/DELOITTE & TOUCHE LLP
DELOITTE & TOUCHE LLP
Boston, Massachusetts
December 22, 2006
Annual Report
Trustees and Officers
The Trustees, Members of the Advisory Board, and executive officers of the trust and fund, as applicable, are listed below. The Board of Trustees governs the fund and is responsible for protecting the interests of shareholders. The Trustees are experienced executives who meet periodically throughout the year to oversee the fund's activities, review contractual arrangements with companies that provide services to the fund, and review the fund's performance. Except for William O. McCoy, each of the Trustees oversees 347 funds advised by FMR or an affiliate. Mr. McCoy oversees 349 funds advised by FMR or an affiliate.
The Trustees hold office without limit in time except that (a) any Trustee may resign; (b) any Trustee may be removed by written instrument, signed by at least two-thirds of the number of Trustees prior to such removal; (c) any Trustee who requests to be retired or who has become incapacitated by illness or injury may be retired by written instrument signed by a majority of the other Trustees; and (d) any Trustee may be removed at any special meeting of shareholders by a two-thirds vote of the outstanding voting securities of the trust. Each Trustee who is not an interested person (as defined in the 1940 Act) (Independent Trustee), shall retire not later than the last day of the calendar year in which his or her 72nd birthday occurs. The Independent Trustees may waive this mandatory retirement age policy with respect to individual Trustees. The executive officers and Advisory Board Members hold office without limit in time, except that any officer and Advisory Board Member may resign or may be removed by a vote of a majority of the Trustees at any regular meeting or any special meeting of the Trustees. Except as indicated, each individual has held the office shown or other offices in the same company for the past five years.
The fund's Statement of Additional Information (SAI) includes more information about the Trustees. To request a free copy, call Fidelity at 1-877-208-0098.
Interested Trustees*: Correspondence intended for each Trustee who is an interested person may be sent to Fidelity Investments, 82 Devonshire Street, Boston, Massachusetts 02109.
Name, Age; Principal Occupation |
Edward C. Johnson 3d (76) |
| Year of Election or Appointment: 1984
Mr. Johnson is Chairman of the Board of Trustees. Mr. Johnson serves as President (2006-present), Chief Executive Officer, Chairman, and a Director of FMR Corp.; Chairman and a Director of FMR; Chairman and a Director of Fidelity Research & Analysis Company (FRAC); Chairman and a Director of Fidelity Investments Money Management, Inc.; and Chairman (2001-present) and a Director of FMR Co., Inc. In addition, Mr. Johnson serves as Chairman and Director of Fidelity International Limited (FIL). |
Stephen P. Jonas (53) |
| Year of Election or Appointment: 2005
Mr. Jonas is Senior Vice President of the fund (2005-present). He also serves as Senior Vice President of other Fidelity funds (2005-present). Mr. Jonas is Executive Director of FMR (2005-present) and FMR Co., Inc. (2005-present). He also serves as a Director of Fidelity Investments Money Management, Inc. (2005-present) and FMR Corp. (2003-present). Previously, Mr. Jonas served as President of Fidelity Enterprise Operations and Risk Services (2004-2005), Chief Administrative Officer (2002-2004), and Chief Financial Officer of FMR Corp. (1998-2002). In addition, he serves on the Boards of Boston Ballet (2003-present) and Simmons College (2003-present). |
Robert L. Reynolds (54) |
| Year of Election or Appointment: 2003
Mr. Reynolds is President and a Director of FMR (2005-present), Fidelity Investments Money Management, Inc. (2005-present), and FMR Co., Inc. (2005-present). Mr. Reynolds also serves as Vice Chairman (2006-present), a Director (2003-present), and Chief Operating Officer of FMR Corp. and a Director of Strategic Advisers, Inc. (2005-present). He also serves on the Board at Fidelity Investments Canada, Ltd. |
* Trustees have been determined to be "Interested Trustees" by virtue of, among other things, their affiliation with the trust or various entities under common control with FMR.
Annual Report
Independent Trustees:
Correspondence intended for each Independent Trustee (that is, the Trustees other than the Interested Trustees) may be sent to Fidelity Investments, P.O. Box 55235, Boston, Massachusetts 02205-5235.
Name, Age; Principal Occupation |
Dennis J. Dirks (58) |
| Year of Election or Appointment: 2005 Prior to his retirement in May 2003, Mr. Dirks was Chief Operating Officer and a member of the Board of The Depository Trust & Clearing Corporation (DTCC) (1999-2003). He also served as President, Chief Operating Officer, and Board member of The Depository Trust Company (DTC) (1999-2003) and President and Board member of the National Securities Clearing Corporation (NSCC) (1999-2003). In addition, Mr. Dirks served as Chief Executive Officer and Board member of the Government Securities Clearing Corporation (2001-2003) and Chief Executive Officer and Board member of the Mortgage-Backed Securities Clearing Corporation (2001-2003). Mr. Dirks also serves as a Trustee and a member of the Finance Committee of Manhattan College (2005-present) and a Trustee and a member of the Finance Committee of AHRC of Nassau County (2006-present). |
Albert R. Gamper, Jr. (64) |
| Year of Election or Appointment: 2006 Prior to his retirement in December 2004, Mr. Gamper served as Chairman of the Board of CIT Group Inc. (commercial finance). During his tenure with CIT Group Inc. Mr. Gamper served in numerous senior management positions, including Chairman (1987-1989; 1999-2001; 2002-2004), Chief Executive Officer (1987-2004), and President (1989-2002). He currently serves as a member of the Board of Directors of Public Service Enterprise Group (utilities, 2001-present), Chairman of the Board of Governors, Rutgers University (2004-present), and Chairman of the Board of Saint Barnabas Health Care System. |
George H. Heilmeier (70) |
| Year of Election or Appointment: 2004
Dr. Heilmeier is Chairman Emeritus of Telcordia Technologies (communication software and systems), where prior to his retirement, he served as company Chairman and Chief Executive Officer. He currently serves on the Boards of Directors of The Mitre Corporation (systems engineering and information technology support for the government), and HRL Laboratories (private research and development, 2004-present). He is Chairman of the General Motors Science & Technology Advisory Board and a Life Fellow of the Institute of Electrical and Electronics Engineers (IEEE). Dr. Heilmeier is a member of the Defense Science Board and the National Security Agency Advisory Board. He is also a member of the National Academy of Engineering, the American Academy of Arts and Sciences, and the Board of Overseers of the School of Engineering and Applied Science of the University of Pennsylvania. Previously, Dr. Heilmeier served as a Director of TRW Inc. (automotive, space, defense, and information technology, 1992-2002), Compaq (1994-2002), Automatic Data Processing, Inc. (ADP) (technology-based business outsourcing, 1995-2002), INET Technologies Inc. (telecommunications network surveillance, 2001-2004), and Teletech Holdings (customer management services). He is the recipient of the 2005 Kyoto Prize in Advanced Technology for his invention of the liquid crystal display, and a member of the Consumer Electronics Hall of Fame. |
Marie L. Knowles (60) |
| Year of Election or Appointment: 2001
Prior to Ms. Knowles' retirement in June 2000, she served as Executive Vice President and Chief Financial Officer of Atlantic Richfield Company (ARCO) (diversified energy, 1996-2000). From 1993 to 1996, she was a Senior Vice President of ARCO and President of ARCO Transportation Company. She served as a Director of ARCO from 1996 to 1998. She currently serves as a Director of Phelps Dodge Corporation (copper mining and manufacturing) and McKesson Corporation (healthcare service, 2002-present). Ms. Knowles is a Trustee of the Brookings Institution and the Catalina Island Conservancy and also serves as a member of the Advisory Board for the School of Engineering of the University of Southern California. |
Ned C. Lautenbach (62) |
| Year of Election or Appointment: 2000
Mr. Lautenbach is Chairman of the Independent Trustees (2006-present). Mr. Lautenbach has been a partner of Clayton, Dubilier & Rice, Inc. (private equity investment firm) since September 1998. Previously, Mr. Lautenbach was with the International Business Machines Corporation (IBM) from 1968 until his retirement in 1998. Mr. Lautenbach serves as a Director of Sony Corporation (2006- present) and Eaton Corporation (diversified industrial) as well as the Philharmonic Center for the Arts in Naples, Florida. He also is a member of the Board of Trustees of Fairfield University (2005-present), as well as a member of the Council on Foreign Relations. |
William O. McCoy (73) |
| Year of Election or Appointment: 1997
Prior to his retirement in December 1994, Mr. McCoy was Vice Chairman of the Board of BellSouth Corporation (telecommunications) and President of BellSouth Enterprises. He is currently a Director of Duke Realty Corporation (real estate). He is also a partner of Franklin Street Partners (private investment management firm). In addition, Mr. McCoy served as the Interim Chancellor (1999-2000) and a member of the Board of Visitors for the University of North Carolina at Chapel Hill and currently serves as Chairman of the Board of Directors of the University of North Carolina Health Care System. He also served as Vice President of Finance for the University of North Carolina (16-school system). |
Cornelia M. Small (62) |
| Year of Election or Appointment: 2005
Ms. Small is a member (2000-present) and Chairperson (2002-present) of the Investment Committee, and a member (2002-present) of the Board of Trustees of Smith College. Previously, she served as Chief Investment Officer (1999-2000), Director of Global Equity Investments (1996-1999), and a member of the Board of Directors of Scudder, Stevens & Clark (1990-1997) and Scudder Kemper Investments (1997-1999). In addition, Ms. Small served as Co-Chair (2000-2003) of the Annual Fund for the Fletcher School of Law and Diplomacy. |
William S. Stavropoulos (67) |
| Year of Election or Appointment: 2001
Mr. Stavropoulos is Chairman Emeritus of the Board of Directors of The Dow Chemical Company. Since joining The Dow Chemical Company in 1967, Mr. Stavropoulos served in numerous senior management positions, including President (1993-2000; 2002-2003), CEO (1995-2000; 2002-2004), and Chairman of the Executive Committee (2000-2004). Currently, he is a Director of NCR Corporation (data warehousing and technology solutions), BellSouth Corporation (telecommunications), Chemical Financial Corporation, Maersk Inc. (industrial conglomerate, 2002-present), and Metalmark Capital (private equity investment firm, 2005-present). He also serves as a member of the Board of Trustees of the American Enterprise Institute for Public Policy Research. In addition, Mr. Stavropoulos is a member of The Business Council, J.P. Morgan International Council and the University of Notre Dame Advisory Council for the College of Science. |
Kenneth L. Wolfe (67) |
| Year of Election or Appointment: 2005
Prior to his retirement in 2001, Mr. Wolfe was Chairman and Chief Executive Officer of Hershey Foods Corporation (1993-2001). He currently serves as a member of the boards of Adelphia Communications Corporation (2003-present), Bausch & Lomb, Inc., and Revlon Inc. (2004-present). |
Annual Report
Advisory Board Members and Executive Officers:
Correspondence intended for Mr. Keyes may be sent to Fidelity Investments, P.O. Box 55235, Boston, Massachusetts 02205-5235. Correspondence intended for each executive officer and Mr. Lynch may be sent to Fidelity Investments, 82 Devonshire Street, Boston, Massachusetts 02109.
Name, Age; Principal Occupation |
James H. Keyes (66) |
| Year of Election or Appointment: 2006
Member of the Advisory Board of Fidelity Investment Trust. Prior to his retirement in 2003, Mr. Keyes was Chairman, President, and Chief Executive Officer of Johnson Controls, Inc. (automotive supplier, 1993-2003). He currently serves as a member of the boards of LSI Logic Corporation (semiconductor technologies), Navistar International Corporation (manufacture and sale of trucks, buses, and diesel engines, 2002-present), and Pitney Bowes, Inc. (integrated mail, messaging, and document management solutions). |
Peter S. Lynch (62) |
| Year of Election or Appointment: 2003
Member of the Advisory Board of Fidelity Investment Trust. Mr. Lynch is Vice Chairman and a Director of FMR, and Vice Chairman (2001- present) and a Director of FMR Co., Inc. Previously, Mr. Lynch served as a Trustee of the Fidelity funds (1990-2003). In addition, he serves as a Trustee of Boston College and as the Chairman of the Inner-City Scholarship Fund. |
Dwight D. Churchill (52) |
| Year of Election or Appointment: 2005
Vice President of the fund. Mr. Churchill also serves as Vice President of certain Equity Funds (2005-present). Mr. Churchill is Executive Vice President of FMR (2005-present) and FMR Co., Inc. (2005-present). Previously, Mr. Churchill served as Senior Vice President of Fidelity Investments Money Management, Inc. (2005-2006), Head of Fidelity's Fixed-Income Division (2000-2005), Vice President of Fidelity's Money Market Funds (2000-2005), Vice President of Fidelity's Bond Funds, and Senior Vice President of FMR. |
Eric M. Wetlaufer (44) |
| Year of Election or Appointment: 2006
Vice President of the fund. Mr. Wetlaufer also serves as Vice President of certain International Equity Funds (2006-present). Mr. Wetlaufer is Senior Vice President of FMR (2006-present) and FMR Co., Inc. (2006-present), and President and Director of Fidelity Management & Research (U.K.) Inc. (2006-present) and Fidelity Research & Analysis Company (2006-present). Before joining Fidelity Investments in 2005, Mr. Wetlaufer was a partner in Oxhead Capital Management (2004-2005). Previously, Mr. Wetlaufer served as a Chief Investment Officer of Putnam Investments (1997-2003). |
Ben Paton (45) |
| Year of Election or Appointment: 2004 Vice President of International Small Cap. Mr. Paton serves as Vice President of another fund advised by FMR. Prior to his current responsibilities, Mr. Paton worked as a research analyst and manager. |
Tokuya Sano (35) |
| Year of Election or Appointment: 2002 Vice President of International Small Cap. Mr. Sano serves as Vice President of another fund advised by FMR. Prior to his current responsibilities, Mr. Sano worked as a research analyst and manager. |
Wilson Wong (33) |
| Year of Election or Appointment: 2005 Vice President of International Small Cap. Mr. Wong serves as Vice President of another fund advised by FMR. Prior to his current responsibilities, Mr. Wong worked as a research analyst and manager. |
Eric D. Roiter (57) |
| Year of Election or Appointment: 2002 Secretary of the fund. He also serves as Secretary of other Fidelity funds; Vice President, General Counsel, and Secretary of FMR Co., Inc. (2001-present) and FMR; Assistant Secretary of Fidelity Management & Research (U.K.) Inc. (2001-present), Fidelity Research & Analysis Company (2001-present), and Fidelity Investments Money Management, Inc. (2001-present). Mr. Roiter is an Adjunct Member, Faculty of Law, at Boston College Law School (2003-present). Previously, Mr. Roiter served as Vice President and Secretary of Fidelity Distributors Corporation (FDC)(1998-2005). |
Stuart Fross (47) |
| Year of Election or Appointment: 2003 Assistant Secretary of the fund. Mr. Fross also serves as Assistant Secretary of other Fidelity funds (2003-present), Vice President and Secretary of FDC (2005-present), and is an employee of FMR. |
Christine Reynolds (48) |
| Year of Election or Appointment: 2004 President and Treasurer of the fund. Ms. Reynolds also serves as President and Treasurer of other Fidelity funds (2004-present) and is a Vice President (2003-present) and an employee (2002-present) of FMR. Before joining Fidelity Investments, Ms. Reynolds worked at PricewaterhouseCoopers LLP (PwC) (1980-2002), where she was most recently an audit partner with PwC's investment management practice. |
R. Stephen Ganis (40) |
| Year of Election or Appointment: 2006
Anti-Money Laundering (AML) officer of the fund. Mr. Ganis also serves as AML officer of other Fidelity funds (2006-present) and FMR Corp. (2003-present). Before joining Fidelity Investments, Mr. Ganis practiced law at Goodwin Procter, LLP (2000-2002). |
Joseph B. Hollis (58) |
| Year of Election or Appointment: 2006
Chief Financial Officer of the fund. Mr. Hollis also serves as Chief Financial Officer of other Fidelity funds. Mr. Hollis is President of Fidelity Pricing and Cash Management Services (FPCMS) (2005-present). Mr. Hollis also serves as President and Director of Fidelity Service Company, Inc. (2006-present). Previously, Mr. Hollis served as Senior Vice President of Cash Management Services (1999-2002) and Investment Management Operations (2002-2005). |
Kenneth A. Rathgeber (59) |
| Year of Election or Appointment: 2004
Chief Compliance Officer of the fund. Mr. Rathgeber also serves as Chief Compliance Officer of other Fidelity funds (2004-present) and Executive Vice President of Risk Oversight for Fidelity Investments (2002-present). He is Chief Compliance Officer of FMR (2005-present), FMR Co., Inc. (2005-present), Fidelity Management & Research (U.K.) Inc. (2005-present), Fidelity Research & Analysis Company (2005- present), Fidelity Investments Money Management, Inc. (2005-present), and Strategic Advisers, Inc. (2005-present). Previously, Mr. Rathgeber served as Executive Vice President and Chief Operating Officer for Fidelity Investments Institutional Services Company, Inc. (1998-2002). |
Name, Age; Principal Occupation |
Bryan A. Mehrmann (45) |
| Year of Election or Appointment: 2005
Deputy Treasurer of the fund. Mr. Mehrmann also serves as Deputy Treasurer of other Fidelity funds (2005-present) and is an employee of FMR. Previously, Mr. Mehrmann served as Vice President of Fidelity Investments Institutional Services Group (FIIS)/Fidelity Investments Institutional Operations Corporation, Inc. (FIIOC) Client Services (1998-2004). |
Kimberley H. Monasterio (42) |
| Year of Election or Appointment: 2004
Deputy Treasurer of the fund. Ms. Monasterio also serves as Deputy Treasurer of other Fidelity funds (2004) and is an employee of FMR (2004). Before joining Fidelity Investments, Ms. Monasterio served as Treasurer (2000-2004) and Chief Financial Officer (2002-2004) of the Franklin Templeton Funds and Senior Vice President of Franklin Templeton Services, LLC (2000-2004). |
Kenneth B. Robins (37) |
| Year of Election or Appointment: 2005
Deputy Treasurer of the fund. Mr. Robins also serves as Deputy Treasurer of other Fidelity funds (2005-present) and is an employee of FMR (2004-present). Before joining Fidelity Investments, Mr. Robins worked at KPMG LLP, where he was a partner in KPMG's department of professional practice (2002-2004) and a Senior Manager (1999-2000). In addition, Mr. Robins served as Assistant Chief Accountant, United States Securities and Exchange Commission (2000-2002). |
Robert G. Byrnes (39) |
| Year of Election or Appointment: 2005 Assistant Treasurer of the fund. Mr. Byrnes also serves as Assistant Treasurer of other Fidelity funds (2005-present) and is an employee of FMR (2005-present). Previously, Mr. Byrnes served as Vice President of FPCMS (2003-2005). Before joining Fidelity Investments, Mr. Byrnes worked at Deutsche Asset Management where he served as Vice President of the Investment Operations Group (2000-2003). |
John H. Costello (60) |
| Year of Election or Appointment: 2002
Assistant Treasurer of the fund. Mr. Costello also serves as Assistant Treasurer of other Fidelity funds and is an employee of FMR. |
Peter L. Lydecker (52) |
| Year of Election or Appointment: 2004
Assistant Treasurer of the fund. Mr. Lydecker also serves as Assistant Treasurer of other Fidelity funds (2004) and is an employee of FMR. |
Mark Osterheld (51) |
| Year of Election or Appointment: 2004
Assistant Treasurer of the fund. Mr. Osterheld also serves as Assistant Treasurer of other Fidelity funds (2002) and is an employee of FMR. |
Gary W. Ryan (48) |
| Year of Election or Appointment: 2005
Assistant Treasurer of the fund. Mr. Ryan also serves as Assistant Treasurer of other Fidelity funds (2005-present) and is an employee of FMR (2005-present). Previously, Mr. Ryan served as Vice President of Fund Reporting in FPCMS (1999-2005). |
Salvatore Schiavone (40) |
| Year of Election or Appointment: 2005
Assistant Treasurer of the fund. Mr. Schiavone also serves as Assistant Treasurer of other Fidelity funds (2005-present) and is an employee of FMR (2005-present). Before joining Fidelity Investments, Mr. Schiavone worked at Deutsche Asset Management, where he most recently served as Assistant Treasurer (2003-2005) of the Scudder Funds and Vice President and Head of Fund Reporting (1996-2003). |
Annual Report
Distributions
The Board of Trustees of Advisor International Small Cap Fund voted to pay to shareholders of record at the opening of business on record date, the following distributions per share derived from capital gains realized from sales of portfolio securities, and dividends derived from net investment income:
| Pay Date | Record Date | Dividends | Capital Gains |
Class A | 12/11/06 | 12/08/06 | $0.00 | $5.650 |
Class T | 12/11/06 | 12/08/06 | $0.00 | $5.568 |
Class B | 12/11/06 | 12/08/06 | $0.00 | $5.413 |
Class C | 12/11/06 | 12/08/06 | $0.00 | $5.387 |
The fund hereby designates as a capital gain dividend with respect to the taxable year ended October 31, 2006, $310,524,390, or, if subsequently determined to be different, the net capital gain of such year.
The amounts per share which represent income derived from sources within, and taxes paid to, foreign countries or possessions of the United States are as follows:
| Pay Date | Income | Taxes |
Class A | 12/12/05 | $.188 | $.0228 |
Class T | 12/12/05 | $.173 | $.0228 |
Class B | 12/12/05 | $.135 | $.0228 |
Class C | 12/12/05 | $.142 | $.0228 |
The fund will notify shareholders in January 2007 of amounts for use in preparing 2006 income tax returns.
Annual Report
Board Approval of Investment Advisory Contracts and Management Fees
Fidelity International Small Cap Fund
Each year, typically in July, the Board of Trustees, including the Independent Trustees (together, the Board), votes on the renewal of the management contract and sub-advisory agreements (together, the Advisory Contracts) for the fund. The Board, assisted by the advice of fund counsel and Independent Trustees' counsel, requests and considers a broad range of information throughout the year.
The Board meets regularly each month except August and takes into account throughout the year matters bearing on Advisory Contracts. The Board, acting directly and through its separate committees, considers at each of its meetings factors that are relevant to the annual renewal of the fund's Advisory Contracts, including the services and support provided to the fund and its shareholders. At the time of the renewal, the Board had 12 standing committees, each composed of Independent Trustees with varying backgrounds, to which the Board has assigned specific subject matter responsibilities in order to enhance effective decision-making by the Board. Each committee has adopted a written charter outlining the structure and purposes of the committee. One such committee, the Equity Contract Committee, meets periodically as needed throughout the year to consider matters specifically related to the annual renewal of Advisory Contracts. The committee requests and receives information on, and makes recommendations to the Independent Trustees concerning, the approval and annual review of the Advisory Contracts.
At its July 2006 meeting, the Board of Trustees, including the Independent Trustees, unanimously determined to renew the Advisory Contracts for the fund. In reaching its determination, the Board considered all factors it believed relevant, including (i) the nature, extent, and quality of the services to be provided to the fund and its shareholders (including the investment performance of the fund); (ii) the competitiveness of the management fee and total expenses of the fund; (iii) the total costs of the services to be provided by and the profits to be realized by the investment adviser and its affiliates from the relationship with the fund; (iv) the extent to which economies of scale would be realized as the fund grows; and (v) whether fee levels reflect these economies of scale, if any, for the benefit of fund shareholders.
In determining whether to renew the Advisory Contracts for the fund, the Board ultimately reached a determination, with the assistance of fund counsel and Independent Trustees' counsel, that the renewal of the Advisory Contracts and the compensation to be received by Fidelity under the management contract is consistent with Fidelity's fiduciary duty under applicable law. In addition to evaluating the specific factors noted above, the Board, in reaching its determination, is aware that shareholders in the fund have a broad range of investment choices available to them, including a wide choice among mutual funds offered by competitors to Fidelity, and that the fund's shareholders, with the opportunity to review and weigh the disclosure provided by the fund in its prospectus and other public disclosures, have chosen to invest in this fund, managed by Fidelity.
Annual Report
Board Approval of Investment Advisory Contracts and
Management Fees - continued
Nature, Extent, and Quality of Services Provided. The Board considered staffing within the investment adviser, FMR, and the sub-advisers (together, the Investment Advisers), including the backgrounds of the fund's portfolio managers and the fund's investment objective and discipline. The Independent Trustees also had discussions with senior management of Fidelity's investment operations and investment groups. The Board considered the structure of the portfolio manager compensation program and whether this structure provides appropriate incentives.
Resources Dedicated to Investment Management and Support Services. The Board reviewed the size, education, and experience of the Investment Advisers' investment staff, their use of technology, and the Investment Advisers' approach to recruiting, training, and retaining portfolio managers and other research, advisory, and management personnel. The Board considered Fidelity's extensive global research capabilities that enable the Investment Advisers to aggregate data from various sources in an effort to produce positive investment results. The Board noted that Fidelity's analysts have access to a variety of technological tools that enable them to perform both fundamental and quantitative analysis and to specialize in various disciplines. The Board also considered that Fidelity's portfolio managers and analysts have access to daily portfolio attribution that allows for monitoring of a fund's portfolio, as well as an electronic communication system that provides immediate real-time access to research concerning issuers and credit enhancers.
Shareholder and Administrative Services. The Board considered (i) the nature, extent, quality, and cost of administrative, distribution, and shareholder services performed by the Investment Advisers and their affiliates under the Advisory Contracts and under separate agreements covering transfer agency, pricing and bookkeeping, and securities lending services for the fund; (ii) the nature and extent of the Investment Advisers' supervision of third party service providers, principally custodians and subcustodians; and (iii) the resources devoted to, and the record of compliance with, the fund's compliance policies and procedures. The Board reviewed the allocation of fund brokerage, including allocations to brokers affiliated with the Investment Advisers, the use of brokerage commissions to pay fund expenses, and the use of "soft" commission dollars to pay for research services. The Board also considered that Fidelity voluntarily pays for market data out of its own resources.
The Board noted that the growth of fund assets across the complex allows Fidelity to reinvest in the development of services designed to enhance the value or convenience of the Fidelity funds as investment vehicles. These services include 24-hour access to account information and market information through phone representatives and over the Internet, and investor education materials and asset allocation tools.
Annual Report
Investment in a Large Fund Family. The Board considered the benefits to shareholders of investing in a Fidelity fund, including the benefits of investing in a fund that is part of a large family of funds offering a variety of investment disciplines and providing for a large variety of mutual fund investor services. For example, fund shareholders are offered the privilege of exchanging shares of the fund for shares of other Fidelity funds, as set forth in the fund's prospectus, without paying an additional sales charge. The Board noted that, since the last Advisory Contract renewals in July 2005, Fidelity has taken a number of actions that benefited particular funds, including (i) dedicating additional resources to investment research and to restructure the investment research teams; (ii) voluntarily entering into contractual arrangements with certain brokers pursuant to which Fidelity pays for research products and services separately out of its own resources, rather than bundling with fund commissions; (iii) launching the Fidelity Advantage Class of its five Spartan stock index funds and three Spartan bond index funds, which is a lower-fee class available to shareholders with higher account balances; (iv) contractually agreeing to impose expense limitations on Fidelity U.S. Bond Index Fund and reducing the fund's initial investment minimum; and (v) offering shareholders of each of the Fidelity Institutional Money Market Funds the privilege of exchanging shares of the fund for shares of other Fidelity funds.
Investment Performance and Compliance. The Board considered whether the fund has operated within its investment objective, as well as its record of compliance with its investment restrictions. It also reviewed the fund's absolute investment performance for each class, as well as the fund's relative investment performance for each class measured against (i) a broad-based securities market index, and (ii) a peer group of mutual funds deemed appropriate by the Board over multiple periods. Because the fund had been in existence less than five calendar years, the following charts considered by the Board show, over the one- and three-year periods ended December 31, 2005, as applicable, the cumulative total returns of Class C and Fidelity International Small Cap (retail class), the cumulative total returns of a broad-based securities market index ("benchmark"), and a range of cumulative total returns of a peer group of mutual funds identified by Lipper Inc. as having an investment objective similar to that of the fund. The returns of Class C and Fidelity International Small Cap (retail class) represent the performance of classes with the highest and lowest 12b-1 fees, respectively (not necessarily with the highest and lowest total expenses). The box within each chart shows the 25th percentile return (bottom of box) and the 75th percentile return (top of box) of the Lipper peer group. Returns shown above the box are in the first quartile and returns shown below the box are in the fourth quartile. The percentage beaten numbers noted below each chart correspond to the percentile box and represent the percentage of funds in the Lipper peer group whose performance was equal to or lower than that of the class indicated.
Annual Report
Board Approval of Investment Advisory Contracts and
Management Fees - continued
Fidelity International Small Cap Fund

The Board reviewed the fund's relative investment performance against its Lipper peer group and stated that the performance of Fidelity International Small Cap (retail class) was in the first quartile for all the periods shown. The Board also stated that the relative investment performance of Fidelity International Small Cap (retail class) compared favorably to its benchmark for all the periods shown. The Board considered that the variations in performance among the fund's classes reflect the variations in class expenses, which result in lower performance for higher expense classes.
The Board also considered that the fund's management fee is subject to upward or downward adjustment depending upon whether, and to what extent, the fund's investment performance for the performance period exceeds, or is exceeded by, the record (over the same period) of a Board-approved performance adjustment index. The Board realizes that the performance adjustment provides FMR with a strong economic incentive to seek to achieve superior performance for the fund's shareholders and helps to more closely align the interests of FMR and the fund's shareholders.
The Board considered that FMR has taken steps to refocus and strengthen equity research, equity portfolio management, and compliance. The Board noted with favor FMR's reorganization of its senior management team in 2005 and FMR's dedication of additional resources to investment research, and participated in the process that led to those changes.
Based on its review, and giving particular weight to the nature and quality of the resources dedicated by the Investment Advisers to maintain and improve relative performance, the Board concluded that the nature, extent, and quality of the services provided to the fund will benefit the fund's shareholders, particularly in light of the Board's view that the fund's shareholders benefit from investing in a fund that is part of a large family of funds offering a variety of investment disciplines and services.
Annual Report
Competitiveness of Management Fee and Total Fund Expenses. The Board considered the fund's management fee and total expenses compared to "mapped groups" of competitive funds and classes. Fidelity creates "mapped groups" by combining similar Lipper investment objective categories that have comparable management fee characteristics. Combining Lipper investment objective categories aids the Board's management fee and total expense comparisons by broadening the competitive group used for comparison and by reducing the number of universes to which various Fidelity funds are compared.
The Board considered two proprietary management fee comparisons for the 12-month (or shorter) periods shown in the chart below. The group of Lipper funds used by the Board for management fee comparisons is referred to below as the "Total Mapped Group" and, for the reasons explained above, is broader than the Lipper peer group used by the Board for performance comparisons. The Total Mapped Group comparison focuses on a fund's standing relative to the total universe of comparable funds available to investors, in terms of gross management fees before expense reimbursements or caps, and without giving effect to the fund's performance adjustment. "TMG %" represents the percentage of funds in the Total Mapped Group that had management fees that were lower than the fund's. For example, a TMG % of 37% means that 63% of the funds in the Total Mapped Group had higher management fees than the fund. The "Asset-Size Peer Group" (ASPG) comparison focuses on a fund's standing relative to non-Fidelity funds similar in size to the fund within the Total Mapped Group. The ASPG represents at least 15% of the funds in the Total Mapped Group with comparable asset size and management fee characteristics, subject to a minimum of 50 funds (or all funds in the Total Mapped Group if fewer than 50). Additional information, such as the ASPG quartile in which the fund's management fee ranked and the impact of the fund's performance adjustment, is also included in the chart and considered by the Board.
Annual Report
Board Approval of Investment Advisory Contracts and
Management Fees - continued
Fidelity International Small Cap Fund
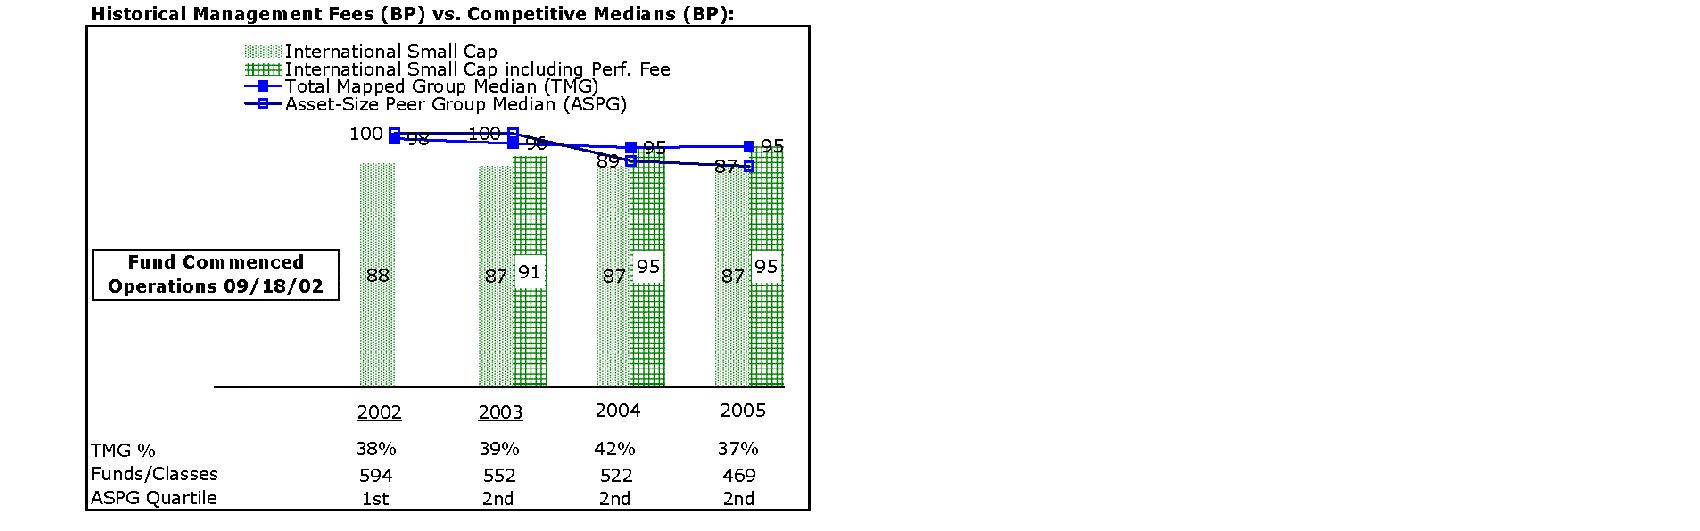
The Board noted that the fund's management fee ranked below the median of its Total Mapped Group and equal to the median of its ASPG for 2005. The Board also noted the effect of the fund's positive performance adjustment on the fund's management fee ranking. The Board noted that the performance adjustment for each year represents calculations for rolling 36-month periods that differ from the periods shown in the performance charts above.
Based on its review, the Board concluded that the fund's management fee was fair and reasonable in light of the services that the fund receives and the other factors considered.
In its review of each class's total expenses, the Board considered the fund's management fee as well as other fund or class expenses, as applicable, such as transfer agent fees, pricing and bookkeeping fees, fund-paid 12b-1 fees, and custodial, legal, and audit fees. The Board also noted the effects of any waivers and reimbursements on fees and expenses, as well as the fund's positive performance adjustment. As part of its review, the Board also considered current and historical total expenses of each class of the fund compared to competitive fund median expenses. Each class of the fund is compared to those funds and classes in the Total Mapped Group (used by the Board for management fee comparisons) that have a similar sales load structure.
The Board noted that the total expenses of Fidelity International Small Cap (retail class) ranked below its competitive median for 2005, and the total expenses of each of Class A, Class B, Class C, Class T and Institutional Class ranked above its competitive median for 2005. The Board considered that the fund is an international small cap fund, but that the broader competitive mapped group includes international funds of all cap levels because there are relatively few international funds focused on small caps. The Board noted that the fund offers multiple classes, each of which has a different sales load and 12b-1 fee structure, and that the multiple structures are intended to offer a range of pricing options for the intermediary market. The Board also noted that the total expenses of the classes vary primarily by the level of their 12b-1 fees, although differences in transfer agent fees may also cause expenses to vary from class to class.
Annual Report
In its review of total expenses, the Board also considered Fidelity fee structures and other information on clients that FMR and its affiliates service in other competitive markets, such as other mutual funds advised or subadvised by FMR or its affiliates, pension plan clients, and other institutional clients.
Based on its review, the Board concluded that the total expenses of each class of the fund were reasonable, although in some cases above the median of the universe presented for comparison, in light of the services that the fund and its shareholders receive and the other factors considered.
Costs of the Services and Profitability. The Board considered the revenues earned and the expenses incurred by Fidelity in conducting the business of developing, marketing, distributing, managing, administering and servicing the fund and its shareholders. The Board also considered the level of Fidelity's profits in respect of all the Fidelity funds.
On an annual basis, FMR presents to the Board Fidelity's profitability for the fund. Fidelity calculates the profitability for each fund, as well as aggregate profitability for groups of Fidelity funds and all Fidelity funds, using a series of detailed revenue and cost allocation methodologies which originate with the audited books and records of Fidelity. The Audit Committee of the Board reviews any significant changes from the prior year's methodologies.
PricewaterhouseCoopers LLP (PwC), independent registered accounting firm and auditor to Fidelity and certain Fidelity funds, has been engaged annually by the Board as part of the Board's assessment of the results of Fidelity's profitability analysis. PwC's engagement includes the review and assessment of Fidelity's methodologies used in determining the revenues and expenses attributable to Fidelity's mutual fund business, and completion of agreed-upon procedures surrounding the mathematical accuracy of fund profitability and its conformity to allocation methodologies. After considering PwC's reports issued under the engagement and information provided by Fidelity, the Board believes that while other allocation methods may also be reasonable, Fidelity's profitability methodologies are reasonable in all material respects.
Annual Report
Board Approval of Investment Advisory Contracts and
Management Fees - continued
The Board has also reviewed Fidelity's non-fund businesses and any fall-out benefits related to the mutual fund business as well as cases where Fidelity's affiliates may benefit from or be related to the fund's business.
The Board considered the costs of the services provided by and the profits realized by Fidelity in connection with the operation of the fund and determined that the amount of profit is a fair entrepreneurial profit for the management of the fund.
Economies of Scale. The Board considered whether there have been economies of scale in respect of the management of the Fidelity funds, whether the Fidelity funds (including the fund) have appropriately benefited from any such economies of scale, and whether there is potential for realization of any further economies of scale. The Board considered the extent to which the fund will benefit from economies of scale through increased services to the fund, through waivers or reimbursements, or through fee or expense reductions, including reductions that occur through operation of the transfer agent agreement. The transfer agent fee varies in part based on the number of accounts in the fund. If the number of accounts decreases or the average account size increases, the overall transfer agent fee rate decreases.
The Board recognized that the fund's management contract incorporates a "group fee" structure, which provides for lower fee rates as total fund assets under FMR's management increase, and for higher fee rates as total fund assets under FMR's management decrease. The Board considered that the group fee is designed to deliver the benefits of economies of scale to fund shareholders when total fund assets increase, even if assets of any particular fund are unchanged or have declined, because some portion of Fidelity's costs are attributable to services provided to all Fidelity funds, and all funds benefit if those costs can be allocated among more assets. The Board also considered that although the fund is partially closed to new investors, it continues to incur investment management expenses, and marketing and distribution expenses related to the retention of existing shareholders and assets. The Board further noted that the fund may continue to realize benefits from the group fee structure, even though assets may not be expected to grow significantly at the fund level. The Board concluded that, given the group fee structure, fund shareholders will achieve a certain level of economies of scale as assets under FMR's management increase at the fund complex level, regardless of whether Fidelity achieves any such economies of scale.
The Board further concluded that any potential economies of scale are being shared between fund shareholders and Fidelity in an appropriate manner.
Additional Information Requested by the Board. In order to develop fully the factual basis for consideration of the Advisory Contracts, the Board requested additional information on several topics, including (i) Fidelity's fund profitability methodology and profitability trends within certain funds; (ii) portfolio manager compensation; (iii) the extent to which any economies of scale exist and are shared between the funds and Fidelity; (iv) the total expenses of certain funds and classes relative to competitors, including the extent to which the expenses of certain funds have been or could be capped; (v) fund performance trends; and (vi) Fidelity's fee structures, including use of performance fees.
Annual Report
Based on its evaluation of all of the conclusions noted above, and after considering all material factors, the Board ultimately concluded that the advisory fee structures are fair and reasonable, and that the fund's Advisory Contracts should be renewed.
Annual Report
Investment Adviser
Fidelity Management & Research Company
Boston, MA
Investment Sub-Advisers
FMR Co., Inc.
Fidelity Management & Research
(U.K.) Inc.
Fidelity Research & Analysis
Company (formerly Fidelity
Management & Research (Far East) Inc.)
Fidelity International
Investment Advisors
Fidelity Investments Japan Limited
Fidelity International Investment Advisors (U.K.) Limited
General Distributor
Fidelity Distributors Corporation
Boston, MA
Transfer and Service Agents
Fidelity Investments Institutional Operations Company, Inc.
Boston, MA
Fidelity Service Company, Inc.
Boston, MA
Custodian
Mellon Bank
Pittsburgh, PA
(Fidelity Investment logo)(registered trademark)
Corporate Headquarters
82 Devonshire St., Boston, MA 02109
www.fidelity.com
AISC-UANN-1206
1.793568.103
Fidelity®
International Small Cap
Fund
Annual Report
October 31, 2006
(2_fidelity_logos) (Registered_Trademark)
Contents
Chairman's Message | 4 | Ned Johnson's message to shareholders. |
Performance | 5 | How the fund has done over time. |
Management's Discussion | 6 | The managers' review of fund performance, strategy and outlook. |
Shareholder Expense Example | 7 | An example of shareholder expenses. |
Investment Changes | 9 | A summary of major shifts in the fund's investments over the past six months. |
Investments | 11 | A complete list of the fund's investments with their market values. |
Financial Statements | 35 | Statements of assets and liabilities, operations, and changes in net assets,
as well as financial highlights. |
Notes | 45 | Notes to the financial statements. |
Report of Independent Registered Public Accounting Firm | 55 | |
Trustees and Officers | 56 | |
Distributions | 67 | |
Board Approval of Investment Advisory Contracts and Management Fees | 68 | |
To view a fund's proxy voting guidelines and proxy voting record for the 12-month period ended June 30, visit www.fidelity.com/proxyvotingresults or visit the Securities and Exchange Commission's (SEC) web site at www.sec.gov. You may also call 1-800-544-8544 to request a free copy of the proxy voting guidelines.
Standard & Poor's, S&P and S&P 500 are registered service marks of The McGraw-Hill Companies, Inc. and have been licensed for use by Fidelity Distributors Corporation.
Other third party marks appearing herein are the property of their respective owners.
All other marks appearing herein are registered or unregistered trademarks or service marks of FMR Corp. or an affiliated company.
Annual Report
This report and the financial statements contained herein are submitted for the general information of the shareholders of the fund. This report is not authorized for distribution to prospective investors in the fund unless preceded or accompanied by an effective prospectus.
A fund files its complete schedule of portfolio holdings with the SEC for the first and third quarters of each fiscal year on Form N-Q. Forms N-Q are available on the SEC's web site at http://www.sec.gov. A fund's Forms N-Q may be reviewed and copied at the SEC's Public Reference Room in Washington, DC. Information regarding the operation of the SEC's Public Reference Room may be obtained by calling 1-800-SEC-0330. For a complete list of a fund's portfolio holdings, view the most recent quarterly holdings report, semiannual report, or annual report on Fidelity's web site at http://www.fidelity.com/holdings.
NOT FDIC INSURED · MAY LOSE VALUE · NO BANK GUARANTEE
Neither the fund nor Fidelity Distributors Corporation is a bank.
Annual Report
Chairman's Message
(photo_of_Edward_C_Johnson_3d)
Dear Shareholder:
Stock and bond markets around the world have seen largely positive results year to date, although weakness in the technology sector and growth stocks in general have tempered performance. While financial markets are always unpredictable, there are a number of time-tested principles that can put the historical odds in your favor.
One of the basic tenets is to invest for the long term. Over time, riding out the markets' inevitable ups and downs has proven much more effective than selling into panic or chasing the hottest trend. Even missing only a few of the markets' best days can significantly diminish investor returns. Patience also affords the benefits of compounding - of earning interest on additional income or reinvested dividends and capital gains. There are tax advantages and cost benefits to consider as well. The more you sell, the more taxes you pay, and the more you trade, the higher the costs. While staying the course doesn't eliminate risk, it can considerably lessen the effect of short-term declines.
You can further manage your investing risk through diversification. And today, more than ever, geographic diversification should be taken into account. Studies indicate that asset allocation is the single most important determinant of a portfolio's long-term success. The right mix of stocks, bonds and cash - aligned to your particular risk tolerance and investment objective - is very important. Age-appropriate rebalancing is also an essential aspect of asset allocation. For younger investors, an emphasis on equities - which historically have been the best performing asset class over time - is encouraged. As investors near their specific goal, such as retirement or sending a child to college, consideration may be given to replacing volatile assets (e.g. common stocks) with more-stable fixed investments (bonds or savings plans).
A third investment principle - investing regularly - can help lower the average cost of your purchases. Investing a certain amount of money each month or quarter helps ensure you won't pay for all your shares at market highs. This strategy - known as dollar cost averaging - also reduces unconstructive "emotion" from investing, helping shareholders avoid selling weak performers just prior to an upswing, or chasing a hot performer just before a correction.
We invite you to contact us via the Internet, through our Investor Centers or over the phone. It is our privilege to provide you the information you need to make the investments that are right for you.
Sincerely,
/s/Edward C. Johnson 3d
Edward C. Johnson 3d
Annual Report
Performance: The Bottom Line
Average annual total return reflects the change in the value of an investment, assuming reinvestment of International Small Cap's dividend income and capital gains (the profits earned upon the sale of securities that have grown in value) and assuming a constant rate of performance each year. The $10,000 table and the fund's returns do not reflect the deduction of taxes that a shareholder would pay on fund distributions or the redemption of fund shares. During periods of reimbursement by Fidelity, a fund's total return will be greater than it would be had the reimbursement not occurred. How a fund did yesterday is no guarantee of how it will do tomorrow.
Average Annual Total Returns
Periods ended October 31, 2006 | Past 1
year | Life of
fund A |
International Small Cap | 20.65% | 34.92% |
A From September 18, 2002.
$10,000 Over Life of Fund
Let's say hypothetically that $10,000 was invested in International Small Cap on September 18, 2002, when the fund started. The chart shows how the value of your investment would have changed, and also shows how the MSCI® EAFE® Small Cap Index performed over the same period.
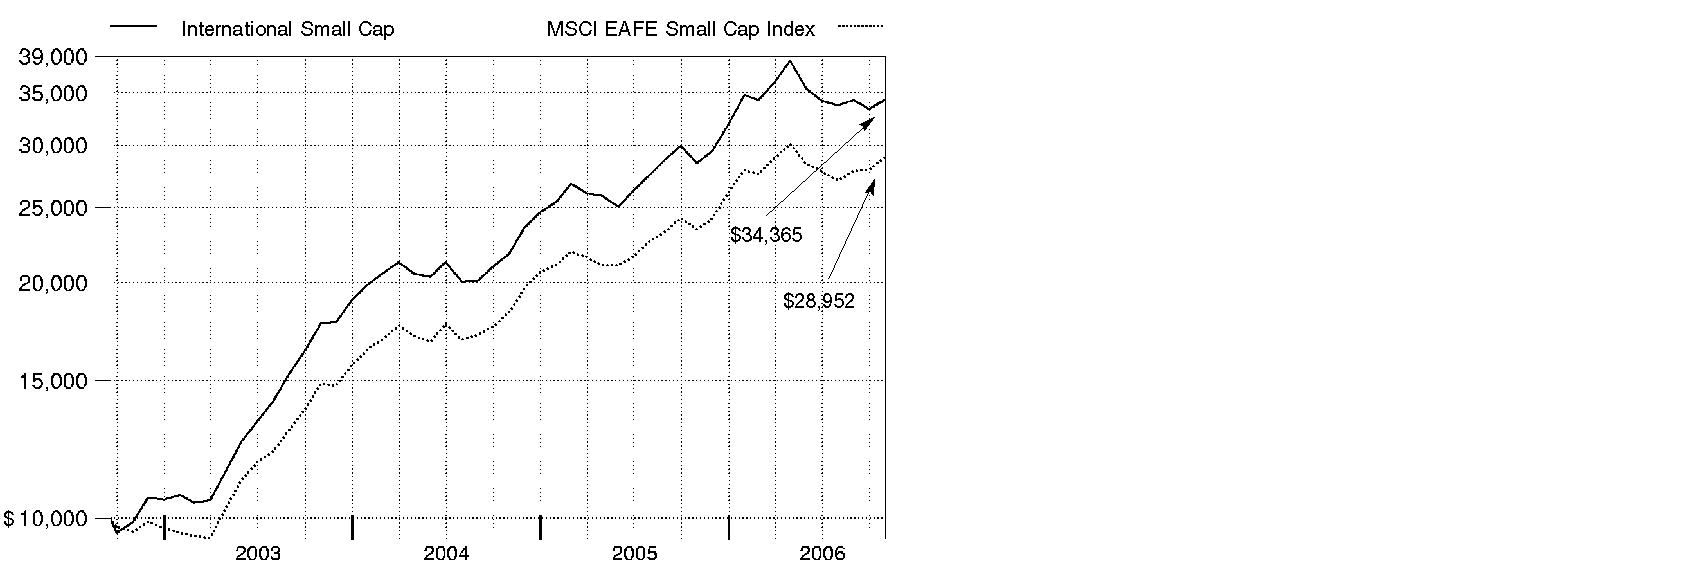
Annual Report
Management's Discussion of Fund Performance
Comments from Ben Paton, Tokuya Sano and Wilson Wong, Co-Portfolio Managers of Fidelity® International Small Cap Fund
International equity markets as a whole outpaced their U.S. counterparts for the 12 months ending October 31, 2006 - partly as a result of favorable currency exchanges that boosted returns for U.S. investors. The Morgan Stanley Capital InternationalSM Europe, Australasia, Far East (MSCI® EAFE®) Index - a gauge of developed stock markets outside the United States and Canada - gained 27.72% during that time. European markets benefited from solid corporate profit growth and attractive dividends, which helped the MSCI Europe index advance 31.95%. Strong performing Latin American and Asian emerging markets drove the MSCI Emerging Markets index to a lofty 35.42% return. Japan was somewhat of an exception to the generally stellar foreign market performance after struggling in the middle part of the period. Still, its earlier gains helped the Tokyo Stock Exchange Stock Price Index (TOPIX) - a benchmark of the largest and better-established stocks traded on the Tokyo Stock Exchange - rise 12.47% overall. Natural-resources-rich Canada also struggled over the final six months as energy prices fell, but the S&P/TSX Composite Index managed a 12-month return of 28.21%.
During the past year, International Small Cap returned 20.65%, trailing the 23.55% return of the MSCI EAFE Small Cap index. Weak results in the Europe/Africa/Middle East subportfolio - in particular, unsuccessful positions in the United Kingdom and in energy and materials stocks - hurt the most versus the index. For example, not owning Swedish zinc producer Boliden was costly, as zinc prices soared, causing the stock to follow suit. Healthcare Enterprise Group, a U.K. health care device company, faltered because of an acquisition that reported unexpected losses. Performance also suffered due to Japan-based Kura Corp., a restaurant operator; Tanzanite One, a Bermuda-incorporated miner of the blue gemstone tanzanite; and Downer EDI, an Australian engineering company. Conversely, both the Japanese and Pacific Basin ex Japan subportfolios outperformed their respective index components. On a sector basis, financials and information technology helped, with Italian stock Banca Italease leading the way. Other positives included Japanese auto parts maker Nissin Kogyo and the timely sale of DaVinci Advisors, a real estate stock. In the Pacific Basin ex Japan subportfolio, contributors included two Australian companies: engineering services provider WorleyParsons and Bradken, a supplier of consumable products to the mining and rail industries. In absolute terms, currency fluctuations bolstered the fund's gains.
The views expressed above reflect those of the portfolio manager(s) only through the end of the period as stated on the cover of this report and do not necessarily represent the views of Fidelity or any other person in the Fidelity organization. Any such views are subject to change at any time based upon market or other conditions and Fidelity disclaims any responsibility to update such views. These views may not be relied on as investment advice and, because investment decisions for a Fidelity fund are based on numerous factors, may not be relied on as an indication of trading intent on behalf of any Fidelity fund.
Annual Report
Shareholder Expense Example
As a shareholder of the Fund, you incur two types of costs: (1) transaction costs, including sales charges (loads) on purchase payments or redemption proceeds, redemption fees, and (2) ongoing costs, including management fees, distribution and/or service (12b-1) fees and other Fund expenses. This Example is intended to help you understand your ongoing costs (in dollars) of investing in the Fund and to compare these costs with the ongoing costs of investing in other mutual funds.
The Example is based on an investment of $1,000 invested at the beginning of the period and held for the entire period (May 1, 2006 to October 31, 2006).
Actual Expenses
The first line of the accompanying table for each class of the Fund provides information about actual account values and actual expenses. You may use the information in this line, together with the amount you invested, to estimate the expenses that you paid over the period. Simply divide your account value by $1,000.00 (for example, an $8,600 account value divided by $1,000.00 = 8.6), then multiply the result by the number in the first line for a class of the Fund under the heading entitled "Expenses Paid During Period" to estimate the expenses you paid on your account during this period. A small balance maintenance fee of $12.00 that is charged once a year may apply for certain accounts with a value of less than $2,000. This fee is not included in the table below. If it was, the estimate of expenses you paid during the period would be higher, and your ending account value lower, by this amount.
Hypothetical Example for Comparison Purposes
The second line of the accompanying table for each class of the Fund provides information about hypothetical account values and hypothetical expenses based on a Class' actual expense ratio and an assumed rate of return of 5% per year before expenses, which is not the Class' actual return. The hypothetical account values and expenses may not be used to estimate the actual ending account balance or expenses you paid for the period. You may use this information to compare the ongoing costs of investing in the Fund and other funds. To do so, compare this 5% hypothetical example with the 5% hypothetical examples that appear in the shareholder reports of the other funds. A small balance maintenance fee of $12.00 that is charged once a year may apply for certain accounts with a value of less than $2,000. This fee is not included in the table below. If it was, the estimate of expenses you paid during the period would be higher, and your ending account value lower, by this amount.
Annual Report
Shareholder Expense Example - continued
Please note that the expenses shown in the table are meant to highlight your ongoing costs only and do not reflect any transaction costs. Therefore, the second line of the table is useful in comparing ongoing costs only, and will not help you determine the relative total costs of owning different funds. In addition, if these transactional costs were included, your costs would have been higher.
| Beginning
Account Value
May 1, 2006 | Ending
Account Value
October 31, 2006 | Expenses Paid
During Period*
May 1, 2006
to October 31, 2006 |
Class A | | | |
Actual | $ 1,000.00 | $ 890.50 | $ 7.86 |
Hypothetical A | $ 1,000.00 | $ 1,016.89 | $ 8.39 |
Class T | | | |
Actual | $ 1,000.00 | $ 889.40 | $ 9.00 |
Hypothetical A | $ 1,000.00 | $ 1,015.68 | $ 9.60 |
Class B | | | |
Actual | $ 1,000.00 | $ 887.30 | $ 11.42 |
Hypothetical A | $ 1,000.00 | $ 1,013.11 | $ 12.18 |
Class C | | | |
Actual | $ 1,000.00 | $ 887.30 | $ 11.32 |
Hypothetical A | $ 1,000.00 | $ 1,013.21 | $ 12.08 |
International Small Cap | | | |
Actual | $ 1,000.00 | $ 892.40 | $ 6.11 |
Hypothetical A | $ 1,000.00 | $ 1,018.75 | $ 6.51 |
Institutional Class | | | |
Actual | $ 1,000.00 | $ 892.30 | $ 6.20 |
Hypothetical A | $ 1,000.00 | $ 1,018.65 | $ 6.61 |
A 5% return per year before expenses
* Expenses are equal to each Class' annualized expense ratio (shown in the table below); multiplied by the average account value over the period, multiplied by 184/365 (to reflect the one-half year period).
| Annualized
Expense Ratio |
Class A | 1.65% |
Class T | 1.89% |
Class B | 2.40% |
Class C | 2.38% |
International Small Cap | 1.28% |
Institutional Class | 1.30% |
Annual Report
Investment Changes
Geographic Diversification (% of fund's net assets) |
As of October 31, 2006 |
| Japan 31.2% | |
| United Kingdom 19.2% | |
| Australia 10.5% | |
| United States of America 5.1% | |
| Canada 3.7% | |
| France 3.2% | |
| Germany 3.1% | |
| Italy 2.9% | |
| Bermuda 2.5% | |
| Other 18.6% | |

Percentages are adjusted for the effect of futures contracts, if applicable. |
|
As of April 30, 2006 |
| Japan 32.2% | |
| United Kingdom 18.1% | |
| Australia 9.6% | |
| Canada 3.9% | |
| South Africa 3.8% | |
| United States of America 2.8% | |
| Italy 2.8% | |
| Bermuda 2.4% | |
| Germany 2.2% | |
| Other 22.2% | |
Percentages are adjusted for the effect of futures contracts, if applicable. |
Asset Allocation |
| % of fund's
net assets | % of fund's net assets
6 months ago |
Stocks and Investment Companies | 96.1 | 98.7 |
Bonds | 0.3 | 0.3 |
Short-Term Investments and Net Other Assets | 3.6 | 1.0 |
Top Ten Stocks as of October 31, 2006 |
| % of fund's
net assets | % of fund's net assets
6 months ago |
Banca Italease Spa (Italy, Diversified Financial Services) | 2.3 | 1.9 |
Icade SA (France, Real Estate Management & Development) | 1.3 | 0.1 |
Nissin Kogyo Co. Ltd. (Japan, Auto Components) | 1.2 | 0.9 |
Steinhoff International Holdings Ltd. (South Africa, Household Durables) | 1.1 | 1.5 |
Fujikura Ltd. (Japan, Electrical Equipment) | 1.1 | 0.8 |
Ceske Energeticke Zavody AS (Czech Republic, Electric Utilities) | 1.1 | 0.0 |
Max Petroleum PLC (United Kingdom, Oil, Gas & Consumable Fuels) | 1.1 | 1.0 |
NOK Corp. (Japan, Auto Components) | 1.0 | 0.1 |
Nippon Seiki Co. Ltd. (Japan, Auto Components) | 0.9 | 0.7 |
International Ferro Metals (Australia, Metals & Mining) | 0.9 | 0.6 |
| 12.0 | |
Market Sectors as of October 31, 2006 |
| % of fund's
net assets | % of fund's net assets
6 months ago |
Consumer Discretionary | 16.8 | 16.5 |
Materials | 16.7 | 18.7 |
Industrials | 15.1 | 15.7 |
Information Technology | 11.4 | 12.8 |
Financials | 11.3 | 9.8 |
Energy | 10.3 | 14.5 |
Health Care | 5.4 | 5.0 |
Utilities | 4.6 | 1.2 |
Consumer Staples | 3.7 | 3.7 |
Telecommunication Services | 1.1 | 1.1 |
Annual Report
Investments October 31, 2006
Showing Percentage of Net Assets
Common Stocks - 96.0% |
| Shares | | Value (Note 1) (000s) |
Australia - 10.5% |
Allied Gold Ltd. (a) | 11,880,000 | | $ 3,863 |
AMP Ltd. | 398,700 | | 2,932 |
Aristocrat Leisure Ltd. | 38,800 | | 418 |
Austbrokers Holdings Ltd. | 1,012,159 | | 3,173 |
Australian Stock Exchange Ltd. | 191,909 | | 5,259 |
Australian Wealth Management Ltd. | 2,709,087 | | 5,453 |
Babcock & Brown Japan Property Trust | 1,297,100 | | 1,943 |
Billabong International Ltd. | 307,700 | | 3,735 |
Bradken Ltd. | 1,417,195 | | 6,703 |
Brambles Industries Ltd. (d) | 308,500 | | 2,981 |
Caltex Australia Ltd. | 36,000 | | 617 |
Capital-XX Ltd. | 2,262,572 | | 3,129 |
Centamin Egypt Ltd. (a) | 5,903,500 | | 2,984 |
Cochlear Ltd. | 163,900 | | 7,064 |
Computershare Ltd. | 1,284,572 | | 7,657 |
David Jones Ltd. | 590,500 | | 1,655 |
Dominos Pizza Australia New Zealand Ltd. | 2,778,220 | | 6,990 |
Downer EDI Ltd. | 581,057 | | 2,897 |
Dwyka Diamonds Ltd. (a) | 6,949,000 | | 2,717 |
Elixir Petroleum Ltd. (a) | 2,002,140 | | 630 |
Elkedra Diamonds NL (a) | 5,953,671 | | 2,470 |
Energy Resources of Australia Ltd. | 129,200 | | 1,774 |
European Gas Ltd. (a) | 1,673,600 | | 894 |
Fox Resources Ltd. warrants 6/30/07 (a) | 342,636 | | 252 |
Hastie Group Ltd. | 2,126,299 | | 4,000 |
HFA Holdings Ltd. | 2,152,000 | | 3,099 |
IBT Education Ltd. | 153,450 | | 227 |
International Ferro Metals (e) | 24,719,526 | | 17,682 |
Invocare Ltd. | 67,700 | | 278 |
Jumbuck Entertainment Ltd. (a) | 841,100 | | 1,205 |
Kimberley Diamond Co. NL (a) | 855,800 | | 696 |
Macquarie Goodman Group unit | 295,700 | | 1,515 |
Metcash Ltd. | 2,138,000 | | 7,084 |
Mineral Commodities Ltd. (a)(e) | 7,900,000 | | 948 |
Mineral Deposits Ltd. (a) | 4,233,200 | | 5,112 |
Mintails Ltd. (a) | 6,289,600 | | 974 |
Monto Minerals Ltd. (a) | 8,525,252 | | 1,504 |
Monto Minerals Ltd. warrants 5/25/09 (a) | 1,485,934 | | 11 |
Mortgage Choice Ltd. | 2,133,191 | | 4,426 |
Multiplex Group unit | 1,238,000 | | 3,527 |
Newcrest Mining Ltd. | 23,800 | | 439 |
Novera Energy Ltd. (a) | 488,000 | | 521 |
Common Stocks - continued |
| Shares | | Value (Note 1) (000s) |
Australia - continued |
Oakton Ltd. | 130,715 | | $ 419 |
Paladin Resources Ltd. (a)(d) | 1,443,600 | | 6,448 |
Patties Food Ltd. | 1,035,200 | | 1,402 |
Phosphagenics Ltd. (a) | 9,040,000 | | 2,449 |
QBE Insurance Group Ltd. | 257,323 | | 4,920 |
Reverse Corp. Ltd. | 1,073,700 | | 2,934 |
Rinker Group Ltd. | 82,700 | | 1,188 |
Roc Oil Co. Ltd. (United Kingdom) (a) | 3,700,112 | | 10,022 |
SAI Global Ltd. | 98,900 | | 274 |
Seek Ltd. | 1,350,239 | | 5,561 |
Sigma Pharmaceuticals Ltd. | 1,517,600 | | 3,031 |
SMS Management & Technology Ltd. | 166,300 | | 530 |
Sonic Healthcare Ltd. | 89,400 | | 910 |
Sphere Investments Ltd. (a) | 2,038,159 | | 1,988 |
Summit Resources Ltd. (a) | 1,039,620 | | 1,787 |
Sylvania Resources Ltd. (a) | 7,484,597 | | 5,331 |
Sylvania Resources Ltd. (United Kingdom) (a) | 4,923,630 | | 3,616 |
Tanami Gold NL | 19,652,484 | | 2,815 |
Tattersall's Ltd. | 665,464 | | 1,875 |
United Group Ltd. | 320,421 | | 3,624 |
Woodside Petroleum Ltd. | 45,600 | | 1,326 |
Woolworths Ltd. | 394,926 | | 6,326 |
WorleyParsons Ltd. | 172,430 | | 2,423 |
TOTAL AUSTRALIA | | 202,637 |
Austria - 0.3% |
Oesterreichische Elektrizitaetswirtschafts AG (Verbund) | 106,900 | | 5,336 |
Belgium - 0.1% |
Punch International NV (a) | 17,350 | | 2,024 |
Bermuda - 2.5% |
Aquarius Platinum Ltd. (United Kingdom) | 539,400 | | 10,052 |
Hi Sun Technology (China) Ltd. (a) | 2,106,000 | | 406 |
Katanga Mining Ltd. (a) | 233,800 | | 1,320 |
Pacific Basin Shipping Ltd. | 2,030,000 | | 1,305 |
Peace Mark Holdings Ltd. | 3,750,000 | | 2,556 |
Petra Diamonds Ltd. (a) | 2,502,406 | | 5,847 |
Ports Design Ltd. | 1,798,000 | | 3,126 |
RC Group (Holdings) Ltd. | 2,139,000 | | 2,693 |
SeaDrill Ltd. (a) | 502,921 | | 7,132 |
Tanzanite One Ltd. (e) | 5,808,701 | | 9,086 |
Trefoil Ltd. (a) | 385,100 | | 2,698 |
Common Stocks - continued |
| Shares | | Value (Note 1) (000s) |
Bermuda - continued |
Xceldiam Ltd. (e) | 3,318,255 | | $ 1,946 |
Xceldiam Ltd. warrants 11/16/07 (a) | 1,659,127 | | 222 |
TOTAL BERMUDA | | 48,389 |
British Virgin Islands - 0.4% |
Albidon Ltd. unit (a) | 1,469,000 | | 1,646 |
BDI Mining Corp. (a)(e) | 8,728,890 | | 3,288 |
Kalahari Energy (a)(g) | 1,451,000 | | 1,814 |
Titanium Resources Group Ltd. | 959,090 | | 1,134 |
TOTAL BRITISH VIRGIN ISLANDS | | 7,882 |
Canada - 3.4% |
AirSea Lines (g) | 1,862,300 | | 1,189 |
AirSea Lines warrants 6/14/08 (a)(g) | 1,862,300 | | 0 |
Altius Minerals Corp. (a) | 533,806 | | 3,842 |
Antrim Energy, Inc. (a) | 714,540 | | 2,482 |
Antrim Energy, Inc. (United Kingdom) | 800,000 | | 2,762 |
Bankers Petroleum Ltd. (a) | 3,767,000 | | 2,282 |
Brazilian Diamonds Ltd. (a) | 332,000 | | 41 |
First Quantum Minerals Ltd. | 190,271 | | 10,872 |
Grove Energy Ltd. (a) | 1,964,140 | | 1,161 |
Lionore Mining International Ltd. (a) | 474,540 | | 4,003 |
MagIndustries Corp. (a) | 7,216,960 | | 6,107 |
Oilexco, Inc. (a) | 1,394,525 | | 8,360 |
Platinum Group Metals Ltd. (a) | 407,100 | | 696 |
Rock Well Petroleum, Inc. (g) | 770,400 | | 1,029 |
Starfield Resources, Inc. (a)(e) | 13,019,181 | | 3,247 |
Starfield Resources, Inc.: | | | |
warrants 5/9/07 (a)(g) | 1,313,025 | | 9 |
warrants 1/21/08 (a)(g) | 1,678,100 | | 89 |
Stealth Ventures Ltd. (a) | 966,500 | | 1,178 |
Stealth Ventures Ltd. warrants 3/12/08 (a)(g) | 483,250 | | 110 |
StrataGold Corp. (a) | 2,976,400 | | 2,704 |
SXR Uranium One, Inc. (a) | 475,740 | | 5,409 |
Tenke Mining Corp. (a) | 103,000 | | 1,373 |
Visual Defence, Inc. (a)(e) | 5,963,100 | | 2,673 |
Western Canadian Coal Corp. | 1,554,418 | | 2,894 |
Western Canadian Coal Corp. (United Kingdom) (a) | 548,286 | | 1,098 |
TOTAL CANADA | | 65,610 |
Cayman Islands - 0.4% |
Computime Group Ltd. | 2,048,000 | | 761 |
EcoGreen Fine Chemical Group Ltd. | 2,346,000 | | 573 |
Common Stocks - continued |
| Shares | | Value (Note 1) (000s) |
Cayman Islands - continued |
Hopefluent Group Holdings Ltd. | 20,000 | | $ 8 |
Kingboard Chemical Holdings Ltd. | 149,000 | | 530 |
New World China Land Ltd. | 3,470,000 | | 1,664 |
Prime Success International Group Ltd. | 2,718,000 | | 2,230 |
Shimao Property Holdings Ltd. | 648,000 | | 873 |
Wasion Meters Group Ltd. | 2,030,000 | | 848 |
TOTAL CAYMAN ISLANDS | | 7,487 |
China - 0.9% |
BYD Co. Ltd. (H Shares) (a) | 363,000 | | 978 |
China International Marine Containers Co. Ltd. (B Shares) | 1,115,800 | | 1,571 |
China Merchants Bank Co. Ltd. (H Shares) (a) | 1,663,500 | | 2,597 |
China Oilfield Services Ltd. (H Shares) | 2,664,000 | | 1,497 |
China Shipping Development Co. Ltd. (H Shares) | 1,286,000 | | 1,399 |
Dalian Port (PDA) Co. Ltd. (H Shares) | 2,188,000 | | 1,058 |
Guangzhou R&F Properties Co. Ltd. (H Shares) | 696,000 | | 1,137 |
Home Inns & Hotels Management, Inc. sponsored ADR | 2,200 | | 54 |
Hunan Non-Ferrous Metals Corp. Ltd. (H Shares) | 3,026,000 | | 1,432 |
Industrial & Commercial Bank of China | 2,524,000 | | 1,129 |
London Asia Chinese Private Equity Fund Ltd. (a) | 473,800 | | 1,008 |
Nine Dragons Paper (Holdings) Ltd. | 1,154,000 | | 1,469 |
Parkson Retail Group Ltd. | 36,000 | | 150 |
Shenzhou International Group Holdings Ltd. | 2,768,000 | | 1,146 |
Yantai Changyu Pioneer Wine Co. (B Shares) | 327,210 | | 1,115 |
TOTAL CHINA | | 17,740 |
Cyprus - 0.1% |
Buried Hill Energy (Cyprus) PLC (g) | 1,947,000 | | 2,142 |
Czech Republic - 1.1% |
Ceske Energeticke Zavody AS | 533,600 | | 21,101 |
Finland - 0.6% |
Inion OY (a)(e) | 3,740,300 | | 1,677 |
Nokian Tyres Ltd. | 348,000 | | 6,663 |
Tekla Oyj (A Shares) | 344,180 | | 2,886 |
TOTAL FINLAND | | 11,226 |
France - 3.2% |
BVRP Software SA (a) | 98,706 | | 1,914 |
Carbone Lorraine | 27,400 | | 1,526 |
Carrefour SA | 50,000 | | 3,047 |
Constructions Industrielles dela Mediterranee SA | 9,300 | | 1,319 |
Common Stocks - continued |
| Shares | | Value (Note 1) (000s) |
France - continued |
Electricite de France | 90,900 | | $ 5,512 |
Groupe Open SA (a)(d) | 51,442 | | 867 |
Groupe Promeo | 32,130 | | 1,538 |
Guerbet SA | 8,400 | | 1,406 |
Icade SA | 435,318 | | 25,843 |
Sechilienne-Sidec | 94,320 | | 3,612 |
Tessi SA | 43,953 | | 2,776 |
The Lisi Group | 22,500 | | 1,581 |
Veolia Environnement | 166,000 | | 10,164 |
TOTAL FRANCE | | 61,105 |
Germany - 3.1% |
Articon-Integralis AG (Reg.) (a) | 195,779 | | 825 |
Deutz AG (a)(d) | 1,027,100 | | 10,344 |
E.ON AG | 93,000 | | 11,196 |
ElringKlinger AG | 18,284 | | 972 |
Fresenius Medical Care AG | 108,100 | | 14,424 |
Grenkeleasing AG | 25,918 | | 1,069 |
Kontron AG | 120,300 | | 1,749 |
Merck KGaA | 18,831 | | 1,985 |
Parsytec AG (a) | 153,836 | | 1,198 |
Pfleiderer AG | 164,259 | | 4,462 |
PSI AG (a) | 387,761 | | 2,227 |
Pulsion Medical Systems AG (a) | 98,511 | | 742 |
RWE AG | 52,000 | | 5,139 |
SGL Carbon AG (a) | 200,700 | | 4,396 |
TOTAL GERMANY | | 60,728 |
Greece - 0.9% |
Autohellas SA | 259,430 | | 1,556 |
Fourlis Holdings SA | 110,000 | | 2,134 |
Marfin Financial Group Holdings SA | 45,000 | | 2,270 |
Sarantis SA (Reg.) | 1,159,018 | | 11,243 |
TOTAL GREECE | | 17,203 |
Hong Kong - 1.2% |
Bank of East Asia Ltd. | 275,000 | | 1,314 |
Cafe de Coral Holdings Ltd. | 976,000 | | 1,526 |
China Overseas Land & Investment Ltd. | 1,424,000 | | 1,298 |
Citic International Financial Holdings Ltd. | 858,000 | | 576 |
CNPC (Hong Kong) Ltd. | 3,180,000 | | 1,595 |
Esprit Holdings Ltd. | 389,000 | | 3,766 |
Common Stocks - continued |
| Shares | | Value (Note 1) (000s) |
Hong Kong - continued |
Fairwood Holdings Ltd. (f) | 928,500 | | $ 920 |
Hong Kong Aircraft & Engineering Co. | 11,200 | | 142 |
Industrial & Commercial Bank of China (Asia) Ltd. | 820,000 | | 1,421 |
Li & Fung Ltd. | 924,000 | | 2,418 |
Lifestyle International Holdings Ltd. | 451,000 | | 874 |
Sa Sa International Holdings Ltd. | 1,028,000 | | 365 |
Tai Cheung Holdings Ltd. | 1,384,000 | | 683 |
Vtech Holdings Ltd. | 882,000 | | 4,434 |
Wing Lung Bank Ltd. | 122,700 | | 1,167 |
TOTAL HONG KONG | | 22,499 |
India - 0.2% |
Great Eastern Energy Corp. Ltd. GDR | 909,000 | | 2,124 |
Noida Toll Bridge Co. Ltd. GDR | 454,051 | | 1,975 |
TOTAL INDIA | | 4,099 |
Indonesia - 0.1% |
PT Bank Niaga Tbk | 15,019,000 | | 1,434 |
PT Perushahaan Perkebunan London Sumatra Tbk | 1,526,500 | | 775 |
PT Telkomunikasi Indonesia Tbk Series B | 592,000 | | 546 |
TOTAL INDONESIA | | 2,755 |
Ireland - 0.7% |
Adwalker PLC (a)(e) | 9,125,000 | | 413 |
Glanbia PLC | 1,135,500 | | 4,348 |
Kenmare Resources PLC (a) | 2,640,000 | | 1,964 |
Kenmare Resources PLC warrants 7/23/09 (a) | 1,712,500 | | 751 |
Minco PLC (a) | 300,000 | | 47 |
Petroceltic International PLC (a)(d) | 13,644,934 | | 3,384 |
Providence Resources PLC (a) | 1,675,130 | | 141 |
Trinity Biotech PLC sponsored ADR (a) | 227,325 | | 2,085 |
Vimio PLC (a) | 867,300 | | 935 |
TOTAL IRELAND | | 14,068 |
Israel - 0.6% |
Advanced Vision Technology Ltd. (a) | 133,900 | | 1,786 |
Israel Chemicals Ltd. | 611,900 | | 3,495 |
Leadcom Integrated Solutions | 3,601,400 | | 4,053 |
Metal-Tech Ltd. | 575,500 | | 1,756 |
MTI Wireless Edge Ltd. | 705,128 | | 632 |
TOTAL ISRAEL | | 11,722 |
Common Stocks - continued |
| Shares | | Value (Note 1) (000s) |
Italy - 2.9% |
Banca Italease Spa | 790,700 | | $ 44,157 |
Bastogi Spa (a) | 3,339,200 | | 861 |
Enel Spa ADR | 543,800 | | 5,220 |
ERG Spa | 109,100 | | 2,285 |
Lottomatica Spa | 81,000 | | 2,957 |
Teleunit Spa (e) | 12,719,158 | | 1,122 |
TOTAL ITALY | | 56,602 |
Japan - 31.2% |
Abc-Mart, Inc. | 320,300 | | 7,230 |
Access Co. Ltd. (a) | 515 | | 1,013 |
Access Co. Ltd. (a)(d) | 181 | | 1,206 |
Advanced Media, Inc. (a) | 64 | | 167 |
Aeon Fantasy Co. Ltd. | 55,300 | | 1,967 |
Aichi Steel Corp. (d) | 280,000 | | 1,666 |
Ain Pharmaciez, Inc. | 38,000 | | 695 |
Alpen Co. Ltd. | 51,200 | | 1,541 |
AOC Holdings, Inc. | 70,500 | | 1,278 |
AOI Electronics Co. Ltd. | 79,000 | | 1,800 |
Ariake Japan Co. Ltd. (d) | 115,300 | | 2,119 |
Asahi Diamond Industrial Co. Ltd. | 231,000 | | 1,523 |
Asics Corp. | 137,000 | | 1,835 |
Asset Managers Co. Ltd. (d) | 931 | | 2,547 |
Atect Corp. | 17,100 | | 224 |
Atrium Co. Ltd. | 98,700 | | 3,367 |
Axell Corp. | 490 | | 1,550 |
Bic Camera, Inc. | 48 | | 67 |
Bit-isle, Inc. | 284 | | 1,428 |
Bookoff Corp. | 151,200 | | 2,760 |
C. Uyemura & Co. Ltd. | 42,400 | | 2,799 |
Canon Fintech, Inc. | 72,900 | | 1,318 |
Casio Micronics Co. Ltd. | 181,900 | | 2,003 |
Chiba Bank Ltd. | 458,000 | | 4,104 |
Chiyoda Corp. | 129,000 | | 2,338 |
Chugoku Marine Paints Ltd. | 49,000 | | 307 |
Chuo Denki Kogyo Co. Ltd. (d) | 30,000 | | 114 |
CMIC Co. Ltd. (d) | 1,990 | | 521 |
Create SD Co. Ltd. | 65,900 | | 1,076 |
Daido Metal Co. Ltd. (d) | 784,000 | | 5,175 |
Daido Steel Co. Ltd. | 1,192,000 | | 7,776 |
Daikokutenbussan Co. Ltd. | 44,100 | | 914 |
Daiseki Co. Ltd. | 79,500 | | 1,920 |
Common Stocks - continued |
| Shares | | Value (Note 1) (000s) |
Japan - continued |
Daito Gyorui Co. Ltd. | 93,000 | | $ 200 |
Daiwa Securities Group, Inc. | 158,000 | | 1,793 |
Daiwabo Information System Ltd. (d) | 285,500 | | 3,586 |
Denyo Co. Ltd. | 49,600 | | 537 |
Descente Ltd. (d) | 220,000 | | 1,117 |
Ebara Corp. (d) | 311,000 | | 1,215 |
Eiken Chemical Co. Ltd. | 122,700 | | 1,194 |
Elpida Memory, Inc. (a) | 41,100 | | 1,919 |
Endo Lighting Corp. | 177,900 | | 1,688 |
EPS Co. Ltd. (d) | 996 | | 2,333 |
Fast Retailing Co. Ltd. | 48,500 | | 4,590 |
FCC Co. Ltd. (d) | 71,800 | | 1,651 |
FinTech Global, Inc. (d) | 1,812 | | 1,642 |
Fujikura Ltd. (d) | 1,999,000 | | 21,381 |
Fullcast Co. Ltd. (d) | 1,033 | | 3,047 |
Furukawa Electric Co. Ltd. | 956,000 | | 6,825 |
Futaba Industrial Co. Ltd. (d) | 102,000 | | 2,333 |
Gentosha, Inc. (d) | 111 | | 459 |
Hamamatsu Photonics KK (d) | 145,100 | | 4,193 |
Harmonic Drive Systems, Inc. | 306 | | 1,672 |
Haseko Corp. (a)(d) | 876,500 | | 3,013 |
Heiwa Real Estate Co. Ltd. (d) | 290,000 | | 1,946 |
Hikari Tsushin, Inc. | 247,800 | | 13,051 |
Hioki EE Corp. | 32,300 | | 994 |
Hiroshima Bank Ltd. | 451,000 | | 2,695 |
Hitachi Construction Machinery Co. Ltd. | 369,900 | | 8,792 |
Hitachi Maxell Ltd. | 138,500 | | 2,031 |
Hokuriku Electric Industry (d) | 882,000 | | 2,519 |
Hokuto Corp. | 178,900 | | 2,941 |
Ibiden Co. Ltd. | 34,000 | | 1,782 |
Inpex Holdings, Inc. | 235 | | 1,921 |
Intelligence Ltd. (d) | 718 | | 1,559 |
Internet Research Institute, Inc. (d) | 1,474 | | 916 |
Iriso Electronics Co. Ltd. | 62,400 | | 2,241 |
Ishihara Chemical Co. Ltd. | 38,500 | | 762 |
Ishikawajima-Harima Heavy Industries Co. Ltd. | 1,408,000 | | 4,743 |
Itochu Corp. | 734,000 | | 5,849 |
ITOCHU Techno-Solutions Corp. (d) | 21,600 | | 1,208 |
Japan Communications, Inc. (a)(d) | 333 | | 104 |
Japan Digital Contents Trust, Inc. (a) | 725 | | 209 |
Jastec Co. Ltd. | 141,300 | | 1,258 |
JGC Corp. | 108,000 | | 1,681 |
Common Stocks - continued |
| Shares | | Value (Note 1) (000s) |
Japan - continued |
Joint Corp. | 33,000 | | $ 1,298 |
JSR Corp. | 126,300 | | 3,175 |
Juroku Bank Ltd. | 179,000 | | 1,015 |
Kakaku.com, Inc. (d) | 607 | | 1,806 |
Kenedix, Inc. | 312 | | 1,753 |
Kibun Food Chemifa Co. Ltd. (d) | 66,900 | | 677 |
Kitagawa Seiki Co. Ltd. | 31,500 | | 225 |
KK daVinci Advisors (a) | 2,823 | | 3,089 |
Kobayashi Pharmaceutical Co. Ltd. | 109,400 | | 4,200 |
Koito Manufacturing Co. Ltd. | 149,000 | | 2,106 |
Konica Minolta Holdings, Inc. (d) | 479,000 | | 6,381 |
Kubota Corp. | 59,000 | | 516 |
Kura Corp. Ltd. | 4,979 | | 11,537 |
Kurita Water Industries Ltd. | 86,800 | | 1,774 |
Link Theory Holdings Co. Ltd. (d) | 120 | | 228 |
Lintec Corp. | 150,300 | | 3,431 |
Mandom Corp. | 25,200 | | 614 |
Mazda Motor Corp. | 940,000 | | 6,357 |
Media Global Links Co. Ltd. | 473 | | 1,209 |
Meganesuper Co. Ltd. | 20 | | 0 |
Meiko Electronics Co. Ltd. | 141,300 | | 5,678 |
Micronics Japan Co. Ltd. (d) | 200,100 | | 5,680 |
Mitsuba Corp. | 277,000 | | 2,027 |
Mitsubishi Gas Chemical Co., Inc. | 985,000 | | 9,382 |
Mitsubishi Materials Corp. (d) | 433,000 | | 1,707 |
Mitsubishi Rayon Co. Ltd. | 99,000 | | 625 |
Mitsui Engineering & Shipbuilding Co. | 770,000 | | 2,870 |
Mitsui O.S.K. Lines Ltd. | 705,000 | | 5,877 |
Miyachi Corp. | 39,100 | | 690 |
Mori Seiki Co. Ltd. (d) | 93,600 | | 1,957 |
Murata Manufacturing Co. Ltd. | 131,000 | | 9,162 |
Nabtesco Corp. | 132,000 | | 1,586 |
Nachi-Fujikoshi Corp. | 1,045,000 | | 5,191 |
Nafco Co. Ltd. | 34,600 | | 958 |
NEOMAX Co. Ltd. (d) | 325,000 | | 5,974 |
NGK Spark Plug Co. Ltd. (d) | 631,000 | | 13,299 |
NHK Spring Co. Ltd. | 321,000 | | 3,549 |
NIC Corp. | 224,900 | | 1,850 |
Nidec Copal Electronics Corp. (d) | 308,900 | | 2,113 |
Nidec Corp. | 44,100 | | 3,375 |
Nihon Ceratec Co. Ltd. (d) | 283 | | 733 |
Nihon Dempa Kogyo Co. Ltd. (d) | 327,400 | | 13,436 |
Common Stocks - continued |
| Shares | | Value (Note 1) (000s) |
Japan - continued |
Nihon Micro Coating Co. Ltd. | 35,600 | | $ 258 |
Nihon Trim Co. Ltd. (d) | 193,500 | | 9,314 |
Nihonwasou Holdings, Inc. | 6 | | 6 |
Nikkiso Co. Ltd. | 316,000 | | 2,713 |
Nippon Chemiphar Co. Ltd. (a)(d) | 301,000 | | 1,969 |
Nippon Denko Co. Ltd. (d) | 1,904,000 | | 7,456 |
Nippon Mining Holdings, Inc. | 77,000 | | 575 |
Nippon Oil Corp. | 204,000 | | 1,517 |
Nippon Paint Co. Ltd. | 970,000 | | 5,208 |
Nippon Seiki Co. Ltd. | 757,000 | | 18,090 |
Nippon Soda Co. Ltd. (a) | 330,000 | | 1,744 |
Nissei Corp. | 97,900 | | 963 |
Nissin Kogyo Co. Ltd. | 968,100 | | 23,176 |
NOK Corp. | 732,700 | | 19,232 |
Noritake Co. Ltd. | 287,000 | | 1,453 |
NTN Corp. | 165,000 | | 1,359 |
Obara Corp. | 1,100 | | 43 |
Oiles Corp. | 64,500 | | 1,530 |
Optex Co. Ltd. (d) | 32,400 | | 906 |
Optoelectronics Co. Ltd. | 37,100 | | 980 |
Otaki Gas Co. Ltd. | 15,000 | | 78 |
Otsuka Corp. (d) | 23,100 | | 2,536 |
Pacific Metals Co. Ltd. | 154,000 | | 1,323 |
Phoenix Electric Co. Ltd. (d) | 238,100 | | 1,460 |
Pigeon Corp. (d) | 68,800 | | 1,259 |
Produce Co. Ltd. | 364 | | 2,652 |
Ray Corp. | 189,100 | | 404 |
Rex Holdings Co. Ltd. (d) | 1,683 | | 2,921 |
Round One Corp. | 569 | | 2,325 |
Royal Holdings Co. Ltd. | 84,700 | | 1,167 |
Ryobi Ltd. | 254,000 | | 2,026 |
Saison Information Systems Co. Ltd. | 118,300 | | 1,135 |
Saizeriya Co. Ltd. (d) | 73,700 | | 965 |
Sammy NetWorks Co. Ltd. (d) | 1,083 | | 5,648 |
Sanyo Special Steel Co. Ltd. | 143,000 | | 952 |
Sato Corp. | 201,200 | | 3,819 |
Sawai Pharmaceutical Co. Ltd. (d) | 48,800 | | 2,257 |
SBI Holdings, Inc. | 2,969 | | 1,084 |
Sega Sammy Holdings, Inc. | 62,100 | | 1,561 |
Sekisui Plastics Co. Ltd. | 128,000 | | 439 |
Seria Co. Ltd. | 577 | | 977 |
Common Stocks - continued |
| Shares | | Value (Note 1) (000s) |
Japan - continued |
Shaddy Co. Ltd. (d) | 142,000 | | $ 1,808 |
Shibaura Electronics Co. Ltd. | 121,300 | | 2,152 |
Shikoku Chemicals Corp. (d) | 105,000 | | 614 |
Shin-Kobe Electric Machinery Co. Ltd. | 104,000 | | 554 |
Shinohara Systems of Construction Co. Ltd. (a) | 345 | | 767 |
Shizuki Electric Co., Inc. | 405,000 | | 1,766 |
Showa Denko KK | 569,000 | | 2,481 |
St. Marc Holdings Co. Ltd. | 18,500 | | 1,237 |
Star Micronics Co. Ltd. | 256,400 | | 4,768 |
Starbucks Coffee Japan Ltd. | 2,348 | | 1,016 |
Stella Chemifa Corp. (d) | 58,200 | | 1,951 |
Sumco Corp. | 42,400 | | 3,016 |
Sumitomo Corp. | 481,100 | | 6,326 |
Sumitomo Metal Industries Ltd. | 827,000 | | 3,111 |
Sumitomo Metal Mining Co. Ltd. | 290,000 | | 3,811 |
Sumitomo Titanium Corp. (d) | 15,200 | | 1,805 |
Sumitomo Trust & Banking Co. Ltd. | 186,000 | | 2,001 |
Sun Frontier Fudousan Co. Ltd. | 450 | | 1,027 |
Sunx Ltd. | 284,100 | | 3,031 |
Sysmex Corp. (d) | 84,100 | | 3,387 |
T&D Holdings, Inc. | 21,800 | | 1,594 |
Taisei Corp. | 283,000 | | 963 |
Taiyo Ink Manufacturing Co. Ltd. | 58,000 | | 3,065 |
Taiyo Kagaku | 87,800 | | 897 |
Taiyo Nippon Sanso Corp. Tokyo | 366,000 | | 3,217 |
Takiron Co. Ltd. | 337,000 | | 1,184 |
Telewave, Inc. (d) | 3,307 | | 6,588 |
The First Energy Service Co. Ltd. (a)(d) | 165 | | 175 |
Toagosei Co. Ltd. | 423,000 | | 1,624 |
Toc Co. Ltd. | 78,500 | | 428 |
Tohcello Co. Ltd. | 135,500 | | 1,732 |
Tokai Carbon Co. Ltd. (d) | 180,000 | | 1,216 |
Token Corp. (d) | 153,710 | | 11,604 |
Tokuyama Corp. | 122,000 | | 1,535 |
Tokyo Gas Co. Ltd. (d) | 297,000 | | 1,516 |
Tokyo Seimitsu Co. Ltd. | 12,600 | | 609 |
Tomen Devices Corp. | 65,100 | | 1,350 |
TonenGeneral Sekiyu KK (d) | 147,000 | | 1,400 |
Toray Industries, Inc. | 188,000 | | 1,355 |
Toshiba Machine Co. Ltd. | 328,000 | | 2,961 |
Toyo Ink Manufacturing Co. Ltd. | 127,000 | | 513 |
Trancom Co. Ltd. | 83,800 | | 1,594 |
Common Stocks - continued |
| Shares | | Value (Note 1) (000s) |
Japan - continued |
Trend Micro, Inc. | 57,500 | | $ 1,844 |
Tyo Productions, Inc. (d) | 101,500 | | 399 |
Ulvac, Inc. | 55,600 | | 1,631 |
Unicom Group Holdings, Inc. | 154,500 | | 1,878 |
Usen Corp. (d) | 205,690 | | 2,040 |
V Technology Co. Ltd. (d) | 145 | | 707 |
Village Vanguard Co. Ltd. (d) | 163 | | 985 |
Wacom Co. Ltd. (d) | 334 | | 742 |
Wiz Co. Ltd. | 297 | | 853 |
Yachiyo Industry Co. Ltd. | 76,600 | | 1,772 |
Yahoo! Japan Corp. | 1,836 | | 714 |
Yamada Denki Co. Ltd. | 123,990 | | 12,340 |
Yaskawa Electric Corp. (d) | 271,000 | | 2,892 |
Yokogawa Electric Corp. | 247,900 | | 3,402 |
Yoshimoto Kogyo Co. Ltd. | 52,900 | | 963 |
TOTAL JAPAN | | 603,439 |
Korea (South) - 0.7% |
CDNetworks Co. Ltd. (a) | 827 | | 28 |
Hite Brewery Co. Ltd. | 4,633 | | 551 |
Korean Reinsurance Co. | 61,966 | | 700 |
LG Dacom Corp. | 70,720 | | 1,644 |
LG Household & Health Care Ltd. | 28,820 | | 2,661 |
NHN Corp. | 8,466 | | 840 |
Nice e-Banking Services | 8,970 | | 371 |
Orion Corp. | 3,590 | | 972 |
Pyeong San Co. Ltd. | 14,925 | | 384 |
SFA Engineering Corp. | 25,920 | | 812 |
SK Corp. | 11,180 | | 820 |
STX Pan Ocean Co. Ltd. | 2,327,000 | | 1,285 |
Taewoong Co. Ltd. | 49,925 | | 1,380 |
YBM Sisa.com, Inc. | 71,707 | | 1,549 |
TOTAL KOREA (SOUTH) | | 13,997 |
Luxembourg - 0.3% |
SES Global SA FDR (France) | 319,100 | | 4,892 |
Malaysia - 0.2% |
Kulim Malaysia BHD | 1,300,400 | | 1,659 |
Steppe Cement Ltd. (a) | 636,100 | | 2,305 |
TOTAL MALAYSIA | | 3,964 |
Common Stocks - continued |
| Shares | | Value (Note 1) (000s) |
Netherlands - 0.3% |
Bateman Engineering NV | 349,377 | | $ 2,006 |
Engel East Europe NV | 1,448,532 | | 3,295 |
TOTAL NETHERLANDS | | 5,301 |
New Zealand - 0.6% |
Fisher & Paykel Healthcare Corp. | 1,509,151 | | 4,227 |
Freightways Ltd. | 353,460 | | 959 |
Sky City Entertainment Group Ltd. | 1,781,777 | | 6,149 |
TOTAL NEW ZEALAND | | 11,335 |
Norway - 2.3% |
Aker Kvaerner ASA | 22,550 | | 2,346 |
Camillo Eitzen & Co. ASA (d) | 252,400 | | 2,848 |
Eitzen Maritime Services ASA (a)(d) | 68,425 | | 25 |
Fred Olsen Energy ASA (a)(d) | 25,500 | | 1,100 |
Hafslund ASA (B Shares) | 369,270 | | 6,779 |
Pertra AS (A Shares) (a) | 175,642 | | 1,720 |
ProSafe ASA | 172,000 | | 10,999 |
Schibsted ASA (B Shares) | 48,600 | | 1,472 |
Songa Offshore ASA (a) | 751,186 | | 6,694 |
Stepstone ASA (a) | 4,710,000 | | 8,286 |
TANDBERG ASA | 263,700 | | 3,046 |
TOTAL NORWAY | | 45,315 |
Papua New Guinea - 0.2% |
Oil Search Ltd. | 1,136,300 | | 3,008 |
Singapore - 2.3% |
Advent Air Ltd. (e) | 14,719,299 | | 2,948 |
Banyan Tree Holdings Ltd. | 1,038,000 | | 627 |
Cosco Corp. Singapore Ltd. | 3,949,000 | | 4,868 |
CSE Global Ltd. | 1,038,000 | | 766 |
DBS Group Holdings Ltd. | 87,000 | | 1,140 |
GigaMedia Ltd. (a) | 355,600 | | 3,439 |
HTL International Holdings Ltd. | 673,375 | | 510 |
Keppel Corp. Ltd. | 174,000 | | 1,765 |
Keppel Land Ltd. | 823,000 | | 2,906 |
Osim International Ltd. | 1,741,000 | | 1,889 |
Parkway Holdings Ltd. | 3,746,000 | | 6,663 |
SembCorp Marine Ltd. | 809,000 | | 1,777 |
SIA Engineering Co. Ltd. | 1,538,000 | | 3,693 |
Singapore Petroleum Co. Ltd. | 199,000 | | 580 |
Uol Group Ltd. | 2,329,000 | | 5,982 |
Common Stocks - continued |
| Shares | | Value (Note 1) (000s) |
Singapore - continued |
Want Want Holdings Ltd. | 2,077,000 | | $ 3,718 |
Yanlord Land Group Ltd. | 547,000 | | 509 |
TOTAL SINGAPORE | | 43,780 |
South Africa - 1.7% |
Barnard Jacobs Mellet Holdings Ltd. | 2,661,840 | | 1,742 |
MTN Group Ltd. | 377,102 | | 3,430 |
Steinhoff International Holdings Ltd. | 6,659,732 | | 21,698 |
Telkom SA Ltd. | 146,300 | | 2,716 |
Wilson Bayly Holmes-Ovcon Ltd. | 446,856 | | 4,198 |
TOTAL SOUTH AFRICA | | 33,784 |
Sweden - 1.1% |
Hexagon AB (B Shares) (d) | 239,511 | | 8,921 |
Modern Times Group AB (MTG) (B Shares) | 227,750 | | 13,118 |
TOTAL SWEDEN | | 22,039 |
Switzerland - 0.3% |
Actelion Ltd. (Reg.) (a) | 16,588 | | 2,793 |
Arpida Ltd. (a) | 8,195 | | 192 |
Bucher Holding AG | 15,811 | | 1,601 |
Sulzer AG (Reg.) | 2,070 | | 1,822 |
TOTAL SWITZERLAND | | 6,408 |
Taiwan - 0.6% |
China Life Insurance Co. Ltd. (a) | 2,916,000 | | 1,433 |
High Tech Computer Corp. | 33,000 | | 821 |
Hung Poo Real Estate Development Co. Ltd. | 966,000 | | 1,069 |
KEE TAI Properties Co. Ltd. (a) | 1,920,000 | | 1,126 |
Shin Kong Financial Holding Co. Ltd. | 1,896,700 | | 1,681 |
Sinyi Realty, Inc. | 697,000 | | 1,681 |
Taiwan Chi Cheng Enterprise Co. Ltd. | 580,000 | | 1,547 |
Taiwan Fertilizer Co. Ltd. | 910,000 | | 1,481 |
TOTAL TAIWAN | | 10,839 |
Thailand - 0.3% |
Aromatics (Thailand) PCL | 931,500 | | 889 |
Bumrungrad Hospital PCL (For. Reg.) | 2,926,900 | | 2,932 |
Robinson Department Store PCL (For. Reg.) (a) | 1,281,100 | | 395 |
Total Access Communication PCL (a) | 311,200 | | 1,245 |
TOTAL THAILAND | | 5,461 |
Common Stocks - continued |
| Shares | | Value (Note 1) (000s) |
Turkey - 0.2% |
Dogan Gazetecilik AS (a) | 1,979,955 | | $ 3,777 |
KOZA, Inc. (a) | 93,000 | | 578 |
TOTAL TURKEY | | 4,355 |
United Kingdom - 19.1% |
Accuma Group PLC (a) | 507,663 | | 2,445 |
Advanced Fluid Connection PLC (a) | 7,009,687 | | 0 |
Advanced Technology PLC (a)(e) | 7,355,000 | | 0 |
ADVFN PLC (a) | 20,254,200 | | 1,120 |
AeroBox PLC (a) | 5,694,657 | | 57 |
Afren PLC (a)(d) | 8,430,660 | | 7,679 |
African Consolidated Resources PLC | 7,758,334 | | 1,295 |
African Copper PLC (a) | 1,677,884 | | 2,096 |
Air Partner PLC | 45,000 | | 698 |
Alliance Pharma PLC (a) | 7,984,200 | | 2,132 |
Alterian PLC (a) | 1,020,800 | | 2,230 |
Amlin PLC | 206,973 | | 1,189 |
Andor Technology Ltd. (a) | 313,644 | | 515 |
Anglo Asian Mining PLC (a) | 4,744,400 | | 1,855 |
Angus & Ross PLC (a) | 4,124,200 | | 1,357 |
Angus & Ross PLC (a)(g) | 2,566,117 | | 760 |
Appian Technology PLC (a) | 4,869,178 | | 720 |
Appian Technology PLC warrants 2/28/08 (a)(g) | 479,045 | | 58 |
Ascent Resources PLC (a) | 11,792,400 | | 2,812 |
Ascent Resources PLC warrants 12/22/07 (a) | 1,500,000 | | 102 |
Asia Energy PLC (a) | 1,478,451 | | 2,623 |
Atrium Underwriting PLC | 257,060 | | 1,109 |
Autoclenz Holdings PLC | 422,000 | | 910 |
Avanti Screenmedia Group PLC (a)(e) | 1,410,260 | | 9,335 |
Avation PLC (a) | 1,526,929 | | 0 |
Baltic Oil Terminals PLC | 1,758,000 | | 6,707 |
Belitung Zinc Corp. PLC (g) | 7,435,490 | | 1,418 |
BioCare Solutions plc (e) | 5,174,719 | | 2,270 |
Bioprogress PLC (a)(e) | 8,454,910 | | 9,152 |
Blackstar Investors PLC | 2,870,000 | | 5,885 |
Block Shield Corp. PLC (a) | 1,103,400 | | 2,547 |
BowLeven PLC (a) | 1,115,160 | | 4,159 |
British Energy Group PLC (a) | 302,200 | | 2,424 |
Cambrian Mining PLC (e) | 6,402,100 | | 15,845 |
Camco International Ltd. | 868,900 | | 854 |
Cardpoint PLC (a) | 345,300 | | 566 |
CareCapital Group PLC | 1,847,500 | | 1,163 |
Common Stocks - continued |
| Shares | | Value (Note 1) (000s) |
United Kingdom - continued |
Celsis International PLC (a) | 788,248 | | $ 2,842 |
Central African Mining & Exploration Co. PLC (a) | 12,663,119 | | 10,749 |
Centurion Electronics PLC (a)(e) | 880,024 | | 432 |
Ceres Power Holding PLC (a) | 329,370 | | 1,520 |
Chaco Resources PLC (a) | 10,430,720 | | 2,437 |
Clapham House Group PLC (a) | 494,150 | | 2,295 |
Cobra Biomanufacturing PLC (a) | 396,900 | | 352 |
Coffeeheaven International PLC (a) | 4,440,240 | | 2,880 |
Corac Group PLC (a)(e) | 5,224,104 | | 3,538 |
Corin Group PLC | 742,614 | | 3,683 |
Countermine PLC (a)(g) | 4,939 | | 243 |
Countermine PLC warrants 7/26/06 (a)(g) | 4,939 | | 0 |
CustomVis PLC (a) | 1,558,936 | | 134 |
DA Group PLC (a)(e) | 1,800,165 | | 1,236 |
Datacash Group PLC | 720,000 | | 2,019 |
Dominion Energy PLC (a) | 10,531,300 | | 1,708 |
Domino's Pizza UK & IRL PLC | 1 | | 0 |
Dream Direct Group PLC (a) | 145,000 | | 90 |
Eclipse Energy Co. Ltd. (a)(g) | 102,000 | | 1,459 |
Econergy International PLC | 675,000 | | 1,178 |
Emerald Energy PLC (a) | 552,500 | | 2,034 |
EnCore Oil PLC (a) | 2,690,530 | | 1,527 |
Eureka Mining PLC (a) | 381,700 | | 419 |
Europa Oil & Gas Holdings PLC (a) | 1,000,000 | | 463 |
Europa Oil & Gas Holdings PLC warrants 11/11/07 (a) | 500,000 | | 36 |
European Diamonds PLC (a) | 124,300 | | 25 |
Faroe Petroleum PLC (a) | 1,439,666 | | 3,295 |
Financial Payment Systems Ltd. (a)(e) | 7,787,504 | | 1,485 |
Firestone Diamonds PLC (a) | 1,518,100 | | 3,316 |
Flomerics Group PLC | 449,658 | | 643 |
Forum Energy PLC (a) | 1,419,770 | | 2,383 |
Gasol PLC (a)(e) | 7,750,800 | | 1,257 |
Gemfields Resources PLC (e) | 6,234,200 | | 5,589 |
GMA Resources PLC (a)(e) | 22,946,083 | | 3,939 |
Goals Soccer Centres PLC | 438,850 | | 2,323 |
Golden Prospect PLC | 1,457,800 | | 1,439 |
Goldshield Group PLC | 297,470 | | 1,406 |
Gyrus Group PLC (a) | 486,400 | | 3,363 |
Hallin Marine Subsea International PLC | 1,047,700 | | 1,109 |
Hambledon Mining PLC (a) | 6,343,200 | | 1,512 |
Hardide Ltd. (a)(e) | 8,154,400 | | 1,711 |
Healthcare Enterprise Group PLC (a)(e) | 16,540,108 | | 1,010 |
Common Stocks - continued |
| Shares | | Value (Note 1) (000s) |
United Kingdom - continued |
Hot Tuna International PLC (a) | 2,349,400 | | $ 851 |
Hot Tuna International PLC warrants 2/25/08 (a)(g) | 1,179,700 | | 10 |
Hydrodec Group PLC (a)(e) | 13,277,286 | | 8,231 |
ID Data PLC (a)(e) | 84,350,500 | | 925 |
Ideal Shopping Direct PLC | 661,592 | | 3,231 |
Impact Holdings PLC (a)(e) | 10,414,000 | | 2,086 |
Indago Petroleum Ltd. | 2,939,846 | | 2,523 |
Inova Holding PLC | 1,443,461 | | 771 |
Intec Telecom Systems PLC (a) | 1,950,570 | | 1,488 |
Interbulk Investments PLC (a)(e) | 4,899,600 | | 1,682 |
International Con Minerals Ltd. (a)(g) | 2,659,964 | | 798 |
International Con Minerals Ltd. warrants 10/31/07 (a)(g) | 1,329,982 | | 0 |
Intertek Group PLC | 94,110 | | 1,477 |
iomart Group PLC | 2,037,940 | | 3,207 |
IPSA Group PLC (a) | 2,184,605 | | 1,823 |
Irvine Energy PLC (a) | 12,895,900 | | 524 |
ITE Group PLC | 2,420,640 | | 6,568 |
ITM Power PLC (a) | 3,196,490 | | 8,094 |
Jubilee Platinum PLC (a)(e) | 7,171,303 | | 8,789 |
Kalahari Minerals PLC | 3,563,200 | | 1,054 |
KBC Advanced Technologies PLC (a) | 917,600 | | 630 |
Keronite PLC (a)(g) | 13,620,267 | | 1,559 |
KimCor Diamonds PLC (e) | 4,285,000 | | 1,185 |
KimCor Diamonds PLC warrants 3/15/08 (a) | 2,185,000 | | 240 |
Landround PLC (a)(e) | 358,600 | | 188 |
Lansdowne Oil & Gas PLC | 907,620 | | 1,039 |
Lawrence PLC | 964,599 | | 5,465 |
London Asia Chinese Private Equity Fund Ltd. warrants 3/31/11 (a) | 105,400 | | 53 |
LTG Technologies PLC (a)(e) | 19,449,772 | | 1,948 |
Max Petroleum PLC (d) | 11,461,320 | | 21,097 |
Metals Exploration PLC (a)(e) | 3,945,316 | | 2,126 |
Michelmersh Brick Holdings PLC | 109,600 | | 225 |
MicroEmissive Displays (a)(e) | 3,022,300 | | 1,672 |
Motivcom PLC (e) | 1,936,600 | | 3,085 |
NeutraHealth PLC (a) | 6,488,100 | | 1,176 |
Pan African Resources PLC (a) | 3,455,600 | | 338 |
Peninsular Gold Ltd. (a) | 350,000 | | 327 |
PetroLatina Energy PLC (a) | 4,545,755 | | 1,626 |
PetroLatina Energy PLC warrants 4/30/07 (a) | 2,279,573 | | 7 |
Pilat Media Global PLC (a) | 1,026,000 | | 1,365 |
Common Stocks - continued |
| Shares | | Value (Note 1) (000s) |
United Kingdom - continued |
Platinum Mining Corp. of India PLC (a)(e) | 12,070,800 | | $ 2,418 |
Plethora Solutions Holdings PLC (a) | 431,818 | | 1,594 |
PlusNet Technologies Ltd. (a) | 1,409,404 | | 5,242 |
Proteome Sciences PLC (a) | 780,842 | | 957 |
Pureprofile Media PLC (g) | 1,108,572 | | 1,057 |
Pursuit Dynamics PLC (a) | 666,667 | | 1,055 |
Rambler Metals & Mining PLC (a) | 1,300,000 | | 1,017 |
Rheochem PLC (a)(e) | 7,753,300 | | 2,034 |
Rheochem PLC warrants 12/21/07 (a) | 4,364,150 | | 105 |
Ridge Mining PLC (a) | 1,739,800 | | 1,477 |
Sarantel Group PLC Class A (a) | 1,819,000 | | 677 |
Scottish & Southern Energy PLC | 209,000 | | 5,238 |
SDL PLC (a) | 948,100 | | 3,979 |
Serabi Mining PLC (a) | 1,590,800 | | 910 |
Sibir Energy PLC (a) | 84,580 | | 653 |
Sinclair Pharma PLC (a) | 2,521,696 | | 5,556 |
Sinosoft Technology PLC | 4,618,900 | | 1,498 |
Solomon Gold PLC (e) | 1,824,300 | | 905 |
SPI Lasers PLC | 565,800 | | 2,024 |
Spice Holdings PLC | 662,000 | | 4,284 |
SR Pharma plc (a) | 2,245,200 | | 749 |
Stem Cell Sciences PLC (a) | 716,649 | | 601 |
Sterling Energy PLC (a) | 3,389,267 | | 1,148 |
Stratex International PLC | 4,191,100 | | 630 |
SubSea Resources PLC (a)(e) | 7,879,100 | | 2,630 |
SubSea Resources PLC warrants 11/4/09 (a) | 1,805,625 | | 284 |
Synchronica PLC (a) | 1,447,320 | | 511 |
Synergy Healthcare PLC | 135,840 | | 1,775 |
Tanfield Group PLC (a) | 6,543,261 | | 5,429 |
Target Resources PLC | 1,020,000 | | 817 |
Target Resources PLC warrants 7/12/08 (a) | 1,020,000 | | 78 |
Tersus Energy PLC (a) | 1,420,122 | | 799 |
Theratase PLC | 1,725,000 | | 2,007 |
Third Advance Value Realisation Co. Ltd. (a) | 507,108 | | 933 |
Tikit Group PLC | 446,100 | | 2,034 |
TMO Biotec (g) | 10,000 | | 572 |
Toledo Mining Corp. PLC (a)(e) | 1,608,144 | | 3,742 |
Triple Plate Junction PLC (a) | 2,463,000 | | 799 |
Triple Plate Junction PLC warrants 5/9/07 (a) | 1,818,750 | | 0 |
Tristel PLC | 30,000 | | 26 |
UK Coal PLC | 809,200 | | 3,774 |
Unibet Group PLC unit | 214,356 | | 4,689 |
Common Stocks - continued |
| Shares | | Value (Note 1) (000s) |
United Kingdom - continued |
Vectura Group PLC (a) | 2,489,400 | | $ 4,392 |
Victoria Oil & Gas PLC (a) | 1,855,000 | | 2,618 |
Virotec International PLC (a) | 6,788,332 | | 2,104 |
Whatman PLC | 280,100 | | 1,549 |
William Ransom & Son PLC | 2,973,100 | | 2,637 |
Windsor PLC | 333,530 | | 309 |
York Pharma PLC (a) | 1,070,000 | | 1,970 |
ZincOx Resources PLC (a) | 693,100 | | 3,305 |
TOTAL UNITED KINGDOM | | 370,240 |
United States of America - 1.5% |
121Media, Inc. (a) | 644,900 | | 11,748 |
Cyberscan Technology, Inc. (a)(e) | 996,527 | | 4,562 |
Frontera Resources Corp. (a) | 1,892,700 | | 1,950 |
Frontier Mining Ltd. (a)(e) | 6,771,600 | | 1,808 |
Solar Integrated Technologies, Inc. (a) | 1,345,573 | | 667 |
Spacelabs Healthcare, Inc. | 707,250 | | 1,727 |
Uramin, Inc. warrants 7/26/08 (a)(g) | 666,666 | | 330 |
UTEK Corp. (d) | 22,500 | | 320 |
XL TechGroup, Inc. (a) | 1,365,380 | | 5,886 |
TOTAL UNITED STATES OF AMERICA | | 28,998 |
TOTAL COMMON STOCKS (Cost $1,554,654) | 1,859,510 |
Nonconvertible Preferred Stocks - 0.1% |
| | | |
United Kingdom - 0.1% |
Third Advance Value Realisation Co. Ltd. (a)
(Cost $1,344) | 757,164 | | 1,401 |
Investment Companies - 0.0% |
| | | |
United Kingdom - 0.0% |
The Greenhouse Fund Ltd. (a)
(Cost $404) | 2,175,000 | | 456 |
Corporate Bonds - 0.3% |
| Principal Amount (000s)(h) | | Value (Note 1) (000s) |
Convertible Bonds - 0.3% |
Canada - 0.3% |
Western Canadian Coal Corp. 7.5% 3/24/11 | CAD | 7,354 | | $ 5,830 |
Nonconvertible Bonds - 0.0% |
Norway - 0.0% |
Songa Offshore ASA 9% 9/8/10 (f) | | $ 600 | | 600 |
TOTAL CORPORATE BONDS (Cost $6,935) | 6,430 |
Money Market Funds - 9.0% |
| Shares | | |
Fidelity Cash Central Fund, 5.34% (b) | 76,978,461 | | 76,978 |
Fidelity Securities Lending Cash Central Fund, 5.35% (b)(c) | 96,528,195 | | 96,528 |
TOTAL MONEY MARKET FUNDS (Cost $173,506) | 173,506 |
TOTAL INVESTMENT PORTFOLIO - 105.4% (Cost $1,736,843) | | 2,041,303 |
NET OTHER ASSETS - (5.4)% | | (104,822) |
NET ASSETS - 100% | $ 1,936,481 |
Currency Abbreviations |
CAD | - | Canadian dollar |
Legend |
(a) Non-income producing |
(b) Affiliated fund that is available only to investment companies and other accounts managed by Fidelity Investments. The rate quoted is the annualized seven-day yield of the fund at period end. A complete unaudited listing of the fund's holdings as of its most recent quarter end is available upon request. |
(c) Investment made with cash collateral received from securities on loan. |
(d) Security or a portion of the security is on loan at period end. |
(e) Affiliated company |
(f) Security exempt from registration under Rule 144A of the Securities Act of 1933. These securities may be resold in transactions exempt from registration, normally to qualified institutional buyers. At the end of the period, the value of these securities amounted to $1,520,000 or 0.1% of net assets. |
(g) Restricted securities - Investment in securities not registered under the Securities Act of 1933 (excluding 144A issues). At the end of the period, the value of restricted securities (excluding 144A issues) amounted to $14,646,000 or 0.8% of net assets. |
Additional information on each holding is as follows: |
Security | Acquisition Date | Acquisition Cost (000s) |
AirSea Lines | 8/4/06 | $ 1,199 |
AirSea Lines warrants 6/14/08 | 8/4/06 | $ 0 |
Angus & Ross PLC | 8/3/06 | $ 969 |
Appian Technology PLC warrants 2/28/08 | 2/18/05 | $ 0 |
Belitung Zinc Corp. PLC | 1/12/06 | $ 1,308 |
Buried Hill Energy (Cyprus) PCL | 8/18/06 | $ 2,142 |
Countermine PLC | 12/22/05 | $ 443 |
Countermine PLC warrants 7/26/06 | 12/22/05 | $ 0 |
Security | Acquisition Date | Acquisition Cost (000s) |
Eclipse Energy Co. Ltd. | 4/28/05 | $ 1,459 |
Hot Tuna International PLC warrants 2/25/08 | 2/14/06 | $ 0 |
International Con Minerals Ltd. | 1/30/06 | $ 798 |
International Con Minerals Ltd. warrants 10/31/07 | 1/30/06 | $ 0 |
Kalahari Energy | 9/1/06 | $ 1,814 |
Keronite PLC | 8/16/06 | $ 1,549 |
Pureprofile Media PLC | 5/3/05 - 1/11/06 | $ 1,173 |
Rock Well Petroleum, Inc. | 4/13/06 | $ 1,004 |
Starfield Resources, Inc. warrants 5/9/07 | 5/18/06 | $ 0 |
Starfield Resources, Inc. warrants 1/21/08 | 1/17/06 | $ 0 |
Stealth Ventures Ltd. warrants 3/12/08 | 9/21/06 | $ 0 |
TMO Biotec | 10/27/05 | $ 535 |
Uramin, Inc. warrants 7/26/08 | 8/24/05 | $ 0 |
(h) Principal amount is stated in United States dollars unless otherwise noted. |
Affiliated Central Funds |
Information regarding fiscal year to date income earned by the Fund from investments in Fidelity Central Funds is as follows: |
Fund | Income earned
(Amounts in thousands) |
Fidelity Cash Central Fund | $ 1,843 |
Fidelity Securities Lending Cash Central Fund | 2,546 |
Total | $ 4,389 |
Other Affiliated Issuers |
An affiliated company is a company in which the fund has ownership of at least 5% of the voting securities. Fiscal year to date transactions with companies which are or were affiliates are as follows: |
Affiliates
(Amounts in thousands) | Value, beginning of period | Purchases | Sales Proceeds | Dividend Income | Value,
end of
period |
121Media, Inc. | $ 1,832 | $ 915 | $ 704 | $ - | $ - |
Advanced Technology PLC | - | - | - | - | - |
Advent Air Ltd. | - | 2,523 | 121 | 19 | 2,948 |
Adwalker PLC | 1,292 | - | - | - | 413 |
Afren PLC | 12,040 | 2,657 | 7,151 | - | - |
Alliance Pharma PLC | 2,924 | - | 318 | - | - |
Ascent Resources PLC | 2,603 | 526 | 1,215 | - | - |
Autoclenz Holdings PLC | - | 1,213 | 290 | 15 | - |
Avanti Screenmedia Group PLC | - | 7,564 | 1,837 | - | 9,335 |
BDI Mining Corp. | 4,646 | 494 | - | - | 3,288 |
BioCare Solutions PLC | - | 439 | - | - | 2,270 |
Bioprogress PLC | 2,479 | 4,927 | 1,571 | - | 9,152 |
Blackstar Investors PLC | - | 5,074 | - | - | - |
BowLeven PLC | 9,158 | 2,970 | 4,238 | - | - |
Cambrian Mining PLC | 15,024 | 3,024 | 2,644 | 156 | 15,845 |
Centurion Electronics PLC | 574 | 366 | - | - | 432 |
Coffeeheaven International PLC | 1,580 | 1,537 | 1,731 | - | - |
Corac Group PLC | 2,146 | 283 | 88 | - | 3,538 |
Cyberscan Technology, Inc. | 1,725 | 8,966 | - | - | 4,562 |
DA Group PLC | 2,490 | - | 64 | - | 1,236 |
Dominion Energy PLC | - | 932 | - | - | - |
Financial Payment Systems Ltd. | - | 1,729 | - | - | 1,485 |
Forum Energy PLC | 2,505 | 1,207 | 479 | - | - |
Affiliates
(Amounts in thousands) | Value, beginning of period | Purchases | Sales Proceeds | Dividend Income | Value,
end of
period |
Fox Resources Ltd. | $ 844 | $ - | $ 4,134 | $ - | $ - |
Frontier Mining Ltd. | 2,220 | 256 | - | - | 1,808 |
Gasol PLC | - | 2,620 | 263 | - | 1,257 |
Gemfields Resources PLC | - | 5,312 | 532 | - | 5,589 |
GMA Resources PLC | 3,026 | 1,455 | 354 | - | 3,939 |
Hardide Ltd. | 2,909 | - | 1,050 | - | 1,711 |
Healthcare Enterprise Group PLC | 10,604 | 2,028 | - | - | 1,010 |
Hot Tuna International PLC | - | 2,049 | 6 | - | - |
Hydrodec Group PLC | 2,730 | 5,558 | 1,670 | - | 8,231 |
ID Data PLC | 1,344 | - | - | - | 925 |
Impact Holdings PLC | - | 1,944 | - | - | 2,086 |
Inion OY | 3,466 | 2,117 | - | - | 1,677 |
Interbulk Investments PLC | - | 2,006 | 298 | - | 1,682 |
International Ferro Metals | 15,854 | 600 | 1,630 | - | 17,682 |
IPSA Group PLC | 2,128 | - | 1,223 | - | - |
Jubilee Platinum PLC | 3,339 | 4,414 | 791 | - | 8,789 |
KimCor Diamonds PLC | - | 1,147 | 23 | - | 1,185 |
Kura Corp. Ltd. | 18,905 | 588 | 2,593 | 15 | - |
Lambert Howarth Group PLC | 6,291 | - | 5,227 | 131 | - |
Landround PLC | 582 | 54 | - | - | 188 |
Leadcom Integrated Solutions | 4,705 | - | 1,445 | 64 | - |
LTG Technologies PLC | 2,294 | 1,300 | 16 | - | 1,948 |
MagIndustries Corp. | - | 13,459 | 4,582 | - | - |
Metals Exploration PLC | 624 | 533 | 194 | - | 2,126 |
MicroEmissive Displays | - | 1,141 | - | - | 1,672 |
Mineral Commodities Ltd. | - | 1,802 | - | - | 948 |
Mintails Ltd. | - | 1,466 | 244 | - | - |
Motivcom PLC | 3,423 | - | 147 | 40 | 3,085 |
NeutraHealth PLC | 1,719 | - | 193 | - | - |
Oil Quest Resources PLC (OLD) | 596 | - | - | - | - |
Pertra AS (A Shares) | - | 3,513 | 1,508 | - | - |
PetroLatina Energy PLC | - | - | 34 | - | - |
Pilat Media Global PLC | 2,244 | - | 1,894 | - | - |
Platinum Mining Corp. of India PLC | 3,602 | - | 91 | - | 2,418 |
Affiliates
(Amounts in thousands) | Value, beginning of period | Purchases | Sales Proceeds | Dividend Income | Value,
end of
period |
PlusNet Technologies Ltd. | $ 7,340 | $ 720 | $ 845 | $ - | $ - |
PSI AG | 3,396 | - | 1,893 | - | - |
Rheochem PLC | 1,854 | - | 258 | - | 2,034 |
Solomon Gold PLC | - | 1,588 | - | - | 905 |
Sphere Investments Ltd. | 2,552 | - | 2,544 | - | - |
Starfield Resources, Inc. | 3,741 | 1,819 | 1,083 | - | 3,247 |
Stepstone ASA | 5,719 | - | - | - | - |
SubSea Resources PLC | 4,362 | 52 | 461 | - | 2,630 |
Sylvania Resources Ltd. | 2,738 | 557 | 109 | - | - |
Sylvania Resources Ltd. (United Kingdom) | - | 3,084 | - | - | - |
Synchronica PLC (formerly, Dat Group PLC) | 1,263 | - | 117 | - | - |
Taghmen Energy PLC | 5,671 | - | 102 | - | - |
Tanfield Group PLC | 2,911 | 2,114 | 5,156 | - | - |
Tanzanite One Ltd. | 4,936 | 10,260 | 184 | 414 | 9,086 |
Teleunit Spa | 3,683 | 710 | 28 | 94 | 1,122 |
Tikit Group PLC | 2,436 | - | 1,014 | 33 | - |
Toledo Mining Corp. PLC | 982 | 2,614 | 313 | - | 3,742 |
Visual Defence, Inc. | 1,379 | 1,024 | - | - | 2,673 |
Xceldiam Ltd. | 2,643 | - | - | - | 1,946 |
Total | $ 214,073 | $ 127,250 | $ 66,700 | $ 981 | $ 151,845 |
Annual Report
See accompanying notes which are an integral part of the financial statements.
Financial Statements
Statement of Assets and Liabilities
Amounts in thousands (except per-share amounts) | October 31, 2006 |
| | |
Assets | | |
Investment in securities, at value (including securities loaned of $91,236) - See accompanying schedule: Unaffiliated issuers (cost $1,381,890) | $ 1,715,952 | |
Fidelity Central Funds (cost $173,506) | 173,506 | |
Other affiliated issuers (cost $181,447) | 151,845 | |
Total Investments (cost $1,736,843) | | $ 2,041,303 |
Cash | | 79 |
Foreign currency held at value (cost $464) | | 464 |
Receivable for investments sold | | 41,977 |
Receivable for fund shares sold | | 566 |
Dividends receivable | | 2,857 |
Interest receivable | | 359 |
Receivable from investment adviser for expense reductions | | 3 |
Other receivables | | 414 |
Total assets | | 2,088,022 |
| | |
Liabilities | | |
Payable for investments purchased | $ 46,615 | |
Payable for fund shares redeemed | 6,294 | |
Accrued management fee | 1,457 | |
Distribution fees payable | 54 | |
Other affiliated payables | 445 | |
Other payables and accrued expenses | 148 | |
Collateral on securities loaned, at value | 96,528 | |
Total liabilities | | 151,541 |
| | |
Net Assets | | $ 1,936,481 |
Net Assets consist of: | | |
Paid in capital | | $ 1,186,953 |
Undistributed net investment income | | 5,133 |
Accumulated undistributed net realized gain (loss) on investments and foreign currency transactions | | 440,012 |
Net unrealized appreciation (depreciation) on investments and assets and liabilities in foreign currencies | | 304,383 |
Net Assets | | $ 1,936,481 |
Annual Report
See accompanying notes which are an integral part of the financial statements.
Financial Statements - continued
Statement of Assets and Liabilities - continued
Amounts in thousands (except per-share amounts) | October 31, 2006 |
| | |
Calculation of Maximum Offering Price
Class A:
Net Asset Value and redemption price per share ($36,701 ÷ 1,274.8 shares) | | $ 28.79 |
| | |
Maximum offering price per share (100/94.25 of $28.79) | | $ 30.55 |
Class T:
Net Asset Value and redemption price per share ($41,982 ÷ 1,465.7 shares) | | $ 28.64 |
| | |
Maximum offering price per share (100/96.50 of $28.64) | | $ 29.68 |
Class B:
Net Asset Value and offering price per share ($11,354 ÷ 401.7 shares) A | | $ 28.26 |
| | |
Class C:
Net Asset Value and offering price per share ($21,335 ÷ 753.2 shares) A | | $ 28.33 |
| | |
| | |
International Small Cap:
Net Asset Value, offering price and redemption price per share ($1,816,059 ÷ 62,562.3 shares) | | $ 29.03 |
| | |
Institutional Class:
Net Asset Value, offering price and redemption price per share ($9,050 ÷ 312.2 shares) | | $ 28.99 |
A Redemption price per share is equal to net asset value less any applicable contingent deferred sales charge.
Annual Report
See accompanying notes which are an integral part of the financial statements.
Statement of Operations
Amounts in thousands | Amounts in thousands Year ended October 31, 2006 |
Investment Income | | |
Dividends (including $981 received from other affiliated issuers) | | $ 33,534 |
Interest | | 499 |
Income from Fidelity Central Funds (including $2,546 from security lending) | | 4,389 |
| | 38,422 |
Less foreign taxes withheld | | (1,795) |
Total income | | 36,627 |
| | |
Expenses | | |
Management fee
Basic fee | $ 21,102 | |
Performance adjustment | 2,444 | |
Transfer agent fees | 4,929 | |
Distribution fees | 752 | |
Accounting and security lending fees | 1,162 | |
Custodian fees and expenses | 1,238 | |
Independent trustees' compensation | 10 | |
Registration fees | 88 | |
Audit | 102 | |
Legal | 48 | |
Interest | 38 | |
Miscellaneous | 20 | |
Total expenses before reductions | 31,933 | |
Expense reductions | (1,487) | 30,446 |
Net investment income (loss) | | 6,181 |
Realized and Unrealized Gain (Loss) Net realized gain (loss) on: | | |
Investment securities: | | |
Unaffiliated issuers (net of foreign taxes of $427) | 461,328 | |
Other affiliated issuers | 367 | |
Foreign currency transactions | (494) | |
Total net realized gain (loss) | | 461,201 |
Change in net unrealized appreciation (depreciation) on: Investment securities (net of decrease in deferred foreign taxes of $314) | (42,284) | |
Assets and liabilities in foreign currencies | (54) | |
Total change in net unrealized appreciation (depreciation) | | (42,338) |
Net gain (loss) | | 418,863 |
Net increase (decrease) in net assets resulting from operations | | $ 425,044 |
Annual Report
See accompanying notes which are an integral part of the financial statements.
Financial Statements - continued
Statement of Changes in Net Assets
Amounts in thousands | Year ended
October 31,
2006 | Year ended
October 31,
2005 |
Increase (Decrease) in Net Assets | | |
Operations | | |
Net investment income (loss) | $ 6,181 | $ 10,862 |
Net realized gain (loss) | 461,201 | 242,238 |
Change in net unrealized appreciation (depreciation) | (42,338) | 169,248 |
Net increase (decrease) in net assets resulting
from operations | 425,044 | 422,348 |
Distributions to shareholders from net investment income | (10,829) | (3,406) |
Distributions to shareholders from net realized gain | (234,438) | (45,235) |
Total distributions | (245,267) | (48,641) |
Share transactions - net increase (decrease) | (456,221) | 701,403 |
Redemption fees | 565 | 1,213 |
Total increase (decrease) in net assets | (275,879) | 1,076,323 |
| | |
Net Assets | | |
Beginning of period | 2,212,360 | 1,136,037 |
End of period (including undistributed net investment income of $5,133 and undistributed net investment income of $10,862, respectively) | $ 1,936,481 | $ 2,212,360 |
Annual Report
See accompanying notes which are an integral part of the financial statements.
Financial Highlights - Class A
Years ended October 31, | 2006 | 2005 | 2004 | 2003 I |
Selected Per-Share Data | | | | |
Net asset value, beginning of period | $ 26.69 | $ 21.25 | $ 17.69 | $ 12.35 |
Income from Investment Operations | | | | |
Net investment income (loss) E | (.02) | .05 | .02 | .02 H |
Net realized and unrealized gain (loss) | 5.05 | 6.16 | 3.83 | 5.30 |
Total from investment operations | 5.03 | 6.21 | 3.85 | 5.32 |
Distributions from net investment income | (.05) | (.02) | (.02) | - |
Distributions from net realized gain | (2.89) | (.77) | (.31) | - |
Total distributions | (2.94) | (.79) | (.33) | - |
Redemption fees added to paid in capital E | .01 | .02 | .04 | .02 |
Net asset value, end of period | $ 28.79 | $ 26.69 | $ 21.25 | $ 17.71 |
Total Return B, C, D | 20.22% | 30.16% | 22.36% | 43.24% |
Ratios to Average Net Assets F, J | | | | |
Expenses before reductions | 1.64% | 1.66% | 1.71% | 1.77% A |
Expenses net of fee waivers, if any | 1.64% | 1.66% | 1.71% | 1.77% A |
Expenses net of all reductions | 1.58% | 1.63% | 1.69% | 1.74% A |
Net investment income (loss) | (.08)% | .21% | .09% | .28% A |
Supplemental Data | | | | |
Net assets, end of period (in millions) | $ 37 | $ 35 | $ 13 | $ 5 |
Portfolio turnover rate G | 84% | 79% | 77% | 84% A |
A Annualized
B Total returns for periods of less than one year are not annualized.
C Total returns would have been lower had certain expenses not been reduced during the periods shown.
D Total returns do not include the effect of the sales charges.
E Calculated based on average shares outstanding during the period.
F Fees and expenses of the underlying Fidelity Central Funds are not included in the Fund's expense ratio. The Fund indirectly bears its proportionate share of the expenses of any underlying Fidelity Central Funds.
G Amount does not include the portfolio activity of any underlying Fidelity Central Funds.
H Investment income per share reflects a special dividend which amounted to $.01 per share.
I For the period May 27, 2003 (commencement of sale of shares) to October 31, 2003.
J Expense ratios reflect operating expenses of the class. Expenses before reductions do not reflect amounts reimbursed by the investment adviser or reductions from brokerage service arrangements or other expense offset arrangements and do not represent the amount paid by the class during periods when reimbursements or reductions occur. Expense ratios before reductions for start-up periods may not be representative of longer-term operating periods. Expenses net of fee waivers reflect expenses after reimbursement by the investment adviser but prior to reductions from brokerage service arrangements or other expense offset arrangements. Expenses net of all reductions represent the net expenses paid by the class.
Annual Report
See accompanying notes which are an integral part of the financial statements.
Financial Highlights - Class T
Years ended October 31, | 2006 | 2005 | 2004 | 2003 I |
Selected Per-Share Data | | | | |
Net asset value, beginning of period | $ 26.57 | $ 21.20 | $ 17.68 | $ 12.35 |
Income from Investment Operations | | | | |
Net investment income (loss) E | (.09) | (.01) | (.03) | - H, K |
Net realized and unrealized gain (loss) | 5.03 | 6.12 | 3.83 | 5.31 |
Total from investment operations | 4.94 | 6.11 | 3.80 | 5.31 |
Distributions from net investment income | - | - | (.01) | - |
Distributions from net realized gain | (2.88) | (.76) | (.31) | - |
Total distributions | (2.88) | (.76) | (.32) | - |
Redemption fees added to paid in capital E | .01 | .02 | .04 | .02 |
Net asset value, end of period | $ 28.64 | $ 26.57 | $ 21.20 | $ 17.65 |
Total Return B, C, D | 19.93% | 29.72% | 22.07% | 43.16% |
Ratios to Average Net Assets F, J | | | | |
Expenses before reductions | 1.89% | 1.92% | 1.94% | 2.12% A |
Expenses net of fee waivers, if any | 1.89% | 1.91% | 1.94% | 2.12% A |
Expenses net of all reductions | 1.83% | 1.88% | 1.92% | 2.09% A |
Net investment income (loss) | (.32)% | (.04)% | (.14)% | (.07)% A |
Supplemental Data | | | | |
Net assets, end of period (in millions) | $ 42 | $ 42 | $ 15 | $ 4 |
Portfolio turnover rate G | 84% | 79% | 77% | 84% A |
A Annualized
B Total returns for periods of less than one year are not annualized.
C Total returns would have been lower had certain expenses not been reduced during the periods shown.
D Total returns do not include the effect of the sales charges.
E Calculated based on average shares outstanding during the period.
F Fees and expenses of the underlying Fidelity Central Funds are not included in the Fund's expense ratio. The Fund indirectly bears its proportionate share of the expenses of any underlying Fidelity Central Funds.
G Amount does not include the portfolio activity of any underlying Fidelity Central Funds.
H Investment income per share reflects a special dividend which amounted to $.01 per share.
I For the period May 27, 2003 (commencement of sale of shares) to October 31, 2003.
J Expense ratios reflect operating expenses of the class. Expenses before reductions do not reflect amounts reimbursed by the investment adviser or reductions from brokerage service arrangements or other expense offset arrangements and do not represent the amount paid by the class during periods when reimbursements or reductions occur. Expense ratios before reductions for start-up periods may not be representative of longer-term operating periods. Expenses net of fee waivers reflect expenses after reimbursement by the investment adviser but prior to reductions from brokerage service arrangements or other expense offset arrangements. Expenses net of all reductions represent the net expenses paid by the class.
K Amount represents less than $.01 per share.
Annual Report
See accompanying notes which are an integral part of the financial statements.
Financial Highlights - Class B
Years ended October 31, | 2006 | 2005 | 2004 | 2003 I |
Selected Per-Share Data | | | | |
Net asset value, beginning of period | $ 26.24 | $ 20.99 | $ 17.62 | $ 12.35 |
Income from Investment Operations | | | | |
Net investment income (loss) E | (.24) | (.14) | (.16) | (.05) H |
Net realized and unrealized gain (loss) | 4.98 | 6.08 | 3.80 | 5.30 |
Total from investment operations | 4.74 | 5.94 | 3.64 | 5.25 |
Distributions from net realized gain | (2.73) | (.71) | (.31) | - |
Redemption fees added to paid in capital E | .01 | .02 | .04 | .02 |
Net asset value, end of period | $ 28.26 | $ 26.24 | $ 20.99 | $ 17.52 |
Total Return B, C, D | 19.28% | 29.13% | 21.21% | 42.67% |
Ratios to Average Net Assets F, J | | | | |
Expenses before reductions | 2.48% | 2.49% | 2.63% | 2.76% A |
Expenses net of fee waivers, if any | 2.40% | 2.43% | 2.63% | 2.76% A |
Expenses net of all reductions | 2.34% | 2.40% | 2.60% | 2.73% A |
Net investment income (loss) | (.84)% | (.56)% | (.83)% | (.71)% A |
Supplemental Data | | | | |
Net assets, end of period (in millions) | $ 11 | $ 13 | $ 5 | $ 1 |
Portfolio turnover rate G | 84% | 79% | 77% | 84% A |
A Annualized
B Total returns for periods of less than one year are not annualized.
C Total returns would have been lower had certain expenses not been reduced during the periods shown.
D Total returns do not include the effect of the contingent deferred sales charge.
E Calculated based on average shares outstanding during the period.
F Fees and expenses of the underlying Fidelity Central Funds are not included in the Fund's expense ratio. The Fund indirectly bears its proportionate share of the expenses of any underlying Fidelity Central Funds.
G Amount does not include the portfolio activity of any underlying Fidelity Central Funds.
H Investment income per share reflects a special dividend which amounted to $.01 per share.
I For the period May 27, 2003 (commencement of sale of shares) to October 31, 2003.
J Expense ratios reflect operating expenses of the class. Expenses before reductions do not reflect amounts reimbursed by the investment adviser or reductions from brokerage service arrangements or other expense offset arrangements and do not represent the amount paid by the class during periods when reimbursements or reductions occur. Expense ratios before reductions for start-up periods may not be representative of longer-term operating periods. Expenses net of fee waivers reflect expenses after reimbursement by the investment adviser but prior to reductions from brokerage service arrangements or other expense offset arrangements. Expenses net of all reductions represent the net expenses paid by the class.
Annual Report
See accompanying notes which are an integral part of the financial statements.
Financial Highlights - Class C
Years ended October 31, | 2006 | 2005 | 2004 | 2003 I |
Selected Per-Share Data | | | | |
Net asset value, beginning of period | $ 26.31 | $ 21.04 | $ 17.64 | $ 12.35 |
Income from Investment Operations | | | | |
Net investment income (loss) E | (.23) | (.13) | (.12) | (.04) H |
Net realized and unrealized gain (loss) | 4.99 | 6.10 | 3.80 | 5.31 |
Total from investment operations | 4.76 | 5.97 | 3.68 | 5.27 |
Distributions from net investment income | - | - | (.01) | - |
Distributions from net realized gain | (2.75) | (.72) | (.31) | - |
Total distributions | (2.75) | (.72) | (.32) | - |
Redemption fees added to paid in capital E | .01 | .02 | .04 | .02 |
Net asset value, end of period | $ 28.33 | $ 26.31 | $ 21.04 | $ 17.64 |
Total Return B, C, D | 19.34% | 29.22% | 21.43% | 42.83% |
Ratios to Average Net Assets F, J | | | | |
Expenses before reductions | 2.38% | 2.41% | 2.43% | 2.57% A |
Expenses net of fee waivers, if any | 2.38% | 2.41% | 2.43% | 2.57% A |
Expenses net of all reductions | 2.32% | 2.38% | 2.40% | 2.55% A |
Net investment income (loss) | (.81)% | (.54)% | (.62)% | (.52)% A |
Supplemental Data | | | | |
Net assets, end of period (in millions) | $ 21 | $ 25 | $ 9 | $ 1 |
Portfolio turnover rate G | 84% | 79% | 77% | 84% A |
A Annualized
B Total returns for periods of less than one year are not annualized.
C Total returns would have been lower had certain expenses not been reduced during the periods shown.
D Total returns do not include the effect of the contingent deferred sales charge.
E Calculated based on average shares outstanding during the period.
F Fees and expenses of the underlying Fidelity Central Funds are not included in the Fund's expense ratio. The Fund indirectly bears its proportionate share of the expenses of any underlying Fidelity Central Funds.
G Amount does not include the portfolio activity of any underlying Fidelity Central Funds.
H Investment income per share reflects a special dividend which amounted to $.01 per share.
I For the period May 27, 2003 (commencement of sale of shares) to October 31, 2003.
J Expense ratios reflect operating expenses of the class. Expenses before reductions do not reflect amounts reimbursed by the investment adviser or reductions from brokerage service arrangements or other expense offset arrangements and do not represent the amount paid by the class during periods when reimbursements or reductions occur. Expense ratios before reductions for start-up periods may not be representative of longer-term operating periods. Expenses net of fee waivers reflect expenses after reimbursement by the investment adviser but prior to reductions from brokerage service arrangements or other expense offset arrangements. Expenses net of all reductions represent the net expenses paid by the class.
Annual Report
See accompanying notes which are an integral part of the financial statements.
Financial Highlights - International Small Cap
Years ended October 31, | 2006 | 2005 | 2004 | 2003 | 2002 H |
Selected Per-Share Data | | | | | |
Net asset value, beginning of period | $ 26.89 | $ 21.36 | $ 17.71 | $ 9.87 | $ 10.00 |
Income from Investment Operations | | | | | |
Net investment income (loss) D | .08 | .15 | .10 | .07 G | (.01) |
Net realized and unrealized gain (loss) | 5.08 | 6.19 | 3.84 | 7.75 | (.12) |
Total from investment operations | 5.16 | 6.34 | 3.94 | 7.82 | (.13) |
Distributions from net investment income | (.14) | (.06) | (.02) | - | - |
Distributions from net realized gain | (2.89) | (.77) | (.31) | (.02) | - |
Total distributions | (3.03) | (.83) | (.33) | (.02) | - |
Redemption fees added to
paid in capital D | .01 | .02 | .04 | .04 | - J |
Net asset value, end of period | $ 29.03 | $ 26.89 | $ 21.36 | $ 17.71 | $ 9.87 |
Total Return B, C | 20.65% | 30.67% | 22.84% | 79.78% | (1.30)% |
Ratios to Average Net Assets E, I | | | | |
Expenses before reductions | 1.28% | 1.28% | 1.30% | 1.54% | 13.70% A |
Expenses net of fee waivers, if any | 1.28% | 1.28% | 1.30% | 1.54% | 1.80% A |
Expenses net of all
reductions | 1.22% | 1.25% | 1.28% | 1.51% | 1.80% A |
Net investment income (loss) | .29% | .59% | .50% | .46% | (.56)% A |
Supplemental Data | | | | | |
Net assets, end of period
(in millions) | $ 1,816 | $ 2,090 | $ 1,091 | $ 547 | $ 3 |
Portfolio turnover rate F | 84% | 79% | 77% | 84% | 85% A |
A Annualized
B Total returns for periods of less than one year are not annualized.
C Total returns would have been lower had certain expenses not been reduced during the periods shown.
D Calculated based on average shares outstanding during the period.
E Fees and expenses of the underlying Fidelity Central Funds are not included in the Fund's expense ratio. The Fund indirectly bears its proportionate share of the expenses of any underlying Fidelity Central Funds.
F Amount does not include the portfolio activity of any underlying Fidelity Central Funds.
G Investment income per share reflects a special dividend which amounted to $.03 per share.
H For the period September 18, 2002 (commencement of operations) to October 31, 2002.
I Expense ratios reflect operating expenses of the class. Expenses before reductions do not reflect amounts reimbursed by the investment adviser or reductions from brokerage service arrangements or other expense offset arrangements and do not represent the amount paid by the class during periods when reimbursements or reductions occur. Expense ratios before reductions for start-up periods may not be representative of longer-term operating periods. Expenses net of fee waivers reflect expenses after reimbursement by the investment adviser but prior to reductions from brokerage service arrangements or other expense offset arrangements. Expenses net of all reductions represent the net expenses paid by the class.
J Amount represents less than $.01 per share.
Annual Report
See accompanying notes which are an integral part of the financial statements.
Financial Highlights - Institutional Class
Years ended October 31, | 2006 | 2005 | 2004 | 2003 H |
Selected Per-Share Data | | | | |
Net asset value, beginning of period | $ 26.86 | $ 21.36 | $ 17.72 | $ 12.35 |
Income from Investment Operations | | | | |
Net investment income (loss) D | .08 | .14 | .10 | .04 G |
Net realized and unrealized gain (loss) | 5.07 | 6.18 | 3.84 | 5.31 |
Total from investment operations | 5.15 | 6.32 | 3.94 | 5.35 |
Distributions from net investment income | (.14) | (.07) | (.03) | - |
Distributions from net realized gain | (2.89) | (.77) | (.31) | - |
Total distributions | (3.03) | (.84) | (.34) | - |
Redemption fees added to paid in capital D | .01 | .02 | .04 | .02 |
Net asset value, end of period | $ 28.99 | $ 26.86 | $ 21.36 | $ 17.72 |
Total Return B, C | 20.65% | 30.59% | 22.84% | 43.48% |
Ratios to Average Net Assets E, I | | | | |
Expenses before reductions | 1.29% | 1.30% | 1.32% | 1.51% A |
Expenses net of fee waivers, if any | 1.29% | 1.30% | 1.32% | 1.51% A |
Expenses net of all reductions | 1.23% | 1.27% | 1.29% | 1.48% A |
Net investment income (loss) | .28% | .57% | .49% | .54% A |
Supplemental Data | | | | |
Net assets, end of period (in millions) | $ 9 | $ 7 | $ 3 | $ .4 |
Portfolio turnover rate F | 84% | 79% | 77% | 84% A |
A Annualized
B Total returns for periods of less than one year are not annualized.
C Total returns would have been lower had certain expenses not been reduced during the periods shown.
D Calculated based on average shares outstanding during the period.
E Fees and expenses of the underlying Fidelity Central Funds are not included in the Fund's expense ratio. The Fund indirectly bears its proportionate share of the expenses of any underlying Fidelity Central Funds.
F Amount does not include the portfolio activity of any underlying Fidelity Central Funds.
G Investment income per share reflects a special dividend which amounted to $.01 per share.
H For the period May 27, 2003 (commencement of sale of shares) to October 31, 2003.
I Expense ratios reflect operating expenses of the class. Expenses before reductions do not reflect amounts reimbursed by the investment adviser or reductions from brokerage service arrangements or other expense offset arrangements and do not represent the amount paid by the class during periods when reimbursements or reductions occur. Expense ratios before reductions for start-up periods may not be representative of longer-term operating periods. Expenses net of fee waivers reflect expenses after reimbursement by the investment adviser but prior to reductions from brokerage service arrangements or other expense offset arrangements. Expenses net of all reductions represent the net expenses paid by the class.
Annual Report
See accompanying notes which are an integral part of the financial statements.
Notes to Financial Statements
For the period ended October 31, 2006
(Amounts in thousands except ratios)
1. Significant Accounting Policies.
Fidelity International Small Cap Fund (the Fund) is a fund of Fidelity Investment Trust (the trust) and is authorized to issue an unlimited number of shares. The trust is registered under the Investment Company Act of 1940, as amended (the 1940 Act), as an open-end management investment company organized as a Massachusetts business trust.
The Fund offers Class A, Class T, Class B, Class C, International Small Cap and Institutional Class shares, each of which has equal rights as to assets and voting privileges. Each class has exclusive voting rights with respect to matters that affect that class. Class B shares will automatically convert to Class A shares after a holding period of seven years from the initial date of purchase. Investment income, realized and unrealized capital gains and losses, the common expenses of the Fund, and certain fund-level expense reductions, if any, are allocated on a pro rata basis to each class based on the relative net assets of each class to the total net assets of the Fund. Each class differs with respect to transfer agent and distribution and service plan fees incurred. Certain expense reductions also differ by class.
The Fund may invest in Fidelity Central Funds which are open-end investment companies available to investment companies and other accounts managed by Fidelity Management & Research Company (FMR) and its affiliates. The financial statements have been prepared in conformity with accounting principles generally accepted in the United States of America, which require management to make certain estimates and assumptions at the date of the financial statements. The following summarizes the significant accounting policies of the Fund, which are also consistently followed by the Fidelity Central Funds:
Security Valuation. Investments are valued and net asset value (NAV) per share is calculated (NAV calculation) as of the close of business of the New York Stock Exchange (NYSE), normally 4:00 p.m. Eastern time. Wherever possible, the Fund uses independent pricing services approved by the Board of Trustees to value its investments.
Equity securities, including restricted securities, for which market quotations are readily available, are valued at the last reported sale price or official closing price as reported by an independent pricing service on the primary market or exchange on which they are traded. In the event there were no sales during the day or closing prices are not available, securities are valued at the last quoted bid price. Debt securities, including restricted securities, for which quotations are readily available, are valued by independent pricing services or by dealers who make markets in such securities. Pricing services consider yield or price of bonds of comparable quality, coupon, maturity and type as well as dealer supplied prices. Investments in open-end mutual funds, including the Fidelity Central Funds, are valued at their closing net asset value each business day. Short-term securities with remaining maturities of sixty days or less for which quotations are not readily available are valued at amortized cost, which approximates value.
Annual Report
Notes to Financial Statements - continued
(Amounts in thousands except ratios)
1. Significant Accounting Policies - continued
Security Valuation - continued
When current market prices or quotations are not readily available or do not accurately reflect fair value, valuations may be determined in accordance with procedures adopted by the Board of Trustees. For example, when developments occur between the close of a market and the close of the NYSE that may materially affect the value of some or all of the securities, or when trading in a security is halted, those securities may be fair valued. Factors used in the determination of fair value may include monitoring news to identify significant market or security specific events such as changes in the value of U.S. securities markets, reviewing developments in foreign markets and evaluating the performance of ADRs, futures contracts and exchange-traded funds. Because the Fund's utilization of fair value pricing depends on market activity, the frequency with which fair value pricing is used can not be predicted and may be utilized to a significant extent. The value of securities used for NAV calculation under fair value pricing may differ from published prices for the same securities.
Foreign Currency. The Fund uses foreign currency contracts to facilitate transactions in foreign-denominated securities. Losses from these transactions may arise from changes in the value of the foreign currency or if the counterparties do not perform under the contracts' terms.
Foreign-denominated assets, including investment securities, and liabilities are translated into U.S. dollars at the exchange rate at period end. Purchases and sales of investment securities, income and dividends received and expenses denominated in foreign currencies are translated into U.S. dollars at the exchange rate in effect on the transaction date.
The effects of exchange rate fluctuations on investments are included with the net realized and unrealized gain (loss) on investment securities. Other foreign currency transactions resulting in realized and unrealized gain (loss) are disclosed separately.
Investment Transactions and Income. Security transactions, including the Fund's investment activity in the Fidelity Central Funds, are accounted for as of trade date. Gains and losses on securities sold are determined on the basis of identified cost. Dividend income is recorded on the ex-dividend date, except for certain dividends from foreign securities where the ex-dividend date may have passed, which are recorded as soon as the Fund is informed of the ex-dividend date. Non-cash dividends included in dividend income, if any, are recorded at the fair market value of the securities received. Interest income and distributions from the Fidelity Central Funds are accrued as earned. Interest income includes coupon interest and amortization of premium and accretion of discount on debt securities. Investment income is recorded net of foreign taxes withheld where recovery of such taxes is uncertain.
Annual Report
1. Significant Accounting Policies - continued
Expenses. Most expenses of the trust can be directly attributed to a fund. Expenses which cannot be directly attributed are apportioned among each Fund in the trust. Expense estimates are accrued in the period to which they relate and adjustments are made when actual amounts are known.
Income Tax Information and Distributions to Shareholders. Each year, the Fund intends to qualify as a regulated investment company by distributing all of its taxable income and realized gains under Subchapter M of the Internal Revenue Code. As a result, no provision for income taxes is required in the accompanying financial statements. Foreign taxes are provided for based on the Fund's understanding of the tax rules and rates that exist in the foreign markets in which it invests.
Distributions are recorded on the ex-dividend date. Income dividends and capital gain distributions are declared separately for each class. Income and capital gain distributions are determined in accordance with income tax regulations, which may differ from generally accepted accounting principles. In addition, the Fund will claim a portion of the payment made to redeeming shareholders as a distribution for income tax purposes.
Capital accounts within the financial statements are adjusted for permanent book-tax differences. These adjustments have no impact on net assets or the results of operations. Temporary book-tax differences will reverse in a subsequent period.
Book-tax differences are primarily due to foreign currency transactions, passive foreign investment companies (PFIC) and losses deferred due to wash sales.
The tax-basis components of distributable earnings and the federal tax cost as of period end were as follows:
Unrealized appreciation | $ 444,995 | |
Unrealized depreciation | (177,521) | |
Net unrealized appreciation (depreciation) | 267,474 | |
Undistributed ordinary income | 43,513 | |
Undistributed long-term capital gain | 310,524 | |
| | |
Cost for federal income tax purposes | $ 1,773,829 | |
The tax character of distributions paid was as follows:
| October 31, 2006 | October 31, 2005 |
Ordinary Income | $ 66,631 | $ 30,409 |
Long-term Capital Gains | 178,636 | 18,232 |
Total | $ 245,267 | $ 48,641 |
Annual Report
Notes to Financial Statements - continued
(Amounts in thousands except ratios)
1. Significant Accounting Policies - continued
Short-Term Trading (Redemption) Fees. Shares held in the Fund less than 90 days are subject to a redemption fee equal to 2.00% of the proceeds of the redeemed shares. All redemption fees, including any estimated redemption fees paid by FMR, are retained by the Fund and accounted for as an addition to paid in capital.
New Accounting Pronouncements. In July 2006, Financial Accounting Standards Board Interpretation No. 48, Accounting for Uncertainty in Income Taxes - an interpretation of FASB Statement 109 (FIN 48), was issued and is effective for fiscal years beginning after December 15, 2006. FIN 48 sets forth a threshold for financial statement recognition, measurement and disclosure of a tax position taken or expected to be taken on a tax return. Management is currently evaluating the impact, if any, the adoption of FIN 48 will have on the Fund's net assets, results of operations and financial statement disclosures.
In addition, in September 2006, Statement of Financial Accounting Standards No. 157, Fair Value Measurements (SFAS 157), was issued and is effective for fiscal years beginning after November 15, 2007. SFAS 157 defines fair value, establishes a framework for measuring fair value and expands disclosures about fair value measurements. Management is currently evaluating the impact the adoption of SFAS 157 will have on the Fund's financial statement disclosures.
2. Operating Policies.
Repurchase Agreements. FMR has received an Exemptive Order from the Securities and Exchange Commission (the SEC) which permits the Fund and other affiliated entities of FMR to transfer uninvested cash balances into joint trading accounts which are then invested in repurchase agreements. The Fund may also invest directly with institutions in repurchase agreements. Repurchase agreements are collateralized by government or non-government securities. Upon settlement date, collateral is held in segregated accounts with custodian banks and may be obtained in the event of a default of the counterparty. The Fund monitors, on a daily basis, the value of the collateral to ensure it is at least equal to the principal amount of the repurchase agreement (including accrued interest). In the event of a default by the counterparty, realization of the collateral proceeds could be delayed, during which time the value of the collateral may decline.
Restricted Securities. The Fund may invest in securities that are subject to legal or contractual restrictions on resale. These securities generally may be resold in transactions exempt from registration or to the public if the securities are registered. Disposal of these securities may involve time-consuming negotiations and expense, and prompt sale at an acceptable price may be difficult. Information regarding restricted securities is included at the end of the Fund's Schedule of Investments.
Annual Report
3. Purchases and Sales of Investments.
Purchases and sales of securities, other than short-term securities, aggregated $1,999,351 and $2,719,149, respectively.
4. Fees and Other Transactions with Affiliates.
Management Fee. FMR and its affiliates provide the Fund with investment management related services for which the Fund pays a monthly management fee. The management fee is the sum of an individual fund fee rate that is based on an annual rate of .60% of the Fund's average net assets and a group fee rate that averaged .27% during the period. The group fee rate is based upon the average net assets of all the mutual funds advised by FMR. The group fee rate decreases as assets under management increase and increases as assets under management decrease. In addition, the management fee is subject to a performance adjustment (up to a maximum of ± .20% of the Fund's average net assets over a 36 month performance period). The upward or downward adjustment to the management fee is based on the investment performance of the asset-weighted return of the retail class of the Fund, International Small Cap, as compared to an appropriate benchmark index. For the period, the total annual management fee rate, including the performance adjustment, was .97% of the Fund's average net assets.
Distribution and Service Plan. In accordance with Rule 12b-1 of the 1940 Act, the Fund has adopted separate Distribution and Service Plans for each class of shares. Certain classes pay Fidelity Distributors Corporation (FDC), an affiliate of FMR, separate Distribution and Service Fees, each of which is based on an annual percentage of each class' average net assets. In addition, FDC may pay financial intermediaries for selling shares of the Fund and providing shareholder support services. For the period, the Distribution and Service Fee rates and the total amounts paid to and retained by FDC were as follows:
| Distribution
Fee | Service
Fee | Paid to
FDC | Retained
by FDC |
Class A | 0% | .25% | $ 99 | $ 2 |
Class T | .25% | .25% | 240 | - |
Class B | .75% | .25% | 137 | 103 |
Class C | .75% | .25% | 276 | 41 |
| | | $ 752 | $ 146 |
Annual Report
Notes to Financial Statements - continued
(Amounts in thousands except ratios)
4. Fees and Other Transactions with Affiliates - continued
Sales Load. FDC receives a front-end sales charge of up to 5.75% for selling Class A shares, and 3.50% for selling Class T shares, some of which is paid to financial intermediaries for selling shares of the Fund. FDC receives the proceeds of contingent deferred sales charges levied on Class A, Class T, Class B, and Class C redemptions. These charges depend on the holding period. The deferred sales charges range from 5% to 1% for Class B, 1% for Class C, 1.00% to .50% for certain purchases of Class A shares (.25% prior to February 24, 2006) and .25% for certain purchases of Class T shares.
For the period, sales charge amounts retained by FDC were as follows:
| Retained
by FDC |
Class A | $ 8 |
Class T | 6 |
Class B* | 42 |
Class C* | 2 |
| $ 58 |
* When Class B and Class C shares are initially sold, FDC pays commissions from its own resources to financial intermediaries through which the sales are made.
Transfer Agent Fees. Fidelity Investments Institutional Operations Company, Inc. (FIIOC), an affiliate of FMR, is the transfer, dividend disbursing and shareholder servicing agent for each class of the Fund, except for International Small Cap. Fidelity Service Company, Inc. (FSC), an affiliate of FMR, is the transfer agent for International Small Cap shares. FIIOC and FSC receive account fees and asset-based fees that vary according to the account size and type of account of the shareholders of the respective classes of the Fund. FIIOC and FSC pay for typesetting, printing and mailing of shareholder reports, except proxy statements. For the period, the total transfer agent fees paid by each class to FIIOC or FSC, were as follows:
| Amount | % of
Average
Net Assets |
Class A | $ 124 | .31 |
Class T | 148 | .31 |
Class B | 55 | .40 |
Class C | 82 | .30 |
International Small Cap | 4,500 | .20 |
Institutional Class | 20 | .21 |
| $ 4,929 | |
Accounting and Security Lending Fees. FSC maintains the Fund's accounting records. The accounting fee is based on the level of average net assets for the month. Under a separate contract, FSC administers the security lending program. The security lending fee is based on the number and duration of lending transactions.
Annual Report
4. Fees and Other Transactions with Affiliates - continued
Investments in Fidelity Central Funds. The Fund may invest in Fidelity Central Funds. The Fund's Schedule of Investments lists each of the Fidelity Central Funds as an investment of the Fund but does not include the underlying holdings of each Fidelity Central Fund. As an Investing Fund, the Fund indirectly bears its proportionate share of the expenses of the underlying Fidelity Central Funds. A complete unaudited list of holdings for each Fidelity Central Fund is available upon request. In addition, the financial statements of the Fidelity Central Funds, which are not covered by the Fund's Report of Independent Registered Public Accounting Firm, are available on the EDGAR Database on the SEC's web site, www.sec.gov, or upon request.
The Money Market Central Funds seek preservation of capital and current income and are managed by Fidelity Investments Money Management, Inc. (FIMM), an affiliate of FMR.
Interfund Lending Program. Pursuant to an Exemptive Order issued by the SEC, the Fund, along with other registered investment companies having management contracts with FMR, may participate in an interfund lending program. This program provides an alternative credit facility allowing the Funds to borrow from, or lend money to, other participating affiliated funds. At period end, there were no interfund loans outstanding. The Fund's activity in this program during the period for which loans were outstanding was as follows:
Borrower or Lender | Average Daily
Loan Balance | Weighted Average
Interest Rate | Interest
Expense |
Borrower | $ 23,977 | 5.14% | $ 38 |
5. Committed Line of Credit.
The Fund participates with other funds managed by FMR in a $4.2 billion credit facility (the "line of credit") to be utilized for temporary or emergency purposes to fund shareholder redemptions or for other short-term liquidity purposes. The Fund has agreed to pay commitment fees on its pro rata portion of the line of credit, which amounts to $7 and is reflected in Miscellaneous Expense on the Statement of Operations. During the period, there were no borrowings on this line of credit.
6. Security Lending.
The Fund lends portfolio securities from time to time in order to earn additional income. On the settlement date of the loan, the Fund receives collateral (in the form of U.S. Treasury obligations, letters of credit and/or cash) against the loaned securities and maintains collateral in an amount not less than 100% of the market value of the loaned securities during the period of the loan. The market value of the loaned securities is determined at the close of business of the Fund and any additional required collateral is delivered to the Fund on the next business day. If the borrower defaults on its obligation to
Annual Report
Notes to Financial Statements - continued
(Amounts in thousands except ratios)
6. Security Lending - continued
return the securities loaned because of insolvency or other reasons, a fund could experience delays and costs in recovering the securities loaned or in gaining access to the collateral. Any cash collateral received is invested in the Fidelity Securities Lending Cash Central Fund. The value of loaned securities and cash collateral at period end are disclosed on the Fund's Statement of Assets and Liabilities. Security lending income represents the income earned on investing cash collateral, less fees and expenses associated with the loan, plus any premium payments that may be received on the loan of certain types of securities. Security lending income is presented in the Statement of Operations as a component of income from Fidelity Central Funds.
7. Expense Reductions.
FMR voluntarily agreed to reimburse each class to the extent annual operating expenses exceeded certain levels of average net assets as noted in the table below. Some expenses, for example interest expense, including commitment fees, are excluded from this reimbursement.
The following classes were in reimbursement during the period:
| Expense
Limitations | Reimbursement
from adviser |
Class B | 2.40% | $ 10 |
Many of the brokers with whom FMR places trades on behalf of the Fund provided services to the Fund in addition to trade execution. These services included payments of certain expenses on behalf of the Fund totaling $1,455 for the period. During the period, credits reduced each class' transfer agent expense as noted in the table below.
| Transfer Agent
expense reduction |
International Small Cap | $ 22 |
8. Other.
The Fund's organizational documents provide former and current trustees and officers with a limited indemnification against liabilities arising in connection with the performance of their duties to the Fund. In the normal course of business, the Fund may also enter into contracts that provide general indemnifications. The Fund's maximum exposure under these arrangements is unknown as this would be dependent on future claims that may be made against the Fund. The risk of material loss from such claims is considered remote.
During the period, the Fund's transfer agent, Fidelity Investments Institutional Operations Company, Inc. (FIIOC), an affiliate of Fidelity Management & Research Company, notified
Annual Report
8. Other - continued
the Fund that the fund's books and records did not reflect a conversion of certain Class B to Class A shares upon their conversion date. Management has determined that this did not have a material impact to the Fund's reported net assets or results of operations in the accompanying financial statements. FIIOC will cause the books and records of the Fund to reflect a conversion of the relevant Class B shares to Class A and is in the process of determining the impact to affected shareholder accounts for purposes of its remediation.
The United States Securities and Exchange Commission ("SEC") is conducting an investigation of FMR (covering the years 2002 to 2004) arising from gifts, gratuities and business entertainment provided by certain brokers to certain individuals who were employed on FMR's domestic equity trading desk during that period. FMR is in discussions with the SEC staff regarding the possible resolution of the matter, but as of period-end no final resolution has been reached.
In December 2006, the Independent Trustees completed their own investigation of the matter with the assistance of independent counsel. The Independent Trustees and FMR agree that, despite the absence of proof that the Fidelity mutual funds experienced diminished execution quality as a result of the improper receipt of gifts and business entertainment, the conduct at issue was serious and is worthy of redress. Accordingly, the Independent Trustees have requested and FMR has agreed to pay $42 million to Fidelity mutual funds, plus interest to be determined at the time that payment is made. A method of allocating this payment among the funds has not yet been determined. In addition, FMR has agreed to reimburse related legal expenses. The total payment to the Fund is not anticipated to have a material impact on the Fund's net assets.
9. Distributions to Shareholders.
Distributions to shareholders of each class were as follows:
Years ended October 31, | 2006 | 2005 |
From net investment income | | |
Class A | $ 62 | $ 14 |
International Small Cap | 10,726 | 3,381 |
Institutional Class | 41 | 11 |
Total | $ 10,829 | $ 3,406 |
From net realized gain | | |
Class A | $ 3,713 | $ 542 |
Class T | 4,531 | 602 |
Class B | 1,339 | 221 |
Class C | 2,560 | 359 |
International Small Cap | 221,459 | 43,388 |
Institutional Class | 836 | 123 |
Total | $ 234,438 | $ 45,235 |
Annual Report
Notes to Financial Statements - continued
(Amounts in thousands except ratios)
10. Share Transactions.
Transactions for each class of shares were as follows:
| Shares | Dollars |
Years ended | 2006 | 2005 | 2006 | 2005 |
Class A | | | | |
Shares sold | 335 | 915 | $ 9,788 | $ 22,252 |
Reinvestment of distributions | 125 | 20 | 3,194 | 427 |
Shares redeemed | (490) | (255) | (14,008) | (6,421) |
Net increase (decrease) | (30) | 680 | $ (1,026) | $ 16,258 |
| | | | |
Class T | | | | |
Shares sold | 413 | 1,286 | $ 11,877 | $ 31,179 |
Reinvestment of distributions | 165 | 24 | 4,209 | 531 |
Shares redeemed | (679) | (457) | (19,325) | (11,453) |
Net increase (decrease) | (101) | 853 | $ (3,239) | $ 20,257 |
| | | | |
Class B | | | | |
Shares sold | 69 | 415 | $ 1,926 | $ 9,882 |
Reinvestment of distributions | 48 | 9 | 1,211 | 199 |
Shares redeemed | (202) | (178) | (5,665) | (4,336) |
Net increase (decrease) | (85) | 246 | $ (2,528) | $ 5,745 |
| | | | |
Class C | | | | |
Shares sold | 146 | 680 | $ 4,106 | $ 16,301 |
Reinvestment of distributions | 80 | 13 | 2,033 | 272 |
Shares redeemed | (431) | (147) | (11,929) | (3,591) |
Net increase (decrease) | (205) | 546 | $ (5,790) | $ 12,982 |
| | | | |
International Small Cap | | | | |
Shares sold | 17,580 | 51,579 | $ 512,574 | $ 1,266,283 |
Reinvestment of distributions | 8,379 | 2,008 | 216,010 | 43,867 |
Shares redeemed | (41,151) | (26,924) | (1,173,251) | (667,826) |
Net increase (decrease) | (15,192) | 26,663 | $ (444,667) | $ 642,324 |
| | | | |
Institutional Class | | | | |
Shares sold | 124 | 259 | $ 3,656 | $ 6,323 |
Reinvestment of distributions | 20 | 3 | 506 | 59 |
Shares redeemed | (109) | (105) | (3,132) | (2,545) |
Net increase (decrease) | 35 | 157 | $ 1,030 | $ 3,837 |
Annual Report
Report of Independent Registered Public Accounting Firm
To the Trustees of Fidelity Investment Trust and Shareholders of Fidelity International Small Cap Fund:
We have audited the accompanying statement of assets and liabilities of Fidelity International Small Cap Fund (the Fund), a fund of Fidelity Investment Trust, including the schedule of investments, as of October 31, 2006, and the related statement of operations for the year then ended, the statement of changes in net assets for each of the two years in the period then ended, and the financial highlights for each of the five years in the period then ended. These financial statements and financial highlights are the responsibility of the Fund's management. Our responsibility is to express an opinion on these financial statements and financial highlights based on our audits.
We conducted our audits in accordance with standards of the Public Company Accounting Oversight Board (United States). Those standards require that we plan and perform the audit to obtain reasonable assurance about whether the financial statements and financial highlights are free of material misstatement. The Fund is not required to have, nor were we engaged to perform, an audit of its internal control over financial reporting. Our audits included consideration of internal control over financial reporting as a basis for designing audit procedures that are appropriate in the circumstances, but not for the purpose of expressing an opinion on the effectiveness of the Fund's internal control over financial reporting. Accordingly, we express no such opinion. An audit also includes examining, on a test basis, evidence supporting the amounts and disclosures in the financial statements, assessing the accounting principles used and significant estimates made by management, as well as evaluating the overall financial statement presentation. Our procedures included confirmation of securities owned as of October 31, 2006, by correspondence with the custodians and brokers; where replies were not received from brokers, we performed other auditing procedures. We believe that our audits provide a reasonable basis for our opinion.
In our opinion, the financial statements and financial highlights referred to above present fairly, in all material respects, the financial position of Fidelity International Small Cap Fund as of October 31, 2006, the results of its operations for the year then ended, the changes in its net assets for each of the two years in the period then ended, and its financial highlights for each of the five years in the period then ended, in conformity with accounting principles generally accepted in the United States of America.
/s/DELOITTE & TOUCHE LLP
DELOITTE & TOUCHE LLP
Boston, Massachusetts
December 22, 2006
Annual Report
Trustees and Officers
The Trustees, Members of the Advisory Board, and executive officers of the trust and fund, as applicable, are listed below. The Board of Trustees governs the fund and is responsible for protecting the interests of shareholders. The Trustees are experienced executives who meet periodically throughout the year to oversee the fund's activities, review contractual arrangements with companies that provide services to the fund, and review the fund's performance. Except for William O. McCoy, each of the Trustees oversees 348 funds advised by FMR or an affiliate. Mr. McCoy oversees 350 funds advised by FMR or an affiliate.
The Trustees hold office without limit in time except that (a) any Trustee may resign; (b) any Trustee may be removed by written instrument, signed by at least two-thirds of the number of Trustees prior to such removal; (c) any Trustee who requests to be retired or who has become incapacitated by illness or injury may be retired by written instrument signed by a majority of the other Trustees; and (d) any Trustee may be removed at any special meeting of shareholders by a two-thirds vote of the outstanding voting securities of the trust. Each Trustee who is not an interested person (as defined in the 1940 Act) (Independent Trustee), shall retire not later than the last day of the calendar year in which his or her 72nd birthday occurs. The Independent Trustees may waive this mandatory retirement age policy with respect to individual Trustees. The executive officers and Advisory Board Members hold office without limit in time, except that any officer and Advisory Board Member may resign or may be removed by a vote of a majority of the Trustees at any regular meeting or any special meeting of the Trustees. Except as indicated, each individual has held the office shown or other offices in the same company for the past five years.
The fund's Statement of Additional Information (SAI) includes more information about the Trustees. To request a free copy, call Fidelity at 1-800-544-8544.
Interested Trustees*:
Correspondence intended for each Trustee who is an interested person may be sent to Fidelity Investments, 82 Devonshire Street, Boston, Massachusetts 02109.
Name, Age; Principal Occupation |
Edward C. Johnson 3d (76) |
| Year of Election or Appointment: 1984 Mr. Johnson is Chairman of the Board of Trustees. Mr. Johnson serves as President (2006-present), Chief Executive Officer, Chairman, and a Director of FMR Corp.; Chairman and a Director of FMR; Chairman and a Director of Fidelity Research & Analysis Company (FRAC); Chairman and a Director of Fidelity Investments Money Management, Inc.; and Chairman (2001-present) and a Director of FMR Co., Inc. In addition, Mr. Johnson serves as Chairman and Director of Fidelity International Limited (FIL). |
Stephen P. Jonas (53) |
| Year of Election or Appointment: 2005 Mr. Jonas is Senior Vice President of International Small Cap (2005-present). He also serves as Senior Vice President of other Fidelity funds (2005-present). Mr. Jonas is Executive Director of FMR (2005-present) and FMR Co., Inc. (2005-present). He also serves as a Director of Fidelity Investments Money Management, Inc. (2005-present) and FMR Corp. (2003-present). Previously, Mr. Jonas served as President of Fidelity Enterprise Operations and Risk Services (2004-2005), Chief Administrative Officer (2002-2004), and Chief Financial Officer of FMR Corp. (1998-2002). In addition, he serves on the Boards of Boston Ballet (2003-present) and Simmons College (2003-present). |
Robert L. Reynolds (54) |
| Year of Election or Appointment: 2003 Mr. Reynolds is President and a Director of FMR (2005-present), Fidelity Investments Money Management, Inc. (2005-present), and FMR Co., Inc. (2005-present). Mr. Reynolds also serves as Vice Chairman (2006-present), a Director (2003-present), and Chief Operating Officer of FMR Corp. and a Director of Strategic Advisers, Inc. (2005-present). He also serves on the Board at Fidelity Investments Canada, Ltd. |
* Trustees have been determined to be "Interested Trustees" by virtue of, among other things, their affiliation with the trust or various entities under common control with FMR.
Annual Report
Independent Trustees:
Correspondence intended for each Independent Trustee (that is, the Trustees other than the Interested Trustees) may be sent to Fidelity Investments, P.O. Box 55235, Boston, Massachusetts 02205-5235.
Name, Age; Principal Occupation |
Dennis J. Dirks (58) |
| Year of Election or Appointment: 2005 Prior to his retirement in May 2003, Mr. Dirks was Chief Operating Officer and a member of the Board of The Depository Trust & Clearing Corporation (DTCC) (1999-2003). He also served as President, Chief Operating Officer, and Board member of The Depository Trust Company (DTC) (1999-2003) and President and Board member of the National Securities Clearing Corporation (NSCC) (1999-2003). In addition, Mr. Dirks served as Chief Executive Officer and Board member of the Government Securities Clearing Corporation (2001-2003) and Chief Executive Officer and Board member of the Mortgage-Backed Securities Clearing Corporation (2001-2003). Mr. Dirks also serves as a Trustee and a member of the Finance Committee of Manhattan College (2005-present) and a Trustee and a member of the Finance Committee of AHRC of Nassau County (2006-present). |
Albert R. Gamper, Jr. (64) |
| Year of Election or Appointment: 2006 Prior to his retirement in December 2004, Mr. Gamper served as Chairman of the Board of CIT Group Inc. (commercial finance). During his tenure with CIT Group Inc. Mr. Gamper served in numerous senior management positions, including Chairman (1987-1989; 1999-2001; 2002-2004), Chief Executive Officer (1987-2004), and President (1989-2002). He currently serves as a member of the Board of Directors of Public Service Enterprise Group (utilities, 2001-present), Chairman of the Board of Governors, Rutgers University (2004-present), and Chairman of the Board of Saint Barnabas Health Care System. |
George H. Heilmeier (70) |
| Year of Election or Appointment: 2004 Dr. Heilmeier is Chairman Emeritus of Telcordia Technologies (communication software and systems), where prior to his retirement, he served as company Chairman and Chief Executive Officer. He currently serves on the Boards of Directors of The Mitre Corporation (systems engineering and information technology support for the government), and HRL Laboratories (private research and development, 2004-present). He is Chairman of the General Motors Science & Technology Advisory Board and a Life Fellow of the Institute of Electrical and Electronics Engineers (IEEE). Dr. Heilmeier is a member of the Defense Science Board and the National Security Agency Advisory Board. He is also a member of the National Academy of Engineering, the American Academy of Arts and Sciences, and the Board of Overseers of the School of Engineering and Applied Science of the University of Pennsylvania. Previously, Dr. Heilmeier served as a Director of TRW Inc. (automotive, space, defense, and information technology, 1992-2002), Compaq (1994-2002), Automatic Data Processing, Inc. (ADP) (technology-based business outsourcing, 1995-2002), INET Technologies Inc. (telecommunications network surveillance, 2001-2004), and Teletech Holdings (customer management services). He is the recipient of the 2005 Kyoto Prize in Advanced Technology for his invention of the liquid crystal display, and a member of the Consumer Electronics Hall of Fame. |
Marie L. Knowles (60) |
| Year of Election or Appointment: 2001 Prior to Ms. Knowles' retirement in June 2000, she served as Executive Vice President and Chief Financial Officer of Atlantic Richfield Company (ARCO) (diversified energy, 1996-2000). From 1993 to 1996, she was a Senior Vice President of ARCO and President of ARCO Transportation Company. She served as a Director of ARCO from 1996 to 1998. She currently serves as a Director of Phelps Dodge Corporation (copper mining and manufacturing) and McKesson Corporation (healthcare service, 2002-present). Ms. Knowles is a Trustee of the Brookings Institution and the Catalina Island Conservancy and also serves as a member of the Advisory Board for the School of Engineering of the University of Southern California. |
Ned C. Lautenbach (62) |
| Year of Election or Appointment: 2000 Mr. Lautenbach is Chairman of the Independent Trustees (2006-present). Mr. Lautenbach has been a partner of Clayton, Dubilier & Rice, Inc. (private equity investment firm) since September 1998. Previously, Mr. Lautenbach was with the International Business Machines Corporation (IBM) from 1968 until his retirement in 1998. Mr. Lautenbach serves as a Director of Sony Corporation (2006-present) and Eaton Corporation (diversified industrial) as well as the Philharmonic Center for the Arts in Naples, Florida. He also is a member of the Board of Trustees of Fairfield University (2005-present), as well as a member of the Council on Foreign Relations. |
William O. McCoy (73) |
| Year of Election or Appointment: 1997 Prior to his retirement in December 1994, Mr. McCoy was Vice Chairman of the Board of BellSouth Corporation (telecommunications) and President of BellSouth Enterprises. He is currently a Director of Duke Realty Corporation (real estate). He is also a partner of Franklin Street Partners (private investment management firm). In addition, Mr. McCoy served as the Interim Chancellor (1999-2000) and a member of the Board of Visitors for the University of North Carolina at Chapel Hill and currently serves as Chairman of the Board of Directors of the University of North Carolina Health Care System. He also served as Vice President of Finance for the University of North Carolina (16-school system). |
Cornelia M. Small (62) |
| Year of Election or Appointment: 2005 Ms. Small is a member (2000-present) and Chairperson (2002-present) of the Investment Committee, and a member (2002-present) of the Board of Trustees of Smith College. Previously, she served as Chief Investment Officer (1999-2000), Director of Global Equity Investments (1996-1999), and a member of the Board of Directors of Scudder, Stevens & Clark (1990-1997) and Scudder Kemper Investments (1997-1999). In addition, Ms. Small served as Co-Chair (2000-2003) of the Annual Fund for the Fletcher School of Law and Diplomacy. |
William S. Stavropoulos (67) |
| Year of Election or Appointment: 2001 Mr. Stavropoulos is Chairman Emeritus of the Board of Directors of The Dow Chemical Company. Since joining The Dow Chemical Company in 1967, Mr. Stavropoulos served in numerous senior management positions, including President (1993-2000; 2002-2003), CEO (1995-2000; 2002-2004), and Chairman of the Executive Committee (2000-2004). Currently, he is a Director of NCR Corporation (data warehousing and technology solutions), BellSouth Corporation (telecommunications), Chemical Financial Corporation, Maersk Inc. (industrial conglomerate, 2002-present), and Metalmark Capital (private equity investment firm, 2005-present). He also serves as a member of the Board of Trustees of the American Enterprise Institute for Public Policy Research. In addition, Mr. Stavropoulos is a member of The Business Council, J.P. Morgan International Council and the University of Notre Dame Advisory Council for the College of Science. |
Kenneth L. Wolfe (67) |
| Year of Election or Appointment: 2005 Prior to his retirement in 2001, Mr. Wolfe was Chairman and Chief Executive Officer of Hershey Foods Corporation (1993-2001). He currently serves as a member of the boards of Adelphia Communications Corporation (2003-present), Bausch & Lomb, Inc., and Revlon Inc. (2004-present). |
Annual Report
Advisory Board Members and Executive Officers:
Correspondence intended for Mr. Keyes may be sent to Fidelity Investments, P.O. Box 55235, Boston, Massachusetts 02205-5235. Correspondence intended for each executive officer and Mr. Lynch may be sent to Fidelity Investments, 82 Devonshire Street, Boston, Massachusetts 02109.
Name, Age; Principal Occupation |
James H. Keyes (66) |
| Year of Election or Appointment: 2006 Member of the Advisory Board of Fidelity Investment Trust. Prior to his retirement in 2003, Mr. Keyes was Chairman, President, and Chief Executive Officer of Johnson Controls, Inc. (automotive supplier, 1993-2003). He currently serves as a member of the boards of LSI Logic Corporation (semiconductor technologies), Navistar International Corporation (manufacture and sale of trucks, buses, and diesel engines, 2002-present), and Pitney Bowes, Inc. (integrated mail, messaging, and document management solutions). |
Peter S. Lynch (62) |
| Year of Election or Appointment: 2003 Member of the Advisory Board of Fidelity Investment Trust. Mr. Lynch is Vice Chairman and a Director of FMR, and Vice Chairman (2001- present) and a Director of FMR Co., Inc. Previously, Mr. Lynch served as a Trustee of the Fidelity funds (1990-2003). In addition, he serves as a Trustee of Boston College and as the Chairman of the Inner-City Scholarship Fund. |
Dwight D. Churchill (52) |
| Year of Election or Appointment: 2005 Vice President of International Small Cap. Mr. Churchill also serves as Vice President of certain Equity Funds (2005-present). Mr. Churchill is Executive Vice President of FMR (2005-present) and FMR Co., Inc. (2005-present). Previously, Mr. Churchill served as Senior Vice President of Fidelity Investments Money Management, Inc. (2005-2006), Head of Fidelity's Fixed-Income Division (2000-2005), Vice President of Fidelity's Money Market Funds (2000-2005), Vice President of Fidelity's Bond Funds, and Senior Vice President of FMR. |
Eric M. Wetlaufer (44) |
| Year of Election or Appointment: 2006 Vice President of International Small Cap. Mr. Wetlaufer also serves as Vice President of certain International Equity Funds (2006-present). Mr. Wetlaufer is Senior Vice President of FMR (2006-present) and FMR Co., Inc. (2006-present), and President and Director of Fidelity Management & Research (U.K.) Inc. (2006-present) and Fidelity Research & Analysis Company (2006-present). Before joining Fidelity Investments in 2005, Mr. Wetlaufer was a partner in Oxhead Capital Management (2004-2005). Previously, Mr. Wetlaufer served as a Chief Investment Officer of Putnam Investments (1997-2003). |
Ben Paton (45) |
| Year of Election or Appointment: 2004 Vice President of International Small Cap. Mr. Paton serves as Vice President of another fund advised by FMR. Prior to his current responsibilities, Mr. Paton worked as a research analyst and manager. |
Tokuya Sano (35) |
| Year of Election or Appointment: 2002 Vice President of International Small Cap. Mr. Sano also serves as Vice President of another fund advised by FMR. Prior to his current responsibilities, Mr. Sano worked as a research analyst and manager. |
Wilson L. Wong (33) |
| Year of Election or Appointment: 2005 Vice President of International Small Cap. Mr. Wong also serves as Vice President of another fund advised by FMR. Prior to his current responsibilities, Mr. Wong worked as an investment analyst and portfolio manager. |
Eric D. Roiter (57) |
| Year of Election or Appointment: 2002 Secretary of International Small Cap. He also serves as Secretary of other Fidelity funds; Vice President, General Counsel, and Secretary of FMR Co., Inc. (2001-present) and FMR; Assistant Secretary of Fidelity Management & Research (U.K.) Inc. (2001-present), Fidelity Research & Analysis Company (2001-present), and Fidelity Investments Money Management, Inc. (2001-present). Mr. Roiter is an Adjunct Member, Faculty of Law, at Boston College Law School (2003-present). Previously, Mr. Roiter served as Vice President and Secretary of Fidelity Distributors Corporation (FDC) (1998-2005). |
Stuart Fross (47) |
| Year of Election or Appointment: 2003 Assistant Secretary of International Small Cap. Mr. Fross also serves as Assistant Secretary of other Fidelity funds (2003-present), Vice President and Secretary of FDC (2005-present), and is an employee of FMR. |
Christine Reynolds (48) |
| Year of Election or Appointment: 2004 President and Treasurer of International Small Cap. Ms. Reynolds also serves as President and Treasurer of other Fidelity funds (2004-present) and is a Vice President (2003-present) and an employee (2002-present) of FMR. Before joining Fidelity Investments, Ms. Reynolds worked at PricewaterhouseCoopers LLP (PwC) (1980-2002), where she was most recently an audit partner with PwC's investment management practice. |
R. Stephen Ganis (40) |
| Year of Election or Appointment: 2006 Anti-Money Laundering (AML) officer of International Small Cap. Mr. Ganis also serves as AML officer of other Fidelity funds (2006- present) and FMR Corp. (2003-present). Before joining Fidelity Investments, Mr. Ganis practiced law at Goodwin Procter, LLP (2000-2002). |
Joseph B. Hollis (58) |
| Year of Election or Appointment: 2006 Chief Financial Officer of International Small Cap. Mr. Hollis also serves as Chief Financial Officer of other Fidelity funds. Mr. Hollis is President of Fidelity Pricing and Cash Management Services (FPCMS) (2005- present). Mr. Hollis also serves as President and Director of Fidelity Service Company, Inc. (2006-present). Previously, Mr. Hollis served as Senior Vice President of Cash Management Services (1999-2002) and Investment Management Operations (2002-2005). |
Kenneth A. Rathgeber (59) |
| Year of Election or Appointment: 2004 Chief Compliance Officer of International Small Cap. Mr. Rathgeber also serves as Chief Compliance Officer of other Fidelity funds (2004-present) and Executive Vice President of Risk Oversight for Fidelity Investments (2002-present). He is Chief Compliance Officer of FMR (2005-present), FMR Co., Inc. (2005-present), Fidelity Management & Research (U.K.) Inc. (2005-present), Fidelity Research & Analysis Company (2005-present), Fidelity Investments Money Management, Inc. (2005-present), and Strategic Advisers, Inc. (2005-present). Previously, Mr. Rathgeber served as Executive Vice President and Chief Operating Officer for Fidelity Investments Institutional Services Company, Inc. (1998-2002). |
Bryan A. Mehrmann (45) |
| Year of Election or Appointment: 2005 Deputy Treasurer of International Small Cap. Mr. Mehrmann also serves as Deputy Treasurer of other Fidelity funds (2005-present) and is an employee of FMR. Previously, Mr. Mehrmann served as Vice President of Fidelity Investments Institutional Services Group (FIIS)/Fidelity Investments Institutional Operations Corporation, Inc. (FIIOC) Client Services (1998-2004). |
Kimberley H. Monasterio (42) |
| Year of Election or Appointment: 2004 Deputy Treasurer of International Small Cap. Ms. Monasterio also serves as Deputy Treasurer of other Fidelity funds (2004) and is an employee of FMR (2004). Before joining Fidelity Investments, Ms. Monasterio served as Treasurer (2000-2004) and Chief Financial Officer (2002-2004) of the Franklin Templeton Funds and Senior Vice President of Franklin Templeton Services, LLC (2000-2004). |
Kenneth B. Robins (37) |
| Year of Election or Appointment: 2005 Deputy Treasurer of International Small Cap. Mr. Robins also serves as Deputy Treasurer of other Fidelity funds (2005-present) and is an employee of FMR (2004-present). Before joining Fidelity Investments, Mr. Robins worked at KPMG LLP, where he was a partner in KPMG's department of professional practice (2002-2004) and a Senior Manager (1999-2000). In addition, Mr. Robins served as Assistant Chief Accountant, United States Securities and Exchange Commission (2000-2002). |
Robert G. Byrnes (39) |
| Year of Election or Appointment: 2005 Assistant Treasurer of International Small Cap. Mr. Byrnes also serves as Assistant Treasurer of other Fidelity funds (2005-present) and is an employee of FMR (2005-present). Previously, Mr. Byrnes served as Vice President of FPCMS (2003-2005). Before joining Fidelity Investments, Mr. Byrnes worked at Deutsche Asset Management where he served as Vice President of the Investment Operations Group (2000-2003). |
John H. Costello (60) |
| Year of Election or Appointment: 2002 Assistant Treasurer of International Small Cap. Mr. Costello also serves as Assistant Treasurer of other Fidelity funds and is an employee of FMR. |
Peter L. Lydecker (52) |
| Year of Election or Appointment: 2004 Assistant Treasurer of International Small Cap. Mr. Lydecker also serves as Assistant Treasurer of other Fidelity funds (2004) and is an employee of FMR. |
Mark Osterheld (51) |
| Year of Election or Appointment: 2002 Assistant Treasurer of International Small Cap. Mr. Osterheld also serves as Assistant Treasurer of other Fidelity funds (2002) and is an employee of FMR. |
Gary W. Ryan (48) |
| Year of Election or Appointment: 2005 Assistant Treasurer of International Small Cap. Mr. Ryan also serves as Assistant Treasurer of other Fidelity funds (2005-present) and is an employee of FMR (2005-present). Previously, Mr. Ryan served as Vice President of Fund Reporting in FPCMS (1999-2005). |
Salvatore Schiavone (40) |
| Year of Election or Appointment: 2005 Assistant Treasurer of International Small Cap. Mr. Schiavone also serves as Assistant Treasurer of other Fidelity funds (2005-present) and is an employee of FMR (2005-present). Before joining Fidelity Investments, Mr. Schiavone worked at Deutsche Asset Management, where he most recently served as Assistant Treasurer (2003-2005) of the Scudder Funds and Vice President and Head of Fund Reporting (1996-2003). |
Annual Report
Distributions
The Board of Trustees of Advisor International Small Cap Fund voted to pay to shareholders of record at the opening of business on record date, the following distributions per share derived from capital gains realized from sales of portfolio securities, and dividends derived from net investment income:
| Pay Date | Record Date | Dividends | Capital Gains |
Advisor International Small Cap Fund | 12/11/06 | 12/08/06 | $.065 | $5.675 |
The fund hereby designates as a capital gain dividend with respect to the taxable year ended October 31, 2006, $310,524,390, or, if subsequently determined to be different, the net capital gain of such year.
The amounts per share which represent income derived from sources within, and taxes paid to, foreign countries or possessions of the United States are $.210 and $.0228 for the dividend paid December 12, 2005.
The fund will notify shareholders in January 2007 of amounts for use in preparing 2006 income tax returns.
Annual Report
Board Approval of Investment Advisory Contracts and Management Fees
Fidelity International Small Cap Fund
Each year, typically in July, the Board of Trustees, including the Independent Trustees (together, the Board), votes on the renewal of the management contract and sub-advisory agreements (together, the Advisory Contracts) for the fund. The Board, assisted by the advice of fund counsel and Independent Trustees' counsel, requests and considers a broad range of information throughout the year.
The Board meets regularly each month except August and takes into account throughout the year matters bearing on Advisory Contracts. The Board, acting directly and through its separate committees, considers at each of its meetings factors that are relevant to the annual renewal of the fund's Advisory Contracts, including the services and support provided to the fund and its shareholders. At the time of the renewal, the Board had 12 standing committees, each composed of Independent Trustees with varying backgrounds, to which the Board has assigned specific subject matter responsibilities in order to enhance effective decision-making by the Board. Each committee has adopted a written charter outlining the structure and purposes of the committee. One such committee, the Equity Contract Committee, meets periodically as needed throughout the year to consider matters specifically related to the annual renewal of Advisory Contracts. The committee requests and receives information on, and makes recommendations to the Independent Trustees concerning, the approval and annual review of the Advisory Contracts.
At its July 2006 meeting, the Board of Trustees, including the Independent Trustees, unanimously determined to renew the Advisory Contracts for the fund. In reaching its determination, the Board considered all factors it believed relevant, including (i) the nature, extent, and quality of the services to be provided to the fund and its shareholders (including the investment performance of the fund); (ii) the competitiveness of the management fee and total expenses of the fund; (iii) the total costs of the services to be provided by and the profits to be realized by the investment adviser and its affiliates from the relationship with the fund; (iv) the extent to which economies of scale would be realized as the fund grows; and (v) whether fee levels reflect these economies of scale, if any, for the benefit of fund shareholders.
In determining whether to renew the Advisory Contracts for the fund, the Board ultimately reached a determination, with the assistance of fund counsel and Independent Trustees' counsel, that the renewal of the Advisory Contracts and the compensation to be received by Fidelity under the management contract is consistent with Fidelity's fiduciary duty under applicable law. In addition to evaluating the specific factors noted above, the Board, in reaching its determination, is aware that shareholders in the fund have a broad range of investment choices available to them, including a wide choice among mutual funds offered by competitors to Fidelity, and that the fund's shareholders, with the opportunity to review and weigh the disclosure provided by the fund in its prospectus and other public disclosures, have chosen to invest in this fund, managed by Fidelity.
Annual Report
Board Approval of Investment Advisory Contracts and
Management Fees - continued
Nature, Extent, and Quality of Services Provided. The Board considered staffing within the investment adviser, FMR, and the sub-advisers (together, the Investment Advisers), including the backgrounds of the fund's portfolio managers and the fund's investment objective and discipline. The Independent Trustees also had discussions with senior management of Fidelity's investment operations and investment groups. The Board considered the structure of the portfolio manager compensation program and whether this structure provides appropriate incentives.
Resources Dedicated to Investment Management and Support Services. The Board reviewed the size, education, and experience of the Investment Advisers' investment staff, their use of technology, and the Investment Advisers' approach to recruiting, training, and retaining portfolio managers and other research, advisory, and management personnel. The Board considered Fidelity's extensive global research capabilities that enable the Investment Advisers to aggregate data from various sources in an effort to produce positive investment results. The Board noted that Fidelity's analysts have access to a variety of technological tools that enable them to perform both fundamental and quantitative analysis and to specialize in various disciplines. The Board also considered that Fidelity's portfolio managers and analysts have access to daily portfolio attribution that allows for monitoring of a fund's portfolio, as well as an electronic communication system that provides immediate real-time access to research concerning issuers and credit enhancers.
Shareholder and Administrative Services. The Board considered (i) the nature, extent, quality, and cost of administrative, distribution, and shareholder services performed by the Investment Advisers and their affiliates under the Advisory Contracts and under separate agreements covering transfer agency, pricing and bookkeeping, and securities lending services for the fund; (ii) the nature and extent of the Investment Advisers' supervision of third party service providers, principally custodians and subcustodians; and (iii) the resources devoted to, and the record of compliance with, the fund's compliance policies and procedures. The Board reviewed the allocation of fund brokerage, including allocations to brokers affiliated with the Investment Advisers, the use of brokerage commissions to pay fund expenses, and the use of "soft" commission dollars to pay for research services. The Board also considered that Fidelity voluntarily pays for market data out of its own resources.
The Board noted that the growth of fund assets across the complex allows Fidelity to reinvest in the development of services designed to enhance the value or convenience of the Fidelity funds as investment vehicles. These services include 24-hour access to account information and market information through phone representatives and over the Internet, and investor education materials and asset allocation tools.
Annual Report
Investment in a Large Fund Family. The Board considered the benefits to shareholders of investing in a Fidelity fund, including the benefits of investing in a fund that is part of a large family of funds offering a variety of investment disciplines and providing for a large variety of mutual fund investor services. For example, fund shareholders are offered the privilege of exchanging shares of the fund for shares of other Fidelity funds, as set forth in the fund's prospectus, without paying an additional sales charge. The Board noted that, since the last Advisory Contract renewals in July 2005, Fidelity has taken a number of actions that benefited particular funds, including (i) dedicating additional resources to investment research and to restructure the investment research teams; (ii) voluntarily entering into contractual arrangements with certain brokers pursuant to which Fidelity pays for research products and services separately out of its own resources, rather than bundling with fund commissions; (iii) launching the Fidelity Advantage Class of its five Spartan stock index funds and three Spartan bond index funds, which is a lower-fee class available to shareholders with higher account balances; (iv) contractually agreeing to impose expense limitations on Fidelity U.S. Bond Index Fund and reducing the fund's initial investment minimum; and (v) offering shareholders of each of the Fidelity Institutional Money Market Funds the privilege of exchanging shares of the fund for shares of other Fidelity funds.
Investment Performance and Compliance. The Board considered whether the fund has operated within its investment objective, as well as its record of compliance with its investment restrictions. It also reviewed the fund's absolute investment performance for each class, as well as the fund's relative investment performance for each class measured against (i) a broad-based securities market index, and (ii) a peer group of mutual funds deemed appropriate by the Board over multiple periods. Because the fund had been in existence less than five calendar years, the following charts considered by the Board show, over the one- and three-year periods ended December 31, 2005, as applicable, the cumulative total returns of Class C and Fidelity International Small Cap (retail class), the cumulative total returns of a broad-based securities market index ("benchmark"), and a range of cumulative total returns of a peer group of mutual funds identified by Lipper Inc. as having an investment objective similar to that of the fund. The returns of Class C and Fidelity International Small Cap (retail class) represent the performance of classes with the highest and lowest 12b-1 fees, respectively (not necessarily with the highest and lowest total expenses). The box within each chart shows the 25th percentile return (bottom of box) and the 75th percentile return (top of box) of the Lipper peer group. Returns shown above the box are in the first quartile and returns shown below the box are in the fourth quartile. The percentage beaten numbers noted below each chart correspond to the percentile box and represent the percentage of funds in the Lipper peer group whose performance was equal to or lower than that of the class indicated.
Annual Report
Board Approval of Investment Advisory Contracts and
Management Fees - continued
Fidelity International Small Cap Fund
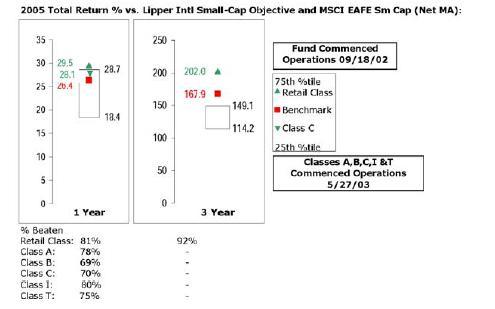
The Board reviewed the fund's relative investment performance against its Lipper peer group and stated that the performance of Fidelity International Small Cap (retail class) was in the first quartile for all the periods shown. The Board also stated that the relative investment performance of Fidelity International Small Cap (retail class) compared favorably to its benchmark for all the periods shown. The Board considered that the variations in performance among the fund's classes reflect the variations in class expenses, which result in lower performance for higher expense classes.
The Board also considered that the fund's management fee is subject to upward or downward adjustment depending upon whether, and to what extent, the fund's investment performance for the performance period exceeds, or is exceeded by, the record (over the same period) of a Board-approved performance adjustment index. The Board realizes that the performance adjustment provides FMR with a strong economic incentive to seek to achieve superior performance for the fund's shareholders and helps to more closely align the interests of FMR and the fund's shareholders.
The Board considered that FMR has taken steps to refocus and strengthen equity research, equity portfolio management, and compliance. The Board noted with favor FMR's reorganization of its senior management team in 2005 and FMR's dedication of additional resources to investment research, and participated in the process that led to those changes.
Based on its review, and giving particular weight to the nature and quality of the resources dedicated by the Investment Advisers to maintain and improve relative performance, the Board concluded that the nature, extent, and quality of the services provided to the fund will benefit the fund's shareholders, particularly in light of the Board's view that the fund's shareholders benefit from investing in a fund that is part of a large family of funds offering a variety of investment disciplines and services.
Annual Report
Competitiveness of Management Fee and Total Fund Expenses. The Board considered the fund's management fee and total expenses compared to "mapped groups" of competitive funds and classes. Fidelity creates "mapped groups" by combining similar Lipper investment objective categories that have comparable management fee characteristics. Combining Lipper investment objective categories aids the Board's management fee and total expense comparisons by broadening the competitive group used for comparison and by reducing the number of universes to which various Fidelity funds are compared.
The Board considered two proprietary management fee comparisons for the 12-month (or shorter) periods shown in the chart below. The group of Lipper funds used by the Board for management fee comparisons is referred to below as the "Total Mapped Group" and, for the reasons explained above, is broader than the Lipper peer group used by the Board for performance comparisons. The Total Mapped Group comparison focuses on a fund's standing relative to the total universe of comparable funds available to investors, in terms of gross management fees before expense reimbursements or caps, and without giving effect to the fund's performance adjustment. "TMG %" represents the percentage of funds in the Total Mapped Group that had management fees that were lower than the fund's. For example, a TMG % of 37% means that 63% of the funds in the Total Mapped Group had higher management fees than the fund. The "Asset-Size Peer Group" (ASPG) comparison focuses on a fund's standing relative to non-Fidelity funds similar in size to the fund within the Total Mapped Group. The ASPG represents at least 15% of the funds in the Total Mapped Group with comparable asset size and management fee characteristics, subject to a minimum of 50 funds (or all funds in the Total Mapped Group if fewer than 50). Additional information, such as the ASPG quartile in which the fund's management fee ranked and the impact of the fund's performance adjustment, is also included in the chart and considered by the Board.
Annual Report
Board Approval of Investment Advisory Contracts and
Management Fees - continued
Fidelity International Small Cap Fund

The Board noted that the fund's management fee ranked below the median of its Total Mapped Group and equal to the median of its ASPG for 2005. The Board also noted the effect of the fund's positive performance adjustment on the fund's management fee ranking. The Board noted that the performance adjustment for each year represents calculations for rolling 36-month periods that differ from the periods shown in the performance charts above.
Based on its review, the Board concluded that the fund's management fee was fair and reasonable in light of the services that the fund receives and the other factors considered.
In its review of each class's total expenses, the Board considered the fund's management fee as well as other fund or class expenses, as applicable, such as transfer agent fees, pricing and bookkeeping fees, fund-paid 12b-1 fees, and custodial, legal, and audit fees. The Board also noted the effects of any waivers and reimbursements on fees and expenses, as well as the fund's positive performance adjustment. As part of its review, the Board also considered current and historical total expenses of each class of the fund compared to competitive fund median expenses. Each class of the fund is compared to those funds and classes in the Total Mapped Group (used by the Board for management fee comparisons) that have a similar sales load structure.
The Board noted that the total expenses of Fidelity International Small Cap (retail class) ranked below its competitive median for 2005, and the total expenses of each of Class A, Class B, Class C, Class T and Institutional Class ranked above its competitive median for 2005. The Board considered that the fund is an international small cap fund, but that the broader competitive mapped group includes international funds of all cap levels because there are relatively few international funds focused on small caps. The Board noted that the fund offers multiple classes, each of which has a different sales load and 12b-1 fee structure, and that the multiple structures are intended to offer a range of pricing options for the intermediary market. The Board also noted that the total expenses of the classes vary primarily by the level of their 12b-1 fees, although differences in transfer agent fees may also cause expenses to vary from class to class.
Annual Report
In its review of total expenses, the Board also considered Fidelity fee structures and other information on clients that FMR and its affiliates service in other competitive markets, such as other mutual funds advised or subadvised by FMR or its affiliates, pension plan clients, and other institutional clients.
Based on its review, the Board concluded that the total expenses of each class of the fund were reasonable, although in some cases above the median of the universe presented for comparison, in light of the services that the fund and its shareholders receive and the other factors considered.
Costs of the Services and Profitability. The Board considered the revenues earned and the expenses incurred by Fidelity in conducting the business of developing, marketing, distributing, managing, administering and servicing the fund and its shareholders. The Board also considered the level of Fidelity's profits in respect of all the Fidelity funds.
On an annual basis, FMR presents to the Board Fidelity's profitability for the fund. Fidelity calculates the profitability for each fund, as well as aggregate profitability for groups of Fidelity funds and all Fidelity funds, using a series of detailed revenue and cost allocation methodologies which originate with the audited books and records of Fidelity. The Audit Committee of the Board reviews any significant changes from the prior year's methodologies.
PricewaterhouseCoopers LLP (PwC), independent registered accounting firm and auditor to Fidelity and certain Fidelity funds, has been engaged annually by the Board as part of the Board's assessment of the results of Fidelity's profitability analysis. PwC's engagement includes the review and assessment of Fidelity's methodologies used in determining the revenues and expenses attributable to Fidelity's mutual fund business, and completion of agreed-upon procedures surrounding the mathematical accuracy of fund profitability and its conformity to allocation methodologies. After considering PwC's reports issued under the engagement and information provided by Fidelity, the Board believes that while other allocation methods may also be reasonable, Fidelity's profitability methodologies are reasonable in all material respects.
Annual Report
Board Approval of Investment Advisory Contracts and
Management Fees - continued
The Board has also reviewed Fidelity's non-fund businesses and any fall-out benefits related to the mutual fund business as well as cases where Fidelity's affiliates may benefit from or be related to the fund's business.
The Board considered the costs of the services provided by and the profits realized by Fidelity in connection with the operation of the fund and determined that the amount of profit is a fair entrepreneurial profit for the management of the fund.
Economies of Scale. The Board considered whether there have been economies of scale in respect of the management of the Fidelity funds, whether the Fidelity funds (including the fund) have appropriately benefited from any such economies of scale, and whether there is potential for realization of any further economies of scale. The Board considered the extent to which the fund will benefit from economies of scale through increased services to the fund, through waivers or reimbursements, or through fee or expense reductions, including reductions that occur through operation of the transfer agent agreement. The transfer agent fee varies in part based on the number of accounts in the fund. If the number of accounts decreases or the average account size increases, the overall transfer agent fee rate decreases.
The Board recognized that the fund's management contract incorporates a "group fee" structure, which provides for lower fee rates as total fund assets under FMR's management increase, and for higher fee rates as total fund assets under FMR's management decrease. The Board considered that the group fee is designed to deliver the benefits of economies of scale to fund shareholders when total fund assets increase, even if assets of any particular fund are unchanged or have declined, because some portion of Fidelity's costs are attributable to services provided to all Fidelity funds, and all funds benefit if those costs can be allocated among more assets. The Board also considered that although the fund is partially closed to new investors, it continues to incur investment management expenses, and marketing and distribution expenses related to the retention of existing shareholders and assets. The Board further noted that the fund may continue to realize benefits from the group fee structure, even though assets may not be expected to grow significantly at the fund level. The Board concluded that, given the group fee structure, fund shareholders will achieve a certain level of economies of scale as assets under FMR's management increase at the fund complex level, regardless of whether Fidelity achieves any such economies of scale.
The Board further concluded that any potential economies of scale are being shared between fund shareholders and Fidelity in an appropriate manner.
Additional Information Requested by the Board. In order to develop fully the factual basis for consideration of the Advisory Contracts, the Board requested additional information on several topics, including (i) Fidelity's fund profitability methodology and profitability trends within certain funds; (ii) portfolio manager compensation; (iii) the extent to which any economies of scale exist and are shared between the funds and Fidelity; (iv) the total expenses of certain funds and classes relative to competitors, including the extent to which the expenses of certain funds have been or could be capped; (v) fund performance trends; and (vi) Fidelity's fee structures, including use of performance fees.
Annual Report
Based on its evaluation of all of the conclusions noted above, and after considering all material factors, the Board ultimately concluded that the advisory fee structures are fair and reasonable, and that the fund's Advisory Contracts should be renewed.
Annual Report
Managing Your Investments
Fidelity offers several ways to conveniently manage your personal investments via your telephone or PC. You can access your account information, conduct trades and research your investments 24 hours a day.
By Phone
Fidelity Automated Service Telephone provides a single toll-free number to access account balances, positions, quotes and trading. It's easy to navigate the service, and on your first call, the system will help you create a personal identification number (PIN) for security.
(phone_graphic)Fidelity Automated
Service Telephone (FAST®)
1-800-544-5555
Press
1 For mutual fund and brokerage trading.
2 For quotes.*
3 For account balances and holdings.
4 To review orders and mutual
fund activity.
5 To change your PIN.
*0 To speak to a Fidelity representative.
By PC
Fidelity's web site on the Internet provides a wide range of information, including daily financial news, fund performance, interactive planning tools and news about Fidelity products and services.
(computer_graphic)Fidelity's Web Site
www.fidelity.com
* When you call the quotes line, please remember that a fund's yield and return will vary and, except for money market funds, share price will also vary. This means that you may have a gain or loss when you sell your shares. There is no assurance that money market funds will be able to maintain a stable $1 share price; an investment in a money market fund is not insured or guaranteed by the U.S. government. Total returns are historical and include changes in share price, reinvestment of dividends and capital gains, and the effects of any sales charges.
Annual Report
To Visit Fidelity
For directions and hours,
please call 1-800-544-9797.
Arizona
7001 West Ray Road
Chandler, AZ
15445 N. Scottsdale Road
Scottsdale, AZ
California
815 East Birch Street
Brea, CA
1411 Chapin Avenue
Burlingame, CA
851 East Hamilton Avenue
Campbell, CA
19200 Von Karman Avenue
Irvine, CA
601 Larkspur Landing Circle
Larkspur, CA
10100 Santa Monica Blvd.
Los Angeles, CA
27101 Puerta Real
Mission Viejo, CA
73-575 El Paseo
Palm Desert, CA
251 University Avenue
Palo Alto, CA
123 South Lake Avenue
Pasadena, CA
16995 Bernardo Ctr. Drive
Rancho Bernardo, CA
1220 Roseville Parkway
Roseville, CA
1740 Arden Way
Sacramento, CA
7676 Hazard Center Drive
San Diego, CA
11943 El Camino Real
San Diego, CA
8 Montgomery Street
San Francisco, CA
3793 State Street
Santa Barbara, CA
1200 Wilshire Boulevard
Santa Monica, CA
21701 Hawthorne Boulevard
Torrance, CA
2001 North Main Street
Walnut Creek, CA
6300 Canoga Avenue
Woodland Hills, CA
Colorado
1625 Broadway
Denver, CO
9185 Westview Road
Lone Tree, CO
Connecticut
48 West Putnam Avenue
Greenwich, CT
265 Church Street
New Haven, CT
300 Atlantic Street
Stamford, CT
29 South Main Street
West Hartford, CT
Delaware
400 Delaware Avenue
Wilmington, DE
Florida
4400 N. Federal Highway
Boca Raton, FL
121 Alhambra Plaza
Coral Gables, FL
2948 N. Federal Highway
Ft. Lauderdale, FL
4671 Town Center Parkway
Jacksonville, FL
1907 West State Road 434
Longwood, FL
8880 Tamiami Trail, North
Naples, FL
3501 PGA Boulevard
Palm Beach Gardens, FL
3550 Tamiami Trail, South
Sarasota, FL
1502 N. Westshore Blvd.
Tampa, FL
2465 State Road 7
Wellington, FL
Georgia
3445 Peachtree Road, N.E.
Atlanta, GA
1000 Abernathy Road
Atlanta, GA
Illinois
One North LaSalle Street
Chicago, IL
875 North Michigan Ave.
Chicago, IL
1415 West 22nd Street
Oak Brook, IL
1572 East Golf Road
Schaumburg, IL
3232 Lake Avenue
Wilmette, IL
Indiana
4729 East 82nd Street
Indianapolis, IN
Kansas
5400 College Boulevard
Overland Park, KS
Maine
Three Canal Plaza
Portland, ME
Maryland
7315 Wisconsin Avenue
Bethesda, MD
One W. Pennsylvania Ave.
Towson, MD
Massachusetts
801 Boylston Street
Boston, MA
155 Congress Street
Boston, MA
300 Granite Street
Braintree, MA
44 Mall Road
Burlington, MA
238 Main Street
Cambridge, MA
405 Cochituate Road
Framingham, MA
416 Belmont Street
Worcester, MA
Annual Report
Fidelity Brokerage Services, Inc., 100 Summer St., Boston, MA 02110 Member NYSE/SIPC
Michigan
500 E. Eisenhower Pkwy.
Ann Arbor, MI
280 Old N. Woodward Ave.
Birmingham, MI
43420 Grand River Avenue
Novi, MI
29155 Northwestern Hwy.
Southfield, MI
Minnesota
7600 France Avenue South
Edina, MN
Missouri
1524 South Lindbergh Blvd.
St. Louis, MO
Nevada
2225 Village Walk Drive
Henderson, NV
New Jersey
150 Essex Street
Millburn, NJ
56 South Street
Morristown, NJ
396 Route 17, North
Paramus, NJ
3518 Route 1 North
Princeton, NJ
530 Broad Street
Shrewsbury, NJ
New York
1055 Franklin Avenue
Garden City, NY
37 West Jericho Turnpike
Huntington Station, NY
1271 Avenue of the Americas
New York, NY
980 Madison Avenue
New York, NY
61 Broadway
New York, NY
350 Park Avenue
New York, NY
200 Fifth Avenue
New York, NY
733 Third Avenue
New York, NY
11 Penn Plaza
New York, NY
2070 Broadway
New York, NY
1075 Northern Blvd.
Roslyn, NY
799 Central Park Avenue
Scarsdale, NY
North Carolina
4611 Sharon Road
Charlotte, NC
7011 Fayetteville Road
Durham, NC
Ohio
3805 Edwards Road
Cincinnati, OH
1324 Polaris Parkway
Columbus, OH
28699 Chagrin Boulevard
Woodmere Village, OH
Oregon
7493 SW Bridgeport Road
Tigard, OR
Pennsylvania
600 West DeKalb Pike
King of Prussia, PA
1735 Market Street
Philadelphia, PA
12001 Perry Highway
Wexford, PA
Rhode Island
47 Providence Place
Providence, RI
Tennessee
6150 Poplar Avenue
Memphis, TN
Texas
10000 Research Boulevard
Austin, TX
4001 Northwest Parkway
Dallas, TX
12532 Memorial Drive
Houston, TX
2701 Drexel Drive
Houston, TX
6560 Fannin Street
Houston, TX
6500 N. MacArthur Blvd.
Irving, TX
6005 West Park Boulevard
Plano, TX
14100 San Pedro
San Antonio, TX
1576 East Southlake Blvd.
Southlake, TX
19740 IH 45 North
Spring, TX
Utah
279 West South Temple
Salt Lake City, UT
Virginia
1861 International Drive
McLean, VA
Washington
411 108th Avenue, N.E.
Bellevue, WA
1518 6th Avenue
Seattle, WA
Washington, DC
1900 K Street, N.W.
Washington, DC
Wisconsin
595 North Barker Road
Brookfield, WI
Annual Report
Investment Adviser
Fidelity Management & Research Company
Boston, MA
Investment Sub-Advisers
FMR Co., Inc.
Fidelity Management & Research
(U.K.) Inc.
Fidelity Research & Analysis
Company (formerly Fidelity
Management & Research (Far East) Inc.)
Fidelity International Investment
Advisors
Fidelity Investments Japan Limited
Fidelity International Investment
Advisors (U.K.) Limited
General Distributor
Fidelity Distributors Corporation
Boston, MA
Transfer and Service Agent
Fidelity Service Company, Inc.
Boston, MA
Custodian
Mellon Bank
Pittsburgh, PA
The Fidelity Telephone Connection
Mutual Fund 24-Hour Service
Exchanges/Redemptions
and Account Assistance 1-800-544-6666
Product Information 1-800-544-8888
Retirement Accounts 1-800-544-4774
(8 a.m. - 9 p.m.)
TDD Service 1-800-544-0118
for the deaf and hearing impaired
(9 a.m. - 9 p.m. Eastern time)
Fidelity Automated Service
Telephone (FAST®) (automated graphic) 1-800-544-5555
(automated graphic) Automated line for quickest service
(Fidelity Investment logo)(registered trademark)
Corporate Headquarters
82 Devonshire St., Boston, MA 02109
www.fidelity.com
ISC-UANN-1206
1.793584.103
(Fidelity Investment logo)(registered trademark)
Fidelity Advisor
International Small Cap
Fund - Institutional Class
Annual Report
October 31, 2006
(2_fidelity_logos) (Registered_Trademark)
Institutional Class is a class of
Fidelity® International Small Cap Fund
Contents
Chairman's Message | 4 | Ned Johnson's message to shareholders. |
Performance | 5 | How the fund has done over time. |
Management's Discussion | 6 | The managers' review of fund performance, strategy and outlook. |
Shareholder Expense Example | 7 | An example of shareholder expenses. |
Investment Changes | 9 | A summary of major shifts in the fund's investments over the past six months. |
Investments | 11 | A complete list of the fund's investments with their market values. |
Financial Statements | 35 | Statements of assets and liabilities, operations, and changes in net assets,
as well as financial highlights. |
Notes | 45 | Notes to the financial statements. |
Report of Independent Registered Public Accounting Firm | 55 | |
Trustees and Officers | 56 | |
Distributions | 67 | |
Board Approval of Investment Advisory Contracts and Management Fees | 68 | |
To view a fund's proxy voting guidelines and proxy voting record for the 12-month period ended June 30, visit www.fidelity.com/proxyvotingresults or visit the Securities and Exchange Commission's (SEC) web site at www.sec.gov. You may also call 1-877-208-0098 to request a free copy of the proxy voting guidelines.
Standard & Poor's, S&P and S&P 500 are registered service marks of The McGraw-Hill Companies, Inc. and have been licensed for use by Fidelity Distributors Corporation.
Other third party marks appearing herein are the property of their respective owners.
All other marks appearing herein are registered or unregistered trademarks or service marks of FMR Corp. or an affiliated company.
Annual Report
This report and the financial statements contained herein are submitted for the general information of the shareholders of the fund. This report is not authorized for distribution to prospective investors in the fund unless preceded or accompanied by an effective prospectus.
A fund files its complete schedule of portfolio holdings with the SEC for the first and third quarters of each fiscal year on Form N-Q. Forms N-Q are available on the SEC's web site at http://www.sec.gov. A fund's Forms N-Q may be reviewed and copied at the SEC's Public Reference Room in Washington, DC. Information regarding the operation of the SEC's Public Reference Room may be obtained by calling 1-800-SEC-0330. For a complete list of a fund's portfolio holdings, view the most recent quarterly holdings report, semiannual report, or annual report on Fidelity's web site at http://www.advisor.fidelity.com.
NOT FDIC INSURED · MAY LOSE VALUE · NO BANK GUARANTEE
Neither the fund nor Fidelity Distributors Corporation is a bank.
Annual Report
Chairman's Message
(photo_of_Edward_C_Johnson_3d)
Dear Shareholder:
Stock and bond markets around the world have seen largely positive results year to date, although weakness in the technology sector and growth stocks in general have tempered performance. While financial markets are always unpredictable, there are a number of time-tested principles that can put the historical odds in your favor.
One of the basic tenets is to invest for the long term. Over time, riding out the markets' inevitable ups and downs has proven much more effective than selling into panic or chasing the hottest trend. Even missing only a few of the markets' best days can significantly diminish investor returns. Patience also affords the benefits of compounding - of earning interest on additional income or reinvested dividends and capital gains. There are tax advantages and cost benefits to consider as well. The more you sell, the more taxes you pay, and the more you trade, the higher the costs. While staying the course doesn't eliminate risk, it can considerably lessen the effect of short-term declines.
You can further manage your investing risk through diversification. And today, more than ever, geographic diversification should be taken into account. Studies indicate that asset allocation is the single most important determinant of a portfolio's long-term success. The right mix of stocks, bonds and cash - aligned to your particular risk tolerance and investment objective - is very important. Age-appropriate rebalancing is also an essential aspect of asset allocation. For younger investors, an emphasis on equities - which historically have been the best performing asset class over time - is encouraged. As investors near their specific goal, such as retirement or sending a child to college, consideration may be given to replacing volatile assets (e.g. common stocks) with more-stable fixed investments (bonds or savings plans).
A third investment principle - investing regularly - can help lower the average cost of your purchases. Investing a certain amount of money each month or quarter helps ensure you won't pay for all your shares at market highs. This strategy - known as dollar cost averaging - also reduces unconstructive "emotion" from investing, helping shareholders avoid selling weak performers just prior to an upswing, or chasing a hot performer just before a correction.
We invite you to contact us via the Internet, through our Investor Centers or over the phone. It is our privilege to provide you the information you need to make the investments that are right for you.
Sincerely,
/s/Edward C. Johnson 3d
Edward C. Johnson 3d
Annual Report
Fidelity Advisor International Small Cap Fund - Institutional Class
Performance: The Bottom Line
Average annual total return reflects the change in the value of an investment, assuming reinvestment of the class' dividend income and capital gains (the profits earned upon the sale of securities that have grown in value) and assuming a constant rate of performance each year. The $10,000 table and the fund's returns do not reflect the deduction of taxes that a shareholder would pay on fund distributions or the redemption of fund shares. During periods of reimbursement by Fidelity, a fund's total return will be greater than it would be had the reimbursement not occurred. How a fund did yesterday is no guarantee of how it will do tomorrow.
Average Annual Total Returns
Periods ended October 31, 2006 | Past 1
year | Life of
FundA |
Institutional Class B | 20.65% | 34.92% |
A From September 18, 2002.
B The initial offering of Institutional Class shares took place on May 27, 2003. Returns prior to May 27, 2003 are those of International Small Cap, the original class of the fund.
$10,000 Over Life of Fund
Let's say hypothetically that $10,000 was invested in Fidelity Advisor International Small Cap Fund - Institutional Class on September 18, 2002, when the fund started. The chart shows how the value of your investment would have changed, and also shows how the MSCI® EAFE® Small Cap Index performed over the same period.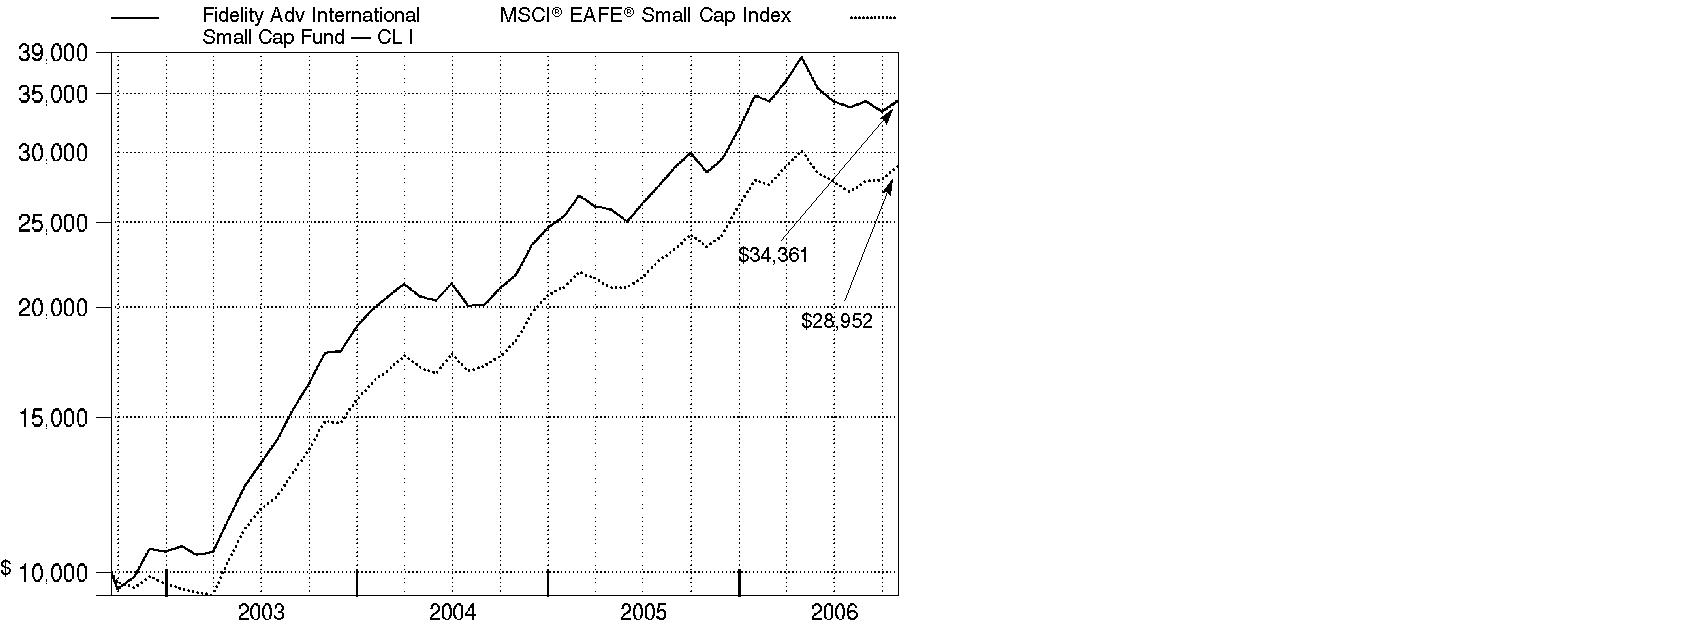
Annual Report
Management's Discussion of Fund Performance
Comments from Ben Paton, Tokuya Sano and Wilson Wong, Co-Portfolio Managers of Fidelity Advisor International Small Cap Fund
International equity markets as a whole outpaced their U.S. counterparts for the 12 months ending October 31, 2006 - partly as a result of favorable currency exchanges that boosted returns for U.S. investors. The Morgan Stanley Capital InternationalSM Europe, Australasia, Far East (MSCI® EAFE®) Index - a gauge of developed stock markets outside the United States and Canada - gained 27.72% during that time. European markets benefited from solid corporate profit growth and attractive dividends, which helped the MSCI Europe index advance 31.95%. Strong performing Latin American and Asian emerging markets drove the MSCI Emerging Markets index to a lofty 35.42% return. Japan was somewhat of an exception to the generally stellar foreign market performance after struggling in the middle part of the period. Still, its earlier gains helped the Tokyo Stock Exchange Stock Price Index (TOPIX) - a benchmark of the largest and better-established stocks traded on the Tokyo Stock Exchange - rise 12.47% overall. Natural-resources-rich Canada also struggled over the final six months as energy prices fell, but the S&P/TSX Composite Index managed a 12-month return of 28.21%.
During the past year, the fund's Institutional Class shares returned 20.65%, compared with 23.55% for the MSCI EAFE Small Cap index. Weak results in the Europe/Africa/Middle East subportfolio - in particular, fueled by unsuccessful positions in the United Kingdom and in energy and materials stocks - hurt the most versus the index. For example, not owning Swedish zinc producer Boliden was costly, as zinc prices soared, causing the stock to follow suit. Healthcare Enterprise Group, a U.K. health care device company, faltered because of an acquisition that reported unexpected losses. Performance also suffered due to Japan-based Kura Corp., a restaurant operator; Tanzanite One, a Bermuda-incorporated miner of the blue gemstone tanzanite; and Downer EDI, an Australian engineering company. Conversely, both the Japanese and Pacific Basin ex Japan subportfolios outperformed their respective index components. On a sector basis, financials and information technology helped, with Italian stock Banca Italease leading the way. Other positives included Japanese auto parts maker Nissin Kogyo and the timely sale of DaVinci Advisors, a real estate stock. In the Pacific Basin ex Japan subportfolio, contributors included two Australian companies: engineering services provider WorleyParsons and Bradken, a supplier of consumable products to the mining and rail industries. In absolute terms, currency fluctuations bolstered the fund's gains.
The views expressed above reflect those of the portfolio manager(s) only through the end of the period as stated on the cover of this report and do not necessarily represent the views of Fidelity or any other person in the Fidelity organization. Any such views are subject to change at any time based upon market or other conditions and Fidelity disclaims any responsibility to update such views. These views may not be relied on as investment advice and, because investment decisions for a Fidelity fund are based on numerous factors, may not be relied on as an indication of trading intent on behalf of any Fidelity fund.
Annual Report
Shareholder Expense Example
As a shareholder of the Fund, you incur two types of costs: (1) transaction costs, including sales charges (loads) on purchase payments or redemption proceeds, redemption fees, and (2) ongoing costs, including management fees, distribution and/or service (12b-1) fees and other Fund expenses. This Example is intended to help you understand your ongoing costs (in dollars) of investing in the Fund and to compare these costs with the ongoing costs of investing in other mutual funds.
The Example is based on an investment of $1,000 invested at the beginning of the period and held for the entire period (May 1, 2006 to October 31, 2006).
Actual Expenses
The first line of the accompanying table for each class of the Fund provides information about actual account values and actual expenses. You may use the information in this line, together with the amount you invested, to estimate the expenses that you paid over the period. Simply divide your account value by $1,000.00 (for example, an $8,600 account value divided by $1,000.00 = 8.6), then multiply the result by the number in the first line for a class of the Fund under the heading entitled "Expenses Paid During Period" to estimate the expenses you paid on your account during this period. A small balance maintenance fee of $12.00 that is charged once a year may apply for certain accounts with a value of less than $2,000. This fee is not included in the table below. If it was, the estimate of expenses you paid during the period would be higher, and your ending account value lower, by this amount.
Hypothetical Example for Comparison Purposes
The second line of the accompanying table for each class of the Fund provides information about hypothetical account values and hypothetical expenses based on a Class' actual expense ratio and an assumed rate of return of 5% per year before expenses, which is not the Class' actual return. The hypothetical account values and expenses may not be used to estimate the actual ending account balance or expenses you paid for the period. You may use this information to compare the ongoing costs of investing in the Fund and other funds. To do so, compare this 5% hypothetical example with the 5% hypothetical examples that appear in the shareholder reports of the other funds. A small balance maintenance fee of $12.00 that is charged once a year may apply for certain accounts with a value of less than $2,000. This fee is not included in the table below. If it was, the estimate of expenses you paid during the period would be higher, and your ending account value lower, by this amount.
Annual Report
Shareholder Expense Example - continued
Please note that the expenses shown in the table are meant to highlight your ongoing costs only and do not reflect any transaction costs. Therefore, the second line of the table is useful in comparing ongoing costs only, and will not help you determine the relative total costs of owning different funds. In addition, if these transactional costs were included, your costs would have been higher.
| Beginning
Account Value
May 1, 2006 | Ending
Account Value
October 31, 2006 | Expenses Paid
During Period*
May 1, 2006
to October 31, 2006 |
Class A | | | |
Actual | $ 1,000.00 | $ 890.50 | $ 7.86 |
Hypothetical A | $ 1,000.00 | $ 1,016.89 | $ 8.39 |
Class T | | | |
Actual | $ 1,000.00 | $ 889.40 | $ 9.00 |
Hypothetical A | $ 1,000.00 | $ 1,015.68 | $ 9.60 |
Class B | | | |
Actual | $ 1,000.00 | $ 887.30 | $ 11.42 |
Hypothetical A | $ 1,000.00 | $ 1,013.11 | $ 12.18 |
Class C | | | |
Actual | $ 1,000.00 | $ 887.30 | $ 11.32 |
Hypothetical A | $ 1,000.00 | $ 1,013.21 | $ 12.08 |
International Small Cap | | | |
Actual | $ 1,000.00 | $ 892.40 | $ 6.11 |
Hypothetical A | $ 1,000.00 | $ 1,018.75 | $ 6.51 |
Institutional Class | | | |
Actual | $ 1,000.00 | $ 892.30 | $ 6.20 |
Hypothetical A | $ 1,000.00 | $ 1,018.65 | $ 6.61 |
A 5% return per year before expenses
* Expenses are equal to each Class' annualized expense ratio (shown in the table below); multiplied by the average account value over the period, multiplied by 184/365 (to reflect the one-half year period).
| Annualized
Expense Ratio |
Class A | 1.65% |
Class T | 1.89% |
Class B | 2.40% |
Class C | 2.38% |
International Small Cap | 1.28% |
Institutional Class | 1.30% |
Annual Report
Investment Changes
Geographic Diversification (% of fund's net assets) |
As of October 31, 2006 |
| Japan 31.2% | |
| United Kingdom 19.2% | |
| Australia 10.5% | |
| United States of America 5.1% | |
| Canada 3.7% | |
| France 3.2% | |
| Germany 3.1% | |
| Italy 2.9% | |
| Bermuda 2.5% | |
| Other 18.6% | |

Percentages are adjusted for the effect of futures contracts, if applicable. |
|
As of April 30, 2006 |
| Japan 32.2% | |
| United Kingdom 18.1% | |
| Australia 9.6% | |
| Canada 3.9% | |
| South Africa 3.8% | |
| United States of America 2.8% | |
| Italy 2.8% | |
| Bermuda 2.4% | |
| Germany 2.2% | |
| Other 22.2% | |
Percentages are adjusted for the effect of futures contracts, if applicable. |
Asset Allocation |
| % of fund's
net assets | % of fund's net assets
6 months ago |
Stocks and Investment Companies | 96.1 | 98.7 |
Bonds | 0.3 | 0.3 |
Short-Term Investments and Net Other Assets | 3.6 | 1.0 |
Top Ten Stocks as of October 31, 2006 |
| % of fund's
net assets | % of fund's net assets
6 months ago |
Banca Italease Spa (Italy, Diversified Financial Services) | 2.3 | 1.9 |
Icade SA (France, Real Estate Management & Development) | 1.3 | 0.1 |
Nissin Kogyo Co. Ltd. (Japan, Auto Components) | 1.2 | 0.9 |
Steinhoff International Holdings Ltd. (South Africa, Household Durables) | 1.1 | 1.5 |
Fujikura Ltd. (Japan, Electrical Equipment) | 1.1 | 0.8 |
Ceske Energeticke Zavody AS (Czech Republic, Electric Utilities) | 1.1 | 0.0 |
Max Petroleum PLC (United Kingdom, Oil, Gas & Consumable Fuels) | 1.1 | 1.0 |
NOK Corp. (Japan, Auto Components) | 1.0 | 0.1 |
Nippon Seiki Co. Ltd. (Japan, Auto Components) | 0.9 | 0.7 |
International Ferro Metals (Australia, Metals & Mining) | 0.9 | 0.6 |
| 12.0 | |
Market Sectors as of October 31, 2006 |
| % of fund's
net assets | % of fund's net assets
6 months ago |
Consumer Discretionary | 16.8 | 16.5 |
Materials | 16.7 | 18.7 |
Industrials | 15.1 | 15.7 |
Information Technology | 11.4 | 12.8 |
Financials | 11.3 | 9.8 |
Energy | 10.3 | 14.5 |
Health Care | 5.4 | 5.0 |
Utilities | 4.6 | 1.2 |
Consumer Staples | 3.7 | 3.7 |
Telecommunication Services | 1.1 | 1.1 |
Annual Report
Investments October 31, 2006
Showing Percentage of Net Assets
Common Stocks - 96.0% |
| Shares | | Value (Note 1) (000s) |
Australia - 10.5% |
Allied Gold Ltd. (a) | 11,880,000 | | $ 3,863 |
AMP Ltd. | 398,700 | | 2,932 |
Aristocrat Leisure Ltd. | 38,800 | | 418 |
Austbrokers Holdings Ltd. | 1,012,159 | | 3,173 |
Australian Stock Exchange Ltd. | 191,909 | | 5,259 |
Australian Wealth Management Ltd. | 2,709,087 | | 5,453 |
Babcock & Brown Japan Property Trust | 1,297,100 | | 1,943 |
Billabong International Ltd. | 307,700 | | 3,735 |
Bradken Ltd. | 1,417,195 | | 6,703 |
Brambles Industries Ltd. (d) | 308,500 | | 2,981 |
Caltex Australia Ltd. | 36,000 | | 617 |
Capital-XX Ltd. | 2,262,572 | | 3,129 |
Centamin Egypt Ltd. (a) | 5,903,500 | | 2,984 |
Cochlear Ltd. | 163,900 | | 7,064 |
Computershare Ltd. | 1,284,572 | | 7,657 |
David Jones Ltd. | 590,500 | | 1,655 |
Dominos Pizza Australia New Zealand Ltd. | 2,778,220 | | 6,990 |
Downer EDI Ltd. | 581,057 | | 2,897 |
Dwyka Diamonds Ltd. (a) | 6,949,000 | | 2,717 |
Elixir Petroleum Ltd. (a) | 2,002,140 | | 630 |
Elkedra Diamonds NL (a) | 5,953,671 | | 2,470 |
Energy Resources of Australia Ltd. | 129,200 | | 1,774 |
European Gas Ltd. (a) | 1,673,600 | | 894 |
Fox Resources Ltd. warrants 6/30/07 (a) | 342,636 | | 252 |
Hastie Group Ltd. | 2,126,299 | | 4,000 |
HFA Holdings Ltd. | 2,152,000 | | 3,099 |
IBT Education Ltd. | 153,450 | | 227 |
International Ferro Metals (e) | 24,719,526 | | 17,682 |
Invocare Ltd. | 67,700 | | 278 |
Jumbuck Entertainment Ltd. (a) | 841,100 | | 1,205 |
Kimberley Diamond Co. NL (a) | 855,800 | | 696 |
Macquarie Goodman Group unit | 295,700 | | 1,515 |
Metcash Ltd. | 2,138,000 | | 7,084 |
Mineral Commodities Ltd. (a)(e) | 7,900,000 | | 948 |
Mineral Deposits Ltd. (a) | 4,233,200 | | 5,112 |
Mintails Ltd. (a) | 6,289,600 | | 974 |
Monto Minerals Ltd. (a) | 8,525,252 | | 1,504 |
Monto Minerals Ltd. warrants 5/25/09 (a) | 1,485,934 | | 11 |
Mortgage Choice Ltd. | 2,133,191 | | 4,426 |
Multiplex Group unit | 1,238,000 | | 3,527 |
Newcrest Mining Ltd. | 23,800 | | 439 |
Novera Energy Ltd. (a) | 488,000 | | 521 |
Common Stocks - continued |
| Shares | | Value (Note 1) (000s) |
Australia - continued |
Oakton Ltd. | 130,715 | | $ 419 |
Paladin Resources Ltd. (a)(d) | 1,443,600 | | 6,448 |
Patties Food Ltd. | 1,035,200 | | 1,402 |
Phosphagenics Ltd. (a) | 9,040,000 | | 2,449 |
QBE Insurance Group Ltd. | 257,323 | | 4,920 |
Reverse Corp. Ltd. | 1,073,700 | | 2,934 |
Rinker Group Ltd. | 82,700 | | 1,188 |
Roc Oil Co. Ltd. (United Kingdom) (a) | 3,700,112 | | 10,022 |
SAI Global Ltd. | 98,900 | | 274 |
Seek Ltd. | 1,350,239 | | 5,561 |
Sigma Pharmaceuticals Ltd. | 1,517,600 | | 3,031 |
SMS Management & Technology Ltd. | 166,300 | | 530 |
Sonic Healthcare Ltd. | 89,400 | | 910 |
Sphere Investments Ltd. (a) | 2,038,159 | | 1,988 |
Summit Resources Ltd. (a) | 1,039,620 | | 1,787 |
Sylvania Resources Ltd. (a) | 7,484,597 | | 5,331 |
Sylvania Resources Ltd. (United Kingdom) (a) | 4,923,630 | | 3,616 |
Tanami Gold NL | 19,652,484 | | 2,815 |
Tattersall's Ltd. | 665,464 | | 1,875 |
United Group Ltd. | 320,421 | | 3,624 |
Woodside Petroleum Ltd. | 45,600 | | 1,326 |
Woolworths Ltd. | 394,926 | | 6,326 |
WorleyParsons Ltd. | 172,430 | | 2,423 |
TOTAL AUSTRALIA | | 202,637 |
Austria - 0.3% |
Oesterreichische Elektrizitaetswirtschafts AG (Verbund) | 106,900 | | 5,336 |
Belgium - 0.1% |
Punch International NV (a) | 17,350 | | 2,024 |
Bermuda - 2.5% |
Aquarius Platinum Ltd. (United Kingdom) | 539,400 | | 10,052 |
Hi Sun Technology (China) Ltd. (a) | 2,106,000 | | 406 |
Katanga Mining Ltd. (a) | 233,800 | | 1,320 |
Pacific Basin Shipping Ltd. | 2,030,000 | | 1,305 |
Peace Mark Holdings Ltd. | 3,750,000 | | 2,556 |
Petra Diamonds Ltd. (a) | 2,502,406 | | 5,847 |
Ports Design Ltd. | 1,798,000 | | 3,126 |
RC Group (Holdings) Ltd. | 2,139,000 | | 2,693 |
SeaDrill Ltd. (a) | 502,921 | | 7,132 |
Tanzanite One Ltd. (e) | 5,808,701 | | 9,086 |
Trefoil Ltd. (a) | 385,100 | | 2,698 |
Common Stocks - continued |
| Shares | | Value (Note 1) (000s) |
Bermuda - continued |
Xceldiam Ltd. (e) | 3,318,255 | | $ 1,946 |
Xceldiam Ltd. warrants 11/16/07 (a) | 1,659,127 | | 222 |
TOTAL BERMUDA | | 48,389 |
British Virgin Islands - 0.4% |
Albidon Ltd. unit (a) | 1,469,000 | | 1,646 |
BDI Mining Corp. (a)(e) | 8,728,890 | | 3,288 |
Kalahari Energy (a)(g) | 1,451,000 | | 1,814 |
Titanium Resources Group Ltd. | 959,090 | | 1,134 |
TOTAL BRITISH VIRGIN ISLANDS | | 7,882 |
Canada - 3.4% |
AirSea Lines (g) | 1,862,300 | | 1,189 |
AirSea Lines warrants 6/14/08 (a)(g) | 1,862,300 | | 0 |
Altius Minerals Corp. (a) | 533,806 | | 3,842 |
Antrim Energy, Inc. (a) | 714,540 | | 2,482 |
Antrim Energy, Inc. (United Kingdom) | 800,000 | | 2,762 |
Bankers Petroleum Ltd. (a) | 3,767,000 | | 2,282 |
Brazilian Diamonds Ltd. (a) | 332,000 | | 41 |
First Quantum Minerals Ltd. | 190,271 | | 10,872 |
Grove Energy Ltd. (a) | 1,964,140 | | 1,161 |
Lionore Mining International Ltd. (a) | 474,540 | | 4,003 |
MagIndustries Corp. (a) | 7,216,960 | | 6,107 |
Oilexco, Inc. (a) | 1,394,525 | | 8,360 |
Platinum Group Metals Ltd. (a) | 407,100 | | 696 |
Rock Well Petroleum, Inc. (g) | 770,400 | | 1,029 |
Starfield Resources, Inc. (a)(e) | 13,019,181 | | 3,247 |
Starfield Resources, Inc.: | | | |
warrants 5/9/07 (a)(g) | 1,313,025 | | 9 |
warrants 1/21/08 (a)(g) | 1,678,100 | | 89 |
Stealth Ventures Ltd. (a) | 966,500 | | 1,178 |
Stealth Ventures Ltd. warrants 3/12/08 (a)(g) | 483,250 | | 110 |
StrataGold Corp. (a) | 2,976,400 | | 2,704 |
SXR Uranium One, Inc. (a) | 475,740 | | 5,409 |
Tenke Mining Corp. (a) | 103,000 | | 1,373 |
Visual Defence, Inc. (a)(e) | 5,963,100 | | 2,673 |
Western Canadian Coal Corp. | 1,554,418 | | 2,894 |
Western Canadian Coal Corp. (United Kingdom) (a) | 548,286 | | 1,098 |
TOTAL CANADA | | 65,610 |
Cayman Islands - 0.4% |
Computime Group Ltd. | 2,048,000 | | 761 |
EcoGreen Fine Chemical Group Ltd. | 2,346,000 | | 573 |
Common Stocks - continued |
| Shares | | Value (Note 1) (000s) |
Cayman Islands - continued |
Hopefluent Group Holdings Ltd. | 20,000 | | $ 8 |
Kingboard Chemical Holdings Ltd. | 149,000 | | 530 |
New World China Land Ltd. | 3,470,000 | | 1,664 |
Prime Success International Group Ltd. | 2,718,000 | | 2,230 |
Shimao Property Holdings Ltd. | 648,000 | | 873 |
Wasion Meters Group Ltd. | 2,030,000 | | 848 |
TOTAL CAYMAN ISLANDS | | 7,487 |
China - 0.9% |
BYD Co. Ltd. (H Shares) (a) | 363,000 | | 978 |
China International Marine Containers Co. Ltd. (B Shares) | 1,115,800 | | 1,571 |
China Merchants Bank Co. Ltd. (H Shares) (a) | 1,663,500 | | 2,597 |
China Oilfield Services Ltd. (H Shares) | 2,664,000 | | 1,497 |
China Shipping Development Co. Ltd. (H Shares) | 1,286,000 | | 1,399 |
Dalian Port (PDA) Co. Ltd. (H Shares) | 2,188,000 | | 1,058 |
Guangzhou R&F Properties Co. Ltd. (H Shares) | 696,000 | | 1,137 |
Home Inns & Hotels Management, Inc. sponsored ADR | 2,200 | | 54 |
Hunan Non-Ferrous Metals Corp. Ltd. (H Shares) | 3,026,000 | | 1,432 |
Industrial & Commercial Bank of China | 2,524,000 | | 1,129 |
London Asia Chinese Private Equity Fund Ltd. (a) | 473,800 | | 1,008 |
Nine Dragons Paper (Holdings) Ltd. | 1,154,000 | | 1,469 |
Parkson Retail Group Ltd. | 36,000 | | 150 |
Shenzhou International Group Holdings Ltd. | 2,768,000 | | 1,146 |
Yantai Changyu Pioneer Wine Co. (B Shares) | 327,210 | | 1,115 |
TOTAL CHINA | | 17,740 |
Cyprus - 0.1% |
Buried Hill Energy (Cyprus) PLC (g) | 1,947,000 | | 2,142 |
Czech Republic - 1.1% |
Ceske Energeticke Zavody AS | 533,600 | | 21,101 |
Finland - 0.6% |
Inion OY (a)(e) | 3,740,300 | | 1,677 |
Nokian Tyres Ltd. | 348,000 | | 6,663 |
Tekla Oyj (A Shares) | 344,180 | | 2,886 |
TOTAL FINLAND | | 11,226 |
France - 3.2% |
BVRP Software SA (a) | 98,706 | | 1,914 |
Carbone Lorraine | 27,400 | | 1,526 |
Carrefour SA | 50,000 | | 3,047 |
Constructions Industrielles dela Mediterranee SA | 9,300 | | 1,319 |
Common Stocks - continued |
| Shares | | Value (Note 1) (000s) |
France - continued |
Electricite de France | 90,900 | | $ 5,512 |
Groupe Open SA (a)(d) | 51,442 | | 867 |
Groupe Promeo | 32,130 | | 1,538 |
Guerbet SA | 8,400 | | 1,406 |
Icade SA | 435,318 | | 25,843 |
Sechilienne-Sidec | 94,320 | | 3,612 |
Tessi SA | 43,953 | | 2,776 |
The Lisi Group | 22,500 | | 1,581 |
Veolia Environnement | 166,000 | | 10,164 |
TOTAL FRANCE | | 61,105 |
Germany - 3.1% |
Articon-Integralis AG (Reg.) (a) | 195,779 | | 825 |
Deutz AG (a)(d) | 1,027,100 | | 10,344 |
E.ON AG | 93,000 | | 11,196 |
ElringKlinger AG | 18,284 | | 972 |
Fresenius Medical Care AG | 108,100 | | 14,424 |
Grenkeleasing AG | 25,918 | | 1,069 |
Kontron AG | 120,300 | | 1,749 |
Merck KGaA | 18,831 | | 1,985 |
Parsytec AG (a) | 153,836 | | 1,198 |
Pfleiderer AG | 164,259 | | 4,462 |
PSI AG (a) | 387,761 | | 2,227 |
Pulsion Medical Systems AG (a) | 98,511 | | 742 |
RWE AG | 52,000 | | 5,139 |
SGL Carbon AG (a) | 200,700 | | 4,396 |
TOTAL GERMANY | | 60,728 |
Greece - 0.9% |
Autohellas SA | 259,430 | | 1,556 |
Fourlis Holdings SA | 110,000 | | 2,134 |
Marfin Financial Group Holdings SA | 45,000 | | 2,270 |
Sarantis SA (Reg.) | 1,159,018 | | 11,243 |
TOTAL GREECE | | 17,203 |
Hong Kong - 1.2% |
Bank of East Asia Ltd. | 275,000 | | 1,314 |
Cafe de Coral Holdings Ltd. | 976,000 | | 1,526 |
China Overseas Land & Investment Ltd. | 1,424,000 | | 1,298 |
Citic International Financial Holdings Ltd. | 858,000 | | 576 |
CNPC (Hong Kong) Ltd. | 3,180,000 | | 1,595 |
Esprit Holdings Ltd. | 389,000 | | 3,766 |
Common Stocks - continued |
| Shares | | Value (Note 1) (000s) |
Hong Kong - continued |
Fairwood Holdings Ltd. (f) | 928,500 | | $ 920 |
Hong Kong Aircraft & Engineering Co. | 11,200 | | 142 |
Industrial & Commercial Bank of China (Asia) Ltd. | 820,000 | | 1,421 |
Li & Fung Ltd. | 924,000 | | 2,418 |
Lifestyle International Holdings Ltd. | 451,000 | | 874 |
Sa Sa International Holdings Ltd. | 1,028,000 | | 365 |
Tai Cheung Holdings Ltd. | 1,384,000 | | 683 |
Vtech Holdings Ltd. | 882,000 | | 4,434 |
Wing Lung Bank Ltd. | 122,700 | | 1,167 |
TOTAL HONG KONG | | 22,499 |
India - 0.2% |
Great Eastern Energy Corp. Ltd. GDR | 909,000 | | 2,124 |
Noida Toll Bridge Co. Ltd. GDR | 454,051 | | 1,975 |
TOTAL INDIA | | 4,099 |
Indonesia - 0.1% |
PT Bank Niaga Tbk | 15,019,000 | | 1,434 |
PT Perushahaan Perkebunan London Sumatra Tbk | 1,526,500 | | 775 |
PT Telkomunikasi Indonesia Tbk Series B | 592,000 | | 546 |
TOTAL INDONESIA | | 2,755 |
Ireland - 0.7% |
Adwalker PLC (a)(e) | 9,125,000 | | 413 |
Glanbia PLC | 1,135,500 | | 4,348 |
Kenmare Resources PLC (a) | 2,640,000 | | 1,964 |
Kenmare Resources PLC warrants 7/23/09 (a) | 1,712,500 | | 751 |
Minco PLC (a) | 300,000 | | 47 |
Petroceltic International PLC (a)(d) | 13,644,934 | | 3,384 |
Providence Resources PLC (a) | 1,675,130 | | 141 |
Trinity Biotech PLC sponsored ADR (a) | 227,325 | | 2,085 |
Vimio PLC (a) | 867,300 | | 935 |
TOTAL IRELAND | | 14,068 |
Israel - 0.6% |
Advanced Vision Technology Ltd. (a) | 133,900 | | 1,786 |
Israel Chemicals Ltd. | 611,900 | | 3,495 |
Leadcom Integrated Solutions | 3,601,400 | | 4,053 |
Metal-Tech Ltd. | 575,500 | | 1,756 |
MTI Wireless Edge Ltd. | 705,128 | | 632 |
TOTAL ISRAEL | | 11,722 |
Common Stocks - continued |
| Shares | | Value (Note 1) (000s) |
Italy - 2.9% |
Banca Italease Spa | 790,700 | | $ 44,157 |
Bastogi Spa (a) | 3,339,200 | | 861 |
Enel Spa ADR | 543,800 | | 5,220 |
ERG Spa | 109,100 | | 2,285 |
Lottomatica Spa | 81,000 | | 2,957 |
Teleunit Spa (e) | 12,719,158 | | 1,122 |
TOTAL ITALY | | 56,602 |
Japan - 31.2% |
Abc-Mart, Inc. | 320,300 | | 7,230 |
Access Co. Ltd. (a) | 515 | | 1,013 |
Access Co. Ltd. (a)(d) | 181 | | 1,206 |
Advanced Media, Inc. (a) | 64 | | 167 |
Aeon Fantasy Co. Ltd. | 55,300 | | 1,967 |
Aichi Steel Corp. (d) | 280,000 | | 1,666 |
Ain Pharmaciez, Inc. | 38,000 | | 695 |
Alpen Co. Ltd. | 51,200 | | 1,541 |
AOC Holdings, Inc. | 70,500 | | 1,278 |
AOI Electronics Co. Ltd. | 79,000 | | 1,800 |
Ariake Japan Co. Ltd. (d) | 115,300 | | 2,119 |
Asahi Diamond Industrial Co. Ltd. | 231,000 | | 1,523 |
Asics Corp. | 137,000 | | 1,835 |
Asset Managers Co. Ltd. (d) | 931 | | 2,547 |
Atect Corp. | 17,100 | | 224 |
Atrium Co. Ltd. | 98,700 | | 3,367 |
Axell Corp. | 490 | | 1,550 |
Bic Camera, Inc. | 48 | | 67 |
Bit-isle, Inc. | 284 | | 1,428 |
Bookoff Corp. | 151,200 | | 2,760 |
C. Uyemura & Co. Ltd. | 42,400 | | 2,799 |
Canon Fintech, Inc. | 72,900 | | 1,318 |
Casio Micronics Co. Ltd. | 181,900 | | 2,003 |
Chiba Bank Ltd. | 458,000 | | 4,104 |
Chiyoda Corp. | 129,000 | | 2,338 |
Chugoku Marine Paints Ltd. | 49,000 | | 307 |
Chuo Denki Kogyo Co. Ltd. (d) | 30,000 | | 114 |
CMIC Co. Ltd. (d) | 1,990 | | 521 |
Create SD Co. Ltd. | 65,900 | | 1,076 |
Daido Metal Co. Ltd. (d) | 784,000 | | 5,175 |
Daido Steel Co. Ltd. | 1,192,000 | | 7,776 |
Daikokutenbussan Co. Ltd. | 44,100 | | 914 |
Daiseki Co. Ltd. | 79,500 | | 1,920 |
Common Stocks - continued |
| Shares | | Value (Note 1) (000s) |
Japan - continued |
Daito Gyorui Co. Ltd. | 93,000 | | $ 200 |
Daiwa Securities Group, Inc. | 158,000 | | 1,793 |
Daiwabo Information System Ltd. (d) | 285,500 | | 3,586 |
Denyo Co. Ltd. | 49,600 | | 537 |
Descente Ltd. (d) | 220,000 | | 1,117 |
Ebara Corp. (d) | 311,000 | | 1,215 |
Eiken Chemical Co. Ltd. | 122,700 | | 1,194 |
Elpida Memory, Inc. (a) | 41,100 | | 1,919 |
Endo Lighting Corp. | 177,900 | | 1,688 |
EPS Co. Ltd. (d) | 996 | | 2,333 |
Fast Retailing Co. Ltd. | 48,500 | | 4,590 |
FCC Co. Ltd. (d) | 71,800 | | 1,651 |
FinTech Global, Inc. (d) | 1,812 | | 1,642 |
Fujikura Ltd. (d) | 1,999,000 | | 21,381 |
Fullcast Co. Ltd. (d) | 1,033 | | 3,047 |
Furukawa Electric Co. Ltd. | 956,000 | | 6,825 |
Futaba Industrial Co. Ltd. (d) | 102,000 | | 2,333 |
Gentosha, Inc. (d) | 111 | | 459 |
Hamamatsu Photonics KK (d) | 145,100 | | 4,193 |
Harmonic Drive Systems, Inc. | 306 | | 1,672 |
Haseko Corp. (a)(d) | 876,500 | | 3,013 |
Heiwa Real Estate Co. Ltd. (d) | 290,000 | | 1,946 |
Hikari Tsushin, Inc. | 247,800 | | 13,051 |
Hioki EE Corp. | 32,300 | | 994 |
Hiroshima Bank Ltd. | 451,000 | | 2,695 |
Hitachi Construction Machinery Co. Ltd. | 369,900 | | 8,792 |
Hitachi Maxell Ltd. | 138,500 | | 2,031 |
Hokuriku Electric Industry (d) | 882,000 | | 2,519 |
Hokuto Corp. | 178,900 | | 2,941 |
Ibiden Co. Ltd. | 34,000 | | 1,782 |
Inpex Holdings, Inc. | 235 | | 1,921 |
Intelligence Ltd. (d) | 718 | | 1,559 |
Internet Research Institute, Inc. (d) | 1,474 | | 916 |
Iriso Electronics Co. Ltd. | 62,400 | | 2,241 |
Ishihara Chemical Co. Ltd. | 38,500 | | 762 |
Ishikawajima-Harima Heavy Industries Co. Ltd. | 1,408,000 | | 4,743 |
Itochu Corp. | 734,000 | | 5,849 |
ITOCHU Techno-Solutions Corp. (d) | 21,600 | | 1,208 |
Japan Communications, Inc. (a)(d) | 333 | | 104 |
Japan Digital Contents Trust, Inc. (a) | 725 | | 209 |
Jastec Co. Ltd. | 141,300 | | 1,258 |
JGC Corp. | 108,000 | | 1,681 |
Common Stocks - continued |
| Shares | | Value (Note 1) (000s) |
Japan - continued |
Joint Corp. | 33,000 | | $ 1,298 |
JSR Corp. | 126,300 | | 3,175 |
Juroku Bank Ltd. | 179,000 | | 1,015 |
Kakaku.com, Inc. (d) | 607 | | 1,806 |
Kenedix, Inc. | 312 | | 1,753 |
Kibun Food Chemifa Co. Ltd. (d) | 66,900 | | 677 |
Kitagawa Seiki Co. Ltd. | 31,500 | | 225 |
KK daVinci Advisors (a) | 2,823 | | 3,089 |
Kobayashi Pharmaceutical Co. Ltd. | 109,400 | | 4,200 |
Koito Manufacturing Co. Ltd. | 149,000 | | 2,106 |
Konica Minolta Holdings, Inc. (d) | 479,000 | | 6,381 |
Kubota Corp. | 59,000 | | 516 |
Kura Corp. Ltd. | 4,979 | | 11,537 |
Kurita Water Industries Ltd. | 86,800 | | 1,774 |
Link Theory Holdings Co. Ltd. (d) | 120 | | 228 |
Lintec Corp. | 150,300 | | 3,431 |
Mandom Corp. | 25,200 | | 614 |
Mazda Motor Corp. | 940,000 | | 6,357 |
Media Global Links Co. Ltd. | 473 | | 1,209 |
Meganesuper Co. Ltd. | 20 | | 0 |
Meiko Electronics Co. Ltd. | 141,300 | | 5,678 |
Micronics Japan Co. Ltd. (d) | 200,100 | | 5,680 |
Mitsuba Corp. | 277,000 | | 2,027 |
Mitsubishi Gas Chemical Co., Inc. | 985,000 | | 9,382 |
Mitsubishi Materials Corp. (d) | 433,000 | | 1,707 |
Mitsubishi Rayon Co. Ltd. | 99,000 | | 625 |
Mitsui Engineering & Shipbuilding Co. | 770,000 | | 2,870 |
Mitsui O.S.K. Lines Ltd. | 705,000 | | 5,877 |
Miyachi Corp. | 39,100 | | 690 |
Mori Seiki Co. Ltd. (d) | 93,600 | | 1,957 |
Murata Manufacturing Co. Ltd. | 131,000 | | 9,162 |
Nabtesco Corp. | 132,000 | | 1,586 |
Nachi-Fujikoshi Corp. | 1,045,000 | | 5,191 |
Nafco Co. Ltd. | 34,600 | | 958 |
NEOMAX Co. Ltd. (d) | 325,000 | | 5,974 |
NGK Spark Plug Co. Ltd. (d) | 631,000 | | 13,299 |
NHK Spring Co. Ltd. | 321,000 | | 3,549 |
NIC Corp. | 224,900 | | 1,850 |
Nidec Copal Electronics Corp. (d) | 308,900 | | 2,113 |
Nidec Corp. | 44,100 | | 3,375 |
Nihon Ceratec Co. Ltd. (d) | 283 | | 733 |
Nihon Dempa Kogyo Co. Ltd. (d) | 327,400 | | 13,436 |
Common Stocks - continued |
| Shares | | Value (Note 1) (000s) |
Japan - continued |
Nihon Micro Coating Co. Ltd. | 35,600 | | $ 258 |
Nihon Trim Co. Ltd. (d) | 193,500 | | 9,314 |
Nihonwasou Holdings, Inc. | 6 | | 6 |
Nikkiso Co. Ltd. | 316,000 | | 2,713 |
Nippon Chemiphar Co. Ltd. (a)(d) | 301,000 | | 1,969 |
Nippon Denko Co. Ltd. (d) | 1,904,000 | | 7,456 |
Nippon Mining Holdings, Inc. | 77,000 | | 575 |
Nippon Oil Corp. | 204,000 | | 1,517 |
Nippon Paint Co. Ltd. | 970,000 | | 5,208 |
Nippon Seiki Co. Ltd. | 757,000 | | 18,090 |
Nippon Soda Co. Ltd. (a) | 330,000 | | 1,744 |
Nissei Corp. | 97,900 | | 963 |
Nissin Kogyo Co. Ltd. | 968,100 | | 23,176 |
NOK Corp. | 732,700 | | 19,232 |
Noritake Co. Ltd. | 287,000 | | 1,453 |
NTN Corp. | 165,000 | | 1,359 |
Obara Corp. | 1,100 | | 43 |
Oiles Corp. | 64,500 | | 1,530 |
Optex Co. Ltd. (d) | 32,400 | | 906 |
Optoelectronics Co. Ltd. | 37,100 | | 980 |
Otaki Gas Co. Ltd. | 15,000 | | 78 |
Otsuka Corp. (d) | 23,100 | | 2,536 |
Pacific Metals Co. Ltd. | 154,000 | | 1,323 |
Phoenix Electric Co. Ltd. (d) | 238,100 | | 1,460 |
Pigeon Corp. (d) | 68,800 | | 1,259 |
Produce Co. Ltd. | 364 | | 2,652 |
Ray Corp. | 189,100 | | 404 |
Rex Holdings Co. Ltd. (d) | 1,683 | | 2,921 |
Round One Corp. | 569 | | 2,325 |
Royal Holdings Co. Ltd. | 84,700 | | 1,167 |
Ryobi Ltd. | 254,000 | | 2,026 |
Saison Information Systems Co. Ltd. | 118,300 | | 1,135 |
Saizeriya Co. Ltd. (d) | 73,700 | | 965 |
Sammy NetWorks Co. Ltd. (d) | 1,083 | | 5,648 |
Sanyo Special Steel Co. Ltd. | 143,000 | | 952 |
Sato Corp. | 201,200 | | 3,819 |
Sawai Pharmaceutical Co. Ltd. (d) | 48,800 | | 2,257 |
SBI Holdings, Inc. | 2,969 | | 1,084 |
Sega Sammy Holdings, Inc. | 62,100 | | 1,561 |
Sekisui Plastics Co. Ltd. | 128,000 | | 439 |
Seria Co. Ltd. | 577 | | 977 |
Common Stocks - continued |
| Shares | | Value (Note 1) (000s) |
Japan - continued |
Shaddy Co. Ltd. (d) | 142,000 | | $ 1,808 |
Shibaura Electronics Co. Ltd. | 121,300 | | 2,152 |
Shikoku Chemicals Corp. (d) | 105,000 | | 614 |
Shin-Kobe Electric Machinery Co. Ltd. | 104,000 | | 554 |
Shinohara Systems of Construction Co. Ltd. (a) | 345 | | 767 |
Shizuki Electric Co., Inc. | 405,000 | | 1,766 |
Showa Denko KK | 569,000 | | 2,481 |
St. Marc Holdings Co. Ltd. | 18,500 | | 1,237 |
Star Micronics Co. Ltd. | 256,400 | | 4,768 |
Starbucks Coffee Japan Ltd. | 2,348 | | 1,016 |
Stella Chemifa Corp. (d) | 58,200 | | 1,951 |
Sumco Corp. | 42,400 | | 3,016 |
Sumitomo Corp. | 481,100 | | 6,326 |
Sumitomo Metal Industries Ltd. | 827,000 | | 3,111 |
Sumitomo Metal Mining Co. Ltd. | 290,000 | | 3,811 |
Sumitomo Titanium Corp. (d) | 15,200 | | 1,805 |
Sumitomo Trust & Banking Co. Ltd. | 186,000 | | 2,001 |
Sun Frontier Fudousan Co. Ltd. | 450 | | 1,027 |
Sunx Ltd. | 284,100 | | 3,031 |
Sysmex Corp. (d) | 84,100 | | 3,387 |
T&D Holdings, Inc. | 21,800 | | 1,594 |
Taisei Corp. | 283,000 | | 963 |
Taiyo Ink Manufacturing Co. Ltd. | 58,000 | | 3,065 |
Taiyo Kagaku | 87,800 | | 897 |
Taiyo Nippon Sanso Corp. Tokyo | 366,000 | | 3,217 |
Takiron Co. Ltd. | 337,000 | | 1,184 |
Telewave, Inc. (d) | 3,307 | | 6,588 |
The First Energy Service Co. Ltd. (a)(d) | 165 | | 175 |
Toagosei Co. Ltd. | 423,000 | | 1,624 |
Toc Co. Ltd. | 78,500 | | 428 |
Tohcello Co. Ltd. | 135,500 | | 1,732 |
Tokai Carbon Co. Ltd. (d) | 180,000 | | 1,216 |
Token Corp. (d) | 153,710 | | 11,604 |
Tokuyama Corp. | 122,000 | | 1,535 |
Tokyo Gas Co. Ltd. (d) | 297,000 | | 1,516 |
Tokyo Seimitsu Co. Ltd. | 12,600 | | 609 |
Tomen Devices Corp. | 65,100 | | 1,350 |
TonenGeneral Sekiyu KK (d) | 147,000 | | 1,400 |
Toray Industries, Inc. | 188,000 | | 1,355 |
Toshiba Machine Co. Ltd. | 328,000 | | 2,961 |
Toyo Ink Manufacturing Co. Ltd. | 127,000 | | 513 |
Trancom Co. Ltd. | 83,800 | | 1,594 |
Common Stocks - continued |
| Shares | | Value (Note 1) (000s) |
Japan - continued |
Trend Micro, Inc. | 57,500 | | $ 1,844 |
Tyo Productions, Inc. (d) | 101,500 | | 399 |
Ulvac, Inc. | 55,600 | | 1,631 |
Unicom Group Holdings, Inc. | 154,500 | | 1,878 |
Usen Corp. (d) | 205,690 | | 2,040 |
V Technology Co. Ltd. (d) | 145 | | 707 |
Village Vanguard Co. Ltd. (d) | 163 | | 985 |
Wacom Co. Ltd. (d) | 334 | | 742 |
Wiz Co. Ltd. | 297 | | 853 |
Yachiyo Industry Co. Ltd. | 76,600 | | 1,772 |
Yahoo! Japan Corp. | 1,836 | | 714 |
Yamada Denki Co. Ltd. | 123,990 | | 12,340 |
Yaskawa Electric Corp. (d) | 271,000 | | 2,892 |
Yokogawa Electric Corp. | 247,900 | | 3,402 |
Yoshimoto Kogyo Co. Ltd. | 52,900 | | 963 |
TOTAL JAPAN | | 603,439 |
Korea (South) - 0.7% |
CDNetworks Co. Ltd. (a) | 827 | | 28 |
Hite Brewery Co. Ltd. | 4,633 | | 551 |
Korean Reinsurance Co. | 61,966 | | 700 |
LG Dacom Corp. | 70,720 | | 1,644 |
LG Household & Health Care Ltd. | 28,820 | | 2,661 |
NHN Corp. | 8,466 | | 840 |
Nice e-Banking Services | 8,970 | | 371 |
Orion Corp. | 3,590 | | 972 |
Pyeong San Co. Ltd. | 14,925 | | 384 |
SFA Engineering Corp. | 25,920 | | 812 |
SK Corp. | 11,180 | | 820 |
STX Pan Ocean Co. Ltd. | 2,327,000 | | 1,285 |
Taewoong Co. Ltd. | 49,925 | | 1,380 |
YBM Sisa.com, Inc. | 71,707 | | 1,549 |
TOTAL KOREA (SOUTH) | | 13,997 |
Luxembourg - 0.3% |
SES Global SA FDR (France) | 319,100 | | 4,892 |
Malaysia - 0.2% |
Kulim Malaysia BHD | 1,300,400 | | 1,659 |
Steppe Cement Ltd. (a) | 636,100 | | 2,305 |
TOTAL MALAYSIA | | 3,964 |
Common Stocks - continued |
| Shares | | Value (Note 1) (000s) |
Netherlands - 0.3% |
Bateman Engineering NV | 349,377 | | $ 2,006 |
Engel East Europe NV | 1,448,532 | | 3,295 |
TOTAL NETHERLANDS | | 5,301 |
New Zealand - 0.6% |
Fisher & Paykel Healthcare Corp. | 1,509,151 | | 4,227 |
Freightways Ltd. | 353,460 | | 959 |
Sky City Entertainment Group Ltd. | 1,781,777 | | 6,149 |
TOTAL NEW ZEALAND | | 11,335 |
Norway - 2.3% |
Aker Kvaerner ASA | 22,550 | | 2,346 |
Camillo Eitzen & Co. ASA (d) | 252,400 | | 2,848 |
Eitzen Maritime Services ASA (a)(d) | 68,425 | | 25 |
Fred Olsen Energy ASA (a)(d) | 25,500 | | 1,100 |
Hafslund ASA (B Shares) | 369,270 | | 6,779 |
Pertra AS (A Shares) (a) | 175,642 | | 1,720 |
ProSafe ASA | 172,000 | | 10,999 |
Schibsted ASA (B Shares) | 48,600 | | 1,472 |
Songa Offshore ASA (a) | 751,186 | | 6,694 |
Stepstone ASA (a) | 4,710,000 | | 8,286 |
TANDBERG ASA | 263,700 | | 3,046 |
TOTAL NORWAY | | 45,315 |
Papua New Guinea - 0.2% |
Oil Search Ltd. | 1,136,300 | | 3,008 |
Singapore - 2.3% |
Advent Air Ltd. (e) | 14,719,299 | | 2,948 |
Banyan Tree Holdings Ltd. | 1,038,000 | | 627 |
Cosco Corp. Singapore Ltd. | 3,949,000 | | 4,868 |
CSE Global Ltd. | 1,038,000 | | 766 |
DBS Group Holdings Ltd. | 87,000 | | 1,140 |
GigaMedia Ltd. (a) | 355,600 | | 3,439 |
HTL International Holdings Ltd. | 673,375 | | 510 |
Keppel Corp. Ltd. | 174,000 | | 1,765 |
Keppel Land Ltd. | 823,000 | | 2,906 |
Osim International Ltd. | 1,741,000 | | 1,889 |
Parkway Holdings Ltd. | 3,746,000 | | 6,663 |
SembCorp Marine Ltd. | 809,000 | | 1,777 |
SIA Engineering Co. Ltd. | 1,538,000 | | 3,693 |
Singapore Petroleum Co. Ltd. | 199,000 | | 580 |
Uol Group Ltd. | 2,329,000 | | 5,982 |
Common Stocks - continued |
| Shares | | Value (Note 1) (000s) |
Singapore - continued |
Want Want Holdings Ltd. | 2,077,000 | | $ 3,718 |
Yanlord Land Group Ltd. | 547,000 | | 509 |
TOTAL SINGAPORE | | 43,780 |
South Africa - 1.7% |
Barnard Jacobs Mellet Holdings Ltd. | 2,661,840 | | 1,742 |
MTN Group Ltd. | 377,102 | | 3,430 |
Steinhoff International Holdings Ltd. | 6,659,732 | | 21,698 |
Telkom SA Ltd. | 146,300 | | 2,716 |
Wilson Bayly Holmes-Ovcon Ltd. | 446,856 | | 4,198 |
TOTAL SOUTH AFRICA | | 33,784 |
Sweden - 1.1% |
Hexagon AB (B Shares) (d) | 239,511 | | 8,921 |
Modern Times Group AB (MTG) (B Shares) | 227,750 | | 13,118 |
TOTAL SWEDEN | | 22,039 |
Switzerland - 0.3% |
Actelion Ltd. (Reg.) (a) | 16,588 | | 2,793 |
Arpida Ltd. (a) | 8,195 | | 192 |
Bucher Holding AG | 15,811 | | 1,601 |
Sulzer AG (Reg.) | 2,070 | | 1,822 |
TOTAL SWITZERLAND | | 6,408 |
Taiwan - 0.6% |
China Life Insurance Co. Ltd. (a) | 2,916,000 | | 1,433 |
High Tech Computer Corp. | 33,000 | | 821 |
Hung Poo Real Estate Development Co. Ltd. | 966,000 | | 1,069 |
KEE TAI Properties Co. Ltd. (a) | 1,920,000 | | 1,126 |
Shin Kong Financial Holding Co. Ltd. | 1,896,700 | | 1,681 |
Sinyi Realty, Inc. | 697,000 | | 1,681 |
Taiwan Chi Cheng Enterprise Co. Ltd. | 580,000 | | 1,547 |
Taiwan Fertilizer Co. Ltd. | 910,000 | | 1,481 |
TOTAL TAIWAN | | 10,839 |
Thailand - 0.3% |
Aromatics (Thailand) PCL | 931,500 | | 889 |
Bumrungrad Hospital PCL (For. Reg.) | 2,926,900 | | 2,932 |
Robinson Department Store PCL (For. Reg.) (a) | 1,281,100 | | 395 |
Total Access Communication PCL (a) | 311,200 | | 1,245 |
TOTAL THAILAND | | 5,461 |
Common Stocks - continued |
| Shares | | Value (Note 1) (000s) |
Turkey - 0.2% |
Dogan Gazetecilik AS (a) | 1,979,955 | | $ 3,777 |
KOZA, Inc. (a) | 93,000 | | 578 |
TOTAL TURKEY | | 4,355 |
United Kingdom - 19.1% |
Accuma Group PLC (a) | 507,663 | | 2,445 |
Advanced Fluid Connection PLC (a) | 7,009,687 | | 0 |
Advanced Technology PLC (a)(e) | 7,355,000 | | 0 |
ADVFN PLC (a) | 20,254,200 | | 1,120 |
AeroBox PLC (a) | 5,694,657 | | 57 |
Afren PLC (a)(d) | 8,430,660 | | 7,679 |
African Consolidated Resources PLC | 7,758,334 | | 1,295 |
African Copper PLC (a) | 1,677,884 | | 2,096 |
Air Partner PLC | 45,000 | | 698 |
Alliance Pharma PLC (a) | 7,984,200 | | 2,132 |
Alterian PLC (a) | 1,020,800 | | 2,230 |
Amlin PLC | 206,973 | | 1,189 |
Andor Technology Ltd. (a) | 313,644 | | 515 |
Anglo Asian Mining PLC (a) | 4,744,400 | | 1,855 |
Angus & Ross PLC (a) | 4,124,200 | | 1,357 |
Angus & Ross PLC (a)(g) | 2,566,117 | | 760 |
Appian Technology PLC (a) | 4,869,178 | | 720 |
Appian Technology PLC warrants 2/28/08 (a)(g) | 479,045 | | 58 |
Ascent Resources PLC (a) | 11,792,400 | | 2,812 |
Ascent Resources PLC warrants 12/22/07 (a) | 1,500,000 | | 102 |
Asia Energy PLC (a) | 1,478,451 | | 2,623 |
Atrium Underwriting PLC | 257,060 | | 1,109 |
Autoclenz Holdings PLC | 422,000 | | 910 |
Avanti Screenmedia Group PLC (a)(e) | 1,410,260 | | 9,335 |
Avation PLC (a) | 1,526,929 | | 0 |
Baltic Oil Terminals PLC | 1,758,000 | | 6,707 |
Belitung Zinc Corp. PLC (g) | 7,435,490 | | 1,418 |
BioCare Solutions plc (e) | 5,174,719 | | 2,270 |
Bioprogress PLC (a)(e) | 8,454,910 | | 9,152 |
Blackstar Investors PLC | 2,870,000 | | 5,885 |
Block Shield Corp. PLC (a) | 1,103,400 | | 2,547 |
BowLeven PLC (a) | 1,115,160 | | 4,159 |
British Energy Group PLC (a) | 302,200 | | 2,424 |
Cambrian Mining PLC (e) | 6,402,100 | | 15,845 |
Camco International Ltd. | 868,900 | | 854 |
Cardpoint PLC (a) | 345,300 | | 566 |
CareCapital Group PLC | 1,847,500 | | 1,163 |
Common Stocks - continued |
| Shares | | Value (Note 1) (000s) |
United Kingdom - continued |
Celsis International PLC (a) | 788,248 | | $ 2,842 |
Central African Mining & Exploration Co. PLC (a) | 12,663,119 | | 10,749 |
Centurion Electronics PLC (a)(e) | 880,024 | | 432 |
Ceres Power Holding PLC (a) | 329,370 | | 1,520 |
Chaco Resources PLC (a) | 10,430,720 | | 2,437 |
Clapham House Group PLC (a) | 494,150 | | 2,295 |
Cobra Biomanufacturing PLC (a) | 396,900 | | 352 |
Coffeeheaven International PLC (a) | 4,440,240 | | 2,880 |
Corac Group PLC (a)(e) | 5,224,104 | | 3,538 |
Corin Group PLC | 742,614 | | 3,683 |
Countermine PLC (a)(g) | 4,939 | | 243 |
Countermine PLC warrants 7/26/06 (a)(g) | 4,939 | | 0 |
CustomVis PLC (a) | 1,558,936 | | 134 |
DA Group PLC (a)(e) | 1,800,165 | | 1,236 |
Datacash Group PLC | 720,000 | | 2,019 |
Dominion Energy PLC (a) | 10,531,300 | | 1,708 |
Domino's Pizza UK & IRL PLC | 1 | | 0 |
Dream Direct Group PLC (a) | 145,000 | | 90 |
Eclipse Energy Co. Ltd. (a)(g) | 102,000 | | 1,459 |
Econergy International PLC | 675,000 | | 1,178 |
Emerald Energy PLC (a) | 552,500 | | 2,034 |
EnCore Oil PLC (a) | 2,690,530 | | 1,527 |
Eureka Mining PLC (a) | 381,700 | | 419 |
Europa Oil & Gas Holdings PLC (a) | 1,000,000 | | 463 |
Europa Oil & Gas Holdings PLC warrants 11/11/07 (a) | 500,000 | | 36 |
European Diamonds PLC (a) | 124,300 | | 25 |
Faroe Petroleum PLC (a) | 1,439,666 | | 3,295 |
Financial Payment Systems Ltd. (a)(e) | 7,787,504 | | 1,485 |
Firestone Diamonds PLC (a) | 1,518,100 | | 3,316 |
Flomerics Group PLC | 449,658 | | 643 |
Forum Energy PLC (a) | 1,419,770 | | 2,383 |
Gasol PLC (a)(e) | 7,750,800 | | 1,257 |
Gemfields Resources PLC (e) | 6,234,200 | | 5,589 |
GMA Resources PLC (a)(e) | 22,946,083 | | 3,939 |
Goals Soccer Centres PLC | 438,850 | | 2,323 |
Golden Prospect PLC | 1,457,800 | | 1,439 |
Goldshield Group PLC | 297,470 | | 1,406 |
Gyrus Group PLC (a) | 486,400 | | 3,363 |
Hallin Marine Subsea International PLC | 1,047,700 | | 1,109 |
Hambledon Mining PLC (a) | 6,343,200 | | 1,512 |
Hardide Ltd. (a)(e) | 8,154,400 | | 1,711 |
Healthcare Enterprise Group PLC (a)(e) | 16,540,108 | | 1,010 |
Common Stocks - continued |
| Shares | | Value (Note 1) (000s) |
United Kingdom - continued |
Hot Tuna International PLC (a) | 2,349,400 | | $ 851 |
Hot Tuna International PLC warrants 2/25/08 (a)(g) | 1,179,700 | | 10 |
Hydrodec Group PLC (a)(e) | 13,277,286 | | 8,231 |
ID Data PLC (a)(e) | 84,350,500 | | 925 |
Ideal Shopping Direct PLC | 661,592 | | 3,231 |
Impact Holdings PLC (a)(e) | 10,414,000 | | 2,086 |
Indago Petroleum Ltd. | 2,939,846 | | 2,523 |
Inova Holding PLC | 1,443,461 | | 771 |
Intec Telecom Systems PLC (a) | 1,950,570 | | 1,488 |
Interbulk Investments PLC (a)(e) | 4,899,600 | | 1,682 |
International Con Minerals Ltd. (a)(g) | 2,659,964 | | 798 |
International Con Minerals Ltd. warrants 10/31/07 (a)(g) | 1,329,982 | | 0 |
Intertek Group PLC | 94,110 | | 1,477 |
iomart Group PLC | 2,037,940 | | 3,207 |
IPSA Group PLC (a) | 2,184,605 | | 1,823 |
Irvine Energy PLC (a) | 12,895,900 | | 524 |
ITE Group PLC | 2,420,640 | | 6,568 |
ITM Power PLC (a) | 3,196,490 | | 8,094 |
Jubilee Platinum PLC (a)(e) | 7,171,303 | | 8,789 |
Kalahari Minerals PLC | 3,563,200 | | 1,054 |
KBC Advanced Technologies PLC (a) | 917,600 | | 630 |
Keronite PLC (a)(g) | 13,620,267 | | 1,559 |
KimCor Diamonds PLC (e) | 4,285,000 | | 1,185 |
KimCor Diamonds PLC warrants 3/15/08 (a) | 2,185,000 | | 240 |
Landround PLC (a)(e) | 358,600 | | 188 |
Lansdowne Oil & Gas PLC | 907,620 | | 1,039 |
Lawrence PLC | 964,599 | | 5,465 |
London Asia Chinese Private Equity Fund Ltd. warrants 3/31/11 (a) | 105,400 | | 53 |
LTG Technologies PLC (a)(e) | 19,449,772 | | 1,948 |
Max Petroleum PLC (d) | 11,461,320 | | 21,097 |
Metals Exploration PLC (a)(e) | 3,945,316 | | 2,126 |
Michelmersh Brick Holdings PLC | 109,600 | | 225 |
MicroEmissive Displays (a)(e) | 3,022,300 | | 1,672 |
Motivcom PLC (e) | 1,936,600 | | 3,085 |
NeutraHealth PLC (a) | 6,488,100 | | 1,176 |
Pan African Resources PLC (a) | 3,455,600 | | 338 |
Peninsular Gold Ltd. (a) | 350,000 | | 327 |
PetroLatina Energy PLC (a) | 4,545,755 | | 1,626 |
PetroLatina Energy PLC warrants 4/30/07 (a) | 2,279,573 | | 7 |
Pilat Media Global PLC (a) | 1,026,000 | | 1,365 |
Common Stocks - continued |
| Shares | | Value (Note 1) (000s) |
United Kingdom - continued |
Platinum Mining Corp. of India PLC (a)(e) | 12,070,800 | | $ 2,418 |
Plethora Solutions Holdings PLC (a) | 431,818 | | 1,594 |
PlusNet Technologies Ltd. (a) | 1,409,404 | | 5,242 |
Proteome Sciences PLC (a) | 780,842 | | 957 |
Pureprofile Media PLC (g) | 1,108,572 | | 1,057 |
Pursuit Dynamics PLC (a) | 666,667 | | 1,055 |
Rambler Metals & Mining PLC (a) | 1,300,000 | | 1,017 |
Rheochem PLC (a)(e) | 7,753,300 | | 2,034 |
Rheochem PLC warrants 12/21/07 (a) | 4,364,150 | | 105 |
Ridge Mining PLC (a) | 1,739,800 | | 1,477 |
Sarantel Group PLC Class A (a) | 1,819,000 | | 677 |
Scottish & Southern Energy PLC | 209,000 | | 5,238 |
SDL PLC (a) | 948,100 | | 3,979 |
Serabi Mining PLC (a) | 1,590,800 | | 910 |
Sibir Energy PLC (a) | 84,580 | | 653 |
Sinclair Pharma PLC (a) | 2,521,696 | | 5,556 |
Sinosoft Technology PLC | 4,618,900 | | 1,498 |
Solomon Gold PLC (e) | 1,824,300 | | 905 |
SPI Lasers PLC | 565,800 | | 2,024 |
Spice Holdings PLC | 662,000 | | 4,284 |
SR Pharma plc (a) | 2,245,200 | | 749 |
Stem Cell Sciences PLC (a) | 716,649 | | 601 |
Sterling Energy PLC (a) | 3,389,267 | | 1,148 |
Stratex International PLC | 4,191,100 | | 630 |
SubSea Resources PLC (a)(e) | 7,879,100 | | 2,630 |
SubSea Resources PLC warrants 11/4/09 (a) | 1,805,625 | | 284 |
Synchronica PLC (a) | 1,447,320 | | 511 |
Synergy Healthcare PLC | 135,840 | | 1,775 |
Tanfield Group PLC (a) | 6,543,261 | | 5,429 |
Target Resources PLC | 1,020,000 | | 817 |
Target Resources PLC warrants 7/12/08 (a) | 1,020,000 | | 78 |
Tersus Energy PLC (a) | 1,420,122 | | 799 |
Theratase PLC | 1,725,000 | | 2,007 |
Third Advance Value Realisation Co. Ltd. (a) | 507,108 | | 933 |
Tikit Group PLC | 446,100 | | 2,034 |
TMO Biotec (g) | 10,000 | | 572 |
Toledo Mining Corp. PLC (a)(e) | 1,608,144 | | 3,742 |
Triple Plate Junction PLC (a) | 2,463,000 | | 799 |
Triple Plate Junction PLC warrants 5/9/07 (a) | 1,818,750 | | 0 |
Tristel PLC | 30,000 | | 26 |
UK Coal PLC | 809,200 | | 3,774 |
Unibet Group PLC unit | 214,356 | | 4,689 |
Common Stocks - continued |
| Shares | | Value (Note 1) (000s) |
United Kingdom - continued |
Vectura Group PLC (a) | 2,489,400 | | $ 4,392 |
Victoria Oil & Gas PLC (a) | 1,855,000 | | 2,618 |
Virotec International PLC (a) | 6,788,332 | | 2,104 |
Whatman PLC | 280,100 | | 1,549 |
William Ransom & Son PLC | 2,973,100 | | 2,637 |
Windsor PLC | 333,530 | | 309 |
York Pharma PLC (a) | 1,070,000 | | 1,970 |
ZincOx Resources PLC (a) | 693,100 | | 3,305 |
TOTAL UNITED KINGDOM | | 370,240 |
United States of America - 1.5% |
121Media, Inc. (a) | 644,900 | | 11,748 |
Cyberscan Technology, Inc. (a)(e) | 996,527 | | 4,562 |
Frontera Resources Corp. (a) | 1,892,700 | | 1,950 |
Frontier Mining Ltd. (a)(e) | 6,771,600 | | 1,808 |
Solar Integrated Technologies, Inc. (a) | 1,345,573 | | 667 |
Spacelabs Healthcare, Inc. | 707,250 | | 1,727 |
Uramin, Inc. warrants 7/26/08 (a)(g) | 666,666 | | 330 |
UTEK Corp. (d) | 22,500 | | 320 |
XL TechGroup, Inc. (a) | 1,365,380 | | 5,886 |
TOTAL UNITED STATES OF AMERICA | | 28,998 |
TOTAL COMMON STOCKS (Cost $1,554,654) | 1,859,510 |
Nonconvertible Preferred Stocks - 0.1% |
| | | |
United Kingdom - 0.1% |
Third Advance Value Realisation Co. Ltd. (a)
(Cost $1,344) | 757,164 | | 1,401 |
Investment Companies - 0.0% |
| | | |
United Kingdom - 0.0% |
The Greenhouse Fund Ltd. (a)
(Cost $404) | 2,175,000 | | 456 |
Corporate Bonds - 0.3% |
| Principal Amount (000s)(h) | | Value (Note 1) (000s) |
Convertible Bonds - 0.3% |
Canada - 0.3% |
Western Canadian Coal Corp. 7.5% 3/24/11 | CAD | 7,354 | | $ 5,830 |
Nonconvertible Bonds - 0.0% |
Norway - 0.0% |
Songa Offshore ASA 9% 9/8/10 (f) | | $ 600 | | 600 |
TOTAL CORPORATE BONDS (Cost $6,935) | 6,430 |
Money Market Funds - 9.0% |
| Shares | | |
Fidelity Cash Central Fund, 5.34% (b) | 76,978,461 | | 76,978 |
Fidelity Securities Lending Cash Central Fund, 5.35% (b)(c) | 96,528,195 | | 96,528 |
TOTAL MONEY MARKET FUNDS (Cost $173,506) | 173,506 |
TOTAL INVESTMENT PORTFOLIO - 105.4% (Cost $1,736,843) | | 2,041,303 |
NET OTHER ASSETS - (5.4)% | | (104,822) |
NET ASSETS - 100% | $ 1,936,481 |
Currency Abbreviations |
CAD | - | Canadian dollar |
Legend |
(a) Non-income producing |
(b) Affiliated fund that is available only to investment companies and other accounts managed by Fidelity Investments. The rate quoted is the annualized seven-day yield of the fund at period end. A complete unaudited listing of the fund's holdings as of its most recent quarter end is available upon request. |
(c) Investment made with cash collateral received from securities on loan. |
(d) Security or a portion of the security is on loan at period end. |
(e) Affiliated company |
(f) Security exempt from registration under Rule 144A of the Securities Act of 1933. These securities may be resold in transactions exempt from registration, normally to qualified institutional buyers. At the end of the period, the value of these securities amounted to $1,520,000 or 0.1% of net assets. |
(g) Restricted securities - Investment in securities not registered under the Securities Act of 1933 (excluding 144A issues). At the end of the period, the value of restricted securities (excluding 144A issues) amounted to $14,646,000 or 0.8% of net assets. |
Additional information on each holding is as follows: |
Security | Acquisition Date | Acquisition Cost (000s) |
AirSea Lines | 8/4/06 | $ 1,199 |
AirSea Lines warrants 6/14/08 | 8/4/06 | $ 0 |
Angus & Ross PLC | 8/3/06 | $ 969 |
Appian Technology PLC warrants 2/28/08 | 2/18/05 | $ 0 |
Belitung Zinc Corp. PLC | 1/12/06 | $ 1,308 |
Buried Hill Energy (Cyprus) PCL | 8/18/06 | $ 2,142 |
Countermine PLC | 12/22/05 | $ 443 |
Countermine PLC warrants 7/26/06 | 12/22/05 | $ 0 |
Security | Acquisition Date | Acquisition Cost (000s) |
Eclipse Energy Co. Ltd. | 4/28/05 | $ 1,459 |
Hot Tuna International PLC warrants 2/25/08 | 2/14/06 | $ 0 |
International Con Minerals Ltd. | 1/30/06 | $ 798 |
International Con Minerals Ltd. warrants 10/31/07 | 1/30/06 | $ 0 |
Kalahari Energy | 9/1/06 | $ 1,814 |
Keronite PLC | 8/16/06 | $ 1,549 |
Pureprofile Media PLC | 5/3/05 - 1/11/06 | $ 1,173 |
Rock Well Petroleum, Inc. | 4/13/06 | $ 1,004 |
Starfield Resources, Inc. warrants 5/9/07 | 5/18/06 | $ 0 |
Starfield Resources, Inc. warrants 1/21/08 | 1/17/06 | $ 0 |
Stealth Ventures Ltd. warrants 3/12/08 | 9/21/06 | $ 0 |
TMO Biotec | 10/27/05 | $ 535 |
Uramin, Inc. warrants 7/26/08 | 8/24/05 | $ 0 |
(h) Principal amount is stated in United States dollars unless otherwise noted. |
Affiliated Central Funds |
Information regarding fiscal year to date income earned by the Fund from investments in Fidelity Central Funds is as follows: |
Fund | Income earned
(Amounts in thousands) |
Fidelity Cash Central Fund | $ 1,843 |
Fidelity Securities Lending Cash Central Fund | 2,546 |
Total | $ 4,389 |
Other Affiliated Issuers |
An affiliated company is a company in which the fund has ownership of at least 5% of the voting securities. Fiscal year to date transactions with companies which are or were affiliates are as follows: |
Affiliates
(Amounts in thousands) | Value, beginning of period | Purchases | Sales Proceeds | Dividend Income | Value,
end of
period |
121Media, Inc. | $ 1,832 | $ 915 | $ 704 | $ - | $ - |
Advanced Technology PLC | - | - | - | - | - |
Advent Air Ltd. | - | 2,523 | 121 | 19 | 2,948 |
Adwalker PLC | 1,292 | - | - | - | 413 |
Afren PLC | 12,040 | 2,657 | 7,151 | - | - |
Alliance Pharma PLC | 2,924 | - | 318 | - | - |
Ascent Resources PLC | 2,603 | 526 | 1,215 | - | - |
Autoclenz Holdings PLC | - | 1,213 | 290 | 15 | - |
Avanti Screenmedia Group PLC | - | 7,564 | 1,837 | - | 9,335 |
BDI Mining Corp. | 4,646 | 494 | - | - | 3,288 |
BioCare Solutions PLC | - | 439 | - | - | 2,270 |
Bioprogress PLC | 2,479 | 4,927 | 1,571 | - | 9,152 |
Blackstar Investors PLC | - | 5,074 | - | - | - |
BowLeven PLC | 9,158 | 2,970 | 4,238 | - | - |
Cambrian Mining PLC | 15,024 | 3,024 | 2,644 | 156 | 15,845 |
Centurion Electronics PLC | 574 | 366 | - | - | 432 |
Coffeeheaven International PLC | 1,580 | 1,537 | 1,731 | - | - |
Corac Group PLC | 2,146 | 283 | 88 | - | 3,538 |
Cyberscan Technology, Inc. | 1,725 | 8,966 | - | - | 4,562 |
DA Group PLC | 2,490 | - | 64 | - | 1,236 |
Dominion Energy PLC | - | 932 | - | - | - |
Financial Payment Systems Ltd. | - | 1,729 | - | - | 1,485 |
Forum Energy PLC | 2,505 | 1,207 | 479 | - | - |
Affiliates
(Amounts in thousands) | Value, beginning of period | Purchases | Sales Proceeds | Dividend Income | Value,
end of
period |
Fox Resources Ltd. | $ 844 | $ - | $ 4,134 | $ - | $ - |
Frontier Mining Ltd. | 2,220 | 256 | - | - | 1,808 |
Gasol PLC | - | 2,620 | 263 | - | 1,257 |
Gemfields Resources PLC | - | 5,312 | 532 | - | 5,589 |
GMA Resources PLC | 3,026 | 1,455 | 354 | - | 3,939 |
Hardide Ltd. | 2,909 | - | 1,050 | - | 1,711 |
Healthcare Enterprise Group PLC | 10,604 | 2,028 | - | - | 1,010 |
Hot Tuna International PLC | - | 2,049 | 6 | - | - |
Hydrodec Group PLC | 2,730 | 5,558 | 1,670 | - | 8,231 |
ID Data PLC | 1,344 | - | - | - | 925 |
Impact Holdings PLC | - | 1,944 | - | - | 2,086 |
Inion OY | 3,466 | 2,117 | - | - | 1,677 |
Interbulk Investments PLC | - | 2,006 | 298 | - | 1,682 |
International Ferro Metals | 15,854 | 600 | 1,630 | - | 17,682 |
IPSA Group PLC | 2,128 | - | 1,223 | - | - |
Jubilee Platinum PLC | 3,339 | 4,414 | 791 | - | 8,789 |
KimCor Diamonds PLC | - | 1,147 | 23 | - | 1,185 |
Kura Corp. Ltd. | 18,905 | 588 | 2,593 | 15 | - |
Lambert Howarth Group PLC | 6,291 | - | 5,227 | 131 | - |
Landround PLC | 582 | 54 | - | - | 188 |
Leadcom Integrated Solutions | 4,705 | - | 1,445 | 64 | - |
LTG Technologies PLC | 2,294 | 1,300 | 16 | - | 1,948 |
MagIndustries Corp. | - | 13,459 | 4,582 | - | - |
Metals Exploration PLC | 624 | 533 | 194 | - | 2,126 |
MicroEmissive Displays | - | 1,141 | - | - | 1,672 |
Mineral Commodities Ltd. | - | 1,802 | - | - | 948 |
Mintails Ltd. | - | 1,466 | 244 | - | - |
Motivcom PLC | 3,423 | - | 147 | 40 | 3,085 |
NeutraHealth PLC | 1,719 | - | 193 | - | - |
Oil Quest Resources PLC (OLD) | 596 | - | - | - | - |
Pertra AS (A Shares) | - | 3,513 | 1,508 | - | - |
PetroLatina Energy PLC | - | - | 34 | - | - |
Pilat Media Global PLC | 2,244 | - | 1,894 | - | - |
Platinum Mining Corp. of India PLC | 3,602 | - | 91 | - | 2,418 |
Affiliates
(Amounts in thousands) | Value, beginning of period | Purchases | Sales Proceeds | Dividend Income | Value,
end of
period |
PlusNet Technologies Ltd. | $ 7,340 | $ 720 | $ 845 | $ - | $ - |
PSI AG | 3,396 | - | 1,893 | - | - |
Rheochem PLC | 1,854 | - | 258 | - | 2,034 |
Solomon Gold PLC | - | 1,588 | - | - | 905 |
Sphere Investments Ltd. | 2,552 | - | 2,544 | - | - |
Starfield Resources, Inc. | 3,741 | 1,819 | 1,083 | - | 3,247 |
Stepstone ASA | 5,719 | - | - | - | - |
SubSea Resources PLC | 4,362 | 52 | 461 | - | 2,630 |
Sylvania Resources Ltd. | 2,738 | 557 | 109 | - | - |
Sylvania Resources Ltd. (United Kingdom) | - | 3,084 | - | - | - |
Synchronica PLC (formerly, Dat Group PLC) | 1,263 | - | 117 | - | - |
Taghmen Energy PLC | 5,671 | - | 102 | - | - |
Tanfield Group PLC | 2,911 | 2,114 | 5,156 | - | - |
Tanzanite One Ltd. | 4,936 | 10,260 | 184 | 414 | 9,086 |
Teleunit Spa | 3,683 | 710 | 28 | 94 | 1,122 |
Tikit Group PLC | 2,436 | - | 1,014 | 33 | - |
Toledo Mining Corp. PLC | 982 | 2,614 | 313 | - | 3,742 |
Visual Defence, Inc. | 1,379 | 1,024 | - | - | 2,673 |
Xceldiam Ltd. | 2,643 | - | - | - | 1,946 |
Total | $ 214,073 | $ 127,250 | $ 66,700 | $ 981 | $ 151,845 |
Annual Report
See accompanying notes which are an integral part of the financial statements.
Financial Statements
Statement of Assets and Liabilities
Amounts in thousands (except per-share amounts) | October 31, 2006 |
| | |
Assets | | |
Investment in securities, at value (including securities loaned of $91,236) - See accompanying schedule: Unaffiliated issuers (cost $1,381,890) | $ 1,715,952 | |
Fidelity Central Funds (cost $173,506) | 173,506 | |
Other affiliated issuers (cost $181,447) | 151,845 | |
Total Investments (cost $1,736,843) | | $ 2,041,303 |
Cash | | 79 |
Foreign currency held at value (cost $464) | | 464 |
Receivable for investments sold | | 41,977 |
Receivable for fund shares sold | | 566 |
Dividends receivable | | 2,857 |
Interest receivable | | 359 |
Receivable from investment adviser for expense reductions | | 3 |
Other receivables | | 414 |
Total assets | | 2,088,022 |
| | |
Liabilities | | |
Payable for investments purchased | $ 46,615 | |
Payable for fund shares redeemed | 6,294 | |
Accrued management fee | 1,457 | |
Distribution fees payable | 54 | |
Other affiliated payables | 445 | |
Other payables and accrued expenses | 148 | |
Collateral on securities loaned, at value | 96,528 | |
Total liabilities | | 151,541 |
| | |
Net Assets | | $ 1,936,481 |
Net Assets consist of: | | |
Paid in capital | | $ 1,186,953 |
Undistributed net investment income | | 5,133 |
Accumulated undistributed net realized gain (loss) on investments and foreign currency transactions | | 440,012 |
Net unrealized appreciation (depreciation) on investments and assets and liabilities in foreign currencies | | 304,383 |
Net Assets | | $ 1,936,481 |
Annual Report
See accompanying notes which are an integral part of the financial statements.
Financial Statements - continued
Statement of Assets and Liabilities - continued
Amounts in thousands (except per-share amounts) | October 31, 2006 |
| | |
Calculation of Maximum Offering Price
Class A:
Net Asset Value and redemption price per share ($36,701 ÷ 1,274.8 shares) | | $ 28.79 |
| | |
Maximum offering price per share (100/94.25 of $28.79) | | $ 30.55 |
Class T:
Net Asset Value and redemption price per share ($41,982 ÷ 1,465.7 shares) | | $ 28.64 |
| | |
Maximum offering price per share (100/96.50 of $28.64) | | $ 29.68 |
Class B:
Net Asset Value and offering price per share ($11,354 ÷ 401.7 shares) A | | $ 28.26 |
| | |
Class C:
Net Asset Value and offering price per share ($21,335 ÷ 753.2 shares) A | | $ 28.33 |
| | |
| | |
International Small Cap:
Net Asset Value, offering price and redemption price per share ($1,816,059 ÷ 62,562.3 shares) | | $ 29.03 |
| | |
Institutional Class:
Net Asset Value, offering price and redemption price per share ($9,050 ÷ 312.2 shares) | | $ 28.99 |
A Redemption price per share is equal to net asset value less any applicable contingent deferred sales charge.
Annual Report
See accompanying notes which are an integral part of the financial statements.
Statement of Operations
Amounts in thousands | Year ended October 31, 2006 |
Investment Income | | |
Dividends (including $981 received from other affiliated issuers) | | $ 33,534 |
Interest | | 499 |
Income from Fidelity Central Funds (including $2,546 from security lending) | | 4,389 |
| | 38,422 |
Less foreign taxes withheld | | (1,795) |
Total income | | 36,627 |
| | |
Expenses | | |
Management fee
Basic fee | $ 21,102 | |
Performance adjustment | 2,444 | |
Transfer agent fees | 4,929 | |
Distribution fees | 752 | |
Accounting and security lending fees | 1,162 | |
Custodian fees and expenses | 1,238 | |
Independent trustees' compensation | 10 | |
Registration fees | 88 | |
Audit | 102 | |
Legal | 48 | |
Interest | 38 | |
Miscellaneous | 20 | |
Total expenses before reductions | 31,933 | |
Expense reductions | (1,487) | 30,446 |
Net investment income (loss) | | 6,181 |
Realized and Unrealized Gain (Loss) Net realized gain (loss) on: | | |
Investment securities: | | |
Unaffiliated issuers (net of foreign taxes of $427) | 461,328 | |
Other affiliated issuers | 367 | |
Foreign currency transactions | (494) | |
Total net realized gain (loss) | | 461,201 |
Change in net unrealized appreciation (depreciation) on: Investment securities (net of decrease in deferred foreign taxes of $314) | (42,284) | |
Assets and liabilities in foreign currencies | (54) | |
Total change in net unrealized appreciation (depreciation) | | (42,338) |
Net gain (loss) | | 418,863 |
Net increase (decrease) in net assets resulting from operations | | $ 425,044 |
Annual Report
See accompanying notes which are an integral part of the financial statements.
Financial Statements - continued
Statement of Changes in Net Assets
Amounts in thousands | Year ended
October 31,
2006 | Year ended
October 31,
2005 |
Increase (Decrease) in Net Assets | | |
Operations | | |
Net investment income (loss) | $ 6,181 | $ 10,862 |
Net realized gain (loss) | 461,201 | 242,238 |
Change in net unrealized appreciation (depreciation) | (42,338) | 169,248 |
Net increase (decrease) in net assets resulting
from operations | 425,044 | 422,348 |
Distributions to shareholders from net investment income | (10,829) | (3,406) |
Distributions to shareholders from net realized gain | (234,438) | (45,235) |
Total distributions | (245,267) | (48,641) |
Share transactions - net increase (decrease) | (456,221) | 701,403 |
Redemption fees | 565 | 1,213 |
Total increase (decrease) in net assets | (275,879) | 1,076,323 |
| | |
Net Assets | | |
Beginning of period | 2,212,360 | 1,136,037 |
End of period (including undistributed net investment income of $5,133 and undistributed net investment income of $10,862, respectively) | $ 1,936,481 | $ 2,212,360 |
Annual Report
See accompanying notes which are an integral part of the financial statements.
Financial Highlights - Class A
Years ended October 31, | 2006 | 2005 | 2004 | 2003 I |
Selected Per-Share Data | | | | |
Net asset value, beginning of period | $ 26.69 | $ 21.25 | $ 17.69 | $ 12.35 |
Income from Investment Operations | | | | |
Net investment income (loss) E | (.02) | .05 | .02 | .02 H |
Net realized and unrealized gain (loss) | 5.05 | 6.16 | 3.83 | 5.30 |
Total from investment operations | 5.03 | 6.21 | 3.85 | 5.32 |
Distributions from net investment income | (.05) | (.02) | (.02) | - |
Distributions from net realized gain | (2.89) | (.77) | (.31) | - |
Total distributions | (2.94) | (.79) | (.33) | - |
Redemption fees added to paid in capital E | .01 | .02 | .04 | .02 |
Net asset value, end of period | $ 28.79 | $ 26.69 | $ 21.25 | $ 17.71 |
Total Return B, C, D | 20.22% | 30.16% | 22.36% | 43.24% |
Ratios to Average Net Assets F, J | | | | |
Expenses before reductions | 1.64% | 1.66% | 1.71% | 1.77% A |
Expenses net of fee waivers, if any | 1.64% | 1.66% | 1.71% | 1.77% A |
Expenses net of all reductions | 1.58% | 1.63% | 1.69% | 1.74% A |
Net investment income (loss) | (.08)% | .21% | .09% | .28% A |
Supplemental Data | | | | |
Net assets, end of period (in millions) | $ 37 | $ 35 | $ 13 | $ 5 |
Portfolio turnover rate G | 84% | 79% | 77% | 84% A |
A Annualized
B Total returns for periods of less than one year are not annualized.
C Total returns would have been lower had certain expenses not been reduced during the periods shown.
D Total returns do not include the effect of the sales charges.
E Calculated based on average shares outstanding during the period.
F Fees and expenses of the underlying Fidelity Central Funds are not included in the Fund's expense ratio. The Fund indirectly bears its proportionate share of the expenses of any underlying Fidelity Central Funds.
G Amount does not include the portfolio activity of any underlying Fidelity Central Funds.
H Investment income per share reflects a special dividend which amounted to $.01 per share.
I For the period May 27, 2003 (commencement of sale of shares) to October 31, 2003.
J Expense ratios reflect operating expenses of the class. Expenses before reductions do not reflect amounts reimbursed by the investment adviser or reductions from brokerage service arrangements or other expense offset arrangements and do not represent the amount paid by the class during periods when reimbursements or reductions occur. Expense ratios before reductions for start-up periods may not be representative of longer-term operating periods. Expenses net of fee waivers reflect expenses after reimbursement by the investment adviser but prior to reductions from brokerage service arrangements or other expense offset arrangements. Expenses net of all reductions represent the net expenses paid by the class.
Annual Report
See accompanying notes which are an integral part of the financial statements.
Financial Highlights - Class T
Years ended October 31, | 2006 | 2005 | 2004 | 2003 I |
Selected Per-Share Data | | | | |
Net asset value, beginning of period | $ 26.57 | $ 21.20 | $ 17.68 | $ 12.35 |
Income from Investment Operations | | | | |
Net investment income (loss) E | (.09) | (.01) | (.03) | - H, K |
Net realized and unrealized gain (loss) | 5.03 | 6.12 | 3.83 | 5.31 |
Total from investment operations | 4.94 | 6.11 | 3.80 | 5.31 |
Distributions from net investment income | - | - | (.01) | - |
Distributions from net realized gain | (2.88) | (.76) | (.31) | - |
Total distributions | (2.88) | (.76) | (.32) | - |
Redemption fees added to paid in capital E | .01 | .02 | .04 | .02 |
Net asset value, end of period | $ 28.64 | $ 26.57 | $ 21.20 | $ 17.65 |
Total Return B, C, D | 19.93% | 29.72% | 22.07% | 43.16% |
Ratios to Average Net Assets F, J | | | | |
Expenses before reductions | 1.89% | 1.92% | 1.94% | 2.12% A |
Expenses net of fee waivers, if any | 1.89% | 1.91% | 1.94% | 2.12% A |
Expenses net of all reductions | 1.83% | 1.88% | 1.92% | 2.09% A |
Net investment income (loss) | (.32)% | (.04)% | (.14)% | (.07)% A |
Supplemental Data | | | | |
Net assets, end of period (in millions) | $ 42 | $ 42 | $ 15 | $ 4 |
Portfolio turnover rate G | 84% | 79% | 77% | 84% A |
A Annualized
B Total returns for periods of less than one year are not annualized.
C Total returns would have been lower had certain expenses not been reduced during the periods shown.
D Total returns do not include the effect of the sales charges.
E Calculated based on average shares outstanding during the period.
F Fees and expenses of the underlying Fidelity Central Funds are not included in the Fund's expense ratio. The Fund indirectly bears its proportionate share of the expenses of any underlying Fidelity Central Funds.
G Amount does not include the portfolio activity of any underlying Fidelity Central Funds.
H Investment income per share reflects a special dividend which amounted to $.01 per share.
I For the period May 27, 2003 (commencement of sale of shares) to October 31, 2003.
J Expense ratios reflect operating expenses of the class. Expenses before reductions do not reflect amounts reimbursed by the investment adviser or reductions from brokerage service arrangements or other expense offset arrangements and do not represent the amount paid by the class during periods when reimbursements or reductions occur. Expense ratios before reductions for start-up periods may not be representative of longer-term operating periods. Expenses net of fee waivers reflect expenses after reimbursement by the investment adviser but prior to reductions from brokerage service arrangements or other expense offset arrangements. Expenses net of all reductions represent the net expenses paid by the class.
K Amount represents less than $.01 per share.
Annual Report
See accompanying notes which are an integral part of the financial statements.
Financial Highlights - Class B
Years ended October 31, | 2006 | 2005 | 2004 | 2003 I |
Selected Per-Share Data | | | | |
Net asset value, beginning of period | $ 26.24 | $ 20.99 | $ 17.62 | $ 12.35 |
Income from Investment Operations | | | | |
Net investment income (loss) E | (.24) | (.14) | (.16) | (.05) H |
Net realized and unrealized gain (loss) | 4.98 | 6.08 | 3.80 | 5.30 |
Total from investment operations | 4.74 | 5.94 | 3.64 | 5.25 |
Distributions from net realized gain | (2.73) | (.71) | (.31) | - |
Redemption fees added to paid in capital E | .01 | .02 | .04 | .02 |
Net asset value, end of period | $ 28.26 | $ 26.24 | $ 20.99 | $ 17.52 |
Total Return B, C, D | 19.28% | 29.13% | 21.21% | 42.67% |
Ratios to Average Net Assets F, J | | | | |
Expenses before reductions | 2.48% | 2.49% | 2.63% | 2.76% A |
Expenses net of fee waivers, if any | 2.40% | 2.43% | 2.63% | 2.76% A |
Expenses net of all reductions | 2.34% | 2.40% | 2.60% | 2.73% A |
Net investment income (loss) | (.84)% | (.56)% | (.83)% | (.71)% A |
Supplemental Data | | | | |
Net assets, end of period (in millions) | $ 11 | $ 13 | $ 5 | $ 1 |
Portfolio turnover rate G | 84% | 79% | 77% | 84% A |
A Annualized
B Total returns for periods of less than one year are not annualized.
C Total returns would have been lower had certain expenses not been reduced during the periods shown.
D Total returns do not include the effect of the contingent deferred sales charge.
E Calculated based on average shares outstanding during the period.
F Fees and expenses of the underlying Fidelity Central Funds are not included in the Fund's expense ratio. The Fund indirectly bears its proportionate share of the expenses of any underlying Fidelity Central Funds.
G Amount does not include the portfolio activity of any underlying Fidelity Central Funds.
H Investment income per share reflects a special dividend which amounted to $.01 per share.
I For the period May 27, 2003 (commencement of sale of shares) to October 31, 2003.
J Expense ratios reflect operating expenses of the class. Expenses before reductions do not reflect amounts reimbursed by the investment adviser or reductions from brokerage service arrangements or other expense offset arrangements and do not represent the amount paid by the class during periods when reimbursements or reductions occur. Expense ratios before reductions for start-up periods may not be representative of longer-term operating periods. Expenses net of fee waivers reflect expenses after reimbursement by the investment adviser but prior to reductions from brokerage service arrangements or other expense offset arrangements. Expenses net of all reductions represent the net expenses paid by the class.
Annual Report
See accompanying notes which are an integral part of the financial statements.
Financial Highlights - Class C
Years ended October 31, | 2006 | 2005 | 2004 | 2003 I |
Selected Per-Share Data | | | | |
Net asset value, beginning of period | $ 26.31 | $ 21.04 | $ 17.64 | $ 12.35 |
Income from Investment Operations | | | | |
Net investment income (loss) E | (.23) | (.13) | (.12) | (.04) H |
Net realized and unrealized gain (loss) | 4.99 | 6.10 | 3.80 | 5.31 |
Total from investment operations | 4.76 | 5.97 | 3.68 | 5.27 |
Distributions from net investment income | - | - | (.01) | - |
Distributions from net realized gain | (2.75) | (.72) | (.31) | - |
Total distributions | (2.75) | (.72) | (.32) | - |
Redemption fees added to paid in capital E | .01 | .02 | .04 | .02 |
Net asset value, end of period | $ 28.33 | $ 26.31 | $ 21.04 | $ 17.64 |
Total Return B, C, D | 19.34% | 29.22% | 21.43% | 42.83% |
Ratios to Average Net Assets F, J | | | | |
Expenses before reductions | 2.38% | 2.41% | 2.43% | 2.57% A |
Expenses net of fee waivers, if any | 2.38% | 2.41% | 2.43% | 2.57% A |
Expenses net of all reductions | 2.32% | 2.38% | 2.40% | 2.55% A |
Net investment income (loss) | (.81)% | (.54)% | (.62)% | (.52)% A |
Supplemental Data | | | | |
Net assets, end of period (in millions) | $ 21 | $ 25 | $ 9 | $ 1 |
Portfolio turnover rate G | 84% | 79% | 77% | 84% A |
A Annualized
B Total returns for periods of less than one year are not annualized.
C Total returns would have been lower had certain expenses not been reduced during the periods shown.
D Total returns do not include the effect of the contingent deferred sales charge.
E Calculated based on average shares outstanding during the period.
F Fees and expenses of the underlying Fidelity Central Funds are not included in the Fund's expense ratio. The Fund indirectly bears its proportionate share of the expenses of any underlying Fidelity Central Funds.
G Amount does not include the portfolio activity of any underlying Fidelity Central Funds.
H Investment income per share reflects a special dividend which amounted to $.01 per share.
I For the period May 27, 2003 (commencement of sale of shares) to October 31, 2003.
J Expense ratios reflect operating expenses of the class. Expenses before reductions do not reflect amounts reimbursed by the investment adviser or reductions from brokerage service arrangements or other expense offset arrangements and do not represent the amount paid by the class during periods when reimbursements or reductions occur. Expense ratios before reductions for start-up periods may not be representative of longer-term operating periods. Expenses net of fee waivers reflect expenses after reimbursement by the investment adviser but prior to reductions from brokerage service arrangements or other expense offset arrangements. Expenses net of all reductions represent the net expenses paid by the class.
Annual Report
See accompanying notes which are an integral part of the financial statements.
Financial Highlights - International Small Cap
Years ended October 31, | 2006 | 2005 | 2004 | 2003 | 2002 H |
Selected Per-Share Data | | | | | |
Net asset value, beginning of period | $ 26.89 | $ 21.36 | $ 17.71 | $ 9.87 | $ 10.00 |
Income from Investment Operations | | | | | |
Net investment income (loss) D | .08 | .15 | .10 | .07 G | (.01) |
Net realized and unrealized gain (loss) | 5.08 | 6.19 | 3.84 | 7.75 | (.12) |
Total from investment operations | 5.16 | 6.34 | 3.94 | 7.82 | (.13) |
Distributions from net investment income | (.14) | (.06) | (.02) | - | - |
Distributions from net realized gain | (2.89) | (.77) | (.31) | (.02) | - |
Total distributions | (3.03) | (.83) | (.33) | (.02) | - |
Redemption fees added to
paid in capital D | .01 | .02 | .04 | .04 | - J |
Net asset value, end of period | $ 29.03 | $ 26.89 | $ 21.36 | $ 17.71 | $ 9.87 |
Total Return B, C | 20.65% | 30.67% | 22.84% | 79.78% | (1.30)% |
Ratios to Average Net Assets E, I | | | | |
Expenses before reductions | 1.28% | 1.28% | 1.30% | 1.54% | 13.70% A |
Expenses net of fee waivers, if any | 1.28% | 1.28% | 1.30% | 1.54% | 1.80% A |
Expenses net of all
reductions | 1.22% | 1.25% | 1.28% | 1.51% | 1.80% A |
Net investment income (loss) | .29% | .59% | .50% | .46% | (.56)% A |
Supplemental Data | | | | | |
Net assets, end of period
(in millions) | $ 1,816 | $ 2,090 | $ 1,091 | $ 547 | $ 3 |
Portfolio turnover rate F | 84% | 79% | 77% | 84% | 85% A |
A Annualized
B Total returns for periods of less than one year are not annualized.
C Total returns would have been lower had certain expenses not been reduced during the periods shown.
D Calculated based on average shares outstanding during the period.
E Fees and expenses of the underlying Fidelity Central Funds are not included in the Fund's expense ratio. The Fund indirectly bears its proportionate share of the expenses of any underlying Fidelity Central Funds.
F Amount does not include the portfolio activity of any underlying Fidelity Central Funds.
G Investment income per share reflects a special dividend which amounted to $.03 per share.
H For the period September 18, 2002 (commencement of operations) to October 31, 2002.
I Expense ratios reflect operating expenses of the class. Expenses before reductions do not reflect amounts reimbursed by the investment adviser or reductions from brokerage service arrangements or other expense offset arrangements and do not represent the amount paid by the class during periods when reimbursements or reductions occur. Expense ratios before reductions for start-up periods may not be representative of longer-term operating periods. Expenses net of fee waivers reflect expenses after reimbursement by the investment adviser but prior to reductions from brokerage service arrangements or other expense offset arrangements. Expenses net of all reductions represent the net expenses paid by the class.
J Amount represents less than $.01 per share.
Annual Report
See accompanying notes which are an integral part of the financial statements.
Financial Highlights - Institutional Class
Years ended October 31, | 2006 | 2005 | 2004 | 2003 H |
Selected Per-Share Data | | | | |
Net asset value, beginning of period | $ 26.86 | $ 21.36 | $ 17.72 | $ 12.35 |
Income from Investment Operations | | | | |
Net investment income (loss) D | .08 | .14 | .10 | .04 G |
Net realized and unrealized gain (loss) | 5.07 | 6.18 | 3.84 | 5.31 |
Total from investment operations | 5.15 | 6.32 | 3.94 | 5.35 |
Distributions from net investment income | (.14) | (.07) | (.03) | - |
Distributions from net realized gain | (2.89) | (.77) | (.31) | - |
Total distributions | (3.03) | (.84) | (.34) | - |
Redemption fees added to paid in capital D | .01 | .02 | .04 | .02 |
Net asset value, end of period | $ 28.99 | $ 26.86 | $ 21.36 | $ 17.72 |
Total Return B, C | 20.65% | 30.59% | 22.84% | 43.48% |
Ratios to Average Net Assets E, I | | | | |
Expenses before reductions | 1.29% | 1.30% | 1.32% | 1.51% A |
Expenses net of fee waivers, if any | 1.29% | 1.30% | 1.32% | 1.51% A |
Expenses net of all reductions | 1.23% | 1.27% | 1.29% | 1.48% A |
Net investment income (loss) | .28% | .57% | .49% | .54% A |
Supplemental Data | | | | |
Net assets, end of period (in millions) | $ 9 | $ 7 | $ 3 | $ .4 |
Portfolio turnover rate F | 84% | 79% | 77% | 84% A |
A Annualized
B Total returns for periods of less than one year are not annualized.
C Total returns would have been lower had certain expenses not been reduced during the periods shown.
D Calculated based on average shares outstanding during the period.
E Fees and expenses of the underlying Fidelity Central Funds are not included in the Fund's expense ratio. The Fund indirectly bears its proportionate share of the expenses of any underlying Fidelity Central Funds.
F Amount does not include the portfolio activity of any underlying Fidelity Central Funds.
G Investment income per share reflects a special dividend which amounted to $.01 per share.
H For the period May 27, 2003 (commencement of sale of shares) to October 31, 2003.
I Expense ratios reflect operating expenses of the class. Expenses before reductions do not reflect amounts reimbursed by the investment adviser or reductions from brokerage service arrangements or other expense offset arrangements and do not represent the amount paid by the class during periods when reimbursements or reductions occur. Expense ratios before reductions for start-up periods may not be representative of longer-term operating periods. Expenses net of fee waivers reflect expenses after reimbursement by the investment adviser but prior to reductions from brokerage service arrangements or other expense offset arrangements. Expenses net of all reductions represent the net expenses paid by the class.
Annual Report
See accompanying notes which are an integral part of the financial statements.
Notes to Financial Statements
For the period ended October 31, 2006
(Amounts in thousands except ratios)
1. Significant Accounting Policies.
Fidelity International Small Cap Fund (the Fund) is a fund of Fidelity Investment Trust (the trust) and is authorized to issue an unlimited number of shares. The trust is registered under the Investment Company Act of 1940, as amended (the 1940 Act), as an open-end management investment company organized as a Massachusetts business trust.
The Fund offers Class A, Class T, Class B, Class C, International Small Cap and Institutional Class shares, each of which has equal rights as to assets and voting privileges. Each class has exclusive voting rights with respect to matters that affect that class. Class B shares will automatically convert to Class A shares after a holding period of seven years from the initial date of purchase. Investment income, realized and unrealized capital gains and losses, the common expenses of the Fund, and certain fund-level expense reductions, if any, are allocated on a pro rata basis to each class based on the relative net assets of each class to the total net assets of the Fund. Each class differs with respect to transfer agent and distribution and service plan fees incurred. Certain expense reductions also differ by class.
The Fund may invest in Fidelity Central Funds which are open-end investment companies available to investment companies and other accounts managed by Fidelity Management & Research Company (FMR) and its affiliates. The financial statements have been prepared in conformity with accounting principles generally accepted in the United States of America, which require management to make certain estimates and assumptions at the date of the financial statements. The following summarizes the significant accounting policies of the Fund, which are also consistently followed by the Fidelity Central Funds:
Security Valuation. Investments are valued and net asset value (NAV) per share is calculated (NAV calculation) as of the close of business of the New York Stock Exchange (NYSE), normally 4:00 p.m. Eastern time. Wherever possible, the Fund uses independent pricing services approved by the Board of Trustees to value its investments.
Equity securities, including restricted securities, for which market quotations are readily available, are valued at the last reported sale price or official closing price as reported by an independent pricing service on the primary market or exchange on which they are traded. In the event there were no sales during the day or closing prices are not available, securities are valued at the last quoted bid price. Debt securities, including restricted securities, for which quotations are readily available, are valued by independent pricing services or by dealers who make markets in such securities. Pricing services consider yield or price of bonds of comparable quality, coupon, maturity and type as well as dealer supplied prices. Investments in open-end mutual funds, including the Fidelity Central Funds, are valued at their closing net asset value each business day. Short-term securities with remaining maturities of sixty days or less for which quotations are not readily available are valued at amortized cost, which approximates value.
Annual Report
Notes to Financial Statements - continued
(Amounts in thousands except ratios)
1. Significant Accounting Policies - continued
Security Valuation - continued
When current market prices or quotations are not readily available or do not accurately reflect fair value, valuations may be determined in accordance with procedures adopted by the Board of Trustees. For example, when developments occur between the close of a market and the close of the NYSE that may materially affect the value of some or all of the securities, or when trading in a security is halted, those securities may be fair valued. Factors used in the determination of fair value may include monitoring news to identify significant market or security specific events such as changes in the value of U.S. securities markets, reviewing developments in foreign markets and evaluating the performance of ADRs, futures contracts and exchange-traded funds. Because the Fund's utilization of fair value pricing depends on market activity, the frequency with which fair value pricing is used can not be predicted and may be utilized to a significant extent. The value of securities used for NAV calculation under fair value pricing may differ from published prices for the same securities.
Foreign Currency. The Fund uses foreign currency contracts to facilitate transactions in foreign-denominated securities. Losses from these transactions may arise from changes in the value of the foreign currency or if the counterparties do not perform under the contracts' terms.
Foreign-denominated assets, including investment securities, and liabilities are translated into U.S. dollars at the exchange rate at period end. Purchases and sales of investment securities, income and dividends received and expenses denominated in foreign currencies are translated into U.S. dollars at the exchange rate in effect on the transaction date.
The effects of exchange rate fluctuations on investments are included with the net realized and unrealized gain (loss) on investment securities. Other foreign currency transactions resulting in realized and unrealized gain (loss) are disclosed separately.
Investment Transactions and Income. Security transactions, including the Fund's investment activity in the Fidelity Central Funds, are accounted for as of trade date. Gains and losses on securities sold are determined on the basis of identified cost. Dividend income is recorded on the ex-dividend date, except for certain dividends from foreign securities where the ex-dividend date may have passed, which are recorded as soon as the Fund is informed of the ex-dividend date. Non-cash dividends included in dividend income, if any, are recorded at the fair market value of the securities received. Interest income and distributions from the Fidelity Central Funds are accrued as earned. Interest income includes coupon interest and amortization of premium and accretion of discount on debt securities. Investment income is recorded net of foreign taxes withheld where recovery of such taxes is uncertain.
Annual Report
1. Significant Accounting Policies - continued
Expenses. Most expenses of the trust can be directly attributed to a fund. Expenses which cannot be directly attributed are apportioned among each Fund in the trust. Expense estimates are accrued in the period to which they relate and adjustments are made when actual amounts are known.
Income Tax Information and Distributions to Shareholders. Each year, the Fund intends to qualify as a regulated investment company by distributing all of its taxable income and realized gains under Subchapter M of the Internal Revenue Code. As a result, no provision for income taxes is required in the accompanying financial statements. Foreign taxes are provided for based on the Fund's understanding of the tax rules and rates that exist in the foreign markets in which it invests.
Distributions are recorded on the ex-dividend date. Income dividends and capital gain distributions are declared separately for each class. Income and capital gain distributions are determined in accordance with income tax regulations, which may differ from generally accepted accounting principles. In addition, the Fund will claim a portion of the payment made to redeeming shareholders as a distribution for income tax purposes.
Capital accounts within the financial statements are adjusted for permanent book-tax differences. These adjustments have no impact on net assets or the results of operations. Temporary book-tax differences will reverse in a subsequent period.
Book-tax differences are primarily due to foreign currency transactions, passive foreign investment companies (PFIC) and losses deferred due to wash sales.
The tax-basis components of distributable earnings and the federal tax cost as of period end were as follows:
Unrealized appreciation | $ 444,995 | |
Unrealized depreciation | (177,521) | |
Net unrealized appreciation (depreciation) | 267,474 | |
Undistributed ordinary income | 43,513 | |
Undistributed long-term capital gain | 310,524 | |
| | |
Cost for federal income tax purposes | $ 1,773,829 | |
The tax character of distributions paid was as follows:
| October 31, 2006 | October 31, 2005 |
Ordinary Income | $ 66,631 | $ 30,409 |
Long-term Capital Gains | 178,636 | 18,232 |
Total | $ 245,267 | $ 48,641 |
Annual Report
Notes to Financial Statements - continued
(Amounts in thousands except ratios)
1. Significant Accounting Policies - continued
Short-Term Trading (Redemption) Fees. Shares held in the Fund less than 90 days are subject to a redemption fee equal to 2.00% of the proceeds of the redeemed shares. All redemption fees, including any estimated redemption fees paid by FMR, are retained by the Fund and accounted for as an addition to paid in capital.
New Accounting Pronouncements. In July 2006, Financial Accounting Standards Board Interpretation No. 48, Accounting for Uncertainty in Income Taxes - an interpretation of FASB Statement 109 (FIN 48), was issued and is effective for fiscal years beginning after December 15, 2006. FIN 48 sets forth a threshold for financial statement recognition, measurement and disclosure of a tax position taken or expected to be taken on a tax return. Management is currently evaluating the impact, if any, the adoption of FIN 48 will have on the Fund's net assets, results of operations and financial statement disclosures.
In addition, in September 2006, Statement of Financial Accounting Standards No. 157, Fair Value Measurements (SFAS 157), was issued and is effective for fiscal years beginning after November 15, 2007. SFAS 157 defines fair value, establishes a framework for measuring fair value and expands disclosures about fair value measurements. Management is currently evaluating the impact the adoption of SFAS 157 will have on the Fund's financial statement disclosures.
2. Operating Policies.
Repurchase Agreements. FMR has received an Exemptive Order from the Securities and Exchange Commission (the SEC) which permits the Fund and other affiliated entities of FMR to transfer uninvested cash balances into joint trading accounts which are then invested in repurchase agreements. The Fund may also invest directly with institutions in repurchase agreements. Repurchase agreements are collateralized by government or non-government securities. Upon settlement date, collateral is held in segregated accounts with custodian banks and may be obtained in the event of a default of the counterparty. The Fund monitors, on a daily basis, the value of the collateral to ensure it is at least equal to the principal amount of the repurchase agreement (including accrued interest). In the event of a default by the counterparty, realization of the collateral proceeds could be delayed, during which time the value of the collateral may decline.
Restricted Securities. The Fund may invest in securities that are subject to legal or contractual restrictions on resale. These securities generally may be resold in transactions exempt from registration or to the public if the securities are registered. Disposal of these securities may involve time-consuming negotiations and expense, and prompt sale at an acceptable price may be difficult. Information regarding restricted securities is included at the end of the Fund's Schedule of Investments.
Annual Report
3. Purchases and Sales of Investments.
Purchases and sales of securities, other than short-term securities, aggregated $1,999,351 and $2,719,149, respectively.
4. Fees and Other Transactions with Affiliates.
Management Fee. FMR and its affiliates provide the Fund with investment management related services for which the Fund pays a monthly management fee. The management fee is the sum of an individual fund fee rate that is based on an annual rate of .60% of the Fund's average net assets and a group fee rate that averaged .27% during the period. The group fee rate is based upon the average net assets of all the mutual funds advised by FMR. The group fee rate decreases as assets under management increase and increases as assets under management decrease. In addition, the management fee is subject to a performance adjustment (up to a maximum of ± .20% of the Fund's average net assets over a 36 month performance period). The upward or downward adjustment to the management fee is based on the investment performance of the asset-weighted return of the retail class of the Fund, International Small Cap, as compared to an appropriate benchmark index. For the period, the total annual management fee rate, including the performance adjustment, was .97% of the Fund's average net assets.
Distribution and Service Plan. In accordance with Rule 12b-1 of the 1940 Act, the Fund has adopted separate Distribution and Service Plans for each class of shares. Certain classes pay Fidelity Distributors Corporation (FDC), an affiliate of FMR, separate Distribution and Service Fees, each of which is based on an annual percentage of each class' average net assets. In addition, FDC may pay financial intermediaries for selling shares of the Fund and providing shareholder support services. For the period, the Distribution and Service Fee rates and the total amounts paid to and retained by FDC were as follows:
| Distribution
Fee | Service
Fee | Paid to
FDC | Retained
by FDC |
Class A | 0% | .25% | $ 99 | $ 2 |
Class T | .25% | .25% | 240 | - |
Class B | .75% | .25% | 137 | 103 |
Class C | .75% | .25% | 276 | 41 |
| | | $ 752 | $ 146 |
Annual Report
Notes to Financial Statements - continued
(Amounts in thousands except ratios)
4. Fees and Other Transactions with Affiliates - continued
Sales Load. FDC receives a front-end sales charge of up to 5.75% for selling Class A shares, and 3.50% for selling Class T shares, some of which is paid to financial intermediaries for selling shares of the Fund. FDC receives the proceeds of contingent deferred sales charges levied on Class A, Class T, Class B, and Class C redemptions. These charges depend on the holding period. The deferred sales charges range from 5% to 1% for Class B, 1% for Class C, 1.00% to .50% for certain purchases of Class A shares (.25% prior to February 24, 2006) and .25% for certain purchases of Class T shares.
For the period, sales charge amounts retained by FDC were as follows:
| Retained
by FDC |
Class A | $ 8 |
Class T | 6 |
Class B* | 42 |
Class C* | 2 |
| $ 58 |
* When Class B and Class C shares are initially sold, FDC pays commissions from its own resources to financial intermediaries through which the sales are made.
Transfer Agent Fees. Fidelity Investments Institutional Operations Company, Inc. (FIIOC), an affiliate of FMR, is the transfer, dividend disbursing and shareholder servicing agent for each class of the Fund, except for International Small Cap. Fidelity Service Company, Inc. (FSC), an affiliate of FMR, is the transfer agent for International Small Cap shares. FIIOC and FSC receive account fees and asset-based fees that vary according to the account size and type of account of the shareholders of the respective classes of the Fund. FIIOC and FSC pay for typesetting, printing and mailing of shareholder reports, except proxy statements. For the period, the total transfer agent fees paid by each class to FIIOC or FSC, were as follows:
| Amount | % of
Average
Net Assets |
Class A | $ 124 | .31 |
Class T | 148 | .31 |
Class B | 55 | .40 |
Class C | 82 | .30 |
International Small Cap | 4,500 | .20 |
Institutional Class | 20 | .21 |
| $ 4,929 | |
Accounting and Security Lending Fees. FSC maintains the Fund's accounting records. The accounting fee is based on the level of average net assets for the month. Under a separate contract, FSC administers the security lending program. The security lending fee is based on the number and duration of lending transactions.
Annual Report
4. Fees and Other Transactions with Affiliates - continued
Investments in Fidelity Central Funds. The Fund may invest in Fidelity Central Funds. The Fund's Schedule of Investments lists each of the Fidelity Central Funds as an investment of the Fund but does not include the underlying holdings of each Fidelity Central Fund. As an Investing Fund, the Fund indirectly bears its proportionate share of the expenses of the underlying Fidelity Central Funds. A complete unaudited list of holdings for each Fidelity Central Fund is available upon request. In addition, the financial statements of the Fidelity Central Funds, which are not covered by the Fund's Report of Independent Registered Public Accounting Firm, are available on the EDGAR Database on the SEC's web site, www.sec.gov, or upon request.
The Money Market Central Funds seek preservation of capital and current income and are managed by Fidelity Investments Money Management, Inc. (FIMM), an affiliate of FMR.
Interfund Lending Program. Pursuant to an Exemptive Order issued by the SEC, the Fund, along with other registered investment companies having management contracts with FMR, may participate in an interfund lending program. This program provides an alternative credit facility allowing the Funds to borrow from, or lend money to, other participating affiliated funds. At period end, there were no interfund loans outstanding. The Fund's activity in this program during the period for which loans were outstanding was as follows:
Borrower or Lender | Average Daily
Loan Balance | Weighted Average
Interest Rate | Interest
Expense |
Borrower | $ 23,977 | 5.14% | $ 38 |
5. Committed Line of Credit.
The Fund participates with other funds managed by FMR in a $4.2 billion credit facility (the "line of credit") to be utilized for temporary or emergency purposes to fund shareholder redemptions or for other short-term liquidity purposes. The Fund has agreed to pay commitment fees on its pro rata portion of the line of credit, which amounts to $7 and is reflected in Miscellaneous Expense on the Statement of Operations. During the period, there were no borrowings on this line of credit.
6. Security Lending.
The Fund lends portfolio securities from time to time in order to earn additional income. On the settlement date of the loan, the Fund receives collateral (in the form of U.S. Treasury obligations, letters of credit and/or cash) against the loaned securities and maintains collateral in an amount not less than 100% of the market value of the loaned securities during the period of the loan. The market value of the loaned securities is determined at the close of business of the Fund and any additional required collateral is delivered to the Fund on the next business day. If the borrower defaults on its obligation to
Annual Report
Notes to Financial Statements - continued
(Amounts in thousands except ratios)
6. Security Lending - continued
return the securities loaned because of insolvency or other reasons, a fund could experience delays and costs in recovering the securities loaned or in gaining access to the collateral. Any cash collateral received is invested in the Fidelity Securities Lending Cash Central Fund. The value of loaned securities and cash collateral at period end are disclosed on the Fund's Statement of Assets and Liabilities. Security lending income represents the income earned on investing cash collateral, less fees and expenses associated with the loan, plus any premium payments that may be received on the loan of certain types of securities. Security lending income is presented in the Statement of Operations as a component of income from Fidelity Central Funds.
7. Expense Reductions.
FMR voluntarily agreed to reimburse each class to the extent annual operating expenses exceeded certain levels of average net assets as noted in the table below. Some expenses, for example interest expense, including commitment fees, are excluded from this reimbursement.
The following classes were in reimbursement during the period:
| Expense
Limitations | Reimbursement
from adviser |
Class B | 2.40% | $ 10 |
Many of the brokers with whom FMR places trades on behalf of the Fund provided services to the Fund in addition to trade execution. These services included payments of certain expenses on behalf of the Fund totaling $1,455 for the period. During the period, credits reduced each class' transfer agent expense as noted in the table below.
| Transfer Agent
expense reduction |
International Small Cap | $ 22 |
8. Other.
The Fund's organizational documents provide former and current trustees and officers with a limited indemnification against liabilities arising in connection with the performance of their duties to the Fund. In the normal course of business, the Fund may also enter into contracts that provide general indemnifications. The Fund's maximum exposure under these arrangements is unknown as this would be dependent on future claims that may be made against the Fund. The risk of material loss from such claims is considered remote.
During the period, the Fund's transfer agent, Fidelity Investments Institutional Operations Company, Inc. (FIIOC), an affiliate of Fidelity Management & Research Company, notified
Annual Report
8. Other - continued
the Fund that the fund's books and records did not reflect a conversion of certain Class B to Class A shares upon their conversion date. Management has determined that this did not have a material impact to the Fund's reported net assets or results of operations in the accompanying financial statements. FIIOC will cause the books and records of the Fund to reflect a conversion of the relevant Class B shares to Class A and is in the process of determining the impact to affected shareholder accounts for purposes of its remediation.
The United States Securities and Exchange Commission ("SEC") is conducting an investigation of FMR (covering the years 2002 to 2004) arising from gifts, gratuities and business entertainment provided by certain brokers to certain individuals who were employed on FMR's domestic equity trading desk during that period. FMR is in discussions with the SEC staff regarding the possible resolution of the matter, but as of period-end no final resolution has been reached.
In December 2006, the Independent Trustees completed their own investigation of the matter with the assistance of independent counsel. The Independent Trustees and FMR agree that, despite the absence of proof that the Fidelity mutual funds experienced diminished execution quality as a result of the improper receipt of gifts and business entertainment, the conduct at issue was serious and is worthy of redress. Accordingly, the Independent Trustees have requested and FMR has agreed to pay $42 million to Fidelity mutual funds, plus interest to be determined at the time that payment is made. A method of allocating this payment among the funds has not yet been determined. In addition, FMR has agreed to reimburse related legal expenses. The total payment to the Fund is not anticipated to have a material impact on the Fund's net assets.
9. Distributions to Shareholders.
Distributions to shareholders of each class were as follows:
Years ended October 31, | 2006 | 2005 |
From net investment income | | |
Class A | $ 62 | $ 14 |
International Small Cap | 10,726 | 3,381 |
Institutional Class | 41 | 11 |
Total | $ 10,829 | $ 3,406 |
From net realized gain | | |
Class A | $ 3,713 | $ 542 |
Class T | 4,531 | 602 |
Class B | 1,339 | 221 |
Class C | 2,560 | 359 |
International Small Cap | 221,459 | 43,388 |
Institutional Class | 836 | 123 |
Total | $ 234,438 | $ 45,235 |
Annual Report
Notes to Financial Statements - continued
(Amounts in thousands except ratios)
10. Share Transactions.
Transactions for each class of shares were as follows:
| Shares | Dollars |
Years ended | 2006 | 2005 | 2006 | 2005 |
Class A | | | | |
Shares sold | 335 | 915 | $ 9,788 | $ 22,252 |
Reinvestment of distributions | 125 | 20 | 3,194 | 427 |
Shares redeemed | (490) | (255) | (14,008) | (6,421) |
Net increase (decrease) | (30) | 680 | $ (1,026) | $ 16,258 |
| | | | |
Class T | | | | |
Shares sold | 413 | 1,286 | $ 11,877 | $ 31,179 |
Reinvestment of distributions | 165 | 24 | 4,209 | 531 |
Shares redeemed | (679) | (457) | (19,325) | (11,453) |
Net increase (decrease) | (101) | 853 | $ (3,239) | $ 20,257 |
| | | | |
Class B | | | | |
Shares sold | 69 | 415 | $ 1,926 | $ 9,882 |
Reinvestment of distributions | 48 | 9 | 1,211 | 199 |
Shares redeemed | (202) | (178) | (5,665) | (4,336) |
Net increase (decrease) | (85) | 246 | $ (2,528) | $ 5,745 |
| | | | |
Class C | | | | |
Shares sold | 146 | 680 | $ 4,106 | $ 16,301 |
Reinvestment of distributions | 80 | 13 | 2,033 | 272 |
Shares redeemed | (431) | (147) | (11,929) | (3,591) |
Net increase (decrease) | (205) | 546 | $ (5,790) | $ 12,982 |
| | | | |
International Small Cap | | | | |
Shares sold | 17,580 | 51,579 | $ 512,574 | $ 1,266,283 |
Reinvestment of distributions | 8,379 | 2,008 | 216,010 | 43,867 |
Shares redeemed | (41,151) | (26,924) | (1,173,251) | (667,826) |
Net increase (decrease) | (15,192) | 26,663 | $ (444,667) | $ 642,324 |
| | | | |
Institutional Class | | | | |
Shares sold | 124 | 259 | $ 3,656 | $ 6,323 |
Reinvestment of distributions | 20 | 3 | 506 | 59 |
Shares redeemed | (109) | (105) | (3,132) | (2,545) |
Net increase (decrease) | 35 | 157 | $ 1,030 | $ 3,837 |
Annual Report
Report of Independent Registered Public Accounting Firm
To the Trustees of Fidelity Investment Trust and Shareholders of Fidelity International Small Cap Fund:
We have audited the accompanying statement of assets and liabilities of Fidelity International Small Cap Fund (the Fund), a fund of Fidelity Investment Trust, including the schedule of investments, as of October 31, 2006, and the related statement of operations for the year then ended, the statement of changes in net assets for each of the two years in the period then ended, and the financial highlights for each of the five years in the period then ended. These financial statements and financial highlights are the responsibility of the Fund's management. Our responsibility is to express an opinion on these financial statements and financial highlights based on our audits.
We conducted our audits in accordance with standards of the Public Company Accounting Oversight Board (United States). Those standards require that we plan and perform the audit to obtain reasonable assurance about whether the financial statements and financial highlights are free of material misstatement. The Fund is not required to have, nor were we engaged to perform, an audit of its internal control over financial reporting. Our audits included consideration of internal control over financial reporting as a basis for designing audit procedures that are appropriate in the circumstances, but not for the purpose of expressing an opinion on the effectiveness of the Fund's internal control over financial reporting. Accordingly, we express no such opinion. An audit also includes examining, on a test basis, evidence supporting the amounts and disclosures in the financial statements, assessing the accounting principles used and significant estimates made by management, as well as evaluating the overall financial statement presentation. Our procedures included confirmation of securities owned as of October 31, 2006, by correspondence with the custodians and brokers; where replies were not received from brokers, we performed other auditing procedures. We believe that our audits provide a reasonable basis for our opinion.
In our opinion, the financial statements and financial highlights referred to above present fairly, in all material respects, the financial position of Fidelity International Small Cap Fund as of October 31, 2006, the results of its operations for the year then ended, the changes in its net assets for each of the two years in the period then ended, and its financial highlights for each of the five years in the period then ended, in conformity with accounting principles generally accepted in the United States of America.
/s/DELOITTE & TOUCHE LLP
DELOITTE & TOUCHE LLP
Boston, Massachusetts
December 22, 2006
Annual Report
Trustees and Officers
The Trustees, Members of the Advisory Board, and executive officers of the trust and fund, as applicable, are listed below. The Board of Trustees governs the fund and is responsible for protecting the interests of shareholders. The Trustees are experienced executives who meet periodically throughout the year to oversee the fund's activities, review contractual arrangements with companies that provide services to the fund, and review the fund's performance. Except for William O. McCoy, each of the Trustees oversees 347 funds advised by FMR or an affiliate. Mr. McCoy oversees 349 funds advised by FMR or an affiliate.
The Trustees hold office without limit in time except that (a) any Trustee may resign; (b) any Trustee may be removed by written instrument, signed by at least two-thirds of the number of Trustees prior to such removal; (c) any Trustee who requests to be retired or who has become incapacitated by illness or injury may be retired by written instrument signed by a majority of the other Trustees; and (d) any Trustee may be removed at any special meeting of shareholders by a two-thirds vote of the outstanding voting securities of the trust. Each Trustee who is not an interested person (as defined in the 1940 Act) (Independent Trustee), shall retire not later than the last day of the calendar year in which his or her 72nd birthday occurs. The Independent Trustees may waive this mandatory retirement age policy with respect to individual Trustees. The executive officers and Advisory Board Members hold office without limit in time, except that any officer and Advisory Board Member may resign or may be removed by a vote of a majority of the Trustees at any regular meeting or any special meeting of the Trustees. Except as indicated, each individual has held the office shown or other offices in the same company for the past five years.
The fund's Statement of Additional Information (SAI) includes more information about the Trustees. To request a free copy, call Fidelity at 1-877-208-0098.
Interested Trustees*: Correspondence intended for each Trustee who is an interested person may be sent to Fidelity Investments, 82 Devonshire Street, Boston, Massachusetts 02109.
Name, Age; Principal Occupation |
Edward C. Johnson 3d (76) |
| Year of Election or Appointment: 1984
Mr. Johnson is Chairman of the Board of Trustees. Mr. Johnson serves as President (2006-present), Chief Executive Officer, Chairman, and a Director of FMR Corp.; Chairman and a Director of FMR; Chairman and a Director of Fidelity Research & Analysis Company (FRAC); Chairman and a Director of Fidelity Investments Money Management, Inc.; and Chairman (2001-present) and a Director of FMR Co., Inc. In addition, Mr. Johnson serves as Chairman and Director of Fidelity International Limited (FIL). |
Stephen P. Jonas (53) |
| Year of Election or Appointment: 2005
Mr. Jonas is Senior Vice President of the fund (2005-present). He also serves as Senior Vice President of other Fidelity funds (2005-present). Mr. Jonas is Executive Director of FMR (2005-present) and FMR Co., Inc. (2005-present). He also serves as a Director of Fidelity Investments Money Management, Inc. (2005-present) and FMR Corp. (2003-present). Previously, Mr. Jonas served as President of Fidelity Enterprise Operations and Risk Services (2004-2005), Chief Administrative Officer (2002-2004), and Chief Financial Officer of FMR Corp. (1998-2002). In addition, he serves on the Boards of Boston Ballet (2003-present) and Simmons College (2003-present). |
Robert L. Reynolds (54) |
| Year of Election or Appointment: 2003
Mr. Reynolds is President and a Director of FMR (2005-present), Fidelity Investments Money Management, Inc. (2005-present), and FMR Co., Inc. (2005-present). Mr. Reynolds also serves as Vice Chairman (2006-present), a Director (2003-present), and Chief Operating Officer of FMR Corp. and a Director of Strategic Advisers, Inc. (2005-present). He also serves on the Board at Fidelity Investments Canada, Ltd. |
* Trustees have been determined to be "Interested Trustees" by virtue of, among other things, their affiliation with the trust or various entities under common control with FMR.
Annual Report
Independent Trustees:
Correspondence intended for each Independent Trustee (that is, the Trustees other than the Interested Trustees) may be sent to Fidelity Investments, P.O. Box 55235, Boston, Massachusetts 02205-5235.
Name, Age; Principal Occupation |
Dennis J. Dirks (58) |
| Year of Election or Appointment: 2005 Prior to his retirement in May 2003, Mr. Dirks was Chief Operating Officer and a member of the Board of The Depository Trust & Clearing Corporation (DTCC) (1999-2003). He also served as President, Chief Operating Officer, and Board member of The Depository Trust Company (DTC) (1999-2003) and President and Board member of the National Securities Clearing Corporation (NSCC) (1999-2003). In addition, Mr. Dirks served as Chief Executive Officer and Board member of the Government Securities Clearing Corporation (2001-2003) and Chief Executive Officer and Board member of the Mortgage-Backed Securities Clearing Corporation (2001-2003). Mr. Dirks also serves as a Trustee and a member of the Finance Committee of Manhattan College (2005-present) and a Trustee and a member of the Finance Committee of AHRC of Nassau County (2006-present). |
Albert R. Gamper, Jr. (64) |
| Year of Election or Appointment: 2006 Prior to his retirement in December 2004, Mr. Gamper served as Chairman of the Board of CIT Group Inc. (commercial finance). During his tenure with CIT Group Inc. Mr. Gamper served in numerous senior management positions, including Chairman (1987-1989; 1999-2001; 2002-2004), Chief Executive Officer (1987-2004), and President (1989-2002). He currently serves as a member of the Board of Directors of Public Service Enterprise Group (utilities, 2001-present), Chairman of the Board of Governors, Rutgers University (2004-present), and Chairman of the Board of Saint Barnabas Health Care System. |
George H. Heilmeier (70) |
| Year of Election or Appointment: 2004
Dr. Heilmeier is Chairman Emeritus of Telcordia Technologies (communication software and systems), where prior to his retirement, he served as company Chairman and Chief Executive Officer. He currently serves on the Boards of Directors of The Mitre Corporation (systems engineering and information technology support for the government), and HRL Laboratories (private research and development, 2004-present). He is Chairman of the General Motors Science & Technology Advisory Board and a Life Fellow of the Institute of Electrical and Electronics Engineers (IEEE). Dr. Heilmeier is a member of the Defense Science Board and the National Security Agency Advisory Board. He is also a member of the National Academy of Engineering, the American Academy of Arts and Sciences, and the Board of Overseers of the School of Engineering and Applied Science of the University of Pennsylvania. Previously, Dr. Heilmeier served as a Director of TRW Inc. (automotive, space, defense, and information technology, 1992-2002), Compaq (1994-2002), Automatic Data Processing, Inc. (ADP) (technology-based business outsourcing, 1995-2002), INET Technologies Inc. (telecommunications network surveillance, 2001-2004), and Teletech Holdings (customer management services). He is the recipient of the 2005 Kyoto Prize in Advanced Technology for his invention of the liquid crystal display, and a member of the Consumer Electronics Hall of Fame. |
Marie L. Knowles (60) |
| Year of Election or Appointment: 2001
Prior to Ms. Knowles' retirement in June 2000, she served as Executive Vice President and Chief Financial Officer of Atlantic Richfield Company (ARCO) (diversified energy, 1996-2000). From 1993 to 1996, she was a Senior Vice President of ARCO and President of ARCO Transportation Company. She served as a Director of ARCO from 1996 to 1998. She currently serves as a Director of Phelps Dodge Corporation (copper mining and manufacturing) and McKesson Corporation (healthcare service, 2002-present). Ms. Knowles is a Trustee of the Brookings Institution and the Catalina Island Conservancy and also serves as a member of the Advisory Board for the School of Engineering of the University of Southern California. |
Ned C. Lautenbach (62) |
| Year of Election or Appointment: 2000
Mr. Lautenbach is Chairman of the Independent Trustees (2006-present). Mr. Lautenbach has been a partner of Clayton, Dubilier & Rice, Inc. (private equity investment firm) since September 1998. Previously, Mr. Lautenbach was with the International Business Machines Corporation (IBM) from 1968 until his retirement in 1998. Mr. Lautenbach serves as a Director of Sony Corporation (2006- present) and Eaton Corporation (diversified industrial) as well as the Philharmonic Center for the Arts in Naples, Florida. He also is a member of the Board of Trustees of Fairfield University (2005-present), as well as a member of the Council on Foreign Relations. |
William O. McCoy (73) |
| Year of Election or Appointment: 1997
Prior to his retirement in December 1994, Mr. McCoy was Vice Chairman of the Board of BellSouth Corporation (telecommunications) and President of BellSouth Enterprises. He is currently a Director of Duke Realty Corporation (real estate). He is also a partner of Franklin Street Partners (private investment management firm). In addition, Mr. McCoy served as the Interim Chancellor (1999-2000) and a member of the Board of Visitors for the University of North Carolina at Chapel Hill and currently serves as Chairman of the Board of Directors of the University of North Carolina Health Care System. He also served as Vice President of Finance for the University of North Carolina (16-school system). |
Cornelia M. Small (62) |
| Year of Election or Appointment: 2005
Ms. Small is a member (2000-present) and Chairperson (2002-present) of the Investment Committee, and a member (2002-present) of the Board of Trustees of Smith College. Previously, she served as Chief Investment Officer (1999-2000), Director of Global Equity Investments (1996-1999), and a member of the Board of Directors of Scudder, Stevens & Clark (1990-1997) and Scudder Kemper Investments (1997-1999). In addition, Ms. Small served as Co-Chair (2000-2003) of the Annual Fund for the Fletcher School of Law and Diplomacy. |
William S. Stavropoulos (67) |
| Year of Election or Appointment: 2001
Mr. Stavropoulos is Chairman Emeritus of the Board of Directors of The Dow Chemical Company. Since joining The Dow Chemical Company in 1967, Mr. Stavropoulos served in numerous senior management positions, including President (1993-2000; 2002-2003), CEO (1995-2000; 2002-2004), and Chairman of the Executive Committee (2000-2004). Currently, he is a Director of NCR Corporation (data warehousing and technology solutions), BellSouth Corporation (telecommunications), Chemical Financial Corporation, Maersk Inc. (industrial conglomerate, 2002-present), and Metalmark Capital (private equity investment firm, 2005-present). He also serves as a member of the Board of Trustees of the American Enterprise Institute for Public Policy Research. In addition, Mr. Stavropoulos is a member of The Business Council, J.P. Morgan International Council and the University of Notre Dame Advisory Council for the College of Science. |
Kenneth L. Wolfe (67) |
| Year of Election or Appointment: 2005
Prior to his retirement in 2001, Mr. Wolfe was Chairman and Chief Executive Officer of Hershey Foods Corporation (1993-2001). He currently serves as a member of the boards of Adelphia Communications Corporation (2003-present), Bausch & Lomb, Inc., and Revlon Inc. (2004-present). |
Annual Report
Advisory Board Members and Executive Officers:
Correspondence intended for Mr. Keyes may be sent to Fidelity Investments, P.O. Box 55235, Boston, Massachusetts 02205-5235. Correspondence intended for each executive officer and Mr. Lynch may be sent to Fidelity Investments, 82 Devonshire Street, Boston, Massachusetts 02109.
Name, Age; Principal Occupation |
James H. Keyes (66) |
| Year of Election or Appointment: 2006
Member of the Advisory Board of Fidelity Investment Trust. Prior to his retirement in 2003, Mr. Keyes was Chairman, President, and Chief Executive Officer of Johnson Controls, Inc. (automotive supplier, 1993-2003). He currently serves as a member of the boards of LSI Logic Corporation (semiconductor technologies), Navistar International Corporation (manufacture and sale of trucks, buses, and diesel engines, 2002-present), and Pitney Bowes, Inc. (integrated mail, messaging, and document management solutions). |
Peter S. Lynch (62) |
| Year of Election or Appointment: 2003
Member of the Advisory Board of Fidelity Investment Trust. Mr. Lynch is Vice Chairman and a Director of FMR, and Vice Chairman (2001- present) and a Director of FMR Co., Inc. Previously, Mr. Lynch served as a Trustee of the Fidelity funds (1990-2003). In addition, he serves as a Trustee of Boston College and as the Chairman of the Inner-City Scholarship Fund. |
Dwight D. Churchill (52) |
| Year of Election or Appointment: 2005
Vice President of the fund. Mr. Churchill also serves as Vice President of certain Equity Funds (2005-present). Mr. Churchill is Executive Vice President of FMR (2005-present) and FMR Co., Inc. (2005-present). Previously, Mr. Churchill served as Senior Vice President of Fidelity Investments Money Management, Inc. (2005-2006), Head of Fidelity's Fixed-Income Division (2000-2005), Vice President of Fidelity's Money Market Funds (2000-2005), Vice President of Fidelity's Bond Funds, and Senior Vice President of FMR. |
Eric M. Wetlaufer (44) |
| Year of Election or Appointment: 2006
Vice President of the fund. Mr. Wetlaufer also serves as Vice President of certain International Equity Funds (2006-present). Mr. Wetlaufer is Senior Vice President of FMR (2006-present) and FMR Co., Inc. (2006-present), and President and Director of Fidelity Management & Research (U.K.) Inc. (2006-present) and Fidelity Research & Analysis Company (2006-present). Before joining Fidelity Investments in 2005, Mr. Wetlaufer was a partner in Oxhead Capital Management (2004-2005). Previously, Mr. Wetlaufer served as a Chief Investment Officer of Putnam Investments (1997-2003). |
Ben Paton (45) |
| Year of Election or Appointment: 2004 Vice President of International Small Cap. Mr. Paton serves as Vice President of another fund advised by FMR. Prior to his current responsibilities, Mr. Paton worked as a research analyst and manager. |
Tokuya Sano (35) |
| Year of Election or Appointment: 2002 Vice President of International Small Cap. Mr. Sano serves as Vice President of another fund advised by FMR. Prior to his current responsibilities, Mr. Sano worked as a research analyst and manager. |
Wilson Wong (33) |
| Year of Election or Appointment: 2005 Vice President of International Small Cap. Mr. Wong serves as Vice President of another fund advised by FMR. Prior to his current responsibilities, Mr. Wong worked as a research analyst and manager. |
Eric D. Roiter (57) |
| Year of Election or Appointment: 2002 Secretary of the fund. He also serves as Secretary of other Fidelity funds; Vice President, General Counsel, and Secretary of FMR Co., Inc. (2001-present) and FMR; Assistant Secretary of Fidelity Management & Research (U.K.) Inc. (2001-present), Fidelity Research & Analysis Company (2001-present), and Fidelity Investments Money Management, Inc. (2001-present). Mr. Roiter is an Adjunct Member, Faculty of Law, at Boston College Law School (2003-present). Previously, Mr. Roiter served as Vice President and Secretary of Fidelity Distributors Corporation (FDC)(1998-2005). |
Stuart Fross (47) |
| Year of Election or Appointment: 2003 Assistant Secretary of the fund. Mr. Fross also serves as Assistant Secretary of other Fidelity funds (2003-present), Vice President and Secretary of FDC (2005-present), and is an employee of FMR. |
Christine Reynolds (48) |
| Year of Election or Appointment: 2004 President and Treasurer of the fund. Ms. Reynolds also serves as President and Treasurer of other Fidelity funds (2004-present) and is a Vice President (2003-present) and an employee (2002-present) of FMR. Before joining Fidelity Investments, Ms. Reynolds worked at PricewaterhouseCoopers LLP (PwC) (1980-2002), where she was most recently an audit partner with PwC's investment management practice. |
R. Stephen Ganis (40) |
| Year of Election or Appointment: 2006
Anti-Money Laundering (AML) officer of the fund. Mr. Ganis also serves as AML officer of other Fidelity funds (2006-present) and FMR Corp. (2003-present). Before joining Fidelity Investments, Mr. Ganis practiced law at Goodwin Procter, LLP (2000-2002). |
Joseph B. Hollis (58) |
| Year of Election or Appointment: 2006
Chief Financial Officer of the fund. Mr. Hollis also serves as Chief Financial Officer of other Fidelity funds. Mr. Hollis is President of Fidelity Pricing and Cash Management Services (FPCMS) (2005-present). Mr. Hollis also serves as President and Director of Fidelity Service Company, Inc. (2006-present). Previously, Mr. Hollis served as Senior Vice President of Cash Management Services (1999-2002) and Investment Management Operations (2002-2005). |
Kenneth A. Rathgeber (59) |
| Year of Election or Appointment: 2004
Chief Compliance Officer of the fund. Mr. Rathgeber also serves as Chief Compliance Officer of other Fidelity funds (2004-present) and Executive Vice President of Risk Oversight for Fidelity Investments (2002-present). He is Chief Compliance Officer of FMR (2005-present), FMR Co., Inc. (2005-present), Fidelity Management & Research (U.K.) Inc. (2005-present), Fidelity Research & Analysis Company (2005- present), Fidelity Investments Money Management, Inc. (2005-present), and Strategic Advisers, Inc. (2005-present). Previously, Mr. Rathgeber served as Executive Vice President and Chief Operating Officer for Fidelity Investments Institutional Services Company, Inc. (1998-2002). |
Name, Age; Principal Occupation |
Bryan A. Mehrmann (45) |
| Year of Election or Appointment: 2005
Deputy Treasurer of the fund. Mr. Mehrmann also serves as Deputy Treasurer of other Fidelity funds (2005-present) and is an employee of FMR. Previously, Mr. Mehrmann served as Vice President of Fidelity Investments Institutional Services Group (FIIS)/Fidelity Investments Institutional Operations Corporation, Inc. (FIIOC) Client Services (1998-2004). |
Kimberley H. Monasterio (42) |
| Year of Election or Appointment: 2004
Deputy Treasurer of the fund. Ms. Monasterio also serves as Deputy Treasurer of other Fidelity funds (2004) and is an employee of FMR (2004). Before joining Fidelity Investments, Ms. Monasterio served as Treasurer (2000-2004) and Chief Financial Officer (2002-2004) of the Franklin Templeton Funds and Senior Vice President of Franklin Templeton Services, LLC (2000-2004). |
Kenneth B. Robins (37) |
| Year of Election or Appointment: 2005
Deputy Treasurer of the fund. Mr. Robins also serves as Deputy Treasurer of other Fidelity funds (2005-present) and is an employee of FMR (2004-present). Before joining Fidelity Investments, Mr. Robins worked at KPMG LLP, where he was a partner in KPMG's department of professional practice (2002-2004) and a Senior Manager (1999-2000). In addition, Mr. Robins served as Assistant Chief Accountant, United States Securities and Exchange Commission (2000-2002). |
Robert G. Byrnes (39) |
| Year of Election or Appointment: 2005 Assistant Treasurer of the fund. Mr. Byrnes also serves as Assistant Treasurer of other Fidelity funds (2005-present) and is an employee of FMR (2005-present). Previously, Mr. Byrnes served as Vice President of FPCMS (2003-2005). Before joining Fidelity Investments, Mr. Byrnes worked at Deutsche Asset Management where he served as Vice President of the Investment Operations Group (2000-2003). |
John H. Costello (60) |
| Year of Election or Appointment: 2002
Assistant Treasurer of the fund. Mr. Costello also serves as Assistant Treasurer of other Fidelity funds and is an employee of FMR. |
Peter L. Lydecker (52) |
| Year of Election or Appointment: 2004
Assistant Treasurer of the fund. Mr. Lydecker also serves as Assistant Treasurer of other Fidelity funds (2004) and is an employee of FMR. |
Mark Osterheld (51) |
| Year of Election or Appointment: 2004
Assistant Treasurer of the fund. Mr. Osterheld also serves as Assistant Treasurer of other Fidelity funds (2002) and is an employee of FMR. |
Gary W. Ryan (48) |
| Year of Election or Appointment: 2005
Assistant Treasurer of the fund. Mr. Ryan also serves as Assistant Treasurer of other Fidelity funds (2005-present) and is an employee of FMR (2005-present). Previously, Mr. Ryan served as Vice President of Fund Reporting in FPCMS (1999-2005). |
Salvatore Schiavone (40) |
| Year of Election or Appointment: 2005
Assistant Treasurer of the fund. Mr. Schiavone also serves as Assistant Treasurer of other Fidelity funds (2005-present) and is an employee of FMR (2005-present). Before joining Fidelity Investments, Mr. Schiavone worked at Deutsche Asset Management, where he most recently served as Assistant Treasurer (2003-2005) of the Scudder Funds and Vice President and Head of Fund Reporting (1996-2003). |
Annual Report
Distributions
The Board of Trustees of Advisor International Small Cap Fund voted to pay on December 11, 2006, to shareholders of record at the opening of business on December 8, 2006, a distribution of $.073 per share derived from capital gains realized from sales of portfolio securities and a dividend of $5.675 per share from net investment income.
The fund hereby designates as a capital gain dividend with respect to the taxable year ended October 31, 2006, $310,524,390, or, if subsequently determined to be different, the net capital gain of such year.
The amounts per share which represent income derived from sources within, and taxes paid to, foreign countries or possessions of the United States are $.211 and $.0288 for the dividend paid December 12, 2005.
The fund will notify shareholders in January 2007 of amounts for use in preparing 2006 income tax returns.
Annual Report
Board Approval of Investment Advisory Contracts and Management Fees
Fidelity International Small Cap Fund
Each year, typically in July, the Board of Trustees, including the Independent Trustees (together, the Board), votes on the renewal of the management contract and sub-advisory agreements (together, the Advisory Contracts) for the fund. The Board, assisted by the advice of fund counsel and Independent Trustees' counsel, requests and considers a broad range of information throughout the year.
The Board meets regularly each month except August and takes into account throughout the year matters bearing on Advisory Contracts. The Board, acting directly and through its separate committees, considers at each of its meetings factors that are relevant to the annual renewal of the fund's Advisory Contracts, including the services and support provided to the fund and its shareholders. At the time of the renewal, the Board had 12 standing committees, each composed of Independent Trustees with varying backgrounds, to which the Board has assigned specific subject matter responsibilities in order to enhance effective decision-making by the Board. Each committee has adopted a written charter outlining the structure and purposes of the committee. One such committee, the Equity Contract Committee, meets periodically as needed throughout the year to consider matters specifically related to the annual renewal of Advisory Contracts. The committee requests and receives information on, and makes recommendations to the Independent Trustees concerning, the approval and annual review of the Advisory Contracts.
At its July 2006 meeting, the Board of Trustees, including the Independent Trustees, unanimously determined to renew the Advisory Contracts for the fund. In reaching its determination, the Board considered all factors it believed relevant, including (i) the nature, extent, and quality of the services to be provided to the fund and its shareholders (including the investment performance of the fund); (ii) the competitiveness of the management fee and total expenses of the fund; (iii) the total costs of the services to be provided by and the profits to be realized by the investment adviser and its affiliates from the relationship with the fund; (iv) the extent to which economies of scale would be realized as the fund grows; and (v) whether fee levels reflect these economies of scale, if any, for the benefit of fund shareholders.
In determining whether to renew the Advisory Contracts for the fund, the Board ultimately reached a determination, with the assistance of fund counsel and Independent Trustees' counsel, that the renewal of the Advisory Contracts and the compensation to be received by Fidelity under the management contract is consistent with Fidelity's fiduciary duty under applicable law. In addition to evaluating the specific factors noted above, the Board, in reaching its determination, is aware that shareholders in the fund have a broad range of investment choices available to them, including a wide choice among mutual funds offered by competitors to Fidelity, and that the fund's shareholders, with the opportunity to review and weigh the disclosure provided by the fund in its prospectus and other public disclosures, have chosen to invest in this fund, managed by Fidelity.
Annual Report
Board Approval of Investment Advisory Contracts and
Management Fees - continued
Nature, Extent, and Quality of Services Provided. The Board considered staffing within the investment adviser, FMR, and the sub-advisers (together, the Investment Advisers), including the backgrounds of the fund's portfolio managers and the fund's investment objective and discipline. The Independent Trustees also had discussions with senior management of Fidelity's investment operations and investment groups. The Board considered the structure of the portfolio manager compensation program and whether this structure provides appropriate incentives.
Resources Dedicated to Investment Management and Support Services. The Board reviewed the size, education, and experience of the Investment Advisers' investment staff, their use of technology, and the Investment Advisers' approach to recruiting, training, and retaining portfolio managers and other research, advisory, and management personnel. The Board considered Fidelity's extensive global research capabilities that enable the Investment Advisers to aggregate data from various sources in an effort to produce positive investment results. The Board noted that Fidelity's analysts have access to a variety of technological tools that enable them to perform both fundamental and quantitative analysis and to specialize in various disciplines. The Board also considered that Fidelity's portfolio managers and analysts have access to daily portfolio attribution that allows for monitoring of a fund's portfolio, as well as an electronic communication system that provides immediate real-time access to research concerning issuers and credit enhancers.
Shareholder and Administrative Services. The Board considered (i) the nature, extent, quality, and cost of administrative, distribution, and shareholder services performed by the Investment Advisers and their affiliates under the Advisory Contracts and under separate agreements covering transfer agency, pricing and bookkeeping, and securities lending services for the fund; (ii) the nature and extent of the Investment Advisers' supervision of third party service providers, principally custodians and subcustodians; and (iii) the resources devoted to, and the record of compliance with, the fund's compliance policies and procedures. The Board reviewed the allocation of fund brokerage, including allocations to brokers affiliated with the Investment Advisers, the use of brokerage commissions to pay fund expenses, and the use of "soft" commission dollars to pay for research services. The Board also considered that Fidelity voluntarily pays for market data out of its own resources.
The Board noted that the growth of fund assets across the complex allows Fidelity to reinvest in the development of services designed to enhance the value or convenience of the Fidelity funds as investment vehicles. These services include 24-hour access to account information and market information through phone representatives and over the Internet, and investor education materials and asset allocation tools.
Annual Report
Investment in a Large Fund Family. The Board considered the benefits to shareholders of investing in a Fidelity fund, including the benefits of investing in a fund that is part of a large family of funds offering a variety of investment disciplines and providing for a large variety of mutual fund investor services. For example, fund shareholders are offered the privilege of exchanging shares of the fund for shares of other Fidelity funds, as set forth in the fund's prospectus, without paying an additional sales charge. The Board noted that, since the last Advisory Contract renewals in July 2005, Fidelity has taken a number of actions that benefited particular funds, including (i) dedicating additional resources to investment research and to restructure the investment research teams; (ii) voluntarily entering into contractual arrangements with certain brokers pursuant to which Fidelity pays for research products and services separately out of its own resources, rather than bundling with fund commissions; (iii) launching the Fidelity Advantage Class of its five Spartan stock index funds and three Spartan bond index funds, which is a lower-fee class available to shareholders with higher account balances; (iv) contractually agreeing to impose expense limitations on Fidelity U.S. Bond Index Fund and reducing the fund's initial investment minimum; and (v) offering shareholders of each of the Fidelity Institutional Money Market Funds the privilege of exchanging shares of the fund for shares of other Fidelity funds.
Investment Performance and Compliance. The Board considered whether the fund has operated within its investment objective, as well as its record of compliance with its investment restrictions. It also reviewed the fund's absolute investment performance for each class, as well as the fund's relative investment performance for each class measured against (i) a broad-based securities market index, and (ii) a peer group of mutual funds deemed appropriate by the Board over multiple periods. Because the fund had been in existence less than five calendar years, the following charts considered by the Board show, over the one- and three-year periods ended December 31, 2005, as applicable, the cumulative total returns of Class C and Fidelity International Small Cap (retail class), the cumulative total returns of a broad-based securities market index ("benchmark"), and a range of cumulative total returns of a peer group of mutual funds identified by Lipper Inc. as having an investment objective similar to that of the fund. The returns of Class C and Fidelity International Small Cap (retail class) represent the performance of classes with the highest and lowest 12b-1 fees, respectively (not necessarily with the highest and lowest total expenses). The box within each chart shows the 25th percentile return (bottom of box) and the 75th percentile return (top of box) of the Lipper peer group. Returns shown above the box are in the first quartile and returns shown below the box are in the fourth quartile. The percentage beaten numbers noted below each chart correspond to the percentile box and represent the percentage of funds in the Lipper peer group whose performance was equal to or lower than that of the class indicated.
Annual Report
Board Approval of Investment Advisory Contracts and
Management Fees - continued
Fidelity International Small Cap Fund
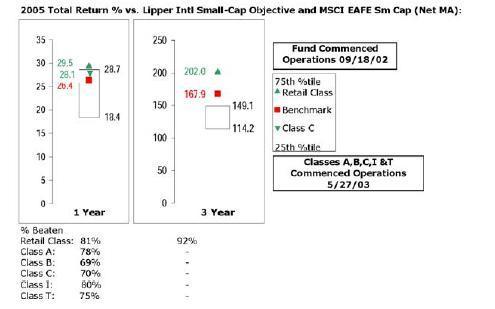
The Board reviewed the fund's relative investment performance against its Lipper peer group and stated that the performance of Fidelity International Small Cap (retail class) was in the first quartile for all the periods shown. The Board also stated that the relative investment performance of Fidelity International Small Cap (retail class) compared favorably to its benchmark for all the periods shown. The Board considered that the variations in performance among the fund's classes reflect the variations in class expenses, which result in lower performance for higher expense classes.
The Board also considered that the fund's management fee is subject to upward or downward adjustment depending upon whether, and to what extent, the fund's investment performance for the performance period exceeds, or is exceeded by, the record (over the same period) of a Board-approved performance adjustment index. The Board realizes that the performance adjustment provides FMR with a strong economic incentive to seek to achieve superior performance for the fund's shareholders and helps to more closely align the interests of FMR and the fund's shareholders.
The Board considered that FMR has taken steps to refocus and strengthen equity research, equity portfolio management, and compliance. The Board noted with favor FMR's reorganization of its senior management team in 2005 and FMR's dedication of additional resources to investment research, and participated in the process that led to those changes.
Based on its review, and giving particular weight to the nature and quality of the resources dedicated by the Investment Advisers to maintain and improve relative performance, the Board concluded that the nature, extent, and quality of the services provided to the fund will benefit the fund's shareholders, particularly in light of the Board's view that the fund's shareholders benefit from investing in a fund that is part of a large family of funds offering a variety of investment disciplines and services.
Annual Report
Competitiveness of Management Fee and Total Fund Expenses. The Board considered the fund's management fee and total expenses compared to "mapped groups" of competitive funds and classes. Fidelity creates "mapped groups" by combining similar Lipper investment objective categories that have comparable management fee characteristics. Combining Lipper investment objective categories aids the Board's management fee and total expense comparisons by broadening the competitive group used for comparison and by reducing the number of universes to which various Fidelity funds are compared.
The Board considered two proprietary management fee comparisons for the 12-month (or shorter) periods shown in the chart below. The group of Lipper funds used by the Board for management fee comparisons is referred to below as the "Total Mapped Group" and, for the reasons explained above, is broader than the Lipper peer group used by the Board for performance comparisons. The Total Mapped Group comparison focuses on a fund's standing relative to the total universe of comparable funds available to investors, in terms of gross management fees before expense reimbursements or caps, and without giving effect to the fund's performance adjustment. "TMG %" represents the percentage of funds in the Total Mapped Group that had management fees that were lower than the fund's. For example, a TMG % of 37% means that 63% of the funds in the Total Mapped Group had higher management fees than the fund. The "Asset-Size Peer Group" (ASPG) comparison focuses on a fund's standing relative to non-Fidelity funds similar in size to the fund within the Total Mapped Group. The ASPG represents at least 15% of the funds in the Total Mapped Group with comparable asset size and management fee characteristics, subject to a minimum of 50 funds (or all funds in the Total Mapped Group if fewer than 50). Additional information, such as the ASPG quartile in which the fund's management fee ranked and the impact of the fund's performance adjustment, is also included in the chart and considered by the Board.
Annual Report
Board Approval of Investment Advisory Contracts and
Management Fees - continued
Fidelity International Small Cap Fund
The Board noted that the fund's management fee ranked below the median of its Total Mapped Group and equal to the median of its ASPG for 2005. The Board also noted the effect of the fund's positive performance adjustment on the fund's management fee ranking. The Board noted that the performance adjustment for each year represents calculations for rolling 36-month periods that differ from the periods shown in the performance charts above.
Based on its review, the Board concluded that the fund's management fee was fair and reasonable in light of the services that the fund receives and the other factors considered.
In its review of each class's total expenses, the Board considered the fund's management fee as well as other fund or class expenses, as applicable, such as transfer agent fees, pricing and bookkeeping fees, fund-paid 12b-1 fees, and custodial, legal, and audit fees. The Board also noted the effects of any waivers and reimbursements on fees and expenses, as well as the fund's positive performance adjustment. As part of its review, the Board also considered current and historical total expenses of each class of the fund compared to competitive fund median expenses. Each class of the fund is compared to those funds and classes in the Total Mapped Group (used by the Board for management fee comparisons) that have a similar sales load structure.
The Board noted that the total expenses of Fidelity International Small Cap (retail class) ranked below its competitive median for 2005, and the total expenses of each of Class A, Class B, Class C, Class T and Institutional Class ranked above its competitive median for 2005. The Board considered that the fund is an international small cap fund, but that the broader competitive mapped group includes international funds of all cap levels because there are relatively few international funds focused on small caps. The Board noted that the fund offers multiple classes, each of which has a different sales load and 12b-1 fee structure, and that the multiple structures are intended to offer a range of pricing options for the intermediary market. The Board also noted that the total expenses of the classes vary primarily by the level of their 12b-1 fees, although differences in transfer agent fees may also cause expenses to vary from class to class.
Annual Report
In its review of total expenses, the Board also considered Fidelity fee structures and other information on clients that FMR and its affiliates service in other competitive markets, such as other mutual funds advised or subadvised by FMR or its affiliates, pension plan clients, and other institutional clients.
Based on its review, the Board concluded that the total expenses of each class of the fund were reasonable, although in some cases above the median of the universe presented for comparison, in light of the services that the fund and its shareholders receive and the other factors considered.
Costs of the Services and Profitability. The Board considered the revenues earned and the expenses incurred by Fidelity in conducting the business of developing, marketing, distributing, managing, administering and servicing the fund and its shareholders. The Board also considered the level of Fidelity's profits in respect of all the Fidelity funds.
On an annual basis, FMR presents to the Board Fidelity's profitability for the fund. Fidelity calculates the profitability for each fund, as well as aggregate profitability for groups of Fidelity funds and all Fidelity funds, using a series of detailed revenue and cost allocation methodologies which originate with the audited books and records of Fidelity. The Audit Committee of the Board reviews any significant changes from the prior year's methodologies.
PricewaterhouseCoopers LLP (PwC), independent registered accounting firm and auditor to Fidelity and certain Fidelity funds, has been engaged annually by the Board as part of the Board's assessment of the results of Fidelity's profitability analysis. PwC's engagement includes the review and assessment of Fidelity's methodologies used in determining the revenues and expenses attributable to Fidelity's mutual fund business, and completion of agreed-upon procedures surrounding the mathematical accuracy of fund profitability and its conformity to allocation methodologies. After considering PwC's reports issued under the engagement and information provided by Fidelity, the Board believes that while other allocation methods may also be reasonable, Fidelity's profitability methodologies are reasonable in all material respects.
Annual Report
Board Approval of Investment Advisory Contracts and
Management Fees - continued
The Board has also reviewed Fidelity's non-fund businesses and any fall-out benefits related to the mutual fund business as well as cases where Fidelity's affiliates may benefit from or be related to the fund's business.
The Board considered the costs of the services provided by and the profits realized by Fidelity in connection with the operation of the fund and determined that the amount of profit is a fair entrepreneurial profit for the management of the fund.
Economies of Scale. The Board considered whether there have been economies of scale in respect of the management of the Fidelity funds, whether the Fidelity funds (including the fund) have appropriately benefited from any such economies of scale, and whether there is potential for realization of any further economies of scale. The Board considered the extent to which the fund will benefit from economies of scale through increased services to the fund, through waivers or reimbursements, or through fee or expense reductions, including reductions that occur through operation of the transfer agent agreement. The transfer agent fee varies in part based on the number of accounts in the fund. If the number of accounts decreases or the average account size increases, the overall transfer agent fee rate decreases.
The Board recognized that the fund's management contract incorporates a "group fee" structure, which provides for lower fee rates as total fund assets under FMR's management increase, and for higher fee rates as total fund assets under FMR's management decrease. The Board considered that the group fee is designed to deliver the benefits of economies of scale to fund shareholders when total fund assets increase, even if assets of any particular fund are unchanged or have declined, because some portion of Fidelity's costs are attributable to services provided to all Fidelity funds, and all funds benefit if those costs can be allocated among more assets. The Board also considered that although the fund is partially closed to new investors, it continues to incur investment management expenses, and marketing and distribution expenses related to the retention of existing shareholders and assets. The Board further noted that the fund may continue to realize benefits from the group fee structure, even though assets may not be expected to grow significantly at the fund level. The Board concluded that, given the group fee structure, fund shareholders will achieve a certain level of economies of scale as assets under FMR's management increase at the fund complex level, regardless of whether Fidelity achieves any such economies of scale.
The Board further concluded that any potential economies of scale are being shared between fund shareholders and Fidelity in an appropriate manner.
Additional Information Requested by the Board. In order to develop fully the factual basis for consideration of the Advisory Contracts, the Board requested additional information on several topics, including (i) Fidelity's fund profitability methodology and profitability trends within certain funds; (ii) portfolio manager compensation; (iii) the extent to which any economies of scale exist and are shared between the funds and Fidelity; (iv) the total expenses of certain funds and classes relative to competitors, including the extent to which the expenses of certain funds have been or could be capped; (v) fund performance trends; and (vi) Fidelity's fee structures, including use of performance fees.
Annual Report
Based on its evaluation of all of the conclusions noted above, and after considering all material factors, the Board ultimately concluded that the advisory fee structures are fair and reasonable, and that the fund's Advisory Contracts should be renewed.
Annual Report
Annual Report
Annual Report
Annual Report
Investment Adviser
Fidelity Management & Research Company
Boston, MA
Investment Sub-Advisers
FMR Co., Inc.
Fidelity Management & Research
(U.K.) Inc.
Fidelity Research & Analysis
Company (formerly Fidelity
Management & Research (Far East) Inc.)
Fidelity International
Investment Advisors
Fidelity Investments Japan Limited
Fidelity International Investment Advisors (U.K.) Limited
General Distributor
Fidelity Distributors Corporation
Boston, MA
Transfer and Service Agents
Fidelity Investments Institutional Operations Company, Inc.
Boston, MA
Fidelity Service Company, Inc.
Boston, MA
Custodian
Mellon Bank
Pittsburgh, PA
(Fidelity Investment logo)(registered trademark)
Corporate Headquarters
82 Devonshire St., Boston, MA 02109
www.fidelity.com
AISCI-UANN-1206
1.793572.103
Fidelity's
Broadly Diversified International Equity
Funds
Fidelity® Global Balanced Fund
Fidelity Diversified International Fund
Fidelity Aggressive International Fund
Fidelity Overseas Fund
Fidelity Worldwide Fund
Annual Report
October 31, 2006
Contents
Chairman's Message | A-4 | Ned Johnson's message to shareholders. |
Shareholder Expense Example | A-5 | An example of shareholder expenses. |
Global Balanced Fund | A-6 | Performance |
| A-7 | Management's Discussion |
| A-8 | Investment Changes |
| A-9 | Investments |
| A-16 | Financial Statements |
Diversified International Fund | A-18 | Performance |
| A-19 | Management's Discussion |
| A-20 | Investment Changes |
| A-21 | Investments |
| A-28 | Financial Statements |
Aggressive International Fund | A-30 | Performance |
| A-31 | Management's Discussion |
| A-32 | Investment Changes |
| A-33 | Investments |
| A-35 | Financial Statements |
Overseas Fund | A-37 | Performance |
| A-38 | Management's Discussion |
| A-39 | Investment Changes |
| A-40 | Investments |
| A-43 | Financial Statements |
Worldwide Fund | A-45 | Performance |
| A-46 | Management's Discussion |
| A-47 | Investment Changes |
| A-48 | Investments |
| A-54 | Financial Statements |
Notes to Financial Statements | A-56 | Notes to the Financial Statements |
Reports of Independent Registered Public Accounting Firms | A-62 | |
Trustees and Officers | A-64 | |
Distributions | A-70 | |
Board Approval of Investment Advisory Contracts and Management Fees | A-71 | |
To view a fund's proxy voting guidelines and proxy voting record for the 12-month period ended June 30, visit www.fidelity.com/proxyvotingresults or visit the Securities and Exchange Commission's (SEC) web site at www.sec.gov. You may also call 1-800-544-8544 to request a free copy of the proxy voting guidelines.
Standard & Poor's, S&P and S&P 500 are registered service marks of The McGraw-Hill Companies, Inc. and have been licensed for use by Fidelity Distributors Corporation.
Other third party marks appearing herein are the property of their respective owners.
All other marks appearing herein are registered or unregistered trademarks or service marks of FMR Corp. or an affiliated company.
Annual Report
This report and the financial statements contained herein are submitted for the general information of the shareholders of the funds. This report is not authorized for distribution to prospective investors in the funds unless preceded or accompanied by an effective prospectus.
A fund files its complete schedule of portfolio holdings with the SEC for the first and third quarters of each fiscal year on Form N-Q. Forms N-Q are available on the SEC's web site at http://www.sec.gov. A fund's Forms N-Q may be reviewed and copied at the SEC's Public Reference Room in Washington, DC. Information regarding the operation of the SEC's Public Reference Room may be obtained by calling 1-800-SEC-0330. For a complete list of a fund's portfolio holdings, view the most recent quarterly holdings report, semiannual report, or annual report on Fidelity's web site at http://www.fidelity.com/holdings.
NOT FDIC INSURED · MAY LOSE VALUE · NO BANK GUARANTEE
Neither the funds nor Fidelity Distributors Corporation is a bank.
Annual Report
Chairman's Message
(Photograph of Edward C. Johnson 3d.)
Dear Shareholder:
Stock and bond markets around the world have seen largely positive results year to date, although weakness in the technology sector and growth stocks in general have tempered performance. While financial markets are always unpredictable, there are a number of time-tested principles that can put the historical odds in your favor.
One of the basic tenets is to invest for the long term. Over time, riding out the markets' inevitable ups and downs has proven much more effective than selling into panic or chasing the hottest trend. Even missing only a few of the markets' best days can significantly diminish investor returns. Patience also affords the benefits of compounding - of earning interest on additional income or reinvested dividends and capital gains. There are tax advantages and cost benefits to consider as well. The more you sell, the more taxes you pay, and the more you trade, the higher the costs. While staying the course doesn't eliminate risk, it can considerably lessen the effect of short-term declines.
You can further manage your investing risk through diversification. And today, more than ever, geographic diversification should be taken into account. Studies
indicate that asset allocation is the single most important determinant of a portfolio's long-term success. The right mix of stocks, bonds and cash - aligned to your particular risk tolerance and investment objective - is very important. Age-appropriate rebalancing is also an essential aspect of asset allocation. For younger investors, an emphasis on equities - which historically have been the best performing asset class over time - is encouraged. As investors near their specific goal, such as retirement or sending a child to college, consideration may be given to replacing volatile assets (e.g. common stocks) with more-stable fixed investments (bonds or savings plans).
A third investment principle - investing regularly - can help lower the average cost of your purchases. Investing a certain amount of money each month or quarter helps ensure you won't pay for all your shares at market highs. This strategy - known as dollar cost averaging - also reduces unconstructive "emotion" from investing, helping shareholders avoid selling weak performers just prior to an upswing, or chasing a hot performer just before a correction.
We invite you to contact us via the Internet, through our Investor Centers or over the phone. It is our privilege to provide you the information you need to make the investments that are right for you.
Sincerely,
/s/Edward C. Johnson 3d
Edward C. Johnson 3d
Annual Report
Shareholder Expense Example
As a shareholder of a Fund, you incur two types of costs: (1) transaction costs, including redemption fees, and (2) ongoing costs, including management fees and other Fund expenses. This Example is intended to help you understand your ongoing costs (in dollars) of investing in the Funds and to compare these costs with the ongoing costs of investing in other mutual funds.
The Example is based on an investment of $1,000 invested at the beginning of the period and held for the entire period (May 1, 2006 to October 31, 2006).
Actual Expenses
The first line of the accompanying table for each fund provides information about actual account values and actual expenses. You may use the information in this line, together with the amount you invested, to estimate the expenses that you paid over the period. Simply divide your account value by $1,000.00 (for example, an $8,600 account value divided by $1,000.00 = 8.6), then multiply the result by the number in the first line for a fund under the heading entitled "Expenses Paid During Period" to estimate the expenses you paid on your account during this period. A small balance maintenance fee of $12.00 that is charged once a year may apply for certain accounts with a value of less than $2,000. This fee is not included in the table below. If it was, the estimate of expenses you paid during the period would be higher, and your ending account value lower, by this amount.
Hypothetical Example for Comparison Purposes
The second line of the accompanying table for each fund provides information about hypothetical account values and hypothetical expenses based on a fund's actual expense ratio and an assumed rate of return of 5% per year before expenses, which is not the Fund's actual return. The hypothetical account values and expenses may not be used to estimate the actual ending account balance or expenses you paid for the period. You may use this information to compare the ongoing costs of investing in the Fund and other funds. To do so, compare this 5% hypothetical example with the 5% hypothetical examples that appear in the shareholder reports of the other funds. A small balance maintenance fee of $12.00 that is charged once a year may apply for certain accounts with a value of less than $2,000. This fee is not included in the table below. If it was, the estimate of expenses you paid during the period would be higher, and your ending account value lower, by this amount.
Please note that the expenses shown in the table are meant to highlight your ongoing costs only and do not reflect any transaction costs. Therefore, the second line of the table is useful in comparing ongoing costs only, and will not help you determine the relative total costs of owning different funds. In addition, if these transactional costs were included, your costs would have been higher.
| Beginning
Account Value
May 1, 2006 | Ending
Account Value
October 31, 2006 | Expenses Paid
During Period*
May 1, 2006
to October 31, 2006 |
Global Balanced | | | |
Actual | $ 1,000.00 | $ 1,011.40 | $ 6.03 |
HypotheticalA | $ 1,000.00 | $ 1,019.21 | $ 6.06 |
Diversified International | | | |
Actual | $ 1,000.00 | $ 1,008.90 | $ 4.86 |
HypotheticalA | $ 1,000.00 | $ 1,020.37 | $ 4.89 |
Aggressive International | | | |
Actual | $ 1,000.00 | $ 975.80 | $ 4.13 |
HypotheticalA | $ 1,000.00 | $ 1,021.02 | $ 4.23 |
Overseas | | | |
Actual | $ 1,000.00 | $ 1,001.30 | $ 4.69 |
HypotheticalA | $ 1,000.00 | $ 1,020.52 | $ 4.74 |
Worldwide | | | |
Actual | $ 1,000.00 | $ 1,022.50 | $ 5.15 |
HypotheticalA | $ 1,000.00 | $ 1,020.11 | $ 5.14 |
A 5% return per year before expenses
* Expenses are equal to each Fund's annualized expense ratio (shown in the table below); multiplied by the average account value over the period, multiplied by 184/365 (to reflect the one-half year period).
| Annualized
Expense Ratio |
Global Balanced | 1.19% |
Diversified International | .96% |
Aggressive International | .83% |
Overseas | .93% |
Worldwide | 1.01% |
Annual Report
Global Balanced
Performance: The Bottom Line
Average annual total return reflects the change in the value of an investment, assuming reinvestment of the fund's dividend income and capital gains (the profits earned upon the sale of securities that have grown in value) and assuming a constant rate of performance each year. The $10,000 table and the fund's returns do not reflect the deduction of taxes that a shareholder would pay on fund distributions or the redemption of fund shares. During periods of reimbursement by Fidelity, a fund's total return will be greater than it would be had the reimbursement not occurred. How a fund did yesterday is no guarantee of how it will do tomorrow.
Average Annual Total Returns
Periods ended
October 31, 2006 | Past 1
year | Past 5
years | Past 10
years |
Fidelity® Global Balanced Fund | 14.23% | 11.53% | 9.26% |
$10,000 Over 10 Years
Let's say hypothetically that $10,000 was invested in Fidelity® Global Balanced Fund on October 31, 1996. The chart shows how the value of your investment would have changed, and also shows how the Morgan Stanley Capital International World Index performed over the same period.
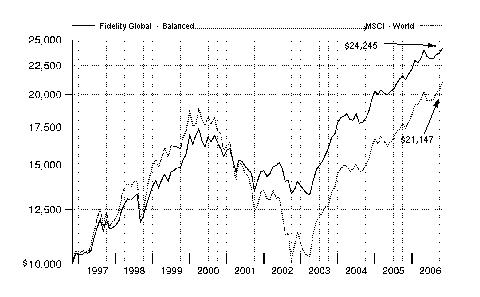
Annual Report
Global Balanced
Management's Discussion of Fund Performance
Comments from Derek Young, Lead Portfolio Manager of Fidelity® Global Balanced Fund
International equity markets as a whole outpaced their U.S. counterparts for the 12 months ending October 31, 2006 - partly as a result of favorable currency exchanges that boosted returns for U.S. investors. The Morgan Stanley Capital InternationalSM Europe, Australasia, Far East (MSCI® EAFE®) Index - a gauge of developed stock markets outside the United States and Canada - gained 27.72% during that time. European markets benefited from solid corporate profit growth and attractive dividends, which helped the MSCI Europe index advance 31.95%. Strong performing Latin American and Asian emerging markets drove the MSCI Emerging Markets index to a lofty 35.42% return. Japan was somewhat of an exception to the generally stellar foreign market performance after struggling in the middle part of the period. Still, its earlier gains helped the Tokyo Stock Exchange Stock Price Index (TOPIX) - a benchmark of the largest and better-established stocks traded on the Tokyo Stock Exchange - rise 12.47% overall. Natural-resources-rich Canada also struggled over the final six months as energy prices fell, but the S&P/TSX Composite Index managed a 12-month return of 28.21%.
The fund gained 14.23% for the period, compared with 14.88% for the Fidelity Global Balanced Composite Index, a 60%/40% blend of the MSCI World index and the Citigroup® World Government Bond Index. Global equity returns were strongly positive for the period, as the MSCI World index advanced 21.75%. The fund's average equity allocation was slightly above the Composite index's 60% weighting, which helped, but the biggest boosts came from favorable regional allocation and astute stock picking in the Asia-Pacific ex Japan and U.S. equity sleeves. On a sector basis, good stock picking in information technology helped the most. Among the fund's best overall performers were Swiss biopharmaceutical firm Actelion and French real estate developer Icade. Unfavorable results from some of the fund's European and Japanese equity positions - among them U.K. online funds transfer service NETeller, which was no longer held at period end, and Japanese integrated energy company Nippon Oil - partially offset the overall equity gain. The fund's large average cash position also hurt results. In the bond sleeve, being underweighted in the asset class helped performance for the 12-month period overall, although the fund's bond sleeve slightly underperformed its component of the Composite index.
Note to shareholders: Ruben Calderon was named Assistant Portfolio Manager of the fund on December 12, 2006.
The views expressed above reflect those of the portfolio manager(s) only through the end of the period as stated on the cover of this report and do not necessarily represent the views of Fidelity or any other person in the Fidelity organization. Any such views are subject to change at any time based upon market or other conditions and Fidelity disclaims any responsibility to update such views. These views may not be relied on as investment advice and, because investment decisions for a Fidelity fund are based on numerous factors, may not be relied on as an indication of trading intent on behalf of any Fidelity fund.
Annual Report
Global Balanced
Investment Changes
Geographic Diversification (% of fund's net assets) |
As of October 31, 2006 |
 | United States of America | 37.3% | |
 | Japan | 18.6% | |
 | France | 7.3% | |
 | Germany | 6.9% | |
 | United Kingdom | 4.7% | |
 | Switzerland | 3.6% | |
 | Finland | 3.0% | |
 | Netherlands | 2.9% | |
 | Austria | 2.6% | |
 | Other | 13.1% | |

Percentages are adjusted for the effect of futures contracts, if applicable. |
|
As of April 30, 2006 |
| United States of America | 39.9% | |
| Japan | 16.0% | |
| France | 8.3% | |
| Germany | 6.9% | |
| United Kingdom | 4.8% | |
| Austria | 4.3% | |
| Switzerland | 3.2% | |
| Norway | 2.4% | |
| Netherlands | 2.1% | |
| Other | 12.1% | |

Percentages are adjusted for the effect of futures contracts, if applicable. |
Asset Allocation |
| % of fund's
net assets | % of fund's net assets
6 months ago |
Stocks | 56.2 | 64.4 |
Bonds | 35.7 | 31.3 |
Convertible Securities | 0.1 | 0.0 |
Short-Term Investments and Net Other Assets | 8.0 | 4.3 |
Top Five Stocks as of October 31, 2006 |
| % of fund's
net assets | % of fund's net assets
6 months ago |
Exxon Mobil Corp. (United States of America) | 1.1 | 0.3 |
Procter & Gamble Co. (United States of America) | 1.0 | 0.0 |
ABB Ltd. sponsored ADR (Switzerland) | 0.8 | 0.0 |
Merck & Co., Inc. (United States
of America) | 0.8 | 0.2 |
PepsiCo, Inc. (United States of America) | 0.7 | 0.5 |
| 4.4 | |
Top Five Bond Issuers as of October 31, 2006 |
(with maturities greater than
one year) | % of fund's
net assets | % of fund's net assets
6 months ago |
Japan Government | 8.6 | 9.6 |
German Federal Republic | 4.6 | 0.1 |
U.S. Treasury Obligations | 4.3 | 5.0 |
Finnish Government | 2.6 | 0.0 |
United Kingdom, Great Britain & Northern Ireland | 1.7 | 1.7 |
| 21.8 | |
Market Sectors as of October 31, 2006 |
| % of fund's
net assets | % of fund's net assets
6 months ago |
Financials | 16.0 | 14.3 |
Consumer Discretionary | 8.1 | 8.6 |
Industrials | 7.4 | 7.4 |
Health Care | 6.8 | 5.6 |
Information Technology | 6.0 | 8.1 |
Consumer Staples | 5.6 | 5.8 |
Energy | 4.5 | 6.8 |
Materials | 3.4 | 4.9 |
Telecommunication Services | 1.8 | 2.7 |
Utilities | 1.6 | 1.7 |
Annual Report
Global Balanced
Investments October 31, 2006
Showing Percentage of Net Assets
Common Stocks - 55.7% |
| Shares | | Value (Note 1) |
Argentina - 0.3% |
Cresud S.A.C.I.F. y A. sponsored ADR | 26,900 | | $ 393,816 |
Inversiones y Representaciones SA sponsored GDR (a) | 17,700 | | 254,349 |
TOTAL ARGENTINA | | 648,165 |
Australia - 2.0% |
AGL Energy Ltd. (a) | 20,900 | | 248,359 |
Alinta Ltd. | 12,069 | | 99,038 |
AMP Ltd. | 53,285 | | 391,881 |
Australian Stock Exchange Ltd. | 12,000 | | 328,859 |
AWB Ltd. | 37,500 | | 73,157 |
BHP Billiton Ltd. | 42,234 | | 898,951 |
Computershare Ltd. | 35,100 | | 209,230 |
Downer EDI Ltd. | 34,987 | | 174,429 |
Fosters Group Ltd. | 65,839 | | 328,752 |
National Australia Bank Ltd. | 24,500 | | 721,280 |
Oxiana Ltd. | 133,494 | | 342,070 |
QBE Insurance Group Ltd. | 17,300 | | 330,802 |
Sonic Healthcare Ltd. | 34,300 | | 349,176 |
Vision Group Holdings Ltd. | 692 | | 2,137 |
Woodside Petroleum Ltd. | 5,100 | | 148,254 |
Woolworths Ltd. | 13,400 | | 214,630 |
WorleyParsons Ltd. | 30,000 | | 421,525 |
TOTAL AUSTRALIA | | 5,282,530 |
Austria - 0.5% |
Flughafen Wien AG | 15,000 | | 1,345,007 |
Bermuda - 0.8% |
Allied World Assurance Co. Holdings
Ltd. | 5,200 | | 217,152 |
Endurance Specialty Holdings Ltd. | 12,000 | | 427,800 |
Lazard Ltd. Class A | 9,600 | | 407,040 |
Marvell Technology Group Ltd. (a) | 16,600 | | 303,448 |
Pacific Basin Shipping Ltd. | 254,000 | | 163,298 |
SeaDrill Ltd. (a) | 31,600 | | 448,141 |
TOTAL BERMUDA | | 1,966,879 |
Brazil - 0.1% |
TAM SA (PN) sponsored ADR (ltd. vtg.) | 11,700 | | 357,435 |
Canada - 0.8% |
Canadian Natural Resources Ltd. | 12,800 | | 666,423 |
European Goldfields Ltd. (a) | 124,800 | | 422,429 |
MagIndustries Corp. (a) | 74,120 | | 62,721 |
New Flyer Industries, Inc. / New Flyer Canada | 50,200 | | 389,026 |
Suncor Energy, Inc. | 5,400 | | 414,867 |
TOTAL CANADA | | 1,955,466 |
Cayman Islands - 0.3% |
Ctrip.com International Ltd. sponsored ADR | 3,500 | | 171,500 |
|
| Shares | | Value (Note 1) |
Foxconn International Holdings Ltd. (a) | 63,000 | | $ 209,401 |
Noble Corp. | 4,900 | | 343,490 |
TOTAL CAYMAN ISLANDS | | 724,391 |
China - 0.1% |
Anhui Conch Cement Co. Ltd. (H Shares) | 76,000 | | 169,058 |
China Life Insurance Co. Ltd. (H Shares) | 65,000 | | 136,900 |
TOTAL CHINA | | 305,958 |
France - 2.8% |
BIC SA | 16,300 | | 1,048,588 |
Compagnie Generale de Geophysique SA (a) | 2,400 | | 405,895 |
Eutelsat Communications | 48,600 | | 877,768 |
Icade SA | 29,100 | | 1,727,532 |
Renault SA | 13,000 | | 1,520,767 |
Sanofi-Aventis sponsored ADR | 30,692 | | 1,310,241 |
Societe Generale Series A | 2,100 | | 348,993 |
TOTAL FRANCE | | 7,239,784 |
Germany - 1.9% |
E.ON AG | 10,400 | | 1,252,056 |
KarstadtQuelle AG (a) | 46,826 | | 1,099,744 |
Lanxess AG (a) | 33,900 | | 1,549,497 |
Qimonda AG Sponsored ADR | 24,000 | | 334,800 |
SAP AG sponsored ADR | 13,400 | | 665,176 |
TOTAL GERMANY | | 4,901,273 |
Hong Kong - 1.0% |
Bank of East Asia Ltd. | 52,537 | | 250,958 |
Chaoda Modern Agriculture (Holdings) Ltd. | 288,000 | | 174,418 |
Cheung Kong Holdings Ltd. | 29,000 | | 315,461 |
China Mobile (Hong Kong) Ltd. | 46,500 | | 379,254 |
CNOOC Ltd. | 125,000 | | 104,775 |
Esprit Holdings Ltd. | 37,000 | | 358,239 |
Hong Kong Exchanges & Clearing Ltd. | 35,000 | | 277,221 |
Li & Fung Ltd. | 132,000 | | 345,394 |
Prosperity (REIT) | 468 | | 108 |
Wing Hang Bank Ltd. | 35,500 | | 345,086 |
TOTAL HONG KONG | | 2,550,914 |
Israel - 0.1% |
Teva Pharmaceutical Industries Ltd. sponsored ADR | 10,400 | | 342,888 |
Italy - 0.3% |
Banca Intesa Spa | 106,000 | | 724,658 |
Japan - 7.6% |
Aeon Co. Ltd. | 14,500 | | 341,548 |
Asics Corp. | 8,000 | | 107,182 |
Calsonic Kansei Corp. | 16,000 | | 104,104 |
Canon, Inc. | 5,600 | | 298,984 |
Daiichi Sankyo Co. Ltd. | 3,200 | | 95,212 |
Dainippon Ink & Chemicals, Inc. | 70,000 | | 264,535 |
Diamond Lease Co. Ltd. | 2,800 | | 141,245 |
Common Stocks - continued |
| Shares | | Value (Note 1) |
Japan - continued |
eAccess Ltd. (f) | 330 | | $ 190,450 |
East Japan Railway Co. | 44 | | 307,729 |
Fanuc Ltd. | 4,200 | | 364,484 |
First Juken Co. Ltd. | 22,000 | | 244,528 |
Fujitsu Ltd. | 24,000 | | 195,759 |
Heiwado Co. Ltd. | 6,100 | | 104,309 |
Hoya Corp. | 7,000 | | 270,520 |
Iino Kaiun Kaisha Ltd. | 37,400 | | 325,843 |
Itochushokuhin Co. Ltd. | 9,600 | | 320,109 |
Japan Retail Fund Investment Corp. | 11 | | 85,115 |
JSR Corp. | 11,500 | | 289,073 |
Kawasaki Kisen Kaisha Ltd. (f) | 60,000 | | 426,813 |
Koito Manufacturing Co. Ltd. | 11,000 | | 155,463 |
Kuraray Co. Ltd. | 19,500 | | 220,742 |
Kurita Water Industries Ltd. | 7,200 | | 147,127 |
Mandom Corp. | 8,400 | | 204,685 |
Matsushita Electric Industrial Co. Ltd. | 21,000 | | 436,800 |
Misawa Homes Holdings, Inc. (a) | 5,400 | | 162,979 |
Mitsubishi Estate Co. Ltd. | 4,000 | | 95,759 |
Mitsui & Co. Ltd. | 31,000 | | 423,281 |
Mizuho Financial Group, Inc. | 236 | | 1,838,201 |
Nafco Co. Ltd. | 8,200 | | 227,155 |
Nikko Cordial Corp. | 17,000 | | 203,634 |
Nintendo Co. Ltd. | 4,500 | | 920,315 |
Nippon Carbon Co. Ltd. | 43,000 | | 168,382 |
Nippon Oil Corp. | 54,000 | | 401,676 |
Nippon Steel Corp. | 139,000 | | 565,698 |
Nissan Motor Co. Ltd. | 45,200 | | 541,426 |
Nomura Holdings, Inc. | 17,100 | | 301,302 |
NTT DoCoMo, Inc. | 67 | | 102,539 |
Omron Corp. | 16,600 | | 428,625 |
Organo Corp. | 34,000 | | 320,639 |
ORIX Corp. | 1,300 | | 366,236 |
Rakuten, Inc. | 843 | | 374,795 |
Sega Sammy Holdings, Inc. | 3,100 | | 77,924 |
Shinagawa Refractories Co. Ltd. | 18,000 | | 62,945 |
Sho-Bond Corp. | 12,800 | | 121,587 |
Shoei Co. | 5,390 | | 171,894 |
Sony Corp. | 8,800 | | 360,624 |
Stanley Electric Co. Ltd. | 5,800 | | 115,048 |
Sumitomo Corp. | 25,600 | | 336,635 |
Sumitomo Electric Industries Ltd. | 36,200 | | 512,544 |
Sumitomo Metal Industries Ltd. | 75,000 | | 282,148 |
Sumitomo Mitsui Financial Group, Inc. | 59 | | 645,691 |
Sumitomo Trust & Banking Co. Ltd. | 34,000 | | 365,698 |
T&D Holdings, Inc. | 7,400 | | 540,954 |
Takeda Pharamaceutical Co. Ltd. | 10,300 | | 661,363 |
Toc Co. Ltd. | 42,000 | | 229,104 |
Toenec Corp. | 39,000 | | 148,051 |
Tokyo Tomin Bank Ltd. | 5,400 | | 219,768 |
Tokyu Land Corp. | 34,000 | | 329,070 |
TonenGeneral Sekiyu KK | 10,000 | | 95,246 |
|
| Shares | | Value (Note 1) |
Toppan Forms Co. Ltd. | 8,300 | | $ 108,788 |
Toyota Motor Corp. | 13,000 | | 767,000 |
UNY Co. Ltd. | 24,000 | | 301,436 |
Valor Co. Ltd. | 8,800 | | 129,412 |
Yachiyo Industry Co. Ltd. | 4,300 | | 99,449 |
TOTAL JAPAN | | 19,767,380 |
Korea (South) - 0.2% |
KT&G Corp. | 2,590 | | 159,977 |
Samsung Engineering Co. Ltd. | 2,960 | | 135,552 |
Taewoong Co. Ltd. | 5,138 | | 142,048 |
TOTAL KOREA (SOUTH) | | 437,577 |
Luxembourg - 0.6% |
SES Global SA FDR (France) | 106,200 | | 1,628,000 |
Malaysia - 0.1% |
United Plantations BHD | 103,000 | | 235,469 |
Mexico - 0.3% |
America Movil SA de CV Series L sponsored ADR | 20,400 | | 874,548 |
Netherlands - 2.1% |
ING Groep NV (Certificaten Van Aandelen) | 24,300 | | 1,077,219 |
Koninklijke Philips Electronics NV | 29,400 | | 1,024,002 |
Koninklijke Wessanen NV | 30,659 | | 408,550 |
Nutreco Holding NV | 18,400 | | 1,096,550 |
Reed Elsevier NV | 83,600 | | 1,437,344 |
Tele Atlas NV (a)(f) | 26,400 | | 495,345 |
TOTAL NETHERLANDS | | 5,539,010 |
Norway - 0.7% |
Fred Olsen Energy ASA (a) | 11,900 | | 513,386 |
Petroleum Geo-Services ASA (a) | 10,100 | | 587,928 |
TANDBERG ASA | 9,770 | | 112,847 |
TGS Nopec Geophysical Co. ASA (a) | 32,700 | | 582,803 |
TOTAL NORWAY | | 1,796,964 |
Papua New Guinea - 0.1% |
Oil Search Ltd. | 69,100 | | 182,949 |
Philippines - 0.2% |
DMCI Holdings, Inc. | 1,372,000 | | 134,888 |
Semirara Mining Corp. | 714,900 | | 276,120 |
TOTAL PHILIPPINES | | 411,008 |
Singapore - 0.6% |
CapitaCommercial Trust (REIT) | 181,600 | | 251,866 |
CapitaLand Ltd. | 91,000 | | 318,447 |
DBS Group Holdings Ltd. | 20,000 | | 261,975 |
Keppel Corp. Ltd. | 24,000 | | 243,483 |
Keppel Land Ltd. | 113,000 | | 399,063 |
TOTAL SINGAPORE | | 1,474,834 |
Sweden - 0.8% |
Assa Abloy AB (B Shares) | 51,000 | | 981,530 |
Common Stocks - continued |
| Shares | | Value (Note 1) |
Sweden - continued |
Atlas Copco AB (A Shares) | 38,500 | | $ 1,124,765 |
Micronic Laser Systems AB (a) | 5,700 | | 51,496 |
TOTAL SWEDEN | | 2,157,791 |
Switzerland - 3.6% |
ABB Ltd. sponsored ADR | 148,900 | | 2,221,588 |
Actelion Ltd. (Reg.) (a) | 10,626 | | 1,789,291 |
Bucher Holding AG | 9,724 | | 984,788 |
Credit Suisse Group sponsored ADR | 10,500 | | 635,040 |
Nestle SA sponsored ADR | 5,800 | | 497,640 |
Novartis AG sponsored ADR | 17,124 | | 1,039,941 |
Roche Holding AG (participation certificate) | 5,410 | | 946,636 |
Swissfirst AG | 4,010 | | 238,831 |
Syngenta AG (Switzerland) | 7,063 | | 1,138,202 |
TOTAL SWITZERLAND | | 9,491,957 |
Taiwan - 0.0% |
Motech Industries, Inc. | 8,306 | | 112,165 |
United Kingdom - 2.6% |
Amlin PLC | 16,700 | | 95,964 |
Benfield Group PLC | 202,943 | | 1,349,091 |
GlaxoSmithKline PLC | 55,100 | | 1,467,038 |
Pearson PLC | 86,957 | | 1,283,008 |
Peter Hambro Mining PLC (a) | 22,839 | | 518,428 |
Standard Chartered PLC (United Kingdom) | 21,043 | | 592,058 |
Tesco PLC | 210,200 | | 1,577,764 |
TOTAL UNITED KINGDOM | | 6,883,351 |
United States of America - 25.2% |
AES Corp. (a) | 35,000 | | 769,650 |
Allergan, Inc. | 12,200 | | 1,409,100 |
Allstate Corp. | 8,300 | | 509,288 |
American Express Co. | 13,200 | | 763,092 |
American International Group, Inc. | 21,687 | | 1,456,716 |
American Superconductor Corp. (a) | 7,700 | | 73,073 |
American Tower Corp. Class A (a) | 29,700 | | 1,069,794 |
Amphenol Corp. Class A | 7,000 | | 475,300 |
Amylin Pharmaceuticals, Inc. (a) | 8,100 | | 356,076 |
Apple Computer, Inc. (a) | 21,100 | | 1,710,788 |
Applied Materials, Inc. | 35,400 | | 615,606 |
aQuantive, Inc. (a) | 14,700 | | 399,546 |
Avon Products, Inc. | 53,100 | | 1,614,771 |
Bank of America Corp. | 14,300 | | 770,341 |
Beazer Homes USA, Inc. | 3,700 | | 160,358 |
Best Buy Co., Inc. (f) | 19,100 | | 1,055,275 |
C.R. Bard, Inc. | 10,200 | | 835,992 |
Casual Male Retail Group, Inc. (a) | 30,100 | | 445,781 |
Cerner Corp. (a) | 12,200 | | 589,382 |
Cognizant Technology Solutions Corp. Class A (a) | 14,300 | | 1,076,504 |
Constellation Energy Group, Inc. | 7,100 | | 443,040 |
|
| Shares | | Value (Note 1) |
CSX Corp. | 15,300 | | $ 545,751 |
CyberSource Corp. (a) | 45,100 | | 462,275 |
Electronic Arts, Inc. (a) | 14,900 | | 788,061 |
EMC Corp. (a) | 41,500 | | 508,375 |
Exelixis, Inc. (a) | 30,400 | | 294,880 |
Exxon Mobil Corp. | 40,200 | | 2,871,084 |
Federated Department Stores, Inc. | 35,000 | | 1,536,850 |
Fluor Corp. | 14,800 | | 1,160,764 |
FormFactor, Inc. (a) | 15,400 | | 587,972 |
FPL Group, Inc. | 19,400 | | 989,400 |
General Dynamics Corp. | 22,800 | | 1,621,080 |
General Growth Properties, Inc. | 7,940 | | 412,086 |
Gilead Sciences, Inc. (a) | 7,900 | | 544,310 |
Google, Inc. Class A (sub. vtg.) (a) | 3,700 | | 1,762,643 |
Greenhill & Co., Inc. | 5,600 | | 380,464 |
Harris Corp. | 7,800 | | 332,280 |
Health Net, Inc. (a) | 8,000 | | 332,080 |
Honeywell International, Inc. | 13,900 | | 585,468 |
Hudson City Bancorp, Inc. | 74,900 | | 1,028,377 |
International Game Technology | 13,400 | | 569,634 |
Inverness Medical Innovations, Inc. (a) | 10,200 | | 384,438 |
JCPenney Co., Inc. | 17,400 | | 1,309,002 |
Johnson & Johnson | 19,800 | | 1,334,520 |
Kroger Co. | 23,700 | | 533,013 |
Lennar Corp. Class A | 4,000 | | 189,920 |
Level 3 Communications, Inc. (a) | 83,500 | | 441,715 |
Merck & Co., Inc. | 44,400 | | 2,016,648 |
Microsoft Corp. | 53,300 | | 1,530,243 |
Monsanto Co. | 26,500 | | 1,171,830 |
Morgan Stanley | 16,000 | | 1,222,880 |
National Oilwell Varco, Inc. (a) | 7,500 | | 453,000 |
Northern Trust Corp. | 26,000 | | 1,526,720 |
NTL, Inc. | 40,050 | | 1,082,552 |
OfficeMax, Inc. | 12,100 | | 575,718 |
PepsiCo, Inc. | 29,390 | | 1,864,502 |
Procter & Gamble Co. | 42,700 | | 2,706,753 |
Quanta Services, Inc. (a) | 30,400 | | 556,320 |
Quest Software, Inc. (a) | 29,100 | | 428,643 |
Quicksilver Resources, Inc. (a) | 6,350 | | 217,678 |
Qwest Communications International, Inc. (a) | 54,100 | | 466,883 |
Raytheon Co. warrants 6/16/11 (a) | 112 | | 1,761 |
Safeway, Inc. | 22,900 | | 672,344 |
Senomyx, Inc. (a) | 13,200 | | 203,544 |
Service Corp. International (SCI) | 55,900 | | 509,808 |
State Street Corp. | 24,300 | | 1,560,789 |
Synthes, Inc. | 13,910 | | 1,577,544 |
Telik, Inc. (a) | 7,700 | | 145,915 |
Time Warner, Inc. | 1,900 | | 38,019 |
Titanium Metals Corp. (a) | 34,000 | | 1,002,320 |
TradeStation Group, Inc. (a) | 22,800 | | 356,820 |
U.S. Bancorp, Delaware | 17,600 | | 595,584 |
United Dominion Realty Trust, Inc. (SBI) | 14,700 | | 475,839 |
United Technologies Corp. | 11,700 | | 768,924 |
Common Stocks - continued |
| Shares | | Value (Note 1) |
United States of America - continued |
Valero Energy Corp. | 9,900 | | $ 518,067 |
Verizon Communications, Inc. | 28,800 | | 1,065,600 |
Wachovia Corp. | 7,400 | | 410,700 |
Wells Fargo & Co. | 30,200 | | 1,095,958 |
Whole Foods Market, Inc. | 8,200 | | 523,488 |
Wynn Resorts Ltd. (a) | 1,500 | | 110,310 |
TOTAL UNITED STATES OF AMERICA | | 65,559,619 |
TOTAL COMMON STOCKS (Cost $127,246,193) | 144,897,970 |
Nonconvertible Preferred Stocks - 0.5% |
| | | |
Italy - 0.5% |
Istituto Finanziario Industriale Spa (IFI) (a)
(Cost $980,985) | 51,900 | | 1,418,971 |
Corporate Bonds - 5.0% |
| Principal Amount (d) | | |
Convertible Bonds - 0.1% |
India - 0.1% |
IVRCL Infrastructures & Projects Ltd. 0% 12/9/10 | | $ 100,000 | | 121,000 |
Nonconvertible Bonds - 4.9% |
Australia - 0.0% |
Myer Group Finance Ltd. 10.1938% 3/15/13 | AUD | 35 | | 2,704 |
Austria - 1.7% |
Oesterreichische Kontrollbank 3.875% 9/15/16 | EUR | 3,400,000 | | 4,350,609 |
Cayman Islands - 0.1% |
Finans Capital Finance Ltd. (Reg. S) 9% 10/7/14 (e) | | 160,000 | | 169,600 |
MUFG Capital Finance 1 Ltd. 6.346% (h) | | 175,000 | | 175,897 |
TOTAL CAYMAN ISLANDS | | 345,497 |
Cyprus - 0.1% |
Mizuho Capital Investment Europe 1 Ltd. 5.02% (h) | EUR | 100,000 | | 127,614 |
Germany - 0.0% |
Wuerttembergische Lebens AG 5.375% 6/1/26 (h) | EUR | 100,000 | | 125,125 |
Hong Kong - 0.1% |
Dah Sing Bank Ltd. 6.1406% 6/3/16 (h) | | 250,000 | | 249,639 |
Iceland - 0.3% |
Kaupthing Bank hf 5.75% 10/4/11 (g) | | 750,000 | | 749,705 |
|
| Principal Amount (d) | | Value
(Note 1) |
Ireland - 0.2% |
Dali Capital PLC: | | | | |
7% 4/13/09 | RUB | 7,000,000 | | $ 266,876 |
8% 9/30/09 | RUB | 3,800,000 | | 143,797 |
TOTAL IRELAND | | 410,673 |
Japan - 0.1% |
Shinsei Bank Ltd. 3.75% 2/23/16 (h) | EUR | 200,000 | | 248,541 |
Luxembourg - 0.5% |
BTA Finance Luxembourg 8.25% (h) | | 100,000 | | 95,801 |
Fiat Finance & Trade Ltd. 5.625% 11/15/11 | EUR | 300,000 | | 389,430 |
Glencore Finance (Europe) SA 5.375% 9/30/11 | EUR | 150,000 | | 194,811 |
Lux-Development SA 6.1% 10/31/16 (e) | EUR | 200,000 | | 256,148 |
Russian Standard Finance SA 6.825% 9/16/09 | EUR | 125,000 | | 160,188 |
VTB Capital SA 0% 8/1/08 (h) | | 270,000 | | 270,122 |
TOTAL LUXEMBOURG | | 1,366,500 |
Multi-National - 0.1% |
WT Finance (Aust) Pty Ltd./Westfield Europe Finance PLC/WEA Finance 3.625% 6/27/12 | EUR | 200,000 | | 246,345 |
Netherlands - 0.4% |
ALB Finance BV 8.75% 4/20/11 | | 200,000 | | 199,000 |
CRR BV 9% 9/21/07 | | 200,000 | | 201,400 |
Deutsche Telekom International Finance BV 4.5% 10/25/13 | EUR | 115,000 | | 146,353 |
Eureko BV 5.125% (h) | EUR | 200,000 | | 257,246 |
TuranAlem Finance BV 6.25% 9/27/11 | EUR | 250,000 | | 320,696 |
TOTAL NETHERLANDS | | 1,124,695 |
Norway - 0.1% |
Neptune Marine Oil & Gas Ltd. 10.92% 9/7/09 (g)(h) | | 250,000 | | 253,750 |
Russia - 0.1% |
PSB Finance SA 8.75% 10/20/11 | | 250,000 | | 249,490 |
United Arab Emirates - 0.1% |
Abu Dhabi National Energy Co. Pjsc 6.5% 10/27/36 | | 200,000 | | 206,760 |
United Kingdom - 0.1% |
Amlin PLC 6.5% 12/19/26 (h) | GBP | 125,000 | | 237,436 |
Gallaher Group PLC 4.5% 4/2/14 | EUR | 100,000 | | 128,023 |
TOTAL UNITED KINGDOM | | 365,459 |
United States of America - 0.9% |
Banca Popolare di Lodi Investment Trust 6.742% (h) | EUR | 200,000 | | 280,782 |
EB Holdings, Inc. (Reg. S) 10% 2/15/15 pay-in-kind | EUR | 275,625 | | 355,326 |
Corporate Bonds - continued |
| Principal Amount (d) | | Value
(Note 1) |
Nonconvertible Bonds - continued |
United States of America - continued |
Embarq Corp. 7.082% 6/1/16 | | $ 200,000 | | $ 204,641 |
Fortune Brands, Inc. 4% 1/30/13 | EUR | 300,000 | | 366,072 |
Pemex Project Funding Master Trust (Reg. S) 5.5% 2/24/25 | EUR | 500,000 | | 649,049 |
Residential Capital Corp. 6.375% 5/17/13 | GBP | 250,000 | | 484,019 |
TOTAL UNITED STATES OF AMERICA | | 2,339,889 |
TOTAL NONCONVERTIBLE BONDS | | 12,762,995 |
TOTAL CORPORATE BONDS (Cost $12,553,209) | 12,883,995 |
Government Obligations - 30.4% |
|
Austria - 0.4% |
Austrian Republic 5.625% 7/15/07 | EUR | 775,000 | | 1,001,278 |
Brazil - 0.0% |
Brazilian Federative Republic 7.375% 2/3/15 | EUR | 100,000 | | 148,573 |
Canada - 0.8% |
Canadian Government 5.25% 6/1/12 | CAD | 2,250,000 | | 2,132,855 |
Finland - 3.0% |
Finnish Government: | | | | |
3.875% 9/15/17 | EUR | 5,350,000 | | 6,885,419 |
5% 7/4/07 | EUR | 775,000 | | 997,322 |
TOTAL FINLAND | | 7,882,741 |
France - 2.2% |
French Government: | | | | |
2.25% 3/12/07 | EUR | 1,550,000 | | 1,969,517 |
3.25% 4/25/16 | EUR | 2,995,000 | | 3,671,817 |
TOTAL FRANCE | | 5,641,334 |
Germany - 5.0% |
German Federal Republic: | | | | |
3.5% 9/12/08 | EUR | 6,800,000 | | 8,653,475 |
4% 1/4/37 | EUR | 2,500,000 | | 3,277,157 |
6% 7/4/07 | EUR | 775,000 | | 1,004,048 |
TOTAL GERMANY | | 12,934,680 |
Japan - 10.9% |
Japan Government: | | | | |
Inflation-Indexed 0.5% 6/10/15 | JPY | 606,600,000 | | 4,929,663 |
|
| Principal
Amount (d) | | Value
(Note 1) |
0.1% 6/20/07 | JPY | 600,000,000 | | $ 5,119,186 |
0.3552% 1/29/07 | JPY | 100,000,000 | | 854,224 |
1.22% 11/20/20 (h) | JPY | 125,000,000 | | 1,038,282 |
1.3% 3/20/15 | JPY | 900,000,000 | | 7,524,573 |
1.5% 3/20/14 | JPY | 200,000,000 | | 1,712,825 |
1.8% 3/20/16 | JPY | 820,000,000 | | 7,093,323 |
TOTAL JAPAN | | 28,272,076 |
Netherlands - 0.4% |
Dutch Government 3% 7/15/07 | EUR | 775,000 | | 984,096 |
United Kingdom - 1.7% |
United Kingdom, Great Britain & Northern Ireland: | | | | |
4.25% 6/7/32 | GBP | 950,000 | | 1,863,444 |
5% 3/7/25 | GBP | 85,000 | | 176,811 |
5.75% 12/7/09 | GBP | 1,200,000 | | 2,344,302 |
TOTAL UNITED KINGDOM | | 4,384,557 |
United States of America - 6.0% |
U.S. Treasury Inflation-Indexed Notes 2% 7/15/14 | | 2,163,300 | | 2,107,523 |
U.S. Treasury Notes: | | | | |
3.375% 12/15/08 | | 765,000 | | 745,457 |
3.5% 5/31/07 | | 4,450,000 | | 4,410,889 |
4.375% 8/15/12 | | 2,400,000 | | 2,378,155 |
4.625% 8/31/11 | | 125,000 | | 125,234 |
4.875% 5/31/11 | | 1,875,000 | | 1,897,853 |
5.125% 6/30/11 | | 3,850,000 | | 3,937,075 |
TOTAL UNITED STATES OF AMERICA | | 15,602,186 |
TOTAL GOVERNMENT OBLIGATIONS (Cost $78,651,328) | 78,984,376 |
Asset-Backed Securities - 0.3% |
|
Affinity PLC Series 2002-A
CLass C, 6.37% 5/15/09 (h) | GBP | 110,000 | | 210,937 |
Bosphorus Financial Services Ltd. (Reg. S) 7.205% 2/15/12 (h) | | 250,000 | | 252,300 |
Permanent Master Issuer PLC Series 2006-1 Class 2C, 5.7744% 7/17/42 (h) | | 400,000 | | 399,984 |
TOTAL ASSET-BACKED SECURITIES (Cost $849,212) | 863,221 |
Collateralized Mortgage Obligations - 0.1% |
|
Private Sponsor - 0.1% |
Lansdowne Mortgage Securities No. 1 PLC Series M1, 3.551% 6/15/45 (h)
(Cost $122,905) | EUR | 100,000 | | $ 127,385 |
Commercial Mortgage Securities - 0.3% |
| Principal
Amount (d) | | Value
(Note 1) |
Ireland - 0.2% |
European Property Capital Series 4 Class C, 0% 7/20/14 (h) | GBP | 75,000 | | $ 143,063 |
German Residential Asset Note Distributor PLC: | | | | |
Series 1 Class A, 3.751% 7/20/16 (h) | EUR | 197,256 | | 252,485 |
4.231% 7/20/16 (h) | EUR | 138,079 | | 177,126 |
TOTAL IRELAND | | 572,674 |
United Kingdom - 0.1% |
Broadgate PLC 5.8925% 10/5/25 (h) | GBP | 48,250 | | 91,834 |
Canary Wharf Finance II PLC Series C1, 5.75% 4/22/30 (h) | GBP | 74,663 | | 141,094 |
TOTAL UNITED KINGDOM | | 232,928 |
TOTAL COMMERCIAL MORTGAGE SECURITIES (Cost $796,284) | 805,602 |
Commercial Paper - 2.5% |
|
France - 2.3% |
Banque Federative du Credit Mutuel (BFCM) 3.34% 11/10/06 | EUR | 4,800,000 | | 6,118,636 |
Ireland - 0.2% |
GPB Finance Public Ltd. 0% 4/19/07 | | 500,000 | | 487,802 |
TOTAL COMMERCIAL PAPER (Cost $6,496,336) | 6,606,438 |
Money Market Funds - 4.9% |
| Shares | | |
Fidelity Cash Central Fund, 5.34% (b) | 11,091,563 | | 11,091,563 |
Fidelity Securities Lending Cash Central Fund, 5.35% (b)(c) | 1,625,495 | | 1,625,495 |
TOTAL MONEY MARKET FUNDS (Cost $12,717,058) | 12,717,058 |
TOTAL INVESTMENT PORTFOLIO - 99.7% (Cost $240,413,510) | | 259,305,016 |
NET OTHER ASSETS - 0.3% | | 838,917 |
NET ASSETS - 100% | $ 260,143,933 |
Currency Abbreviations |
AUD | - | Australian dollar |
CAD | - | Canadian dollar |
EUR | - | European Monetary Unit |
GBP | - | British pound |
JPY | - | Japanese yen |
RUB | - | Russian ruble |
Legend |
(a) Non-income producing |
(b) Affiliated fund that is available only to investment companies and other accounts managed by Fidelity Investments. The rate quoted is the annualized seven-day yield of the fund at period end. A complete unaudited listing of the fund's holdings as of its most recent quarter end is available upon request. |
(c) Investment made with cash collateral received from securities on loan. |
(d) Principal amount is stated in United States dollars unless otherwise noted. |
(e) Security initially issued at one coupon which converts to a higher coupon at a specified date. The rate shown is the rate at period end. |
(f) Security or a portion of the security is on loan at period end. |
(g) Security exempt from registration under Rule 144A of the Securities Act of 1933. These securities may be resold in transactions exempt from registration, normally to qualified institutional buyers. At the end of the period, the value of these securities amounted to $1,003,455 or 0.4% of net assets. |
(h) The coupon rate shown on floating or adjustable rate securities represents the rate at period end. |
Affiliated Central Funds |
Information regarding fiscal year to date income earned by the Fund from investments in Fidelity Central Funds is as follows: |
Fund | Income earned |
Fidelity Cash Central Fund | $ 883,487 |
Fidelity Securities Lending Cash Central Fund | 29,527 |
Total | $ 913,014 |
Other Information |
The composition of credit quality ratings as a percentage of net assets is as follows (ratings are unaudited): |
U.S.Government and U.S.Government Agency Obligations | 6.0% |
AAA,AA,A | 26.5% |
BBB | 1.8% |
BB | 0.4% |
B | 0.2% |
CCC,CC,C | 0.0% |
Not Rated | 0.9% |
Equities | 56.2% |
Short-Term Investments and Net Other Assets | 8.0% |
| 100.0% |
We have used ratings from Moody's Investors Services, Inc. Where Moody's ratings are not available, we have used S&P ratings. |
Annual Report
See accompanying notes which are an integral part of the financial statements.
Global Balanced
Financial Statements
Statement of Assets and Liabilities
October 31, 2006 |
| | |
Assets | | |
Investment in securities, at value (including securities loaned of $1,576,481) - See accompanying schedule: Unaffiliated issuers (cost $227,696,452) | $ 246,587,958 | |
Fidelity Central Funds (cost $12,717,058) | 12,717,058 | |
Total Investments (cost $240,413,510) | | $ 259,305,016 |
Cash | | 17,059 |
Foreign currency held at value (cost $254,212) | | 254,238 |
Receivable for investments sold | | 5,149,750 |
Receivable for fund shares sold | | 459,107 |
Dividends receivable | | 172,054 |
Interest receivable | | 942,480 |
Other receivables | | 16,946 |
Total assets | | 266,316,650 |
| | |
Liabilities | | |
Payable for investments purchased | $ 3,957,664 | |
Payable for fund shares redeemed | 284,086 | |
Accrued management fee | 151,464 | |
Other affiliated payables | 62,356 | |
Other payables and accrued expenses | 91,652 | |
Collateral on securities loaned, at value | 1,625,495 | |
Total liabilities | | 6,172,717 |
| | |
Net Assets | | $ 260,143,933 |
Net Assets consist of: | | |
Paid in capital | | $ 211,415,739 |
Undistributed net investment income | | 2,652,173 |
Accumulated undistributed net realized gain (loss) on investments and foreign currency transactions | | 27,176,237 |
Net unrealized appreciation (depreciation) on investments and assets and liabilities in foreign currencies | | 18,899,784 |
Net Assets, for 11,269,010 shares outstanding | | $ 260,143,933 |
Net Asset Value, offering price and redemption price per share ($260,143,933 ÷ 11,269,010 shares) | | $ 23.08 |
Statement of Operations
Year ended October 31, 2006 |
| | |
Investment Income | | |
Dividends | | $ 2,494,413 |
Interest | | 2,252,573 |
Income from Fidelity Central Funds (including $29,527 from security lending) | | 913,014 |
| | 5,660,000 |
Less foreign taxes withheld | | (176,084) |
Total income | | 5,483,916 |
| | |
Expenses | | |
Management fee | $ 1,623,828 | |
Transfer agent fees | 566,372 | |
Accounting and security lending fees | 113,617 | |
Custodian fees and expenses | 257,668 | |
Independent trustees' compensation | 895 | |
Registration fees | 25,768 | |
Audit | 85,199 | |
Legal | 7,404 | |
Miscellaneous | 1,927 | |
Total expenses before reductions | 2,682,678 | |
Expense reductions | (90,437) | 2,592,241 |
Net investment income (loss) | | 2,891,675 |
Realized and Unrealized Gain (Loss) Net realized gain (loss) on: | | |
Investment securities: | | |
Unaffiliated issuers (net of foreign taxes of $11,184) | 26,747,856 | |
Foreign currency transactions | (69,221) | |
Futures contracts | 710,088 | |
Total net realized gain (loss) | | 27,388,723 |
Change in net unrealized appreciation (depreciation) on: Investment securities | (1,366,518) | |
Assets and liabilities in foreign currencies | 19,037 | |
Futures contracts | 139,170 | |
Total change in net unrealized appreciation (depreciation) | | (1,208,311) |
Net gain (loss) | | 26,180,412 |
Net increase (decrease) in net assets resulting from operations | | $ 29,072,087 |
Annual Report
See accompanying notes which are an integral part of the financial statements.
Global Balanced
Financial Statements - continued
Statement of Changes in Net Assets
| Year ended
October 31,
2006 | Year ended
October 31,
2005 |
Increase (Decrease) in Net Assets | | |
Operations | | |
Net investment income (loss) | $ 2,891,675 | $ 1,411,815 |
Net realized gain (loss) | 27,388,723 | 17,750,076 |
Change in net unrealized appreciation (depreciation) | (1,208,311) | 2,312,645 |
Net increase (decrease) in net assets resulting from operations | 29,072,087 | 21,474,536 |
Distributions to shareholders from net investment income | (1,257,249) | (947,033) |
Distributions to shareholders from net realized gain | (15,002,921) | (2,331,147) |
Total distributions | (16,260,170) | (3,278,180) |
Share transactions
Proceeds from sales of shares | 103,989,584 | 85,851,097 |
Reinvestment of distributions | 15,532,156 | 3,105,549 |
Cost of shares redeemed | (63,446,357) | (53,533,775) |
Net increase (decrease) in net assets resulting from share transactions | 56,075,383 | 35,422,871 |
Redemption fees | 9,915 | 8,689 |
Total increase (decrease) in net assets | 68,897,215 | 53,627,916 |
| | |
Net Assets | | |
Beginning of period | 191,246,718 | 137,618,802 |
End of period (including undistributed net investment income of $2,652,173 and undistributed net investment income
of $1,211,763, respectively) | $ 260,143,933 | $ 191,246,718 |
Other Information Shares | | |
Sold | 4,699,494 | 4,082,256 |
Issued in reinvestment of distributions | 741,039 | 151,048 |
Redeemed | (2,883,798) | (2,510,378) |
Net increase (decrease) | 2,556,735 | 1,722,926 |
Financial Highlights
Years ended October 31, | 2006 | 2005 | 2004 | 2003 | 2002 |
Selected Per-Share Data | | | | | |
Net asset value, beginning of period | $ 21.95 | $ 19.69 | $ 18.06 | $ 14.84 | $ 15.36 |
Income from Investment Operations | | | | | |
Net investment income (loss) B | .28 | .17 E | .10 F | .15 | .17 |
Net realized and unrealized gain (loss) | 2.66 | 2.54 | 1.85 | 3.29 | (.66) |
Total from investment operations | 2.94 | 2.71 | 1.95 | 3.44 | (.49) |
Distributions from net investment income | (.14) | (.13) | (.32) | (.22) | (.03) |
Distributions from net realized gain | (1.67) | (.32) | - | - | - |
Total distributions | (1.81) | (.45) | (.32) | (.22) | (.03) |
Redemption fees added to paid in capital B | - H | - H | - H | - H | - H |
Net asset value, end of period | $ 23.08 | $ 21.95 | $ 19.69 | $ 18.06 | $ 14.84 |
Total Return A | 14.23% | 13.92% | 10.93% | 23.49% | (3.20)% |
Ratios to Average Net Assets C, G | | | | | |
Expenses before reductions | 1.18% | 1.17% | 1.20% | 1.29% | 1.29% |
Expenses net of fee waivers, if any | 1.18% | 1.17% | 1.20% | 1.29% | 1.29% |
Expenses net of all reductions | 1.14% | 1.15% | 1.19% | 1.28% | 1.27% |
Net investment income (loss) | 1.27% | .80% E | .54% F | .98% | 1.07% |
Supplemental Data | | | | | |
Net assets, end of period (000 omitted) | $ 260,144 | $ 191,247 | $ 137,619 | $ 115,864 | $ 88,263 |
Portfolio turnover rate D | 208% | 95% | 94% | 113% | 126% |
A Total returns would have been lower had certain expenses not been reduced during the periods shown. B Calculated based on average shares outstanding during the period. C Fees and expenses of the underlying Fidelity Central Funds are not included in the Fund's expense ratio. The Fund indirectly bears its proportionate share of the expense of any underlying Fidelity Central Funds D Amount does not include the portfolio activity of any underlying Fidelity Central Funds E Investment income per share reflects a special dividend which amounted to $.03 per share. Excluding the special dividend, the ratio of net investment income (loss) to average net assets would have been .66%. F Net investment income per share includes approximately $.05 per share received as a result of a reorganization of an issuer that was in bankruptcy. Excluding this non-recurring amount, the ratio of net investment income to average net assets would have been .26%. G Expense ratios reflect operating expenses of the Fund. Expenses before reductions do not reflect amounts reimbursed by the investment adviser or reductions from brokerage service arrangements or other expense offset arrangements and do not represent the amount paid by the Fund during periods when reimbursements or reductions occur. Expenses net of fee waivers reflect expenses after reimbursement by the investment adviser but prior to reductions from brokerage service arrangements or other expense offset arrangements. Expenses net of all reductions represent the net expenses paid by the Fund. H Amount represents less than $.01 per share. |
Annual Report
See accompanying notes which are an integral part of the financial statements.
Diversified International
Performance: The Bottom Line
Average annual total return reflects the change in the value of an investment, assuming reinvestment of the fund's dividend income and capital gains (the profits earned upon the sale of securities that have grown in value) and assuming a constant rate of performance each year. The $10,000 table and the fund's returns do not reflect the deduction of taxes that a shareholder would pay on fund distributions or the redemption of fund shares. During periods of reimbursement by Fidelity, a fund's total return will be greater than it would be had the reimbursement not occurred. How a fund did yesterday is no guarantee of how it will do tomorrow.
Average Annual Total Returns
Periods ended
October 31, 2006 | Past 1
year | Past 5
years | Past 10
years |
Fidelity Diversified International Fund | 25.89% | 17.18% | 13.14% |
$10,000 Over 10 Years
Let's say hypothetically that $10,000 was invested in Fidelity Diversified International Fund on October 31, 1996. The chart shows how the value of your investment would have changed, and also shows how the Morgan Stanley Capital International EAFE Index performed over the same period.
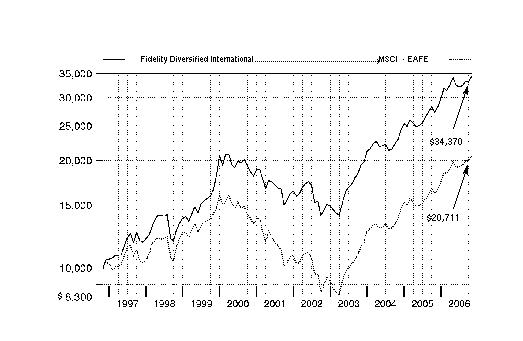
Annual Report
Diversified International
Management's Discussion of Fund Performance
Comments from William Bower, Portfolio Manager of Fidelity® Diversified International Fund
International equity markets as a whole outpaced their U.S. counterparts for the 12 months ending October 31, 2006 - partly as a result of favorable currency exchanges that boosted returns for U.S. investors. The Morgan Stanley Capital InternationalSM Europe, Australasia, Far East (MSCI® EAFE®) Index - a gauge of developed stock markets outside the United States and Canada - gained 27.72% during that time. European markets benefited from solid corporate profit growth and attractive dividends, which helped the MSCI Europe index advance 31.95%. Strong performing Latin American and Asian emerging markets drove the MSCI Emerging Markets index to a lofty 35.42% return. Japan was somewhat of an exception to the generally stellar foreign market performance after struggling in the middle part of the period. Still, its earlier gains helped the Tokyo Stock Exchange Stock Price Index (TOPIX) - a benchmark of the largest and better-established stocks traded on the Tokyo Stock Exchange - rise 12.47% overall. Natural-resources-rich Canada also struggled over the final six months as energy prices fell, but the S&P/TSX Composite Index managed a 12-month return of 28.21%.
For the 12 months ending October 31, 2006, the fund returned 25.89%, underperforming the MSCI EAFE index. Security selection in and an underweighting of financials detracted, as did poor stock selection in and an overweighting of health care. Stock selection in Europe also dampened performance, along with the fund's modest cash position and - due to our underweighting in the United Kingdom - the appreciation of the pound sterling relative to the U.S. dollar. Conversely, security selection in industrials, energy and telecommunication services - along with an underweighting in this last sector - helped returns. Security selection in India and Japan, as well as an underweighting of Japan, also proved beneficial. Detractors included Canadian energy firm EnCana, Japanese materials firm Nitto Denko, leading global medical device manufacturer Synthes and Hong-Kong based tool maker Techtronic Industries. Underweighting British metals supplier Anglo American and not owning Spanish electric utility Endesa also hurt. Contributors included Swiss electrical power equipment provider ABB, Italian automaker Fiat and Indian software manufacturer Infosys Technologies. Underweighting or not owning several lagging index components, including U.K. pharmaceutical firm GlaxoSmithKline and integrated oil companies BP and Royal Dutch Shell, also helped.
The views expressed above reflect those of the portfolio manager(s) only through the end of the period as stated on the cover of this report and do not necessarily represent the views of Fidelity or any other person in the Fidelity organization. Any such views are subject to change at any time based upon market or other conditions and Fidelity disclaims any responsibility to update such views. These views may not be relied on as investment advice and, because investment decisions for a Fidelity fund are based on numerous factors, may not be relied on as an indication of trading intent on behalf of any Fidelity fund.
Annual Report
Diversified International
Investment Changes
Geographic Diversification (% of fund's net assets) |
As of October 31, 2006 |
| Japan | 15.9% | |
| United Kingdom | 11.9% | |
| United States of America | 10.5% | |
| Switzerland | 10.1% | |
| France | 8.9% | |
| Germany | 7.5% | |
| Canada | 6.1% | |
| Spain | 3.9% | |
| Netherlands | 3.6% | |
| Other | 21.6% | |
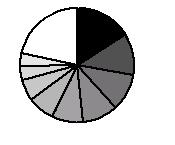
Percentages are adjusted for the effect of futures contracts, if applicable. |
|
As of April 30, 2006 |
| Japan | 18.2% | |
| United Kingdom | 11.2% | |
| Switzerland | 10.1% | |
| France | 9.4% | |
| United States of America | 7.4% | |
| Germany | 6.8% | |
| Canada | 5.7% | |
| Netherlands | 3.9% | |
| Korea (South) | 2.8% | |
| Other | 24.5% | |

Percentages are adjusted for the effect of futures contracts, if applicable. |
Asset Allocation |
| % of fund's
net assets | % of fund's net assets
6 months ago |
Stocks | 92.4 | 96.0 |
Bonds | 0.6 | 0.4 |
Short-Term Investments and Net Other Assets | 7.0 | 3.6 |
Top Ten Stocks as of October 31, 2006 |
| % of fund's
net assets | % of fund's net assets
6 months ago |
Roche Holding AG (participation certificate) (Switzerland, Pharmaceuticals) | 1.8 | 1.7 |
Novartis AG (Switzerland, Pharmaceuticals) | 1.7 | 1.5 |
Banco Bilbao Vizcaya Argentaria SA (Spain, Commercial Banks) | 1.4 | 0.7 |
ORIX Corp. (Japan, Consumer Finance) | 1.3 | 1.3 |
Toyota Motor Corp. sponsored ADR (Japan, Automobiles) | 1.3 | 1.1 |
Tesco PLC (United Kingdom, Food & Staples Retailing) | 1.1 | 0.7 |
HSBC Holdings PLC sponsored ADR (United Kingdom, Commercial Banks) | 1.1 | 0.7 |
Mizuho Financial Group, Inc. (Japan, Commercial Banks) | 1.1 | 0.9 |
Fiat Spa (Italy, Automobiles) | 1.0 | 0.6 |
Unicredito Italiano Spa (Italy, Commercial Banks) | 1.0 | 0.8 |
| 12.8 | |
Market Sectors as of October 31, 2006 |
| % of fund's
net assets | % of fund's net assets
6 months ago |
Financials | 23.0 | 24.5 |
Consumer Discretionary | 11.7 | 10.7 |
Industrials | 11.4 | 13.3 |
Consumer Staples | 8.4 | 6.5 |
Materials | 8.3 | 8.7 |
Information Technology | 7.9 | 9.6 |
Energy | 7.7 | 10.1 |
Health Care | 7.6 | 7.9 |
Telecommunication Services | 3.5 | 2.3 |
Utilities | 2.9 | 2.4 |
Annual Report
Diversified International
Investments October 31, 2006
Showing Percentage of Net Assets
Common Stocks - 92.0% |
| Shares | | Value (Note 1) |
Australia - 2.2% |
Aristocrat Leisure Ltd. | 2,000,000 | | $ 21,567,819 |
Australia & New Zealand Banking Group Ltd. | 4,500,000 | | 101,165,922 |
BHP Billiton Ltd. sponsored ADR | 2,541,000 | | 108,170,370 |
Brambles Industries Ltd. (e) | 12,000,000 | | 115,936,704 |
Computershare Ltd. | 22,000,000 | | 131,141,010 |
CSL Ltd. | 4,216,566 | | 183,092,038 |
Macquarie Capital Alliance Group unit (a) | 10,199,900 | | 27,242,071 |
National Australia Bank Ltd. | 4,000,000 | | 117,760,000 |
QBE Insurance Group Ltd. | 9,500,000 | | 181,654,297 |
TOTAL AUSTRALIA | | 987,730,231 |
Austria - 0.2% |
OMV AG | 1,224,000 | | 66,538,936 |
Belgium - 0.3% |
InBev SA | 500,000 | | 28,170,148 |
KBC Groupe SA | 501,000 | | 54,739,180 |
RHJ International (a) | 1,000,000 | | 18,826,900 |
Umicore SA | 300,000 | | 46,563,072 |
TOTAL BELGIUM | | 148,299,300 |
Bermuda - 0.2% |
Clear Media Ltd. (a)(f) | 27,000,000 | | 37,841,382 |
Willis Group Holdings Ltd. | 1,700,000 | | 64,651,000 |
TOTAL BERMUDA | | 102,492,382 |
Brazil - 0.9% |
Banco Itau Holding Financeira SA sponsored ADR (non-vtg.) | 1,000,000 | | 33,200,000 |
Banco Nossa Caixa SA | 3,785,000 | | 90,108,104 |
Companhia Siderurgica Nacional SA (CSN) sponsored ADR | 57,000 | | 1,776,690 |
Cyrela Brazil Realty SA | 1,300,000 | | 26,230,733 |
Embraer - Empresa Brasileira de Aeronautica SA sponsored ADR | 64,400 | | 2,680,972 |
Petroleo Brasileiro SA Petrobras sponsored ADR | 20,000 | | 1,775,200 |
Sadia SA ADR | 61,000 | | 1,789,740 |
TAM SA (PN) sponsored ADR
(ltd. vtg.) | 2,000,000 | | 61,100,000 |
Uniao de Bancos Brasileiros SA (Unibanco) GDR | 2,000,000 | | 157,500,000 |
TOTAL BRAZIL | | 376,161,439 |
Canada - 6.1% |
Astral Media, Inc. Class A (non-vtg.) | 1,000,000 | | 35,558,723 |
Brookfield Asset Management, Inc. Class A (e) | 3,150,000 | | 143,491,738 |
Canadian National Railway Co. | 1,600,000 | | 76,248,163 |
Canadian Natural Resources Ltd. | 6,550,000 | | 341,021,245 |
Canadian Oil Sands Trust unit | 500,000 | | 13,548,301 |
Canadian Western Bank, Edmonton | 400,000 | | 15,071,483 |
|
| Shares | | Value (Note 1) |
Corus Entertainment, Inc. Class B (non-vtg.) | 1,100,000 | | $ 41,397,586 |
EnCana Corp. | 6,750,000 | | 320,649,802 |
Flint Energy Services Ltd. (a) | 1,000,000 | | 51,218,100 |
Gildan Activewear, Inc. Class A (a) | 50,000 | | 2,545,762 |
Glamis Gold Ltd. (a) | 1,376,000 | | 60,597,194 |
Goldcorp, Inc. | 3,000,000 | | 78,991,672 |
Keyera Facilities Income Fund (e) | 350,000 | | 6,709,126 |
Meridian Gold, Inc. (a) | 525,000 | | 13,220,282 |
Metro, Inc. Class A (sub. vtg.) | 700,000 | | 21,736,071 |
Niko Resources Ltd. | 2,000,000 | | 121,141,941 |
OZ Optics Ltd. unit (a)(h) | 102,000 | | 1,504,500 |
Petro-Canada | 3,500,000 | | 149,271,812 |
Potash Corp. of Saskatchewan, Inc. | 500,000 | | 62,450,002 |
Power Corp. of Canada (sub. vtg.) | 3,800,000 | | 115,118,692 |
Precision Drilling Trust (e) | 3,350,000 | | 95,309,313 |
Research In Motion Ltd. (a) | 1,000,000 | | 117,480,007 |
Rogers Communications, Inc. Class B (non-vtg.) | 1,500,000 | | 89,774,195 |
Shoppers Drug Mart Corp. | 1,000,000 | | 40,742,885 |
Skye Resources, Inc. (a) | 1,000,000 | | 16,033,492 |
Suncor Energy, Inc. | 1,200,000 | | 92,192,580 |
Talisman Energy, Inc. | 12,250,000 | | 201,320,536 |
TransCanada Corp. | 5,800,000 | | 187,745,068 |
Ultra Petroleum Corp. (a) | 500,000 | | 26,685,000 |
Western Oil Sands, Inc. Class A (a) | 6,000,000 | | 154,723,200 |
TOTAL CANADA | | 2,693,498,471 |
Cayman Islands - 0.6% |
Apex Silver Mines Ltd. (a) | 1,400,000 | | 22,120,000 |
GlobalSantaFe Corp. | 3,250,000 | | 168,675,000 |
Hutchison Telecommunications International Ltd. sponsored ADR (a) | 876,200 | | 25,716,470 |
Noble Corp. | 750,000 | | 52,575,000 |
TOTAL CAYMAN ISLANDS | | 269,086,470 |
Chile - 0.0% |
Lan Airlines SA sponsored ADR | 41,000 | | 1,769,150 |
China - 0.3% |
BYD Co. Ltd. (H Shares) (a) | 7,000,000 | | 18,856,401 |
China Shenhua Energy Co. Ltd.
(H Shares) | 7,999,700 | | 14,071,375 |
China Techfaith Wireless Communication Technology Ltd. sponsored ADR (a)(e) | 2,920,300 | | 21,435,002 |
Global Bio-Chem Technology Group Co. Ltd. | 109,999,600 | | 32,247,993 |
Industrial & Commercial Bank of China | 50,000,000 | | 22,373,091 |
Shanghai Zhenhua Port Machinery Co. Ltd. (B Shares) | 11,999,900 | | 11,351,905 |
Sinopec Shanghai Petrochemical Co. Ltd. sponsored ADR | 42,000 | | 1,794,660 |
Weichai Power Co. Ltd. (H Shares) | 466,000 | | 1,118,084 |
TOTAL CHINA | | 123,248,511 |
Common Stocks - continued |
| Shares | | Value (Note 1) |
Colombia - 0.0% |
BanColombia SA sponsored ADR | 58,000 | | $ 1,773,060 |
Czech Republic - 0.2% |
Ceske Energeticke Zavody AS | 500,000 | | 19,772,537 |
Zentiva NV | 929,500 | | 53,088,966 |
TOTAL CZECH REPUBLIC | | 72,861,503 |
Denmark - 0.4% |
Danske Bank AS | 1,300,000 | | 54,539,539 |
Novozymes AS Series B | 1,500,000 | | 120,209,596 |
Vestas Wind Systems AS (a) | 500,000 | | 14,084,386 |
TOTAL DENMARK | | 188,833,521 |
Finland - 0.6% |
Fortum Oyj | 68,000 | | 1,871,305 |
Metso Corp. sponsored ADR | 68,000 | | 2,944,400 |
Neste Oil Oyj | 1,000,000 | | 31,476,024 |
Nokia Corp. sponsored ADR | 10,500,000 | | 208,740,000 |
TOTAL FINLAND | | 245,031,729 |
France - 8.9% |
Alcatel SA sponsored ADR (e) | 10,500,000 | | 133,350,000 |
Alstom SA (a) | 1,800,000 | | 166,110,697 |
AXA SA sponsored ADR | 4,000,000 | | 152,480,000 |
BNP Paribas SA | 4,099,720 | | 450,812,838 |
Bouygues SA | 3,000,000 | | 174,917,857 |
Carrefour SA | 3,787,100 | | 230,768,212 |
CNP Assurances | 700,000 | | 73,667,426 |
Dassault Aviation SA | 36,265 | | 28,560,095 |
Essilor International SA | 1,200,000 | | 125,904,096 |
Financiere Marc de Lacharriere SA (Fimalac) | 1,401,759 | | 130,611,979 |
Flamel Technologies SA sponsored ADR (a) | 74,000 | | 1,836,680 |
Groupe Danone | 500,000 | | 73,265,360 |
Ipsos SA (f) | 2,226,664 | | 84,893,943 |
L'Oreal SA | 1,600,000 | | 155,618,689 |
Lagardere S.C.A. (Reg.) | 1,550,000 | | 111,483,967 |
Louis Vuitton Moet Hennessy (LVMH) | 1,500,000 | | 156,327,091 |
Neopost SA (f) | 1,650,000 | | 201,760,549 |
Neuf Cegetel | 39,800 | | 1,201,437 |
Pernod Ricard SA | 1,100,000 | | 220,293,877 |
Pinault Printemps-Redoute SA | 200,000 | | 29,842,232 |
Renault SA | 3,805,544 | | 445,180,378 |
Rhodia SA | 7,439,300 | | 20,510,329 |
Schneider Electric SA | 1,300,000 | | 135,068,649 |
Societe Generale Series A | 858,920 | | 142,741,579 |
Veolia Environnement | 1,831,300 | | 112,128,500 |
Vinci SA | 3,100,000 | | 349,191,131 |
TOTAL FRANCE | | 3,908,527,591 |
Germany - 7.0% |
Adidas-Salomon AG | 23,800 | | 1,192,653 |
|
| Shares | | Value (Note 1) |
Allianz AG: | | | |
(Reg.) | 16,160 | | $ 3,004,144 |
sponsored ADR | 17,700,000 | | 329,043,000 |
BASF AG sponsored ADR | 20,000 | | 1,759,600 |
Bayer AG | 8,053,310 | | 404,195,629 |
Bayerische Motoren Werke AG (BMW) | 1,503,500 | | 86,358,033 |
cash.life AG (a) | 200,145 | | 6,767,270 |
Celesio AG | 1,800,000 | | 92,819,808 |
Continental AG | 1,330,930 | | 148,848,774 |
DaimlerChrysler AG | 1,000,000 | | 56,930,000 |
Deutsche Postbank AG | 1,000,000 | | 74,388,592 |
E.ON AG | 221,380 | | 26,651,938 |
E.ON AG sponsored ADR | 8,500,000 | | 341,105,000 |
Fresenius AG | 600,000 | | 108,335,727 |
Fresenius Medical Care AG sponsored ADR | 59,000 | | 2,618,420 |
GFK AG | 1,600,000 | | 70,028,410 |
K&S AG | 13,700 | | 1,296,637 |
KarstadtQuelle AG (a)(e) | 3,500,000 | | 82,200,160 |
Linde AG | 2,770,557 | | 274,632,084 |
Merck KGaA | 12,600 | | 1,328,426 |
MG Technologies AG | 1,410,092 | | 25,323,769 |
MPC Muenchmeyer Petersen Capital AG | 236,029 | | 20,727,198 |
MTU Aero Engines Holding AG | 1,250,000 | | 51,295,325 |
Muenchener Rueckversicherungs-Gesellschaft AG (Reg.) | 900,000 | | 146,099,297 |
Praktiker Bau- und Heimwerkermaerkte Holding AG | 800,000 | | 25,476,944 |
Puma AG | 250,000 | | 88,655,553 |
RWE AG | 2,330,020 | | 230,279,727 |
SAP AG sponsored ADR | 4,600,000 | | 228,344,000 |
Techem AG (f) | 2,000,000 | | 127,767,640 |
Volkswagen AG | 300,000 | | 29,599,716 |
TOTAL GERMANY | | 3,087,073,474 |
Greece - 0.0% |
Hellenic Telecommunication Organization SA (OTE) (a) | 72,000 | | 1,865,586 |
Hong Kong - 0.8% |
China Unicom Ltd. sponsored ADR | 160,000 | | 1,761,600 |
Cosco Pacific Ltd. | 21,416,000 | | 44,224,266 |
Esprit Holdings Ltd. | 11,274,000 | | 109,156,534 |
Melco International Development Ltd. | 27,000,000 | | 66,170,344 |
Shun Tak Holdings Ltd. | 27,000,000 | | 35,688,937 |
Techtronic Industries Co. Ltd. | 45,213,000 | | 64,065,121 |
Television Broadcasts Ltd. | 5,000,000 | | 28,673,559 |
TOTAL HONG KONG | | 349,740,361 |
India - 2.1% |
Bajaj Auto Ltd. | 1,362,846 | | 83,372,681 |
Bharat Forge Ltd. | 1,250,000 | | 9,984,417 |
Bharti Airtel Ltd. (a) | 2,999,845 | | 38,535,187 |
Infosys Technologies Ltd. | 4,951,383 | | 230,980,035 |
Common Stocks - continued |
| Shares | | Value (Note 1) |
India - continued |
Reliance Industries Ltd. | 7,000,000 | | $ 191,050,759 |
Satyam Computer Services Ltd. | 15,000,000 | | 146,861,088 |
Satyam Computer Services Ltd. sponsored ADR | 130,000 | | 2,874,300 |
State Bank of India | 6,814,228 | | 200,279,447 |
Wipro Ltd. sponsored ADR | 120,000 | | 1,747,200 |
TOTAL INDIA | | 905,685,114 |
Indonesia - 0.0% |
PT Telkomunikasi Indonesia Tbk sponsored ADR | 50,000 | | 1,828,000 |
Ireland - 1.1% |
Allied Irish Banks PLC | 1,000,000 | | 27,320,000 |
CRH PLC | 4,500,000 | | 159,045,823 |
IAWS Group PLC (Ireland) | 4,000,000 | | 88,071,600 |
Ryanair Holdings PLC sponsored ADR (a) | 3,325,000 | | 222,176,500 |
TOTAL IRELAND | | 496,613,923 |
Italy - 2.8% |
Banca Intesa Spa (e) | 36,000,000 | | 246,110,343 |
Banca Popolare di Milano | 121,900 | | 1,803,480 |
Enel Spa ADR ADR | 37,000 | | 1,773,040 |
ENI Spa | 105,600 | | 3,205,488 |
ENI Spa sponsored ADR (e) | 500,000 | | 30,355,000 |
Fiat Spa (a)(e) | 26,102,400 | | 461,042,078 |
Impregilo Spa (a) | 279,000 | | 1,241,775 |
Lottomatica Spa | 600,000 | | 21,903,024 |
Mediobanca Spa | 53,700 | | 1,248,025 |
San Paolo IMI Spa | 153,600 | | 3,277,056 |
Tod's Spa | 200,000 | | 17,343,723 |
Unicredito Italiano Spa | 55,499,500 | | 460,173,795 |
TOTAL ITALY | | 1,249,476,827 |
Japan - 15.3% |
Aeon Co. Ltd. | 8,200,000 | | 193,151,514 |
Canon, Inc. sponsored ADR | 7,500,000 | | 400,425,000 |
Chugai Pharmaceutical Co. Ltd. | 7,234,000 | | 148,440,499 |
Credit Saison Co. Ltd. | 2,170,000 | | 78,480,681 |
Daiwa Securities Group, Inc. | 14,949,000 | | 169,607,763 |
DCM Japan Holdings Co. Ltd. (e) | 1,100,000 | | 12,602,600 |
East Japan Railway Co. | 24,000 | | 167,852,265 |
Fanuc Ltd. | 2,500,000 | | 216,954,524 |
Hirose Electric Co. Ltd. | 300,000 | | 40,013,682 |
Honda Motor Co. Ltd. sponsored ADR | 2,250,000 | | 79,492,500 |
Hoya Corp. | 7,500,000 | | 289,842,695 |
Ibiden Co. Ltd. | 2,000,000 | | 104,822,166 |
Japan Tobacco, Inc. | 80,000 | | 348,837,226 |
JSR Corp. | 6,750,000 | | 169,673,401 |
Keyence Corp. | 800,000 | | 177,154,591 |
Komatsu Ltd. | 1,000,000 | | 18,040,357 |
Kuraray Co. Ltd. | 237,000 | | 2,682,866 |
|
| Shares | | Value (Note 1) |
Leopalace21 Corp. | 250,000 | | $ 9,404,925 |
Matsushita Electric Industrial Co. Ltd. | 4,000,000 | | 83,200,004 |
Mitsubishi Estate Co. Ltd. | 3,000,000 | | 71,819,429 |
Mitsubishi UFJ Financial Group, Inc. | 18,200 | | 232,050,011 |
Mitsui & Co. Ltd. | 8,000,000 | | 109,233,931 |
Mitsui Fudosan Co. Ltd. | 4,000,000 | | 98,495,217 |
Mitsui Trust Holdings, Inc. | 4,000,000 | | 47,093,025 |
Mizuho Financial Group, Inc. | 60,000 | | 467,339,283 |
Nintendo Co. Ltd. | 1,700,000 | | 347,674,435 |
Nippon Electric Glass Co. Ltd. | 2,500,000 | | 53,864,572 |
Nitto Denko Corp. | 4,000,000 | | 228,112,186 |
ORIX Corp. | 2,083,670 | | 587,012,053 |
Shin-Etsu Chemical Co. Ltd. | 5,100,000 | | 334,447,690 |
Sony Corp. | 1,500,000 | | 61,470,003 |
Stanley Electric Co. Ltd. | 1,500,000 | | 29,753,763 |
Sumco Corp. | 1,200,000 | | 85,362,521 |
Sumitomo Metal Industries Ltd. | 5,999,900 | | 22,571,444 |
Sumitomo Mitsui Financial Group, Inc. | 34,550 | | 378,112,193 |
Sumitomo Trust & Banking Co. Ltd. | 4,000,000 | | 43,023,258 |
T&D Holdings, Inc. | 2,800,000 | | 204,685,372 |
Tokuyama Corp. | 3,000,000 | | 37,756,500 |
Toyota Motor Corp. sponsored ADR | 4,700,000 | | 554,600,000 |
TOTAL JAPAN | | 6,705,156,145 |
Korea (South) - 1.9% |
Amorepacific Corp. (a) | 190,000 | | 98,402,716 |
Kookmin Bank sponsored ADR | 2,700,000 | | 214,272,000 |
Korea Exchange Bank (a) | 4,120,310 | | 54,879,138 |
Korean Reinsurance Co. | 1,973,460 | | 22,305,481 |
LG Household & Health Care Ltd. | 469,530 | | 43,352,711 |
Macquarie Korea Infrastructure Fund | 6,700,000 | | 45,508,072 |
Samsung Electronics Co. Ltd. | 199,500 | | 129,365,292 |
Shinhan Financial Group Co. Ltd. | 3,845,010 | | 177,304,973 |
Woongjin Coway Co. Ltd. | 2,000,000 | | 52,533,805 |
TOTAL KOREA (SOUTH) | | 837,924,188 |
Luxembourg - 0.2% |
GAGFAH SA | 188,500 | | 5,471,276 |
SES Global SA FDR (France) | 6,554,918 | | 100,484,035 |
TOTAL LUXEMBOURG | | 105,955,311 |
Mexico - 1.1% |
America Movil SA de CV Series L sponsored ADR | 4,742,000 | | 203,289,540 |
Cemex SA de CV sponsored ADR | 3,400,000 | | 104,516,000 |
Empresas ICA Sociedad Controladora SA de CV sponsored ADR (a)(e) | 59,300 | | 2,439,602 |
Fomento Economico Mexicano SA de CV sponsored ADR | 1,700,000 | | 164,373,000 |
Common Stocks - continued |
| Shares | | Value (Note 1) |
Mexico - continued |
Grupo Aeroportuario del Pacifico SA de CV sponsored ADR | 400,000 | | $ 15,096,000 |
Grupo Televisa SA de CV (CPO) sponsored ADR | 121,000 | | 2,986,280 |
TOTAL MEXICO | | 492,700,422 |
Netherlands - 3.6% |
Arcadis NV (NY Shares) | 58,000 | | 2,801,400 |
ASML Holding NV (NY Shares) (a) | 111,000 | | 2,535,240 |
Chicago Bridge & Iron Co. NV (NY Shares) | 2,000,000 | | 49,120,000 |
Fugro NV (Certificaten Van Aandelen) unit | 1,300,000 | | 56,184,575 |
ING Groep NV: | | | |
(Certificaten Van Aandelen) | 49,500 | | 2,194,335 |
sponsored ADR | 9,800,000 | | 434,434,000 |
Koninklijke KPN NV | 7,000,000 | | 93,547,356 |
Koninklijke KPN NV sponsored ADR | 200,000 | | 2,688,000 |
Koninklijke Numico NV | 6,024,612 | | 269,374,212 |
Koninklijke Philips Electronics NV
(NY Shares) | 4,000,000 | | 139,320,000 |
Mittal Steel Co. NV Class A
(NY Shares) | 2,200,000 | | 94,050,000 |
Nutreco Holding NV | 38,900 | | 2,318,250 |
OPG Groep NV (A Shares)(Certificaten Van Aandelen) unit | 523,600 | | 53,699,756 |
Reed Elsevier NV | 118,200 | | 2,032,225 |
Reed Elsevier NV sponsored ADR (e) | 11,000,000 | | 374,000,000 |
Royal DSM NV | 31,200 | | 1,422,104 |
TOTAL NETHERLANDS | | 1,579,721,453 |
Netherlands Antilles - 0.4% |
Schlumberger Ltd. (NY Shares) | 3,050,000 | | 192,394,000 |
Norway - 1.0% |
DnB Nor ASA | 18,500,000 | | 242,266,622 |
Norsk Hydro ASA sponsored ADR | 77,000 | | 1,782,550 |
Telenor ASA | 11,000,000 | | 173,752,409 |
Telenor ASA sponsored ADR | 66,600 | | 3,174,822 |
TOTAL NORWAY | | 420,976,403 |
Papua New Guinea - 0.0% |
Lihir Gold Ltd. (a) | 3,000,000 | | 6,386,737 |
Portugal - 0.6% |
Brisa Auto-Estradas de Portugal SA (e) | 3,000,000 | | 33,160,872 |
Energias de Portugal SA | 40,000,000 | | 179,717,121 |
Portugal Telecom SGPS SA sponsored ADR | 4,500,000 | | 56,205,000 |
TOTAL PORTUGAL | | 269,082,993 |
Russia - 0.5% |
Novatek JSC GDR (g) | 1,500,000 | | 87,300,000 |
OAO Gazprom sponsored ADR | 2,725,000 | | 116,085,000 |
TOTAL RUSSIA | | 203,385,000 |
|
| Shares | | Value (Note 1) |
South Africa - 0.6% |
African Bank Investments Ltd. | 7,000,000 | | $ 26,123,020 |
DRDGOLD Ltd. sponsored ADR (a) | 5,000,000 | | 6,450,000 |
FirstRand Ltd. | 15,000,000 | | 39,239,510 |
Gold Fields Ltd. sponsored ADR | 1,800,000 | | 30,168,000 |
Sasol Ltd. | 2,500,000 | | 85,796,125 |
Steinhoff International Holdings Ltd. | 19,469,200 | | 63,432,225 |
TOTAL SOUTH AFRICA | | 251,208,880 |
Spain - 3.9% |
Actividades de Construccion y Servicios SA (ACS) | 4,400,000 | | 220,883,574 |
Antena 3 Television SA (e) | 1,999,962 | | 43,345,721 |
Banco Bilbao Vizcaya Argentaria SA | 112,100 | | 2,712,820 |
Banco Bilbao Vizcaya Argentaria SA sponsored ADR (e) | 25,000,000 | | 605,000,000 |
Banco Santander Central Hispano SA | 99,400 | | 1,720,414 |
Compania de Distribucion Integral Logista SA | 503,606 | | 28,476,160 |
Enagas SA | 4,000,000 | | 97,006,400 |
Fomento Construcciones y Contratas SA (FOCSA) | 800,000 | | 69,742,496 |
Gestevision Telecinco SA | 3,500,000 | | 91,983,766 |
Inditex SA | 3,500,000 | | 167,348,805 |
Red Electrica de Espana SA | 1,457,500 | | 56,573,335 |
Telefonica SA | 5,000,000 | | 96,166,667 |
Telefonica SA sponsored ADR | 3,100,000 | | 178,870,000 |
Union Fenosa SA | 1,254,138 | | 63,711,114 |
TOTAL SPAIN | | 1,723,541,272 |
Sweden - 2.1% |
Assa Abloy AB (B Shares) | 12,000,000 | | 230,948,161 |
Atlas Copco AB (A Shares) | 7,500,000 | | 219,109,991 |
Modern Times Group AB (MTG)
(B Shares) | 700,800 | | 40,365,086 |
Skandinaviska Enskilda Banken AB
(A Shares) | 2,522,000 | | 70,536,664 |
Svenska Cellulosa AB (SCA) (B Shares) | 2,500,000 | | 114,747,175 |
Telefonaktiebolaget LM Ericsson: | | | |
(B Shares) | 505,000 | | 1,909,910 |
(B Shares) sponsored ADR (e) | 6,900,000 | | 260,958,000 |
Volvo AB sponsored ADR | 29,000 | | 1,808,730 |
TOTAL SWEDEN | | 940,383,717 |
Switzerland - 10.1% |
ABB Ltd. (Reg.) | 23,500,000 | | 349,435,357 |
Actelion Ltd. (Reg.) (a) | 800,000 | | 134,710,445 |
Adecco SA sponsored ADR (e) | 5,000,000 | | 77,400,000 |
Alcon, Inc. | 100,000 | | 10,608,000 |
Compagnie Financiere Richemont unit | 3,000,000 | | 148,414,580 |
Julius Baer Holding AG (Bearer) | 500,000 | | 52,807,137 |
Kuehne & Nagel International AG | 600,000 | | 41,232,970 |
Lonza Group AG | 1,022,504 | | 78,897,548 |
Nestle SA (Reg.) | 1,307,256 | | 446,556,926 |
Common Stocks - continued |
| Shares | | Value (Note 1) |
Switzerland - continued |
Nobel Biocare Holding AG (Switzerland) | 360,000 | | $ 98,525,097 |
Novartis AG: | | | |
(Reg.) | 66,107 | | 4,014,678 |
sponsored ADR | 12,000,000 | | 728,760,000 |
Roche Holding AG (participation certificate) | 4,500,000 | | 787,405,060 |
Schindler Holding AG (Reg.) | 1,400,000 | | 80,456,537 |
Societe Generale de Surveillance Holding SA (SGS) (Reg.) | 185,000 | | 196,427,280 |
Swiss Life Holding | 306,642 | | 72,338,084 |
Swiss Reinsurance Co. (Reg.) | 2,600,352 | | 213,186,436 |
Syngenta AG sponsored ADR | 6,000,000 | | 193,380,000 |
Tecan Group AG (f) | 800,000 | | 42,888,719 |
The Swatch Group AG (Reg.) | 3,900,000 | | 155,793,112 |
UBS AG: | | | |
(NY Shares) | 6,800,000 | | 406,912,000 |
(Reg.) | 44,648 | | 2,671,736 |
Zurich Financial Services AG (Reg.) | 400,000 | | 98,862,677 |
TOTAL SWITZERLAND | | 4,421,684,379 |
Taiwan - 0.1% |
Catcher Technology Co. Ltd. | 4,080,727 | | 35,302,747 |
Turkey - 0.2% |
Acibadem Saglik Hizmetleri AS | 2,434,000 | | 26,724,309 |
Finansbank AS | 11,528,946 | | 45,490,780 |
Turkcell Iletisim Hizmet AS sponsored ADR | 123,000 | | 1,776,120 |
TOTAL TURKEY | | 73,991,209 |
United Kingdom - 11.8% |
Anglo American PLC: | | | |
ADR | 78,000 | | 1,769,040 |
(United Kingdom) | 4,000,000 | | 180,373,199 |
AstraZeneca PLC sponsored ADR | 3,250,000 | | 190,775,000 |
BAE Systems PLC | 21,678,000 | | 173,466,542 |
BG Group PLC | 8,000,000 | | 106,133,299 |
BP PLC | 322,500 | | 3,606,625 |
BP PLC sponsored ADR | 3,200,000 | | 214,720,000 |
Brambles Industries PLC | 7,500,000 | | 70,601,343 |
British American Tobacco PLC | 97,000 | | 2,667,500 |
British American Tobacco PLC sponsored ADR | 4,800,000 | | 264,000,000 |
Capita Group PLC | 24,000,000 | | 246,754,198 |
Experian Group Ltd. | 9,000,000 | | 99,056,474 |
Filtrona PLC | 5,000,000 | | 25,846,625 |
GlaxoSmithKline PLC | 56,200 | | 1,496,325 |
HSBC Holdings PLC sponsored ADR (e) | 5,000,000 | | 477,350,000 |
Imperial Tobacco Group PLC | 74,774 | | 2,648,665 |
Informa PLC | 14,000,000 | | 145,809,299 |
International Power PLC | 5,395,200 | | 34,450,274 |
Intertek Group PLC | 1,000,000 | | 15,698,725 |
J Sainsbury PLC | 261,100 | | 1,951,104 |
|
| Shares | | Value (Note 1) |
Marks & Spencer Group PLC | 1,750,000 | | $ 21,914,790 |
Meggitt PLC | 8,720,000 | | 55,638,723 |
National Grid PLC | 219,700 | | 2,807,821 |
Old Mutual PLC | 30,619,329 | | 98,998,796 |
Pearson PLC | 10,000,000 | | 147,545,124 |
Prudential PLC | 3,000,000 | | 36,767,062 |
Punch Taverns Ltd. | 4,500,000 | | 88,326,787 |
Reckitt Benckiser PLC | 10,437,400 | | 454,132,053 |
Reuters Group PLC | 12,000,000 | | 102,375,524 |
Rolls-Royce Group PLC | 20,322,622 | | 182,100,472 |
Royal Bank of Scotland Group PLC | 7,850,000 | | 279,711,983 |
Smiths Group PLC | 9,500,000 | | 171,427,024 |
Standard Chartered PLC (United Kingdom) | 7,729,300 | | 217,468,685 |
Tesco PLC | 65,342,100 | | 490,458,615 |
Vodafone Group PLC sponsored ADR | 10,500,000 | | 271,425,000 |
Xstrata PLC | 7,000,000 | | 299,095,998 |
TOTAL UNITED KINGDOM | | 5,179,368,694 |
United States of America - 3.9% |
AFLAC, Inc. | 500,000 | | 22,460,000 |
Allegheny Technologies, Inc. | 1,050,000 | | 82,666,500 |
AT&T, Inc. | 1,200,000 | | 41,100,000 |
Avon Products, Inc. | 1,000,000 | | 30,410,000 |
Corning, Inc. (a) | 4,000,000 | | 81,720,000 |
Delphi Corp. (a) | 5,000,000 | | 14,500,000 |
Equitable Resources, Inc. | 1,000,000 | | 40,520,000 |
Flowserve Corp. (a) | 2,050,000 | | 108,650,000 |
Genentech, Inc. (a) | 500,000 | | 41,650,000 |
Halliburton Co. | 500,000 | | 16,175,000 |
Merck & Co., Inc. | 3,000,000 | | 136,260,000 |
Newmont Mining Corp. | 2,700,000 | | 122,229,000 |
NII Holdings, Inc. (a) | 350,000 | | 22,760,500 |
NTL, Inc. | 3,750,000 | | 101,362,500 |
RTI International Metals, Inc. (a)(f) | 1,200,000 | | 73,584,000 |
Sprint Nextel Corp. | 1,500,000 | | 28,035,000 |
Synthes, Inc. | 2,899,874 | | 328,876,921 |
Titanium Metals Corp. (a) | 3,500,000 | | 103,180,000 |
Transocean, Inc. (a) | 1,400,000 | | 101,556,000 |
TXU Corp. | 1,000,000 | | 63,130,000 |
UnitedHealth Group, Inc. | 2,650,000 | | 129,267,000 |
Weatherford International Ltd. (a) | 1,000,000 | | 41,080,000 |
TOTAL UNITED STATES OF AMERICA | | 1,731,172,421 |
TOTAL COMMON STOCKS (Cost $29,187,185,141) | 40,448,471,550 |
Preferred Stocks - 0.4% |
| | | |
Convertible Preferred Stocks - 0.0% |
Canada - 0.0% |
MetroPhotonics, Inc. Series 2 (a)(h) | 198,000 | | 2 |
Preferred Stocks - continued |
| Shares | | Value (Note 1) |
Nonconvertible Preferred Stocks - 0.4% |
Germany - 0.1% |
Porsche AG (non-vtg.) | 20,000 | | $ 23,319,828 |
Italy - 0.2% |
Banca Intesa Spa (Risp) | 14,049,610 | | 93,143,598 |
United Kingdom - 0.1% |
European Capital Ltd. preference shares (a)(h) | 4,900,000 | | 62,543,600 |
Rolls-Royce Group PLC Series B | 745,840,227 | | 1,458,257 |
TOTAL UNITED KINGDOM | | 64,001,857 |
TOTAL NONCONVERTIBLE PREFERRED STOCKS | | 180,465,283 |
TOTAL PREFERRED STOCKS (Cost $141,273,804) | 180,465,285 |
Government Obligations - 1.0% |
| Principal
Amount (d) | | |
Germany - 0.4% |
German Federal Republic 3.1431% 12/13/06 | EUR | 157,500,000 | | 200,269,075 |
Japan - 0.6% |
Japan Government: | | | | |
0.2% 3/20/08 | JPY | 5,860,000,000 | | 49,813,510 |
0.3% 1/15/08 | JPY | 11,400,000,000 | | 97,128,083 |
0.8% 8/15/08 | JPY | 11,600,000,000 | | 99,395,422 |
TOTAL JAPAN | | 246,337,015 |
TOTAL GOVERNMENT OBLIGATIONS (Cost $449,744,410) | 446,606,090 |
Money Market Funds - 8.7% |
| Shares | | |
Fidelity Cash Central Fund, 5.34% (b) | 2,817,902,177 | | 2,817,902,177 |
Fidelity Securities Lending Cash Central Fund, 5.35% (b)(c) | 987,267,000 | | 987,267,000 |
TOTAL MONEY MARKET FUNDS (Cost $3,805,169,177) | 3,805,169,177 |
TOTAL INVESTMENT
PORTFOLIO - 102.1% (Cost $33,583,372,532) | | 44,880,712,102 |
NET OTHER ASSETS - (2.1)% | | (915,522,984) |
NET ASSETS - 100% | $ 43,965,189,118 |
Forward Foreign Currency Contracts |
| Settlement Dates | | Value
(Note 1) | | Unrealized Appreciation/
(Depreciation) |
Contracts to Buy |
39,028,959 AUD | Nov. 2006 | | $ 30,190,851 | | $ 190,851 |
43,617,700 CHF | Nov. 2006 | | 35,169,722 | | 169,722 |
141,176,471 EUR | Nov. 2006 | | 180,509,506 | | 509,506 |
68,501,813 GBP | Nov. 2006 | | 130,702,724 | | 702,724 |
14,632,375,000 JPY | Nov. 2006 | | 125,656,106 | | 656,106 |
| | $ 502,228,909 | | $ 2,228,909 |
|
(Payable Amount $500,000,000) |
|
The value of contracts to buy as a percentage of net assets - 1.2% |
Currency Abbreviations |
AUD | - | Australian dollar |
CHF | - | Swiss franc |
EUR | - | European Monetary Unit |
GBP | - | British pound |
JPY | - | Japanese yen |
Legend |
(a) Non-income producing |
(b) Affiliated fund that is available only to investment companies and other accounts managed by Fidelity Investments. The rate quoted is the annualized seven-day yield of the fund at period end. A complete unaudited listing of the fund's holdings as of its most recent quarter end is available upon request. |
(c) Investment made with cash collateral received from securities on loan. |
(d) Principal amount is stated in United States dollars unless otherwise noted. |
(e) Security or a portion of the security is on loan at period end. |
(f) Affiliated company |
(g) Security exempt from registration under Rule 144A of the Securities Act of 1933. These securities may be resold in transactions exempt from registration, normally to qualified institutional buyers. At the end of the period, the value of these securities amounted to $87,300,000 or 0.2% of net assets. |
(h) Restricted securities - Investment in securities not registered under the Securities Act of 1933 (excluding 144A issues). At the end of the period, the value of restricted securities (excluding 144A issues) amounted to $64,048,102 or 0.1% of net assets. |
Additional information on each holding is as follows: |
Security | Acquisition Date | Acquisition Cost |
European Capital Ltd. preference shares | 8/22/05 - 8/29/05 | $ 59,927,350 |
MetroPhotonics, Inc. Series 2 | 9/29/00 | $ 1,980,000 |
OZ Optics Ltd. unit | 8/18/00 | $ 1,505,520 |
Affiliated Central Funds |
Information regarding fiscal year to date income earned by the Fund from investments in Fidelity Central Funds is as follows: |
Fund | Income earned |
Fidelity Cash Central Fund | $ 85,085,531 |
Fidelity Securities Lending Cash Central Fund | 26,239,074 |
Total | $ 111,324,605 |
Other Affiliated Issuers |
An affiliated company is a company in which the fund has ownership of at least 5% of the voting securities. Fiscal year to date transactions with companies which are or were affiliates are as follows: |
Affiliates | Value, beginning
of period | Purchases | Sales
Proceeds | Dividend
Income | Value, end
of period |
Apex Silver Mines Ltd. | $ 40,981,000 | $ 16,279,278 | $ 29,220,807 | $ - | $ - |
Beijing Media Corp. Ltd. (H Shares) | 4,450,407 | - | 4,125,101 | - | - |
BYD Co. Ltd. (H Shares) | 14,060,706 | - | 6,557,180 | - | - |
Clear Media Ltd. | 22,908,599 | - | 357,388 | - | 37,841,382 |
Filtrona PLC | 57,309,467 | - | 36,254,692 | 1,238,043 | - |
Ipsos SA | 66,063,034 | - | - | 605,274 | 84,893,943 |
Neopost SA | 156,956,234 | 2,228,229 | - | 5,391,911 | 201,760,549 |
RTI International Metals, Inc. | - | 61,637,676 | - | - | 73,584,000 |
Tecan Group AG | 29,756,041 | - | - | 246,595 | 42,888,719 |
Techem AG | - | 86,858,636 | - | 1,023,485 | 127,767,640 |
Total | $ 392,485,488 | $ 167,003,819 | $ 76,515,168 | $ 8,505,308 | $ 568,736,233 |
Annual Report
See accompanying notes which are an integral part of the financial statements.
Diversified International
Financial Statements
Statement of Assets and Liabilities
October 31, 2006 |
| | |
Assets | | |
Investment in securities, at value (including securities loaned of $949,223,451) - See accompanying schedule: Unaffiliated issuers (cost $29,460,173,880) | $ 40,506,806,692 | |
Fidelity Central Funds (cost $3,805,169,177) | 3,805,169,177 | |
Other affiliated issuers (cost $318,029,475) | 568,736,233 | |
Total Investments (cost $33,583,372,532) | | $ 44,880,712,102 |
Foreign currency held at value (cost $19,172,733) | | 19,177,955 |
Receivable for investments sold | | 221,307,216 |
Unrealized appreciation on foreign currency contracts | | 2,228,909 |
Receivable for fund shares sold | | 47,830,971 |
Dividends receivable | | 35,901,275 |
Interest receivable | | 13,437,544 |
Other receivables | | 3,853,281 |
Total assets | | 45,224,449,253 |
| | |
Liabilities | | |
Payable to custodian bank | $ 1,163,650 | |
Payable for investments purchased | 176,499,348 | |
Payable for fund shares redeemed | 35,219,789 | |
Accrued management fee | 24,204,692 | |
Other affiliated payables | 8,041,284 | |
Other payables and accrued expenses | 26,864,372 | |
Collateral on securities loaned, at value | 987,267,000 | |
Total liabilities | | 1,259,260,135 |
| | |
Net Assets | | $ 43,965,189,118 |
Net Assets consist of: | | |
Paid in capital | | $ 29,337,811,126 |
Undistributed net investment income | | 447,691,136 |
Accumulated undistributed net realized gain (loss) on investments and foreign currency transactions | | 2,906,065,501 |
Net unrealized appreciation (depreciation) on investments and assets and liabilities in foreign currencies | | 11,273,621,355 |
Net Assets, for 1,169,964,929 shares outstanding | | $ 43,965,189,118 |
Net Asset Value, offering price and redemption price per share ($43,965,189,118 ÷ 1,169,964,929 shares) | | $ 37.58 |
Statement of Operations
Year ended October 31, 2006 |
| | |
Investment Income | | |
Dividends (including $8,505,308 received from other affiliated issuers) | | $ 826,196,081 |
Interest | | 3,861,753 |
Income from Fidelity Central Funds (including $26,239,074 from security lending) | | 111,324,605 |
| | 941,382,439 |
Less foreign taxes withheld | | (68,724,407) |
Total income | | 872,658,032 |
| | |
Expenses | | |
Management fee
Basic fee | $ 273,502,785 | |
Performance adjustment | 11,677,804 | |
Transfer agent fees | 84,089,542 | |
Accounting and security lending fees | 2,699,065 | |
Custodian fees and expenses | 9,922,131 | |
Independent trustees' compensation | 143,512 | |
Appreciation in deferred trustee compensation account | 21,608 | |
Registration fees | 1,239,654 | |
Audit | 280,382 | |
Legal | 525,656 | |
Interest | 1,649 | |
Miscellaneous | 299,385 | |
Total expenses before reductions | 384,403,173 | |
Expense reductions | (14,735,378) | 369,667,795 |
Net investment income (loss) | | 502,990,237 |
Realized and Unrealized Gain (Loss) Net realized gain (loss) on: | | |
Investment securities: | | |
Unaffiliated issuers (net of foreign taxes of $1,682,230) | 3,089,767,064 | |
Other affiliated issuers | (7,180,722) | |
Foreign currency transactions | 3,291,697 | |
Futures contracts | 50,214,231 | |
Total net realized gain (loss) | | 3,136,092,270 |
Change in net unrealized appreciation (depreciation) on: Investment securities (net of increase in deferred foreign taxes of $20,424,459) | 4,497,546,473 | |
Assets and liabilities in foreign currencies | 1,844,657 | |
Futures contracts | (9,062,186) | |
Total change in net unrealized appreciation (depreciation) | | 4,490,328,944 |
Net gain (loss) | | 7,626,421,214 |
Net increase (decrease) in net assets resulting from operations | | $ 8,129,411,451 |
Annual Report
See accompanying notes which are an integral part of the financial statements.
Diversified International
Financial Statements - continued
Statement of Changes in Net Assets
| Year ended
October 31,
2006 | Year ended
October 31,
2005 |
Increase (Decrease) in Net Assets | | |
Operations | | |
Net investment income (loss) | $ 502,990,237 | $ 262,281,673 |
Net realized gain (loss) | 3,136,092,270 | 833,286,256 |
Change in net unrealized appreciation (depreciation) | 4,490,328,944 | 3,068,430,486 |
Net increase (decrease) in net assets resulting from operations | 8,129,411,451 | 4,163,998,415 |
Distributions to shareholders from net investment income | (273,726,595) | (119,489,325) |
Distributions to shareholders from net realized gain | (713,589,701) | (47,795,646) |
Total distributions | (987,316,296) | (167,284,971) |
Share transactions
Proceeds from sales of shares | 13,118,280,110 | 10,151,395,231 |
Reinvestment of distributions | 945,934,875 | 158,992,781 |
Cost of shares redeemed | (6,879,921,320) | (4,573,060,649) |
Net increase (decrease) in net assets resulting from share transactions | 7,184,293,665 | 5,737,327,363 |
Redemption fees | 1,607,319 | 1,089,152 |
Total increase (decrease) in net assets | 14,327,996,139 | 9,735,129,959 |
| | |
Net Assets | | |
Beginning of period | 29,637,192,979 | 19,902,063,020 |
End of period (including undistributed net investment income of $447,691,136 and undistributed net investment income of $239,713,275, respectively) | $ 43,965,189,118 | $ 29,637,192,979 |
Other Information Shares | | |
Sold | 376,717,133 | 350,205,116 |
Issued in reinvestment of distributions | 29,746,334 | 5,838,883 |
Redeemed | (198,599,068) | (157,193,752) |
Net increase (decrease) | 207,864,399 | 198,850,247 |
Financial Highlights
Years ended October 31, | 2006 | 2005 | 2004 | 2003 | 2002 |
Selected Per-Share Data | | | | | |
Net asset value, beginning of period | $ 30.80 | $ 26.08 | $ 22.35 | $ 16.90 | $ 18.06 |
Income from Investment Operations | | | | | |
Net investment income (loss) B | .46 | .30 | .16 | .18 | .14 |
Net realized and unrealized gain (loss) | 7.33 | 4.63 | 3.87 | 5.40 | (1.29) |
Total from investment operations | 7.79 | 4.93 | 4.03 | 5.58 | (1.15) |
Distributions from net investment income | (.28) | (.15) | (.30) | (.13) | (.01) |
Distributions from net realized gain | (.73) | (.06) | - | - | - |
Total distributions | (1.01) | (.21) | (.30) | (.13) | (.01) |
Redemption fees added to paid in capital B | - F | - F | - F | - F | - F |
Net asset value, end of period | $ 37.58 | $ 30.80 | $ 26.08 | $ 22.35 | $ 16.90 |
Total Return A | 25.89% | 19.01% | 18.20% | 33.26% | (6.37)% |
Ratios to Average Net AssetsC, E | | | | | |
Expenses before reductions | 1.01% | 1.10% | 1.15% | 1.24% | 1.22% |
Expenses net of fee waivers, if any | 1.01% | 1.10% | 1.15% | 1.24% | 1.22% |
Expenses net of all reductions | .97% | 1.07% | 1.12% | 1.22% | 1.19% |
Net investment income (loss) | 1.32% | 1.02% | .66% | .96% | .77% |
Supplemental Data | | | | | |
Net assets, end of period (000 omitted) | $ 43,965,189 | $ 29,637,193 | $ 19,902,063 | $ 11,542,386 | $ 6,735,472 |
Portfolio turnover rate D | 59% | 41% | 55% | 51% | 55% |
A Total returns would have been lower had certain expenses not been reduced during the periods shown. B Calculated based on average shares outstanding during the period. C Fees and expenses of the underlying Fidelity Central Funds are not included in the Fund's expense ratio. The Fund indirectly bears its proportionate share of the expense of any underlying Fidelity Central Funds. D Amount does not include the portfolio activity of any underlying Fidelity Central Funds. E Expense ratios reflect operating expenses of the Fund. Expenses before reductions do not reflect amounts reimbursed by the investment adviser or reductions from brokerage service arrangements or other expense offset arrangements and do not represent the amount paid by the Fund during periods when reimbursements or reductions occur. Expenses net of fee waivers reflect expenses after reimbursement by the investment adviser but prior to reductions from brokerage service arrangements or other expense offset arrangements. Expenses net of all reductions represent the net expenses paid by the Fund. F Amount represents less than $.01 per share. |
Annual Report
See accompanying notes which are an integral part of the financial statements.
Aggressive International
Performance: The Bottom Line
Average annual total return reflects the change in the value of an investment, assuming reinvestment of the fund's dividend income and capital gains (the profits earned upon the sale of securities that have grown in value) and assuming a constant rate of performance each year. The $10,000 table and the fund's returns do not reflect the deduction of taxes that a shareholder would pay on fund distributions or the redemption of fund shares. During periods of reimbursement by Fidelity, a fund's total return will be greater than it would be had the reimbursement not occurred. How a fund did yesterday is no guarantee of how it will do tomorrow.
Average Annual Total Returns
Periods ended
October 31, 2006 | Past 1
year | Past 5
years | Past 10 years |
Fidelity Aggressive International Fund | 18.26% | 13.89% | 7.96% |
$10,000 Over 10 Years
Let's say hypothetically that $10,000 was invested in Fidelity Aggressive International Fund on October 31, 1996. The chart shows how the value of your investment would have changed, and also shows how the Morgan Stanley Capital International All Country World ex USA Index performed over the same period.
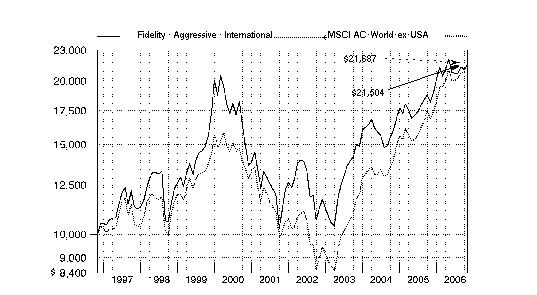
Annual Report
Aggressive International
Management's Discussion of Fund Performance
Comments from Michael Jenkins, Interim Lead Portfolio Manager of Fidelity® Aggressive International Fund for most of the period covered by this report
International equity markets as a whole outpaced their U.S. counterparts for the 12 months ending October 31, 2006 - partly as a result of favorable currency exchanges that boosted returns for U.S. investors. The Morgan Stanley Capital InternationalSM Europe, Australasia, Far East (MSCI® EAFE®) Index - a gauge of developed stock markets outside the United States and Canada - gained 27.72% during that time. European markets benefited from solid corporate profit growth and attractive dividends, which helped the MSCI Europe index advance 31.95%. Strong performing Latin American and Asian emerging markets drove the MSCI Emerging Markets index to a lofty 35.42% return. Japan was somewhat of an exception to the generally stellar foreign market performance after struggling in the middle part of the period. Still, its earlier gains helped the Tokyo Stock Exchange Stock Price Index (TOPIX) - a benchmark of the largest and better-established stocks traded on the Tokyo Stock Exchange - rise 12.47% overall. Natural-resources-rich Canada also struggled over the final six months as energy prices fell, but the S&P/TSX Composite Index managed a 12-month return of 28.21%.
The fund gained 18.26% during the past year, compared with the MSCI All Country World ex USA Index, which rose 28.58%. The fund underperformed its benchmark index almost entirely because of weak stock selection, especially in the materials and energy sectors, where investments in Japanese materials producer Nitto Denko and Canadian Natural Resources, an oil and natural gas company, yielded disappointing returns. The Nitto Denko position was sold by period end. The fund's large stake in French wine and spirits purveyor Pernod Ricard, whose stock price did not rise as much as the overall market, was the biggest drag on performance versus the index. Untimely trading in British telecommunications giant Vodafone also hurt results. On a regional basis, the fund's weakest picks were in Europe and the emerging markets, while a big stake in Japanese stocks helped. Also adding to performance was the fund's big overexposure to the information technology sector for most of the period, particularly among semiconductor equipment stocks, which helped offset some of the fund's overall shortfall relative to the index. Among the best performing stocks in this group were Japan's Tokyo Electron and Taiwan's Advanced Semiconductor, both of which were sold to lock in profits.
Note to shareholders: Darren Maupin became Portfolio Manager of the fund on October 2, 2006.
The views expressed above reflect those of the portfolio manager(s) only through the end of the period as stated on the cover of this report and do not necessarily represent the views of Fidelity or any other person in the Fidelity organization. Any such views are subject to change at any time based upon market or other conditions and Fidelity disclaims any responsibility to update such views. These views may not be relied on as investment advice and, because investment decisions for a Fidelity fund are based on numerous factors, may not be relied on as an indication of trading intent on behalf of any Fidelity fund.
Annual Report
Aggressive International
Investment Changes
Geographic Diversification (% of fund's net assets) |
As of October 31, 2006 |
| United States of America | 21.9% | |
| France | 12.8% | |
| Netherlands | 9.7% | |
| United Kingdom | 9.7% | |
| Canada | 9.3% | |
| Germany | 9.1% | |
| Italy | 5.3% | |
| Japan | 5.0% | |
| Luxembourg | 3.5% | |
| Other | 13.7% | |

Percentages are adjusted for the effect of futures contracts, if applicable. |
|
As of April 30, 2006 |
| Japan | 21.6% | |
| France | 14.9% | |
| Germany | 10.9% | |
| Switzerland | 9.5% | |
| United States of America | 9.1% | |
| South Africa | 4.6% | |
| Canada | 4.5% | |
| Korea (South) | 4.4% | |
| Italy | 4.1% | |
| Other | 16.4% | |

Percentages are adjusted for the effect of futures contracts, if applicable. |
Asset Allocation |
| % of fund's
net assets | % of fund's net assets
6 months ago |
Stocks | 93.2 | 96.0 |
Short-Term Investments and Net Other Assets | 6.8 | 4.0 |
Top Ten Stocks as of October 31, 2006 |
| % of fund's
net assets | % of fund's net assets
6 months ago |
Tesco PLC (United Kingdom, Food & Staples Retailing) | 3.8 | 0.0 |
Synthes, Inc. (United States of America, Health Care Equipment & Supplies) | 3.5 | 1.8 |
SES Global SA FDR (Luxembourg, Media) | 3.5 | 0.0 |
Sanofi-Aventis sponsored ADR (France, Pharmaceuticals) | 3.2 | 1.1 |
NTL, Inc. (United States of America, Media) | 3.1 | 1.4 |
GlobalSantaFe Corp. (Cayman Islands, Energy Equipment & Services) | 3.1 | 0.0 |
Newmont Mining Corp. (United States of America, Metals & Mining) | 3.1 | 0.0 |
Reed Elsevier NV (Netherlands, Media) | 3.0 | 0.0 |
Pearson PLC (United Kingdom, Media) | 3.0 | 0.0 |
Deere & Co. (United States of America, Machinery) | 3.0 | 0.0 |
| 32.3 | |
Market Sectors as of October 31, 2006 |
| % of fund's
net assets | % of fund's net assets
6 months ago |
Consumer Discretionary | 21.9 | 8.3 |
Materials | 14.6 | 5.1 |
Financials | 12.8 | 33.9 |
Energy | 11.9 | 11.5 |
Consumer Staples | 10.6 | 6.1 |
Industrials | 7.6 | 8.2 |
Health Care | 6.9 | 8.4 |
Information Technology | 4.4 | 10.0 |
Utilities | 2.5 | 2.4 |
Telecommunication Services | 0.0 | 2.1 |
Annual Report
Aggressive International
Investments October 31, 2006
Showing Percentage of Net Assets
Common Stocks - 93.2% |
| Shares | | Value (Note 1) |
Argentina - 1.8% |
Cresud S.A.C.I.F. y A. sponsored ADR | 58,437 | | $ 855,518 |
Inversiones y Representaciones SA sponsored GDR (a)(d) | 548,800 | | 7,886,256 |
TOTAL ARGENTINA | | 8,741,774 |
Austria - 2.2% |
Flughafen Wien AG | 114,200 | | 10,239,983 |
Canada - 9.3% |
Abitibi-Consolidated, Inc. | 1,726,200 | | 4,274,561 |
Aquiline Resources, Inc. (a) | 44,400 | | 187,859 |
Aquiline Resources, Inc. (a)(e) | 494,600 | | 1,883,414 |
Canadian Natural Resources Ltd. | 247,000 | | 12,859,885 |
Catalyst Paper Corp. (a) | 125,200 | | 360,216 |
NuVista Energy Ltd. (a) | 62,500 | | 815,593 |
ProEx Energy Ltd. (a) | 409,600 | | 4,961,974 |
Saskatchewan Wheat Pool, Inc. (a) | 367,800 | | 2,355,571 |
Suncor Energy, Inc. | 161,000 | | 12,369,171 |
Talisman Energy, Inc. | 255,800 | | 4,203,901 |
TOTAL CANADA | | 44,272,145 |
Cayman Islands - 3.1% |
GlobalSantaFe Corp. | 287,700 | | 14,931,630 |
Czech Republic - 0.0% |
Philip Morris CR AS | 100 | | 53,007 |
France - 12.8% |
Compagnie Generale de Geophysique SA (a)(d) | 39,300 | | 6,646,534 |
Icade SA | 106,800 | | 6,340,221 |
Neopost SA | 78,035 | | 9,542,051 |
Pernod Ricard SA | 56,400 | | 11,295,068 |
Renault SA | 101,800 | | 11,908,774 |
Sanofi-Aventis sponsored ADR | 352,600 | | 15,052,494 |
TOTAL FRANCE | | 60,785,142 |
Germany - 9.1% |
Bayer AG | 95,300 | | 4,783,107 |
E.ON AG | 99,500 | | 11,978,805 |
KarstadtQuelle AG (a)(d) | 404,900 | | 9,509,384 |
Lanxess AG (a) | 260,700 | | 11,916,045 |
Techem AG | 79,500 | | 5,078,764 |
TOTAL GERMANY | | 43,266,105 |
|
| Shares | | Value (Note 1) |
Italy - 5.3% |
Banca Intesa Spa | 1,747,900 | | $ 11,949,341 |
Fiat Spa (a)(d) | 750,200 | | 13,250,650 |
TOTAL ITALY | | 25,199,991 |
Japan - 5.0% |
Nintendo Co. Ltd. | 56,600 | | 11,575,514 |
ORIX Corp. | 42,890 | | 12,082,982 |
TOTAL JAPAN | | 23,658,496 |
Korea (South) - 0.9% |
Kookmin Bank sponsored ADR | 56,600 | | 4,491,776 |
Luxembourg - 3.5% |
SES Global SA FDR | 1,097,177 | | 16,805,241 |
Netherlands - 9.7% |
ING Groep NV (Certificaten Van Aandelen) | 108,500 | | 4,809,805 |
Koninklijke Numico NV | 144,800 | | 6,474,340 |
Koninklijke Philips Electronics NV | 269,100 | | 9,372,753 |
Nutreco Holding NV | 189,600 | | 11,299,234 |
Reed Elsevier NV | 841,000 | | 14,459,404 |
TOTAL NETHERLANDS | | 46,415,536 |
Philippines - 0.0% |
DMCI Holdings, Inc. | 96,000 | | 9,438 |
Semirara Mining Corp. | 144,000 | | 55,618 |
TOTAL PHILIPPINES | | 65,056 |
South Africa - 2.1% |
Gold Fields Ltd. sponsored ADR | 583,200 | | 9,774,432 |
Sweden - 1.1% |
Atlas Copco AB (A Shares) | 181,800 | | 5,311,226 |
Switzerland - 2.5% |
Actelion Ltd. (Reg.) (a) | 5,078 | | 855,075 |
Bucher Holding AG | 9,840 | | 996,536 |
Syngenta AG sponsored ADR | 309,500 | | 9,975,185 |
TOTAL SWITZERLAND | | 11,826,796 |
United Kingdom - 9.7% |
Benfield Group PLC | 2,051,600 | | 13,638,293 |
Pearson PLC | 977,000 | | 14,415,159 |
Tesco PLC | 2,383,700 | | 17,892,080 |
TOTAL UNITED KINGDOM | | 45,945,532 |
United States of America - 15.1% |
Deere & Co. | 165,700 | | 14,106,041 |
Monsanto Co. | 254,300 | | 11,245,146 |
Newmont Mining Corp. | 324,300 | | 14,681,061 |
NTL, Inc. | 555,000 | | 15,001,650 |
Synthes, Inc. | 149,305 | | 16,932,794 |
TOTAL UNITED STATES OF AMERICA | | 71,966,692 |
TOTAL COMMON STOCKS (Cost $415,962,882) | 443,750,560 |
Money Market Funds - 13.5% |
| Shares | | Value (Note 1) |
Fidelity Cash Central Fund, 5.34% (b) | 29,509,726 | | $ 29,509,726 |
Fidelity Securities Lending Cash Central Fund, 5.35% (b)(c) | 34,765,884 | | 34,765,884 |
TOTAL MONEY MARKET FUNDS (Cost $64,275,610) | 64,275,610 |
TOTAL INVESTMENT PORTFOLIO - 106.7% (Cost $480,238,492) | | 508,026,170 |
NET OTHER ASSETS - (6.7)% | | (31,879,046) |
NET ASSETS - 100% | $ 476,147,124 |
Legend |
(a) Non-income producing |
(b) Affiliated fund that is available only to investment companies and other accounts managed by Fidelity Investments. The rate quoted is the annualized seven-day yield of the fund at period end. A complete unaudited listing of the fund's holdings as of its most recent quarter end is available upon request. |
(c) Investment made with cash collateral received from securities on loan. |
(d) Security or a portion of the security is on loan at period end. |
(e) Restricted securities - Investment in securities not registered under the Securities Act of 1933 (excluding 144A issues). At the end of the period, the value of restricted securities (excluding 144A issues) amounted to $1,883,414 or 0.4% of net assets. |
Additional information on each holding is as follows: |
Security | Acquisition Date | Acquisition Cost |
Aquiline Resources, Inc. | 10/30/06 - 10/31/06 | $ 2,046,386 |
Affiliated Central Funds |
Information regarding fiscal year to date income earned by the Fund from investments in Fidelity Central Funds is as follows: |
Fund | Income earned |
Fidelity Cash Central Fund | $ 1,405,761 |
Fidelity Securities Lending Cash Central Fund | 722,915 |
Total | $ 2,128,676 |
Annual Report
See accompanying notes which are an integral part of the financial statements.
Aggressive International
Financial Statements
Statement of Assets and Liabilities
October 31, 2006 |
| | |
Assets | | |
Investment in securities, at value (including securities loaned of $33,290,546) - See accompanying schedule: Unaffiliated issuers (cost $415,962,882) | $ 443,750,560 | |
Fidelity Central Funds (cost $64,275,610) | 64,275,610 | |
Total Investments (cost $480,238,492) | | $ 508,026,170 |
Cash | | 30,130 |
Receivable for investments sold | | 24,243,336 |
Receivable for fund shares sold | | 501,468 |
Dividends receivable | | 501,259 |
Interest receivable | | 248,898 |
Other receivables | | 127,007 |
Total assets | | 533,678,268 |
| | |
Liabilities | | |
Payable for investments purchased | $ 21,620,762 | |
Payable for fund shares redeemed | 793,507 | |
Accrued management fee | 172,875 | |
Other affiliated payables | 122,813 | |
Other payables and accrued expenses | 55,303 | |
Collateral on securities loaned, at value | 34,765,884 | |
Total liabilities | | 57,531,144 |
| | |
Net Assets | | $ 476,147,124 |
Net Assets consist of: | | |
Paid in capital | | $ 346,159,689 |
Undistributed net investment income | | 6,915,455 |
Accumulated undistributed net realized gain (loss) on investments and foreign currency transactions | | 95,279,932 |
Net unrealized appreciation (depreciation) on investments and assets and liabilities in foreign currencies | | 27,792,048 |
Net Assets, for 26,243,209 shares outstanding | | $ 476,147,124 |
Net Asset Value, offering price and redemption price per share ($476,147,124 ÷ 26,243,209 shares) | | $ 18.14 |
Statement of Operations
Year ended October 31, 2006 |
| | |
Investment Income | | |
Dividends | | $ 10,972,848 |
Interest | | 24,273 |
Income from Fidelity Central Funds (including $722,915 from security lending) | | 2,128,676 |
| | 13,125,797 |
Less foreign taxes withheld | | (1,235,443) |
Total income | | 11,890,354 |
| | |
Expenses | | |
Management fee
Basic fee | $ 4,035,653 | |
Performance adjustment | (1,255,986) | |
Transfer agent fees | 1,482,002 | |
Accounting and security lending fees | 280,550 | |
Custodian fees and expenses | 191,179 | |
Independent trustees' compensation | 2,306 | |
Registration fees | 35,602 | |
Audit | 71,160 | |
Legal | 13,499 | |
Interest | 5,369 | |
Miscellaneous | 6,941 | |
Total expenses before reductions | 4,868,275 | |
Expense reductions | (643,965) | 4,224,310 |
Net investment income (loss) | | 7,666,044 |
Realized and Unrealized Gain (Loss) Net realized gain (loss) on: | | |
Investment securities: | | |
Unaffiliated issuers (net of foreign taxes of $13,002) | 96,923,384 | |
Foreign currency transactions | (819,669) | |
Total net realized gain (loss) | | 96,103,715 |
Change in net unrealized appreciation (depreciation) on: Investment securities | (5,745,350) | |
Assets and liabilities in foreign currencies | 25,740 | |
Total change in net unrealized appreciation (depreciation) | | (5,719,610) |
Net gain (loss) | | 90,384,105 |
Net increase (decrease) in net assets resulting from operations | | $ 98,050,149 |
Annual Report
See accompanying notes which are an integral part of the financial statements.
Aggressive International
Financial Statements - continued
Statement of Changes in Net Assets
| Year ended
October 31,
2006 | Year ended
October 31,
2005 |
Increase (Decrease) in Net Assets | | |
Operations | | |
Net investment income (loss) | $ 7,666,044 | $ 8,428,691 |
Net realized gain (loss) | 96,103,715 | 112,898,015 |
Change in net unrealized appreciation (depreciation) | (5,719,610) | (31,480,640) |
Net increase (decrease) in net assets resulting from operations | 98,050,149 | 89,846,066 |
Distributions to shareholders from net investment income | (7,891,662) | (2,242,652) |
Distributions to shareholders from net realized gain | (60,750,944) | - |
Total distributions | (68,642,606) | (2,242,652) |
Share transactions
Proceeds from sales of shares | 173,391,281 | 249,436,853 |
Reinvestment of distributions | 62,343,713 | 2,093,978 |
Cost of shares redeemed | (484,972,865) | (364,612,526) |
Net increase (decrease) in net assets resulting from share transactions | (249,237,871) | (113,081,695) |
Redemption fees | 263,134 | 48,960 |
Total increase (decrease) in net assets | (219,567,194) | (25,429,321) |
| | |
Net Assets | | |
Beginning of period | 695,714,318 | 721,143,639 |
End of period (including undistributed net investment income of $6,915,455 and undistributed net investment
income of $7,917,620, respectively) | $ 476,147,124 | $ 695,714,318 |
Other Information Shares | | |
Sold | 9,840,640 | 15,019,784 |
Issued in reinvestment of distributions | 3,762,445 | 132,029 |
Redeemed | (27,820,456) | (22,112,916) |
Net increase (decrease) | (14,217,371) | (6,961,103) |
Financial Highlights
Years ended October 31, | 2006 | 2005 | 2004 | 2003 | 2002 |
Selected Per-Share Data | | | | | |
Net asset value, beginning of period | $ 17.19 | $ 15.21 | $ 14.36 | $ 10.78 | $ 10.78 |
Income from Investment Operations | | | | | |
Net investment income (loss) B | .24 | .20 | .04 | .06 | .02 |
Net realized and unrealized gain (loss) | 2.70 | 1.83 | .91 | 3.53 | .04 |
Total from investment operations | 2.94 | 2.03 | .95 | 3.59 | .06 |
Distributions from net investment income | (.23) | (.05) | (.10) | (.01) | (.06) |
Distributions from net realized gain | (1.77) | - | - | - | - |
Total distributions | (2.00) | (.05) | (.10) | (.01) | (.06) |
Redemption fees added to paid in capital B | .01 | - F | - F | - F | - F |
Net asset value, end of period | $ 18.14 | $ 17.19 | $ 15.21 | $ 14.36 | $ 10.78 |
Total Return A | 18.26% | 13.37% | 6.65% | 33.33% | .50% |
Ratios to Average Net Assets C, E | | | | | |
Expenses before reductions | .87% | .97% | 1.24% | 1.23% | 1.54% |
Expenses net of fee waivers, if any | .87% | .97% | 1.24% | 1.23% | 1.54% |
Expenses net of all reductions | .75% | .84% | 1.16% | 1.16% | 1.40% |
Net investment income (loss) | 1.36% | 1.20% | .27% | .50% | .13% |
Supplemental Data | | | | | |
Net assets, end of period (000 omitted) | $ 476,147 | $ 695,714 | $ 721,144 | $ 554,853 | $ 298,478 |
Portfolio turnover rate D | 176% | 185% | 161% | 212% | 188% |
A Total returns would have been lower had certain expenses not been reduced during the periods shown. B Calculated based on average shares outstanding during the period. C Fees and expenses of the underlying Fidelity Central Funds are not included in the Fund's expense ratio. The Fund indirectly bears its proportionate share of the expense of any underlying Fidelity Central Funds. D Amount does not include the portfolio activity of any underlying Fidelity Central Funds. E Expense ratios reflect operating expenses of the Fund. Expenses before reductions do not reflect amounts reimbursed by the investment adviser or reductions from brokerage service arrangements or other expense offset arrangements and do not represent the amount paid by the Fund during periods when reimbursements or reductions occur. Expenses net of fee waivers reflect expenses after reimbursement by the investment adviser but prior to reductions from brokerage service arrangements or other expense offset arrangements. Expenses net of all reductions represent the net expenses paid by the Fund. F Amount represents less than $.01 per share. |
Annual Report
See accompanying notes which are an integral part of the financial statements.
Overseas
Performance: The Bottom Line
Average annual total return reflects the change in the value of an investment, assuming reinvestment of the fund's dividend income and capital gains (the profits earned upon the sale of securities that have grown in value) and assuming a constant rate of performance each year. The $10,000 table and the fund's returns do not reflect the deduction of taxes that a shareholder would pay on fund distributions or the redemption of fund shares. During periods of reimbursement by Fidelity, a fund's total return will be greater than it would be had the reimbursement not occurred. How a fund did yesterday is no guarantee of how it will do tomorrow.
Average Annual Total Returns
Periods ended
October 31, 2006 | Past 1
year | Past 5
years | Past 10
years |
Fidelity Overseas Fund | 26.83% | 13.46% | 8.18% |
$10,000 Over 10 Years
Let's say hypothetically that $10,000 was invested in Fidelity Overseas Fund on October 31, 1996. The chart shows how the value of your investment would have changed, and also shows how the Morgan Stanley Capital International EAFE Index performed over the same period.
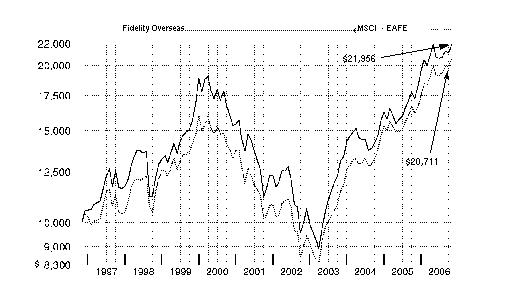
Annual Report
Overseas
Management's Discussion of Fund Performance
Comments from Ian Hart, Portfolio Manager of Fidelity® Overseas Fund
International equity markets as a whole outpaced their U.S. counterparts for the 12 months ending October 31, 2006 - partly as a result of favorable currency exchanges that boosted returns for U.S. investors. The Morgan Stanley Capital InternationalSM Europe, Australasia, Far East (MSCI® EAFE®) Index - a gauge of developed stock markets outside the United States and Canada - gained 27.72% during that time. European markets benefited from solid corporate profit growth and attractive dividends, which helped the MSCI Europe index advance 31.95%. Strong performing Latin American and Asian emerging markets drove the MSCI Emerging Markets index to a lofty 35.42% return. Japan was somewhat of an exception to the generally stellar foreign market performance after struggling in the middle part of the period. Still, its earlier gains helped the Tokyo Stock Exchange Stock Price Index (TOPIX) - a benchmark of the largest and better-established stocks traded on the Tokyo Stock Exchange - rise 12.47% overall. Natural-resources-rich Canada also struggled over the final six months as energy prices fell, but the S&P/TSX Composite Index managed a 12-month return of 28.21%.
The fund gained 26.83% for the period, slightly behind the benchmark MSCI EAFE. Despite big reductions in the fund's exposure to the poor performing energy sector, its overweighting there hurt results. Unfavorable stock selection in energy also detracted, with Canadian oil sands producer Synenco Energy, Japanese integrated energy firm Nippon Oil and Finnish refiner Neste Oil among the names hampering results. The biggest detractor was Global Bio-Chem Technology Group, a Chinese agricultural products firm. On the upside, taking profits from the fund's positions in semiconductor stocks before that group's downward correction provided a big boost to performance. Among the favorable trades in that group were Japan's Tokyo Electron and Taiwan's Siliconware Precision Industries. Yahoo Japan, which was sold prior to a steep pullback in its valuation, was a strong contributor as well. Millicom International Cellular, a Luxembourg-based mobile telephone operator, was the fund's biggest contributor to relative performance. Regionally, the fund's best results were in Japan and Southeast Asia, while holdings in Europe underperformed. A larger-than-usual average cash position also weighed on performance.
The views expressed above reflect those of the portfolio manager(s) only through the end of the period as stated on the cover of this report and do not necessarily represent the views of Fidelity or any other person in the Fidelity organization. Any such views are subject to change at any time based upon market or other conditions and Fidelity disclaims any responsibility to update such views. These views may not be relied on as investment advice and, because investment decisions for a Fidelity fund are based on numerous factors, may not be relied on as an indication of trading intent on behalf of any Fidelity fund.
Annual Report
Overseas
Investment Changes
Geographic Diversification (% of fund's net assets) |
As of October 31, 2006 |
| Japan | 16.3% | |
| United Kingdom | 16.1% | |
| France | 12.8% | |
| United States of America | 11.1% | |
| Germany | 5.8% | |
| Switzerland | 5.6% | |
| Italy | 5.1% | |
| Spain | 3.2% | |
| Netherlands | 2.8% | |
| Other | 21.2% | |

Percentages are adjusted for the effect of futures contracts, if applicable. |
|
As of April 30, 2006 |
| Japan | 16.2% | |
| United Kingdom | 11.9% | |
| France | 9.0% | |
| Switzerland | 8.4% | |
| Germany | 6.5% | |
| United States of America | 5.2% | |
| Korea (South) | 4.8% | |
| Italy | 4.7% | |
| Netherlands | 3.1% | |
| Other | 30.2% | |

Percentages are adjusted for the effect of futures contracts, if applicable. |
Asset Allocation |
| % of fund's
net assets | % of fund's net assets
6 months ago |
Stocks | 92.3 | 96.5 |
Short-Term Investments and Net Other Assets | 7.7 | 3.5 |
Top Ten Stocks as of October 31, 2006 |
| % of fund's
net assets | % of fund's net assets
6 months ago |
Pernod Ricard SA (France, Beverages) | 4.0 | 1.9 |
Reuters Group PLC (United Kingdom, Media) | 3.4 | 1.6 |
BAE Systems PLC (United Kingdom, Aerospace & Defense) | 2.0 | 0.9 |
Nintendo Co. Ltd. (Japan, Software) | 1.9 | 0.0 |
Banco Bilbao Vizcaya Argentaria SA (Spain, Commercial Banks) | 1.8 | 2.0 |
BHP Billiton PLC (United Kingdom, Metals & Mining) | 1.5 | 0.7 |
Lottomatica Spa (Italy, Hotels, Restaurants & Leisure) | 1.5 | 1.2 |
Credit Suisse Group (Reg.) (Switzerland, Capital Markets) | 1.5 | 2.0 |
Bayer AG (Germany, Chemicals) | 1.5 | 1.6 |
Novartis AG (Reg.) (Switzerland, Pharmaceuticals) | 1.4 | 1.5 |
| 20.5 | |
Market Sectors as of October 31, 2006 |
| % of fund's
net assets | % of fund's net assets
6 months ago |
Financials | 28.7 | 31.4 |
Information Technology | 11.3 | 6.8 |
Consumer Discretionary | 11.1 | 10.0 |
Energy | 9.6 | 18.5 |
Materials | 7.0 | 6.8 |
Consumer Staples | 6.6 | 5.3 |
Industrials | 6.2 | 6.1 |
Health Care | 5.4 | 6.7 |
Utilities | 3.6 | 1.2 |
Telecommunication Services | 2.8 | 3.7 |
Annual Report
Overseas
Investments October 31, 2006
Showing Percentage of Net Assets
Common Stocks - 92.3% |
| Shares | | Value (Note 1) |
Australia - 2.3% |
Computershare Ltd. | 10,269,163 | | $ 61,214,018 |
Macquarie Bank Ltd. | 618,000 | | 35,666,561 |
National Australia Bank Ltd. | 992,700 | | 29,225,088 |
Westfield Group unit | 3,000,000 | | 43,267,243 |
TOTAL AUSTRALIA | | 169,372,910 |
Brazil - 2.1% |
Banco Nossa Caixa SA | 2,175,000 | | 51,779,426 |
Uniao de Bancos Brasileiros SA (Unibanco) GDR | 550,700 | | 43,367,625 |
Vivo Participacoes SA (PN) sponsored ADR (d) | 15,464,000 | | 53,969,360 |
TOTAL BRAZIL | | 149,116,411 |
Canada - 1.1% |
Freehold Royalty Trust | 937,500 | | 15,782,969 |
Synenco Energy, Inc. Class A | 1,983,200 | | 24,660,822 |
Talisman Energy, Inc. | 2,326,900 | | 38,241,041 |
TOTAL CANADA | | 78,684,832 |
China - 0.3% |
Global Bio-Chem Technology Group Co. Ltd. | 84,948,000 | | 24,903,749 |
Denmark - 1.0% |
Vestas Wind Systems AS (a) | 2,578,300 | | 72,627,547 |
Finland - 1.3% |
Neste Oil Oyj | 3,100,922 | | 97,604,696 |
France - 12.8% |
Alcatel SA sponsored ADR (d) | 6,394,600 | | 81,211,420 |
Alstom SA (a) | 425,600 | | 39,275,951 |
AXA SA | 1,234,060 | | 47,042,367 |
BNP Paribas SA | 407,198 | | 44,776,250 |
Carrefour SA | 1,011,400 | | 61,629,999 |
Electricite de France | 762,600 | | 46,245,409 |
L'Oreal SA | 480,116 | | 46,696,889 |
Pernod Ricard SA | 1,430,785 | | 286,539,255 |
Renault SA | 304,000 | | 35,562,546 |
Societe Generale Series A | 399,210 | | 66,343,624 |
Total SA Series B | 1,499,076 | | 102,147,039 |
Veolia Environnement | 1,050,400 | | 64,314,845 |
TOTAL FRANCE | | 921,785,594 |
Germany - 5.8% |
Adidas-Salomon AG | 729,400 | | 36,551,302 |
BASF AG | 293,378 | | 25,811,396 |
Bayer AG | 2,134,700 | | 107,140,593 |
DaimlerChrysler AG | 407,800 | | 23,216,054 |
E.ON AG | 738,291 | | 88,882,854 |
Muenchener Rueckversicherungs-Gesellschaft AG (Reg.) | 518,776 | | 84,214,232 |
SAP AG sponsored ADR | 1,031,000 | | 51,178,840 |
TOTAL GERMANY | | 416,995,271 |
|
| Shares | | Value (Note 1) |
Greece - 0.3% |
Greek Organization of Football Prognostics SA | 575,300 | | $ 20,546,076 |
Hong Kong - 0.7% |
CNOOC Ltd. sponsored ADR (d) | 298,200 | | 24,995,124 |
Shanghai Industrial Holdings Ltd.
(H Shares) | 5,588,000 | | 10,878,249 |
Television Broadcasts Ltd. | 2,927,000 | | 16,785,501 |
TOTAL HONG KONG | | 52,658,874 |
India - 2.0% |
Bank of Baroda | 2,019,947 | | 13,068,949 |
Satyam Computer Services Ltd. | 9,003,534 | | 88,151,253 |
State Bank of India | 1,483,012 | | 43,587,744 |
TOTAL INDIA | | 144,807,946 |
Italy - 5.1% |
Banca Intesa Spa | 5,039,100 | | 34,449,295 |
Enel Spa ADR | 1,945,800 | | 18,676,816 |
FASTWEB Spa (d) | 1,501,361 | | 74,353,883 |
Impregilo Spa (a) | 10,371,200 | | 46,160,208 |
Lottomatica Spa | 3,011,452 | | 109,933,176 |
Unicredito Italiano Spa | 9,839,800 | | 81,586,647 |
TOTAL ITALY | | 365,160,025 |
Japan - 16.3% |
Aeon Co. Ltd. | 2,235,700 | | 52,662,054 |
Canon, Inc. | 1,197,700 | | 63,945,206 |
Citizen Watch Co. Ltd. | 9,831,900 | | 81,624,276 |
Fuji Television Network, Inc. | 16,009 | | 33,397,710 |
Fujitsu Ltd. | 6,706,000 | | 54,698,395 |
Konica Minolta Holdings, Inc. | 5,250,000 | | 69,934,169 |
Matsushita Electric Industrial Co. Ltd. | 3,236,900 | | 67,327,523 |
Mitsubishi Estate Co. Ltd. | 3,021,000 | | 72,322,165 |
Mitsui Fudosan Co. Ltd. | 1,379,000 | | 33,956,226 |
Mizuho Financial Group, Inc. | 9,307 | | 72,492,112 |
Nidec Corp. | 372,800 | | 28,527,361 |
Nikko Cordial Corp. | 2,222,500 | | 26,622,116 |
Nintendo Co. Ltd. | 687,200 | | 140,542,277 |
Nippon Oil Corp. | 7,421,000 | | 55,200,669 |
Nissan Motor Co. Ltd. | 2,481,600 | | 29,725,733 |
Omron Corp. | 1,741,800 | | 44,974,660 |
ORIX Corp. | 226,310 | | 63,756,112 |
Sumitomo Mitsui Financial Group, Inc. | 5,860 | | 64,131,330 |
T&D Holdings, Inc. | 978,950 | | 71,563,123 |
Tokuyama Corp. | 4,051,000 | | 50,983,860 |
TOTAL JAPAN | | 1,178,387,077 |
Korea (South) - 1.1% |
Hyundai Engineering & Construction Co. Ltd. (a) | 695,040 | | 38,873,539 |
Common Stocks - continued |
| Shares | | Value (Note 1) |
Korea (South) - continued |
Kookmin Bank | 204,770 | | $ 16,277,279 |
Samsung Electronics Co. Ltd. | 40,080 | | 25,989,779 |
TOTAL KOREA (SOUTH) | | 81,140,597 |
Luxembourg - 0.4% |
Millicom International Cellular SA unit (a) | 650,800 | | 32,664,350 |
Malaysia - 0.3% |
UMW Holdings BHD | 9,288,800 | | 18,564,884 |
Netherlands - 2.8% |
ING Groep NV (Certificaten Van Aandelen) | 2,301,014 | | 102,003,951 |
Mittal Steel Co. NV Class A
(NY Shares) | 997,100 | | 42,626,025 |
Reed Elsevier NV | 3,274,400 | | 56,297,113 |
TOTAL NETHERLANDS | | 200,927,089 |
Netherlands Antilles - 1.0% |
Schlumberger Ltd. (NY Shares) | 1,093,600 | | 68,984,288 |
Norway - 1.5% |
Aker Kvaerner ASA | 727,660 | | 75,698,192 |
Statoil ASA | 1,442,900 | | 36,477,561 |
TOTAL NORWAY | | 112,175,753 |
Philippines - 0.4% |
Metropolitan Bank & Trust Co. | 34,215,100 | | 32,265,443 |
Russia - 0.6% |
OAO Gazprom sponsored ADR | 946,400 | | 40,316,640 |
South Africa - 1.2% |
Impala Platinum Holdings Ltd. | 194,400 | | 34,175,638 |
Steinhoff International Holdings Ltd. | 15,215,826 | | 49,574,389 |
TOTAL SOUTH AFRICA | | 83,750,027 |
Spain - 3.2% |
Banco Bilbao Vizcaya Argentaria SA | 5,180,600 | | 125,370,520 |
Banco Santander Central Hispano SA | 3,385,300 | | 58,592,718 |
Telefonica SA sponsored ADR | 784,300 | | 45,254,110 |
TOTAL SPAIN | | 229,217,348 |
Sweden - 1.0% |
OMX AB (d) | 3,971,500 | | 72,172,598 |
Switzerland - 5.6% |
Actelion Ltd. (Reg.) (a) | 408,154 | | 68,728,259 |
Credit Suisse Group (Reg.) | 1,810,207 | | 109,481,319 |
EFG International | 6,366 | | 208,507 |
|
| Shares | | Value (Note 1) |
Novartis AG (Reg.) | 1,697,084 | | $ 103,063,911 |
Roche Holding AG (participation certificate) | 448,965 | | 78,559,402 |
Syngenta AG sponsored ADR | 1,366,600 | | 44,045,518 |
TOTAL SWITZERLAND | | 404,086,916 |
Thailand - 1.4% |
Bangkok Bank Ltd. PCL (For. Reg.) | 12,432,000 | | 40,663,441 |
Thai Oil PCL (For. Reg.) | 11,662,400 | | 19,390,975 |
TMB PCL (For.Reg.) (a) | 478,869,800 | | 42,290,648 |
TOTAL THAILAND | | 102,345,064 |
Turkey - 1.2% |
Turkiye Garanti Bankasi AS | 12,550,000 | | 46,074,798 |
Yapi ve Kredi Bankasi AS | 21,607,711 | | 41,517,647 |
TOTAL TURKEY | | 87,592,445 |
United Kingdom - 16.1% |
BAE Systems PLC | 17,842,500 | | 142,775,015 |
Barclays PLC | 6,993,300 | | 94,951,531 |
BHP Billiton PLC | 5,710,175 | | 110,119,725 |
British Land Co. PLC | 1,760,200 | | 50,195,843 |
GlaxoSmithKline PLC | 2,134,800 | | 56,839,050 |
HSBC Holdings PLC sponsored ADR (d) | 892,800 | | 85,235,616 |
ITV PLC | 29,969,897 | | 60,311,795 |
LogicaCMG PLC | 11,043,929 | | 34,864,717 |
Prudential PLC | 6,266,900 | | 76,805,167 |
Reuters Group PLC | 28,603,700 | | 244,026,565 |
Rio Tinto PLC (Reg.) | 1,028,338 | | 56,915,937 |
Rolls-Royce Group PLC | 4,151,786 | | 37,202,000 |
Standard Chartered PLC (United Kingdom) | 1,913,000 | | 53,823,450 |
The Weir Group PLC | 5,821,200 | | 56,768,888 |
TOTAL UNITED KINGDOM | | 1,160,835,299 |
United States of America - 3.4% |
AES Corp. (a) | 1,851,400 | | 40,712,286 |
Global Industries Ltd. (a) | 5,659,400 | | 93,946,040 |
Johnson & Johnson | 1,199,100 | | 80,819,340 |
Titanium Metals Corp. (a) | 924,000 | | 27,239,520 |
TOTAL UNITED STATES OF AMERICA | | 242,717,186 |
TOTAL COMMON STOCKS (Cost $5,703,419,072) | 6,662,406,935 |
Nonconvertible Preferred Stocks - 0.0% |
| | | |
United Kingdom - 0.0% |
Rolls-Royce Group PLC Series B
(Cost $289,620) | 152,370,546 | | 297,913 |
Money Market Funds - 9.2% |
| Shares | | Value (Note 1) |
Fidelity Cash Central Fund, 5.34% (b) | 437,581,360 | | $ 437,581,360 |
Fidelity Securities Lending Cash Central Fund, 5.35% (b)(c) | 223,738,817 | | 223,738,817 |
TOTAL MONEY MARKET FUNDS (Cost $661,320,177) | 661,320,177 |
TOTAL INVESTMENT
PORTFOLIO - 101.5% (Cost $6,365,028,869) | | 7,324,025,025 |
NET OTHER ASSETS - (1.5)% | | (106,738,316) |
NET ASSETS - 100% | $ 7,217,286,709 |
Legend |
(a) Non-income producing |
(b) Affiliated fund that is available only to investment companies and other accounts managed by Fidelity Investments. The rate quoted is the annualized seven-day yield of the fund at period end. A complete unaudited listing of the fund's holdings as of its most recent quarter end is available upon request. |
(c) Investment made with cash collateral received from securities on loan. |
(d) Security or a portion of the security is on loan at period end. |
Affiliated Central Funds |
Information regarding fiscal year to date income earned by the Fund from investments in Fidelity Central Funds is as follows: |
Fund | Income earned |
Fidelity Cash Central Fund | $ 16,657,240 |
Fidelity Securities Lending Cash Central Fund | 4,381,778 |
Total | $ 21,039,018 |
Other Affiliated Issuers |
An affiliated company is a company in which the fund has ownership of at least 5% of the voting securities. Fiscal year to date transactions with companies which are or were affiliates are as follows: |
Affiliate | Value, beginning
of period | Purchases | Sales Proceeds | Dividend Income | Value,
end of period |
Global Industries Ltd. | $ - | $ 119,403,946 | $ 36,321,555 | $ - | $ - |
Annual Report
See accompanying notes which are an integral part of the financial statements.
Overseas
Financial Statements
Statement of Assets and Liabilities
October 31, 2006 |
| | |
Assets | | |
Investment in securities, at value (including securities loaned of $215,800,191) - See accompanying schedule: Unaffiliated issuers (cost $5,703,708,692) | $ 6,662,704,848 | |
Fidelity Central Funds (cost $661,320,177) | 661,320,177 | |
Total Investments (cost $6,365,028,869) | | $ 7,324,025,025 |
Foreign currency held at value (cost $166,477) | | 166,480 |
Receivable for investments sold | | 169,173,300 |
Receivable for fund shares sold | | 10,732,804 |
Dividends receivable | | 9,423,421 |
Interest receivable | | 1,372,690 |
Other receivables | | 949,306 |
Total assets | | 7,515,843,026 |
| | |
Liabilities | | |
Payable to custodian bank | $ 255,014 | |
Payable for investments purchased | 62,506,337 | |
Payable for fund shares redeemed | 4,275,384 | |
Accrued management fee | 3,357,431 | |
Other affiliated payables | 1,637,826 | |
Other payables and accrued expenses | 2,785,508 | |
Collateral on securities loaned, at value | 223,738,817 | |
Total liabilities | | 298,556,317 |
| | |
Net Assets | | $ 7,217,286,709 |
Net Assets consist of: | | |
Paid in capital | | $ 5,377,718,616 |
Undistributed net investment income | | 82,749,519 |
Accumulated undistributed net realized gain (loss) on investments and foreign currency transactions | | 800,092,761 |
Net unrealized appreciation (depreciation) on investments and assets and liabilities in foreign currencies | | 956,725,813 |
Net Assets, for 153,298,382 shares outstanding | | $ 7,217,286,709 |
Net Asset Value, offering price and redemption price per share ($7,217,286,709 ÷ 153,298,382 shares) | | $ 47.08 |
Statement of Operations
Year ended October 31, 2006 |
| | |
Investment Income | | |
Dividends | | $ 135,900,188 |
Interest | | 37,127 |
Income from Fidelity Central Funds (including $4,381,778 from security lending) | | 21,039,018 |
| | 156,976,333 |
Less foreign taxes withheld | | (13,286,213) |
Total income | | 143,690,120 |
| | |
Expenses | | |
Management fee
Basic fee | $ 44,089,354 | |
Performance adjustment | (1,792,040) | |
Transfer agent fees | 15,124,297 | |
Accounting and security lending fees | 1,583,018 | |
Custodian fees and expenses | 2,187,740 | |
Independent trustees' compensation | 23,146 | |
Appreciation in deferred trustee compensation account | 10,239 | |
Registration fees | 208,749 | |
Audit | 136,235 | |
Legal | 89,445 | |
Interest | 854 | |
Miscellaneous | 50,947 | |
Total expenses before reductions | 61,711,984 | |
Expense reductions | (6,157,075) | 55,554,909 |
Net investment income (loss) | | 88,135,211 |
Realized and Unrealized Gain (Loss) Net realized gain (loss) on: | | |
Investment securities: | | |
Unaffiliated issuers (net of foreign taxes of $336,395) | 870,833,727 | |
Other affiliated issuers | (2,229,834) | |
Foreign currency transactions | (2,632,191) | |
Total net realized gain (loss) | | 865,971,702 |
Change in net unrealized appreciation (depreciation) on: Investment securities (net of increase in deferred foreign taxes of $2,135,972) | 392,363,993 | |
Assets and liabilities in foreign currencies | 144,233 | |
Total change in net unrealized appreciation (depreciation) | | 392,508,226 |
Net gain (loss) | | 1,258,479,928 |
Net increase (decrease) in net assets resulting from operations | | $ 1,346,615,139 |
Annual Report
See accompanying notes which are an integral part of the financial statements.
Overseas
Financial Statements - continued
Statement of Changes in Net Assets
| Year ended
October 31,
2006 | Year ended
October 31,
2005 |
Increase (Decrease) in Net Assets | | |
Operations | | |
Net investment income (loss) | $ 88,135,211 | $ 51,394,630 |
Net realized gain (loss) | 865,971,702 | 401,382,614 |
Change in net unrealized appreciation (depreciation) | 392,508,226 | 289,293,624 |
Net increase (decrease) in net assets resulting from operations | 1,346,615,139 | 742,070,868 |
Distributions to shareholders from net investment income | (51,835,782) | (24,791,518) |
Distributions to shareholders from net realized gain | (20,228,519) | (14,353,048) |
Total distributions | (72,064,301) | (39,144,566) |
Share transactions
Proceeds from sales of shares | 2,352,534,453 | 977,608,152 |
Reinvestment of distributions | 71,154,819 | 38,479,891 |
Cost of shares redeemed | (1,215,037,539) | (1,167,494,600) |
Net increase (decrease) in net assets resulting from share transactions | 1,208,651,733 | (151,406,557) |
Redemption fees | 287,325 | 173,736 |
Total increase (decrease) in net assets | 2,483,489,896 | 551,693,481 |
| | |
Net Assets | | |
Beginning of period | 4,733,796,813 | 4,182,103,332 |
End of period (including undistributed net investment income of $82,749,519 and undistributed net investment income of $46,450,091, respectively) | $ 7,217,286,709 | $ 4,733,796,813 |
Other Information Shares | | |
Sold | 53,641,186 | 27,631,957 |
Issued in reinvestment of distributions | 1,782,435 | 1,105,744 |
Redeemed | (27,857,412) | (32,826,166) |
Net increase (decrease) | 27,566,209 | (4,088,465) |
Financial Highlights
Years ended October 31, | 2006 | 2005 | 2004 | 2003 | 2002 |
Selected Per-Share Data | | | | | |
Net asset value, beginning of period | $ 37.65 | $ 32.21 | $ 29.19 | $ 22.34 | $ 25.98 |
Income from Investment Operations | | | | | |
Net investment income (loss) B | .63 | .39 | .17 E | .18 | .11 |
Net realized and unrealized gain (loss) | 9.37 | 5.35 | 3.15 | 6.76 | (3.75) |
Total from investment operations | 10.00 | 5.74 | 3.32 | 6.94 | (3.64) |
Distributions from net investment income | (.41) | (.19) | (.30) | (.09) | - |
Distributions from net realized gain | (.16) | (.11) | - | - | - |
Total distributions | (.57) | (.30) | (.30) | (.09) | - |
Redemption fees added to paid in capital B | - G | - G | - G | - G | - G |
Net asset value, end of period | $ 47.08 | $ 37.65 | $ 32.21 | $ 29.19 | $ 22.34 |
Total Return A | 26.83% | 17.90% | 11.45% | 31.18% | (14.01)% |
Ratios to Average Net Assets C, F | | | | | |
Expenses before reductions | 1.00% | .93% | 1.05% | 1.04% | 1.21% |
Expenses net of fee waivers, if any | 1.00% | .93% | 1.05% | 1.04% | 1.21% |
Expenses net of all reductions | .90% | .86% | 1.01% | 1.00% | 1.16% |
Net investment income (loss) | 1.43% | 1.11% | .55% E | .75% | .42% |
Supplemental Data | | | | | |
Net assets, end of period (000 omitted) | $ 7,217,287 | $ 4,733,797 | $ 4,182,103 | $ 3,500,394 | $ 2,862,101 |
Portfolio turnover rate D | 132% | 87% | 79% | 104% | 72% |
A Total returns would have been lower had certain expenses not been reduced during the periods shown. B Calculated based on average shares outstanding during the period. C Fees and expenses of the underlying Fidelity Central Funds are not included in the Fund's expense ratio. The Fund indirectly bears its proportionate share of the expense of any underlying Fidelity Central Funds. D Amount does not include the portfolio activity of any underlying Fidelity Central Funds. E Net investment income per share includes approximately $.01 per share received as a result of a reorganization of an issuer that was in bankruptcy. Excluding this non-recurring amount, the ratio of net investment income (loss) to average net assets would have been ..52%. F Expense ratios reflect operating expenses of the Fund. Expenses before reductions do not reflect amounts reimbursed by the investment adviser or reductions from brokerage service arrangements or other expense offset arrangements and do not represent the amount paid by the Fund during periods when reimbursements or reductions occur. Expenses net of fee waivers reflect expenses after reimbursement by the investment adviser but prior to reductions from brokerage service arrangements or other expense offset arrangements. Expenses net of all reductions represent the net expenses paid by the Fund. G Amount represents less than $.01 per share. |
Annual Report
See accompanying notes which are an integral part of the financial statements.
Worldwide
Performance: The Bottom Line
Average annual total return reflects the change in the value of an investment, assuming reinvestment of the fund's dividend income and capital gains (the profits earned upon the sale of securities that have grown in value) and assuming a constant rate of performance each year. The $10,000 table and the fund's returns do not reflect the deduction of taxes that a shareholder would pay on fund distributions or the redemption of fund shares. During periods of reimbursement by Fidelity, a fund's total return will be greater than it would be had the reimbursement not occurred. How a fund did yesterday is no guarantee of how it will do tomorrow.
Average Annual Total Returns
Periods ended
October 31, 2006 | Past 1
year | Past 5
years | Past 10
years |
Fidelity Worldwide Fund | 21.31% | 11.67% | 8.57% |
$10,000 Over 10 Years
Let's say hypothetically that $10,000 was invested in Fidelity Worldwide Fund on October 31, 1996. The chart shows how the value of your investment would have changed, and also shows how the Morgan Stanley Capital International World Index performed over the same period.
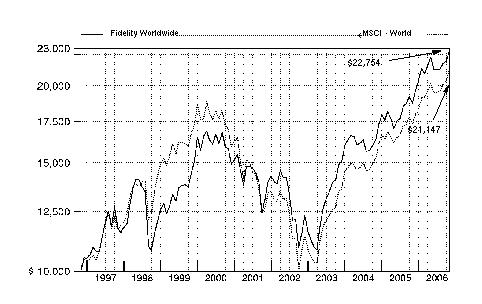
Annual Report
Worldwide
Management's Discussion of Fund Performance
Comments from Jeffrey Feingold, Lead Portfolio Manager of Fidelity® Worldwide Fund, who also is in charge of the fund's U.S. equity subportfolio, and William Kennedy, Co-Portfolio Manager, who manages the fund's non-U.S. subportfolio
International equity markets as a whole outpaced their U.S. counterparts for the 12 months ending October 31, 2006 - partly as a result of favorable currency exchanges that boosted returns for U.S. investors. The Morgan Stanley Capital InternationalSM Europe, Australasia, Far East (MSCI® EAFE®) Index - a gauge of developed stock markets outside the United States and Canada - gained 27.72% during that time. European markets benefited from solid corporate profit growth and attractive dividends, which helped the MSCI Europe index advance 31.95%. Strong performing Latin American and Asian emerging markets drove the MSCI Emerging Markets index to a lofty 35.42% return. Japan was somewhat of an exception to the generally stellar foreign market performance after struggling in the middle part of the period. Still, its earlier gains helped the Tokyo Stock Exchange Stock Price Index (TOPIX) - a benchmark of the largest and better-established stocks traded on the Tokyo Stock Exchange - rise 12.47% overall. Natural-resources-rich Canada also struggled over the final six months as energy prices fell, but the S&P/TSX Composite Index managed a 12-month return of 28.21%.
The fund gained 21.31% during the past year, modestly trailing the 21.75% return for MSCI World index. Although both the U.S. and non-U.S. sides of the portfolio aided returns, the biggest gains came from the foreign subportfolio. For the full fund, investments in technology, Japan and elsewhere in Asia lifted performance versus the index, while disappointing security selection in energy and among large-cap European and U.S. stocks hurt returns. In the U.S. subportfolio, we had solid results in health care and consumer discretionary. Cephalon, a biotechnology company that benefited from positive news about drugs in its pipeline, was a top contributor to performance. Among detractors in the U.S. subportfolio was AT&T, a large telecommunication services provider. The fund had an underweighting in AT&T, which was costly as an improved industry outlook pushed the stock higher. In the non-U.S. subportfolio, an overweighting in technology and strong stock picking in Japan and across Asia led the way. Tokyo Electron, a semiconductor company, did especially well early in the year as the Japanese market rallied sharply. Disappointments in the foreign subportfolio included Total SA, a French integrated oil company that missed production targets. The fund no longer held Cephalon, AT&T and Tokyo Electron at period end.
The views expressed in this statement reflect those of the portfolio managers only through the end of the period of the report as stated on the cover and do not necessarily represent the views of Fidelity or any other person in the Fidelity organization. Any such views are subject to change at any time based upon market or other conditions and Fidelity disclaims any responsibility to update such views. These views may not be relied on as investment advice and, because investment decisions for a Fidelity fund are based on numerous factors, may not be relied on as an indication of trading intent on behalf of any Fidelity fund.
Annual Report
Worldwide
Investment Changes
Geographic Diversification (% of fund's net assets) |
As of October 31, 2006 |
| United States of America | 44.8% | |
| Japan | 10.1% | |
| United Kingdom | 8.4% | |
| Switzerland | 6.9% | |
| France | 6.5% | |
| Germany | 5.2% | |
| Australia | 2.8% | |
| Italy | 1.7% | |
| Spain | 1.6% | |
| Other | 12.0% | |

Percentages are adjusted for the effect of futures contracts, if applicable. |
|
As of April 30, 2006 |
| United States of America | 46.5% | |
| Japan | 10.8% | |
| United Kingdom | 7.0% | |
| France | 6.1% | |
| Switzerland | 5.6% | |
| Germany | 5.3% | |
| Australia | 2.0% | |
| Italy | 1.7% | |
| Korea (South) | 1.3% | |
| Other | 13.7% | |
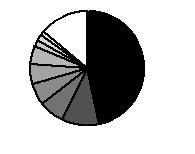
Percentages are adjusted for the effect of futures contracts, if applicable. |
Asset Allocation |
| % of fund's
net assets | % of fund's net assets
6 months ago |
Stocks | 97.7 | 98.4 |
Short-Term Investments and Net Other Assets | 2.3 | 1.6 |
Top Ten Stocks as of October 31, 2006 |
| % of fund's
net assets | % of fund's net assets
6 months ago |
Exxon Mobil Corp. (United States of America, Oil, Gas & Consumable Fuels) | 2.0 | 0.4 |
Procter & Gamble Co. (United States of America, Household Products) | 1.8 | 0.0 |
ABB Ltd. (Switzerland, Electrical Equipment) | 1.8 | 0.2 |
Merck & Co., Inc. (United States of America, Pharmaceuticals) | 1.4 | 0.3 |
PepsiCo, Inc. (United States of America, Beverages) | 1.3 | 0.8 |
Google, Inc. Class A (sub. vtg.) (United States of America, Internet Software & Services) | 1.2 | 1.8 |
Apple Computer, Inc. (United States of America, Computers & Peripherals) | 1.2 | 0.5 |
General Dynamics Corp. (United States of America, Aerospace & Defense) | 1.1 | 0.4 |
Avon Products, Inc. (United States of America, Personal Products) | 1.1 | 0.6 |
Microsoft Corp. (United States of America, Software) | 1.1 | 0.0 |
| 14.0 | |
Market Sectors as of October 31, 2006 |
| % of fund's
net assets | % of fund's net assets
6 months ago |
Financials | 23.8 | 23.9 |
Consumer Discretionary | 12.2 | 13.3 |
Information Technology | 12.0 | 12.1 |
Consumer Staples | 10.6 | 8.6 |
Health Care | 10.1 | 9.8 |
Industrials | 9.8 | 11.5 |
Energy | 7.1 | 8.8 |
Utilities | 4.3 | 3.0 |
Telecommunication Services | 4.0 | 2.4 |
Materials | 3.8 | 5.0 |
Annual Report
Worldwide
Investments October 31, 2006
Showing Percentage of Net Assets
Common Stocks - 97.1% |
| Shares | | Value (Note 1) |
Argentina - 0.2% |
Inversiones y Representaciones SA sponsored GDR (a) | 159,100 | | $ 2,286,267 |
Australia - 2.8% |
AMP Ltd. | 185,200 | | 1,362,040 |
Australia & New Zealand Banking Group Ltd. | 71,900 | | 1,616,407 |
AXA Asia Pacific Holdings Ltd. | 326,300 | | 1,682,350 |
Babcock & Brown Japan Property Trust | 673,100 | | 1,008,291 |
BHP Billiton Ltd. | 182,800 | | 3,890,898 |
Billabong International Ltd. | 175,300 | | 2,127,909 |
Brambles Industries Ltd. | 175,000 | | 1,690,744 |
Cochlear Ltd. | 23,800 | | 1,025,707 |
Commonwealth Bank of Australia | 25,600 | | 945,330 |
Computershare Ltd. | 260,100 | | 1,550,444 |
CSL Ltd. | 108,600 | | 4,715,637 |
Downer EDI Ltd. | 4,329 | | 21,582 |
Fosters Group Ltd. | 329,000 | | 1,642,785 |
Macquarie Airports unit | 185,663 | | 461,377 |
Macquarie Bank Ltd. | 35,000 | | 2,019,951 |
Macquarie Communications Infrastructure Group unit | 141,400 | | 669,925 |
Macquarie Infrastructure Group unit | 151,466 | | 396,330 |
Mortgage Choice Ltd. | 251,000 | | 520,755 |
Multiplex Group unit | 503,400 | | 1,434,122 |
National Australia Bank Ltd. | 98,100 | | 2,888,064 |
QBE Insurance Group Ltd. | 102,700 | | 1,963,779 |
Seek Ltd. | 161,200 | | 663,899 |
Transurban Group unit | 85,606 | | 478,483 |
Woolworths Ltd. | 182,703 | | 2,926,384 |
TOTAL AUSTRALIA | | 37,703,193 |
Austria - 0.4% |
Austriamicrosystems AG (a) | 11,400 | | 724,784 |
Oesterreichische Elektrizitaetswirtschafts AG (Verbund) | 30,800 | | 1,537,536 |
OMV AG | 30,700 | | 1,668,910 |
Telekom Austria AG | 39,000 | | 970,702 |
TOTAL AUSTRIA | | 4,901,932 |
Belgium - 0.2% |
Almancora SCA (Certificaten Van Aandelen) | 15,000 | | 1,977,782 |
Bermuda - 1.0% |
Allied World Assurance Co. Holdings Ltd. | 44,900 | | 1,875,024 |
Endurance Specialty Holdings Ltd. | 118,100 | | 4,210,265 |
Lazard Ltd. Class A | 85,900 | | 3,642,160 |
Marvell Technology Group Ltd. (a) | 127,500 | | 2,330,700 |
Ports Design Ltd. | 554,500 | | 963,951 |
TOTAL BERMUDA | | 13,022,100 |
Brazil - 0.3% |
Banco Nossa Caixa SA | 22,200 | | 528,507 |
|
| Shares | | Value (Note 1) |
CSU Cardsystem SA sponsored ADR (e) | 14,600 | | $ 253,676 |
TAM SA (PN) sponsored ADR (ltd. vtg.) | 106,700 | | 3,259,685 |
TOTAL BRAZIL | | 4,041,868 |
Canada - 0.8% |
Canadian Natural Resources Ltd. | 114,900 | | 5,982,189 |
Potash Corp. of Saskatchewan, Inc. | 9,300 | | 1,161,570 |
Suncor Energy, Inc. | 48,700 | | 3,741,482 |
TOTAL CANADA | | 10,885,241 |
Cayman Islands - 0.6% |
DSND, Inc. (a) | 64,100 | | 1,162,049 |
Foxconn International Holdings Ltd. (a) | 774,700 | | 2,574,962 |
Noble Corp. | 48,600 | | 3,406,860 |
Xinao Gas Holdings Ltd. | 476,000 | | 479,232 |
TOTAL CAYMAN ISLANDS | | 7,623,103 |
China - 0.3% |
Bank of China Ltd. (H Shares) | 993,000 | | 427,731 |
China Life Insurance Co. Ltd. (H Shares) | 824,000 | | 1,735,473 |
China Merchants Bank Co. Ltd. (H Shares) (a) | 46,500 | | 72,585 |
China Shenhua Energy Co. Ltd. (H Shares) | 490,500 | | 862,784 |
Home Inns & Hotels Management, Inc. sponsored ADR | 1,500 | | 36,810 |
Industrial & Commercial Bank of China | 1,714,000 | | 766,950 |
TOTAL CHINA | | 3,902,333 |
Denmark - 0.1% |
Vestas Wind Systems AS (a) | 55,300 | | 1,557,733 |
Finland - 0.6% |
Citycon Oyj | 91,200 | | 483,092 |
Fortum Oyj | 125,400 | | 3,450,906 |
Nokia Corp. sponsored ADR | 216,300 | | 4,300,044 |
TOTAL FINLAND | | 8,234,042 |
France - 6.5% |
Alcatel SA (RFD) | 88,300 | | 1,121,410 |
Alstom SA (a) | 34,400 | | 3,174,560 |
April Group | 22,800 | | 974,914 |
AXA SA | 99,100 | | 3,777,692 |
BNP Paribas SA | 52,682 | | 5,793,011 |
Carrefour SA | 62,900 | | 3,832,833 |
CNP Assurances | 18,100 | | 1,904,829 |
Electricite de France | 26,300 | | 1,594,878 |
Gaz de France | 65,600 | | 2,637,553 |
Groupe Danone | 18,700 | | 2,740,124 |
Icade SA | 54,100 | | 3,211,666 |
L'Oreal SA | 27,600 | | 2,684,422 |
Louis Vuitton Moet Hennessy (LVMH) | 27,700 | | 2,886,840 |
Neopost SA | 28,900 | | 3,533,867 |
Nexity | 29,100 | | 2,005,735 |
Orpea (a) | 22,600 | | 1,893,782 |
Pernod Ricard SA | 18,700 | | 3,744,996 |
Common Stocks - continued |
| Shares | | Value (Note 1) |
France - continued |
Pinault Printemps-Redoute SA | 12,900 | | $ 1,924,824 |
Renault SA | 43,600 | | 5,100,418 |
Sanofi-Aventis sponsored ADR | 40,200 | | 1,716,138 |
Schneider Electric SA | 16,400 | | 1,703,943 |
Societe Generale Series A | 49,385 | | 8,207,159 |
SR Teleperformance SA | 39,300 | | 1,420,101 |
Suez SA (France) | 47,000 | | 2,103,277 |
Total SA Series B | 122,296 | | 8,333,249 |
Veolia Environnement | 34,600 | | 2,118,520 |
Vinci SA | 25,900 | | 2,917,436 |
Vivendi Universal SA | 83,779 | | 3,172,777 |
TOTAL FRANCE | | 86,230,954 |
Germany - 4.8% |
Allianz AG (Reg.) | 39,100 | | 7,268,690 |
Bayer AG | 81,900 | | 4,110,561 |
Bilfinger Berger AG | 21,300 | | 1,327,829 |
Continental AG | 22,000 | | 2,460,440 |
Deutsche Bank AG | 28,200 | | 3,563,070 |
Deutsche Boerse AG | 19,600 | | 3,160,703 |
Deutsche Postbank AG | 23,100 | | 1,718,376 |
E.ON AG | 63,900 | | 7,692,921 |
Fresenius Medical Care AG | 12,100 | | 1,614,562 |
GFK AG | 32,877 | | 1,438,953 |
Hypo Real Estate Holding AG | 14,400 | | 905,223 |
KarstadtQuelle AG (a) | 82,900 | | 1,946,970 |
Linde AG | 30,614 | | 3,034,620 |
Merck KGaA | 18,600 | | 1,961,010 |
MPC Muenchmeyer Petersen Capital AG | 4,400 | | 386,392 |
MTU Aero Engines Holding AG | 23,500 | | 964,352 |
Muenchener Rueckversicherungs-Gesellschaft AG (Reg.) | 25,500 | | 4,139,480 |
Pfleiderer AG | 89,000 | | 2,417,399 |
Puma AG | 3,700 | | 1,312,102 |
Q-Cells AG | 24,800 | | 981,296 |
RWE AG | 53,500 | | 5,287,493 |
SAP AG sponsored ADR | 47,800 | | 2,372,792 |
SGL Carbon AG (a) | 51,200 | | 1,121,435 |
SolarWorld AG | 11,500 | | 618,556 |
Wincor Nixdorf AG | 16,300 | | 2,266,740 |
TOTAL GERMANY | | 64,071,965 |
Greece - 0.2% |
EFG Eurobank Ergasias SA | 30,300 | | 1,007,868 |
Greek Organization of Football Prognostics SA | 29,100 | | 1,039,268 |
TOTAL GREECE | | 2,047,136 |
Hong Kong - 0.7% |
BOC Hong Kong Holdings Ltd. | 302,500 | | 676,786 |
Chaoda Modern Agriculture (Holdings) Ltd. | 1,090,000 | | 660,122 |
|
| Shares | | Value (Note 1) |
China Resources Power Holdings Co. Ltd. | 404,000 | | $ 503,883 |
CNOOC Ltd. | 2,569,500 | | 2,153,755 |
Esprit Holdings Ltd. | 476,100 | | 4,609,671 |
TOTAL HONG KONG | | 8,604,217 |
India - 0.2% |
Infosys Technologies Ltd. | 57,656 | | 2,689,629 |
Pantaloon Retail India Ltd. | 10,057 | | 486,882 |
TOTAL INDIA | | 3,176,511 |
Indonesia - 0.1% |
PT Perusahaan Gas Negara Tbk Series B | 511,500 | | 640,004 |
Ireland - 0.6% |
AgCert International (a) | 126,600 | | 359,819 |
Allied Irish Banks PLC | 73,400 | | 2,005,288 |
C&C Group PLC | 167,700 | | 2,786,961 |
Paddy Power PLC (Ireland) | 50,200 | | 938,703 |
Ryanair Holdings PLC sponsored ADR (a) | 36,500 | | 2,438,930 |
TOTAL IRELAND | | 8,529,701 |
Israel - 0.4% |
Bank Hapoalim BM (Reg.) | 202,400 | | 1,008,685 |
Ormat Industries Ltd. | 142,800 | | 1,481,458 |
Teva Pharmaceutical Industries Ltd. sponsored ADR | 93,100 | | 3,069,507 |
TOTAL ISRAEL | | 5,559,650 |
Italy - 1.5% |
Autostrade Spa | 52,500 | | 1,552,645 |
ENI Spa | 89,751 | | 2,724,392 |
Fiat Spa (a) | 176,900 | | 3,124,553 |
Lottomatica Spa | 76,985 | | 2,810,341 |
Mediobanca Spa | 33,900 | | 787,859 |
Milano Assicurazioni Spa | 159,600 | | 1,245,097 |
Pirelli & C. Real Estate Spa | 19,700 | | 1,288,937 |
Unicredito Italiano Spa | 810,300 | | 6,718,598 |
TOTAL ITALY | | 20,252,422 |
Japan - 10.1% |
Aeon Co. Ltd. | 147,200 | | 3,467,305 |
Aeon Fantasy Co. Ltd. | 3,100 | | 110,260 |
Aeon Mall Co. Ltd. | 32,000 | | 1,688,099 |
Asics Corp. | 194,000 | | 2,599,162 |
Canon, Inc. | 100,650 | | 5,373,704 |
Credit Saison Co. Ltd. | 35,500 | | 1,283,901 |
Daiwa House Industry Co. Ltd. | 79,000 | | 1,425,188 |
Daiwa Securities Group, Inc. | 264,000 | | 2,995,281 |
DCM Japan Holdings Co. Ltd. | 65,120 | | 746,074 |
East Japan Railway Co. | 243 | | 1,699,504 |
Fanuc Ltd. | 24,100 | | 2,091,442 |
Fast Retailing Co. Ltd. | 15,300 | | 1,448,111 |
Honda Motor Co. Ltd. | 44,300 | | 1,565,119 |
Hoya Corp. | 64,800 | | 2,504,241 |
Idemitsu Kosan Co., Ltd. | 1,500 | | 145,947 |
Common Stocks - continued |
| Shares | | Value (Note 1) |
Japan - continued |
Japan Tobacco, Inc. | 810 | | $ 3,531,977 |
JSR Corp. | 57,900 | | 1,455,421 |
JTEKT Corp. | 53,400 | | 1,111,739 |
Kansai Urban Banking Corp. | 114,000 | | 502,941 |
Keyence Corp. | 6,900 | | 1,527,958 |
Kose Corp. | 15,700 | | 472,503 |
Matsushita Electric Industrial Co. Ltd. | 105,000 | | 2,184,000 |
Mitsubishi Estate Co. Ltd. | 121,600 | | 2,911,081 |
Mitsubishi UFJ Financial Group, Inc. | 274 | | 3,493,500 |
Mitsui & Co. Ltd. | 175,000 | | 2,389,492 |
Mitsui Fudosan Co. Ltd. | 138,000 | | 3,398,085 |
Mizuho Financial Group, Inc. | 1,296 | | 10,094,528 |
Nidec Corp. | 11,400 | | 872,350 |
Nikko Cordial Corp. | 50,000 | | 598,923 |
Nintendo Co. Ltd. | 65,900 | | 13,477,497 |
Nippon Electric Glass Co. Ltd. | 48,000 | | 1,034,200 |
Nippon Oil Corp. | 124,000 | | 922,367 |
Nishimatsuya Chain Co. Ltd. | 12,700 | | 248,115 |
Nissan Motor Co. Ltd. | 113,300 | | 1,357,159 |
Nitto Denko Corp. | 25,400 | | 1,448,512 |
Nomura Holdings, Inc. | 35,100 | | 618,462 |
NSK Ltd. | 156,000 | | 1,307,114 |
OMC Card, Inc. (d) | 50,700 | | 503,706 |
Omron Corp. | 45,500 | | 1,174,846 |
ORIX Corp. | 30,400 | | 8,564,296 |
Shin-Etsu Chemical Co. Ltd. | 5,200 | | 341,005 |
Sompo Japan Insurance, Inc. | 161,000 | | 2,141,895 |
Sony Corp. sponsored ADR | 60,700 | | 2,487,486 |
St. Marc Holdings Co. Ltd. | 6,900 | | 461,337 |
Sugi Pharmacy Co. Ltd. | 45,100 | | 817,476 |
Sumco Corp. | 30,300 | | 2,155,404 |
Sumitomo Electric Industries Ltd. | 144,700 | | 2,048,762 |
Sumitomo Metal Industries Ltd. | 344,100 | | 1,294,494 |
Sumitomo Mitsui Financial Group, Inc. | 474 | | 5,187,415 |
Sumitomo Trust & Banking Co. Ltd. | 288,200 | | 3,099,826 |
T&D Holdings, Inc. | 38,050 | | 2,781,528 |
Takeda Pharamaceutical Co. Ltd. | 56,600 | | 3,634,285 |
The Sumitomo Warehouse Co. Ltd. | 27,000 | | 190,681 |
Token Corp. | 8,300 | | 626,616 |
Tokuyama Corp. | 45,000 | | 566,348 |
Tokyo Tomin Bank Ltd. | 3,500 | | 142,442 |
Toyota Motor Corp. | 147,100 | | 8,678,900 |
Valor Co. Ltd. | 13,200 | | 194,118 |
Yamada Denki Co. Ltd. | 26,680 | | 2,655,226 |
TOTAL JAPAN | | 133,849,354 |
Korea (South) - 0.8% |
Kookmin Bank | 21,340 | | 1,696,328 |
Korean Reinsurance Co. | 81,950 | | 926,259 |
KT&G Corp. | 13,980 | | 863,503 |
LG Household & Health Care Ltd. | 37,990 | | 3,507,698 |
NHN Corp. | 19,952 | | 1,979,847 |
|
| Shares | | Value (Note 1) |
Shinhan Financial Group Co. Ltd. | 32,216 | | $ 1,485,577 |
Shinsegae Co. Ltd. | 708 | | 408,006 |
TOTAL KOREA (SOUTH) | | 10,867,218 |
Luxembourg - 0.1% |
GAGFAH SA | 5,800 | | 168,347 |
SES Global SA FDR | 89,613 | | 1,372,584 |
TOTAL LUXEMBOURG | | 1,540,931 |
Mexico - 0.9% |
America Movil SA de CV Series L sponsored ADR | 240,800 | | 10,323,096 |
Urbi, Desarrollos Urbanos, SA de CV (a) | 340,100 | | 1,042,326 |
TOTAL MEXICO | | 11,365,422 |
Netherlands - 0.9% |
ING Groep NV (Certificaten Van Aandelen) | 107,500 | | 4,765,475 |
Koninklijke KPN NV | 223,400 | | 2,985,497 |
Koninklijke Numico NV | 38,100 | | 1,703,538 |
Koninklijke Philips Electronics NV | 54,700 | | 1,905,201 |
Tele Atlas NV (Netherlands) (a) | 11,900 | | 223,129 |
TOTAL NETHERLANDS | | 11,582,840 |
Norway - 0.9% |
Aker Kvaerner ASA | 23,500 | | 2,444,696 |
DnB Nor ASA | 76,000 | | 995,257 |
Norsk Hydro ASA | 112,280 | | 2,599,282 |
ProSafe ASA | 12,500 | | 799,345 |
Renewable Energy Corp. AS | 61,000 | | 1,012,529 |
Statoil ASA | 41,500 | | 1,049,150 |
Telenor ASA | 217,600 | | 3,437,139 |
TOTAL NORWAY | | 12,337,398 |
Portugal - 0.1% |
Energias de Portugal SA | 354,200 | | 1,591,395 |
Russia - 0.2% |
Novatek JSC GDR (e) | 6,000 | | 349,200 |
OAO Gazprom sponsored ADR | 35,200 | | 1,499,520 |
OAO TMK unit | 27,400 | | 691,850 |
TOTAL RUSSIA | | 2,540,570 |
Singapore - 0.3% |
Ascendas Real Estate Investment Trust (A-REIT) | 410,000 | | 571,273 |
HTL International Holdings Ltd. | 588,750 | | 446,080 |
Keppel Corp. Ltd. | 96,000 | | 973,931 |
SembCorp Marine Ltd. | 412,000 | | 904,739 |
Singapore Exchange Ltd. | 573,000 | | 1,655,644 |
TOTAL SINGAPORE | | 4,551,667 |
Common Stocks - continued |
| Shares | | Value (Note 1) |
South Africa - 0.1% |
FirstRand Ltd. | 195,100 | | $ 510,375 |
Steinhoff International Holdings Ltd. | 209,400 | | 682,242 |
TOTAL SOUTH AFRICA | | 1,192,617 |
Spain - 1.6% |
Banco Bilbao Vizcaya Argentaria SA | 273,700 | | 6,623,540 |
Banco Santander Central Hispano SA | 295,000 | | 5,105,855 |
Gestevision Telecinco SA | 22,600 | | 593,952 |
Inditex SA | 83,200 | | 3,978,120 |
Telefonica SA | 265,300 | | 5,102,603 |
TOTAL SPAIN | | 21,404,070 |
Sweden - 0.4% |
Hennes & Mauritz AB (H&M) (B Shares) | 46,250 | | 1,994,749 |
Modern Times Group AB (MTG) (B Shares) | 63,850 | | 3,677,669 |
TOTAL SWEDEN | | 5,672,418 |
Switzerland - 6.9% |
ABB Ltd.: | | | |
(Reg.) | 74,697 | | 1,110,714 |
sponsored ADR | 1,537,400 | | 22,938,008 |
Actelion Ltd. (Reg.) (a) | 14,472 | | 2,436,912 |
Compagnie Financiere Richemont unit | 42,561 | | 2,105,558 |
Credit Suisse Group sponsored ADR | 18,200 | | 1,100,736 |
Credit Suisse Group (Reg.) | 59,212 | | 3,581,142 |
Lindt & Spruengli AG (participation certificate) | 1,255 | | 2,740,694 |
Nestle SA: | | | |
(Reg.) | 21,405 | | 7,311,920 |
sponsored ADR | 53,500 | | 4,590,300 |
Nobel Biocare Holding AG (Switzerland) | 5,654 | | 1,547,391 |
Novartis AG: | | | |
(Reg.) | 35,640 | | 2,164,417 |
sponsored ADR | 115,700 | | 7,026,461 |
Pargesa Holding SA | 11,824 | | 1,133,789 |
Roche Holding AG (participation certificate) | 77,954 | | 13,640,305 |
Societe Generale de Surveillance Holding SA (SGS) (Reg.) | 1,066 | | 1,131,846 |
Swiss Life Holding | 7,978 | | 1,882,042 |
Syngenta AG: | | | |
sponsored ADR | 32,400 | | 1,044,252 |
(Switzerland) | 19,000 | | 3,061,850 |
Tecan Group AG | 17,800 | | 954,274 |
The Swatch Group AG (Reg.) | 32,699 | | 1,306,225 |
UBS AG (NY Shares) | 156,040 | | 9,337,434 |
TOTAL SWITZERLAND | | 92,146,270 |
Taiwan - 0.5% |
Acer, Inc. | 927,000 | | 1,684,946 |
Holtek Semiconductor, Inc. | 176,000 | | 354,387 |
|
| Shares | | Value (Note 1) |
Hon Hai Precision Industry Co. Ltd. (Foxconn) | 534,614 | | $ 3,472,775 |
InnoLux Display Corp. | 85,000 | | 132,208 |
Shin Kong Financial Holding Co. Ltd. | 858,345 | | 760,673 |
TOTAL TAIWAN | | 6,404,989 |
Turkey - 0.1% |
Finansbank AS | 458,078 | | 1,807,479 |
United Kingdom - 8.4% |
Anglo American PLC (United Kingdom) | 73,600 | | 3,318,867 |
AstraZeneca PLC sponsored ADR | 70,300 | | 4,126,610 |
BAE Systems PLC | 334,400 | | 2,675,856 |
Barclays PLC | 122,400 | | 1,661,886 |
Benfield Group PLC | 250,800 | | 1,667,227 |
BG Group PLC | 114,800 | | 1,523,013 |
BG Group PLC sponsored ADR | 16,200 | | 1,076,490 |
BHP Billiton PLC | 112,600 | | 2,171,471 |
BP PLC | 670,175 | | 7,494,790 |
BP PLC sponsored ADR | 17,200 | | 1,154,120 |
British American Tobacco PLC | 171,900 | | 4,727,250 |
British Land Co. PLC | 51,800 | | 1,477,187 |
Cable & Wireless PLC | 704,100 | | 1,967,599 |
Capita Group PLC | 92,400 | | 950,004 |
Enterprise Inns PLC | 43,800 | | 900,653 |
Experian Group Ltd. | 125,100 | | 1,376,885 |
GlaxoSmithKline PLC | 21,600 | | 575,100 |
GlaxoSmithKline PLC sponsored ADR | 91,700 | | 4,883,025 |
HSBC Holdings PLC: | | | |
(Hong Kong) (Reg.) | 308,752 | | 5,895,311 |
(United Kingdom) (Reg.) | 57,800 | | 1,103,633 |
Imperial Energy PLC (a) | 35,800 | | 462,313 |
Imperial Tobacco Group PLC sponsored ADR | 14,300 | | 1,020,162 |
Informa PLC | 113,800 | | 1,185,221 |
International Power PLC | 412,700 | | 2,635,237 |
Man Group PLC | 133,100 | | 1,238,975 |
Marks & Spencer Group PLC | 363,800 | | 4,555,772 |
National Grid PLC | 130,100 | | 1,662,711 |
NDS Group PLC sponsored ADR (a) | 9,700 | | 464,048 |
Pearson PLC | 170,000 | | 2,508,267 |
Prudential PLC | 96,682 | | 1,184,904 |
Reckitt Benckiser PLC | 105,000 | | 4,568,558 |
Reed Elsevier PLC | 167,000 | | 1,901,758 |
Renovo Group PLC | 451,800 | | 1,316,412 |
Reuters Group PLC sponsored ADR | 40,900 | | 2,097,761 |
Rio Tinto PLC sponsored ADR | 11,100 | | 2,457,429 |
Rolls-Royce Group PLC | 309,346 | | 2,771,889 |
Royal Bank of Scotland Group PLC | 61,500 | | 2,191,374 |
Royal Dutch Shell PLC Class B | 161,200 | | 5,803,200 |
Scottish & Southern Energy PLC | 111,800 | | 2,802,217 |
Shire PLC | 127,000 | | 2,317,145 |
SIG PLC | 46,500 | | 885,214 |
Smiths Group PLC | 74,800 | | 1,349,762 |
Tesco PLC | 765,643 | | 5,746,926 |
Common Stocks - continued |
| Shares | | Value (Note 1) |
United Kingdom - continued |
Unilever PLC | 87,100 | | $ 2,114,788 |
Vodafone Group PLC sponsored ADR | 91,912 | | 2,375,925 |
VT Group PLC | 98,200 | | 900,992 |
Whatman PLC | 63,700 | | 352,372 |
William Hill PLC | 105,000 | | 1,303,872 |
TOTAL UNITED KINGDOM | | 110,902,181 |
United States of America - 42.5% |
AES Corp. (a) | 321,800 | | 7,076,382 |
Allergan, Inc. | 108,800 | | 12,566,400 |
Allstate Corp. | 74,600 | | 4,577,456 |
American Express Co. | 123,700 | | 7,151,097 |
American International Group, Inc. | 191,500 | | 12,863,055 |
American Superconductor Corp. (a) | 69,100 | | 655,759 |
American Tower Corp. Class A (a) | 266,600 | | 9,602,932 |
Amphenol Corp. Class A | 53,600 | | 3,639,440 |
Amylin Pharmaceuticals, Inc. (a) | 73,100 | | 3,213,476 |
Apple Computer, Inc. (a) | 190,200 | | 15,421,416 |
Applied Materials, Inc. | 319,100 | | 5,549,149 |
aQuantive, Inc. (a)(d) | 135,400 | | 3,680,172 |
Avon Products, Inc. | 477,100 | | 14,508,611 |
Bank of America Corp. | 149,600 | | 8,058,952 |
Beazer Homes USA, Inc. | 33,100 | | 1,434,554 |
Best Buy Co., Inc. | 171,900 | | 9,497,475 |
C.R. Bard, Inc. | 73,300 | | 6,007,668 |
Casual Male Retail Group, Inc. (a) | 260,700 | | 3,860,967 |
Cerner Corp. (a) | 93,400 | | 4,512,154 |
Cognizant Technology Solutions Corp. Class A (a) | 128,900 | | 9,703,592 |
Constellation Energy Group, Inc. | 63,800 | | 3,981,120 |
CSX Corp. | 138,000 | | 4,922,460 |
CyberSource Corp. (a) | 417,500 | | 4,279,375 |
Electronic Arts, Inc. (a) | 136,300 | | 7,208,907 |
EMC Corp. (a) | 382,500 | | 4,685,625 |
Exelixis, Inc. (a) | 224,900 | | 2,181,530 |
Exxon Mobil Corp. | 377,900 | | 26,989,615 |
Federated Department Stores, Inc. | 287,100 | | 12,606,561 |
Fluor Corp. | 132,600 | | 10,399,818 |
FormFactor, Inc. (a) | 139,200 | | 5,314,656 |
FPL Group, Inc. | 173,900 | | 8,868,900 |
General Dynamics Corp. | 204,700 | | 14,554,170 |
General Growth Properties, Inc. | 69,700 | | 3,617,430 |
Gilead Sciences, Inc. (a) | 72,400 | | 4,988,360 |
Google, Inc. Class A (sub. vtg.) (a) | 33,300 | | 15,863,787 |
Greenhill & Co., Inc. (d) | 50,000 | | 3,397,000 |
Harris Corp. | 73,900 | | 3,148,140 |
Health Net, Inc. (a) | 72,200 | | 2,997,022 |
Honeywell International, Inc. | 127,300 | | 5,361,876 |
Hudson City Bancorp, Inc. | 676,700 | | 9,291,091 |
International Game Technology | 114,100 | | 4,850,391 |
Inverness Medical Innovations, Inc. (a) | 77,140 | | 2,907,407 |
|
| Shares | | Value (Note 1) |
JCPenney Co., Inc. | 153,700 | | $ 11,562,851 |
Johnson & Johnson | 177,300 | | 11,950,020 |
Kroger Co. | 216,500 | | 4,869,085 |
Lennar Corp. Class A | 37,100 | | 1,761,508 |
Level 3 Communications, Inc. (a) | 748,400 | | 3,959,036 |
Macquarie Infrastructure Co. Trust | 12,100 | | 360,943 |
Merck & Co., Inc. | 398,000 | | 18,077,160 |
Microsoft Corp. | 494,200 | | 14,188,482 |
Monsanto Co. | 235,400 | | 10,409,388 |
Morgan Stanley | 143,600 | | 10,975,348 |
National Oilwell Varco, Inc. (a) | 75,304 | | 4,548,362 |
Northern Trust Corp. | 234,400 | | 13,763,968 |
NTL, Inc. | 78,750 | | 2,128,613 |
OfficeMax, Inc. | 113,700 | | 5,409,846 |
PepsiCo, Inc. | 263,600 | | 16,722,784 |
Procter & Gamble Co. | 383,000 | | 24,278,370 |
Quanta Services, Inc. (a) | 273,800 | | 5,010,540 |
Quest Software, Inc. (a) | 261,100 | | 3,846,003 |
Quicksilver Resources, Inc. (a) | 56,900 | | 1,950,532 |
Qwest Communications International, Inc. (a) | 486,300 | | 4,196,769 |
Safeway, Inc. | 206,500 | | 6,062,840 |
Senomyx, Inc. (a) | 118,400 | | 1,825,728 |
Service Corp. International (SCI) | 424,000 | | 3,866,880 |
State Street Corp. | 219,400 | | 14,092,062 |
Telik, Inc. (a) | 69,000 | | 1,307,550 |
Time Warner, Inc. | 16,700 | | 334,167 |
Titanium Metals Corp. (a) | 299,140 | | 8,818,647 |
TradeStation Group, Inc. (a) | 246,600 | | 3,859,290 |
U.S. Bancorp, Delaware | 159,400 | | 5,394,096 |
United Dominion Realty Trust, Inc. (SBI) | 124,500 | | 4,030,065 |
United Technologies Corp. | 107,100 | | 7,038,612 |
Valero Energy Corp. | 93,700 | | 4,903,321 |
Verizon Communications, Inc. | 248,400 | | 9,190,800 |
Wachovia Corp. | 76,100 | | 4,223,550 |
Wells Fargo & Co. | 261,800 | | 9,500,722 |
Whole Foods Market, Inc. | 71,300 | | 4,551,792 |
TOTAL UNITED STATES OF AMERICA | | 564,965,678 |
TOTAL COMMON STOCKS (Cost $1,098,231,605) | 1,289,970,651 |
Nonconvertible Preferred Stocks - 0.6% |
| | | |
Germany - 0.4% |
Fresenius AG (non-vtg.) | 7,800 | | 1,463,520 |
Hugo Boss AG (non-vtg.) | 31,100 | | 1,446,921 |
Porsche AG (non-vtg.) | 1,771 | | 2,064,971 |
TOTAL GERMANY | | 4,975,412 |
Italy - 0.2% |
Banca Intesa Spa (Risp) | 471,400 | | 3,125,204 |
Nonconvertible Preferred Stocks - continued |
| Shares | | Value (Note 1) |
United Kingdom - 0.0% |
Rolls-Royce Group PLC Series B | 11,352,998 | | $ 22,197 |
TOTAL NONCONVERTIBLE PREFERRED STOCKS (Cost $5,942,501) | 8,122,813 |
Money Market Funds - 1.3% |
| | | |
Fidelity Cash Central Fund, 5.34% (b) | 14,307,602 | | 14,307,602 |
Fidelity Securities Lending Cash Central Fund, 5.35% (b)(c) | 2,963,850 | | 2,963,850 |
TOTAL MONEY MARKET FUNDS (Cost $17,271,452) | 17,271,452 |
TOTAL INVESTMENT PORTFOLIO - 99.0% (Cost $1,121,445,558) | | 1,315,364,916 |
NET OTHER ASSETS - 1.0% | | 12,854,264 |
NET ASSETS - 100% | $ 1,328,219,180 |
Legend |
(a) Non-income producing |
(b) Affiliated fund that is available only to investment companies and other accounts managed by Fidelity Investments. The rate quoted is the annualized seven-day yield of the fund at period end. A complete unaudited listing of the fund's holdings as of its most recent quarter end is available upon request. |
(c) Investment made with cash collateral received from securities on loan. |
(d) Security or a portion of the security is on loan at period end. |
(e) Security exempt from registration under Rule 144A of the Securities Act of 1933. These securities may be resold in transactions exempt from registration, normally to qualified institutional buyers. At the end of the period, the value of these securities amounted to $602,876 or 0.0% of net assets. |
Affiliated Central Funds |
Information regarding fiscal year to date income earned by the Fund from investments in Fidelity Central Funds is as follows: |
Fund | Income earned |
Fidelity Cash Central Fund | $ 960,225 |
Fidelity Securities Lending Cash Central Fund | 437,710 |
Total | $ 1,397,935 |
Annual Report
See accompanying notes which are an integral part of the financial statements.
Worldwide
Financial Statements
Statement of Assets and Liabilities
October 31, 2006 |
| | |
Assets | | |
Investment in securities, at value (including securities loaned of $2,881,183) - See accompanying schedule: Unaffiliated issuers (cost $1,104,174,106) | $ 1,298,093,464 | |
Fidelity Central Funds (cost $17,271,452) | 17,271,452 | |
Total Investments (cost $1,121,445,558) | | $ 1,315,364,916 |
Cash | | 1,700,340 |
Foreign currency held at value (cost $498,832) | | 502,068 |
Receivable for investments sold | | 35,997,365 |
Receivable for fund shares sold | | 821,814 |
Dividends receivable | | 1,003,684 |
Interest receivable | | 63,740 |
Other receivables | | 90,713 |
Total assets | | 1,355,544,640 |
| | |
Liabilities | | |
Payable for investments purchased | $ 20,937,389 | |
Payable for fund shares redeemed | 2,303,979 | |
Accrued management fee | 695,364 | |
Other affiliated payables | 305,084 | |
Other payables and accrued expenses | 119,794 | |
Collateral on securities loaned, at value | 2,963,850 | |
Total liabilities | | 27,325,460 |
| | |
Net Assets | | $ 1,328,219,180 |
Net Assets consist of: | | |
Paid in capital | | $ 939,194,561 |
Undistributed net investment income | | 10,732,638 |
Accumulated undistributed net realized gain (loss) on investments and foreign currency transactions | | 184,435,755 |
Net unrealized appreciation (depreciation) on investments and assets and liabilities in foreign currencies | | 193,856,226 |
Net Assets, for 60,875,390 shares outstanding | | $ 1,328,219,180 |
Net Asset Value, offering price and redemption price per share ($1,328,219,180 ÷ 60,875,390 shares) | | $ 21.82 |
Statement of Operations
Year ended October 31, 2006 |
| | |
Investment Income | | |
Dividends | | $ 24,051,966 |
Interest | | 61,276 |
Income from Fidelity Central Funds (including $437,710 from security lending) | | 1,397,935 |
| | 25,511,177 |
Less foreign taxes withheld | | (1,327,199) |
Total income | | 24,183,978 |
| | |
Expenses | | |
Management fee
Basic fee | $ 9,271,433 | |
Performance adjustment | 499,487 | |
Transfer agent fees | 3,134,674 | |
Accounting and security lending fees | 570,707 | |
Custodian fees and expenses | 384,514 | |
Independent trustees' compensation | 5,150 | |
Registration fees | 31,807 | |
Audit | 73,458 | |
Legal | 24,260 | |
Interest | 3,230 | |
Miscellaneous | 12,398 | |
Total expenses before reductions | 14,011,118 | |
Expense reductions | (831,972) | 13,179,146 |
Net investment income (loss) | | 11,004,832 |
Realized and Unrealized Gain (Loss) Net realized gain (loss) on: | | |
Investment securities: | | |
Unaffiliated issuers (net of foreign taxes of $66,852) | 190,888,339 | |
Foreign currency transactions | (399,208) | |
Total net realized gain (loss) | | 190,489,131 |
Change in net unrealized appreciation (depreciation) on: Investment securities (net of increase in deferred foreign taxes of $11,374) | 41,384,472 | |
Assets and liabilities in foreign currencies | (26,863) | |
Total change in net unrealized appreciation (depreciation) | | 41,357,609 |
Net gain (loss) | | 231,846,740 |
Net increase (decrease) in net assets resulting from operations | | $ 242,851,572 |
Annual Report
See accompanying notes which are an integral part of the financial statements.
Worldwide
Financial Statements - continued
Statement of Changes in Net Assets
| Year ended
October 31,
2006 | Year ended
October 31,
2005 |
Increase (Decrease) in Net Assets | | |
Operations | | |
Net investment income (loss) | $ 11,004,832 | $ 9,556,230 |
Net realized gain (loss) | 190,489,131 | 88,740,949 |
Change in net unrealized appreciation (depreciation) | 41,357,609 | 57,827,036 |
Net increase (decrease) in net assets resulting from operations | 242,851,572 | 156,124,215 |
Distributions to shareholders from net investment income | (6,174,286) | (6,368,718) |
Distributions to shareholders from net realized gain | (64,208,386) | (1,273,744) |
Total distributions | (70,382,672) | (7,642,462) |
Share transactions
Proceeds from sales of shares | 204,091,203 | 207,137,584 |
Reinvestment of distributions | 68,541,602 | 7,416,065 |
Cost of shares redeemed | (297,960,894) | (246,181,366) |
Net increase (decrease) in net assets resulting from share transactions | (25,328,089) | (31,627,717) |
Redemption fees | 34,454 | 27,535 |
Total increase (decrease) in net assets | 147,175,265 | 116,881,571 |
| | |
Net Assets | | |
Beginning of period | 1,181,043,915 | 1,064,162,344 |
End of period (including undistributed net investment income of $10,732,638 and undistributed net investment income of $5,779,821, respectively) | $ 1,328,219,180 | $ 1,181,043,915 |
Other Information Shares | | |
Sold | 9,990,392 | 11,450,556 |
Issued in reinvestment of distributions | 3,551,377 | 421,368 |
Redeemed | (14,660,695) | (13,517,553) |
Net increase (decrease) | (1,118,926) | (1,645,629) |
Financial Highlights
Years ended October 31, | 2006 | 2005 | 2004 | 2003 | 2002 |
Selected Per-Share Data | | | | | |
Net asset value, beginning of period | $ 19.05 | $ 16.72 | $ 15.30 | $ 11.91 | $ 13.48 |
Income from Investment Operations | | | | | |
Net investment income (loss) B | .17 | .15 E | .05 F | .04 | .03 |
Net realized and unrealized gain (loss) | 3.74 | 2.30 | 1.44 | 3.37 | (1.60) |
Total from investment operations | 3.91 | 2.45 | 1.49 | 3.41 | (1.57) |
Distributions from net investment income | (.10) | (.10) | (.07) | (.02) | - |
Distributions from net realized gain | (1.04) | (.02) | - | - | - |
Total distributions | (1.14) | (.12) | (.07) | (.02) | - |
Redemption fees added to paid in capital B | - H | - H | - H | - H | - H |
Net asset value, end of period | $ 21.82 | $ 19.05 | $ 16.72 | $ 15.30 | $ 11.91 |
Total Return A | 21.31% | 14.71% | 9.77% | 28.68% | (11.65)% |
Ratios to Average Net Assets C,G | | | | | |
Expenses before reductions | 1.08% | 1.07% | 1.23% | 1.31% | 1.24% |
Expenses net of fee waivers, if any | 1.08% | 1.07% | 1.23% | 1.31% | 1.24% |
Expenses net of all reductions | 1.02% | 1.01% | 1.19% | 1.28% | 1.20% |
Net investment income (loss) | .85% | .82% E | .29% F | .28% | .19% |
Supplemental Data | | | | | |
Net assets, end of period (000 omitted) | $ 1,328,219 | $ 1,181,044 | $ 1,064,162 | $ 849,087 | $ 647,789 |
Portfolio turnover rate D | 205% | 93% | 95% | 106% | 120% |
A Total returns would have been lower had certain expenses not been reduced during the periods shown. B Calculated based on average shares outstanding during the period. C Fees and expenses of the underlying Fidelity Central Funds are not included in the Fund's expense ratio. The Fund indirectly bears its proportionate share of the expense of any underlying Fidelity Central Funds. D Amount does not include the portfolio activity of any underlying Fidelity Central Funds. E Investment income per share reflects a special dividend which amounted to $.04 per share. Excluding the special dividend, the ratio of net investment income (loss) to average net assets would have been .60%. F Net investment income per share includes approximately $.01 per share received as a result of a reorganization of an issuer that was in bankruptcy. Excluding this non-recurring amount, the ratio of net investment income (loss) to average net assets would have been .25%. G Expense ratios reflect operating expenses of the Fund. Expenses before reductions do not reflect amounts reimbursed by the investment adviser or reductions from brokerage service arrangements or other expense offset arrangements and do not represent the amount paid by the Fund during periods when reimbursements or reductions occur. Expenses net of fee waivers reflect expenses after reimbursement by the investment adviser but prior to reductions from brokerage service arrangements or other expense offset arrangements. Expenses net of all reductions represent the net expenses paid by the Fund. H Amount represents less than $.01 per share. |
Annual Report
See accompanying notes which are an integral part of the financial statements.
Notes to Financial Statements
For the period ended October 31, 2006
1. Significant Accounting Policies.
Fidelity Global Balanced Fund, Fidelity Diversified International Fund, Fidelity Aggressive International Fund, Fidelity Overseas Fund and Fidelity Worldwide Fund (the Funds) are funds of Fidelity Investment Trust (the trust). The trust is registered under the Investment Company Act of 1940, as amended (the 1940 Act), as an open-end management investment company organized as a Massachusetts business trust. Each Fund is authorized to issue an unlimited number of shares. Fidelity Diversified International Fund is currently closed to most new accounts. Certain Funds' investments in emerging markets can be subject to social, economic, regulatory, and political uncertainties and can be extremely volatile. The Funds may invest in Fidelity Central Funds which are open-end investment companies available to investment companies and other accounts managed by affiliates of Fidelity Management & Research Company (FMR) and its affiliates.
The financial statements have been prepared in conformity with accounting principles generally accepted in the United States of America, which require management to make certain estimates and assumptions at the date of the financial statements. The following summarizes the significant accounting policies of the Funds, which are also consistently followed by the Fidelity Central Funds:
Security Valuation. Investments are valued and net asset value (NAV) per share is calculated (NAV calculation) as of the close of business of the New York Stock Exchange (NYSE), normally 4:00 p.m. Eastern time. Wherever possible, each Fund uses independent pricing services approved by the Board of Trustees to value their investments.
Equity securities, including restricted securities, for which market quotations are readily available, are valued at the last reported sale price or official closing price as reported by an independent pricing service on the primary market or exchange on which they are traded. In the event there were no sales during the day or closing prices are not available, securities are valued at the last quoted bid price. Debt securities, including restricted securities, for which quotations are readily available, are valued by independent pricing services or by dealers who make markets in such securities. Pricing services consider yield or price of bonds of comparable quality, coupon, maturity and type as well as dealer supplied prices. Investments in open-end mutual funds, including the Fidelity Central Funds, are valued at their closing net asset value each business day. Short-term securities with remaining maturities of sixty days or less for which quotations are not readily available are valued at amortized cost, which approximates value.
When current market prices or quotations are not readily available or do not accurately reflect fair value, valuations may be determined in accordance with procedures adopted by the Board of Trustees. For example, when developments occur between the close of a market and the close of the NYSE that may materially affect the value of some or all of the securities, or when trading in a security is halted, those securities may be fair valued. Factors used in the determination of fair value may include monitoring news to identify significant market or security specific events such as changes in the value of U.S. securities markets, reviewing developments in foreign markets and evaluating the performance of ADRs, futures contracts and exchange-traded funds. Because each Fund's utilization of fair value pricing depends on market activity, the frequency with which fair value pricing is used can not be predicted and may be utilized to a significant extent. The value of securities used for NAV calculation under fair value pricing may differ from published prices for the same securities.
Foreign Currency. Funds may use foreign currency contracts to facilitate transactions in foreign-denominated securities. Losses from these transactions may arise from changes in the value of the foreign currency or if the counterparties do not perform under the contracts' terms.
Foreign-denominated assets, including investment securities, and liabilities are translated into U.S. dollars at the exchange rate at period end. Purchases and sales of investment securities, income and dividends received and expenses denominated in foreign currencies are translated into U.S. dollars at the exchange rate in effect on the transaction date.
The effects of exchange rate fluctuations on investments are included with the net realized and unrealized gain (loss) on investment securities. Other foreign currency transactions resulting in realized and unrealized gain (loss) are disclosed separately.
Investment Transactions and Income. Security transactions, including the Fund's investment activity in the Fidelity Central Funds, are accounted for as of trade date. Gains and losses on securities sold are determined on the basis of identified cost and may include proceeds received from litigation. Dividend income is recorded on the ex-dividend date, except for certain dividends from foreign securities where the ex-dividend date may have passed, which are recorded as soon as the Fund is informed of the ex-dividend date. Non-cash dividends included in dividend income, if any, are recorded at the fair market value of the securities received. Distributions received on securities that represent a return of capital or capital gain are recorded as a reduction of cost of investments and/or as a realized gain. The Funds estimate the components of distributions received that may be considered return of capital distributions or capital gain distributions. Interest income and distributions from the Fidelity Central Funds are accrued as earned. Interest income includes coupon interest and amortization of premium and accretion of discount on debt securities.
Expenses. Most expenses of the trust can be directly attributed to a fund. Expenses which cannot be directly attributed are apportioned among each Fund in the trust. Expense estimates are accrued in the period to which they relate and adjustments are made when actual amounts are known.
Annual Report
Notes to Financial Statements - continued
1. Significant Accounting Policies - continued
Deferred Trustee Compensation. Under a Deferred Compensation Plan (the Plan) for Overseas and Diversified International, Independent Trustees must defer receipt of a portion of, and may elect to defer receipt of an additional portion of, their annual compensation. Deferred amounts are invested in a cross-section of Fidelity funds, are marked-to-market and remain in the Fund until distributed in accordance with the Plan. The investment of deferred amounts and the offsetting payable to the Trustees are included in the accompanying Statement of Assets and Liabilities.
Income Tax Information and Distributions to Shareholders. Each year, each Fund intends to qualify as a regulated investment company by distributing all of its taxable income and realized gains under Subchapter M of the Internal Revenue Code. As a result, no provision for income taxes is required in the accompanying financial statements. Foreign taxes are provided for based on each Fund's understanding of the tax rules and rates that exist in the foreign markets in which it invests.
Distributions are recorded on the ex-dividend date. Income and capital gain distributions are determined in accordance with income tax regulations, which may differ from generally accepted accounting principles. In addition, certain Funds will claim a portion of the payment made to redeeming shareholders as a distribution for income tax purposes.
Capital accounts within the financial statements are adjusted for permanent book-tax differences. These adjustments have no impact on net assets or the results of operations. Temporary book-tax differences will reverse in a subsequent period.
Book-tax differences are primarily due to foreign currency transactions, certain foreign taxes, futures transactions, passive foreign investment companies (PFIC), market discount, partnerships, deferred trustees compensation, capital loss carry forwards and losses deferred due to wash sales.
The tax-basis components of distributable earnings and the federal tax cost as of period end were as follows for each Fund:
| Cost for Federal
Income Tax
Purposes | Unrealized
Appreciation | Unrealized
Depreciation | Net Unrealized
Appreciation/
(Depreciation) |
Global Balanced | $ 241,259,818 | $ 21,315,061 | $ (3,269,863) | $ 18,045,198 |
Diversified International | 33,908,870,703 | 11,363,478,764 | (391,637,365) | 10,971,841,399 |
Aggressive International | 481,408,233 | 31,974,884 | (5,356,947) | 26,617,937 |
Overseas | 6,386,039,433 | 1,070,540,371 | (132,554,779) | 937,985,592 |
Worldwide | 1,124,856,554 | 203,893,958 | (13,385,596) | 190,508,362 |
| Undistributed
Ordinary Income | Undistributed
Long-term
Capital Gain |
Global Balanced | $ 8,304,292 | $ 17,861,922 |
Diversified International | 429,952,388 | 2,939,888,990 |
Aggressive International | 10,433,531 | 65,358,273 |
Overseas | 299,565,666 | 491,474,924 |
Worldwide | 43,639,998 | 126,367,089 |
The tax character of distributions paid was as follows:
October 31, 2006 | | | |
| Ordinary
Income | Long-term
Capital Gains | Total |
Global Balanced | $ 5,569,465 | $ 10,690,705 | $ 16,260,170 |
Diversified International | 342,153,004 | 645,163,292 | 987,316,296 |
Aggressive International | 7,891,662 | 60,750,944 | 68,642,606 |
Overseas | 72,064,301 | - | 72,064,301 |
Worldwide | 10,496,004 | 59,886,668 | 70,382,672 |
October 31, 2005 | | | |
| Ordinary
Income | Long-term
Capital Gains | Total |
Global Balanced | $ 2,039,758 | $ 1,238,422 | $ 3,278,180 |
Diversified International | 167,284,971 | - | 167,284,971 |
Aggressive International | 2,242,652 | - | 2,242,652 |
Overseas | 39,144,566 | - | 39,144,566 |
Worldwide | 7,642,462 | - | 7,642,462 |
Annual Report
1. Significant Accounting Policies - continued
Short-Term Trading (Redemption) Fees. Shares held in the Funds less than 30 days are subject to a redemption fee equal to 1% of the proceeds of the redeemed shares. All redemption fees, including any estimated redemption fees paid by FMR, are retained by the Funds and accounted for as an addition to paid in capital.
New Accounting Pronouncements. In July 2006, Financial Accounting Standards Board Interpretation No. 48, Accounting for Uncertainty in Income Taxes - an interpretation of FASB Statement 109 (FIN 48), was issued and is effective for fiscal years beginning after December 15, 2006. FIN 48 sets forth a threshold for financial statement recognition, measurement and disclosure of a tax position taken or expected to be taken on a tax return. Management is currently evaluating the impact, if any, the adoption of FIN 48 will have on the Funds' net assets, results of operations and financial statement disclosures.
In addition, in September 2006, Statement of Financial Accounting Standards No. 157, Fair Value Measurements (SFAS 157), was issued and is effective for fiscal years beginning after November 15, 2007. SFAS 157 defines fair value, establishes a framework for measuring fair value and expands disclosures about fair value measurements. Management is currently evaluating the impact the adoption of SFAS 157 will have on the Funds' financial statement disclosures.
2. Operating Policies.
Forward Foreign Currency Contracts. Diversified International Fund generally uses foreign currency contracts to facilitate transactions in foreign-denominated securities and to manage the Fund's currency exposure. Contracts to sell generally are used to hedge the Fund's investments against currency fluctuations, while contracts to buy generally are used to offset a previous contract to sell. Also, a contract to buy can be used to acquire exposure to foreign currencies and a contract to sell can be used to offset a previous contract to buy. These contracts involve market risk in excess of the unrealized gain or loss reflected in the Fund's Statement of Assets and Liabilities. The U.S. dollar value of the currencies the Fund has committed to buy or sell is shown in the Schedule of Investments under the caption "Forward Foreign Currency Contracts." This amount represents the aggregate exposure to each currency the Fund has acquired or hedged through currency contracts at period end. Losses may arise from changes in the value of foreign currency or if the counterparties do not perform under the contracts' terms.
The U.S. dollar value of forward foreign currency contracts is determined using forward currency exchange rates supplied by a quotation service. Purchases and sales of forward foreign currency contracts having the same settlement date and broker are offset and any realized gain (loss) recognized on the date of offset: otherwise, gain (loss) is recognized on settlement date. Contracts that have been offset with different counterparties are reflected as both a contract to buy and a contract to sell in the Schedule of Investments under the caption "Forward Foreign Currency Contracts."
Repurchase Agreements. FMR has received an Exemptive Order from the Securities and Exchange Commission (the SEC) which permits certain Funds and other affiliated entities of FMR to transfer uninvested cash balances into joint trading accounts which are then invested in repurchase agreements. Certain Funds may also invest directly with institutions in repurchase agreements. Repurchase agreements are collateralized by government or non-government securities. Upon settlement date, collateral is held in segregated accounts with custodian banks and may be obtained in the event of a default of the counterparty. Each applicable Fund monitors, on a daily basis, the value of the collateral to ensure it is at least equal to the principal amount of the repurchase agreement (including accrued interest). In the event of a default by the counterparty, realization of the collateral proceeds could be delayed, during which time the value of the collateral may decline.
Futures Contracts. Certain Funds may use futures contracts to manage their exposure to the stock market. Buying futures tends to increase a fund's exposure to the underlying instrument, while selling futures tends to decrease a fund's exposure to the underlying instrument or hedge other fund investments. Upon entering into a futures contract, a fund is required to deposit with a clearing broker, no later than the following business day, an amount ("initial margin") equal to a certain percentage of the face value of the contract. The initial margin may be in the form of cash or securities and is transferred to a segregated account on settlement date. Subsequent payments ("variation margin") are made or received by a fund depending on the daily fluctuations in the value of the futures contract and are accounted for as unrealized gains or losses. Realized gains (losses) are recorded upon the expiration or closing of the futures contract. Securities deposited to meet margin requirements are identified in each applicable fund's Schedule of Investments. Losses may arise from changes in the value of the underlying instruments or if the counterparties do not perform under the contract's terms. Futures contracts are valued at the settlement price established each day by the board of trade or exchange on which they are traded.
Restricted Securities. Certain Funds may invest in securities that are subject to legal or contractual restrictions on resale. These securities generally may be resold in transactions exempt from registration or to the public if the securities are registered. Disposal of these securities may involve time-consuming negotiations and expense, and prompt sale at an acceptable price may be difficult. Information regarding restricted securities is included at the end of each applicable Fund's Schedule of Investments.
Annual Report
Notes to Financial Statements - continued
3. Purchases and Sales of Investments.
Purchases and sales of securities (including non Money Market Central Funds), other than short-term securities and U.S. government securities, are noted in the table below.
| Purchases ($) | Sales ($) |
Global Balanced | 453,908,287 | 408,484,330 |
Diversified International | 25,959,908,294 | 21,718,092,141 |
Aggressive International | 953,651,853 | 1,259,477,638 |
Overseas | 8,503,255,529 | 7,713,503,837 |
Worldwide | 2,602,531,479 | 2,683,785,902 |
4. Fees and Other Transactions with Affiliates.
Management Fee. FMR and its affiliates provide the Funds with investment management related services for which the Funds pay a monthly management fee. The management fee is the sum of an individual fund fee rate and a group fee rate. The individual fund fee rate is applied to each Fund's average net assets. The group fee rate is based upon the average net assets of all the mutual funds advised by FMR. The group fee rate decreases as assets under management increase and increases as assets under management decrease. In addition, the management fee for Diversified International, Aggressive International, Overseas and Worldwide is subject to a performance adjustment (up to a maximum ± .20% of each applicable Fund's average net assets over a 36 month performance period). The upward or downward adjustment to the management fee is based on each Fund's relative investment performance as compared to an appropriate benchmark index. For the period, each Fund's annual management fee rate expressed as a percentage of each Fund's average net assets, including the performance adjustment, if applicable was as follows:
| Individual Rate | Group Rate | Total |
Global Balanced | .45% | .27% | .72% |
Diversified International | .45% | .27% | .75% |
Aggressive International | .45% | .27% | .49% |
Overseas | .45% | .27% | .69% |
Worldwide | .45% | .27% | .76% |
Transfer Agent Fees. Fidelity Service Company, Inc. (FSC), an affiliate of FMR, is the Funds' transfer, dividend disbursing and shareholder servicing agent. FSC receives account fees and asset-based fees that vary according to account size and type of account. FSC pays for typesetting, printing and mailing of shareholder reports, except proxy statements. For the period, the transfer agent fees were equivalent to the following annual rates expressed as a percentage of average net assets:
Global Balanced | .25% |
Diversified International | .22% |
Aggressive International | .26% |
Overseas | .25% |
Worldwide | .24% |
Accounting and Security Lending Fees. FSC maintains each Fund's accounting records. The accounting fee is based on the level of average net assets for the month. Under a separate contract, FSC administers the security lending program. The security lending fee is based on the number and duration of lending transactions.
Investments in Fidelity Central Funds. The Funds may invest in Fidelity Central Funds. The Funds' Schedule of Investments lists each of the Fidelity Central Funds as an investment of each Fund but does not include the underlying holdings of each Fidelity Central Fund. As an Investing Fund, the Funds indirectly bear their proportionate share of the expenses of the underlying Fidelity Central Funds. A complete unaudited list of holdings for each Fidelity Central Fund is available upon request. In addition, the financial statements of the Fidelity Central Funds, which are not covered by the Funds' Report of Independent Registered Public Accounting Firm, are available on the EDGAR Database on the SEC's web site, www.sec.gov, or upon request.
The Money Market Central Funds seek preservation of capital and current income and are managed by Fidelity Investments Money Management, Inc. (FIMM), an affiliate of FMR.
Annual Report
4. Fees and Other Transactions with Affiliates - continued
Brokerage Commissions. Certain Funds placed a portion of their portfolio transactions with brokerage firms which are affiliates of the investment adviser. The commissions paid to these affiliated firms were as follows:
| Amount |
Global Balanced | $ 3,423 |
Diversified International | 32,000 |
Aggressive International | 448 |
Overseas | 4,588 |
Worldwide | 24,407 |
Interfund Lending Program. Pursuant to an Exemptive Order issued by the SEC, the Funds, along with other registered investment companies having management contracts with FMR, may participate in an interfund lending program. This program provides an alternative credit facility allowing the Funds to borrow from, or lend money to, other participating affiliated funds. At period end, there were no interfund loans outstanding. Each applicable fund's activity in this program during the period for which loans were outstanding was as follows:
| Borrower or
Lender | Average Daily
Loan Balance | Weighted
Average
Interest Rate | Interest
Expense |
Aggressive International | Borrower | $ 5,450,000 | 4.43% | $ 5,369 |
Worldwide | Borrower | 5,674,250 | 5.12% | 3,230 |
5. Committed Line of Credit.
Certain Funds participate with other funds managed by FMR in a $4.2 billion credit facility (the "line of credit") to be utilized for temporary or emergency purposes to fund shareholder redemptions or for other short-term liquidity purposes. The participating funds have agreed to pay commitment fees on their pro rata portion of the line of credit, which is reflected in Miscellaneous Expense on the Statement of Operations, and is as follows:
Global Balanced | $ 611 |
Diversified International | 101,964 |
Aggressive International | 1,634 |
Overseas | 16,445 |
Worldwide | 3,558 |
During the period, there were no borrowings on this line of credit.
6. Security Lending.
Certain Funds lend portfolio securities from time to time in order to earn additional income. On the settlement date of the loan, each applicable Fund receives collateral (in the form of U.S. Treasury obligations, letters of credit and/or cash) against the loaned securities and maintains collateral in an amount not less than 100% of the market value of the loaned securities during the period of the loan. The market value of the loaned securities is determined at the close of business of the Funds and any additional required collateral is delivered to the Funds on the next business day. If the borrower defaults on its obligation to return the securities loaned because of insolvency or other reasons, a fund could experience delays and costs in recovering the securities loaned or in gaining access to the collateral. Any cash collateral received is invested in the Fidelity Securities Lending Cash Central Fund. The value of loaned securities and cash collateral at period end are disclosed on each applicable Fund's Statement of Assets and Liabilities. Security lending income represents the income earned on investing cash collateral, less fees and expenses associated with the loan, plus any premium payments that may be received on the loan of certain types of securities. Security lending income is presented on each applicable Fund's Statement of Operations as a component of income from Fidelity Central Funds.
7. Bank Borrowings.
Each Fund is permitted to have bank borrowings for temporary or emergency purposes to fund shareholder redemptions. Each Fund has established borrowing arrangements with certain banks. The interest rate on the borrowings is the bank's base rate, as revised from time to time. At period end, there were no bank borrowings outstanding. Each applicable Fund's activity in this program during the period for which loans were outstanding was as follows:
| Average Daily
Loan Balance | Weighted Average
Interest Rate |
Diversified International | $ 13,013,000 | 4.56% |
Overseas | 6,829,000 | 4.50% |
Annual Report
Notes to Financial Statements - continued
8. Expense Reductions.
Many of the brokers with whom FMR places trades on behalf of certain Funds provided services to these Funds in addition to trade execution. These services included payments of expenses on behalf of each applicable Fund. In addition, through arrangements with each applicable fund's custodian and transfer agent, credits realized as a result of uninvested cash balances were used to reduce each applicable fund's expenses. All of the applicable expense reductions are noted in the table below.
| Brokerage
Service
Arrangements | Custody
expense
reduction | Transfer
Agent
expense
reduction |
Global Balanced | $ 81,288 | $ 350 | $ 8,799 |
Diversified International | 12,555,964 | 36,316 | 2,143,098 |
Aggressive International | 625,404 | 10,029 | 8,532 |
Overseas | 5,703,289 | 17,960 | 435,826 |
Worldwide | 766,650 | 6,058 | 59,264 |
9. Other.
The Funds' organizational documents provide former and current trustees and officers with a limited indemnification against liabilities arising in connection with the performance of their duties to the Funds. In the normal course of business, the Funds may also enter into contracts that provide general indemnifications. The Funds' maximum exposure under these arrangements is unknown as this would be dependent on future claims that may be made against the Funds. The risk of material loss from such claims is considered remote.
At the end of the period, Fidelity Freedom Funds were the owners of record, in the aggregate of approximately 25% of the total outstanding shares of Overseas.
The United States Securities and Exchange Commission ("SEC") is conducting an investigation of FMR (covering the years 2002 to 2004) arising from gifts, gratuities and business entertainment provided by certain brokers to certain individuals who were employed on FMR's domestic equity trading desk during that period. FMR is in discussions with the SEC staff regarding the possible resolution of the matter, but as of period-end no final resolution has been reached.
In December 2006, the Independent Trustees completed their own investigation of the matter with the assistance of independent counsel. The Independent Trustees and FMR agree that, despite the absence of proof that the Fidelity mutual funds experienced diminished execution quality as a result of the improper receipt of gifts and business entertainment, the conduct at issue was serious and is worthy of redress. Accordingly, the Independent Trustees have requested and FMR has agreed to pay $42 million to Fidelity mutual funds, plus interest to be determined at the time that payment is made. A method of allocating this payment among the funds has not yet been determined. In addition, FMR has agreed to reimburse related legal expenses. The total payment to each of the Funds is not anticipated to have a material impact on such Fund's net assets.
Annual Report
Report of Independent Registered Public Accounting Firm
To the Trustees of Fidelity Investment Trust and the Shareholders of Fidelity Global Balanced Fund and Fidelity Overseas Fund:
In our opinion, the accompanying statements of assets and liabilities, including the schedules of investments, and the related statements of operations and of changes in net assets and the financial highlights present fairly, in all material respects, the financial position of Fidelity Global Balanced Fund and Fidelity Overseas Fund (funds of Fidelity Investment Trust) at October 31, 2006 and the results of their operations, the changes in their net assets and the financial highlights for the periods indicated, in conformity with accounting principles generally accepted in the United States of America. These financial statements and financial highlights (hereafter referred to as "financial statements") are the responsibility of the Fidelity Investment Trust's management; our responsibility is to express an opinion on these financial statements based on our audits. We conducted our audits of these financial statements in accordance with the standards of the Public Company Accounting Oversight Board (United States). Those standards require that we plan and perform the audit to obtain reasonable assurance about whether the financial statements are free of material misstatement. An audit includes examining, on a test basis, evidence supporting the amounts and disclosures in the financial statements, assessing the accounting principles used and significant estimates made by management, and evaluating the overall financial statement presentation. We believe that our audits, which included confirmation of securities at October 31, 2006 by correspondence with the custodian and brokers, provide a reasonable basis for our opinion.
PricewaterhouseCoopers LLP
Boston, Massachusetts
December 21, 2006
Annual Report
Report of Independent Registered Public Accounting Firm
To the Trustees of Fidelity Investment Trust and Shareholders of Fidelity Diversified International Fund, Fidelity Aggressive International Fund and Fidelity Worldwide Fund:
We have audited the accompanying statements of assets and liabilities of Fidelity Diversified International Fund, Fidelity Aggressive International Fund and Fidelity Worldwide Fund (the Funds), funds of Fidelity Investment Trust (the Trust) including the schedules of investments, as of October 31, 2006, and the related statements of operations for the year then ended, the statements of changes in net assets for each of the two years in the period then ended, and the financial highlights for each of the five years in the period then ended. These financial statements and financial highlights are the responsibility of the Funds' management. Our responsibility is to express an opinion on these financial statements and financial highlights based on our audits.
We conducted our audits in accordance with standards of the Public Company Accounting Oversight Board (United States). Those standards require that we plan and perform the audit to obtain reasonable assurance about whether the financial statements and financial highlights are free of material misstatement. The Funds are not required to have, nor were we engaged to perform, an audit of their internal control over financial reporting. Our audits included consideration of internal control over financial reporting as a basis for designing audit procedures that are appropriate in the circumstances, but not for the purpose of expressing an opinion on the effectiveness of the Funds' internal control over financial reporting. Accordingly, we express no such opinion. An audit also includes examining, on a test basis, evidence supporting the amounts and disclosures in the financial statements, assessing the accounting principles used and significant estimates made by management, as well as evaluating the overall financial statement presentation. Our procedures included confirmation of securities owned as of October 31, 2006, by correspondence with the custodians and brokers; where replies were not received from brokers, we performed other auditing procedures. We believe that our audits provide a reasonable basis for our opinion.
In our opinion, the financial statements and financial highlights referred to above present fairly, in all material respects, the financial positions of Fidelity Diversified International Fund, Fidelity Aggressive International Fund and Fidelity Worldwide Fund as of October 31, 2006, the results of their operations for the year then ended, the changes in their net assets for each of the two years in the period then ended, and their financial highlights for each of the five years in the period then ended, in conformity with accounting principles generally accepted in the United States of America.
/s/DELOITTE & TOUCHE LLP
DELOITTE & TOUCHE LLP
Boston, Massachusetts
December 21, 2006
Annual Report
Trustees and Officers
The Trustees, Members of the Advisory Board, and executive officers of the trust and funds, as applicable, are listed below. The Board of Trustees governs each fund and is responsible for protecting the interests of shareholders. The Trustees are experienced executives who meet periodically throughout the year to oversee each fund's activities, review contractual arrangements with companies that provide services to each fund, and review each fund's performance. Except for William O. McCoy, each of the Trustees oversees 348 funds advised by FMR or an affiliate. Mr. McCoy oversees 350 funds advised by FMR or an affiliate.
The Trustees hold office without limit in time except that (a) any Trustee may resign; (b) any Trustee may be removed by written instrument, signed by at least two-thirds of the number of Trustees prior to such removal; (c) any Trustee who requests to be retired or who has become incapacitated by illness or injury may be retired by written instrument signed by a majority of the other Trustees; and (d) any Trustee may be removed at any special meeting of shareholders by a two-thirds vote of the outstanding voting securities of the trust. Each Trustee who is not an interested person (as defined in the 1940 Act) (Independent Trustee), shall retire not later than the last day of the calendar year in which his or her 72nd birthday occurs. The Independent Trustees may waive this mandatory retirement age policy with respect to individual Trustees. The executive officers and Advisory Board Members hold office without limit in time, except that any officer and Advisory Board Member may resign or may be removed by a vote of a majority of the Trustees at any regular meeting or any special meeting of the Trustees. Except as indicated, each individual has held the office shown or other offices in the same company for the past five years.
The fund's Statement of Additional Information (SAI) includes more information about the Trustees. To request a free copy, call Fidelity at 1-800-544-8544.
Interested Trustees*:
Correspondence intended for each Trustee who is an interested person may be sent to Fidelity Investments, 82 Devonshire Street, Boston, Massachusetts 02109.
Name, Age; Principal Occupation |
Edward C. Johnson 3d (76) |
| Year of Election or Appointment: 1984 Mr. Johnson is Chairman of the Board of Trustees. Mr. Johnson serves as President (2006-present), Chief Executive Officer, Chairman, and a Director of FMR Corp.; Chairman and a Director of FMR; Chairman and a Director of Fidelity Research & Analysis Company (FRAC); Chairman and a Director of Fidelity Investments Money Management, Inc.; and Chairman (2001-present) and a Director of FMR Co., Inc. In addition, Mr. Johnson serves as Chairman and Director of Fidelity International Limited (FIL). |
Stephen P. Jonas (53) |
| Year of Election or Appointment: 2005 Mr. Jonas is Senior Vice President of Global Balanced (2005-present), Diversified International (2005-present), Aggressive International (2005-present), Overseas (2005-present), and Worldwide (2005-present). He also serves as Senior Vice President of other Fidelity funds (2005-present). Mr. Jonas is Executive Director of FMR (2005-present) and FMR Co., Inc. (2005-present). He also serves as a Director of Fidelity Investments Money Management, Inc. (2005-present) and FMR Corp. (2003-present). Previously, Mr. Jonas served as President of Fidelity Enterprise Operations and Risk Services (2004-2005), Chief Administrative Officer (2002-2004), and Chief Financial Officer of FMR Corp. (1998-2002). In addition, he serves on the Boards of Boston Ballet (2003-present) and Simmons College (2003-present). |
Robert L. Reynolds (54) |
| Year of Election or Appointment: 2003 Mr. Reynolds is President and a Director of FMR (2005-present), Fidelity Investments Money Management, Inc. (2005-present), and FMR Co., Inc. (2005-present). Mr. Reynolds also serves as Vice Chairman (2006-present), a Director (2003-present), and Chief Operating Officer of FMR Corp. and a Director of Strategic Advisers, Inc. (2005-present). He also serves on the Board at Fidelity Investments Canada, Ltd. |
* Trustees have been determined to be "Interested Trustees" by virtue of, among other things, their affiliation with the trust or various entities under common control with FMR.
Annual Report
Trustees and Officers - continued
Independent Trustees:
Correspondence intended for each Independent Trustee (that is, the Trustees other than the Interested Trustees) may be sent to Fidelity Investments, P.O. Box 55235, Boston, Massachusetts 02205-5235.
Name, Age; Principal Occupation |
Dennis J. Dirks (58) |
| Year of Election or Appointment: 2005 Prior to his retirement in May 2003, Mr. Dirks was Chief Operating Officer and a member of the Board of The Depository Trust & Clearing Corporation (DTCC) (1999-2003). He also served as President, Chief Operating Officer, and Board member of The Depository Trust Company (DTC) (1999-2003) and President and Board member of the National Securities Clearing Corporation (NSCC) (1999-2003). In addition, Mr. Dirks served as Chief Executive Officer and Board member of the Government Securities Clearing Corporation (2001-2003) and Chief Executive Officer and Board member of the Mortgage-Backed Securities Clearing Corporation (2001-2003). Mr. Dirks also serves as a Trustee and a member of the Finance Committee of Manhattan College (2005-present) and a Trustee and a member of the Finance Committee of AHRC of Nassau County (2006-present). |
Albert R. Gamper, Jr. (64) |
| Year of Election or Appointment: 2006 Prior to his retirement in December 2004, Mr. Gamper served as Chairman of the Board of CIT Group Inc. (commercial finance). During his tenure with CIT Group Inc. Mr. Gamper served in numerous senior management positions, including Chairman (1987-1989; 1999-2001; 2002-2004), Chief Executive Officer (1987-2004), and President (1989-2002). He currently serves as a member of the Board of Directors of Public Service Enterprise Group (utilities, 2001-present), Chairman of the Board of Governors, Rutgers University (2004-present), and Chairman of the Board of Saint Barnabas Health Care System. |
George H. Heilmeier (70) |
| Year of Election or Appointment: 2004 Dr. Heilmeier is Chairman Emeritus of Telcordia Technologies (communication software and systems), where prior to his retirement, he served as company Chairman and Chief Executive Officer. He currently serves on the Boards of Directors of The Mitre Corporation (systems engineering and information technology support for the government), and HRL Laboratories (private research and development, 2004-present). He is Chairman of the General Motors Science & Technology Advisory Board and a Life Fellow of the Institute of Electrical and Electronics Engineers (IEEE). Dr. Heilmeier is a member of the Defense Science Board and the National Security Agency Advisory Board. He is also a member of the National Academy of Engineering, the American Academy of Arts and Sciences, and the Board of Overseers of the School of Engineering and Applied Science of the University of Pennsylvania. Previously, Dr. Heilmeier served as a Director of TRW Inc. (automotive, space, defense, and information technology, 1992-2002), Compaq (1994-2002), Automatic Data Processing, Inc. (ADP) (technology-based business outsourcing, 1995-2002), INET Technologies Inc. (telecommunications network surveillance, 2001-2004), and Teletech Holdings (customer management services). He is the recipient of the 2005 Kyoto Prize in Advanced Technology for his invention of the liquid crystal display, and a member of the Consumer Electronics Hall of Fame. |
Marie L. Knowles (60) |
| Year of Election or Appointment: 2001 Prior to Ms. Knowles' retirement in June 2000, she served as Executive Vice President and Chief Financial Officer of Atlantic Richfield Company (ARCO) (diversified energy, 1996-2000). From 1993 to 1996, she was a Senior Vice President of ARCO and President of ARCO Transportation Company. She served as a Director of ARCO from 1996 to 1998. She currently serves as a Director of Phelps Dodge Corporation (copper mining and manufacturing) and McKesson Corporation (healthcare service, 2002-present). Ms. Knowles is a Trustee of the Brookings Institution and the Catalina Island Conservancy and also serves as a member of the Advisory Board for the School of Engineering of the University of Southern California. |
Ned C. Lautenbach (62) |
| Year of Election or Appointment: 2000 Mr. Lautenbach is Chairman of the Independent Trustees (2006-present). Mr. Lautenbach has been a partner of Clayton, Dubilier & Rice, Inc. (private equity investment firm) since September 1998. Previously, Mr. Lautenbach was with the International Business Machines Corporation (IBM) from 1968 until his retirement in 1998. Mr. Lautenbach serves as a Director of Sony Corporation (2006-present) and Eaton Corporation (diversified industrial) as well as the Philharmonic Center for the Arts in Naples, Florida. He also is a member of the Board of Trustees of Fairfield University (2005-present), as well as a member of the Council on Foreign Relations. |
William O. McCoy (73) |
| Year of Election or Appointment: 1997 Prior to his retirement in December 1994, Mr. McCoy was Vice Chairman of the Board of BellSouth Corporation (telecommunications) and President of BellSouth Enterprises. He is currently a Director of Duke Realty Corporation (real estate). He is also a partner of Franklin Street Partners (private investment management firm). In addition, Mr. McCoy served as the Interim Chancellor (1999-2000) and a member of the Board of Visitors for the University of North Carolina at Chapel Hill and currently serves as Chairman of the Board of Directors of the University of North Carolina Health Care System. He also served as Vice President of Finance for the University of North Carolina (16-school system). |
Cornelia M. Small (62) |
| Year of Election or Appointment: 2005 Ms. Small is a member (2000-present) and Chairperson (2002-present) of the Investment Committee, and a member (2002-present) of the Board of Trustees of Smith College. Previously, she served as Chief Investment Officer (1999-2000), Director of Global Equity Investments (1996-1999), and a member of the Board of Directors of Scudder, Stevens & Clark (1990-1997) and Scudder Kemper Investments (1997-1999). In addition, Ms. Small served as Co-Chair (2000-2003) of the Annual Fund for the Fletcher School of Law and Diplomacy. |
William S. Stavropoulos (67) |
| Year of Election or Appointment: 2001 Mr. Stavropoulos is Chairman Emeritus of the Board of Directors of The Dow Chemical Company. Since joining The Dow Chemical Company in 1967, Mr. Stavropoulos served in numerous senior management positions, including President (1993-2000; 2002-2003), CEO (1995-2000; 2002-2004), and Chairman of the Executive Committee (2000-2004). Currently, he is a Director of NCR Corporation (data warehousing and technology solutions), BellSouth Corporation (telecommunications), Chemical Financial Corporation, Maersk Inc. (industrial conglomerate, 2002-present), and Metalmark Capital (private equity investment firm, 2005-present). He also serves as a member of the Board of Trustees of the American Enterprise Institute for Public Policy Research. In addition, Mr. Stavropoulos is a member of The Business Council, J.P. Morgan International Council and the University of Notre Dame Advisory Council for the College of Science. |
Kenneth L. Wolfe (67) |
| Year of Election or Appointment: 2005 Prior to his retirement in 2001, Mr. Wolfe was Chairman and Chief Executive Officer of Hershey Foods Corporation (1993-2001). He currently serves as a member of the boards of Adelphia Communications Corporation (2003-present), Bausch & Lomb, Inc., and Revlon Inc. (2004-present). |
Advisory Board Members and Executive Officers:
Correspondence intended for Mr. Keyes may be sent to Fidelity Investments, P.O. Box 55235, Boston, Massachusetts 02205-5235. Correspondence intended for each executive officer and Mr. Lynch may be sent to Fidelity Investments, 82 Devonshire Street, Boston, Massachusetts 02109.
Name, Age; Principal Occupation |
James H. Keyes (66) |
| Year of Election or Appointment: 2006 Member of the Advisory Board of Fidelity Investment Trust. Prior to his retirement in 2003, Mr. Keyes was Chairman, President, and Chief Executive Officer of Johnson Controls, Inc. (automotive supplier, 1993-2003). He currently serves as a member of the boards of LSI Logic Corporation (semiconductor technologies), Navistar International Corporation (manufacture and sale of trucks, buses, and diesel engines, 2002-present), and Pitney Bowes, Inc. (integrated mail, messaging, and document management solutions). |
Peter S. Lynch (62) |
| Year of Election or Appointment: 2003 Member of the Advisory Board of Fidelity Investment Trust. Mr. Lynch is Vice Chairman and a Director of FMR, and Vice Chairman (2001-present) and a Director of FMR Co., Inc. Previously, Mr. Lynch served as a Trustee of the Fidelity funds (1990-2003). In addition, he serves as a Trustee of Boston College and as the Chairman of the Inner-City Scholarship Fund. |
Dwight D. Churchill (52) |
| Year of Election or Appointment: 2005 Vice President of Global Balanced, Diversified International, Aggressive International, Overseas, and Worldwide. Mr. Churchill also serves as Vice President of certain Equity Funds (2005-present). Mr. Churchill is Executive Vice President of FMR (2005-present) and FMR Co., Inc. (2005-present). Previously, Mr. Churchill served as Senior Vice President of Fidelity Investments Money Management, Inc. (2005-2006), Head of Fidelity's Fixed-Income Division (2000-2005), Vice President of Fidelity's Money Market Funds (2000-2005), Vice President of Fidelity's Bond Funds, and Senior Vice President of FMR. |
Eric M. Wetlaufer (44) |
| Year of Election or Appointment: 2006 Vice President of Global Balanced, Diversified International, Aggressive International, Overseas, and Worldwide. Mr. Wetlaufer also serves as Vice President of certain International Equity Funds (2006-present). Mr. Wetlaufer is Senior Vice President of FMR (2006-present) and FMR Co., Inc. (2006-present), and President and Director of Fidelity Management & Research (U.K.) Inc. (2006-present) and Fidelity Research & Analysis Company (2006-present). Before joining Fidelity Investments in 2005, Mr. Wetlaufer was a partner in Oxhead Capital Management (2004-2005). Previously, Mr. Wetlaufer served as a Chief Investment Officer of Putnam Investments (1997-2003). |
William Bower (39) |
| Year of Election or Appointment: 2001 Vice President of Diversified International. Mr. Bower also serves as Vice President of other funds advised by FMR. Prior to assuming his current responsibilities, Mr. Bower worked as a research analyst and manager. Mr. Bower also serves as a Vice President of FMR (2000) and FMR Co., Inc. (2001). |
Jeffrey S. Feingold (36) |
| Year of Election or Appointment: 2006 Vice President of Global Balanced and Worldwide. Mr. Feingold also serves as Vice President of another fund advised by FMR. Prior to assuming his current responsibilities, Mr. Feingold worked as a research analyst and manager. Mr. Feingold also serves as a Vice President of FMR and FMR Co., Inc. (2005). |
Ian R. Hart (39) |
| Year of Election or Appointment: 2006 Vice President of Overseas. Mr. Hart also serves as Vice President of other funds advised by FMR. Prior to assuming his current responsibilities, Mr. Hart worked as a research analyst and a manager. Mr. Hart also serves as a Vice President of FMR and FMR Co., Inc. (2002). |
William Kennedy (38) |
| Year of Election or Appointment: 2006 Vice President of Worldwide. Mr. Kennedy also serves as Vice President of other funds advised by FMR. Prior to assuming his current responsibilities, Mr. Kennedy worked as a research analyst and a portfolio manager. Mr. Kennedy also serves as a Vice President of FMR (2000) and FMR Co., Inc. (2001). |
Darren Maupin (30) |
| Year of Election or Appointment: 2006 Vice President of Global Balanced and Aggressive International. Mr. Maupin also serves as Vice President of other funds advised by FMR. Prior to assuming his current responsibilities, Mr. Maupin worked as a research analyst and a portfolio manager. Mr. Maupin also serves as Vice President of FMR and FMR Co., Inc. (2006). |
Ronald Slattery (42) |
| Year of Election or Appointment: 2004 Vice President of Global Balanced. Prior to assuming his current responsibilities, Mr. Slattery worked as an analyst, director of research in Tokyo and portfolio manager. |
Leon Tucker (38) |
| Year of Election or Appointment: 2004 Vice President of Global Balanced. Prior to assuming his current responsibilities, Mr. Tucker worked as an analyst, director of research in Hong Kong and portfolio manager. |
Andrew Weir (39) |
| Year of Election or Appointment: 2006 Vice President of Global Balanced. Mr. Weir also serves as Vice President of other funds advised by FMR. Prior to assuming his current responsibilities, Mr. Weir worked as a quantitative research analyst, director of research and portfolio manager. |
Derek L. Young (42) |
| Year of Election or Appointment: 2006 Vice President of Global Balanced. Mr. Young also serves as Vice President of other funds advised by FMR. Prior to assuming his current responsibilities, Mr. Young worked as a research analyst and a portfolio manager. Mr. Young also serves as a Vice President of FMR and FMR Co., Inc. (2004). |
Eric D. Roiter (57) |
| Year of Election or Appointment: 1998 Secretary of Global Balanced, Diversified International, Aggressive International, Overseas, and Worldwide. He also serves as Secretary of other Fidelity funds; Vice President, General Counsel, and Secretary of FMR Co., Inc. (2001-present) and FMR; Assistant Secretary of Fidelity Management & Research (U.K.) Inc. (2001-present), Fidelity Research & Analysis Company (2001-present), and Fidelity Investments Money Management, Inc. (2001-present). Mr. Roiter is an Adjunct Member, Faculty of Law, at Boston College Law School (2003-present). Previously, Mr. Roiter served as Vice President and Secretary of Fidelity Distributors Corporation (FDC) (1998-2005). |
Stuart Fross (47) |
| Year of Election or Appointment: 2003 Assistant Secretary of Global Balanced, Diversified International, Aggressive International, Overseas, and Worldwide. Mr. Fross also serves as Assistant Secretary of other Fidelity funds (2003-present), Vice President and Secretary of FDC (2005-present), and is an employee of FMR. |
Christine Reynolds (48) |
| Year of Election or Appointment: 2004 President and Treasurer of Global Balanced, Diversified International, Aggressive International, Overseas, and Worldwide. Ms. Reynolds also serves as President and Treasurer of other Fidelity funds (2004-present) and is a Vice President (2003-present) and an employee (2002-present) of FMR. Before joining Fidelity Investments, Ms. Reynolds worked at PricewaterhouseCoopers LLP (PwC) (1980-2002), where she was most recently an audit partner with PwC's investment management practice. |
R. Stephen Ganis (40) |
| Year of Election or Appointment: 2006 Anti-Money Laundering (AML) officer of Global Balanced, Diversified International, Aggressive International, Overseas, and Worldwide. Mr. Ganis also serves as AML officer of other Fidelity funds (2006-present) and FMR Corp. (2003-present). Before joining Fidelity Investments, Mr. Ganis practiced law at Goodwin Procter, LLP (2000-2002). |
Joseph B. Hollis (58) |
| Year of Election or Appointment: 2006 Chief Financial Officer of Global Balanced, Diversified International, Aggressive International, Overseas, and Worldwide. Mr. Hollis also serves as Chief Financial Officer of other Fidelity funds. Mr. Hollis is President of Fidelity Pricing and Cash Management Services (FPCMS) (2005-present). Mr. Hollis also serves as President and Director of Fidelity Service Company, Inc. (2006-present). Previously, Mr. Hollis served as Senior Vice President of Cash Management Services (1999-2002) and Investment Management Operations (2002-2005). |
Kenneth A. Rathgeber (59) |
| Year of Election or Appointment: 2004 Chief Compliance Officer of Global Balanced, Diversified International, Aggressive International, Overseas, and Worldwide. Mr. Rathgeber also serves as Chief Compliance Officer of other Fidelity funds (2004-present) and Executive Vice President of Risk Oversight for Fidelity Investments (2002-present). He is Chief Compliance Officer of FMR (2005-present), FMR Co., Inc. (2005-present), Fidelity Management & Research (U.K.) Inc. (2005-present), Fidelity Research & Analysis Company (2005-present), Fidelity Investments Money Management, Inc. (2005-present), and Strategic Advisers, Inc. (2005-present). Previously, Mr. Rathgeber served as Executive Vice President and Chief Operating Officer for Fidelity Investments Institutional Services Company, Inc. (1998-2002). |
Bryan A. Mehrmann (45) |
| Year of Election or Appointment: 2005 Deputy Treasurer of Global Balanced, Diversified International, Aggressive International, Overseas, and Worldwide. Mr. Mehrmann also serves as Deputy Treasurer of other Fidelity funds (2005-present) and is an employee of FMR. Previously, Mr. Mehrmann served as Vice President of Fidelity Investments Institutional Services Group (FIIS)/Fidelity Investments Institutional Operations Corporation, Inc. (FIIOC) Client Services (1998-2004). |
Kimberley H. Monasterio (42) |
| Year of Election or Appointment: 2004 Deputy Treasurer of Global Balanced, Diversified International, Aggressive International, Overseas, and Worldwide. Ms. Monasterio also serves as Deputy Treasurer of other Fidelity funds (2004) and is an employee of FMR (2004). Before joining Fidelity Investments, Ms. Monasterio served as Treasurer (2000-2004) and Chief Financial Officer (2002-2004) of the Franklin Templeton Funds and Senior Vice President of Franklin Templeton Services, LLC (2000-2004). |
Kenneth B. Robins (37) |
| Year of Election or Appointment: 2005 Deputy Treasurer of Global Balanced, Diversified International, Aggressive International, Overseas, and Worldwide. Mr. Robins also serves as Deputy Treasurer of other Fidelity funds (2005-present) and is an employee of FMR (2004-present). Before joining Fidelity Investments, Mr. Robins worked at KPMG LLP, where he was a partner in KPMG's department of professional practice (2002-2004) and a Senior Manager (1999-2000). In addition, Mr. Robins served as Assistant Chief Accountant, United States Securities and Exchange Commission (2000-2002). |
Robert G. Byrnes (39) |
| Year of Election or Appointment: 2005 Assistant Treasurer of Global Balanced, Diversified International, Aggressive International, Overseas, and Worldwide. Mr. Byrnes also serves as Assistant Treasurer of other Fidelity funds (2005-present) and is an employee of FMR (2005-present). Previously, Mr. Byrnes served as Vice President of FPCMS (2003-2005). Before joining Fidelity Investments, Mr. Byrnes worked at Deutsche Asset Management where he served as Vice President of the Investment Operations Group (2000-2003). |
John H. Costello (60) |
| Year of Election or Appointment: 1986, 1990, 1991, 1993, or 1994 Assistant Treasurer of Global Balanced (1993), Diversified International (1991), Aggressive International (1994), Overseas (1986), and Worldwide (1990). Mr. Costello also serves as Assistant Treasurer of other Fidelity funds and is an employee of FMR. |
Peter L. Lydecker (52) |
| Year of Election or Appointment: 2004 Assistant Treasurer of Global Balanced, Diversified International, Aggressive International, Overseas, and Worldwide. Mr. Lydecker also serves as Assistant Treasurer of other Fidelity funds (2004) and is an employee of FMR. |
Mark Osterheld (51) |
| Year of Election or Appointment: 2002 Assistant Treasurer of Global Balanced, Diversified International, Aggressive International, Overseas, and Worldwide. Mr. Osterheld also serves as Assistant Treasurer of other Fidelity funds (2002) and is an employee of FMR. |
Gary W. Ryan (48) |
| Year of Election or Appointment: 2005 Assistant Treasurer of Global Balanced, Diversified International, Aggressive International, Overseas, and Worldwide. Mr. Ryan also serves as Assistant Treasurer of other Fidelity funds (2005-present) and is an employee of FMR (2005-present). Previously, Mr. Ryan served as Vice President of Fund Reporting in FPCMS (1999-2005). |
Salvatore Schiavone (40) |
| Year of Election or Appointment: 2005 Assistant Treasurer of Global Balanced, Diversified International, Aggressive International, Overseas, and Worldwide. Mr. Schiavone also serves as Assistant Treasurer of other Fidelity funds (2005-present) and is an employee of FMR (2005-present). Before joining Fidelity Investments, Mr. Schiavone worked at Deutsche Asset Management, where he most recently served as Assistant Treasurer (2003-2005) of the Scudder Funds and Vice President and Head of Fund Reporting (1996-2003). |
Annual Report
Distributions
The Board of Trustees of each fund voted to pay to shareholders of record at the opening of business on record date, the following distributions per share derived from capital gains realized from sales of portfolio securities, and dividends derived from net investment income:
Fund | Pay Date | Record Date | Dividends | Capital Gains |
Fidelity Global Balanced Fund | 12/11/06 | 12/08/06 | $.20 | $2.10 |
Fidelity Diversified International Fund | 12/11/06 | 12/08/06 | $.36 | $2.51 |
Fidelity Aggressive International Fund | 12/11/06 | 12/08/06 | $.20 | $2.64 |
Fidelity Overseas Fund | 12/4/06 | 12/01/06 | $.55 | $4.64 |
Fidelity Worldwide Fund | 12/11/06 | 12/08/06 | $.17 | $2.66 |
The funds hereby designate as capital gain dividend the amounts noted below for the taxable year ended October 31, 2006, or, if subsequently determined to be different, the net capital gain of such year.
Fund | |
Fidelity Global Balanced Fund | $ 17,861,922 |
Fidelity Diversified International Fund | $ 2,939,888,990 |
Fidelity Aggressive International Fund | $ 65,542,242 |
Fidelity Overseas Fund | $ 491,474,924 |
Fidelity Worldwide Fund | $ 127,531,484 |
A percentage of the dividends distributed during the fiscal year for the following funds qualify for the dividends-received deduction for corporate shareholders:
Fund | |
Fidelity Global Balanced Fund | 13% |
Fidelity Worldwide Fund | 68% |
A percentage of the dividends distributed during the fiscal year for the following funds may be taken into account as a dividend for purposes of the maximum rate under section 1(h)(11) of the Internal Revenue Code.
Fund | |
Fidelity Global Balanced Fund | 34% |
Fidelity Diversified International Fund | 100% |
Fidelity Aggressive International Fund | 100% |
Fidelity Overseas Fund | 69% |
Fidelity Worldwide Fund | 100% |
The amounts per share which represent income derived from sources within, and taxes paid to, foreign countries or possessions of the United States are as follows:
Fund | Pay Date | Income | Taxes |
Fidelity Global Balanced Fund | 12/12/05 | $0.095 | $0.0081 |
Fidelity Diversified International Fund | 12/12/05 | $0.257 | $0.0187 |
Fidelity Aggressive International Fund | 12/12/05 | $0.254 | $0.0239 |
Fidelity Overseas Fund | 12/05/05 | $0.474 | $0.0481 |
The fund will notify shareholders in January 2007 of amounts for use in preparing 2006 income tax returns.
Annual Report
Board Approval of Investment Advisory Contracts and Management Fees
Broadly Diversified International Equity Funds
Each year, typically in July, the Board of Trustees, including the Independent Trustees (together, the Board), votes on the renewal of the management contract and sub-advisory agreements (together, the Advisory Contracts) for each fund. The Board, assisted by the advice of fund counsel and Independent Trustees' counsel, requests and considers a broad range of information throughout the year.
The Board meets regularly each month except August and takes into account throughout the year matters bearing on Advisory Contracts. The Board, acting directly and through its separate committees, considers at each of its meetings factors that are relevant to the annual renewal of each fund's Advisory Contracts, including the services and support provided to each fund and its shareholders. At the time of the renewal, the Board had 12 standing committees, each composed of Independent Trustees with varying backgrounds, to which the Board has assigned specific subject matter responsibilities in order to enhance effective decision-making by the Board. Each committee has adopted a written charter outlining the structure and purposes of the committee. One such committee, the Equity Contract Committee, meets periodically as needed throughout the year to consider matters specifically related to the annual renewal of Advisory Contracts. The committee requests and receives information on, and makes recommendations to the Independent Trustees concerning, the approval and annual review of the Advisory Contracts.
At its July 2006 meeting, the Board of Trustees, including the Independent Trustees, unanimously determined to renew the Advisory Contracts for each fund. In reaching its determination, the Board considered all factors it believed relevant, including (i) the nature, extent, and quality of the services to be provided to each fund and its shareholders (including the investment performance of each fund); (ii) the competitiveness of the management fee and total expenses of each fund; (iii) the total costs of the services to be provided by and the profits to be realized by the investment adviser and its affiliates from the relationship with each fund; (iv) the extent to which economies of scale would be realized as each fund grows; and (v) whether fee levels reflect these economies of scale, if any, for the benefit of fund shareholders.
In determining whether to renew the Advisory Contracts for each fund, the Board ultimately reached a determination, with the assistance of fund counsel and Independent Trustees' counsel, that the renewal of the Advisory Contracts and the compensation to be received by Fidelity under the management contracts is consistent with Fidelity's fiduciary duty under applicable law. In addition to evaluating the specific factors noted above, the Board, in reaching its determination, is aware that shareholders in each fund have a broad range of investment choices available to them, including a wide choice among mutual funds offered by competitors to Fidelity, and that each fund's shareholders, with the opportunity to review and weigh the disclosure provided by the fund in its prospectus and other public disclosures, have chosen to invest in that fund, managed by Fidelity.
Nature, Extent, and Quality of Services Provided. The Board considered staffing within the investment adviser, FMR, and the sub-advisers (together, the Investment Advisers), including the backgrounds of the funds' portfolio managers and the funds' investment objectives and disciplines. The Independent Trustees also had discussions with senior management of Fidelity's investment operations and investment groups. The Board considered the structure of the portfolio manager compensation program and whether this structure provides appropriate incentives.
Resources Dedicated to Investment Management and Support Services. The Board reviewed the size, education, and experience of the Investment Advisers' investment staff, their use of technology, and the Investment Advisers' approach to recruiting, training, and retaining portfolio managers and other research, advisory, and management personnel. The Board considered Fidelity's extensive global research capabilities that enable the Investment Advisers to aggregate data from various sources in an effort to produce positive investment results. The Board noted that Fidelity's analysts have access to a variety of technological tools that enable them to perform both fundamental and quantitative analysis and to specialize in various disciplines. The Board also considered that Fidelity's portfolio managers and analysts have access to daily portfolio attribution that allows for monitoring of a fund's portfolio, as well as an electronic communication system that provides immediate real-time access to research concerning issuers and credit enhancers.
Shareholder and Administrative Services. The Board considered (i) the nature, extent, quality, and cost of administrative, distribution, and shareholder services performed by the Investment Advisers and their affiliates under the Advisory Contracts and under separate agreements covering transfer agency, pricing and bookkeeping, and securities lending services for each fund; (ii) the nature and extent of the Investment Advisers' supervision of third party service providers, principally custodians and subcustodians; and (iii) the resources devoted to, and the record of compliance with, each fund's compliance policies and procedures. The Board reviewed the allocation of fund brokerage, including allocations to brokers affiliated with the Investment Advisers, the use of brokerage commissions to pay fund expenses, and the use of "soft" commission dollars to pay for research services. The Board also considered that Fidelity voluntarily pays for market data out of its own resources.
The Board noted that the growth of fund assets across the complex allows Fidelity to reinvest in the development of services designed to enhance the value or convenience of the Fidelity funds as investment vehicles. These services include 24-hour access to account information and market information through phone representatives and over the Internet, and investor education materials and asset allocation tools.
Investment in a Large Fund Family. The Board considered the benefits to shareholders of investing in a Fidelity fund, including the benefits of investing in a fund that is part of a large family of funds offering a variety of investment disciplines and providing for a large variety of mutual fund investor services. For example, fund shareholders are offered the privilege of exchanging shares of a fund for shares of other Fidelity funds, as set forth in the fund's prospectus, without paying a sales charge. The Board noted that, since the last Advisory Contract renewals in July 2005, Fidelity has taken a number of actions that benefited particular funds, including (i) dedicating additional resources to investment research and to restructure the investment research teams; (ii) voluntarily entering into contractual arrangements with certain brokers pursuant to which Fidelity pays for research products and services separately out of its own resources, rather than bundling with fund commissions; (iii) launching the Fidelity Advantage Class of its five Spartan stock index funds and three Spartan bond index funds, which is a lower-fee class available to shareholders with higher account balances; (iv) contractually agreeing to impose expense limitations on Fidelity U.S. Bond Index Fund and reducing the fund's initial investment minimum; and (v) offering shareholders of each of the Fidelity Institutional Money Market Funds the privilege of exchanging shares of the fund for shares of other Fidelity funds.
Annual Report
Board Approval of Investment Advisory Contracts and Management Fees - continued
Investment Performance and Compliance. The Board considered whether each fund has operated within its investment objective, as well as its record of compliance with its investment restrictions. It also reviewed each fund's absolute investment performance, as well as each fund's relative investment performance measured against (i) a broad-based securities market index (or a proprietary custom index, in the case of Global Balanced Fund), and (ii) a peer group of mutual funds deemed appropriate by the Board over multiple periods. For each fund, the following charts considered by the Board show, over the one-, three-, and five-year periods ended December 31, 2005, the fund's cumulative total returns, the cumulative total returns of a broad-based securities market index (or a proprietary custom index, in the case of Global Balanced Fund)("benchmark"), and a range of cumulative total returns of a peer group of mutual funds identified by Lipper Inc. as having an investment objective similar to that of the fund. The box within each chart shows the 25th percentile return (bottom of box) and the 75th percentile return (top of box) of the Lipper peer group. Returns shown above the box are in the first quartile and returns shown below the box are in the fourth quartile. The percentage beaten number noted below each chart corresponds to the percentile box and represents the percentage of funds in the Lipper peer group whose performance was equal to or lower than that of the fund. For Global Balanced Fund, the proprietary custom index is an index developed by FMR that represents the performance of the fund's general investment categories in both equity and bond securities.
Fidelity Global Balanced Fund
The Board reviewed the fund's relative investment performance against its Lipper peer group and stated that the performance of the fund was in the second quartile for all the periods shown. The Board also stated that the relative investment performance of the fund compared favorably to its benchmark for all the periods shown. The Board also reviewed the fund's relative investment performance against a peer group defined by Morningstar.
Annual Report
Fidelity Diversified International Fund
The Board reviewed the fund's relative investment performance against its Lipper peer group and stated that the performance of the fund was in the first quartile for all the periods shown. The Board also stated that the relative investment performance of the fund compared favorably to its benchmark for all the periods shown. The Board also reviewed the fund's relative investment performance against a peer group defined by Morningstar.
Fidelity Aggressive International Fund
The Board reviewed the fund's relative investment performance against its Lipper peer group and stated that the performance of the fund was in the third quartile for the one- and three-year periods and the first quartile for the five-year period. The Board also stated that the relative investment performance of the fund was lower than its benchmark for the one- and three-year periods, although the fund's five-year cumulative total return was higher than its benchmark. The Board discussed with FMR actions to be taken by FMR to improve the fund's more recent disappointing performance. The Board also reviewed the fund's relative investment performance against a customized peer group based on a combination of categories defined by Morningstar. The Board will continue to closely monitor the performance of the fund in the coming year.
Annual Report
Board Approval of Investment Advisory Contracts and Management Fees - continued
Fidelity Overseas Fund
The Board reviewed the fund's relative investment performance against its Lipper peer group and stated that the performance of the fund was in the first quartile for the one- and three-year periods and the second quartile for the five-year period. The Board also stated that the relative investment performance of the fund compared favorably to its benchmark for the one- and three-year periods, although the fund's five-year cumulative total return was lower than its benchmark. The Board also reviewed the fund's relative investment performance against a peer group defined by Morningstar.
Fidelity Worldwide Fund
The Board reviewed the fund's relative investment performance against its Lipper peer group and stated that the performance of the fund was in the second quartile for the one- and three-year periods and the first quartile for the five-year period. The Board also stated that the relative investment performance of the fund compared favorably to its benchmark for all the periods shown. The Board also reviewed the fund's relative investment performance against a peer group defined by Morningstar.
The Board also considered that each fund's (except Global Balanced Fund's) management fee is subject to upward or downward adjustment depending upon whether, and to what extent, the fund's investment performance for the performance period exceeds, or is exceeded by, the record (over the same period) of a Board-approved performance adjustment index. The Board realizes that the performance adjustment provides FMR with a strong economic incentive to seek to achieve superior performance for each fund's shareholders and helps to more closely align the interests of FMR and each fund's shareholders.
The Board considered that FMR has taken steps to refocus and strengthen equity research, equity portfolio management, and compliance. The Board noted with favor FMR's reorganization of its senior management team in 2005 and FMR's dedication of additional resources to investment research, and participated in the process that led to those changes.
Annual Report
Based on its review, and giving particular weight to the nature and quality of the resources dedicated by the Investment Advisers to maintain and improve relative performance, the Board concluded that the nature, extent, and quality of the services provided to each fund will benefit each fund's shareholders, particularly in light of the Board's view that each fund's shareholders benefit from investing in a fund that is part of a large family of funds offering a variety of investment disciplines and services.
Competitiveness of Management Fee and Total Fund Expenses. The Board considered each fund's management fee and total expenses compared to "mapped groups" of competitive funds and classes. Fidelity creates "mapped groups" by combining similar Lipper investment objective categories that have comparable management fee characteristics. Combining Lipper investment objective categories aids the Board's management fee and total expense comparisons by broadening the competitive group used for comparison and by reducing the number of universes to which various Fidelity funds are compared.
The Board considered two proprietary management fee comparisons for the 12-month periods shown in the charts below. The group of Lipper funds used by the Board for management fee comparisons is referred to below as the "Total Mapped Group" and, for the reasons explained above, is broader than the Lipper peer group used by the Board for performance comparisons. The Total Mapped Group comparison focuses on a fund's standing relative to the total universe of comparable funds available to investors, in terms of gross management fees before expense reimbursements or caps, and without giving effect to a fund's performance adjustment (if applicable). "TMG %" represents the percentage of funds in the Total Mapped Group that had management fees that were lower than a fund's. For example, a TMG % of 31% would mean that 69% of the funds in the Total Mapped Group had higher management fees than a fund. The "Asset-Size Peer Group" (ASPG) comparison focuses on a fund's standing relative to non-Fidelity funds similar in size to the fund within the Total Mapped Group. The ASPG represents at least 15% of the funds in the Total Mapped Group with comparable asset size and management fee characteristics, subject to a minimum of 50 funds (or all funds in the Total Mapped Group if fewer than 50). Additional information, such as the ASPG quartile in which a fund's management fee ranked and the impact of a fund's performance adjustment (if applicable), is also included in the charts and considered by the Board.
Fidelity Global Balanced Fund
The Board noted that the fund's management fee ranked below the median of its Total Mapped Group and below the median of its ASPG for 2005.
Annual Report
Board Approval of Investment Advisory Contracts and Management Fees - continued
Fidelity Diversified International Fund
The Board noted that the fund's management fee ranked below the median of its Total Mapped Group and below the median of its ASPG for 2005. The Board also noted the effect of the fund's positive performance adjustment on the fund's management fee ranking. The Board noted that the performance adjustment for each year represents calculations for rolling 36-month periods that differ from the periods shown in the performance charts above.
Fidelity Aggressive International Fund
The Board noted that the fund's management fee ranked below the median of its Total Mapped Group and below the median of its ASPG for 2005. The Board also noted the effect of the fund's negative performance adjustment on the fund's management fee ranking. The Board noted that the performance adjustment for each year represents calculations for rolling 36-month periods that differ from the periods shown in the performance charts above.
Furthermore, the Board considered that shareholders of Aggressive International Fund approved a prospective change in the index used to calculate the fund's performance adjustment, beginning March 1, 2001. The Board also considered that, because the performance adjustment is based on a rolling 36-month measurement period, during a transition period the fund's performance is compared to a blended index return that reflects the performance of the former index for the portion of the measurement period prior to March 1, 2001 and the performance of the current index for the remainder of the measurement period. The Board noted that the fund's performance adjustments for 2001 through 2004 shown in the chart above reflect the effect of using the blended index return to calculate the fund's performance adjustment.
Annual Report
Fidelity Overseas Fund
The Board noted that the fund's management fee ranked below the median of its Total Mapped Group and below the median of its ASPG for 2005. The Board also noted the effect of the fund's negative performance adjustment on the fund's management fee ranking. The Board noted that the performance adjustment for each year represents calculations for rolling 36-month periods that differ from the periods shown in the performance charts above.
Fidelity Worldwide Fund
The Board noted that the fund's management fee ranked below the median of its Total Mapped Group and below the median of its ASPG for 2005. The Board also noted the effect of the fund's positive performance adjustment on the fund's management fee ranking. The Board noted that the performance adjustment for each year represents calculations for rolling 36-month periods that differ from the periods shown in the performance charts above.
Based on its review, the Board concluded that each fund's management fee was fair and reasonable in light of the services that the fund receives and the other factors considered.
In its review of each fund's total expenses, the Board considered the fund's management fee as well as other fund expenses, such as transfer agent fees, pricing and bookkeeping fees, and custodial, legal, and audit fees. The Board also noted the effects of any waivers and reimbursements on fees and expenses, as well as Diversified International Fund's and Worldwide Fund's positive performance adjustment, and Aggressive International Fund's and Overseas Fund's negative performance adjustment. As part of its review, the Board also considered current and historical total expenses of each fund compared to competitive fund median expenses. Each fund is compared to those funds and classes in the Total Mapped Group (used by the Board for management fee comparisons) that have a similar sales load structure.
The Board noted that each fund's total expenses ranked below its competitive median for 2005.
Annual Report
Board Approval of Investment Advisory Contracts and Management Fees - continued
In its review of total expenses, the Board also considered Fidelity fee structures and other information on clients that FMR and its affiliates service in other competitive markets, such as other mutual funds advised or subadvised by FMR or its affiliates, pension plan clients, and other institutional clients.
Based on its review, the Board concluded that each fund's total expenses were reasonable in light of the services that the fund and its shareholders receive and the other factors considered.
Costs of the Services and Profitability. The Board considered the revenues earned and the expenses incurred by Fidelity in conducting the business of developing, marketing, distributing, managing, administering and servicing each fund and its shareholders. The Board also considered the level of Fidelity's profits in respect of all the Fidelity funds.
On an annual basis, FMR presents to the Board Fidelity's profitability for each fund. Fidelity calculates the profitability for each fund, as well as aggregate profitability for groups of Fidelity funds and all Fidelity funds, using a series of detailed revenue and cost allocation methodologies which originate with the audited books and records of Fidelity. The Audit Committee of the Board reviews any significant changes from the prior year's methodologies.
PricewaterhouseCoopers LLP (PwC), independent registered accounting firm and auditor to Fidelity and certain Fidelity funds, has been engaged annually by the Board as part of the Board's assessment of the results of Fidelity's profitability analysis. PwC's engagement includes the review and assessment of Fidelity's methodologies used in determining the revenues and expenses attributable to Fidelity's mutual fund business, and completion of agreed-upon procedures surrounding the mathematical accuracy of fund profitability and its conformity to allocation methodologies. After considering PwC's reports issued under the engagement and information provided by Fidelity, the Board believes that while other allocation methods may also be reasonable, Fidelity's profitability methodologies are reasonable in all material respects.
The Board has also reviewed Fidelity's non-fund businesses and any fall-out benefits related to the mutual fund business as well as cases where Fidelity's affiliates may benefit from or be related to the funds' business.
The Board considered the costs of the services provided by and the profits realized by Fidelity in connection with the operation of each fund and determined that the amount of profit is a fair entrepreneurial profit for the management of each fund.
Economies of Scale. The Board considered whether there have been economies of scale in respect of the management of the Fidelity funds, whether the Fidelity funds (including each fund) have appropriately benefited from any such economies of scale, and whether there is potential for realization of any further economies of scale. The Board considered the extent to which each fund will benefit from economies of scale through increased services to the fund, through waivers or reimbursements, or through fee or expense reductions, including reductions that occur through operation of the transfer agent agreement. The transfer agent fee varies in part based on the number of accounts in each fund. If the number of accounts decreases or the average account size increases, the overall transfer agent fee rate decreases.
The Board recognized that each fund's management contract incorporates a "group fee" structure, which provides for lower fee rates as total fund assets under FMR's management increase, and for higher fee rates as total fund assets under FMR's management decrease. The Board considered that the group fee is designed to deliver the benefits of economies of scale to fund shareholders when total fund assets increase, even if assets of any particular fund are unchanged or have declined, because some portion of Fidelity's costs are attributable to services provided to all Fidelity funds, and all funds benefit if those costs can be allocated among more assets. The Board also considered that although Diversified International Fund is partially closed to new investors, it continues to incur investment management expenses, and marketing and distribution expenses related to the retention of existing shareholders and assets. The Board further noted that Diversified International Fund may continue to realize benefits from the group fee structure, even though assets may not be expected to grow significantly at the fund level. The Board concluded that, given the group fee structure, fund shareholders will achieve a certain level of economies of scale as assets under FMR's management increase at the fund complex level, regardless of whether Fidelity achieves any such economies of scale.
The Board further concluded that any potential economies of scale are being shared between fund shareholders and Fidelity in an appropriate manner.
Additional Information Requested by the Board. In order to develop fully the factual basis for consideration of the Advisory Contracts, the Board requested additional information on several topics, including (i) Fidelity's fund profitability methodology and profitability trends within certain funds; (ii) portfolio manager compensation; (iii) the extent to which any economies of scale exist and are shared between the funds and Fidelity; (iv) the total expenses of certain funds and classes relative to competitors, including the extent to which the expenses of certain funds have been or could be capped; (v) fund performance trends; and (vi) Fidelity's fee structures, including use of performance fees.
Based on its evaluation of all of the conclusions noted above, and after considering all material factors, the Board ultimately concluded that the advisory fee structures are fair and reasonable, and that each fund's Advisory Contracts should be renewed.
Annual Report
Investment Adviser
Fidelity Management & Research Company
Boston, MA
Investment Sub-Advisers
FMR Co., Inc.
Fidelity Management & Research (U.K.) Inc.
Fidelity Research & Analysis Company
(formerly Fidelity Management & Research (Far East) Inc.)
Fidelity International Investment Advisors
Fidelity International Investment Advisors
(U.K.) Limited
Fidelity Investments Japan Limited
General Distributor
Fidelity Distributors Corporation
Boston, MA
Transfer and Service Agent
Fidelity Service Company, Inc.
Boston, MA
Custodians
Brown Brothers Harriman & Co.
Boston, MA
Global Balanced Fund
JPMorgan Chase Bank
New York, NY
Aggressive International Fund, Diversified International Fund,
Overseas Fund, Worldwide Fund
Corporate Headquarters
82 Devonshire Street
Boston, MA 02109
1-800-544-8888
The Fidelity Telephone Connection
Mutual Fund 24-Hour Service
Exchanges/Redemptions
and Account Assistance 1-800-544-6666
Product Information 1-800-544-6666
Retirement Accounts 1-800-544-4774
(8 a.m. - 9 p.m.)
TDD Service 1-800-544-0118
for the deaf and hearing impaired
(9 a.m. - 9 p.m. Eastern time)
Fidelity Automated Service
Telephone (FAST®) (automated graphic) 1-800-544-5555
(automated graphic) Automated line for quickest service
IBD-UANNPRO-1206
1.784774.103
Fidelity's
Targeted International Equity
Funds®
Fidelity® Canada Fund
Fidelity China Region Fund
Fidelity Emerging Markets Fund
Fidelity Europe Fund
Fidelity Europe Capital Appreciation Fund
Fidelity Japan Fund
Fidelity Japan Smaller Companies Fund
Fidelity Latin America Fund
Fidelity Nordic Fund
Fidelity Pacific Basin Fund
Fidelity Southeast Asia Fund
Annual Report
October 31, 2006
(2_fidelity_logos) (Registered_Trademark)
Contents
Chairman's Message | A-4 | Ned Johnson's message to shareholders. |
Shareholder Expense Example | A-5 | An example of Shareholder Expenses |
Canada Fund | A-7 | Performance |
| A-8 | Management's Discussion |
| A-9 | Investment Changes |
| A-10 | Investments |
| A-13 | Financial Statements |
China Region Fund | A-15 | Performance |
| A-16 | Management's Discussion |
| A-17 | Investment Changes |
| A-18 | Investments |
| A-21 | Financial Statements |
Emerging Markets Fund | A-23 | Performance |
| A-24 | Management's Discussion |
| A-25 | Investment Changes |
| A-26 | Investments |
| A-31 | Financial Statements |
Europe Fund | A-33 | Performance |
| A-34 | Management's Discussion |
| A-35 | Investment Changes |
| A-36 | Investments |
| A-38 | Financial Statements |
Europe Capital Appreciation Fund | A-40 | Performance |
| A-41 | Management's Discussion |
| A-42 | Investment Changes |
| A-43 | Investments |
| A-45 | Financial Statements |
Japan Fund | A-47 | Performance |
| A-48 | Management's Discussion |
| A-49 | Investment Changes |
| A-50 | Investments |
| A-52 | Financial Statements |
Japan Smaller Companies Fund | A-54 | Performance |
| A-55 | Management's Discussion |
| A-56 | Investment Changes |
| A-57 | Investments |
| A-61 | Financial Statements |
Latin America Fund | A-63 | Performance |
| A-64 | Management's Discussion |
| A-65 | Investment Changes |
| A-66 | Investments |
| A-68 | Financial Statements |
Nordic Fund | A-70 | Performance |
| A-71 | Management's Discussion |
| A-72 | Investment Changes |
| A-73 | Investments |
| A-75 | Financial Statements |
Pacific Basin Fund | A-77 | Performance |
| A-78 | Management's Discussion |
| A-79 | Investment Changes |
| A-80 | Investments |
| A-84 | Financial Statements |
Southeast Asia Fund | A-86 | Performance |
| A-87 | Management's Discussion |
| A-88 | Investment Changes |
| A-89 | Investments |
| A-93 | Financial Statements |
Notes to Financial Statements | A-95 | Notes to Financial Statements |
Reports of Independent Registered Public Accounting Firms | A-102 | |
Trustees and Officers | A-104 | |
Distributions | A-111 | |
Board Approval of Investment Advisory Contracts and Management Fees | A-113 | |
To view a fund's proxy voting guidelines and proxy voting record for the 12-month period ended June 30, visit www.fidelity.com/proxyvotingresults or visit the Securities and Exchange Commission's (SEC) web site at www.sec.gov. You may also call 1-800-544-8544 to request a free copy of the proxy voting guidelines.
Standard & Poor's, S&P and S&P 500 are registered service marks of The McGraw-Hill Companies, Inc. and have been licensed for use by Fidelity Distributors Corporation.
Other third party marks appearing herein are the property of their respective owners.
All other marks appearing herein are registered or unregistered trademarks or service marks of FMR Corp. or an affiliated company.
This report and the financial statements contained herein are submitted for the general information of the shareholders of the funds. This report is not authorized for distribution to prospective investors in the funds unless preceded or accompanied by an effective prospectus.
A fund files its complete schedule of portfolio holdings with the SEC for the first and third quarters of each fiscal year on Form N-Q. Forms N-Q are available on the SEC's web site at http://www.sec.gov. A fund's Forms N-Q may be reviewed and copied at the SEC's Public Reference Room in Washington, DC. Information regarding the operation of the SEC's Public Reference Room may be obtained by calling 1-800-SEC-0330. For a complete list of a fund's portfolio holdings, view each fund's most recent quarterly holdings report, semiannual report, or annual report on Fidelity's web site at http://www.fidelity.com/holdings.
NOT FDIC INSURED · MAY LOSE VALUE · NO BANK GUARANTEE
Neither the funds nor Fidelity Distributors Corporation is a bank.
Annual Report
Chairman's Message
(Photograph of Edward C. Johnson 3d.)
Dear Shareholder:
Stock and bond markets around the world have seen largely positive results year to date, although weakness in the technology sector and growth stocks in general have tempered performance. While financial markets are always unpredictable, there are a number of time-tested principles that can put the historical odds in your favor.
One of the basic tenets is to invest for the long term. Over time, riding out the markets' inevitable ups and downs has proven much more effective than selling into panic or chasing the hottest trend. Even missing only a few of the markets' best days can significantly diminish investor returns. Patience also affords the benefits of compounding - of earning interest on additional income or reinvested dividends and capital gains. There are tax advantages and cost benefits to consider as well. The more you sell, the more taxes you pay, and the more you trade, the higher the costs. While staying the course doesn't eliminate risk, it can considerably lessen the effect of short-term declines.
You can further manage your investing risk through diversification. And today, more than ever, geographic diversification should be taken into account. Studies
indicate that asset allocation is the single most important determinant of a portfolio's long-term success. The right mix of stocks, bonds and cash - - aligned to your particular risk tolerance and investment objective - is very important. Age-appropriate rebalancing is also an essential aspect of asset allocation. For younger investors, an emphasis on equities - which historically have been the best performing asset class over time - is encouraged. As investors near their specific goal, such as retirement or sending a child to college, consideration may be given to replacing volatile assets (e.g. common stocks) with more-stable fixed investments (bonds or savings plans).
A third investment principle - investing regularly - can help lower the average cost of your purchases. Investing a certain amount of money each month or quarter helps ensure you won't pay for all your shares at market highs. This strategy - known as dollar cost averaging - also reduces unconstructive "emotion" from investing, helping shareholders avoid selling weak performers just prior to an upswing, or chasing a hot performer just before a correction.
We invite you to contact us via the Internet, through our Investor Centers or over the phone. It is our privilege to provide you the information you need to make the investments that are right for you.
Sincerely,
/s/Edward C. Johnson 3d
Edward C. Johnson 3d
Annual Report
Shareholder Expense Example
As a shareholder of a Fund, you incur two types of costs: (1) transaction costs, including redemption fees, and (2) ongoing costs, including management fees and other Fund expenses. This Example is intended to help you understand your ongoing costs (in dollars) of investing in the Funds and to compare these costs with the ongoing costs of investing in other mutual funds.
The Example is based on an investment of $1,000 invested at the beginning of the period and held for the entire period (May 1, 2006 to October 31, 2006).
Actual Expenses
The first line of the accompanying table for each fund provides information about actual account values and actual expenses. You may use the information in this line, together with the amount you invested, to estimate the expenses that you paid over the period. Simply divide your account value by $1,000.00 (for example, an $8,600 account value divided by $1,000.00 = 8.6), then multiply the result by the number in the first line for a fund under the heading entitled "Expenses Paid During Period" to estimate the expenses you paid on your account during this period. A small balance maintenance fee of $12.00 that is charged once a year may apply for certain accounts with a value of less than $2,000. This fee is not included in the table below. If it was, the estimate of expenses you paid during the period would be higher, and your ending account value lower, by this amount.
Hypothetical Example for Comparison Purposes
The second line of the accompanying table for each fund provides information about hypothetical account values and hypothetical expenses based on a fund's actual expense ratio and an assumed rate of return of 5% per year before expenses, which is not the Fund's actual return. The hypothetical account values and expenses may not be used to estimate the actual ending account balance or expenses you paid for the period. You may use this information to compare the ongoing costs of investing in the Fund and other funds. To do so, compare this 5% hypothetical example with the 5% hypothetical examples that appear in the shareholder reports of the other funds. A small balance maintenance fee of $12.00 that is charged once a year may apply for certain accounts with a value of less than $2,000. This fee is not included in the table below. If it was, the estimate of expenses you paid during the period would be higher, and your ending account value lower, by this amount.
Please note that the expenses shown in the table are meant to highlight your ongoing costs only and do not reflect any transaction costs. Therefore, the second line of the table is useful in comparing ongoing costs only, and will not help you determine the relative total costs of owning different funds. In addition, if these transactional costs were included, your costs would have been higher.
| Beginning
Account Value
May 1, 2006 | Ending
Account Value
October 31, 2006 | Expenses Paid
During Period*
May 1, 2006
to October 31, 2006 |
Canada | | | |
Actual | $ 1,000.00 | $ 1,033.00 | $ 5.12 |
HypotheticalA | $ 1,000.00 | $ 1,020.16 | $ 5.09 |
China Region | | | |
Actual | $ 1,000.00 | $ 1,039.40 | $ 5.81 |
HypotheticalA | $ 1,000.00 | $ 1,019.51 | $ 5.75 |
Emerging Markets | | | |
Actual | $ 1,000.00 | $ 971.40 | $ 5.52 |
HypotheticalA | $ 1,000.00 | $ 1,019.61 | $ 5.65 |
Europe | | | |
Actual | $ 1,000.00 | $ 1,016.60 | $ 5.85 |
HypotheticalA | $ 1,000.00 | $ 1,019.41 | $ 5.85 |
Europe Capital Appreciation | | | |
Actual | $ 1,000.00 | $ 1,008.80 | $ 5.42 |
HypotheticalA | $ 1,000.00 | $ 1,019.81 | $ 5.45 |
Japan | | | |
Actual | $ 1,000.00 | $ 889.20 | $ 5.00 |
HypotheticalA | $ 1,000.00 | $ 1,019.91 | $ 5.35 |
Japan Smaller Companies | | | |
Actual | $ 1,000.00 | $ 836.20 | $ 4.81 |
HypotheticalA | $ 1,000.00 | $ 1,019.96 | $ 5.30 |
Latin America | | | |
Actual | $ 1,000.00 | $ 1,016.10 | $ 5.28 |
HypotheticalA | $ 1,000.00 | $ 1,019.96 | $ 5.30 |
Nordic | | | |
Actual | $ 1,000.00 | $ 995.10 | $ 5.73 |
HypotheticalA | $ 1,000.00 | $ 1,019.46 | $ 5.80 |
Pacific Basin | | | |
Actual | $ 1,000.00 | $ 946.70 | $ 5.50 |
HypotheticalA | $ 1,000.00 | $ 1,019.56 | $ 5.70 |
| Beginning
Account Value
May 1, 2006 | Ending
Account Value
October 31, 2006 | Expenses Paid
During Period*
May 1, 2006
to October 31, 2006 |
Southeast Asia | | | |
Actual | $ 1,000.00 | $ 1,015.50 | $ 6.20 |
HypotheticalA | $ 1,000.00 | $ 1,019.06 | $ 6.21 |
A 5% return per year before expenses
* Expenses are equal to each Fund's annualized expense ratio (shown in the table below); multiplied by the average account value over the period, multiplied by 184/365 (to reflect the one-half year period).
| Annualized
Expense Ratio |
Canada | 1.00% |
China Region | 1.13% |
Emerging Markets | 1.11% |
Europe | 1.15% |
Europe Capital Appreciation | 1.07% |
Japan | 1.05% |
Japan Smaller Companies | 1.04% |
Latin America | 1.04% |
Nordic | 1.14% |
Pacific Basin | 1.12% |
Southeast Asia | 1.22% |
Annual Report
Canada
Performance: The Bottom Line
Average annual total return reflects the change in the value of an investment, assuming reinvestment of the fund's dividend income and capital gains (the profits earned upon the sale of securities that have grown in value) and assuming a constant rate of performance each year. The $10,000 table and the fund's returns do not reflect the deduction of taxes that a shareholder would pay on fund distributions or the redemption of fund shares. During periods of reimbursement by Fidelity, a fund's total returns will be greater than it would be had the reimbursement not occurred. How a fund did yesterday is no guarantee of how it will do tomorrow.
Average Annual Total Returns
Periods ended
October 31, 2006 | Past 1
year | Past 5
years | Past 10
years |
Fidelity® Canada Fund | 26.93% | 23.87% | 13.15% |
$10,000 Over 10 Years
Let's say hypothetically that $10,000 was invested in Fidelity® Canada Fund on October 31, 1996. The chart shows how the value of your investment would have changed, and also shows how the S&P/TSX Composite Index performed over the same period.
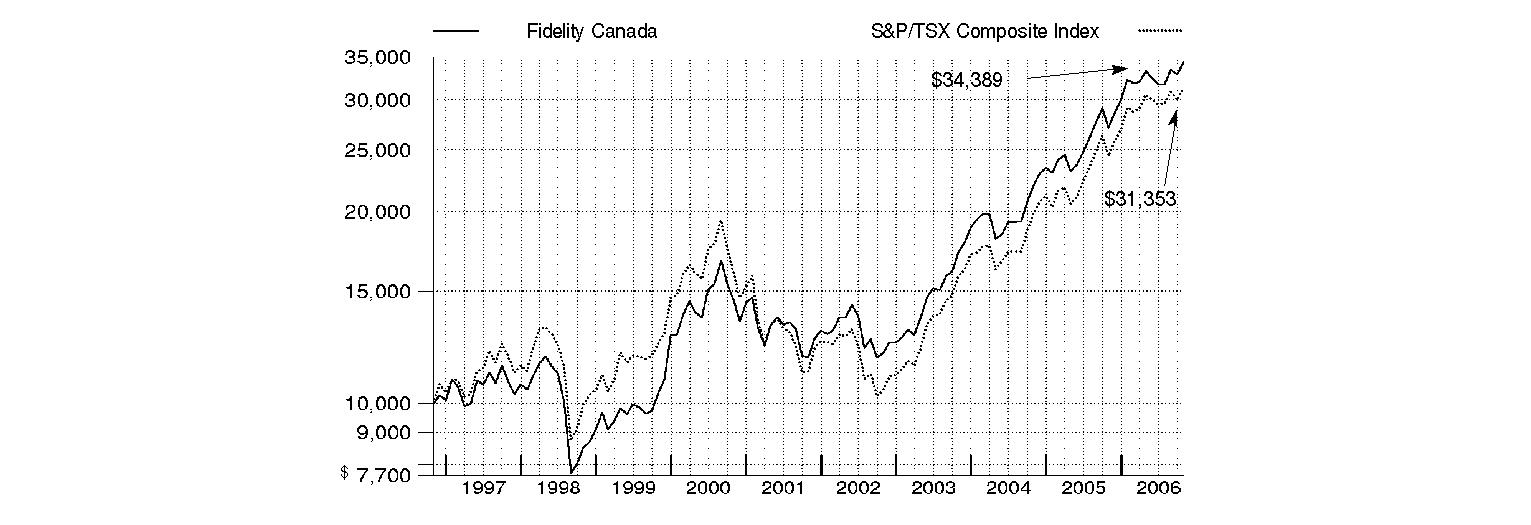
Annual Report
Canada
Management's Discussion of Fund Performance
Comments from Maxime Lemieux, Portfolio Manager of Fidelity® Canada Fund
International equity markets as a whole outpaced their U.S. counterparts for the 12 months ending October 31, 2006 - partly as a result of favorable currency exchanges that boosted returns for U.S. investors. The Morgan Stanley Capital InternationalSM Europe, Australasia, Far East (MSCI®EAFE®) Index - a gauge of developed stock markets outside the United States and Canada - gained 27.72% during that time. European markets benefited from solid corporate profit growth and attractive dividends, which helped the MSCI Europe index advance 31.95%. Strong performing Latin American and Asian emerging markets drove the MSCI Emerging Markets index to a lofty 35.42% return. Japan was somewhat of an exception to the generally stellar foreign market performance after struggling in the middle part of the period. Still, its earlier gains helped the Tokyo Stock Exchange Stock Price Index (TOPIX) - - a benchmark of the largest and better-established stocks traded on the Tokyo Stock Exchange - rise 12.47% overall. Natural-resources-rich Canada also struggled over the final six months as energy prices fell, but the S&P/TSX Composite Index managed a 12-month return of 28.21%.
The fund returned 26.93% for the 12-month period, lagging slightly behind the S&P/TSX Composite Index. The most telling factor in the fund's modest shortfall versus the index was its fairly sizable underweighting in the materials sector, although favorable stock selection there offset some of that relative underperformance. Not having any stake in such strong performers as Glamis Gold, steel maker Dofasco and copper and gold miner First Quantum Minerals weighed on performance. Inopportune stock picking in such names as Suncor Energy and Talisman Energy also hurt, as did some unfavorable picks in the transportation and capital goods groups. On the positive side, the fund benefited most from good stock picking in the information technology, telecommunication services, consumer staples and financials sectors, with the strongest results on an industry basis coming in food and staples retailing, tech hardware and equipment, and insurance. Among the best performers were tech hardware firm Research In Motion, chip maker ATI Technologies, which was sold to lock in profits, and telecom services operators TELUS and Rogers Communications. Favorable currency movements helped boost the fund's absolute return.
Note to shareholders: Fidelity Canada Fund may invest up to 35% of its total assets in any industry that represents more than 20% of the Canadian market. As of October 31, 2006, the fund did not have more than 25% of its total assets invested in any one industry.
The views expressed above reflect those of the portfolio manager(s) only through the end of the period as stated on the cover of this report and do not necessarily represent the views of Fidelity or any other person in the Fidelity organization. Any such views are subject to change at any time based upon market or other conditions and Fidelity disclaims any responsibility to update such views. These views may not be relied on as investment advice and, because investment decisions for a Fidelity fund are based on numerous factors, may not be relied on as an indication of trading intent on behalf of any Fidelity fund.
Annual Report
Canada
Investment Changes
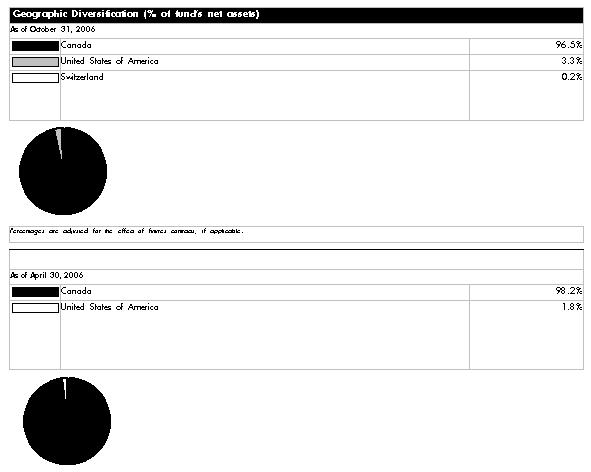
Asset Allocation |
| % of fund's
net assets | % of fund's net assets
6 months ago |
Stocks | 96.9 | 97.4 |
Short-Term Investments and
Net Other Assets | 3.1 | 2.6 |
Top Ten Stocks as of October 31, 2006 |
| % of fund's
net assets | % of fund's net assets
6 months ago |
Toronto-Dominion Bank (Commercial Banks) | 4.6 | 4.5 |
Manulife Financial Corp. (Insurance) | 4.5 | 5.0 |
Royal Bank of Canada (Commercial Banks) | 4.4 | 4.3 |
Research In Motion Ltd. (Communications Equipment) | 3.8 | 2.0 |
TELUS Corp. (non-vtg.) (Diversified Telecommunication Services) | 3.6 | 2.4 |
Bank of Montreal (Commercial Banks) | 3.5 | 2.8 |
TransCanada Corp. (Oil, Gas & Consumable Fuels) | 3.4 | 1.7 |
Suncor Energy, Inc. (Oil, Gas & Consumable Fuels) | 3.0 | 2.4 |
Canadian National Railway Co. (Road & Rail) | 2.9 | 3.7 |
Rogers Communications, Inc. Class B (non-vtg.) (Wireless Telecommunication Services) | 2.8 | 2.1 |
| 36.5 | |
Market Sectors as of October 31, 2006 |
| % of fund's
net assets | % of fund's net assets
6 months ago |
Financials | 28.7 | 29.3 |
Energy | 26.7 | 26.0 |
Materials | 8.7 | 11.8 |
Consumer Discretionary | 7.6 | 7.0 |
Industrials | 7.6 | 8.2 |
Information Technology | 7.3 | 6.5 |
Telecommunication Services | 6.4 | 4.5 |
Consumer Staples | 3.7 | 3.4 |
Health Care | 0.2 | 0.2 |
Utilities | 0.0 | 0.5 |
Annual Report
Canada
Investments October 31, 2006
Showing Percentage of Net Assets
Common Stocks - 96.9% |
| Shares | | Value (Note 1) |
CONSUMER DISCRETIONARY - 7.6% |
Hotels, Restaurants & Leisure - 1.0% |
Great Canadian Gaming Corp. (a) | 1,000,000 | | $ 10,599,920 |
Tim Hortons, Inc. | 737,000 | | 21,299,300 |
| | 31,899,220 |
Media - 3.8% |
Aeroplan Income Fund (d) | 843,200 | | 12,024,791 |
Aeroplan Income Fund (e) | 31,800 | | 453,497 |
Alliance Atlantis Communications, Inc. Class B (non-vtg.) (a) | 125,000 | | 4,275,598 |
Astral Media, Inc. Class A (non-vtg.) | 275,000 | | 9,778,649 |
Corus Entertainment, Inc. Class B (non-vtg.) | 550,000 | | 20,698,793 |
Quebecor, Inc. Class B (sub. vtg.) | 875,000 | | 23,553,645 |
Thomson Corp. | 600,000 | | 24,830,535 |
Yellow Pages Income Fund (d) | 1,875,000 | | 25,252,750 |
| | 120,868,258 |
Multiline Retail - 0.7% |
Canadian Tire Corp. Ltd. Class A (non-vtg.) (d) | 325,000 | | 20,941,968 |
Specialty Retail - 0.3% |
RONA, Inc. (a) | 400,000 | | 8,123,636 |
Textiles, Apparel & Luxury Goods - 1.8% |
Gildan Activewear, Inc. Class A (a) | 1,125,000 | | 57,279,651 |
TOTAL CONSUMER DISCRETIONARY | | 239,112,733 |
CONSUMER STAPLES - 3.7% |
Food & Staples Retailing - 3.7% |
Alimentation Couche-Tard, Inc. Class B (sub. vtg.) | 1,598,000 | | 37,877,148 |
CVS Corp. | 225,000 | | 7,060,500 |
Metro, Inc. Class A (sub. vtg.) | 850,000 | | 26,393,800 |
Shoppers Drug Mart Corp. | 1,080,000 | | 44,002,316 |
| | 115,333,764 |
ENERGY - 26.7% |
Energy Equipment & Services - 1.1% |
CCS Income Trust (d) | 540,000 | | 18,196,410 |
CCS Income Trust (e) | 135,000 | | 4,556,844 |
CHC Helicopter Corp. Class A (sub. vtg.) | 480,000 | | 10,744,578 |
Savanna Energy Services Corp. (a) | 160,000 | | 2,847,548 |
| | 36,345,380 |
Oil, Gas & Consumable Fuels - 25.6% |
AltaGas Income Trust | 600,000 | | 15,328,019 |
Cameco Corp. | 1,800,000 | | 63,332,294 |
Canadian Natural Resources Ltd. | 1,640,000 | | 85,385,472 |
Canadian Oil Sands Trust unit | 1,000,000 | | 27,096,602 |
Duvernay Oil Corp. (a) | 175,000 | | 5,067,697 |
EnCana Corp. | 1,750,000 | | 83,131,430 |
Galleon Energy, Inc. (a)(e) | 140,000 | | 1,766,356 |
Galleon Energy, Inc. Class A (a) | 630,000 | | 11,834,588 |
Highpine Oil & Gas Ltd. (a) | 460,000 | | 7,785,151 |
|
| Shares | | Value (Note 1) |
Highpine Oil & Gas Ltd. (e) | 40,000 | | $ 676,970 |
Husky Energy, Inc. | 700,000 | | 44,594,486 |
Imperial Oil Ltd. | 764,900 | | 26,074,665 |
Keyera Facilities Income Fund (d) | 875,000 | | 16,772,814 |
Nexen, Inc. | 400,000 | | 21,342,360 |
Niko Resources Ltd. | 165,000 | | 9,994,210 |
Niko Resources Ltd. (e) | 20,000 | | 1,211,419 |
Penn West Energy Trust (d) | 670,000 | | 25,191,021 |
Petro-Canada | 1,100,000 | | 46,913,998 |
Suncor Energy, Inc. | 1,225,000 | | 94,113,259 |
Talisman Energy, Inc. | 4,700,000 | | 77,241,349 |
TransCanada Corp. | 3,250,000 | | 105,201,977 |
Western Oil Sands, Inc. Class A (a) | 1,250,000 | | 32,234,000 |
| | 802,290,137 |
TOTAL ENERGY | | 838,635,517 |
FINANCIALS - 28.7% |
Capital Markets - 1.1% |
Addenda Capital, Inc. | 265,000 | | 5,884,693 |
CI Financial Income Fund (d) | 1,100,000 | | 29,443,727 |
| | 35,328,420 |
Commercial Banks - 16.0% |
Bank of Montreal | 1,770,000 | | 109,496,726 |
Canadian Imperial Bank of Commerce | 1,050,000 | | 81,931,145 |
National Bank of Canada | 490,000 | | 26,733,621 |
Royal Bank of Canada | 3,125,000 | | 138,622,901 |
Toronto-Dominion Bank | 2,475,000 | | 143,519,797 |
| | 500,304,190 |
Diversified Financial Services - 0.7% |
TSX Group, Inc. | 475,000 | | 21,155,302 |
Insurance - 9.5% |
ING Canada, Inc. | 1,500,000 | | 79,058,478 |
Manulife Financial Corp. | 4,300,000 | | 139,803,144 |
Power Corp. of Canada (sub. vtg.) | 1,250,000 | | 37,867,991 |
Sun Life Financial, Inc. | 1,000,000 | | 42,061,195 |
| | 298,790,808 |
Real Estate Management & Development - 1.4% |
Brookfield Asset Management, Inc. Class A (d) | 965,000 | | 43,958,580 |
TOTAL FINANCIALS | | 899,537,300 |
HEALTH CARE - 0.2% |
Health Care Equipment & Supplies - 0.2% |
Alcon, Inc. | 53,000 | | 5,622,240 |
Imaging Dynamics Co. Ltd. (a) | 425,000 | | 1,135,706 |
| | 6,757,946 |
Common Stocks - continued |
| Shares | | Value (Note 1) |
INDUSTRIALS - 7.6% |
Aerospace & Defense - 1.1% |
Bombardier, Inc. Class B (sub. vtg.) | 1,900,000 | | $ 6,549,682 |
CAE, Inc. | 3,050,000 | | 27,113,526 |
| | 33,663,208 |
Airlines - 0.9% |
ACE Aviation Holdings, Inc. Class A (a) | 675,000 | | 23,448,982 |
Jazz Air Income Fund (d) | 300,000 | | 2,479,847 |
WestJet Airlines Ltd. (a) | 327,500 | | 3,582,328 |
| | 29,511,157 |
Commercial Services & Supplies - 0.3% |
Garda World Security Corp. (a) | 500,000 | | 9,419,677 |
Construction & Engineering - 1.1% |
SNC-Lavalin Group, Inc. | 1,270,000 | | 34,684,185 |
Machinery - 0.1% |
Railpower Technologies Corp. (a) | 550,000 | | 1,068,009 |
Torr Canada, Inc. (a) | 1,100,000 | | 744,667 |
| | 1,812,676 |
Road & Rail - 3.3% |
Canadian National Railway Co. | 1,925,000 | | 91,736,071 |
TransForce Income Fund | 736,237 | | 11,312,598 |
| | 103,048,669 |
Trading Companies & Distributors - 0.8% |
Finning International, Inc. | 700,000 | | 24,785,107 |
TOTAL INDUSTRIALS | | 236,924,679 |
INFORMATION TECHNOLOGY - 7.3% |
Communications Equipment - 4.3% |
Nortel Networks Corp. (a) | 6,700,000 | | 14,941,003 |
Research In Motion Ltd. (a) | 1,010,000 | | 118,654,807 |
| | 133,595,810 |
Electronic Equipment & Instruments - 0.4% |
Celestica, Inc. (sub. vtg.) (a) | 500,000 | | 4,908,030 |
Miranda Technologies, Inc. | 479,800 | | 5,897,867 |
Miranda Technologies, Inc. (e) | 186,300 | | 2,290,064 |
| | 13,095,961 |
Internet Software & Services - 1.5% |
Emergis, Inc. (a) | 1,600,000 | | 7,781,588 |
Google, Inc. Class A (sub. vtg.) (a) | 80,000 | | 38,111,200 |
| | 45,892,788 |
IT Services - 0.3% |
CGI Group, Inc. Class A (sub. vtg.) (a) | 1,400,000 | | 9,552,398 |
|
| Shares | | Value (Note 1) |
Semiconductors & Semiconductor Equipment - 0.3% |
Broadcom Corp. Class A (a) | 275,000 | | $ 8,324,250 |
Tundra Semiconductor Corp. Ltd. (a) | 200,000 | | 2,182,336 |
Tundra Semiconductor Corp. Ltd. (a)(e) | 4,300 | | 46,920 |
| | 10,553,506 |
Software - 0.5% |
Cognos, Inc. (a) | 240,000 | | 8,755,202 |
MacDonald Dettwiler & Associates Ltd. (a) | 225,000 | | 8,375,495 |
| | 17,130,697 |
TOTAL INFORMATION TECHNOLOGY | | 229,821,160 |
MATERIALS - 8.7% |
Chemicals - 1.7% |
Potash Corp. of Saskatchewan, Inc. | 415,000 | | 51,833,502 |
Metals & Mining - 7.0% |
Aber Diamond Corp. | 275,000 | | 10,185,276 |
Alcan, Inc. | 1,475,000 | | 69,200,775 |
Barrick Gold Corp. | 500,000 | | 15,476,774 |
Eldorado Gold Corp. (a) | 1,000,000 | | 4,248,875 |
Goldcorp, Inc. | 650,000 | | 17,114,862 |
IPSCO, Inc. | 260,000 | | 23,774,401 |
Meridian Gold, Inc. (a) | 450,000 | | 11,331,671 |
Shore Gold, Inc. (a) | 2,800,000 | | 13,343,429 |
Teck Cominco Ltd. Class B (sub. vtg.) | 700,000 | | 51,540,551 |
US Gold Corp. (a) | 811,300 | | 3,991,596 |
US Gold Corp. warrants 2/22/11 (a)(f) | 200,000 | | 381,542 |
| | 220,589,752 |
TOTAL MATERIALS | | 272,423,254 |
TELECOMMUNICATION SERVICES - 6.4% |
Diversified Telecommunication Services - 3.6% |
TELUS Corp. (non-vtg.) | 1,950,000 | | 111,860,330 |
Wireless Telecommunication Services - 2.8% |
Rogers Communications, Inc. Class B (non-vtg.) | 1,500,000 | | 89,774,195 |
TOTAL TELECOMMUNICATION SERVICES | | 201,634,525 |
TOTAL COMMON STOCKS (Cost $2,321,544,720) | 3,040,180,878 |
Government Obligations - 2.2% |
| Principal Amount (g) | | |
Canadian Government Treasury Bills 4.1197% to 4.1692% 11/2/06 to 2/8/07
(Cost $68,584,981) | CAD | 77,250,000 | | 68,496,293 |
Money Market Funds - 6.1% |
| Shares | | Value (Note 1) |
Fidelity Cash Central Fund, 5.34% (b) | 9,825,381 | | $ 9,825,381 |
Fidelity Securities Lending Cash Central Fund, 5.35% (b)(c) | 180,791,500 | | 180,791,500 |
TOTAL MONEY MARKET FUNDS (Cost $190,616,881) | 190,616,881 |
TOTAL INVESTMENT PORTFOLIO - 105.2% (Cost $2,580,746,582) | | 3,299,294,052 |
NET OTHER ASSETS - (5.2)% | | (162,366,799) |
NET ASSETS - 100% | $ 3,136,927,253 |
Currency Abbreviations |
CAD | - | Canadian dollar |
Legend |
(a) Non-income producing |
(b) Affiliated fund that is available only to investment companies and other accounts managed by Fidelity Investments. The rate quoted is the annualized seven-day yield of the fund at period end. A complete unaudited listing of the fund's holdings as of its most recent quarter end is available upon request. |
(c) Investment made with cash collateral received from securities on loan. |
(d) Security or a portion of the security is on loan at period end. |
(e) Security exempt from registration under Rule 144A of the Securities Act of 1933. These securities may be resold in transactions exempt from registration, normally to qualified institutional buyers. At the end of the period, the value of these securities amounted to $11,002,070 or 0.4% of net assets. |
(f) Restricted securities - Investment in securities not registered under the Securities Act of 1933 (excluding 144A issues). At the end of the period, the value of restricted securities (excluding 144A issues) amounted to $381,542 or 0.0% of net assets. |
Additional information on each holding is as follows: |
Security | Acquisition Date | Acquisition Cost |
US Gold Corp. warrants 2/22/11 | 2/8/06 | $ 98,359 |
(g) Principal amount is stated in United States dollars unless otherwise noted. |
Affiliated Central Funds |
Information regarding fiscal year to date income earned by the Fund from investments in Fidelity Central Funds is as follows: |
Fund | Income earned |
Fidelity Cash Central Fund | $ 2,077,487 |
Fidelity Securities Lending Cash Central Fund | 2,661,469 |
Total | $ 4,738,956 |
Annual Report
See accompanying notes which are an integral part of the financial statements.
Canada
Financial Statements
Statement of Assets and Liabilities
October 31, 2006 |
| | |
Assets | | |
Investment in securities, at value (including securities loaned of $174,493,284) - See accompanying schedule: Unaffiliated issuers (cost $2,390,129,701) | $ 3,108,677,171 | |
Fidelity Central Funds (cost $190,616,881) | 190,616,881 | |
Total Investments (cost $2,580,746,582) | | $ 3,299,294,052 |
Cash | | 29,082 |
Foreign currency held at value (cost $1,791,713) | | 1,791,717 |
Receivable for investments sold | | 25,514,872 |
Receivable for fund shares sold | | 4,380,006 |
Dividends receivable | | 3,954,097 |
Interest receivable | | 124,495 |
Other receivables | | 362,338 |
Total assets | | 3,335,450,659 |
| | |
Liabilities | | |
Payable for investments purchased | $ 12,321,954 | |
Payable for fund shares redeemed | 2,732,670 | |
Accrued management fee | 1,813,081 | |
Other affiliated payables | 667,040 | |
Other payables and accrued expenses | 197,161 | |
Collateral on securities loaned, at value | 180,791,500 | |
Total liabilities | | 198,523,406 |
| | |
Net Assets | | $ 3,136,927,253 |
Net Assets consist of: | | |
Paid in capital | | $ 2,344,374,043 |
Undistributed net investment income | | 17,032,665 |
Accumulated undistributed net realized gain (loss) on investments and foreign currency transactions | | 56,941,099 |
Net unrealized appreciation (depreciation) on investments and assets and liabilities in foreign currencies | | 718,579,446 |
Net Assets, for 63,393,198 shares outstanding | | $ 3,136,927,253 |
Net Asset Value, offering price and redemption price per share ($3,136,927,253 ÷ 63,393,198 shares) | | $ 49.48 |
Statement of Operations
Year ended October 31, 2006 |
| | |
Investment Income | | |
Dividends | | $ 45,868,408 |
Interest | | 2,034,791 |
Income from Fidelity Central Funds (including $2,661,469 from security lending) | | 4,738,956 |
| | 52,642,155 |
Less foreign taxes withheld | | (6,860,262) |
Total income | | 45,781,893 |
| | |
Expenses | | |
Management fee
Basic fee | $ 19,138,604 | |
Performance adjustment | (395,368) | |
Transfer agent fees | 6,065,757 | |
Accounting and security lending fees | 1,128,824 | |
Custodian fees and expenses | 548,393 | |
Independent trustees' compensation | 9,934 | |
Registration fees | 236,968 | |
Audit | 74,688 | |
Legal | 36,343 | |
Interest | 7,743 | |
Miscellaneous | 15,509 | |
Total expenses before reductions | 26,867,395 | |
Expense reductions | (817,547) | 26,049,848 |
Net investment income (loss) | | 19,732,045 |
Realized and Unrealized Gain (Loss) Net realized gain (loss) on: | | |
Investment securities: | | |
Unaffiliated issuers | 68,577,130 | |
Foreign currency transactions | 60,025 | |
Futures contracts | 1,591,012 | |
Total net realized gain (loss) | | 70,228,167 |
Change in net unrealized appreciation (depreciation) on: Investment securities | 453,821,705 | |
Assets and liabilities in foreign currencies | 40,570 | |
Futures contracts | 1,423,861 | |
Total change in net unrealized appreciation (depreciation) | | 455,286,136 |
Net gain (loss) | | 525,514,303 |
Net increase (decrease) in net assets resulting from operations | | $ 545,246,348 |
Annual Report
See accompanying notes which are an integral part of the financial statements.
Canada
Financial Statements - continued
Statement of Changes in Net Assets
| Year ended
October 31,
2006 | Year ended
October 31,
2005 |
Increase (Decrease) in Net Assets | | |
Operations | | |
Net investment income (loss) | $ 19,732,045 | $ 5,635,643 |
Net realized gain (loss) | 70,228,167 | 4,899,843 |
Change in net unrealized appreciation (depreciation) | 455,286,136 | 166,157,370 |
Net increase (decrease) in net assets resulting from operations | 545,246,348 | 176,692,856 |
Distributions to shareholders from net investment income | (7,430,512) | (1,384,456) |
Distributions to shareholders from net realized gain | (464,413) | - |
Total distributions | (7,894,925) | (1,384,456) |
Share transactions
Proceeds from sales of shares | 1,811,356,216 | 1,409,653,307 |
Reinvestment of distributions | 7,617,749 | 1,331,051 |
Cost of shares redeemed | (943,205,518) | (277,969,085) |
Net increase (decrease) in net assets resulting from share transactions | 875,768,447 | 1,133,015,273 |
Redemption fees | 1,291,008 | 874,168 |
Total increase (decrease) in net assets | 1,414,410,878 | 1,309,197,841 |
| | |
Net Assets | | |
Beginning of period | 1,722,516,375 | 413,318,534 |
End of period (including undistributed net investment income of $17,032,665 and undistributed net investment income of $4,865,446, respectively) | $ 3,136,927,253 | $ 1,722,516,375 |
Other Information Shares | | |
Sold | 39,925,341 | 38,729,389 |
Issued in reinvestment of distributions | 181,418 | 40,068 |
Redeemed | (20,723,860) | (7,727,493) |
Net increase (decrease) | 19,382,899 | 31,041,964 |
Financial Highlights
Years ended October 31, | 2006 | 2005 | 2004 | 2003 | 2002 |
Selected Per-Share Data | | | | | |
Net asset value, beginning of period | $ 39.14 | $ 31.87 | $ 25.13 | $ 17.52 | $ 17.23 |
Income from Investment Operations | | | | | |
Net investment income (loss) D | .34 | .20 | .10 | .05 | .02 |
Net realized and unrealized gain (loss) | 10.15 | 7.12 | 6.74 | 7.58 | .28 |
Total from investment operations | 10.49 | 7.32 | 6.84 | 7.63 | .30 |
Distributions from net investment income | (.16) | (.08) | (.13) | (.04) | (.03) |
Distributions from net realized gain | (.01) | - | - | - | - |
Total distributions | (.17) | (.08) | (.13) | (.04) | (.03) |
Redemption fees added to paid in capital D | .02 | .03 | .03 | .02 | .02 |
Net asset value, end of period | $ 49.48 | $ 39.14 | $ 31.87 | $ 25.13 | $ 17.52 |
Total Return A, B, C | 26.93% | 23.11% | 27.45% | 43.75% | 1.85% |
Ratios to Average Net Assets E, G | | | | | |
Expenses before reductions | 1.00% | 1.08% | 1.20% | 1.42% | 1.52% |
Expenses net of fee waivers, if any | 1.00% | 1.08% | 1.20% | 1.42% | 1.52% |
Expenses net of all reductions | .97% | 1.04% | 1.15% | 1.37% | 1.46% |
Net investment income (loss) | .74% | .55% | .34% | .26% | .12% |
Supplemental Data | | | | | |
Net assets, end of period (000 omitted) | $ 3,136,927 | $ 1,722,516 | $ 413,319 | $ 167,205 | $ 77,251 |
Portfolio turnover rate F | 50% | 24% | 47% | 52% | 98% |
A Total returns would have been lower had certain expenses not been reduced during the periods shown. B Total returns do not include the effect of the former sales charges. C Total returns do not include the effect of the former contingent deferred sales charge. D Calculated based on average shares outstanding during the period. E Fees and expenses of the underlying Fidelity Central Funds are not included in the Fund's expense ratio. The Fund indirectly bears its proportionate share of the expense of any underlying Fidelity Central Funds. F Amount does not include the portfolio activity of any underlying Fidelity Central Funds. G Expense ratios reflect operating expenses of the Fund. Expenses before reductions do not reflect amounts reimbursed by the investment adviser or reductions from brokerage service arrangements or other expense offset arrangements and do not represent the amount paid by the Fund during periods when reimbursements or reductions occur. Expenses net of fee waivers reflect expenses after reimbursement by the investment adviser but prior to reductions from brokerage service arrangements or other expense offset arrangements. Expenses net of all reductions represent the net expenses paid by the Fund. |
Annual Report
See accompanying notes which are an integral part of the financial statements.
China Region
Performance: The Bottom Line
Average annual total return reflects the change in the value of an investment, assuming reinvestment of the fund's dividend income and capital gains (the profits earned upon the sale of securities that have grown in value) and assuming a constant rate of performance each year. The $10,000 table and the fund's returns do not reflect the deduction of taxes that a shareholder would pay on fund distributions or the redemption of fund shares. During periods of reimbursement by Fidelity, a fund's total returns will be greater than it would be had the reimbursement not occurred. How a fund did yesterday is no guarantee of how it will do tomorrow.
Average Annual Total Returns
Periods ended
October 31, 2006 | Past 1
year | Past 5
years | Past 10
years |
Fidelity China Region Fund | 30.83% | 16.96% | 7.71% |
$10,000 Over Life of Fund
Let's say hypothetically that $10,000 was invested in Fidelity China Region Fund on October 31, 1996. The chart shows how the value of your investment would have changed, and also shows how the Hang Seng Index performed over the same period.
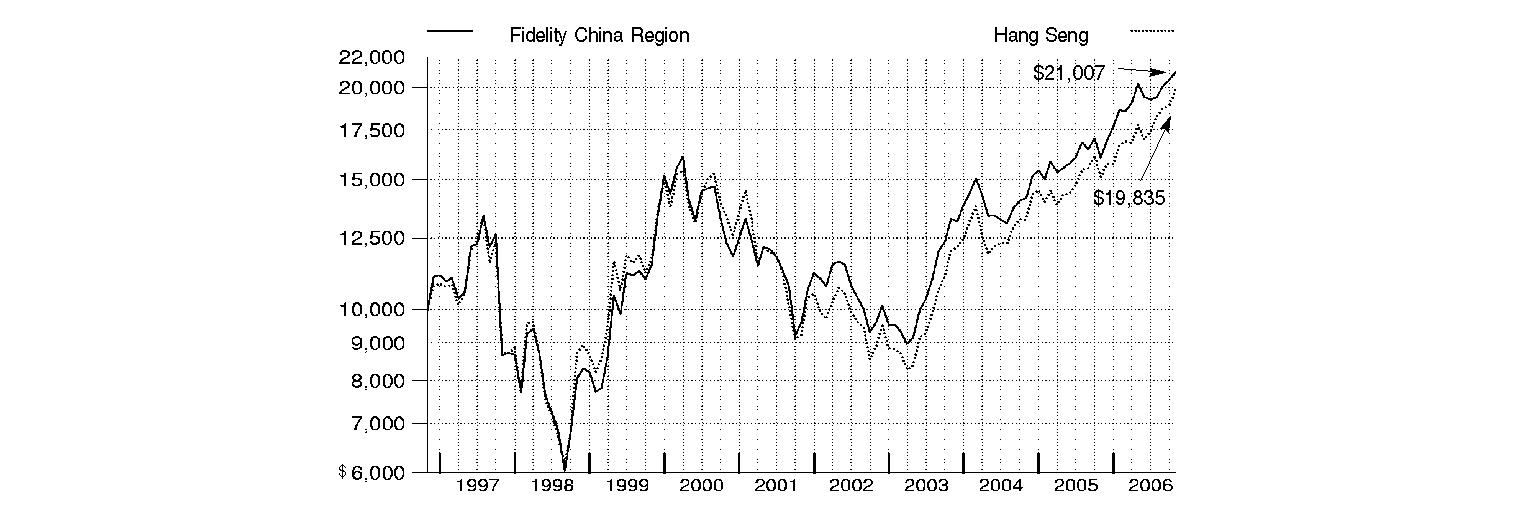
Annual Report
China Region
Management's Discussion of Fund Performance
Comments from K.C. Lee, Portfolio Manager of Fidelity® China Region Fund
International equity markets as a whole outpaced their U.S. counterparts for the 12 months ending October 31, 2006 - partly as a result of favorable currency exchanges that boosted returns for U.S. investors. The Morgan Stanley Capital InternationalSM Europe, Australasia, Far East (MSCI® EAFE®) Index - a gauge of developed stock markets outside the United States and Canada - gained 27.72% during that time. European markets benefited from solid corporate profit growth and attractive dividends, which helped the MSCI Europe index advance 31.95%. Strong performing Latin American and Asian emerging markets drove the MSCI Emerging Markets index to a lofty 35.42% return. Japan was somewhat of an exception to the generally stellar foreign market performance after struggling in the middle part of the period. Still, its earlier gains helped the Tokyo Stock Exchange Stock Price Index (TOPIX) - - a benchmark of the largest and better-established stocks traded on the Tokyo Stock Exchange - rise 12.47% overall. Natural-resources-rich Canada also struggled over the final six months as energy prices fell, but the S&P/TSX Composite Index managed a 12-month return of 28.21%.
During the past year, the fund returned 30.83%, versus 30.60% for the Fidelity China Region Fund Linked Index, tracking market performance in Hong Kong, Taiwan and China, and 31.12% for the Hang Seng Index. Selected technology holdings aided returns versus the Linked index. For example, Hong Kong-listed Foxconn International Holdings, a handset manufacturer incorporated in the Cayman Islands, posted solid earnings growth. Another strong tech holding was High Tech Computer, a Taiwanese manufacturer of wireless pocket personal computers. A large underweighting in U.K.-based bank HSBC Holdings, listed in Hong Kong and accounting for roughly one-quarter of the Linked index, also added value, as did positions in Bank of East Asia and China Life Insurance. Overall, my picks in Taiwan and China benefited returns. Conversely, my choices in Hong Kong - tempered by some strong performers incorporated in the Cayman Islands but listed in Hong Kong - hurt performance. Food retailer Dairy Farm International had an earnings miss, pulling down my stock selection in the consumer staples sector. Not owning Hong Kong Exchanges and Clearing also was untimely, along with our stake in weak performing conglomerate Hutchison Whampoa. Elsewhere, underweighting index component China Mobile was costly. Lastly, the fund's cash position, which increased substantially during the period, hampered the fund's returns in a strong market environment.
Note to shareholders: Fidelity China Region Fund may invest up to 35% of its total assets in any industry that represents more than 20% of the Hong Kong, Taiwanese and Chinese market. As of October 31, 2006, the fund did not have more than 25% of its total assets invested in any one industry.
The views expressed above reflect those of the portfolio manager(s) only through the end of the period as stated on the cover of this report and do not necessarily represent the views of Fidelity or any other person in the Fidelity organization. Any such views are subject to change at any time based upon market or other conditions and Fidelity disclaims any responsibility to update such views. These views may not be relied on as investment advice and, because investment decisions for a Fidelity fund are based on numerous factors, may not be relied on as an indication of trading intent on behalf of any Fidelity fund.
Annual Report
China Region
Investment Changes
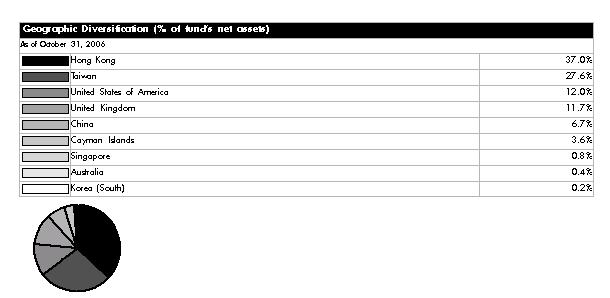
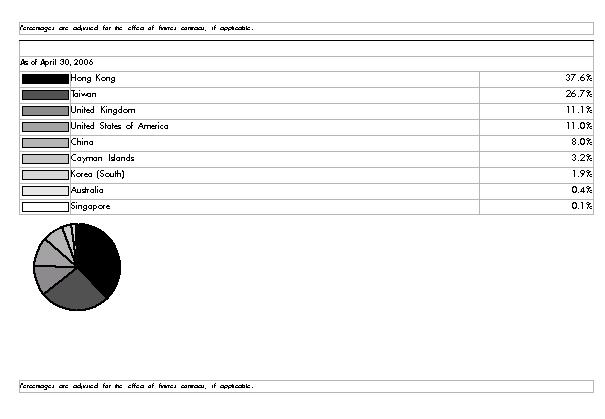
Asset Allocation |
| % of fund's
net assets | % of fund's net assets
6 months ago |
Stocks | 88.0 | 89.0 |
Short-Term Investments and
Net Other Assets | 12.0 | 11.0 |
Top Ten Stocks as of October 31, 2006 |
| % of fund's
net assets | % of fund's net assets
6 months ago |
HSBC Holdings PLC (Hong Kong) (Reg.) (Commercial Banks) | 9.3 | 8.3 |
Taiwan Semiconductor Manufacturing Co. Ltd. (Semiconductors & Semiconductor Equipment) | 5.1 | 4.8 |
Hon Hai Precision Industry Co. Ltd. (Foxconn) (Electronic Equipment & Instruments) | 4.6 | 4.1 |
Cheung Kong Holdings Ltd. (Real Estate Management & Development) | 3.5 | 3.5 |
Hutchison Whampoa Ltd. (Industrial Conglomerates) | 3.3 | 3.3 |
China Mobile (Hong Kong) Ltd. (Wireless Telecommunication Services) | 3.1 | 2.5 |
Li & Fung Ltd. (Distributors) | 3.1 | 2.1 |
Hong Kong & China Gas Co. Ltd. (Gas Utilities) | 2.8 | 3.0 |
Bank of East Asia Ltd. (Commercial Banks) | 2.4 | 1.8 |
Foxconn International Holdings Ltd. (Communications Equipment) | 2.1 | 1.3 |
| 39.3 | |
Market Sectors as of October 31, 2006 |
| % of fund's
net assets | % of fund's net assets
6 months ago |
Financials | 31.8 | 28.7 |
Information Technology | 25.3 | 23.9 |
Consumer Discretionary | 7.7 | 10.2 |
Energy | 4.8 | 5.0 |
Telecommunication Services | 4.2 | 4.4 |
Utilities | 4.2 | 4.4 |
Industrials | 3.9 | 6.2 |
Consumer Staples | 3.7 | 3.5 |
Materials | 2.4 | 2.7 |
Health Care | 0.0 | 0.0 |
Annual Report
China Region
Investments October 31, 2006
Showing Percentage of Net Assets
Common Stocks - 88.0% |
| Shares | | Value (Note 1) |
CONSUMER DISCRETIONARY - 7.7% |
Auto Components - 0.1% |
Tong Yang Industry Co. Ltd. | 937,736 | | $ 681,219 |
Distributors - 3.1% |
Li & Fung Ltd. | 8,668,600 | | 22,682,458 |
Hotels, Restaurants & Leisure - 2.5% |
Cafe de Coral Holdings Ltd. | 4,312,000 | | 6,742,005 |
Hong Kong & Shanghai Hotels Ltd. | 2,878,996 | | 3,997,989 |
Mandarin Oriental International Ltd. | 1,235,000 | | 1,766,050 |
Shangri-La Asia Ltd. | 2,674,000 | | 5,803,775 |
| | 18,309,819 |
Household Durables - 0.4% |
Basso Industry Corp. Ltd. | 1,047,160 | | 1,188,412 |
Merry Electronics Co. Ltd. | 549,939 | | 1,690,845 |
| | 2,879,257 |
Leisure Equipment & Products - 0.4% |
Li Ning Co. Ltd. | 2,124,000 | | 2,512,575 |
Media - 1.0% |
Hong Kong Economic Time Holdings Ltd. | 4,572,000 | | 1,346,227 |
Television Broadcasts Ltd. | 1,082,000 | | 6,204,958 |
| | 7,551,185 |
Specialty Retail - 0.2% |
Esprit Holdings Ltd. | 167,000 | | 1,616,919 |
TOTAL CONSUMER DISCRETIONARY | | 56,233,432 |
CONSUMER STAPLES - 3.7% |
Beverages - 0.5% |
Dynasty Fine Wines Group Ltd. | 2,366,000 | | 912,668 |
Yantai Changyu Pioneer Wine Co.
(B Shares) | 706,263 | | 2,406,518 |
| | 3,319,186 |
Food & Staples Retailing - 2.1% |
Convenience Retail Asia Ltd. | 962,200 | | 368,687 |
Dairy Farm International Holdings Ltd. | 4,431,600 | | 13,915,224 |
Lianhua Supermarket Holdings Co.
(H Shares) | 949,000 | | 1,205,591 |
| | 15,489,502 |
Food Products - 1.1% |
China Mengniu Dairy Co. Ltd. | 4,535,000 | | 8,245,242 |
TOTAL CONSUMER STAPLES | | 27,053,930 |
ENERGY - 4.8% |
Energy Equipment & Services - 0.1% |
China Oilfield Services Ltd. (H Shares) | 2,034,000 | | 1,142,902 |
Oil, Gas & Consumable Fuels - 4.7% |
China Shenhua Energy Co. Ltd.
(H Shares) | 3,349,500 | | 5,891,730 |
CNOOC Ltd. | 14,266,500 | | 11,958,180 |
|
| Shares | | Value (Note 1) |
PetroChina Co. Ltd. (H Shares) | 14,100,000 | | $ 15,564,990 |
S-Oil Corp. | 14,940 | | 1,019,519 |
| | 34,434,419 |
TOTAL ENERGY | | 35,577,321 |
FINANCIALS - 31.8% |
Commercial Banks - 19.0% |
Bank of East Asia Ltd. | 3,707,307 | | 17,709,003 |
BOC Hong Kong Holdings Ltd. | 3,933,000 | | 8,799,336 |
China Merchants Bank Co. Ltd.
(H Shares) (a) | 1,673,500 | | 2,612,288 |
DBS Group Holdings Ltd. | 435,000 | | 5,697,958 |
Hang Seng Bank Ltd. | 572,800 | | 7,298,832 |
HSBC Holdings PLC (Hong Kong) (Reg.) | 3,594,421 | | 68,631,877 |
Industrial & Commercial Bank of China | 1,872,000 | | 837,649 |
Mega Financial Holding Co. Ltd. | 1,479,000 | | 1,045,442 |
Standard Chartered PLC: | | | |
(Hong Kong) | 395,370 | | 11,143,484 |
(United Kingdom) | 238,841 | | 6,719,941 |
Wing Hang Bank Ltd. | 519,500 | | 5,049,915 |
Wing Lung Bank Ltd. | 443,600 | | 4,220,851 |
| | 139,766,576 |
Diversified Financial Services - 0.9% |
First Pacific Co. Ltd. | 8,184,000 | | 4,114,519 |
Jardine Matheson Holdings Ltd. | 123,200 | | 2,464,000 |
| | 6,578,519 |
Insurance - 2.7% |
AXA Asia Pacific Holdings Ltd. | 538,150 | | 2,774,615 |
Cathay Financial Holding Co. Ltd. | 3,717,943 | | 7,228,555 |
China Life Insurance Co. Ltd. (H Shares) | 2,196,000 | | 4,625,120 |
Shin Kong Financial Holding Co. Ltd. | 5,772,980 | | 5,116,070 |
| | 19,744,360 |
Real Estate Investment Trusts - 0.3% |
Champion (REIT) | 5,029,000 | | 2,496,006 |
Real Estate Management & Development - 8.9% |
Cheung Kong Holdings Ltd. | 2,364,000 | | 25,715,476 |
Greentown China Holdings Ltd. (a) | 825,000 | | 1,132,927 |
Guangzhou Investment Co. Ltd. | 14,372,000 | | 2,771,949 |
Hang Lung Group Ltd. | 185,000 | | 472,419 |
Henderson Investment Ltd. | 1,295,000 | | 2,317,852 |
Hong Kong Land Holdings Ltd. | 1,483,000 | | 5,576,080 |
Hysan Development Co. Ltd. | 1,219,000 | | 3,072,108 |
Shun Tak Holdings Ltd. | 1,981,000 | | 2,618,511 |
Sun Hung Kai Properties Ltd. | 722,021 | | 7,895,886 |
Swire Pacific Ltd. (A Shares) | 1,182,000 | | 12,485,380 |
Wharf Holdings Ltd. | 366,685 | | 1,244,726 |
| | 65,303,314 |
TOTAL FINANCIALS | | 233,888,775 |
Common Stocks - continued |
| Shares | | Value (Note 1) |
HEALTH CARE - 0.0% |
Health Care Equipment & Supplies - 0.0% |
Mindray Medical International Ltd. sponsored ADR | 3,100 | | $ 56,110 |
INDUSTRIALS - 3.9% |
Electrical Equipment - 0.0% |
Suntech Power Holdings Co. Ltd. sponsored ADR | 4,200 | | 109,200 |
Industrial Conglomerates - 3.3% |
Hutchison Whampoa Ltd. | 2,724,500 | | 24,172,003 |
Machinery - 0.4% |
King Slide Works Co. Ltd. | 521,400 | | 2,742,556 |
Transportation Infrastructure - 0.2% |
Hopewell Holdings Ltd. | 454,000 | | 1,348,480 |
TOTAL INDUSTRIALS | | 28,372,239 |
INFORMATION TECHNOLOGY - 25.3% |
Communications Equipment - 2.7% |
AAC Acoustic Technology Holdings, Inc. (a) | 2,016,000 | | 2,343,342 |
Foxconn International Holdings Ltd. (a) | 4,754,000 | | 15,801,432 |
ZTE Corp. (H Shares) | 567,000 | | 2,099,676 |
| | 20,244,450 |
Computers & Peripherals - 4.7% |
ASUSTeK Computer, Inc. | 2,793,351 | | 6,803,399 |
Catcher Technology Co. Ltd. | 1,153,789 | | 9,981,536 |
High Tech Computer Corp. | 628,208 | | 15,622,354 |
Wistron Corp. | 1,637,655 | | 1,900,519 |
| | 34,307,808 |
Electronic Equipment & Instruments - 8.0% |
AU Optronics Corp. | 5,400,994 | | 7,293,580 |
Chroma ATE, Inc. | 2,288,714 | | 2,521,552 |
Everfocus Electronics Co. Ltd. | 989,280 | | 784,267 |
Hon Hai Precision Industry Co. Ltd. (Foxconn) | 5,173,953 | | 33,609,250 |
Kingboard Chemical Holdings Ltd. | 1,765,800 | | 6,277,885 |
Nan Ya Printed Circuit Board Corp. | 520,000 | | 3,362,170 |
Phoenix Precision Technology Corp. | 1,845,654 | | 1,966,658 |
Yageo Corp. (a) | 7,582,000 | | 2,788,256 |
| | 58,603,618 |
Semiconductors & Semiconductor Equipment - 9.9% |
Advanced Semiconductor Engineering, Inc. | 8,634,690 | | 8,003,518 |
Holtek Semiconductor, Inc. | 1,006,335 | | 2,026,320 |
King Yuan Electronics Co. Ltd. | 4,344,780 | | 3,077,689 |
Macronix International Co. Ltd. (a) | 3,202,000 | | 1,081,007 |
MediaTek, Inc. | 816,200 | | 7,983,629 |
MJC Probe, Inc. (a) | 348,700 | | 830,363 |
Powertech Technology, Inc. | 492,000 | | 1,419,274 |
Siliconware Precision Industries Co. Ltd. | 7,653,756 | | 9,735,901 |
|
| Shares | | Value (Note 1) |
Taiwan Semiconductor Manufacturing Co. Ltd. | 20,264,513 | | $ 37,261,049 |
United Microelectronics Corp. | 2,586,728 | | 1,446,384 |
| | 72,865,134 |
TOTAL INFORMATION TECHNOLOGY | | 186,021,010 |
MATERIALS - 2.4% |
Chemicals - 2.2% |
Formosa Chemicals & Fibre Corp. | 819,365 | | 1,249,732 |
Nan Ya Plastics Corp. | 5,421,690 | | 7,844,495 |
Taiwan Fertilizer Co. Ltd. | 4,175,000 | | 6,795,780 |
| | 15,890,007 |
Containers & Packaging - 0.2% |
Vision Grande Group Holdings Ltd. | 2,106,000 | | 1,814,303 |
TOTAL MATERIALS | | 17,704,310 |
TELECOMMUNICATION SERVICES - 4.2% |
Wireless Telecommunication Services - 4.2% |
China Mobile (Hong Kong) Ltd. | 2,794,500 | | 22,791,942 |
Far EasTone Telecommunications Co. Ltd. | 5,565,685 | | 6,375,163 |
SmarTone Telecommunications Holdings Ltd. | 1,997,500 | | 1,913,462 |
| | 31,080,567 |
UTILITIES - 4.2% |
Electric Utilities - 0.8% |
Cheung Kong Infrastructure Holdings Ltd. | 1,878,000 | | 5,626,369 |
Gas Utilities - 2.9% |
Hong Kong & China Gas Co. Ltd. | 8,915,400 | | 20,427,973 |
Xinao Gas Holdings Ltd. | 492,000 | | 495,340 |
| | 20,923,313 |
Independent Power Producers & Energy Traders - 0.5% |
China Resources Power Holdings Co. Ltd. | 3,208,000 | | 4,001,131 |
TOTAL UTILITIES | | 30,550,813 |
TOTAL COMMON STOCKS (Cost $490,760,110) | 646,538,507 |
Money Market Funds - 12.2% |
| Shares | | Value (Note 1) |
Fidelity Cash Central Fund, 5.34% (b)
(Cost $89,849,746) | 89,849,746 | | $ 89,849,746 |
TOTAL INVESTMENT PORTFOLIO - 100.2% (Cost $580,609,856) | | 736,388,253 |
NET OTHER ASSETS - (0.2)% | | (1,594,840) |
NET ASSETS - 100% | $ 734,793,413 |
Legend |
(a) Non-income producing |
(b) Affiliated fund that is available only to investment companies and other accounts managed by Fidelity Investments. The rate quoted is the annualized seven-day yield of the fund at period end. A complete unaudited listing of the fund's holdings as of its most recent quarter end is available upon request. |
Affiliated Central Funds |
Information regarding fiscal year to date income earned by the Fund from investments in Fidelity Central Funds is as follows: |
Fund | Income earned |
Fidelity Cash Central Fund | $ 2,109,223 |
Annual Report
See accompanying notes which are an integral part of the financial statements.
China Region
Financial Statements
Statement of Assets and Liabilities
October 31, 2006 |
| | |
Assets | | |
Investment in securities, at value - See accompanying schedule: Unaffiliated issuers (cost $490,760,110) | $ 646,538,507 | |
Fidelity Central Funds (cost $89,849,746) | 89,849,746 | |
Total Investments (cost $580,609,856) | | $ 736,388,253 |
Foreign currency held at value (cost $4,770) | | 4,785 |
Receivable for investments sold | | 3,622,055 |
Receivable for fund shares sold | | 2,365,261 |
Dividends receivable | | 271,087 |
Interest receivable | | 361,337 |
Other receivables | | 64,825 |
Total assets | | 743,077,603 |
| | |
Liabilities | | |
Payable for investments purchased | $ 6,772,702 | |
Payable for fund shares redeemed | 806,907 | |
Accrued management fee | 421,410 | |
Other affiliated payables | 166,956 | |
Other payables and accrued expenses | 116,215 | |
Total liabilities | | 8,284,190 |
| | |
Net Assets | | $ 734,793,413 |
Net Assets consist of: | | |
Paid in capital | | $ 561,055,125 |
Undistributed net investment income | | 10,481,257 |
Accumulated undistributed net realized gain (loss) on investments and foreign currency transactions | | 7,478,945 |
Net unrealized appreciation (depreciation) on investments and assets and liabilities in foreign currencies | | 155,778,086 |
Net Assets, for 32,029,190 shares outstanding | | $ 734,793,413 |
Net Asset Value, offering price and redemption price per share ($734,793,413 ÷ 32,029,190 shares) | | $ 22.94 |
Statement of Operations
Year ended October 31, 2006 |
| | |
Investment Income | | |
Dividends | | $ 16,186,238 |
Interest | | 889 |
Income from Fidelity Central Funds | | 2,109,223 |
| | 18,296,350 |
Less foreign taxes withheld | | (1,314,592) |
Total income | | 16,981,758 |
| | |
Expenses | | |
Management fee | $ 3,955,481 | |
Transfer agent fees | 1,431,153 | |
Accounting fees and expenses | 269,407 | |
Custodian fees and expenses | 501,269 | |
Independent trustees' compensation | 2,038 | |
Registration fees | 67,645 | |
Audit | 64,768 | |
Legal | 7,476 | |
Miscellaneous | 4,208 | |
Total expenses before reductions | 6,303,445 | |
Expense reductions | (344,112) | 5,959,333 |
Net investment income (loss) | | 11,022,425 |
Realized and Unrealized Gain (Loss) Net realized gain (loss) on: | | |
Investment securities: | | |
Unaffiliated issuers | 17,196,356 | |
Foreign currency transactions | (65,796) | |
Total net realized gain (loss) | | 17,130,560 |
Change in net unrealized appreciation (depreciation) on: Investment securities | 105,874,055 | |
Assets and liabilities in foreign currencies | (354) | |
Total change in net unrealized appreciation (depreciation) | | 105,873,701 |
Net gain (loss) | | 123,004,261 |
Net increase (decrease) in net assets resulting from operations | | $ 134,026,686 |
Annual Report
See accompanying notes which are an integral part of the financial statements.
China Region
Financial Statements - continued
Statement of Changes in Net Assets
| Year ended
October 31,
2006 | Year ended
October 31,
2005 |
Increase (Decrease) in Net Assets | | |
Operations | | |
Net investment income (loss) | $ 11,022,425 | $ 7,344,399 |
Net realized gain (loss) | 17,130,560 | 12,847,382 |
Change in net unrealized appreciation (depreciation) | 105,873,701 | 18,616,807 |
Net increase (decrease) in net assets resulting from operations | 134,026,686 | 38,808,588 |
Distributions to shareholders from net investment income | (4,953,820) | (4,953,877) |
Share transactions
Proceeds from sales of shares | 370,937,196 | 167,800,419 |
Reinvestment of distributions | 4,673,740 | 4,707,630 |
Cost of shares redeemed | (167,183,904) | (105,619,907) |
Net increase (decrease) in net assets resulting from share transactions | 208,427,032 | 66,888,142 |
Redemption fees | 388,530 | 158,224 |
Total increase (decrease) in net assets | 337,888,428 | 100,901,077 |
| | |
Net Assets | | |
Beginning of period | 396,904,985 | 296,003,908 |
End of period (including undistributed net investment income of $10,481,257 and undistributed net investment income of $6,428,926, respectively) | $ 734,793,413 | $ 396,904,985 |
Other Information Shares | | |
Sold | 17,430,982 | 9,516,821 |
Issued in reinvestment of distributions | 249,399 | 279,550 |
Redeemed | (8,027,624) | (6,064,944) |
Net increase (decrease) | 9,652,757 | 3,731,427 |
Financial Highlights
Years ended October 31, | 2006 | 2005 | 2004 | 2003 | 2002 |
Selected Per-Share Data | | | | | |
Net asset value, beginning of period | $ 17.74 | $ 15.88 | $ 15.14 | $ 11.16 | $ 11.27 |
Income from Investment Operations | | | | | |
Net investment income (loss) C | .42 | .36 | .25 | .25 | .19 |
Net realized and unrealized gain (loss) | 4.99 | 1.75 | .73 | 3.91 | (.15) |
Total from investment operations | 5.41 | 2.11 | .98 | 4.16 | .04 |
Distributions from net investment income | (.22) | (.26) | (.26) | (.19) | (.16) |
Redemption fees added to paid in capital C | .01 | .01 | .02 | .01 | .01 |
Net asset value, end of period | $ 22.94 | $ 17.74 | $ 15.88 | $ 15.14 | $ 11.16 |
Total Return A, B | 30.83% | 13.44% | 6.71% | 37.91% | .23% |
Ratios to Average Net Assets D, F | | | | | |
Expenses before reductions | 1.14% | 1.16% | 1.22% | 1.30% | 1.32% |
Expenses net of fee waivers, if any | 1.14% | 1.16% | 1.22% | 1.30% | 1.32% |
Expenses net of all reductions | 1.08% | 1.12% | 1.22% | 1.30% | 1.31% |
Net investment income (loss) | 1.99% | 2.04% | 1.64% | 2.07% | 1.52% |
Supplemental Data | | | | | |
Net assets, end of period (000 omitted) | $ 734,793 | $ 396,905 | $ 296,004 | $ 231,654 | $ 110,359 |
Portfolio turnover rate E | 36% | 44% | 101% | 39% | 53% |
A Total returns would have been lower had certain expenses not been reduced during the periods shown. B Total returns do not include the effect of the former sales charges. C Calculated based on average shares outstanding during the period. D Fees and expenses of the underlying Fidelity Central Funds are not included in the Fund's expense ratio. The Fund indirectly bears its proportionate share of the expense of any underlying Fidelity Central Funds. E Amount does not include the portfolio activity of any underlying Fidelity Central Funds. F Expense ratios reflect operating expenses of the Fund. Expenses before reductions do not reflect amounts reimbursed by the investment adviser or reductions from brokerage service arrangements or other expense offset arrangements and do not represent the amount paid by the Fund during periods when reimbursements or reductions occur. Expenses net of fee waivers reflect expenses after reimbursement by the investment adviser but prior to reductions from brokerage service arrangements or other expense offset arrangements. Expenses net of all reductions represent the net expenses paid by the Fund. |
Annual Report
See accompanying notes which are an integral part of the financial statements.
Emerging Markets
Performance: The Bottom Line
Average annual total return reflects the change in the value of an investment, assuming reinvestment of the fund's dividend income and capital gains (the profits earned upon the sale of securities that have grown in value) and assuming a constant rate of performance each year. The $10,000 table and the fund's returns do not reflect the deduction of taxes that a shareholder would pay on fund distributions or the redemption of fund shares. During periods of reimbursement by Fidelity, a fund's total returns will be greater than it would be had the reimbursement not occurred. How a fund did yesterday is no guarantee of how it will do tomorrow.
Average Annual Total Returns
Periods ended
October 31, 2006 | Past 1
year | Past 5
years | Past 10
years |
Fidelity Emerging Markets Fund | 41.96% | 28.67% | 3.76% |
$10,000 Over 10 Years
Let's say hypothetically that $10,000 was invested in Fidelity Emerging Markets Fund on October 31, 1996. The chart shows how the value of your investment would have changed, and also shows how the MSCI Emerging Markets Index performed over the same period.
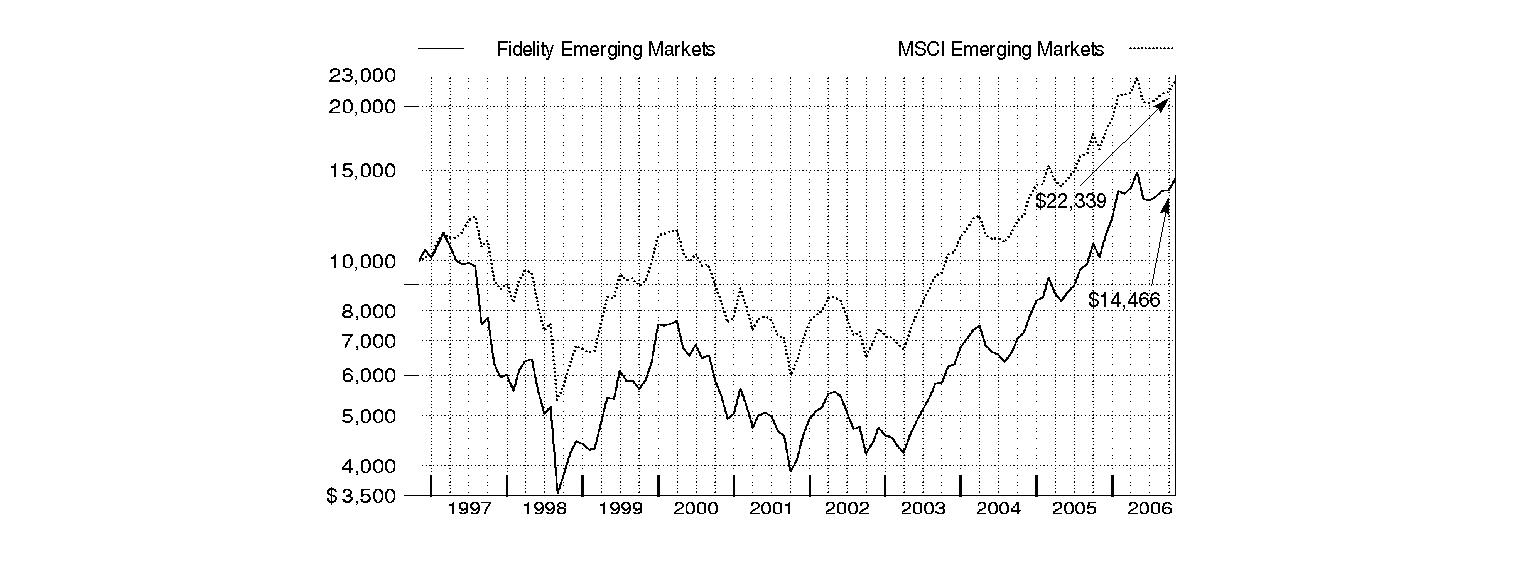
Annual Report
Emerging Markets
Management's Discussion of Fund Performance
Comments from Robert von Rekowsky, Portfolio Manager of Fidelity® Emerging Markets Fund
The 12-month period ending October 31, 2006, was volatile for emerging-markets stocks. On the whole, they rose sharply early on thanks to steady global economic growth, plunged at the period's midpoint after inflation concerns grew, and rallied in the final quarter when evidence suggested inflation fears were overblown. The performance benchmark of emerging markets - the Morgan Stanley Capital InternationalSM (MSCI) Emerging Markets Index - gained 35.42% for the one-year time frame, but lost 1.71% in the final six months of the period. If the benchmark can hold on to these gains through the end of 2006, it would mark the fourth consecutive calendar year that it's put up a double-digit positive return. But anything can happen given the volatility inherent in this asset class. On a country-level basis for the past year, Indonesia, Hong Kong, China and Russia were among the best performers. Israel was weak, however, pressured by military conflicts in the region, while Argentina was one of the only benchmark constituents with a negative return.
The fund returned 41.96% during the past year, handily beating the MSCI Emerging Markets index. The fund was helped versus the index by its positioning in all market sectors except for consumer staples, where our stock selection hurt a bit. The strongest contributions were made by industrials, materials, information technology and consumer discretionary - all mainly due to favorable stock picking. On a geographical basis, our holdings in Taiwan, Russia and South Korea helped the fund's returns. Conversely, stock selection in South Africa dampened performance, as did underweighting India and China. A modest cash position also hurt in a strongly rising market. Among individual holdings, contributors included two Russian producers of natural gas, Gazprom and Novatek. Taiwan-based High Tech Computer also helped performance, along with Hong Kong-listed Foxconn International Holdings, a contract manufacturer of wireless handsets. Lastly, two nickel producers, Russia's MMC Norilsk Nickel and Aneka Tambang, based in Indonesia, both posted triple-digit gains. Conversely, not owning China Life Insurance hurt, as the stock almost tripled in value. Korea-based Kookmin Bank and Reliance Industries, an Indian energy company, both were underweighted index components that did well and therefore hurt our results versus the benchmark. The fund did not own Reliance Industries at period end. Meanwhile, Israeli holding Orckit Communications suffered from slower-than-expected customer growth.
The views expressed above reflect those of the portfolio manager(s) only through the end of the period as stated on the cover of this report and do not necessarily represent the views of Fidelity or any other person in the Fidelity organization. Any such views are subject to change at any time based upon market or other conditions and Fidelity disclaims any responsibility to update such views. These views may not be relied on as investment advice and, because investment decisions for a Fidelity fund are based on numerous factors, may not be relied on as an indication of trading intent on behalf of any Fidelity fund.
Annual Report
Emerging Markets
Investment Changes
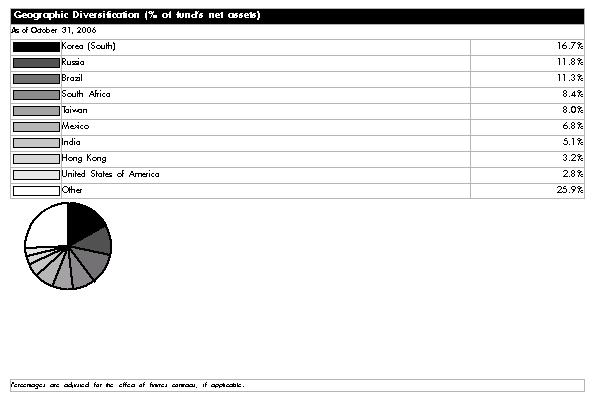
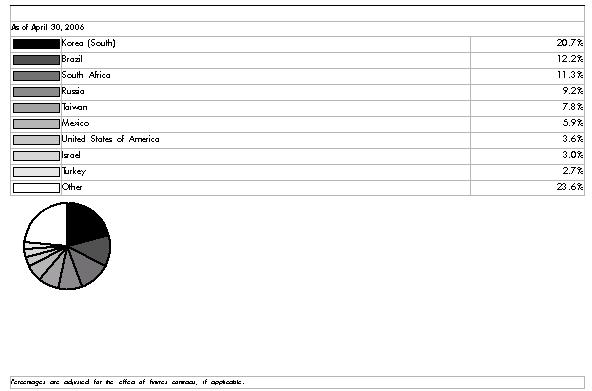
Asset Allocation |
| % of fund's
net assets | % of fund's net assets
6 months ago |
Stocks | 98.3 | 97.5 |
Short-Term Investments and
Net Other Assets | 1.7 | 2.5 |
Top Ten Stocks as of October 31, 2006 |
| % of fund's
net assets | % of fund's net assets
6 months ago |
Samsung Electronics Co. Ltd. (Korea (South), Semiconductors & Semiconductor Equipment) | 4.3 | 4.6 |
OAO Gazprom sponsored ADR (Russia, Oil, Gas & Consumable Fuels) | 3.9 | 1.5 |
America Movil SA de CV Series L sponsored ADR (Mexico, Wireless Telecommunication Services) | 3.1 | 2.2 |
Petroleo Brasileiro SA Petrobras (PN) (non-vtg.) (Brazil, Oil, Gas & Consumable Fuels) | 2.5 | 2.8 |
Lukoil Oil Co. sponsored ADR (Russia, Oil, Gas & Consumable Fuels) | 2.2 | 2.5 |
Hon Hai Precision Industry Co. Ltd. (Foxconn) (Taiwan, Electronic Equipment & Instruments) | 1.8 | 1.4 |
China Mobile (Hong Kong) Ltd. (Hong Kong, Wireless Telecommunication Services) | 1.7 | 1.0 |
Taiwan Semiconductor Manufacturing Co. Ltd. (Taiwan, Semiconductors & Semiconductor Equipment) | 1.4 | 1.6 |
Sasol Ltd. (South Africa, Oil, Gas & Consumable Fuels) | 1.4 | 1.5 |
MTN Group Ltd. (South Africa, Wireless Telecommunication Services) | 1.2 | 1.1 |
| 23.5 | |
Market Sectors as of October 31, 2006 |
| % of fund's
net assets | % of fund's net assets
6 months ago |
Energy | 18.6 | 17.8 |
Financials | 16.9 | 16.5 |
Information Technology | 15.7 | 14.9 |
Materials | 12.0 | 14.5 |
Telecommunication Services | 9.5 | 7.4 |
Industrials | 9.4 | 7.7 |
Consumer Discretionary | 9.3 | 11.3 |
Consumer Staples | 3.1 | 2.7 |
Utilities | 2.1 | 2.3 |
Health Care | 1.7 | 2.4 |
Annual Report
Emerging Markets
Investments October 31, 2006
Showing Percentage of Net Assets
Common Stocks - 98.1% |
| Shares | | Value (Note 1) |
Argentina - 0.5% |
Banco Macro SA sponsored ADR | 146,900 | | $ 3,321,409 |
Inversiones y Representaciones SA sponsored GDR (a)(d) | 831,300 | | 11,945,781 |
TOTAL ARGENTINA | | 15,267,190 |
Austria - 0.7% |
C.A.T. oil AG Bearer | 146,840 | | 3,206,869 |
CA Immo International AG | 83,400 | | 1,500,970 |
Raiffeisen International Bank Holding AG (d) | 96,500 | | 11,042,424 |
voestalpine AG | 136,900 | | 6,456,612 |
TOTAL AUSTRIA | | 22,206,875 |
Bermuda - 1.5% |
Aquarius Platinum Ltd. (Australia) | 837,300 | | 15,556,699 |
Central European Media Enterprises Ltd. Class A (a) | 192,200 | | 14,188,204 |
Credicorp Ltd. (NY Shares) | 238,800 | | 10,077,360 |
Emperor International Holding Ltd. | 10,862,000 | | 2,541,897 |
Sinochem Hong Kong Holding Ltd. | 10,799,900 | | 3,763,273 |
TOTAL BERMUDA | | 46,127,433 |
Brazil - 11.3% |
Banco Bradesco SA (PN) | 921,600 | | 32,692,910 |
Banco Itau Holding Financeira SA (PN) (non-vtg.) | 166,600 | | 5,482,782 |
Banco Nossa Caixa SA | 460,800 | | 10,970,096 |
Brascan Residential Properties SA | 416,600 | | 3,346,810 |
Companhia de Saneamento de Minas Minas Gerais | 738,100 | | 6,891,461 |
Companhia Vale do Rio Doce (PN-A) sponsored ADR (non-vtg.) | 1,532,400 | | 33,283,728 |
CSU Cardsystem SA sponsored ADR (e) | 80,000 | | 1,390,004 |
Cyrela Brazil Realty SA | 780,100 | | 15,740,458 |
Guararapes Confeccoes SA | 34,700 | | 1,507,286 |
Klabin SA (PN) (non-vtg.) | 3,309,900 | | 7,142,334 |
Localiza Rent a Car SA | 446,500 | | 11,094,722 |
Lojas Americanas SA | 130,283,400 | | 6,024,314 |
Lojas Renner SA | 1,355,900 | | 16,909,169 |
Medial Saude SA | 240,000 | | 2,432,508 |
NET Servicos de Communicacao SA sponsored ADR (d) | 992,866 | | 9,978,303 |
Petroleo Brasileiro SA Petrobras: | | | |
(PN) (non-vtg.) | 1,668,000 | | 33,500,234 |
(PN) sponsored ADR (non-vtg.) | 520,500 | | 42,139,680 |
sponsored ADR | 243,000 | | 21,568,680 |
Submarino SA | 358,700 | | 7,323,109 |
TAM SA: | | | |
(PN) (ltd.-vtg.) | 430,300 | | 13,103,951 |
(PN) sponsored ADR (ltd. vtg.) | 108,500 | | 3,314,675 |
Uniao de Bancos Brasileiros SA (Unibanco): | | | |
unit | 1,034,200 | | 8,168,296 |
|
| Shares | | Value (Note 1) |
GDR | 235,400 | | $ 18,537,750 |
Usinas Siderurgicas de Minas Gerais SA (Usiminas) (PN-A) (non-vtg.) | 424,300 | | 14,405,589 |
Votorantim Celulose e Papel SA sponsored ADR (non-vtg.) | 651,800 | | 11,895,350 |
TOTAL BRAZIL | | 338,844,199 |
British Virgin Islands - 0.1% |
Equator Exploration Ltd. (a) | 1,069,500 | | 1,224,043 |
Titanium Resources Group Ltd. | 1,364,400 | | 1,613,608 |
TOTAL BRITISH VIRGIN ISLANDS | | 2,837,651 |
Canada - 0.8% |
Addax Petroleum Corp. | 161,300 | | 3,711,200 |
AUR Resources, Inc. | 259,400 | | 5,023,254 |
Falcon Oil & Gas Ltd. (a) | 1,282,800 | | 3,279,416 |
First Quantum Minerals Ltd. | 122,500 | | 6,999,844 |
SXR Uranium One, Inc. (a) | 564,460 | | 6,417,540 |
TOTAL CANADA | | 25,431,254 |
Cayman Islands - 1.6% |
Agile Property Holdings Ltd. | 12,450,000 | | 11,013,732 |
Foxconn International Holdings Ltd. (a) | 4,375,400 | | 14,543,035 |
Lee & Man Paper Manufacturing Ltd. | 5,130,000 | | 10,422,003 |
Primeline Energy Holdings, Inc. (a) | 767,500 | | 991,293 |
Primeline Energy Holdings, Inc. warrants 4/4/08 (a) | 383,750 | | 110,311 |
Shui On Land Ltd. | 4,312,500 | | 3,327,033 |
SinoCom Software Group Ltd. | 17,898,000 | | 3,521,054 |
Xinao Gas Holdings Ltd. | 4,598,500 | | 4,629,720 |
TOTAL CAYMAN ISLANDS | | 48,558,181 |
China - 2.7% |
Beijing Capital International Airport Co. Ltd. (H Shares) | 7,257,200 | | 4,656,358 |
China Gas Holdings Ltd. | 13,903,100 | | 2,449,114 |
China Petroleum & Chemical Corp.
(H Shares) | 38,586,900 | | 26,767,732 |
China Shenhua Energy Co. Ltd.
(H Shares) | 7,618,600 | | 13,401,025 |
First Tractor Co. Ltd. (H Shares) (a) | 8,104,800 | | 1,792,452 |
Guangzhou R&F Properties Co. Ltd.
(H Shares) | 3,488,000 | | 5,695,829 |
Home Inns & Hotels Management, Inc. sponsored ADR | 3,300 | | 80,982 |
Industrial & Commercial Bank of China | 3,824,000 | | 1,711,094 |
Li Ning Co. Ltd. | 2,502,000 | | 2,959,728 |
Mindray Medical International Ltd. sponsored ADR | 102,700 | | 1,858,870 |
Parkson Retail Group Ltd. | 1,124,000 | | 4,668,158 |
Ping An Insurance (Group) Co. of China, Ltd. (H Shares) | 2,229,500 | | 7,754,459 |
Common Stocks - continued |
| Shares | | Value (Note 1) |
China - continued |
Xiamen International Port Co. Ltd.
(H Shares) | 6,624,400 | | $ 1,541,707 |
Yantai Changyu Pioneer Wine Co.
(B Shares) | 1,408,650 | | 4,799,828 |
TOTAL CHINA | | 80,137,336 |
Colombia - 0.2% |
BanColombia SA sponsored ADR | 196,900 | | 6,019,233 |
Cyprus - 0.2% |
Urals Energy Public Co. Ltd. (a) | 408,130 | | 3,036,181 |
XXI Century Investments Public Ltd. | 250,400 | | 2,686,714 |
TOTAL CYPRUS | | 5,722,895 |
Czech Republic - 0.9% |
Ceske Energeticke Zavody AS | 666,400 | | 26,352,837 |
Egypt - 1.6% |
Commercial International Bank Ltd. sponsored GDR | 836,250 | | 7,501,163 |
Eastern Tobacco Co. | 38,245 | | 1,900,646 |
Orascom Construction Industries SAE: | | | |
GDR | 124,312 | | 10,852,438 |
GDR (e) | 16,120 | | 1,407,276 |
Orascom Hotels & Development (OHD) (a) | 1,089,657 | | 6,948,345 |
Orascom Telecom SAE GDR | 320,299 | | 18,032,834 |
TOTAL EGYPT | | 46,642,702 |
Finland - 0.1% |
YIT-Yhtyma OY | 119,050 | | 2,960,092 |
Hong Kong - 3.2% |
Chaoda Modern Agriculture (Holdings) Ltd. | 21,888,100 | | 13,255,793 |
China Mobile (Hong Kong) Ltd. | 6,289,700 | | 51,298,793 |
China Resources Power Holdings Co. Ltd. | 1,822,000 | | 2,272,463 |
CNOOC Ltd. | 24,521,600 | | 20,554,005 |
Hopson Development Holdings Ltd. | 1,462,000 | | 3,184,473 |
Kerry Properties Ltd. | 1,644,300 | | 6,067,918 |
TOTAL HONG KONG | | 96,633,445 |
Hungary - 1.3% |
MOL Hungarian Oil and Gas Series A (For. Reg.) | 244,072 | | 24,286,963 |
Richter Gedeon Ltd. | 70,800 | | 14,853,755 |
TOTAL HUNGARY | | 39,140,718 |
India - 5.1% |
Apollo Hospitals Enterprise Ltd. | 206,342 | | 2,036,318 |
Bank of India | 1,080,094 | | 4,174,183 |
Bharat Forge Ltd. | 841,802 | | 6,723,922 |
Bharti Airtel Ltd. (a) | 1,494,776 | | 19,201,483 |
Crompton Greaves Ltd. | 1,319,770 | | 7,018,991 |
Federal Bank Ltd. | 113,158 | | 549,290 |
|
| Shares | | Value (Note 1) |
Federal Bank Ltd.: | | | |
GDR | 249,942 | | $ 1,210,368 |
GDR (e) | 337,300 | | 1,633,408 |
Gujarat Ambuja Cement Ltd. | 2,585,865 | | 6,764,006 |
HCL Technologies Ltd. | 595,598 | | 8,251,790 |
Indian Overseas Bank | 2,102,400 | | 5,640,254 |
ITC Ltd. | 1,500 | | 6,345 |
Jaiprakash Associates Ltd. | 992,446 | | 12,867,332 |
Larsen & Toubro Ltd. | 292,798 | | 8,553,195 |
Nagarjuna Construction Co. Ltd. | 1,345,260 | | 5,347,199 |
Pantaloon Retail India Ltd. | 105,500 | | 5,107,497 |
Punj Lloyd Ltd. | 171,401 | | 2,876,271 |
Rolta India Ltd. | 506,544 | | 2,552,454 |
Rolta India Ltd. sponsored GDR (e) | 242,105 | | 1,157,262 |
Satyam Computer Services Ltd. | 1,302,100 | | 12,748,522 |
Sintex Industries Ltd. | 710,885 | | 3,063,832 |
State Bank of India | 453,592 | | 13,331,687 |
Suzlon Energy Ltd. | 159,626 | | 4,648,414 |
UTI Bank Ltd. | 591,700 | | 5,741,808 |
Wipro Ltd. | 875,034 | | 10,485,993 |
TOTAL INDIA | | 151,691,824 |
Indonesia - 2.2% |
PT Aneka Tambang Tbk | 19,795,400 | | 15,100,152 |
PT Bakrie & Brothers Tbk (a) | 348,233,500 | | 5,924,265 |
PT Bank Mandiri Persero Tbk | 20,295,500 | | 6,070,137 |
PT Bank Niaga Tbk | 44,907,500 | | 4,288,154 |
PT Bank Rakyat Indonesia Tbk | 16,661,000 | | 8,960,441 |
PT Medco Energi International Tbk | 19,903,500 | | 7,263,624 |
PT Perusahaan Gas Negara Tbk Series B | 13,681,800 | | 17,119,076 |
TOTAL INDONESIA | | 64,725,849 |
Ireland - 0.1% |
Dragon Oil plc (a) | 526,500 | | 1,576,749 |
Israel - 1.8% |
Bank Hapoalim BM (Reg.) | 3,380,245 | | 16,845,863 |
Israel Chemicals Ltd. | 2,781,900 | | 15,888,203 |
Ituran Location & Control Ltd. | 238,300 | | 4,113,058 |
Orckit Communications Ltd. (a) | 524,600 | | 4,522,052 |
Ormat Industries Ltd. | 367,200 | | 3,809,464 |
Orpak Systems Ltd. | 832,800 | | 2,438,449 |
RADWARE Ltd. (a) | 401,300 | | 5,858,980 |
Teva Pharmaceutical Industries Ltd. sponsored ADR | 45,000 | | 1,483,650 |
TOTAL ISRAEL | | 54,959,719 |
Kazakhstan - 0.1% |
Kazkommertsbank JSC sponsored GDR (a) | 192,000 | | 3,430,963 |
Korea (South) - 16.5% |
Celrun Co. Ltd. (a) | 455,590 | | 3,094,481 |
Daegu Bank Co. Ltd. | 887,510 | | 14,693,712 |
Common Stocks - continued |
| Shares | | Value (Note 1) |
Korea (South) - continued |
Daewoo Shipbuilding & Marine Engineering Co. Ltd. | 405,690 | | $ 13,045,796 |
Hanjin Heavy Industries & Construction Co. Ltd. | 419,810 | | 12,408,282 |
Hynix Semiconductor, Inc. (a) | 279,950 | | 10,161,089 |
Hyundai Department Store Co. Ltd. | 139,423 | | 11,674,683 |
Hyundai Engineering & Construction Co. Ltd. (a) | 220,120 | | 12,311,296 |
Hyundai Mipo Dockyard Co. Ltd. | 79,913 | | 10,601,348 |
Hyundai Mobis | 41,500 | | 4,052,001 |
Hyundai Motor Co. | 217,360 | | 17,670,224 |
Industrial Bank of Korea | 675,680 | | 11,832,014 |
Kookmin Bank | 310,570 | | 24,687,379 |
Korea Zinc Co. Ltd. | 109,750 | | 12,113,553 |
Korean Air Lines Co. Ltd. | 198,000 | | 7,039,530 |
Kyeryong Construction Industrial Co. Ltd. | 338,240 | | 13,856,257 |
LG Engineering & Construction Co. Ltd. | 217,290 | | 16,903,529 |
LG Household & Health Care Ltd. | 70,588 | | 6,517,541 |
Macquarie Korea Infrastructure Fund: | | | |
GDR (e) | 567,100 | | 3,799,570 |
GDR | 866,800 | | 5,807,560 |
MegaStudy Co. Ltd. | 101,769 | | 12,366,724 |
NHN Corp. | 177,311 | | 17,594,663 |
ON*Media Corp. | 207,200 | | 1,682,228 |
POSCO | 79,480 | | 22,057,852 |
Samsung Electronics Co. Ltd. | 197,875 | | 128,311,553 |
Samsung Heavy Industries Ltd. | 743,480 | | 19,923,440 |
Shinhan Financial Group Co. Ltd. | 604,710 | | 27,884,997 |
SK Corp. | 369,690 | | 27,111,242 |
Taewoong Co. Ltd. | 200,258 | | 5,536,449 |
Woong Jin.Com Co. Ltd. | 340,580 | | 6,795,332 |
Woori Finance Holdings Co. Ltd. | 616,760 | | 13,189,396 |
YBM Sisa.com, Inc. | 115,587 | | 2,496,359 |
TOTAL KOREA (SOUTH) | | 497,220,080 |
Lebanon - 0.2% |
Solidere GDR | 333,800 | | 6,151,934 |
Luxembourg - 1.5% |
Evraz Group SA: | | | |
GDR (e) | 66,100 | | 1,711,990 |
GDR | 497,300 | | 12,880,070 |
Orco Property Group (d) | 80,500 | | 9,833,194 |
Tenaris SA sponsored ADR | 537,100 | | 20,726,689 |
TOTAL LUXEMBOURG | | 45,151,943 |
Malaysia - 0.5% |
Genting BHD | 1,036,600 | | 7,591,800 |
Lion Diversified Holdings BHD | 3,169,000 | | 4,555,031 |
Steppe Cement Ltd. (a) | 983,900 | | 3,565,900 |
TOTAL MALAYSIA | | 15,712,731 |
|
| Shares | | Value (Note 1) |
Mexico - 6.8% |
America Movil SA de CV Series L sponsored ADR | 2,169,600 | | $ 93,010,752 |
Cemex SA de CV sponsored ADR | 834,118 | | 25,640,787 |
Fomento Economico Mexicano SA de CV sponsored ADR | 186,300 | | 18,013,347 |
Grupo Famsa SA de CV Series A | 1,122,800 | | 3,601,897 |
Grupo Mexico SA de CV Series B | 6,149,025 | | 21,498,288 |
Urbi, Desarrollos Urbanos, SA de CV (a) | 5,562,100 | | 17,046,522 |
Wal-Mart de Mexico SA de CV Series V | 7,592,274 | | 26,452,416 |
TOTAL MEXICO | | 205,264,009 |
Netherlands - 0.1% |
Plaza Centers NV | 775,400 | | 2,706,708 |
Oman - 0.1% |
BankMuscat SAOG sponsored GDR (e) | 369,325 | | 4,228,771 |
Pakistan - 0.2% |
MCB Bank Ltd. | 330,600 | | 1,496,532 |
MCB Bank Ltd. unit (a)(e) | 167,300 | | 3,110,107 |
TOTAL PAKISTAN | | 4,606,639 |
Panama - 0.2% |
Copa Holdings SA Class A | 165,300 | | 6,264,870 |
Philippines - 0.8% |
Ayala Corp. | 459,000 | | 4,512,640 |
Jollibee Food Corp. | 658,900 | | 522,202 |
Philippine Long Distance Telephone Co. | 335,390 | | 15,881,228 |
Robinsons Land Corp. | 12,015,000 | | 3,495,536 |
TOTAL PHILIPPINES | | 24,411,606 |
Poland - 0.2% |
Globe Trade Centre SA (a) | 615,500 | | 6,784,943 |
Romania - 0.1% |
Banca Transilvania SA | 8,506,974 | | 3,456,990 |
Russia - 11.8% |
AO Tatneft sponsored ADR | 119,800 | | 11,021,600 |
Cherkizovo Group OJSC: | | | |
GDR (a) | 62,000 | | 961,000 |
GDR (a)(e) | 256,400 | | 3,974,200 |
Gazprom Neft sponsored ADR | 140,700 | | 2,905,455 |
JSC MMC 'Norilsk Nickel' sponsored ADR | 231,100 | | 34,433,900 |
Lukoil Oil Co. sponsored ADR | 818,640 | | 66,882,888 |
Magnit OAO | 45,300 | | 1,494,900 |
Novatek JSC: | | | |
GDR | 48,400 | | 2,816,880 |
GDR (e) | 268,500 | | 15,626,700 |
Novolipetsk Iron & Steel Corp. sponsored GDR (e) | 285,000 | | 5,985,000 |
OAO Gazprom sponsored ADR | 2,740,406 | | 116,741,296 |
OAO TMK (a) | 1,345,400 | | 8,492,838 |
OAO TMK unit | 59,000 | | 1,489,750 |
RBC Information Systems Jsc (a) | 570,500 | | 6,104,350 |
Common Stocks - continued |
| Shares | | Value (Note 1) |
Russia - continued |
Sberbank (Savings Bank of the Russian Federation) | 1,400 | | $ 3,150,000 |
Sberbank (Savings Bank of the Russian Federation) GDR | 114,400 | | 28,473,931 |
Sistema JSFC sponsored: | | | |
GDR (e) | 561,500 | | 14,879,750 |
GDR | 54,300 | | 1,438,950 |
Vimpel Communications sponsored ADR (a)(d) | 346,600 | | 22,872,134 |
VSMPO-Avisma Corp. | 17,100 | | 3,898,800 |
TOTAL RUSSIA | | 353,644,322 |
Singapore - 0.3% |
Keppel Corp. Ltd. | 464,600 | | 4,713,420 |
Olam International Ltd. | 2,164,000 | | 2,653,936 |
Raffles Education Corp. Ltd. | 301,400 | | 514,784 |
TOTAL SINGAPORE | | 7,882,140 |
South Africa - 8.4% |
African Bank Investments Ltd. | 2,593,026 | | 9,676,810 |
Aspen Pharmacare Holdings Ltd. | 2,054,900 | | 9,347,936 |
Aveng Ltd. | 2,866,029 | | 12,139,080 |
Bidvest Group Ltd. | 845,800 | | 14,008,064 |
Ellerine Holdings Ltd. | 801,391 | | 7,702,440 |
FirstRand Ltd. | 7,880,856 | | 20,616,062 |
Gold Fields Ltd. | 989,300 | | 16,580,668 |
Impala Platinum Holdings Ltd. | 167,866 | | 29,510,944 |
Lewis Group Ltd. | 1,252,973 | | 9,561,057 |
MTN Group Ltd. | 3,854,500 | | 35,058,510 |
Naspers Ltd. Class N sponsored ADR | 812,618 | | 14,789,648 |
Nedbank Group Ltd. | 384,900 | | 6,369,454 |
Network Healthcare Holdings Ltd. | 5,199,600 | | 8,823,290 |
Sasol Ltd. | 1,190,775 | | 40,865,553 |
Steinhoff International Holdings Ltd. | 3,289,600 | | 10,717,782 |
Truworths International Ltd. | 2,290,573 | | 8,022,587 |
TOTAL SOUTH AFRICA | | 253,789,885 |
Taiwan - 8.0% |
Acer, Inc. | 5,944,000 | | 10,804,015 |
Advanced Semiconductor Engineering, Inc. | 18,785,000 | | 17,411,869 |
Chipbond Technology Corp. | 6,936,290 | | 6,345,634 |
Delta Electronics, Inc. | 5,597,550 | | 15,860,428 |
Foxconn Technology Co. Ltd. | 1,563,500 | | 15,293,316 |
High Tech Computer Corp. | 771,200 | | 19,178,297 |
Hon Hai Precision Industry Co. Ltd. (Foxconn) | 8,135,024 | | 52,843,939 |
Macronix International Co. Ltd. (a) | 8,767,000 | | 2,959,771 |
MediaTek, Inc. | 567,000 | | 5,546,089 |
Motech Industries, Inc. | 406,082 | | 5,483,790 |
Phoenix Precision Technology Corp. | 7,272,752 | | 7,749,564 |
Powertech Technology, Inc. | 2,509,400 | | 7,238,872 |
|
| Shares | | Value (Note 1) |
Shin Kong Financial Holding Co. Ltd. | 16,565,000 | | $ 14,680,060 |
Siliconware Precision Industries Co. Ltd. | 13,621,045 | | 17,326,544 |
Taiwan Semiconductor Manufacturing Co. Ltd. | 23,098,705 | | 42,472,374 |
TOTAL TAIWAN | | 241,194,562 |
Thailand - 1.6% |
Bumrungrad Hospital PCL (For. Reg.) | 2,946,000 | | 2,951,019 |
Charoen Pokphand Foods PCL (For. Reg.) | 36,616,200 | | 4,950,361 |
Minor International PCL (For. Reg.) | 31,569,794 | | 9,293,459 |
PTT PCL (For. Reg.) | 2,123,600 | | 12,850,131 |
Robinson Department Store PCL (For. Reg.) (a) | 11,590,900 | | 3,570,076 |
Siam Commercial Bank PCL (For. Reg.) | 4,591,600 | | 8,197,609 |
Thai Oil PCL (For. Reg.) | 3,714,600 | | 6,176,234 |
TOTAL THAILAND | | 47,988,889 |
Turkey - 2.7% |
Acibadem Saglik Hizmetleri AS | 753,800 | | 8,276,411 |
Akbank T. A. S. | 270,237 | | 1,539,178 |
Anadolu Efes Biracilk Ve Malt Sanyii AS | 258,000 | | 7,081,832 |
Asya Katilim Bankasi AS | 1,864,000 | | 5,960,707 |
Dogan Yayin Holding AS (a) | 2,127,739 | | 8,176,592 |
Dogus Otomotiv Servis ve Ticaret AS | 861,700 | | 4,227,933 |
Enka Insaat ve Sanayi AS | 1,794,313 | | 15,144,999 |
Petrol Ofisi AS | 788,900 | | 2,842,151 |
Tupras-Turkiye Petrol Rafinerileri AS | 613,400 | | 10,186,502 |
Turkiye Garanti Bankasi AS | 4,666,500 | | 17,132,115 |
TOTAL TURKEY | | 80,568,420 |
Ukraine - 0.2% |
Stirol sponsored ADR (a) | 191,500 | | 2,762,066 |
Ukrnafta Open JSC sponsored ADR | 10,000 | | 3,618,594 |
TOTAL UKRAINE | | 6,380,660 |
United Kingdom - 0.8% |
Aricom PLC (a) | 2,043,200 | | 1,597,936 |
Imperial Energy PLC (a) | 284,700 | | 3,676,552 |
Kazakhmys PLC | 70,700 | | 1,619,672 |
Sibir Energy PLC (a) | 1,023,491 | | 7,906,852 |
Vedanta Resources PLC | 248,300 | | 6,924,503 |
Victoria Oil & Gas PLC (a) | 887,800 | | 1,253,174 |
TOTAL UNITED KINGDOM | | 22,978,689 |
United States of America - 1.1% |
CTC Media, Inc. (f) | 372,960 | | 8,146,565 |
CTC Media, Inc. | 514,100 | | 12,477,207 |
NII Holdings, Inc. (a) | 190,000 | | 12,355,700 |
TOTAL UNITED STATES OF AMERICA | | 32,979,472 |
TOTAL COMMON STOCKS (Cost $2,371,042,763) | 2,948,635,408 |
Nonconvertible Preferred Stocks - 0.2% |
| Shares | | Value (Note 1) |
Korea (South) - 0.2% |
Samsung Electronics Co. Ltd.
(Cost $5,020,749) | 14,270 | | $ 6,921,079 |
Money Market Funds - 2.2% |
| | | |
Fidelity Cash Central Fund, 5.34% (b) | 45,237,844 | | 45,237,844 |
Fidelity Securities Lending Cash Central Fund, 5.35% (b)(c) | 20,041,143 | | 20,041,143 |
TOTAL MONEY MARKET FUNDS (Cost $65,278,987) | 65,278,987 |
TOTAL INVESTMENT PORTFOLIO - 100.5% (Cost $2,441,342,499) | | 3,020,835,474 |
NET OTHER ASSETS - (0.5)% | | (15,690,209) |
NET ASSETS - 100% | $ 3,005,145,265 |
Legend |
(a) Non-income producing |
(b) Affiliated fund that is available only to investment companies and other accounts managed by Fidelity Investments. The rate quoted is the annualized seven-day yield of the fund at period end. A complete unaudited listing of the fund's holdings as of its most recent quarter end is available upon request. |
(c) Investment made with cash collateral received from securities on loan. |
(d) Security or a portion of the security is on loan at period end. |
(e) Security exempt from registration under Rule 144A of the Securities Act of 1933. These securities may be resold in transactions exempt from registration, normally to qualified institutional buyers. At the end of the period, the value of these securities amounted to $58,904,038 or 2.0% of net assets. |
(f) Restricted securities - Investment in securities not registered under the Securities Act of 1933 (excluding 144A issues). At the end of the period, the value of restricted securities (excluding 144A issues) amounted to $8,146,565 or 0.3% of net assets. |
Additional information on each holding is as follows: |
Security | Acquisition Date | Acquisition Cost |
CTC Media, Inc. | 1/26/05 | $ 1,400,073 |
Affiliated Central Funds |
Information regarding fiscal year to date income earned by the Fund from investments in Fidelity Central Funds is as follows: |
Fund | Income earned |
Fidelity Cash Central Fund | $ 2,671,805 |
Fidelity Securities Lending Cash Central Fund | 512,378 |
Total | $ 3,184,183 |
Income Tax Information |
At September 30, 2006, the fund had a capital loss carryforward of approximately $68,894,724 of which $16,350,833, $40,040,568 and $12,503,323 will expire on September 30, 2008, 2010 and 2011, respectively. |
Annual Report
See accompanying notes which are an integral part of the financial statements.
Emerging Markets
Financial Statements
Statement of Assets and Liabilities
October 31, 2006 |
| | |
Assets | | |
Investment in securities, at value (including securities loaned of $19,402,476) - See accompanying schedule: Unaffiliated issuers (cost $2,376,063,512) | $ 2,955,556,487 | |
Fidelity Central Funds (cost $65,278,987) | 65,278,987 | |
Total Investments (cost $2,441,342,499) | | $ 3,020,835,474 |
Cash | | 481,585 |
Foreign currency held at value (cost $8,086) | | 2,675 |
Receivable for investments sold | | 30,523,568 |
Receivable for fund shares sold | | 4,926,511 |
Dividends receivable | | 3,165,540 |
Interest receivable | | 167,069 |
Other receivables | | 411,431 |
Total assets | | 3,060,513,853 |
| | |
Liabilities | | |
Payable for investments purchased | $ 25,437,614 | |
Payable for fund shares redeemed | 4,569,322 | |
Accrued management fee | 1,738,424 | |
Other affiliated payables | 635,207 | |
Other payables and accrued expenses | 2,946,878 | |
Collateral on securities loaned, at value | 20,041,143 | |
Total liabilities | | 55,368,588 |
| | |
Net Assets | | $ 3,005,145,265 |
Net Assets consist of: | | |
Paid in capital | | $ 2,514,709,441 |
Undistributed net investment income | | 34,483,401 |
Accumulated undistributed net realized gain (loss) on investments and foreign currency transactions | | (121,021,934) |
Net unrealized appreciation (depreciation) on investments and assets and liabilities in foreign currencies | | 576,974,357 |
Net Assets, for 136,348,427 shares outstanding | | $ 3,005,145,265 |
Net Asset Value, offering price and redemption price per share ($3,005,145,265 ÷ 136,348,427 shares) | | $ 22.04 |
Statement of Operations
Year ended October 31, 2006 |
| | |
Investment Income | | |
Dividends | | $ 57,433,889 |
Interest | | 58,625 |
Income from Fidelity Central Funds (including $512,378 from security lending) | | 3,184,183 |
| | 60,676,697 |
Less foreign taxes withheld | | (5,392,443) |
Total income | | 55,284,254 |
| | |
Expenses | | |
Management fee | $ 19,250,227 | |
Transfer agent fees | 5,872,829 | |
Accounting and security lending fees | 1,130,438 | |
Custodian fees and expenses | 2,789,502 | |
Independent trustees' compensation | 10,118 | |
Registration fees | 309,808 | |
Audit | 151,219 | |
Legal | 40,603 | |
Interest | 182,763 | |
Miscellaneous | 36,365 | |
Total expenses before reductions | 29,773,872 | |
Expense reductions | (2,555,622) | 27,218,250 |
Net investment income (loss) | | 28,066,004 |
Realized and Unrealized Gain (Loss) Net realized gain (loss) on: | | |
Investment securities: | | |
Unaffiliated issuers (net of foreign taxes of $794,867) | 318,878,893 | |
Foreign currency transactions | (2,079,598) | |
Total net realized gain (loss) | | 316,799,295 |
Change in net unrealized appreciation (depreciation) on: Investment securities (net of increase in deferred foreign taxes of $1,859,293) | 306,275,400 | |
Assets and liabilities in foreign currencies | 60,897 | |
Total change in net unrealized appreciation (depreciation) | | 306,336,297 |
Net gain (loss) | | 623,135,592 |
Net increase (decrease) in net assets resulting from operations | | $ 651,201,596 |
Annual Report
See accompanying notes which are an integral part of the financial statements.
Emerging Markets
Financial Statements - continued
Statement of Changes in Net Assets
| Year ended
October 31,
2006 | Year ended
October 31,
2005 |
Increase (Decrease) in Net Assets | | |
Operations | | |
Net investment income (loss) | $ 28,066,004 | $ 15,119,763 |
Net realized gain (loss) | 316,799,295 | 68,322,535 |
Change in net unrealized appreciation (depreciation) | 306,336,297 | 203,724,089 |
Net increase (decrease) in net assets resulting from operations | 651,201,596 | 287,166,387 |
Distributions to shareholders from net investment income | (21,238,863) | (5,999,282) |
Share transactions
Proceeds from sales of shares | 2,470,015,019 | 816,361,551 |
Reinvestment of distributions | 20,504,249 | 5,785,646 |
Cost of shares redeemed | (1,510,859,402) | (316,571,716) |
Net increase (decrease) in net assets resulting from share transactions | 979,659,866 | 505,575,481 |
Redemption fees | 3,299,389 | 930,289 |
Total increase (decrease) in net assets | 1,612,921,988 | 787,672,875 |
| | |
Net Assets | | |
Beginning of period | 1,392,223,277 | 604,550,402 |
End of period (including undistributed net investment income of $34,483,401 and undistributed net investment income of $11,812,415, respectively) | $ 3,005,145,265 | $ 1,392,223,277 |
Other Information Shares | | |
Sold | 121,916,389 | 57,501,628 |
Issued in reinvestment of distributions | 1,159,761 | 485,074 |
Redeemed | (75,344,302) | (22,850,332) |
Net increase (decrease) | 47,731,848 | 35,136,370 |
Financial Highlights
Years ended October 31, | 2006 | 2005 | 2004 | 2003 | 2002 |
Selected Per-Share Data | | | | | |
Net asset value, beginning of period | $ 15.71 | $ 11.30 | $ 9.81 | $ 7.03 | $ 6.52 |
Income from Investment Operations | | | | | |
Net investment income (loss) C | .21 | .21 | .14 | .10 | .06 F |
Net realized and unrealized gain (loss) | 6.31 | 4.30 | 1.46 | 2.73 | .47 |
Total from investment operations | 6.52 | 4.51 | 1.60 | 2.83 | .53 |
Distributions from net investment income | (.21) | (.11) | (.12) | (.05) | (.03) |
Redemption fees added to paid in capital C | .02 | .01 | .01 | - H | .01 |
Net asset value, end of period | $ 22.04 | $ 15.71 | $ 11.30 | $ 9.81 | $ 7.03 |
Total Return A, B | 41.96% | 40.25% | 16.48% | 40.50% | 8.25% |
Ratios to Average Net Assets D, G | | | | | |
Expenses before reductions | 1.11% | 1.16% | 1.23% | 1.36% | 1.44% |
Expenses net of fee waivers, if any | 1.11% | 1.16% | 1.23% | 1.36% | 1.44% |
Expenses net of all reductions | 1.01% | 1.07% | 1.18% | 1.36% | 1.39% |
Net investment income (loss) | 1.04% | 1.53% | 1.27% | 1.31% | .73% |
Supplemental Data | | | | | |
Net assets, end of period (000 omitted) | $ 3,005,145 | $ 1,392,223 | $ 604,550 | $ 430,928 | $ 263,729 |
Portfolio turnover rate E | 66% | 68% | 112% | 105% | 120% |
A Total returns would have been lower had certain expenses not been reduced during the periods shown. B Total returns do not include the effect of the former sales charges. C Calculated based on average shares outstanding during the period. D Fees and expenses of the underlying Fidelity Central Funds are not included in the Fund's expense ratio. The Fund indirectly bears its proportionate share of the expense of any underlying Fidelity Central Funds. E Amount does not include the portfolio activity of any underlying Fidelity Central Funds. F Investment income per share reflects a special dividend which amounted to $.01 per share. G Expense ratios reflect operating expenses of the Fund. Expenses before reductions do not reflect amounts reimbursed by the investment adviser or reductions from brokerage service arrangements or other expense offset arrangements and do not represent the amount paid by the Fund during periods when reimbursements or reductions occur. Expenses net of fee waivers reflect expenses after reimbursement by the investment adviser but prior to reductions from brokerage service arrangements or other expense offset arrangements. Expenses net of all reductions represent the net expenses paid by the Fund. H Amount represents less than $.01 per share. |
Annual Report
See accompanying notes which are an integral part of the financial statements.
Europe
Performance: The Bottom Line
Average annual total return reflects the change in the value of an investment, assuming reinvestment of the fund's dividend income and capital gains (the profits earned upon the sale of securities that have grown in value) and assuming a constant rate of performance each year. The $10,000 table and the fund's returns do not reflect the deduction of taxes that a shareholder would pay on fund distributions or the redemption of fund shares. During periods of reimbursement by Fidelity, a fund's total returns will be greater than it would be had the reimbursement not occurred. How a fund did yesterday is no guarantee of how it will do tomorrow.
Average Annual Total Returns
Periods ended
October 31, 2006 | Past 1
year | Past 5
years | Past 10
years |
Fidelity Europe Fund | 27.40% | 16.69% | 10.80% |
$10,000 Over 10 Years
Let's say hypothetically that $10,000 was invested in Fidelity Europe Fund on October 31, 1996. The chart shows how the value of your investment would have changed, and also shows how the MSCI Europe Index performed over the same period.
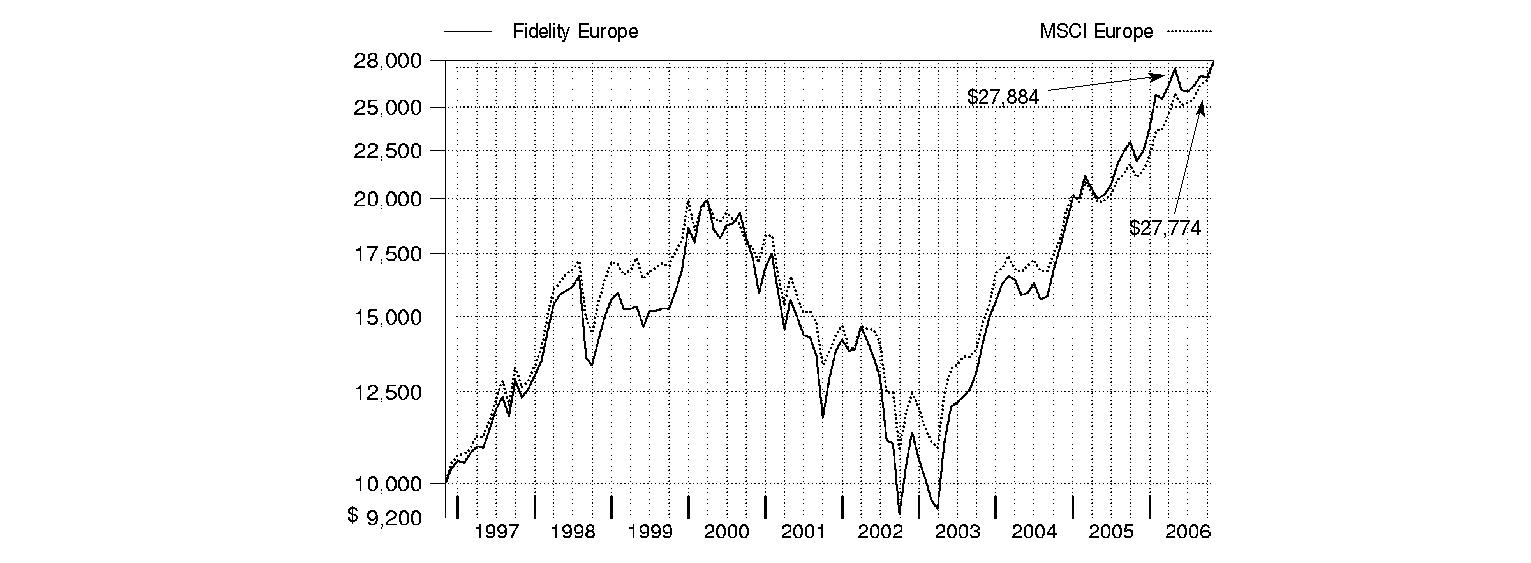
Annual Report
Europe
Management's Discussion of Fund Performance
Comments from Trygve Toraasen, Portfolio Manager of Fidelity® Europe Fund
International equity markets as a whole outpaced their U.S. counterparts for the 12 months ending October 31, 2006 - partly as a result of favorable currency exchanges that boosted returns for U.S. investors. The Morgan Stanley Capital InternationalSM Europe, Australasia, Far East (MSCI® EAFE®) Index - a gauge of developed stock markets outside the United States and Canada - gained 27.72% during that time. European markets benefited from solid corporate profit growth and attractive dividends, which helped the MSCI Europe index advance 31.95%. Strong performing Latin American and Asian emerging markets drove the MSCI Emerging Markets index to a lofty 35.42% return. Japan was somewhat of an exception to the generally stellar foreign market performance after struggling in the middle part of the period. Still, its earlier gains helped the Tokyo Stock Exchange Stock Price Index (TOPIX) - - a benchmark of the largest and better-established stocks traded on the Tokyo Stock Exchange - rise 12.47% overall. Natural-resources-rich Canada also struggled over the final six months as energy prices fell, but the S&P/TSX Composite Index managed a 12-month return of 28.21%.
The fund returned 27.40%, trailing the MSCI Europe index during a 12-month period in which solid profit gains and increased merger-and-acquisition activity provided firm support for European equities. The lagging performance relative to the MSCI index was largely a result of the fund's positions in higher-risk investments during a late-spring market slump. Health care was a particular source of weakness, held back by inopportune stock selection and an overweighting in the pharmaceuticals, biotechnology and life science group. Disappointing results in materials and industrials also detracted. Conversely, stock selection in energy and an overweighting of financials helped. On a country basis, the fund underperformed in France and the United Kingdom, but did well in Spain and the Netherlands. During a strong 12 months for European equities, a sizable portion of the fund's return came from currency fluctuations. The single biggest detractor was U.K. cruise company Carnival, which was forced to lower prices at the same time that its fuel costs rose. Several selections in health care hurt, including Teva Pharmaceutical, a generic drug company based in Israel that I sold; AstraZeneca, the U.K.-based pharmaceutical firm; and Synthes, a Swiss orthopedic products company that I sold. Two stock and futures exchanges - Euronext of the Netherlands and Deutsche Boerse of Germany - were positive contributors, and I took profits by selling the positions. I also liquidated investments in two Russian energy-related energy investments that I viewed as too risky, despite their good performance. One was a security listed under the name of the London branch of the investment bank UBS, the other was stock in the natural gas company Surgutneftegaz.
Note to shareholders: On December 14, 2006, the Board of Trustees agreed to present a proposal to shareholders to merge Fidelity Nordic Fund into Fidelity Europe Fund. Shareholders of Nordic Fund are expected to meet on May 16, 2007, to vote on the approval of the proposal. If approved, the merger is expected to be completed by the end of June 2007.
The foregoing is not a solicitation of any proxy. For a free copy of the Proxy Statement describing the Reorganization (and containing important information about fees, expenses and risk considerations) and a Prospectus for Fidelity Europe Fund, please call 1-800-544-3198 after March 19, 2007. The Prospectus/Proxy Statement also will be available for free on the Securities and Exchange Commission's Web site (www.sec.gov).
The views expressed above reflect those of the portfolio manager(s) only through the end of the period as stated on the cover of this report and do not necessarily represent the views of Fidelity or any other person in the Fidelity organization. Any such views are subject to change at any time based upon market or other conditions and Fidelity disclaims any responsibility to update such views. These views may not be relied on as investment advice and, because investment decisions for a Fidelity fund are based on numerous factors, may not be relied on as an indication of trading intent on behalf of any Fidelity fund.
Annual Report
Europe
Investment Changes

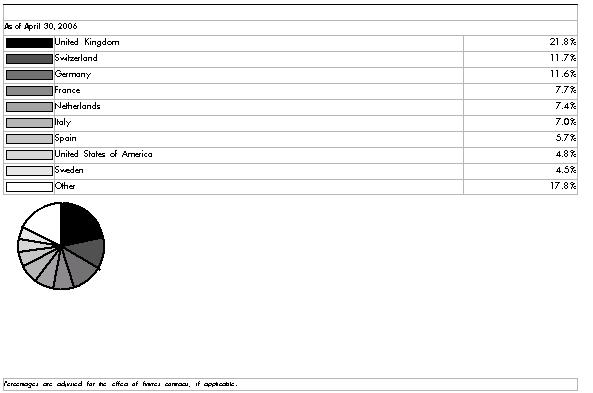
Asset Allocation |
| % of fund's
net assets | % of fund's net assets
6 months ago |
Stocks | 98.3 | 96.2 |
Short-Term Investments and
Net Other Assets | 1.7 | 3.8 |
Top Ten Stocks as of October 31, 2006 |
| % of fund's
net assets | % of fund's net assets
6 months ago |
Banco Bilbao Vizcaya Argentaria SA (Spain, Commercial Banks) | 4.8 | 3.6 |
Tesco PLC (United Kingdom, Food & Staples Retailing) | 3.4 | 1.5 |
Banco Santander Central Hispano SA (Spain, Commercial Banks) | 3.3 | 1.3 |
HSBC Holdings PLC (United Kingdom) (Reg.) (United Kingdom, Commercial Banks) | 3.2 | 2.5 |
Roche Holding AG (participation certificate) (Switzerland, Pharmaceuticals) | 2.9 | 3.2 |
BP PLC (United Kingdom, Oil, Gas & Consumable Fuels) | 2.5 | 3.0 |
ING Groep NV (Certificaten Van Aandelen) (Netherlands, Diversified Financial Services) | 2.3 | 1.0 |
Novartis AG (Reg.) (Switzerland, Pharmaceuticals) | 2.1 | 2.3 |
AstraZeneca PLC (United Kingdom) (United Kingdom, Pharmaceuticals) | 1.9 | 0.0 |
Telefonaktiebolaget LM Ericsson
(B Shares) (Sweden, Communications Equipment) | 1.8 | 1.5 |
| 28.2 | |
Market Sectors as of October 31, 2006 |
| % of fund's
net assets | % of fund's net assets
6 months ago |
Financials | 34.5 | 34.5 |
Consumer Staples | 12.6 | 4.1 |
Consumer Discretionary | 12.7 | 9.9 |
Health Care | 9.6 | 11.9 |
Industrials | 7.3 | 10.5 |
Energy | 7.2 | 10.4 |
Information Technology | 4.8 | 5.7 |
Utilities | 3.8 | 1.8 |
Materials | 3.5 | 6.0 |
Telecommunication Services | 2.3 | 1.4 |
Annual Report
Europe
Investments October 31, 2006
Showing Percentage of Net Assets
Common Stocks - 95.6% |
| Shares | | Value (Note 1) |
Austria - 1.0% |
Erste Bank AG | 624,600 | | $ 42,532,724 |
Belgium - 0.5% |
InBev SA | 388,100 | | 21,865,669 |
Finland - 1.6% |
Metso Corp. | 538,400 | | 23,399,629 |
Nokia Corp. | 1,992,350 | | 39,607,918 |
TOTAL FINLAND | | 63,007,547 |
France - 9.9% |
AXA SA | 1,624,200 | | 61,914,504 |
BNP Paribas SA | 339,100 | | 37,288,067 |
Carrefour SA | 567,200 | | 34,562,523 |
Essilor International SA | 234,800 | | 24,635,235 |
Groupe Danone | 363,900 | | 53,322,529 |
L'Oreal SA | 419,800 | | 40,830,453 |
Louis Vuitton Moet Hennessy (LVMH) | 287,800 | | 29,993,958 |
Societe Generale Series A | 399,035 | | 66,314,542 |
Total SA Series B | 759,000 | | 51,718,260 |
TOTAL FRANCE | | 400,580,071 |
Germany - 10.8% |
Allianz AG (Reg.) | 284,300 | | 52,851,370 |
Bayer AG | 940,900 | | 47,223,771 |
Bayerische Motoren Werke AG (BMW) | 1,172,900 | | 67,369,030 |
E.ON AG | 507,900 | | 61,146,081 |
Hochtief AG | 157,200 | | 10,273,284 |
Linde AG | 228,800 | | 22,679,851 |
Muenchener Rueckversicherungs-Gesellschaft AG (Reg.) | 264,200 | | 42,888,260 |
RWE AG | 262,200 | | 25,913,659 |
SAP AG | 130,400 | | 25,892,224 |
Siemens AG (Reg.) | 264,200 | | 23,727,802 |
Wincor Nixdorf AG | 412,900 | | 57,419,435 |
TOTAL GERMANY | | 437,384,767 |
Greece - 0.4% |
Alpha Bank AE | 557,700 | | 16,230,141 |
Ireland - 0.8% |
Allied Irish Banks PLC | 1,138,200 | | 31,095,624 |
Italy - 4.0% |
Banca Popolare di Milano | 1,696,780 | | 25,103,440 |
ENI Spa (d) | 1,345,100 | | 40,830,511 |
Fiat Spa (a) | 1,347,700 | | 23,804,187 |
Tod's Spa | 371,500 | | 32,215,966 |
Unicredito Italiano Spa | 4,724,500 | | 39,173,165 |
TOTAL ITALY | | 161,127,269 |
Netherlands - 6.3% |
ING Groep NV (Certificaten Van Aandelen) | 2,045,700 | | 90,685,881 |
Koninklijke Numico NV | 463,100 | | 20,706,262 |
Koninklijke Philips Electronics NV | 1,846,100 | | 64,299,663 |
|
| Shares | | Value (Note 1) |
Randstad Holdings NV | 658,100 | | $ 41,453,943 |
Rodamco Europe NV | 310,352 | | 35,909,483 |
TOTAL NETHERLANDS | | 253,055,232 |
Norway - 2.8% |
Aker Kvaerner ASA | 500,970 | | 52,115,718 |
DnB Nor ASA | 3,785,800 | | 49,576,918 |
Statoil ASA | 437,500 | | 11,060,318 |
TOTAL NORWAY | | 112,752,954 |
Spain - 10.5% |
Banco Bilbao Vizcaya Argentaria SA | 8,049,400 | | 194,795,481 |
Banco Santander Central Hispano SA | 7,709,200 | | 133,430,711 |
Inditex SA | 1,138,200 | | 54,421,831 |
Telefonica SA | 2,128,200 | | 40,932,380 |
TOTAL SPAIN | | 423,580,403 |
Sweden - 5.6% |
Elekta AB (B Shares) | 1,255,600 | | 26,077,204 |
Hennes & Mauritz AB (H&M) (B Shares) | 1,533,100 | | 66,122,155 |
Hexagon AB (B Shares) (d) | 1,057,325 | | 39,380,320 |
SKF AB (B Shares) | 1,311,100 | | 21,103,148 |
Telefonaktiebolaget LM Ericsson
(B Shares) | 18,941,000 | | 71,634,862 |
TOTAL SWEDEN | | 224,317,689 |
Switzerland - 15.4% |
ABB Ltd. (Reg.) | 4,491,009 | | 66,779,461 |
Baloise Holdings AG (Reg.) | 236,176 | | 22,589,675 |
Compagnie Financiere Richemont unit | 490,385 | | 24,260,095 |
Credit Suisse Group (Reg.) | 853,896 | | 51,643,630 |
Nestle SA (Reg.) | 177,018 | | 60,469,115 |
Novartis AG (Reg.) | 1,418,243 | | 86,129,897 |
Roche Holding AG (participation certificate) | 676,581 | | 118,387,400 |
Schindler Holding AG (participation certificate) | 518,334 | | 29,767,282 |
Societe Generale de Surveillance Holding SA (SGS) (Reg.) | 23,841 | | 25,313,637 |
Syngenta AG (Switzerland) | 419,377 | | 67,582,604 |
UBS AG (Reg.) | 1,119,365 | | 66,982,802 |
TOTAL SWITZERLAND | | 619,905,598 |
United Kingdom - 26.0% |
AstraZeneca PLC (United Kingdom) | 1,328,800 | | 78,000,560 |
BG Group PLC | 2,398,074 | | 31,814,438 |
Biffa PLC (a) | 957,500 | | 4,867,439 |
BP PLC | 9,073,700 | | 101,474,211 |
British American Tobacco PLC | 1,430,000 | | 39,325,000 |
Carnival PLC | 974,600 | | 47,307,084 |
Diageo PLC | 3,147,600 | | 58,600,443 |
Gallaher Group PLC | 657,100 | | 11,188,770 |
GlaxoSmithKline PLC | 2,205,800 | | 58,729,425 |
HBOS PLC | 3,096,200 | | 64,198,236 |
Common Stocks - continued |
| Shares | | Value (Note 1) |
United Kingdom - continued |
HSBC Holdings PLC (United Kingdom) (Reg.) | 6,799,800 | | $ 129,835,382 |
Imperial Tobacco Group PLC | 346,100 | | 12,259,649 |
Man Group PLC | 3,784,000 | | 35,223,742 |
National Grid PLC | 2,508,900 | | 32,064,369 |
Pearson PLC | 718,100 | | 10,595,215 |
Rolls-Royce Group PLC | 1,313,100 | | 11,766,008 |
Royal Bank of Scotland Group PLC | 1,469,800 | | 52,372,060 |
SABMiller PLC | 625,300 | | 12,094,584 |
Scottish & Southern Energy PLC | 860,000 | | 21,555,513 |
Severn Trent PLC | 638,266 | | 16,996,194 |
Tesco PLC | 18,091,873 | | 135,797,824 |
Vodafone Group PLC | 20,000,000 | | 51,699,998 |
Yell Group PLC | 2,679,100 | | 31,837,687 |
TOTAL UNITED KINGDOM | | 1,049,603,831 |
TOTAL COMMON STOCKS (Cost $3,400,734,654) | 3,857,039,519 |
Nonconvertible Preferred Stocks - 2.7% |
| | | |
Germany - 1.6% |
Henkel KGaA | 77,500 | | 10,381,759 |
Porsche AG (non-vtg.) | 48,243 | | 56,250,923 |
TOTAL GERMANY | | 66,632,682 |
Italy - 1.1% |
Banca Intesa Spa (Risp) | 6,417,097 | | 42,542,925 |
United Kingdom - 0.0% |
Rolls-Royce Group PLC Series B | 46,150,250 | | 90,232 |
TOTAL NONCONVERTIBLE PREFERRED STOCKS (Cost $67,778,738) | 109,265,839 |
Money Market Funds - 2.2% |
| Shares | | Value (Note 1) |
Fidelity Cash Central Fund, 5.34% (b) | 53,262,984 | | $ 53,262,984 |
Fidelity Securities Lending Cash Central Fund, 5.35% (b)(c) | 33,808,334 | | 33,808,334 |
TOTAL MONEY MARKET FUNDS (Cost $87,071,318) | 87,071,318 |
TOTAL INVESTMENT PORTFOLIO - 100.5% (Cost $3,555,584,710) | | 4,053,376,676 |
NET OTHER ASSETS - (0.5)% | | (20,113,632) |
NET ASSETS - 100% | $ 4,033,263,044 |
Legend |
(a) Non-income producing |
(b) Affiliated fund that is available only to investment companies and other accounts managed by Fidelity Investments. The rate quoted is the annualized seven-day yield of the fund at period end. A complete unaudited listing of the fund's holdings as of its most recent quarter end is available upon request. |
(c) Investment made with cash collateral received from securities on loan. |
(d) Security or a portion of the security is on loan at period end. |
Affiliated Central Funds |
Information regarding fiscal year to date income earned by the Fund from investments in Fidelity Central Funds is as follows: |
Fund | Income earned |
Fidelity Cash Central Fund | $ 5,782,641 |
Fidelity Securities Lending Cash Central Fund | 3,012,911 |
Total | $ 8,795,552 |
Annual Report
See accompanying notes which are an integral part of the financial statements.
Europe
Financial Statements
Statement of Assets and Liabilities
October 31, 2006 |
| | |
Assets | | |
Investment in securities, at value (including securities loaned of $32,098,821) - See accompanying schedule: Unaffiliated issuers (cost $3,468,513,392) | $ 3,966,305,358 | |
Fidelity Central Funds (cost $87,071,318) | 87,071,318 | |
Total Investments (cost $3,555,584,710) | | $ 4,053,376,676 |
Receivable for investments sold | | 104,393,541 |
Receivable for fund shares sold | | 4,705,062 |
Dividends receivable | | 2,465,232 |
Interest receivable | | 670,201 |
Other receivables | | 606,183 |
Total assets | | 4,166,216,895 |
| | |
Liabilities | | |
Payable for investments purchased | $ 94,239,841 | |
Payable for fund shares redeemed | 1,068,948 | |
Accrued management fee | 2,740,828 | |
Other affiliated payables | 834,856 | |
Other payables and accrued expenses | 261,044 | |
Collateral on securities loaned, at value | 33,808,334 | |
Total liabilities | | 132,953,851 |
| | |
Net Assets | | $ 4,033,263,044 |
Net Assets consist of: | | |
Paid in capital | | $ 2,971,636,039 |
Undistributed net investment income | | 47,287,901 |
Accumulated undistributed net realized gain (loss) on investments and foreign currency transactions | | 516,492,108 |
Net unrealized appreciation (depreciation) on investments and assets and liabilities in foreign currencies | | 497,846,996 |
Net Assets, for 95,319,221 shares outstanding | | $ 4,033,263,044 |
Net Asset Value, offering price and redemption price per share ($4,033,263,044 ÷ 95,319,221 shares) | | $ 42.31 |
Statement of Operations
Year ended October 31, 2006 |
| | |
Investment Income | | |
Dividends | | $ 81,483,767 |
Interest | | 16,578 |
Income from Fidelity Central Funds (including $3,012,911 from security lending) | | 8,795,552 |
| | 90,295,897 |
Less foreign taxes withheld | | (7,626,758) |
Total income | | 82,669,139 |
| | |
Expenses | | |
Management fee
Basic fee | $ 23,316,735 | |
Performance adjustment | 4,083,687 | |
Transfer agent fees | 7,461,872 | |
Accounting and security lending fees | 1,342,506 | |
Custodian fees and expenses | 1,197,026 | |
Independent trustees' compensation | 12,584 | |
Registration fees | 140,603 | |
Audit | 84,360 | |
Legal | 45,600 | |
Interest | 31,378 | |
Miscellaneous | 26,957 | |
Total expenses before reductions | 37,743,308 | |
Expense reductions | (3,457,264) | 34,286,044 |
Net investment income (loss) | | 48,383,095 |
Realized and Unrealized Gain (Loss) Net realized gain (loss) on: | | |
Investment securities: | | |
Unaffiliated issuers | 529,335,147 | |
Foreign currency transactions | (606,335) | |
Total net realized gain (loss) | | 528,728,812 |
Change in net unrealized appreciation (depreciation) on: Investment securities | 164,068,845 | |
Assets and liabilities in foreign currencies | 61,783 | |
Total change in net unrealized appreciation (depreciation) | | 164,130,628 |
Net gain (loss) | | 692,859,440 |
Net increase (decrease) in net assets resulting from operations | | $ 741,242,535 |
Annual Report
See accompanying notes which are an integral part of the financial statements.
Europe
Financial Statements - continued
Statement of Changes in Net Assets
| Year ended
October 31,
2006 | Year ended
October 31,
2005 |
Increase (Decrease) in Net Assets | | |
Operations | | |
Net investment income (loss) | $ 48,383,095 | $ 22,737,953 |
Net realized gain (loss) | 528,728,812 | 388,153,793 |
Change in net unrealized appreciation (depreciation) | 164,130,628 | 46,504,527 |
Net increase (decrease) in net assets resulting from operations | 741,242,535 | 457,396,273 |
Distributions to shareholders from net investment income | (20,654,281) | (5,654,760) |
Distributions to shareholders from net realized gain | (273,319,238) | (5,026,446) |
Total distributions | (293,973,519) | (10,681,206) |
Share transactions
Proceeds from sales of shares | 1,199,680,149 | 673,749,170 |
Reinvestment of distributions | 289,349,942 | 10,481,613 |
Cost of shares redeemed | (450,913,920) | (428,684,899) |
Net increase (decrease) in net assets resulting from share transactions | 1,038,116,171 | 255,545,884 |
Redemption fees | 66,135 | 110,346 |
Total increase (decrease) in net assets | 1,485,451,322 | 702,371,297 |
Net Assets | | |
Beginning of period | 2,547,811,722 | 1,845,440,425 |
End of period (including undistributed net investment income of $47,287,901 and undistributed net investment income of $22,161,696, respectively) | $ 4,033,263,044 | $ 2,547,811,722 |
Other Information Shares | | |
Sold | 30,327,952 | 19,400,306 |
Issued in reinvestment of distributions | 8,260,061 | 318,978 |
Redeemed | (11,647,553) | (12,015,269) |
Net increase (decrease) | 26,940,460 | 7,704,015 |
Financial Highlights
Years ended October 31, | 2006 | 2005 | 2004 | 2003 | 2002 |
Selected Per-Share Data | | | | | |
Net asset value, beginning of period | $ 37.26 | $ 30.42 | $ 24.37 | $ 18.31 | $ 22.68 |
Income from Investment Operations | | | | | |
Net investment income (loss) D | .58 | .33 | .09 | .29 | .12 G |
Net realized and unrealized gain (loss) | 8.74 | 6.68 | 6.25 | 5.91 | (4.25) |
Total from investment operations | 9.32 | 7.01 | 6.34 | 6.20 | (4.13) |
Distributions from net investment income | (.30) | (.09) | (.29) | (.14) | (.24) |
Distributions from net realized gain | (3.97) | (.08) | - | - | - |
Total distributions | (4.27) | (.17) | (.29) | (.14) | (.24) |
Redemption fees added to paid in capital D, I | - | - | - | - | - |
Net asset value, end of period | $ 42.31 | $ 37.26 | $ 30.42 | $ 24.37 | $ 18.31 |
Total Return A, B, C | 27.40% | 23.12% | 26.20% | 34.09% | (18.49)% |
Ratios to Average Net Assets E, H | | | | | |
Expenses before reductions | 1.16% | 1.15% | 1.11% | 1.03% | 1.20% |
Expenses net of fee waivers, if any | 1.16% | 1.15% | 1.11% | 1.03% | 1.20% |
Expenses net of all reductions | 1.05% | 1.07% | 1.05% | .98% | 1.13% |
Net investment income (loss) | 1.48% | .95% | .32% | 1.44% | .52% |
Supplemental Data | | | | | |
Net assets, end of period (000 omitted) | $ 4,033,263 | $ 2,547,812 | $ 1,845,440 | $ 1,283,191 | $ 875,995 |
Portfolio turnover rate F | 127% | 99% | 106% | 162% | 127% |
A Total returns would have been lower had certain expenses not been reduced during the periods shown. B Total returns do not include the effect of the former sales charges. C Total returns do not include the effect of the former contingent deferred sales charge. D Calculated based on average shares outstanding during the period. E Fees and expenses of the underlying Fidelity Central Funds are not included in the Fund's expense ratio. The Fund indirectly bears its proportionate share of the expense of any underlying Fidelity Central Funds. F Amount does not include the portfolio activity of any underlying Fidelity Central Funds. G Investment income per share reflects a special dividend which amounted to $.05 per share. H Expense ratios reflect operating expenses of the Fund. Expenses before reductions do not reflect amounts reimbursed by the investment adviser or reductions from brokerage service arrangements or other expense offset arrangements and do not represent the amount paid by the Fund during periods when reimbursements or reductions occur. Expenses net of fee waivers reflect expenses after reimbursement by the investment adviser but prior to reductions from brokerage service arrangements or other expense offset arrangements. Expenses net of all reductions represent the net expenses paid by the Fund. I Amount represents less than $.01 per share. |
Annual Report
See accompanying notes which are an integral part of the financial statements.
Europe Capital Appreciation
Performance: The Bottom Line
Average annual total return reflects the change in the value of an investment, assuming reinvestment of the fund's dividend income and capital gains (the profits earned upon the sale of securities that have grown in value) and assuming a constant rate of performance each year. The $10,000 table and the fund's returns do not reflect the deduction of taxes that a shareholder would pay on fund distributions or the redemption of fund shares. During periods of reimbursement by Fidelity, a fund's total returns will be greater than it would be had the reimbursement not occurred. How a fund did yesterday is no guarantee of how it will do tomorrow.
Average Annual Total Returns
Periods ended
October 31, 2006 | Past 1
year | Past 5
years | Past 10
years |
Fidelity Europe Capital Appreciation Fund | 34.81% | 16.23% | 12.55% |
$10,000 Over 10 Years
Let's say hypothetically that $10,000 was invested in Fidelity Europe Capital Appreciation Fund on October 31, 1996. The chart shows how the value of your investment would have changed, and also shows how the MSCI Europe Index performed over the same period.
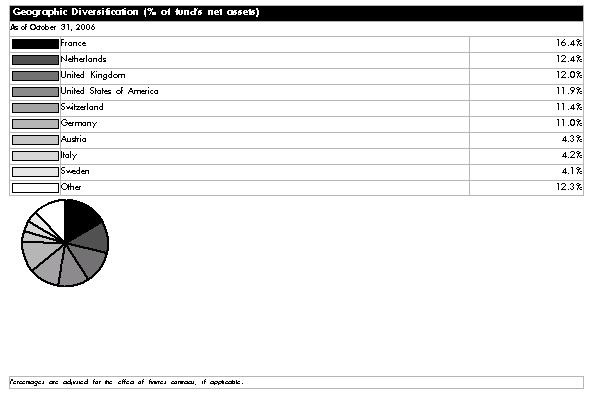

Annual Report
Europe Capital Appreciation
Management's Discussion of Fund Performance
Comments from Darren Maupin, Portfolio Manager of Fidelity® Europe Capital Appreciation Fund
International equity markets as a whole outpaced their U.S. counterparts for the 12 months ending October 31, 2006 - partly as a result of favorable currency exchanges that boosted returns for U.S. investors. The Morgan Stanley Capital InternationalSM Europe, Australasia, Far East (MSCI® EAFE®) Index - a gauge of developed stock markets outside the United States and Canada - gained 27.72% during that time. European markets benefited from solid corporate profit growth and attractive dividends, which helped the MSCI Europe index advance 31.95%. Strong performing Latin American and Asian emerging markets drove the MSCI Emerging Markets index to a lofty 35.42% return. Japan was somewhat of an exception to the generally stellar foreign market performance after struggling in the middle part of the period. Still, its earlier gains helped the Tokyo Stock Exchange Stock Price Index (TOPIX) - - a benchmark of the largest and better-established stocks traded on the Tokyo Stock Exchange - rise 12.47% overall. Natural-resources-rich Canada also struggled over the final six months as energy prices fell, but the S&P/TSX Composite Index managed a 12-month return of 28.21%.
The fund advanced 34.81% for the fiscal year, outperforming the MSCI Europe index. Favorable stock selection added the most value relative to the benchmark, led by the fund's picks in the energy, telecommunication services and financials sectors, as well as in the pharmaceuticals, biotechnology and life science group. Among the stocks that helped most were Millicom International Cellular, a Luxembourg-based wireless company with a strong emerging-markets presence; Banca Italease, an Italian leasing company; and Swiss biopharma company Actelion. I sold Millicom and Banca Italease to realize their profits. Having no exposure to integrated energy giant BP, a major index component, also helped. Conversely, the fund's underweighting in the telecom space held back its performance a bit, as did inopportune stock picking in such groups as commercial services and supplies, media and utilities. Detractors included Tele Atlas, a Dutch maker of digital maps; German pay-TV operator Premiere; and NETeller, a U.K. online funds transfer service. I eliminated the positions in Premiere and NETeller. A larger-than-usual average cash position during the period, some of which I diverted into short-term European bonds, also hurt. On a country level, our best results were in Italy and Switzerland, and our worst in the United Kingdom. Favorable currency movements also helped boost the fund's absolute performance.
The views expressed above reflect those of the portfolio manager(s) only through the end of the period as stated on the cover of this report and do not necessarily represent the views of Fidelity or any other person in the Fidelity organization. Any such views are subject to change at any time based upon market or other conditions and Fidelity disclaims any responsibility to update such views. These views may not be relied on as investment advice and, because investment decisions for a Fidelity fund are based on numerous factors, may not be relied on as an indication of trading intent on behalf of any Fidelity fund.
Annual Report
Europe Capital Appreciation
Investment Changes
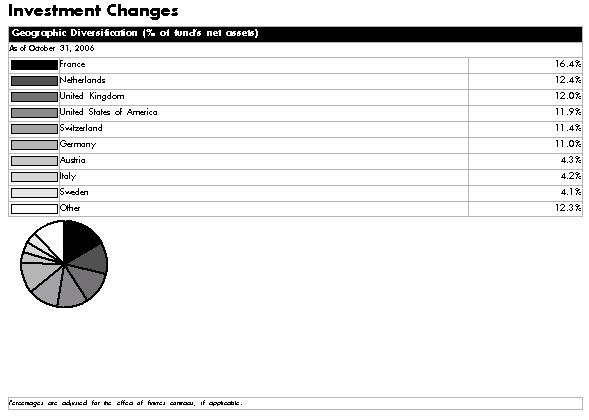
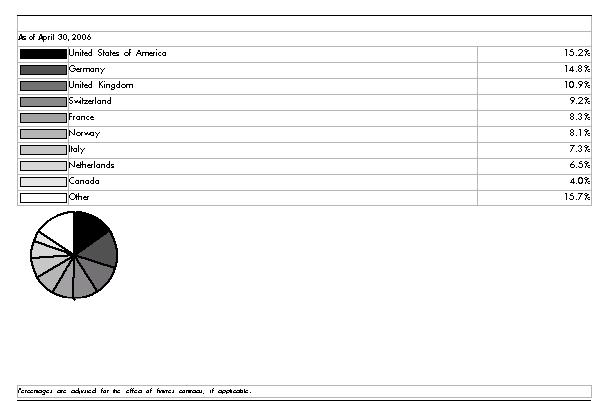
Asset Allocation |
| % of fund's
net assets | % of fund's net assets
6 months ago |
Stocks | 83.1 | 89.8 |
Bonds | 10.2 | 0.0 |
Short-Term Investments and Net Other Assets | 6.7 | 10.2 |
Top Ten Stocks as of October 31, 2006 |
| % of fund's
net assets | % of fund's net assets
6 months ago |
Icade SA (France, Real Estate Management & Development) | 3.4 | 0.7 |
SES Global SA FDR (France) (Luxembourg, Media) | 3.2 | 0.0 |
Tesco PLC (United Kingdom, Food & Staples Retailing) | 3.1 | 0.0 |
Synthes, Inc. (United States of America, Health Care Equipment & Supplies) | 3.1 | 3.0 |
Lanxess AG (Germany, Chemicals) | 3.0 | 1.9 |
Actelion Ltd. (Reg.) (Switzerland, Biotechnology) | 2.8 | 2.6 |
Reed Elsevier NV (Netherlands, Media) | 2.8 | 1.7 |
Istituto Finanziario Industriale Spa (IFI) (Italy, Diversified Financial Services) | 2.8 | 2.4 |
Renault SA (France, Automobiles) | 2.7 | 1.8 |
GlaxoSmithKline PLC (United Kingdom, Pharmaceuticals) | 2.7 | 0.0 |
| 29.6 | |
Market Sectors as of October 31, 2006 |
| % of fund's
net assets | % of fund's net assets
6 months ago |
Consumer Discretionary | 18.9 | 13.7 |
Health Care | 14.2 | 7.2 |
Financials | 14.1 | 19.9 |
Industrials | 12.0 | 7.5 |
Materials | 7.0 | 11.8 |
Consumer Staples | 6.7 | 5.0 |
Energy | 5.6 | 11.2 |
Utilities | 2.4 | 2.7 |
Information Technology | 2.2 | 6.7 |
Telecommunication Services | 0.0 | 4.1 |
Annual Report
Europe Capital Appreciation
Investments October 31, 2006
Showing Percentage of Net Assets
Common Stocks - 80.3% |
| Shares | | Value (Note 1) |
Argentina - 0.7% |
Cresud S.A.C.I.F. y A. sponsored ADR | 551,200 | | $ 8,069,568 |
Austria - 2.6% |
Flughafen Wien AG | 312,377 | | 28,009,940 |
Bermuda - 0.9% |
SeaDrill Ltd. (a) | 647,100 | | 9,176,968 |
Canada - 1.7% |
European Goldfields Ltd. (a) | 2,559,200 | | 8,662,504 |
MagIndustries Corp. (a) | 1,518,880 | | 1,285,295 |
New Flyer Industries, Inc. | 1,028,900 | | 7,973,482 |
TOTAL CANADA | | 17,921,281 |
France - 13.0% |
BIC SA | 309,682 | | 19,922,017 |
Compagnie Generale de Geophysique SA (a)(d) | 49,200 | | 8,320,852 |
Eutelsat Communications | 1,015,064 | | 18,333,132 |
Icade SA | 608,166 | | 36,103,996 |
Renault SA | 249,900 | | 29,233,817 |
Sanofi-Aventis sponsored ADR | 640,599 | | 27,347,171 |
TOTAL FRANCE | | 139,260,985 |
Germany - 9.3% |
E.ON AG | 216,800 | | 26,100,552 |
KarstadtQuelle AG (a)(d) | 899,700 | | 21,130,138 |
Lanxess AG (a) | 689,700 | | 31,524,728 |
Qimonda AG Sponsored ADR | 488,900 | | 6,820,155 |
SAP AG | 70,000 | | 13,899,200 |
TOTAL GERMANY | | 99,474,773 |
Italy - 1.4% |
Banca Intesa Spa | 2,157,500 | | 14,749,530 |
Luxembourg - 3.2% |
SES Global SA FDR (France) | 2,217,100 | | 33,987,176 |
Netherlands - 10.7% |
ING Groep NV (Certificaten Van Aandelen) | 506,898 | | 22,470,788 |
Koninklijke Philips Electronics NV | 596,500 | | 20,776,095 |
Koninklijke Wessanen NV | 628,814 | | 8,379,334 |
Nutreco Holding NV | 383,700 | | 22,866,646 |
Reed Elsevier NV | 1,744,200 | | 29,988,219 |
Tele Atlas NV (a)(d) | 541,978 | | 10,169,177 |
TOTAL NETHERLANDS | | 114,650,259 |
Norway - 3.5% |
Fred Olsen Energy ASA (a)(d) | 253,600 | | 10,940,734 |
Petroleum Geo-Services ASA (a) | 206,750 | | 12,035,060 |
TANDBERG ASA | 196,900 | | 2,274,263 |
TGS Nopec Geophysical Co. ASA (a) | 671,250 | | 11,963,502 |
TOTAL NORWAY | | 37,213,559 |
|
| Shares | | Value (Note 1) |
Philippines - 0.6% |
DMCI Holdings, Inc. | 20,501,000 | | $ 2,015,548 |
Semirara Mining Corp. | 11,981,400 | | 4,627,647 |
TOTAL PHILIPPINES | | 6,643,195 |
Sweden - 4.1% |
Assa Abloy AB (B Shares) | 1,066,600 | | 20,527,442 |
Atlas Copco AB (A Shares) | 760,000 | | 22,203,146 |
Micronic Laser Systems AB (a) | 107,770 | | 973,637 |
TOTAL SWEDEN | | 43,704,225 |
Switzerland - 11.4% |
Actelion Ltd. (Reg.) (a) | 179,049 | | 30,149,713 |
Bucher Holding AG | 184,321 | | 18,666,918 |
Credit Suisse Group (Reg.) | 211,758 | | 12,807,124 |
Novartis AG sponsored ADR | 348,500 | | 21,164,405 |
Roche Holding AG (participation certificate) | 67,642 | | 11,835,923 |
Swissfirst AG | 67,095 | | 3,996,093 |
Syngenta AG (Switzerland) | 147,430 | | 23,758,345 |
TOTAL SWITZERLAND | | 122,378,521 |
United Kingdom - 12.0% |
Amlin PLC | 343,149 | | 1,971,852 |
Benfield Group PLC | 4,236,357 | | 28,161,765 |
GlaxoSmithKline PLC | 1,077,100 | | 28,677,788 |
Pearson PLC | 1,814,600 | | 26,773,538 |
Peter Hambro Mining PLC (a)(d) | 444,288 | | 10,085,004 |
Tesco PLC | 4,388,300 | | 32,938,634 |
TOTAL UNITED KINGDOM | | 128,608,581 |
United States of America - 5.2% |
NTL, Inc. | 836,900 | | 22,621,407 |
Synthes, Inc. | 290,352 | | 32,929,042 |
TOTAL UNITED STATES OF AMERICA | | 55,550,449 |
TOTAL COMMON STOCKS (Cost $774,632,454) | 859,399,010 |
Nonconvertible Preferred Stocks - 2.8% |
| | | |
Italy - 2.8% |
Istituto Finanziario Industriale Spa (IFI) (a)
(Cost $21,855,971) | 1,084,111 | | 29,640,124 |
Government Obligations - 10.2% |
| Principal Amount | | |
Austria - 1.7% |
Austrian Republic 5.625% 7/15/07 | EUR | 14,275,000 | | 18,442,902 |
Finland - 1.7% |
Finnish Government 5% 7/4/07 | EUR | 14,275,000 | | 18,370,019 |
Government Obligations - continued |
| Principal Amount | | Value (Note 1) |
France - 3.4% |
French Government 2.25% 3/12/07 | EUR | 28,550,000 | | $ 36,277,233 |
Germany - 1.7% |
German Federal Republic 6% 7/4/07 | EUR | 14,275,000 | | 18,493,919 |
Netherlands - 1.7% |
Dutch Government 3% 7/15/07 | EUR | 14,275,000 | | 18,126,410 |
TOTAL GOVERNMENT OBLIGATIONS (Cost $109,185,398) | 109,710,483 |
Money Market Funds - 9.5% |
| Shares | | |
Fidelity Cash Central Fund, 5.34% (b) | 59,278,253 | | 59,278,253 |
Fidelity Securities Lending Cash Central Fund, 5.35% (b)(c) | 41,901,786 | | 41,901,786 |
TOTAL MONEY MARKET FUNDS (Cost $101,180,039) | 101,180,039 |
TOTAL INVESTMENT PORTFOLIO - 102.8% (Cost $1,006,853,862) | | 1,099,929,656 |
NET OTHER ASSETS - (2.8)% | | (29,465,269) |
NET ASSETS - 100% | $ 1,070,464,387 |
Currency Abbreviations |
EUR - European Monetary Unit |
Legend |
(a) Non-income producing |
(b) Affiliated fund that is available only to investment companies and other accounts managed by Fidelity Investments. The rate quoted is the annualized seven-day yield of the fund at period end. A complete unaudited listing of the fund's holdings as of its most recent quarter end is available upon request. |
(c) Investment made with cash collateral received from securities on loan. |
(d) Security or a portion of the security is on loan at period end. |
Affiliated Central Funds |
Information regarding fiscal year to date income earned by the Fund from investments in Fidelity Central Funds is as follows: |
Fund | Income earned |
Fidelity Cash Central Fund | $ 2,620,798 |
Fidelity Securities Lending Cash Central Fund | 895,815 |
Total | $ 3,516,613 |
Annual Report
See accompanying notes which are an integral part of the financial statements.
Europe Capital Appreciation
Financial Statements
Statement of Assets and Liabilities
October 31, 2006 |
| | |
Assets | | |
Investment in securities, at value (including securities loaned of $39,767,644) - See accompanying schedule: Unaffiliated issuers (cost $905,673,823) | $ 998,749,617 | |
Fidelity Central Funds (cost $101,180,039) | 101,180,039 | |
Total Investments (cost $1,006,853,862) | | $ 1,099,929,656 |
Receivable for investments sold | | 25,416,899 |
Receivable for fund shares sold | | 5,084,301 |
Dividends receivable | | 663,522 |
Interest receivable | | 1,885,827 |
Other receivables | | 241,011 |
Total assets | | 1,133,221,216 |
| | |
Liabilities | | |
Payable for investments purchased | $ 19,246,482 | |
Payable for fund shares redeemed | 743,293 | |
Accrued management fee | 580,060 | |
Other affiliated payables | 208,935 | |
Other payables and accrued expenses | 76,273 | |
Collateral on securities loaned, at value | 41,901,786 | |
Total liabilities | | 62,756,829 |
| | |
Net Assets | | $ 1,070,464,387 |
Net Assets consist of: | | |
Paid in capital | | $ 854,916,365 |
Undistributed net investment income | | 10,571,012 |
Accumulated undistributed net realized gain (loss) on investments and foreign currency transactions | | 111,874,199 |
Net unrealized appreciation (depreciation) on investments and assets and liabilities in foreign currencies | | 93,102,811 |
Net Assets, for 38,965,440 shares outstanding | | $ 1,070,464,387 |
Net Asset Value, offering price and redemption price per share ($1,070,464,387 ÷ 38,965,440 shares) | | $ 27.47 |
Statement of Operations
Year ended October 31, 2006 |
| | |
Investment Income | | |
Dividends | | $ 12,509,128 |
Special dividends | | 3,180,771 |
Interest | | 493,581 |
Income from Fidelity Central Funds (including $895,815 from security lending) | | 3,516,613 |
| | 19,700,093 |
Less foreign taxes withheld | | (1,967,651) |
Total income | | 17,732,442 |
| | |
Expenses | | |
Management fee
Basic fee | $ 5,044,060 | |
Performance adjustment | 362,758 | |
Transfer agent fees | 1,523,142 | |
Accounting and security lending fees | 340,210 | |
Custodian fees and expenses | 242,299 | |
Independent trustees' compensation | 2,639 | |
Registration fees | 109,908 | |
Audit | 51,030 | |
Legal | 8,993 | |
Miscellaneous | 5,454 | |
Total expenses before reductions | 7,690,493 | |
Expense reductions | (656,211) | 7,034,282 |
Net investment income (loss) | | 10,698,160 |
Realized and Unrealized Gain (Loss) Net realized gain (loss) on: | | |
Investment securities: | | |
Unaffiliated issuers | 112,180,210 | |
Foreign currency transactions | (97,353) | |
Total net realized gain (loss) | | 112,082,857 |
Change in net unrealized appreciation (depreciation) on: Investment securities | 56,456,612 | |
Assets and liabilities in foreign currencies | 26,700 | |
Total change in net unrealized appreciation (depreciation) | | 56,483,312 |
Net gain (loss) | | 168,566,169 |
Net increase (decrease) in net assets resulting from operations | | $ 179,264,329 |
Annual Report
See accompanying notes which are an integral part of the financial statements.
Europe Capital Appreciation
Financial Statements - continued
Statement of Changes in Net Assets
| Year ended
October 31,
2006 | Year ended
October 31,
2005 |
Increase (Decrease) in Net Assets | | |
Operations | | |
Net investment income (loss) | $ 10,698,160 | $ 7,893,648 |
Net realized gain (loss) | 112,082,857 | 80,741,934 |
Change in net unrealized appreciation (depreciation) | 56,483,312 | (10,249,032) |
Net increase (decrease) in net assets resulting from operations | 179,264,329 | 78,386,550 |
Distributions to shareholders from net investment income | (6,124,444) | (3,546,592) |
Distributions to shareholders from net realized gain | (53,486,694) | (1,251,738) |
Total distributions | (59,611,138) | (4,798,330) |
Share transactions
Proceeds from sales of shares | 647,405,817 | 110,398,063 |
Reinvestment of distributions | 55,944,039 | 4,494,786 |
Cost of shares redeemed | (245,527,974) | (103,075,461) |
Net increase (decrease) in net assets resulting from share transactions | 457,821,882 | 11,817,388 |
Redemption fees | 201,750 | 20,064 |
Total increase (decrease) in net assets | 577,676,823 | 85,425,672 |
| | |
Net Assets | | |
Beginning of period | 492,787,564 | 407,361,892 |
End of period (including undistributed net investment income of $10,571,012 and undistributed net investment income of $6,919,085, respectively) | $ 1,070,464,387 | $ 492,787,564 |
Other Information Shares | | |
Sold | 24,922,851 | 4,991,864 |
Issued in reinvestment of distributions | 2,608,114 | 217,455 |
Redeemed | (9,853,075) | (4,674,623) |
Net increase (decrease) | 17,677,890 | 534,696 |
Financial Highlights
Years ended October 31, | 2006 | 2005 | 2004 | 2003 | 2002 |
Selected Per-Share Data | | | | | |
Net asset value, beginning of period | $ 23.15 | $ 19.63 | $ 17.26 | $ 13.85 | $ 15.43 |
Income from Investment Operations | | | | | |
Net investment income (loss) C | .38 F | .37 | .13 G | .14 | .19 |
Net realized and unrealized gain (loss) | 6.85 | 3.38 | 2.46 | 3.46 | (1.60) |
Total from investment operations | 7.23 | 3.75 | 2.59 | 3.60 | (1.41) |
Distributions from net investment income | (.30) | (.17) | (.22) | (.19) | (.17) |
Distributions from net realized gain | (2.62) | (.06) | - | - | - |
Total distributions | (2.92) | (.23) | (.22) | (.19) | (.17) |
Redemption fees added to paid in capital C | .01 | - I | - I | - I | - I |
Net asset value, end of period | $ 27.47 | $ 23.15 | $ 19.63 | $ 17.26 | $ 13.85 |
Total Return A, B | 34.81% | 19.24% | 15.13% | 26.36% | (9.29)% |
Ratios to Average Net Assets D, H | | | | | |
Expenses before reductions | 1.09% | .95% | 1.22% | 1.39% | 1.37% |
Expenses net of fee waivers, if any | 1.09% | .95% | 1.22% | 1.39% | 1.37% |
Expenses net of all reductions | .99% | .84% | 1.15% | 1.32% | 1.32% |
Net investment income (loss) | 1.51% F | 1.66% | .69% G | .94% | 1.18% |
Supplemental Data | | | | | |
Net assets, end of period (000 omitted) | $ 1,070,464 | $ 492,788 | $ 407,362 | $ 394,015 | $ 424,006 |
Portfolio turnover rate E | 143% | 133% | 119% | 184% | 121% |
A Total returns would have been lower had certain expenses not been reduced during the periods shown. B Total returns do not include the effect of the former sales charges. C Calculated based on average shares outstanding during the period. D Fees and expenses of the underlying Fidelity Central Funds are not included in the Fund's expense ratio. The Fund indirectly bears its proportionate share of the expense of any underlying Fidelity Central Funds. E Amount does not include the portfolio activity of any underlying Fidelity Central Funds. F Investment income per share reflects a special dividend which amounted to $.11 per share. Excluding the special dividend, the ratio of net investment income (loss) to average net assets would have been 1.06%. G Net investment income per share includes approximately $.01 per share received as a result of a reorganization of an issuer that was in bankruptcy. Excluding this non-recurring amount, the ratio of net investment income (loss) to average net assets would have been .65%. H Expense ratios reflect operating expenses of the Fund. Expenses before reductions do not reflect amounts reimbursed by the investment adviser or reductions from brokerage service arrangements or other expense offset arrangements and do not represent the amount paid by the Fund during periods when reimbursements or reductions occur. Expenses net of fee waivers reflect expenses after reimbursement by the investment adviser but prior to reductions from brokerage service arrangements or other expense offset arrangements. Expenses net of all reductions represent the net expenses paid by the Fund. I Amount represents less than $.01 per share. |
Annual Report
See accompanying notes which are an integral part of the financial statements.
Japan
Performance: The Bottom Line
Average annual total return reflects the change in the value of an investment, assuming reinvestment of the fund's dividend income and capital gains (the profits earned upon the sale of securities that have grown in value) and assuming a constant rate of performance each year. The $10,000 table and the fund's returns do not reflect the deduction of taxes that a shareholder would pay on fund distributions or the redemption of fund shares. During periods of reimbursement by Fidelity, a fund's total returns will be greater than it would be had the reimbursement not occurred. How a fund did yesterday is no guarantee of how it will do tomorrow.
Average Annual Total Returns
Periods ended
October 31, 2006 | Past 1
year | Past 5
years | Past 10
years |
Fidelity Japan Fund | 12.54% | 11.81% | 6.61% |
$10,000 Over 10 Years
Let's say hypothetically that $10,000 was invested in Fidelity Japan Fund on October 31, 1996. The chart shows how the value of your investment would have changed, and also shows how the TOPIX performed over the same period.
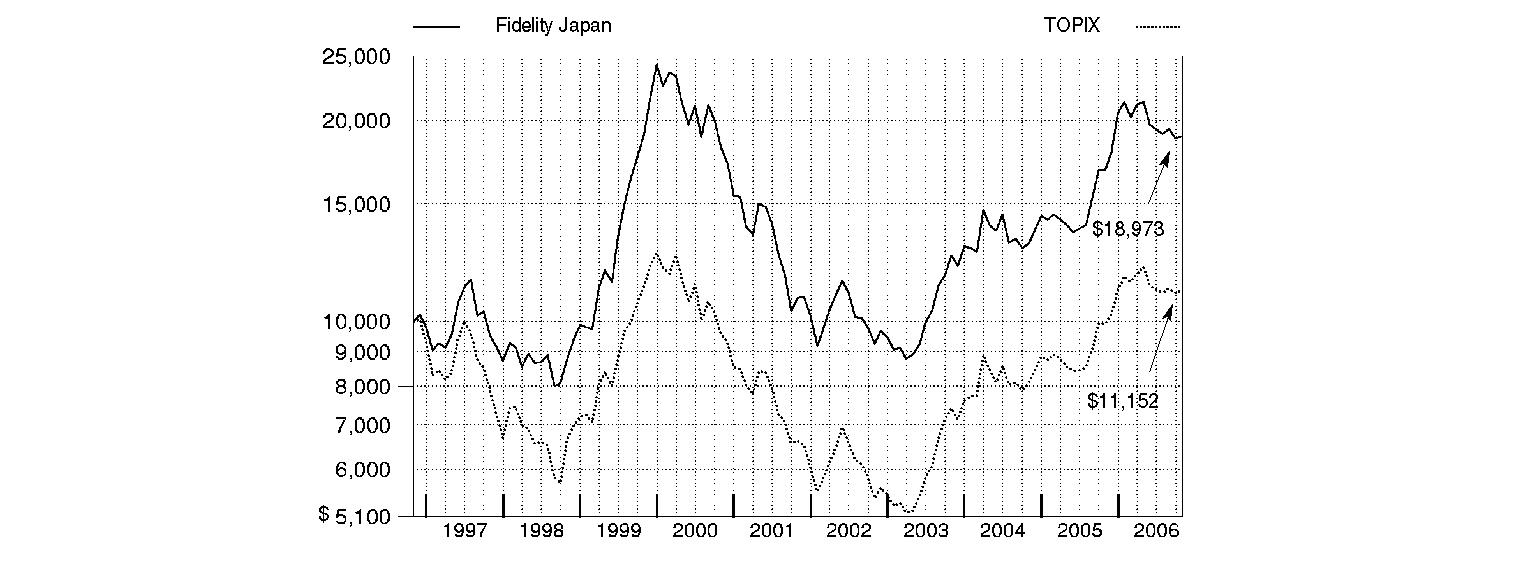
Annual Report
Japan
Management's Discussion of Fund Performance
Comments from Yoko Ishibashi, Portfolio Manager of Fidelity® Japan Fund
International equity markets as a whole outpaced their U.S. counterparts for the 12 months ending October 31, 2006 - partly as a result of favorable currency exchanges that boosted returns for U.S. investors. The Morgan Stanley Capital InternationalSM Europe, Australasia, Far East (MSCI® EAFE®) Index - a gauge of developed stock markets outside the United States and Canada - gained 27.72% during that time. European markets benefited from solid corporate profit growth and attractive dividends, which helped the MSCI Europe index advance 31.95%. Strong performing Latin American and Asian emerging markets drove the MSCI Emerging Markets index to a lofty 35.42% return. Japan was somewhat of an exception to the generally stellar foreign market performance after struggling in the middle part of the period. Still, its earlier gains helped the Tokyo Stock Exchange Stock Price Index (TOPIX) - - a benchmark of the largest and better-established stocks traded on the Tokyo Stock Exchange - rise 12.47% overall. Natural-resources-rich Canada also struggled over the final six months as energy prices fell, but the S&P/TSX Composite Index managed a 12-month return of 28.21%.
During the past year, the fund returned 12.54%, edging the TOPIX. Strong stock picking in the financials sector - particularly in the banking industry - added to performance versus the index. For example, not owning poorly performing index component Mitsubishi UFJ Financial Group proved timely. Also boosting the fund's return was stock selection in materials and telecommunication services. That said, the fund's top contributor was Mitsui Engineering & Shipbuilding. Video game developer Nintendo also boosted the fund's results, as did Sumitomo Metal Mining, a producer of nickel, copper and gold. Sumitomo Realty & Development benefited from the recent strength in real estate prices. Conversely, performance suffered because of the consumer discretionary sector, where a large overweighting in retailers was counterproductive, along with a sizable underweighting in automaker Toyota, a major index component that did well. Owning a minimal stake in office automation stock Canon - another index component - further hurt our results, as did an unsuccessful position in Ebara, a maker of waste incinerators. I sold Ebara by period end. Overweighting energy was detrimental as well, as reflected in the disappointing performance of Nippon Oil. In the case of engineering company JGC Corp., recent earnings appeared unimpressive compared with the previous year's stellar results, hurting its stock price.
The views expressed above reflect those of the portfolio manager(s) only through the end of the period as stated on the cover of this report and do not necessarily represent the views of Fidelity or any other person in the Fidelity organization. Any such views are subject to change at any time based upon market or other conditions and Fidelity disclaims any responsibility to update such views. These views may not be relied on as investment advice and, because investment decisions for a Fidelity fund are based on numerous factors, may not be relied on as an indication of trading intent on behalf of any Fidelity fund.
Annual Report
Japan
Investment Changes
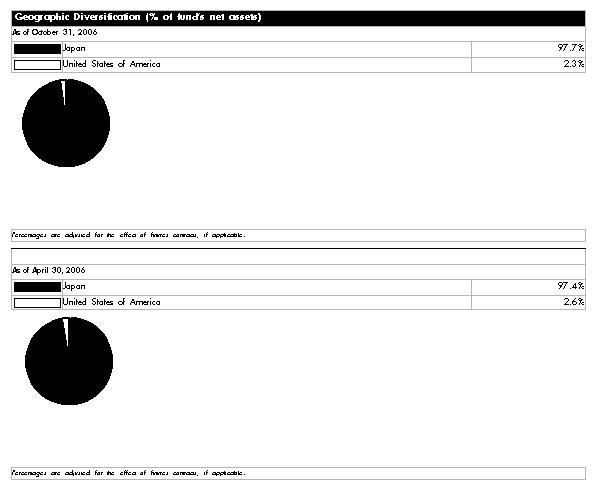
Asset Allocation |
| % of fund's
net assets | % of fund's net assets
6 months ago |
Stocks | 97.7 | 97.4 |
Short-Term Investments and
Net Other Assets | 2.3 | 2.6 |
Top Ten Stocks as of October 31, 2006 |
| % of fund's
net assets | % of fund's net assets
6 months ago |
Mizuho Financial Group, Inc. (Commercial Banks) | 5.3 | 4.8 |
Nintendo Co. Ltd. (Software) | 5.1 | 1.3 |
Sumitomo Mitsui Financial Group, Inc. (Commercial Banks) | 4.9 | 4.0 |
Yamada Denki Co. Ltd. (Specialty Retail) | 4.7 | 3.7 |
Fujifilm Holdings Corp. (Leisure Equipment & Products) | 4.5 | 0.0 |
Mitsui Engineering & Shipbuilding Co. (Machinery) | 4.1 | 2.6 |
Inpex Holdings, Inc. (Oil, Gas & Consumable Fuels) | 3.9 | 3.5 |
Sumitomo Metal Industries Ltd. (Metals & Mining) | 3.7 | 3.4 |
Sumitomo Metal Mining Co. Ltd. (Metals & Mining) | 3.7 | 3.2 |
Matsushita Electric Industrial Co. Ltd. (Household Durables) | 3.3 | 3.2 |
| 43.2 | |
Market Sectors as of October 31, 2006 |
| % of fund's
net assets | % of fund's net assets
6 months ago |
Consumer Discretionary | 26.4 | 23.2 |
Financials | 17.9 | 19.8 |
Information Technology | 13.6 | 12.3 |
Materials | 11.0 | 14.2 |
Industrials | 10.5 | 15.5 |
Health Care | 6.3 | 1.6 |
Energy | 5.9 | 6.1 |
Consumer Staples | 3.8 | 4.7 |
Telecommunication Services | 2.3 | 0.0 |
Annual Report
Japan
Investments October 31, 2006
Showing Percentage of Net Assets
Common Stocks - 97.7% |
| Shares | | Value (Note 1) |
CONSUMER DISCRETIONARY - 26.4% |
Auto Components - 0.1% |
Stanley Electric Co. Ltd. | 108,400 | | $ 2,150,205 |
Automobiles - 3.0% |
Mazda Motor Corp. | 7,193,000 | | 48,646,232 |
Toyota Motor Corp. | 67,400 | | 3,976,600 |
| | 52,622,832 |
Household Durables - 7.2% |
Casio Computer Co. Ltd. (d) | 2,265,200 | | 45,803,679 |
Daiwa House Industry Co. Ltd. | 880,000 | | 15,875,514 |
Matsushita Electric Industrial Co. Ltd. | 2,772,000 | | 57,657,603 |
Sekisui House Ltd. | 413,000 | | 6,529,044 |
Sony Corp. | 9,400 | | 385,212 |
| | 126,251,052 |
Leisure Equipment & Products - 7.9% |
Fujifilm Holdings Corp. | 2,135,400 | | 79,237,658 |
Namco Bandai Holdings, Inc. | 492,200 | | 7,823,186 |
Nikon Corp. (d) | 2,581,000 | | 53,072,036 |
| | 140,132,880 |
Multiline Retail - 2.1% |
Parco Co. Ltd. | 533,800 | | 6,407,791 |
The Daimaru, Inc. | 2,514,000 | | 30,135,330 |
| | 36,543,121 |
Specialty Retail - 6.1% |
Nishimatsuya Chain Co. Ltd. | 335,100 | | 6,546,713 |
Otsuka Kagu Ltd. (d) | 603,600 | | 15,843,469 |
Shimachu Co. Ltd. | 87,700 | | 2,511,927 |
Yamada Denki Co. Ltd. | 836,990 | | 83,298,256 |
| | 108,200,365 |
Textiles, Apparel & Luxury Goods - 0.0% |
Seiko Corp. (d) | 70,000 | | 497,948 |
TOTAL CONSUMER DISCRETIONARY | | 466,398,403 |
CONSUMER STAPLES - 3.8% |
Food & Staples Retailing - 1.1% |
Aeon Co. Ltd. | 833,100 | | 19,623,723 |
Household Products - 2.2% |
Uni-Charm Corp. | 676,600 | | 37,659,595 |
Personal Products - 0.5% |
Mandom Corp. | 368,900 | | 8,989,099 |
TOTAL CONSUMER STAPLES | | 66,272,417 |
ENERGY - 5.9% |
Energy Equipment & Services - 0.5% |
Shinko Plantech Co. Ltd. | 1,264,000 | | 9,499,453 |
|
| Shares | | Value (Note 1) |
Oil, Gas & Consumable Fuels - 5.4% |
Inpex Holdings, Inc. | 8,474 | | $ 69,264,230 |
Nippon Oil Corp. | 3,435,000 | | 25,551,044 |
| | 94,815,274 |
TOTAL ENERGY | | 104,314,727 |
FINANCIALS - 17.9% |
Capital Markets - 2.0% |
Daiwa Securities Group, Inc. (d) | 1,912,000 | | 21,693,093 |
Nomura Holdings, Inc. | 748,800 | | 13,193,857 |
| | 34,886,950 |
Commercial Banks - 11.4% |
Mizuho Financial Group, Inc. | 11,974 | | 93,265,341 |
Sumitomo Mitsui Financial Group, Inc. (d) | 7,928 | | 86,763,342 |
Sumitomo Trust & Banking Co. Ltd. | 1,504,000 | | 16,176,745 |
Tokyo Tomin Bank Ltd. (d) | 150,500 | | 6,125,000 |
| | 202,330,428 |
Real Estate Management & Development - 4.5% |
Mitsubishi Estate Co. Ltd. | 1,273,000 | | 30,475,378 |
Mitsui Fudosan Co. Ltd. | 879,000 | | 21,644,324 |
Sankei Building Co. Ltd. | 304,200 | | 2,928,601 |
Sumitomo Realty & Development Co. Ltd. | 721,000 | | 23,918,264 |
| | 78,966,567 |
TOTAL FINANCIALS | | 316,183,945 |
HEALTH CARE - 6.3% |
Health Care Equipment & Supplies - 1.2% |
Nikkiso Co. Ltd. | 1,537,000 | | 13,193,810 |
Terumo Corp. | 210,900 | | 8,529,045 |
| | 21,722,855 |
Pharmaceuticals - 5.1% |
Daiichi Sankyo Co. Ltd. | 1,057,800 | | 31,473,531 |
Takeda Pharamaceutical Co. Ltd. | 897,200 | | 57,609,202 |
| | 89,082,733 |
TOTAL HEALTH CARE | | 110,805,588 |
INDUSTRIALS - 10.5% |
Building Products - 0.1% |
Toto Ltd. (d) | 168,000 | | 1,663,338 |
Construction & Engineering - 2.8% |
JGC Corp. | 2,962,000 | | 46,116,640 |
Meisei Industrial Co. Ltd. (a)(d) | 543,000 | | 2,785,568 |
| | 48,902,208 |
Electrical Equipment - 0.6% |
Furukawa Electric Co. Ltd. | 1,608,000 | | 11,479,823 |
Machinery - 5.8% |
JTEKT Corp. | 918,900 | | 19,130,657 |
Common Stocks - continued |
| Shares | | Value (Note 1) |
INDUSTRIALS - continued |
Machinery - continued |
Mitsui Engineering & Shipbuilding Co. (d) | 19,307,000 | | $ 71,972,062 |
Nabtesco Corp. | 915,000 | | 10,991,579 |
| | 102,094,298 |
Road & Rail - 0.9% |
East Japan Railway Co. | 2,381 | | 16,652,343 |
Transportation Infrastructure - 0.3% |
Mitsui-Soko Co. Ltd. (d) | 912,000 | | 5,216,553 |
TOTAL INDUSTRIALS | | 186,008,563 |
INFORMATION TECHNOLOGY - 13.6% |
Computers & Peripherals - 0.0% |
Fujitsu Ltd. | 27,000 | | 220,229 |
Electronic Equipment & Instruments - 4.1% |
Hoya Corp. | 223,200 | | 8,625,719 |
Nidec Corp. (d) | 241,200 | | 18,457,080 |
Nihon Dempa Kogyo Co. Ltd. (d) | 33,800 | | 1,387,141 |
Yamatake Corp. | 1,925,700 | | 42,807,971 |
Yaskawa Electric Corp. (d) | 105,000 | | 1,120,383 |
| | 72,398,294 |
Office Electronics - 1.3% |
Canon, Inc. | 18,900 | | 1,009,071 |
Konica Minolta Holdings, Inc. | 1,708,500 | | 22,758,577 |
| | 23,767,648 |
Semiconductors & Semiconductor Equipment - 3.1% |
Tokyo Electron Ltd. | 723,600 | | 54,072,027 |
Software - 5.1% |
Nintendo Co. Ltd. | 436,400 | | 89,250,073 |
TOTAL INFORMATION TECHNOLOGY | | 239,708,271 |
MATERIALS - 11.0% |
Chemicals - 3.6% |
Asahi Kasei Corp. | 2,401,000 | | 15,334,705 |
JSR Corp. | 14,600 | | 366,997 |
Mitsubishi Gas Chemical Co., Inc. | 3,789,000 | | 36,088,801 |
Teijin Ltd. | 1,748,000 | | 9,759,269 |
Tokuyama Corp. (d) | 205,000 | | 2,580,027 |
| | 64,129,799 |
|
| Shares | | Value (Note 1) |
Metals & Mining - 7.4% |
Sumitomo Metal Industries Ltd. (d) | 17,364,000 | | $ 65,322,848 |
Sumitomo Metal Mining Co. Ltd. | 4,897,000 | | 64,352,679 |
| | 129,675,527 |
TOTAL MATERIALS | | 193,805,326 |
TELECOMMUNICATION SERVICES - 2.3% |
Wireless Telecommunication Services - 2.3% |
KDDI Corp. | 6,487 | | 40,432,825 |
TOTAL COMMON STOCKS (Cost $1,508,102,823) | 1,723,930,065 |
Money Market Funds - 7.5% |
| | | |
Fidelity Cash Central Fund, 5.34% (b) | 26,447,682 | | 26,447,682 |
Fidelity Securities Lending Cash Central Fund, 5.35% (b)(c) | 105,442,967 | | 105,442,967 |
TOTAL MONEY MARKET FUNDS (Cost $131,890,649) | 131,890,649 |
TOTAL INVESTMENT PORTFOLIO - 105.2% (Cost $1,639,993,472) | | 1,855,820,714 |
NET OTHER ASSETS - (5.2)% | | (92,433,587) |
NET ASSETS - 100% | $ 1,763,387,127 |
Legend |
(a) Non-income producing |
(b) Affiliated fund that is available only to investment companies and other accounts managed by Fidelity Investments. The rate quoted is the annualized seven-day yield of the fund at period end. A complete unaudited listing of the fund's holdings as of its most recent quarter end is available upon request. |
(c) Investment made with cash collateral received from securities on loan. |
(d) Security or a portion of the security is on loan at period end. |
Affiliated Central Funds |
Information regarding fiscal year to date income earned by the Fund from investments in Fidelity Central Funds is as follows: |
Fund | Income earned |
Fidelity Cash Central Fund | $ 1,426,737 |
Fidelity Securities Lending Cash Central Fund | 2,487,977 |
Total | $ 3,914,714 |
Annual Report
See accompanying notes which are an integral part of the financial statements.
Japan
Financial Statements
Statement of Assets and Liabilities
October 31, 2006 |
| | |
Assets | | |
Investment in securities, at value (including securities loaned of $100,306,245) - See accompanying schedule: Unaffiliated issuers (cost $1,508,102,823) | $ 1,723,930,065 | |
Fidelity Central Funds (cost $131,890,649) | 131,890,649 | |
Total Investments (cost $1,639,993,472) | | $ 1,855,820,714 |
Receivable for investments sold | | 23,087,232 |
Receivable for fund shares sold | | 2,480,496 |
Dividends receivable | | 5,162,583 |
Interest receivable | | 91,212 |
Other receivables | | 147,470 |
Total assets | | 1,886,789,707 |
| | |
Liabilities | | |
Payable for investments purchased | $ 12,805,752 | |
Payable for fund shares redeemed | 3,555,478 | |
Accrued management fee | 1,066,773 | |
Other affiliated payables | 386,593 | |
Other payables and accrued expenses | 145,017 | |
Collateral on securities loaned, at value | 105,442,967 | |
Total liabilities | | 123,402,580 |
| | |
Net Assets | | $ 1,763,387,127 |
Net Assets consist of: | | |
Paid in capital | | $ 1,495,620,454 |
Undistributed net investment income | | 1,292,579 |
Accumulated undistributed net realized gain (loss) on investments and foreign currency transactions | | 50,696,640 |
Net unrealized appreciation (depreciation) on investments and assets and liabilities in foreign currencies | | 215,777,454 |
Net Assets, for 104,622,034 shares outstanding | | $ 1,763,387,127 |
Net Asset Value, offering price and redemption price per share ($1,763,387,127 ÷ 104,622,034 shares) | | $ 16.85 |
Statement of Operations
Year ended October 31, 2006 |
| | |
Investment Income | | |
Dividends | | $ 17,314,764 |
Interest | | 49 |
Income from Fidelity Central Funds (including $2,487,977 from security lending) | | 3,914,714 |
| | 21,229,527 |
Less foreign taxes withheld | | (1,212,032) |
Total income | | 20,017,495 |
| | |
Expenses | | |
Management fee
Basic fee | $ 12,646,770 | |
Performance adjustment | 957,232 | |
Transfer agent fees | 3,844,396 | |
Accounting and security lending fees | 799,419 | |
Custodian fees and expenses | 430,960 | |
Independent trustees' compensation | 6,594 | |
Registration fees | 179,299 | |
Audit | 71,219 | |
Legal | 23,169 | |
Interest | 782 | |
Miscellaneous | 10,244 | |
Total expenses before reductions | 18,970,084 | |
Expense reductions | (368,433) | 18,601,651 |
Net investment income (loss) | | 1,415,844 |
Realized and Unrealized Gain (Loss) Net realized gain (loss) on: | | |
Investment securities: | | |
Unaffiliated issuers | 88,177,284 | |
Foreign currency transactions | 1,092,409 | |
Total net realized gain (loss) | | 89,269,693 |
Change in net unrealized appreciation (depreciation) on: Investment securities | 21,853,306 | |
Assets and liabilities in foreign currencies | 57,093 | |
Total change in net unrealized appreciation (depreciation) | | 21,910,399 |
Net gain (loss) | | 111,180,092 |
Net increase (decrease) in net assets resulting from operations | | $ 112,595,936 |
Annual Report
See accompanying notes which are an integral part of the financial statements.
Japan
Financial Statements - continued
Statement of Changes in Net Assets
| Year ended
October 31,
2006 | Year ended
October 31,
2005 |
Increase (Decrease) in Net Assets | | |
Operations | | |
Net investment income (loss) | $ 1,415,844 | $ 1,532,783 |
Net realized gain (loss) | 89,269,693 | 36,054,734 |
Change in net unrealized appreciation (depreciation) | 21,910,399 | 163,943,488 |
Net increase (decrease) in net assets resulting from operations | 112,595,936 | 201,531,005 |
Distributions to shareholders from net investment income | (1,655,031) | - |
Distributions to shareholders from net realized gain | (827,515) | - |
Total distributions | (2,482,546) | - |
Share transactions
Proceeds from sales of shares | 1,451,989,405 | 367,814,312 |
Reinvestment of distributions | 2,233,026 | - |
Cost of shares redeemed | (878,409,948) | (141,878,515) |
Net increase (decrease) in net assets resulting from share transactions | 575,812,483 | 225,935,797 |
Redemption fees | 2,315,810 | 225,720 |
Total increase (decrease) in net assets | 688,241,683 | 427,692,522 |
| | |
Net Assets | | |
Beginning of period | 1,075,145,444 | 647,452,922 |
End of period (including undistributed net investment income of $1,292,579 and undistributed net investment income of $1,531,765, respectively) | $ 1,763,387,127 | $ 1,075,145,444 |
Other Information Shares | | |
Sold | 83,073,775 | 27,168,421 |
Issued in reinvestment of distributions | 136,493 | - |
Redeemed | (50,278,685) | (11,129,707) |
Net increase (decrease) | 32,931,583 | 16,038,714 |
Financial Highlights
Years ended October 31, | 2006 | 2005 | 2004 | 2003 | 2002 |
Selected Per-Share Data | | | | | |
Net asset value, beginning of period | $ 15.00 | $ 11.63 | $ 11.19 | $ 8.25 | $ 9.67 |
Income from Investment Operations | | | | | |
Net investment income (loss) C | .01 | .03 | (.01) | - G | (.07) |
Net realized and unrealized gain (loss) | 1.85 | 3.34 | .45 | 2.93 | (1.37) |
Total from investment operations | 1.86 | 3.37 | .44 | 2.93 | (1.44) |
Distributions from net investment income | (.02) | - | (.01) | - | - |
Distributions from net realized gain | (.01) | - | - | - | - |
Total distributions | (.03) | - | (.01) | - | - |
Redemption fees added to paid in capital C | .02 | - G | .01 | .01 | .02 |
Net asset value, end of period | $ 16.85 | $ 15.00 | $ 11.63 | $ 11.19 | $ 8.25 |
Total Return A, B | 12.54% | 28.98% | 4.03% | 35.64% | (14.68)% |
Ratios to Average Net Assets D, F | | | | | |
Expenses before reductions | 1.08% | 1.03% | 1.04% | 1.03% | 1.50% |
Expenses net of fee waivers, if any | 1.08% | 1.03% | 1.04% | 1.03% | 1.50% |
Expenses net of all reductions | 1.05% | 1.02% | 1.04% | 1.03% | 1.50% |
Net investment income (loss) | .08% | .20% | (.04)% | (.04)% | (.77)% |
Supplemental Data | | | | | |
Net assets, end of period (000 omitted) | $ 1,763,387 | $ 1,075,145 | $ 647,453 | $ 529,352 | $ 283,293 |
Portfolio turnover rate E | 78% | 74% | 99% | 86% | 66% |
A Total returns would have been lower had certain expenses not been reduced during the periods shown. B Total returns do not include the effect of the former sales charges. C Calculated based on average shares outstanding during the period. D Fees and expenses of the underlying Fidelity Central Funds are not included in the Fund's expense ratio. The Fund indirectly bears its proportionate share of the expense of any underlying Fidelity Central Funds. E Amount does not include the portfolio activity of any underlying Fidelity Central Funds. F Expense ratios reflect operating expenses of the Fund. Expenses before reductions do not reflect amounts reimbursed by the investment adviser or reductions from brokerage service arrangements or other expense offset arrangements and do not represent the amount paid by the Fund during periods when reimbursements or reductions occur. Expenses net of fee waivers reflect expenses after reimbursement by the investment adviser but prior to reductions from brokerage service arrangements or other expense offset arrangements. Expenses net of all reductions represent the net expenses paid by the Fund. G Amount represents less than $.01 per share. |
Annual Report
See accompanying notes which are an integral part of the financial statements.
Japan Smaller Companies
Performance: The Bottom Line
Average annual total return reflects the change in the value of an investment, assuming reinvestment of the fund's dividend income and capital gains (the profits earned upon the sale of securities that have grown in value) and assuming a constant rate of performance each year. The $10,000 table and the fund's returns do not reflect the deduction of taxes that a shareholder would pay on fund distributions or the redemption of fund shares. During periods of reimbursement by Fidelity, a fund's total returns will be greater than it would be had the reimbursement not occurred. How a fund did yesterday is no guarantee of how it will do tomorrow.
Average Annual Total Returns
Periods ended
October 31, 2006 | Past 1
year | Past 5
years | Past 10 years |
Fidelity Japan Smaller Companies Fund | -0.36% | 15.46% | 9.16% |
$10,000 Over Life of Fund
Let's say hypothetically that $10,000 was invested in Fidelity Japan Smaller Companies Fund on October 31, 1996. The chart shows how the value of your investment would have changed, and also shows how the Russell/Nomura Small Cap Index performed over the same period.
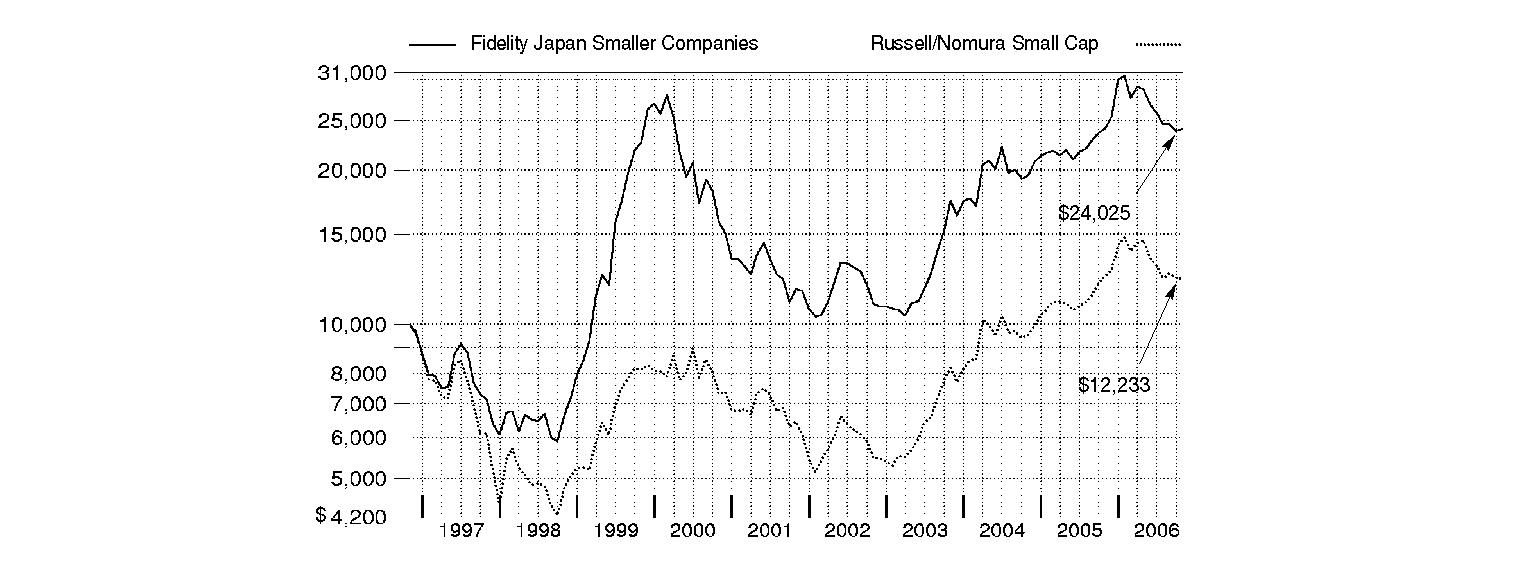
Annual Report
Japan Smaller Companies
Management's Discussion of Fund Performance
Comments from Kenichi Mizushita, Portfolio Manager of Fidelity® Japan Smaller Companies Fund
International equity markets as a whole outpaced their U.S. counterparts for the 12 months ending October 31, 2006 - partly as a result of favorable currency exchanges that boosted returns for U.S. investors. The Morgan Stanley Capital InternationalSM Europe, Australasia, Far East (MSCI® EAFE®) Index - a gauge of developed stock markets outside the United States and Canada - gained 27.72% during that time. European markets benefited from solid corporate profit growth and attractive dividends, which helped the MSCI Europe index advance 31.95%. Strong performing Latin American and Asian emerging markets drove the MSCI Emerging Markets index to a lofty 35.42% return. Japan was somewhat of an exception to the generally stellar foreign market performance after struggling in the middle part of the period. Still, its earlier gains helped the Tokyo Stock Exchange Stock Price Index (TOPIX) - - a benchmark of the largest and better-established stocks traded on the Tokyo Stock Exchange - rise 12.47% overall. Natural-resources-rich Canada also struggled over the final six months as energy prices fell, but the S&P/TSX Composite Index managed a 12-month return of 28.21%.
During the past year, the fund returned -0.36%, outpacing the Russell/Nomura Small CapTM Index, which declined 1.27%. The fund's stock selection in the financials sector helped performance versus the index, led by its holdings in real estate developers, whose share prices rose on growing demand for housing and office space. Some good picks in technology also boosted returns. Looking at individual contributors, Token Corporation is a Nagoya-based builder of condominiums, apartments and houses. The company's construction-order growth was very strong, its gross profit margin improved and its stock did well. Sumco is engaged primarily in the manufacture of silicon wafers for the semiconductor industry. Sales expanded steadily, and the company was able to raise prices, benefiting its stock performance. The fund was hurt by weak stock selection in industrials, software/services and consumer services. In terms of individual detractors, Rex Holdings, an operator of restaurant chains and a convenience store franchise, saw its share price decline sharply after revising earnings projections downward for 2006. Sammy NetWorks provides Internet games and entertainment through mobile phones. In addition to being pulled down along with other Internet-related stocks, a disappointing near-term earnings outlook weighed on Sammy's share price. As we were not convinced that its new businesses could give impetus to the company's growth momentum, I sold the stock.
The views expressed above reflect those of the portfolio manager(s) only through the end of the period as stated on the cover of this report and do not necessarily represent the views of Fidelity or any other person in the Fidelity organization. Any such views are subject to change at any time based upon market or other conditions and Fidelity disclaims any responsibility to update such views. These views may not be relied on as investment advice and, because investment decisions for a Fidelity fund are based on numerous factors, may not be relied on as an indication of trading intent on behalf of any Fidelity fund.
Annual Report
Japan Smaller Companies
Investment Changes
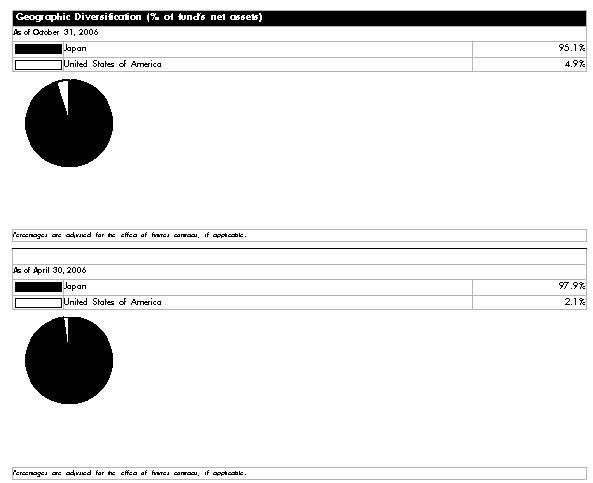
Asset Allocation |
| % of fund's
net assets | % of fund's net assets
6 months ago |
Stocks | 95.1 | 97.9 |
Short-Term Investments and
Net Other Assets | 4.9 | 2.1 |
Top Ten Stocks as of October 31, 2006 |
| % of fund's net assets | % of fund's net assets
6 months ago |
Token Corp. (Household Durables) | 2.6 | 1.3 |
Yamada Denki Co. Ltd. (Specialty Retail) | 2.3 | 1.8 |
Furukawa Electric Co. Ltd. (Electrical Equipment) | 2.2 | 1.1 |
Fujikura Ltd. (Electrical Equipment) | 2.1 | 0.0 |
Konica Minolta Holdings, Inc. (Office Electronics) | 2.0 | 1.7 |
Sumitomo Realty & Development Co. Ltd. (Real Estate Management & Development) | 2.0 | 1.2 |
C. Uyemura & Co. Ltd. (Chemicals) | 1.8 | 0.8 |
Murata Manufacturing Co. Ltd. (Electronic Equipment & Instruments) | 1.7 | 1.4 |
Sumco Corp. (Semiconductors & Semiconductor Equipment) | 1.7 | 1.5 |
Hitachi Construction Machinery Co. Ltd. (Machinery) | 1.7 | 2.3 |
| 20.1 | |
Market Sectors as of October 31, 2006 |
| % of fund's net assets | % of fund's net assets
6 months ago |
Information Technology | 24.7 | 24.5 |
Industrials | 23.0 | 24.6 |
Consumer Discretionary | 22.5 | 26.7 |
Financials | 9.6 | 7.0 |
Materials | 7.3 | 9.6 |
Health Care | 3.3 | 2.5 |
Consumer Staples | 3.2 | 2.6 |
Energy | 1.0 | 0.0 |
Telecommunication Services | 0.5 | 0.4 |
Annual Report
Japan Smaller Companies
Investments October 31, 2006
Showing Percentage of Net Assets
Common Stocks - 95.1% |
| Shares | | Value (Note 1) |
CONSUMER DISCRETIONARY - 22.5% |
Auto Components - 5.8% |
Alpha Corp. (d) | 50,500 | | $ 1,446,435 |
F-Tech, Inc. | 255,400 | | 5,721,170 |
Fine Sinter Co. Ltd. | 417,000 | | 1,982,319 |
Fuji Kiko Co. Ltd. (d) | 805,000 | | 2,202,462 |
H-One Co. Ltd. | 193,600 | | 2,714,638 |
NGK Spark Plug Co. Ltd. | 397,000 | | 8,367,006 |
NHK Spring Co. Ltd. | 1,717,000 | | 18,981,542 |
Nippon Seiki Co. Ltd. | 747,000 | | 17,851,104 |
Nissin Kogyo Co. Ltd. | 137,900 | | 3,301,300 |
NOK Corp. | 154,000 | | 4,042,237 |
Toyota Industries Corp. | 96,700 | | 4,216,570 |
| | 70,826,783 |
Automobiles - 1.0% |
Mazda Motor Corp. | 1,347,000 | | 9,109,756 |
Yachiyo Industry Co. Ltd. (d) | 136,800 | | 3,163,851 |
| | 12,273,607 |
Distributors - 0.1% |
Jin Co. Ltd. (d) | 100,000 | | 1,273,940 |
Diversified Consumer Services - 0.5% |
Best Bridal, Inc. | 849 | | 5,879,703 |
Hotels, Restaurants & Leisure - 2.8% |
Rex Holdings Co. Ltd. (d) | 8,500 | | 14,752,908 |
Round One Corp. (d) | 882 | | 3,604,617 |
Zensho Co. Ltd. (d) | 1,419,508 | | 16,445,224 |
| | 34,802,749 |
Household Durables - 3.2% |
Mitsui Home Co. Ltd. | 233,000 | | 1,721,204 |
Sohken Homes Co. Ltd. (d) | 1,029 | | 1,583,618 |
Sumitomo Forestry Co. Ltd. | 335,000 | | 3,677,668 |
Token Corp. (d) | 419,090 | | 31,639,573 |
| | 38,622,063 |
Internet & Catalog Retail - 0.2% |
Felissimo Corp. (d) | 87,300 | | 2,410,901 |
Leisure Equipment & Products - 0.1% |
Endo Manufacturing Co. Ltd. | 281,000 | | 2,003,711 |
Media - 0.7% |
Gentosha, Inc. | 14 | | 57,934 |
Toei Co. Ltd. | 1,223,000 | | 8,187,492 |
| | 8,245,426 |
Specialty Retail - 6.5% |
Alpen Co. Ltd. | 213,300 | | 6,419,426 |
Bic Camera, Inc. | 60 | | 83,618 |
Hikari Tsushin, Inc. (d) | 183,100 | | 9,643,434 |
Meganesuper Co. Ltd. | 104,500 | | 873,812 |
Nishimatsuya Chain Co. Ltd. (d) | 772,700 | | 15,095,927 |
Shimachu Co. Ltd. | 130,900 | | 3,749,273 |
USS Co. Ltd. | 244,740 | | 15,526,427 |
Yamada Denki Co. Ltd. | 275,400 | | 27,408,141 |
| | 78,800,058 |
|
| Shares | | Value (Note 1) |
Textiles, Apparel & Luxury Goods - 1.6% |
Asics Corp. | 891,000 | | $ 11,937,389 |
Japan Vilene Co. Ltd. | 210,000 | | 1,283,772 |
Seiren Co. Ltd. (d) | 559,700 | | 6,139,664 |
| | 19,360,825 |
TOTAL CONSUMER DISCRETIONARY | | 274,499,766 |
CONSUMER STAPLES - 3.2% |
Food & Staples Retailing - 2.5% |
Cosmos Pharmaceutical Corp. (d) | 310,700 | | 7,995,956 |
Create SD Co. Ltd. | 105,100 | | 1,716,322 |
Daikokutenbussan Co. Ltd. | 242,400 | | 5,025,821 |
Kirindo Co. Ltd. | 280,700 | | 2,416,766 |
Valor Co. Ltd. (d) | 890,100 | | 13,089,706 |
| | 30,244,571 |
Food Products - 0.7% |
Ariake Japan Co. Ltd. (d) | 66,800 | | 1,227,941 |
Frente Co. Ltd. | 179,500 | | 3,376,368 |
Hokuto Corp. (d) | 242,600 | | 3,988,713 |
| | 8,593,022 |
TOTAL CONSUMER STAPLES | | 38,837,593 |
ENERGY - 1.0% |
Energy Equipment & Services - 0.4% |
Shinko Plantech Co. Ltd. | 584,000 | | 4,388,988 |
Oil, Gas & Consumable Fuels - 0.6% |
AOC Holdings, Inc. | 220,800 | | 4,002,189 |
Japan Petroleum Exploration Co. Ltd. (d) | 64,000 | | 3,726,402 |
| | 7,728,591 |
TOTAL ENERGY | | 12,117,579 |
FINANCIALS - 9.6% |
Capital Markets - 0.6% |
Asset Managers Co. Ltd. (d) | 1,855 | | 5,075,240 |
Risa Partners, Inc. (d) | 571 | | 2,660,696 |
| | 7,735,936 |
Commercial Banks - 3.5% |
Bank of Yokohama Ltd. | 1,039,000 | | 8,030,575 |
Chiba Bank Ltd. | 1,030,000 | | 9,229,139 |
Hiroshima Bank Ltd. | 824,000 | | 4,924,556 |
Kansai Urban Banking Corp. (d) | 642,000 | | 2,832,353 |
The Keiyo Bank Ltd. | 1,347,000 | | 7,727,745 |
Tokyo Tomin Bank Ltd. (d) | 228,700 | | 9,307,559 |
| | 42,051,927 |
Real Estate Management & Development - 5.4% |
Arealink Co. Ltd. | 2,694 | | 1,577,796 |
Daibiru Corp. | 216,900 | | 2,531,366 |
Heiwa Real Estate Co. Ltd. (d) | 503,000 | | 3,375,983 |
Joint Corp. | 254,600 | | 10,013,338 |
Common Stocks - continued |
| Shares | | Value (Note 1) |
FINANCIALS - continued |
Real Estate Management & Development - continued |
Kenedix, Inc. | 1,215 | | $ 6,825,026 |
KK daVinci Advisors (a)(d) | 1,435 | | 1,570,452 |
NTT Urban Development Co. | 616 | | 5,319,426 |
Sankei Building Co. Ltd. | 223,500 | | 2,151,684 |
Sumitomo Realty & Development Co. Ltd. | 717,000 | | 23,785,569 |
Sun Frontier Fudousan Co. Ltd. (d) | 1,949 | | 4,449,239 |
Suruga Corp. | 31,600 | | 2,474,829 |
Toc Co. Ltd. | 280,500 | | 1,530,087 |
Tokyu Community Corp. | 18,300 | | 558,576 |
| | 66,163,371 |
Thrifts & Mortgage Finance - 0.1% |
Atrium Co. Ltd. | 22,600 | | 770,982 |
TOTAL FINANCIALS | | 116,722,216 |
HEALTH CARE - 3.3% |
Health Care Equipment & Supplies - 2.5% |
Hogy Medical Co. | 308,800 | | 12,488,236 |
Nakanishi, Inc. | 29,500 | | 3,591,655 |
Sysmex Corp. (d) | 344,600 | | 13,877,104 |
| | 29,956,995 |
Health Care Providers & Services - 0.1% |
I'rom Co. Ltd. | 98 | | 35,275 |
Tokai Corp. | 118,800 | | 1,564,227 |
| | 1,599,502 |
Life Sciences Tools & Services - 0.4% |
Shin Nippon Biomedical Laboratories Ltd. (d) | 272,100 | | 4,494,675 |
Soiken, Inc. (d) | 685 | | 978,069 |
| | 5,472,744 |
Pharmaceuticals - 0.3% |
Sawai Pharmaceutical Co. Ltd. (d) | 46,100 | | 2,132,362 |
Towa Pharmaceutical Co. Ltd. (d) | 34,100 | | 935,884 |
| | 3,068,246 |
TOTAL HEALTH CARE | | 40,097,487 |
INDUSTRIALS - 23.0% |
Air Freight & Logistics - 1.2% |
I-LOGISTICS Corp. | 34,000 | | 99,709 |
Kintetsu World Express, Inc. | 188,200 | | 4,336,517 |
SBS Co. Ltd. (d) | 1,732 | | 5,034,884 |
Yusen Air & Sea Service Co. Ltd. | 227,900 | | 5,251,287 |
| | 14,722,397 |
Building Products - 0.6% |
Comany, Inc. | 348,100 | | 4,690,541 |
Wavelock Holdings Co. Ltd. (d) | 305,700 | | 2,025,629 |
| | 6,716,170 |
|
| Shares | | Value (Note 1) |
Commercial Services & Supplies - 2.3% |
Career Design Center Co. Ltd. (e) | 3,292 | | $ 9,006,840 |
Certo Corp. | 63,600 | | 2,098,974 |
Gakujo Co. Ltd. | 513,200 | | 6,274,590 |
Intelligence Ltd. (d) | 2,478 | | 5,381,430 |
Nihonwasou Holdings, Inc. (d) | 867 | | 867,297 |
Relo Holdings Corp. | 13,300 | | 272,345 |
TFP Consulting Group Co. Ltd. | 1,362 | | 4,331,943 |
| | 28,233,419 |
Construction & Engineering - 2.0% |
Chiyoda Corp. | 199,000 | | 3,607,045 |
COMSYS Holdings Corp. | 736,000 | | 7,790,424 |
JGC Corp. | 236,000 | | 3,674,385 |
Kyowa Exeo Corp. | 677,000 | | 6,315,040 |
Meisei Industrial Co. Ltd. (a)(d) | 633,000 | | 3,247,264 |
| | 24,634,158 |
Electrical Equipment - 5.4% |
Endo Lighting Corp. | 424,500 | | 4,028,685 |
Fujikura Ltd. | 2,375,000 | | 25,402,917 |
Furukawa Electric Co. Ltd. (d) | 3,804,000 | | 27,157,491 |
Iwabuchi Corp. | 238,000 | | 1,383,721 |
Nippon Carbon Co. Ltd. | 426,000 | | 1,668,160 |
Sansha Electric Manufacturing Co. Ltd. | 85,000 | | 737,645 |
Sumitomo Wiring Systems Ltd. | 331,000 | | 5,716,656 |
| | 66,095,275 |
Machinery - 8.2% |
Hitachi Construction Machinery Co. Ltd. | 839,900 | | 19,963,424 |
Ishikawajima-Harima Heavy Industries Co. Ltd. (d) | 4,462,000 | | 15,031,020 |
JTEKT Corp. | 548,300 | | 11,415,104 |
Mitsui Engineering & Shipbuilding Co. | 4,035,000 | | 15,041,553 |
Miyachi Corp. | 78,000 | | 1,377,138 |
Nihon Trim Co. Ltd. (d) | 45,700 | | 2,199,821 |
Nitchitsu Co. Ltd. | 48,000 | | 164,159 |
Nitta Corp. | 303,100 | | 5,558,734 |
NTN Corp. | 1,425,000 | | 11,732,858 |
Obara Corp. (d) | 44,250 | | 1,736,555 |
Organo Corp. | 174,000 | | 1,640,920 |
OSG Corp. | 487,700 | | 7,188,738 |
Sumitomo Heavy Industries Ltd. | 374,000 | | 3,204,070 |
Taiho Kogyo Co. Ltd. | 115,700 | | 1,482,851 |
TCM Corp. (d) | 595,000 | | 1,699,128 |
| | 99,436,073 |
Road & Rail - 1.0% |
Hamakyorex Co. Ltd. (d) | 172,400 | | 4,584,166 |
Ichinen Co. Ltd. | 880,500 | | 7,460,461 |
| | 12,044,627 |
Trading Companies & Distributors - 2.3% |
Itochu Corp. | 1,997,000 | | 15,913,168 |
Common Stocks - continued |
| Shares | | Value (Note 1) |
INDUSTRIALS - continued |
Trading Companies & Distributors - continued |
Marubeni Corp. | 2,204,000 | | $ 11,287,586 |
Meiji Electric Industries Co. Ltd. | 34,300 | | 929,643 |
| | 28,130,397 |
TOTAL INDUSTRIALS | | 280,012,516 |
INFORMATION TECHNOLOGY - 24.7% |
Electronic Equipment & Instruments - 13.5% |
A&D Co. Ltd. | 310,900 | | 6,658,726 |
Canon Electronics, Inc. | 151,200 | | 6,231,054 |
Excel Co. Ltd. | 124,100 | | 2,270,640 |
Forval Corp. | 217,200 | | 928,523 |
Hamamatsu Photonics KK (d) | 432,400 | | 12,495,828 |
Hioki EE Corp. (d) | 46,200 | | 1,422,025 |
Hokuriku Electric Industry (d) | 1,837,000 | | 5,245,879 |
Honda Tsushin Kogyo Co. Ltd. (d) | 216,300 | | 1,568,249 |
Ibiden Co. Ltd. | 311,000 | | 16,299,847 |
Meiko Electronics Co. Ltd. (d) | 458,700 | | 18,432,713 |
Murata Manufacturing Co. Ltd. | 302,600 | | 21,163,373 |
Nagano Keiki Co. Ltd. (d) | 268,220 | | 3,545,384 |
Nidec Corp. | 100,000 | | 7,652,189 |
Nippon Electric Glass Co. Ltd. | 670,000 | | 14,435,705 |
Optoelectronics Co. Ltd. (d) | 97,400 | | 2,573,239 |
Seikoh Giken Co. Ltd. | 5,600 | | 157,045 |
Shibaura Electronics Co. Ltd. | 91,500 | | 1,623,311 |
Shizuki Electric Co., Inc. | 302,000 | | 1,316,861 |
Sokkia Co. Ltd. | 158,000 | | 628,164 |
Star Micronics Co. Ltd. (d) | 775,100 | | 14,413,839 |
Sunx Ltd. | 1,489,600 | | 15,894,501 |
Yokogawa Electric Corp. | 700,000 | | 9,605,849 |
| | 164,562,944 |
Internet Software & Services - 1.4% |
Acca Networks Co. Ltd. (a)(d) | 258 | | 333,088 |
Telewave, Inc. (d) | 8,287 | | 16,508,816 |
| | 16,841,904 |
IT Services - 2.3% |
Bit-isle, Inc. | 264 | | 1,327,223 |
CAC Corp. | 584,500 | | 5,477,189 |
Hitachi Systems & Services Ltd. | 136,000 | | 2,703,488 |
|
| Shares | | Value (Note 1) |
INTEC Holdings Ltd. (a) | 370,600 | | $ 4,905,000 |
Otsuka Corp. (d) | 128,800 | | 14,139,809 |
| | 28,552,709 |
Office Electronics - 2.5% |
Canon Fintech, Inc. | 342,200 | | 6,188,039 |
Konica Minolta Holdings, Inc. (d) | 1,832,000 | | 24,403,695 |
| | 30,591,734 |
Semiconductors & Semiconductor Equipment - 4.6% |
Elpida Memory, Inc. (a) | 389,200 | | 18,168,879 |
Furuya Metal Co. Ltd. | 5,500 | | 935,790 |
Micronics Japan Co. Ltd. (d) | 549,900 | | 15,609,337 |
Sumco Corp. (d) | 290,400 | | 20,657,730 |
| | 55,371,736 |
Software - 0.4% |
Alpha Systems, Inc. (d) | 94,300 | | 2,781,592 |
Cybernet Systems Co. Ltd. (d) | 2,592 | | 1,914,747 |
| | 4,696,339 |
TOTAL INFORMATION TECHNOLOGY | | 300,617,366 |
MATERIALS - 7.3% |
Chemicals - 5.5% |
C. Uyemura & Co. Ltd. | 329,700 | | 21,762,005 |
Ebara-Udylite Co. Ltd. | 71,500 | | 2,072,375 |
Lintec Corp. | 834,300 | | 19,045,666 |
Mitsubishi Rayon Co. Ltd. | 715,000 | | 4,511,543 |
Nippon Parkerizing Co. Ltd. | 147,000 | | 2,595,375 |
Osaka Organic Chemical Industry Ltd. | 234,600 | | 1,498,343 |
Soken Chemical & Engineer Co. Ltd. (d) | 57,600 | | 1,570,999 |
Taiyo Kagaku | 328,800 | | 3,359,405 |
Takiron Co. Ltd. | 609,000 | | 2,140,039 |
Tohcello Co. Ltd. (d) | 640,000 | | 8,180,575 |
| | 66,736,325 |
Containers & Packaging - 0.3% |
Fuji Seal International, Inc. (d) | 131,700 | | 3,490,681 |
Metals & Mining - 1.5% |
Furukawa-Sky Aluminium Corp. | 1,030,000 | | 4,861,149 |
Sanyo Special Steel Co. Ltd. | 405,000 | | 2,697,461 |
Sumitomo Metal Mining Co. Ltd. | 497,000 | | 6,531,199 |
Tokyo Steel Manufacturing Co. Ltd. | 310,400 | | 4,755,787 |
| | 18,845,596 |
TOTAL MATERIALS | | 89,072,602 |
TELECOMMUNICATION SERVICES - 0.5% |
Diversified Telecommunication Services - 0.5% |
Mitsui & Associates Telepark Corp. (d) | 2,250 | | 5,540,356 |
TOTAL COMMON STOCKS (Cost $898,640,374) | 1,157,517,481 |
Money Market Funds - 13.8% |
| Shares | | Value (Note 1) |
Fidelity Cash Central Fund, 5.34% (b) | 34,350,920 | | $ 34,350,920 |
Fidelity Securities Lending Cash Central Fund, 5.35% (b)(c) | 134,186,435 | | 134,186,435 |
TOTAL MONEY MARKET FUNDS (Cost $168,537,355) | 168,537,355 |
TOTAL INVESTMENT PORTFOLIO - 108.9% (Cost $1,067,177,729) | | 1,326,054,836 |
NET OTHER ASSETS - (8.9)% | | (108,815,760) |
NET ASSETS - 100% | $ 1,217,239,076 |
Legend |
(a) Non-income producing |
(b) Affiliated fund that is available only to investment companies and other accounts managed by Fidelity Investments. The rate quoted is the annualized seven-day yield of the fund at period end. A complete unaudited listing of the fund's holdings as of its most recent quarter end is available upon request. |
(c) Investment made with cash collateral received from securities on loan. |
(d) Security or a portion of the security is on loan at period end. |
(e) Affiliated company |
Affiliated Central Funds |
Information regarding fiscal year to date income earned by the Fund from investments in Fidelity Central Funds is as follows: |
Fund | Income earned |
Fidelity Cash Central Fund | $ 2,144,641 |
Fidelity Securities Lending Cash Central Fund | 4,456,287 |
Total | $ 6,600,928 |
Other Affiliated Issuers |
An affiliated company is a company in which the fund has ownership of at least 5% of the voting securities. Fiscal year to date transactions with companies which are or were affiliates are as follows: |
Affiliate | Value,
beginning of period | Purchases | Sales
Proceeds | Dividend
Income | Value,
end of
period |
Career Design Center Co. Ltd. | $ 3,884,084 | $ 4,478,113 | $ 1,246,702 | $ 49,925 | $ 9,006,840 |
Annual Report
See accompanying notes which are an integral part of the financial statements.
Japan Smaller Companies
Financial Statements
Statement of Assets and Liabilities
October 31, 2006 |
| | |
Assets | | |
Investment in securities, at value (including securities loaned of $127,555,729) - See accompanying schedule: Unaffiliated issuers (cost $889,912,214) | $ 1,148,510,641 | |
Fidelity Central Funds (cost $168,537,355) | 168,537,355 | |
Other affiliated issuers (cost $8,728,160) | 9,006,840 | |
Total Investments (cost $1,067,177,729) | | $ 1,326,054,836 |
Cash | | 1,303 |
Receivable for investments sold | | 30,426,108 |
Receivable for fund shares sold | | 365,909 |
Dividends receivable | | 3,568,927 |
Interest receivable | | 135,239 |
Other receivables | | 214,192 |
Total assets | | 1,360,766,514 |
| | |
Liabilities | | |
Payable for investments purchased | $ 3,980,574 | |
Payable for fund shares redeemed | 4,251,741 | |
Accrued management fee | 729,386 | |
Other affiliated payables | 265,519 | |
Other payables and accrued expenses | 113,783 | |
Collateral on securities loaned, at value | 134,186,435 | |
Total liabilities | | 143,527,438 |
| | |
Net Assets | | $ 1,217,239,076 |
Net Assets consist of: | | |
Paid in capital | | $ 885,001,413 |
Undistributed net investment income | | 1,482,630 |
Accumulated undistributed net realized gain (loss) on investments and foreign currency transactions | | 71,929,405 |
Net unrealized appreciation (depreciation) on investments and assets and liabilities in foreign currencies | | 258,825,628 |
Net Assets, for 90,656,364 shares outstanding | | $ 1,217,239,076 |
Net Asset Value, offering price and redemption price per share ($1,217,239,076 ÷ 90,656,364 shares) | | $ 13.43 |
Statement of Operations
Year ended October 31, 2006 |
| | |
Investment Income | | |
Dividends (including $49,925 received from other affiliated issuers) | | $ 12,915,489 |
Interest | | 76 |
Income from Fidelity Central Funds (including $4,456,287 from security lending) | | 6,600,928 |
| | 19,516,493 |
Less foreign taxes withheld | | (904,637) |
Total income | | 18,611,856 |
| | |
Expenses | | |
Management fee | $ 12,227,864 | |
Transfer agent fees | 3,315,117 | |
Accounting and security lending fees | 786,938 | |
Custodian fees and expenses | 825,478 | |
Independent trustees' compensation | 6,662 | |
Registration fees | 107,421 | |
Audit | 61,904 | |
Legal | 26,177 | |
Interest | 3,918 | |
Miscellaneous | 13,993 | |
Total expenses before reductions | 17,375,472 | |
Expense reductions | (246,675) | 17,128,797 |
Net investment income (loss) | | 1,483,059 |
Realized and Unrealized Gain (Loss) Net realized gain (loss) on: | | |
Investment securities: | | |
Unaffiliated issuers | 72,623,797 | |
Other affiliated issuers | (454,174) | |
Foreign currency transactions | 433,477 | |
Total net realized gain (loss) | | 72,603,100 |
Change in net unrealized appreciation (depreciation) on: Investment securities | (136,416,727) | |
Assets and liabilities in foreign currencies | 29,272 | |
Total change in net unrealized appreciation (depreciation) | | (136,387,455) |
Net gain (loss) | | (63,784,355) |
Net increase (decrease) in net assets resulting from operations | | $ (62,301,296) |
Annual Report
See accompanying notes which are an integral part of the financial statements.
Japan Smaller Companies
Financial Statements - continued
Statement of Changes in Net Assets
| Year ended
October 31,
2006 | Year ended
October 31,
2005 |
Increase (Decrease) in Net Assets | | |
Operations | | |
Net investment income (loss) | $ 1,483,059 | $ 2,833,069 |
Net realized gain (loss) | 72,603,100 | 104,804,644 |
Change in net unrealized appreciation (depreciation) | (136,387,455) | 160,290,320 |
Net increase (decrease) in net assets resulting from operations | (62,301,296) | 267,928,033 |
Distributions to shareholders from net investment income | (2,096,615) | (1,062,984) |
Distributions to shareholders from net realized gain | (87,009,291) | (5,323,788) |
Total distributions | (89,105,906) | (6,386,772) |
Share transactions
Proceeds from sales of shares | 937,781,955 | 408,744,851 |
Reinvestment of distributions | 81,250,595 | 5,778,163 |
Cost of shares redeemed | (1,059,732,471) | (549,007,259) |
Net increase (decrease) in net assets resulting from share transactions | (40,699,921) | (134,484,245) |
Redemption fees | 2,673,266 | 524,593 |
Total increase (decrease) in net assets | (189,433,857) | 127,581,609 |
| | |
Net Assets | | |
Beginning of period | 1,406,672,933 | 1,279,091,324 |
End of period (including undistributed net investment income of $1,482,630 and undistributed net investment income of $2,487,857, respectively) | $ 1,217,239,076 | $ 1,406,672,933 |
Other Information Shares | | |
Sold | 57,660,133 | 31,449,513 |
Issued in reinvestment of distributions | 5,471,421 | 493,860 |
Redeemed | (71,185,943) | (43,664,409) |
Net increase (decrease) | (8,054,389) | (11,721,036) |
Financial Highlights
Years ended October 31, | 2006 | 2005 | 2004 | 2003 | 2002 |
Selected Per-Share Data | | | | | |
Net asset value, beginning of period | $ 14.25 | $ 11.58 | $ 10.35 | $ 6.52 | $ 6.97 |
Income from Investment Operations | | | | | |
Net investment income (loss) C | .01 | .03 | .01 | .01 | - G |
Net realized and unrealized gain (loss) | - G | 2.69 | 1.20 | 3.81 | (.47) |
Total from investment operations | .01 | 2.72 | 1.21 | 3.82 | (.47) |
Distributions from net investment income | (.02) | (.01) | (.02) | - | - |
Distributions from net realized gain | (.83) | (.05) | - | - | - |
Total distributions | (.85) | (.06) | (.02) | - | - |
Redemption fees added to paid in capital C | .02 | .01 | .04 | .01 | .02 |
Net asset value, end of period | $ 13.43 | $ 14.25 | $ 11.58 | $ 10.35 | $ 6.52 |
Total Return A, B | (.36)% | 23.69% | 12.12% | 58.74% | (6.46)% |
Ratios to Average Net Assets D, F | | | | | |
Expenses before reductions | 1.02% | 1.02% | 1.04% | 1.12% | 1.19% |
Expenses net of fee waivers, if any | 1.02% | 1.02% | 1.04% | 1.12% | 1.19% |
Expenses net of all reductions | 1.01% | 1.01% | 1.04% | 1.12% | 1.19% |
Net investment income (loss) | .09% | .22% | .11% | .19% | (.06)% |
Supplemental Data | | | | | |
Net assets, end of period (000 omitted) | $ 1,217,239 | $ 1,406,673 | $ 1,279,091 | $ 931,728 | $ 408,611 |
Portfolio turnover rate E | 98% | 65% | 57% | 43% | 50% |
A Total returns would have been lower had certain expenses not been reduced during the periods shown. B Total returns do not include the effect of the former sales charges. C Calculated based on average shares outstanding during the period. D Fees and expenses of the underlying Fidelity Central Funds are not included in the Fund's expense ratio. The Fund indirectly bears its proportionate share of the expense of any underlying Fidelity Central Funds. E Amount does not include the portfolio activity of any underlying Fidelity Central Funds. F Expense ratios reflect operating expenses of the Fund. Expenses before reductions do not reflect amounts reimbursed by the investment adviser or reductions from brokerage service arrangements or other expense offset arrangements and do not represent the amount paid by the Fund during periods when reimbursements or reductions occur. Expenses net of fee waivers reflect expenses after reimbursement by the investment adviser but prior to reductions from brokerage service arrangements or other expense offset arrangements. Expenses net of all reductions represent the net expenses paid by the Fund. G Amount represents less than $.01 per share. |
Annual Report
See accompanying notes which are an integral part of the financial statements.
Latin America
Performance: The Bottom Line
Average annual total return reflects the change in the value of an investment, assuming reinvestment of the fund's dividend income and capital gains (the profits earned upon the sale of securities that have grown in value) and assuming a constant rate of performance each year. The $10,000 table and the fund's returns do not reflect the deduction of taxes that a shareholder would pay on fund distributions or the redemption of fund shares. During periods of reimbursement by Fidelity, a fund's total returns will be greater than it would be had the reimbursement not occurred. How a fund did yesterday is no guarantee of how it will do tomorrow.
Average Annual Total Returns
Periods ended
October 31, 2006 | Past 1
year | Past 5
years | Past 10
years |
Fidelity Latin America Fund | 43.57% | 34.24% | 14.45% |
$10,000 Over 10 Years
Let's say hypothetically that $10,000 was invested in Fidelity Latin America Fund on October 31, 1996. The chart shows how the value of your investment would have changed, and also shows how the MSCI EM - Latin America Index performed over the same period.
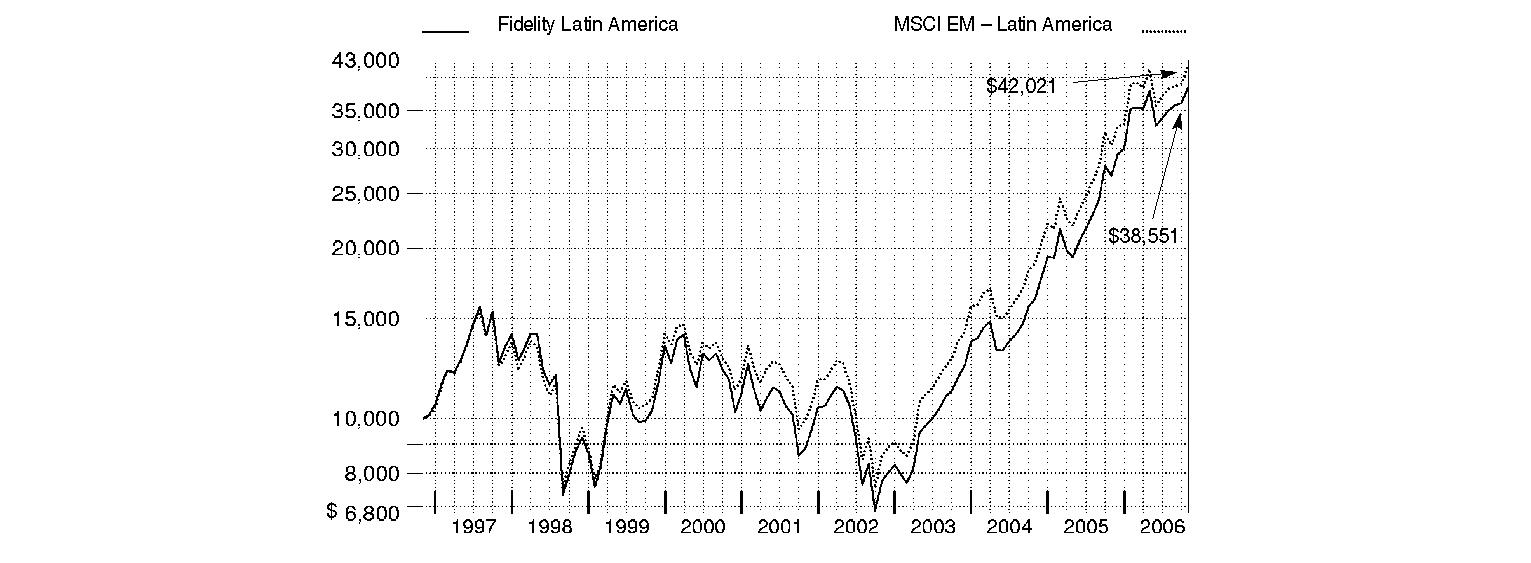
Annual Report
Latin America
Management's Discussion of Fund Performance
Comments from Brent Bottamini and Adam Kutas, Co-Portfolio Managers of Fidelity® Latin America Fund
The 12-month period ending October 31, 2006, was volatile for emerging-markets stocks. On the whole, they rose sharply early on thanks to steady global economic growth, plunged at the period's midpoint after inflation concerns grew, and rallied in the final quarter when evidence suggested inflation fears were overblown. The performance benchmark of emerging markets - the Morgan Stanley Capital InternationalSM (MSCI) Emerging Markets Index - gained 35.42% for the one-year time frame, but lost 1.71% in the final six months of the period. If the benchmark can hold on to these gains through the end of 2006, it would mark the fourth consecutive calendar year that it's put up a double-digit positive return. But anything can happen given the volatility inherent in this asset class. On a country-level basis for the past year, Indonesia, Hong Kong, China and Russia were among the best performers. Israel was weak, however, pressured by military conflicts in the region, while Argentina was one of the only benchmark constituents with a negative return.
For the 12 months ending October 31, 2006, the fund returned 43.57%, outperforming the 38.47% return of the MSCI Emerging Markets - Latin America index. Security selection in materials - which declined as a percentage of net assets - and telecommunication services boosted performance versus the index, as did stock selection in and an overweighting of industrials. Stock picking in Brazil also contributed. On an absolute basis, favorable currency movements helped lift performance. Conversely, a modest cash position, an underweighting and poor stock selection in energy, and weak results from the fund's small stake in U.S. stocks detracted from relative performance. Top individual contributors included steel companies Usiminas and Siderurgica Nacional from Brazil and Gerdau AmeriSteel (traded on the Toronto Stock Exchange); Brazilian airline TAM; copper producer Grupo Mexico; and Brazilian retailer Lojas Renner. Underweightings in Telefonos de Mexico and energy stocks Petrobras from Brazil and Luxembourg-based Tenaris dampened returns, as did overweighting Chilean materials firm Acero del Pacifico. Some of the stocks mentioned here were no longer held at period end.
Note to shareholders: Fidelity Latin America Fund may invest up to 35% of its total assets in any industry that represents more than 20% of the Latin American market. As of October 31, 2006, the fund did not have more than 25% of its total assets invested in any one industry.
The views expressed above reflect those of the portfolio manager(s) only through the end of the period as stated on the cover of this report and do not necessarily represent the views of Fidelity or any other person in the Fidelity organization. Any such views are subject to change at any time based upon market or other conditions and Fidelity disclaims any responsibility to update such views. These views may not be relied on as investment advice and, because investment decisions for a Fidelity fund are based on numerous factors, may not be relied on as an indication of trading intent on behalf of any Fidelity fund.
Annual Report
Latin America
Investment Changes
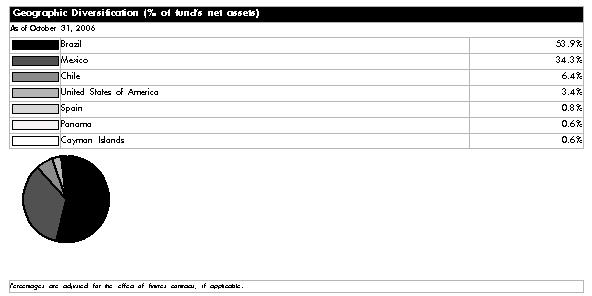
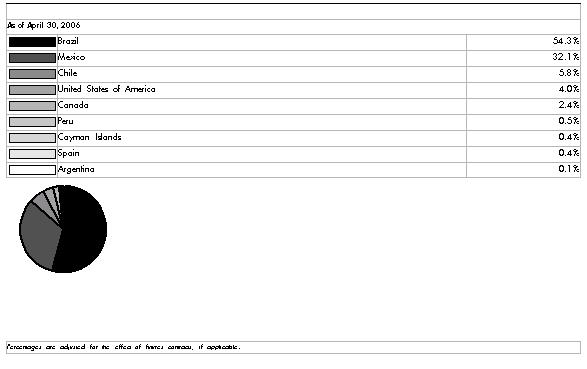
Asset Allocation |
| % of fund's
net assets | % of fund's net assets
6 months ago |
Stocks | 97.3 | 96.8 |
Short-Term Investments and
Net Other Assets | 2.7 | 3.2 |
Top Ten Stocks as of October 31, 2006 |
| % of fund's
net assets | % of fund's net assets
6 months ago |
America Movil SA de CV Series L sponsored ADR (Mexico, Wireless Telecommunication Services) | 11.4 | 9.2 |
Petroleo Brasileiro SA Petrobras (PN) (non-vtg.) (Brazil, Oil, Gas & Consumable Fuels) | 6.0 | 5.9 |
Cemex SA de CV sponsored ADR (Mexico, Construction Materials) | 5.4 | 5.3 |
Banco Itau Holding Financeira SA (non-vtg.) (Brazil, Commercial Banks) | 4.8 | 4.3 |
Banco Bradesco SA (PN) (Brazil, Commercial Banks) | 4.8 | 4.7 |
Uniao de Bancos Brasileiros SA (Unibanco) (Brazil, Commercial Banks) | 4.5 | 3.9 |
Petroleo Brasileiro SA Petrobras (Brazil, Oil, Gas & Consumable Fuels) | 4.4 | 4.4 |
TAM SA (PN) (ltd.-vtg.) (Brazil, Airlines) | 3.6 | 1.6 |
Wal-Mart de Mexico SA de CV Series V (Mexico, Food & Staples Retailing) | 3.3 | 2.5 |
Grupo Televisa SA de CV (Mexico, Media) | 3.3 | 2.5 |
| 51.5 | |
Market Sectors as of October 31, 2006 |
| % of fund's
net assets | % of fund's net assets
6 months ago |
Materials | 21.9 | 31.8 |
Financials | 16.6 | 14.3 |
Telecommunication Services | 14.1 | 14.7 |
Energy | 10.4 | 10.2 |
Industrials | 10.2 | 6.1 |
Consumer Staples | 9.7 | 8.4 |
Consumer Discretionary | 8.7 | 6.5 |
Utilities | 4.5 | 3.8 |
Information Technology | 0.6 | 0.4 |
Health Care | 0.6 | 0.6 |
Annual Report
Latin America
Investments October 31, 2006
Showing Percentage of Net Assets
Common Stocks - 97.3% |
| Shares | | Value (Note 1) |
Brazil - 53.9% |
AES Tiete SA (PN) (non-vtg.) | 406,600,000 | | $ 10,319,778 |
Aracruz Celulose SA (PN-B) sponsored ADR (non-vtg.) | 876,400 | | 48,219,528 |
Banco Bradesco SA: | | | |
(PN) | 1,240,754 | | 44,014,604 |
(PN) sponsored ADR (non-vtg.) | 2,932,300 | | 104,947,017 |
Banco Itau Holding Financeira SA: | | | |
(PN) (non-vtg.) | 2,648,340 | | 87,156,486 |
sponsored ADR (non-vtg.) | 1,884,500 | | 62,565,400 |
Banco Nossa Caixa SA | 889,000 | | 21,164,096 |
Brascan Residential Properties SA | 1,597,000 | | 12,829,706 |
Companhia de Bebidas das Americas (AmBev): | | | |
(PN) sponsored ADR | 939,026 | | 40,997,875 |
sponsored ADR | 74,145 | | 2,919,089 |
Companhia de Saneamento de Minas Minas Gerais | 1,215,800 | | 11,351,631 |
Companhia Siderurgica Nacional SA (CSN) sponsored ADR | 973,600 | | 30,347,112 |
Companhia Vale do Rio Doce: | | | |
(PN-A) | 423,800 | | 9,091,609 |
(PN-A) sponsored ADR (non-vtg.) | 2,920,600 | | 63,435,432 |
sponsored ADR | 3,264,000 | | 83,036,160 |
Confab Industrial SA (PN) (non-vtg.) | 2,942,422 | | 5,607,231 |
Cosan SA Industria E Comercio | 761,500 | | 13,017,702 |
CSU Cardsystem SA sponsored ADR (e) | 74,667 | | 1,297,343 |
Diagnosticos da America SA (a) | 717,200 | | 14,132,960 |
Duratex SA (PN) | 2,015,900 | | 24,330,152 |
Eletropaulo Metropolitana SA (PN-B) (a) | 292,450,000 | | 12,975,164 |
Embraer - Empresa Brasileira de Aeronautica SA sponsored ADR | 696,200 | | 28,982,806 |
Embratel Participacoes SA sponsored ADR | 812,400 | | 13,225,872 |
Empresa Nacional de Comercio Redito e Participacoes SA (PN) | 11,465,310 | | 90,716 |
Energias do Brasil SA | 614,300 | | 8,478,545 |
Gafisa SA (a) | 1,491,100 | | 21,729,248 |
Klabin SA (PN) (non-vtg.) | 5,429,900 | | 11,717,019 |
Localiza Rent a Car SA | 409,800 | | 10,182,793 |
Lojas Renner SA | 2,053,000 | | 25,602,569 |
Medial Saude SA | 1,736,600 | | 17,601,224 |
Natura Cosmeticos SA | 1,144,000 | | 15,682,578 |
Perdigao SA (ON) | 701,000 | | 8,087,202 |
Petroleo Brasileiro SA Petrobras: | | | |
(ON) | 198,500 | | 4,380,722 |
(PN) (non-vtg.) | 3,054,780 | | 61,352,424 |
(PN) sponsored ADR (non-vtg.) | 1,536,500 | | 124,395,040 |
sponsored ADR | 1,496,530 | | 132,832,003 |
Profarma Distribuidora de Produtos Farmaceuticos SA | 511,000 | | 6,444,185 |
|
| Shares | | Value (Note 1) |
Submarino SA | 1,915,400 | | $ 39,104,220 |
TAM SA: | | | |
(PN) (ltd.-vtg.) | 2,636,400 | | 80,286,446 |
(PN) sponsored ADR (ltd. vtg.) | 1,028,000 | | 31,405,400 |
Terna Participacoes SA unit | 370,300 | | 3,905,359 |
Totvs SA | 944,500 | | 19,895,820 |
Tractebel Energia SA | 1,875,300 | | 14,934,080 |
Uniao de Bancos Brasileiros SA (Unibanco): | | | |
unit | 431,200 | | 3,405,695 |
GDR | 1,747,000 | | 137,576,250 |
Usinas Siderurgicas de Minas Gerais SA (Usiminas) (PN-A) (non-vtg.) | 1,482,300 | | 50,326,197 |
Vivo Participacoes SA (PN) sponsored ADR (d) | 9,015,200 | | 31,463,048 |
Votorantim Celulose e Papel SA: | | | |
(PN) (non-vtg.) | 96,565 | | 1,778,402 |
sponsored ADR (non-vtg.) (d) | 4,158,250 | | 75,888,063 |
TOTAL BRAZIL | | 1,684,510,001 |
Cayman Islands - 0.6% |
Apex Silver Mines Ltd. (a) | 1,187,600 | | 18,764,080 |
Chile - 6.4% |
Compania Acero del Pacifico SA | 3,634,386 | | 46,930,766 |
Compania de Telecomunicaciones de Chile SA sponsored ADR | 337,700 | | 2,553,012 |
Compania Sudamericana de Vapores | 3,726,279 | | 4,720,309 |
Empresa Nacional de Electricidad SA sponsored ADR | 780,000 | | 25,404,600 |
Enersis SA sponsored ADR | 1,410,800 | | 19,454,932 |
Inversiones Aguas Metropolitanas SA ADR (e) | 1,513,500 | | 33,434,027 |
Lan Airlines SA sponsored ADR | 1,427,400 | | 61,592,310 |
Vina Concha y Toro SA sponsored ADR | 152,150 | | 4,716,650 |
TOTAL CHILE | | 198,806,606 |
Mexico - 34.3% |
Alsea SA de CV | 2,856,000 | | 13,703,064 |
America Movil SA de CV Series L sponsored ADR | 8,303,400 | | 355,966,753 |
AXTEL SA de CV unit | 3,520,438 | | 7,528,948 |
Cemex SA de CV sponsored ADR | 5,470,538 | | 168,164,338 |
Corporacion Geo SA de CV Series B (a) | 9,088,700 | | 42,027,156 |
Fomento Economico Mexicano SA de CV sponsored ADR | 1,049,065 | | 101,434,095 |
Gruma SA de CV Series B | 3,293,200 | | 10,806,363 |
Grupo Aeroportuario del Pacifico SA de CV sponsored ADR | 1,463,600 | | 55,236,264 |
Grupo Mexico SA de CV Series B | 8,335,969 | | 29,144,306 |
Grupo Televisa SA de CV | 1,507,400 | | 7,455,354 |
Grupo Televisa SA de CV (CPO) sponsored ADR | 3,828,500 | | 94,487,380 |
Industrias Penoles SA de CV | 2,294,500 | | 18,984,110 |
Sare Holding SA de CV Series B (a) | 6,080,300 | | 7,282,000 |
Common Stocks - continued |
| Shares | | Value (Note 1) |
Mexico - continued |
Telefonos de Mexico SA de CV Series L sponsored ADR | 1,214,500 | | $ 32,050,655 |
Urbi, Desarrollos Urbanos, SA de CV (a) | 8,169,300 | | 25,036,973 |
Wal-Mart de Mexico SA de CV Series V | 29,340,486 | | 102,225,860 |
TOTAL MEXICO | | 1,071,533,619 |
Panama - 0.6% |
Copa Holdings SA Class A | 508,100 | | 19,256,990 |
Spain - 0.8% |
Banco Bilbao Vizcaya Argentaria SA | 309,400 | | 7,487,480 |
Banco Santander Central Hispano SA | 992,900 | | 17,185,097 |
TOTAL SPAIN | | 24,672,577 |
United States of America - 0.7% |
Newmont Mining Corp. | 481,000 | | 21,774,870 |
TOTAL COMMON STOCKS (Cost $2,090,535,711) | 3,039,318,743 |
Money Market Funds - 2.2% |
| | | |
Fidelity Cash Central Fund, 5.34% (b) | 65,788,986 | | 65,788,986 |
Fidelity Securities Lending Cash Central Fund, 5.35% (b)(c) | 2,974,875 | | 2,974,875 |
TOTAL MONEY MARKET FUNDS (Cost $68,763,861) | 68,763,861 |
Cash Equivalents - 0.1% |
| Maturity Amount | | |
Investments in repurchase agreements in a joint trading account at 5.3%, dated 10/31/06 due 11/1/06 (Collateralized by U.S. Treasury Obligations) #
(Cost $2,339,000) | $ 2,339,345 | | 2,339,000 |
TOTAL INVESTMENT PORTFOLIO - 99.6% (Cost $2,161,638,572) | | 3,110,421,604 |
NET OTHER ASSETS - 0.4% | | 12,050,982 |
NET ASSETS - 100% | $ 3,122,472,586 |
Legend |
(a) Non-income producing |
(b) Affiliated fund that is available only to investment companies and other accounts managed by Fidelity Investments. The rate quoted is the annualized seven-day yield of the fund at period end. A complete unaudited listing of the fund's holdings as of its most recent quarter end is available upon request. |
(c) Investment made with cash collateral received from securities on loan. |
(d) Security or a portion of the security is on loan at period end. |
(e) Security exempt from registration under Rule 144A of the Securities Act of 1933. These securities may be resold in transactions exempt from registration, normally to qualified institutional buyers. At the end of the period, the value of these securities amounted to $ 34,731,370 or 1.1% of net assets. |
# Additional Information on each counterparty to the repurchase agreement is as follows: |
Repurchase Agreement / Counterparty | Value |
$2,339,000 due 11/01/06 at 5.30% |
BNP Paribas Securities Corp. | $ 1,277,142 |
Banc of America Securities LLC | 329,380 |
Barclays Capital, Inc. | 732,478 |
| $ 2,339,000 |
Affiliated Central Funds |
Information regarding fiscal year to date income earned by the Fund from investments in Fidelity Central Funds is as follows: |
Fund | Income earned |
Fidelity Cash Central Fund | $ 4,495,113 |
Fidelity Securities Lending Cash Central Fund | 958,757 |
Total | $ 5,453,870 |
Annual Report
See accompanying notes which are an integral part of the financial statements.
Latin America
Financial Statements
Statement of Assets and Liabilities
October 31, 2006 |
| | |
Assets | | |
Investment in securities, at value (including securities loaned of $2,954,545 and repurchase agreements of $2,339,000) - - See accompanying schedule: Unaffiliated issuers (cost $2,092,874,711) | $ 3,041,657,743 | |
Fidelity Central Funds (cost $68,763,861) | 68,763,861 | |
Total Investments (cost $2,161,638,572) | | $ 3,110,421,604 |
Cash | | 197 |
Foreign currency held at value (cost $555,009) | | 554,004 |
Receivable for investments sold | | 19,227,013 |
Receivable for fund shares sold | | 6,880,789 |
Dividends receivable | | 5,949,305 |
Interest receivable | | 466,411 |
Other receivables | | 84,348 |
Total assets | | 3,143,583,671 |
| | |
Liabilities | | |
Payable for investments purchased | $ 9,408,464 | |
Payable for fund shares redeemed | 6,026,197 | |
Accrued management fee | 1,795,431 | |
Other affiliated payables | 612,865 | |
Other payables and accrued expenses | 293,253 | |
Collateral on securities loaned, at value | 2,974,875 | |
Total liabilities | | 21,111,085 |
| | |
Net Assets | | $ 3,122,472,586 |
Net Assets consist of: | | |
Paid in capital | | $ 2,092,144,433 |
Undistributed net investment income | | 48,654,473 |
Accumulated undistributed net realized gain (loss) on investments and foreign currency transactions | | 32,877,080 |
Net unrealized appreciation (depreciation) on investments and assets and liabilities in foreign currencies | | 948,796,600 |
Net Assets, for 75,914,971 shares outstanding | | $ 3,122,472,586 |
Net Asset Value, offering price and redemption price per share ($3,122,472,586 ÷ 75,914,971 shares) | | $ 41.13 |
Statement of Operations
Year ended October 31, 2006 |
| | |
Investment Income | | |
Dividends | | $ 85,295,689 |
Interest | | 23,851 |
Income from Fidelity Central Funds (including $958,757 from security lending) | | 5,453,870 |
| | 90,773,410 |
Less foreign taxes withheld | | (6,290,272) |
Total income | | 84,483,138 |
| | |
Expenses | | |
Management fee | $ 18,581,946 | |
Transfer agent fees | 5,490,623 | |
Accounting and security lending fees | 1,110,737 | |
Custodian fees and expenses | 1,400,974 | |
Independent trustees' compensation | 9,784 | |
Registration fees | 328,083 | |
Audit | 89,867 | |
Legal | 32,763 | |
Interest | 158,810 | |
Miscellaneous | 11,833 | |
Total expenses before reductions | 27,215,420 | |
Expense reductions | (717,519) | 26,497,901 |
Net investment income (loss) | | 57,985,237 |
Realized and Unrealized Gain (Loss) Net realized gain (loss) on: | | |
Investment securities: | | |
Unaffiliated issuers | 37,561,152 | |
Foreign currency transactions | (972,233) | |
Total net realized gain (loss) | | 36,588,919 |
Change in net unrealized appreciation (depreciation) on: Investment securities | 585,353,162 | |
Assets and liabilities in foreign currencies | (13,418) | |
Total change in net unrealized appreciation (depreciation) | | 585,339,744 |
Net gain (loss) | | 621,928,663 |
Net increase (decrease) in net assets resulting from operations | | $ 679,913,900 |
Annual Report
See accompanying notes which are an integral part of the financial statements.
Latin America Fund
Financial Statements - continued
Statement of Changes in Net Assets
| Year ended
October 31,
2006 | Year ended
October 31,
2005 |
Increase (Decrease) in Net Assets | | |
Operations | | |
Net investment income (loss) | $ 57,985,237 | $ 18,097,464 |
Net realized gain (loss) | 36,588,919 | 80,919,152 |
Change in net unrealized appreciation (depreciation) | 585,339,744 | 247,588,239 |
Net increase (decrease) in net assets resulting from operations | 679,913,900 | 346,604,855 |
Distributions to shareholders from net investment income | (25,559,551) | (6,575,674) |
Distributions to shareholders from net realized gain | (20,858,777) | - |
Total distributions | (46,418,328) | (6,575,674) |
Share transactions
Proceeds from sales of shares | 2,691,422,984 | 1,044,234,301 |
Reinvestment of distributions | 44,620,920 | 6,298,102 |
Cost of shares redeemed | (1,635,956,243) | (365,491,989) |
Net increase (decrease) in net assets resulting from share transactions | 1,100,087,661 | 685,040,414 |
Redemption fees | 4,806,595 | 1,678,494 |
Total increase (decrease) in net assets | 1,738,389,828 | 1,026,748,089 |
| | |
Net Assets | | |
Beginning of period | 1,384,082,758 | 357,334,669 |
End of period (including undistributed net investment income of $48,654,473 and undistributed net investment income of $16,852,142, respectively) | $ 3,122,472,586 | $ 1,384,082,758 |
Other Information Shares | | |
Sold | 73,372,373 | 42,509,771 |
Issued in reinvestment of distributions | 1,389,117 | 323,696 |
Redeemed | (45,918,289) | (15,505,564) |
Net increase (decrease) | 28,843,201 | 27,327,903 |
Financial Highlights
Years ended October 31, | 2006 | 2005 | 2004 | 2003 | 2002 |
Selected Per-Share Data | | | | | |
Net asset value, beginning of period | $ 29.40 | $ 18.10 | $ 13.38 | $ 8.92 | $ 10.40 |
Income from Investment Operations | | | | | |
Net investment income (loss) C | .82 | .57 | .40 | .20 | .17 |
Net realized and unrealized gain (loss) | 11.68 | 10.98 | 4.53 | 4.42 | (1.41) |
Total from investment operations | 12.50 | 11.55 | 4.93 | 4.62 | (1.24) |
Distributions from net investment income | (.46) | (.30) | (.23) | (.17) | (.25) |
Distributions from net realized gain | (.38) | - | - | - | - |
Total distributions | (.84) | (.30) | (.23) | (.17) | (.25) |
Redemption fees added to paid in capital C | .07 | .05 | .02 | .01 | .01 |
Net asset value, end of period | $ 41.13 | $ 29.40 | $ 18.10 | $ 13.38 | $ 8.92 |
Total Return A, B | 43.57% | 64.94% | 37.47% | 52.83% | (12.37)% |
Ratios to Average Net Assets D, F | | | | | |
Expenses before reductions | 1.05% | 1.10% | 1.19% | 1.31% | 1.44% |
Expenses net of fee waivers, if any | 1.05% | 1.10% | 1.19% | 1.31% | 1.44% |
Expenses net of all reductions | 1.02% | 1.04% | 1.16% | 1.31% | 1.41% |
Net investment income (loss) | 2.23% | 2.38% | 2.56% | 1.89% | 1.57% |
Supplemental Data | | | | | |
Net assets, end of period (000 omitted) | $ 3,122,473 | $ 1,384,083 | $ 357,335 | $ 219,519 | $ 140,399 |
Portfolio turnover rate E | 60% | 40% | 25% | 28% | 128% |
A Total returns would have been lower had certain expenses not been reduced during the periods shown. B Total returns do not include the effect of the former sales charges. C Calculated based on average shares outstanding during the period. D Fees and expenses of the underlying Fidelity Central Funds are not included in the Fund's expense ratio. The Fund indirectly bears its proportionate share of the expense of any underlying Fidelity Central Funds. E Amount does not include the portfolio activity of any underlying Fidelity Central Funds. F Expense ratios reflect operating expenses of the Fund. Expenses before reductions do not reflect amounts reimbursed by the investment adviser or reductions from brokerage service arrangements or other expense offset arrangements and do not represent the amount paid by the Fund during periods when reimbursements or reductions occur. Expenses net of fee waivers reflect expenses after reimbursement by the investment adviser but prior to reductions from brokerage service arrangements or other expense offset arrangements. Expenses net of all reductions represent the net expenses paid by the Fund. |
Annual Report
See accompanying notes which are an integral part of the financial statements.
Nordic
Performance: The Bottom Line
Average annual total return reflects the change in the value of an investment, assuming reinvestment of the fund's dividend income and capital gains (the profits earned upon the sale of securities that have grown in value) and assuming a constant rate of performance each year. The $10,000 table and the fund's returns do not reflect the deduction of taxes that a shareholder would pay on fund distributions or the redemption of fund shares. During periods of reimbursement by Fidelity, a fund's total returns will be greater than it would be had the reimbursement not occurred. How a fund did yesterday is no guarantee of how it will do tomorrow.
Average Annual Total Returns
Periods ended
October 31, 2006 | Past 1
year | Past 5
years | Past 10
years |
Fidelity Nordic Fund | 29.68% | 18.92% | 13.82% |
$10,000 Over Life of Fund
Let's say hypothetically that $10,000 was invested in Fidelity Nordic Fund on October 31, 1996. The chart shows how the value of your investment would have changed, and also shows how the FTSE World Nordic Index performed over the same period.

Annual Report
Nordic
Management's Discussion of Fund Performance
Comments from Trygve Toraasen, Portfolio Manager of Fidelity® Nordic Fund
International equity markets as a whole outpaced their U.S. counterparts for the 12 months ending October 31, 2006 - partly as a result of favorable currency exchanges that boosted returns for U.S. investors. The Morgan Stanley Capital InternationalSM Europe, Australasia, Far East (MSCI® EAFE®) Index - a gauge of developed stock markets outside the United States and Canada - gained 27.72% during that time. European markets benefited from solid corporate profit growth and attractive dividends, which helped the MSCI Europe index advance 31.95%. Strong performing Latin American and Asian emerging markets drove the MSCI Emerging Markets index to a lofty 35.42% return. Japan was somewhat of an exception to the generally stellar foreign market performance after struggling in the middle part of the period. Still, its earlier gains helped the Tokyo Stock Exchange Stock Price Index (TOPIX) - - a benchmark of the largest and better-established stocks traded on the Tokyo Stock Exchange - rise 12.47% overall. Natural-resources-rich Canada also struggled over the final six months as energy prices fell, but the S&P/TSX Composite Index managed a 12-month return of 28.21%.
The fund returned 29.68%, trailing the Financial Times Stock Exchange (FTSE) World Nordic Index, which gained 35.96% during a 12-month period when the global economic expansion benefited many Nordic companies. The fund underperformed its index largely due to stock selection in health care and the de-emphasis of two Swedish truck manufacturers, Scania and Volvo, both of which performed well for company-specific reasons unrelated to the truck manufacturing cycle, which I believed was nearing its end. I didn't own either company at period end. TANDBERG, a Norwegian video conferencing equipment manufacturer, fell hard early in the period. Although it later recovered, it underperformed for the fiscal year. My early underweighting of Swedish investment company Investor AB also detracted from results. Its stock price rose after the company adopted a new business strategy. Among the investments that supported results were: Aker Kvaerner, a Norwegian oil services company; Hexagon, a Swedish engineering firm that specializes in producing equipment to measure industrial processes; and ABB Ltd., a Swedish power plant construction company that benefited from infrastructure spending in emerging markets. In a strong period for the Nordic markets, a sizable portion of the fund's absolute return came from favorable currency movements.
Notes to shareholders: On December 14, 2006, the Board of Trustees agreed to present a proposal to shareholders to merge Fidelity Nordic Fund into Fidelity Europe Fund. Shareholders of Nordic Fund are expected to meet on May 16, 2007, to vote on the approval of the proposal. If approved, the merger is expected to be completed by the end of June 2007.
The foregoing is not a solicitation of any proxy. For a free copy of the Proxy Statement describing the Reorganization (and containing important information about fees, expenses and risk considerations) and a Prospectus for Fidelity Europe Fund, please call 1-800-544-3198 after March 19, 2007. The Prospectus/Proxy Statement also will be available for free on the Securities and Exchange Commission's Web site (www.sec.gov).
Fidelity Nordic Fund may invest up to 35% of its total assets in any industry that represents more than 20% of the Nordic market. As of October 31, 2006, the fund did not have more than 25% of its total assets in any one industry.
The views expressed above reflect those of the portfolio manager(s) only through the end of the period as stated on the cover of this report and do not necessarily represent the views of Fidelity or any other person in the Fidelity organization. Any such views are subject to change at any time based upon market or other conditions and Fidelity disclaims any responsibility to update such views. These views may not be relied on as investment advice and, because investment decisions for a Fidelity fund are based on numerous factors, may not be relied on as an indication of trading intent on behalf of any Fidelity fund.
Annual Report
Nordic
Investment Changes
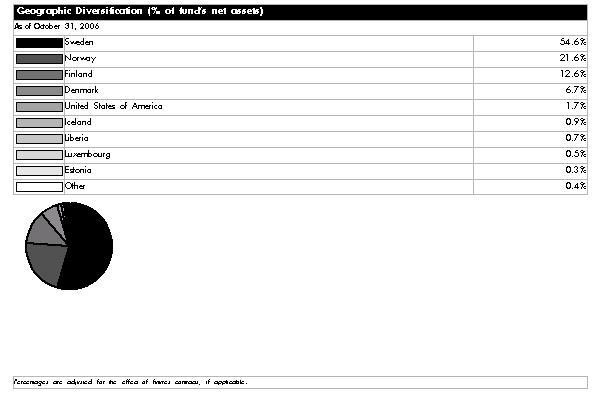
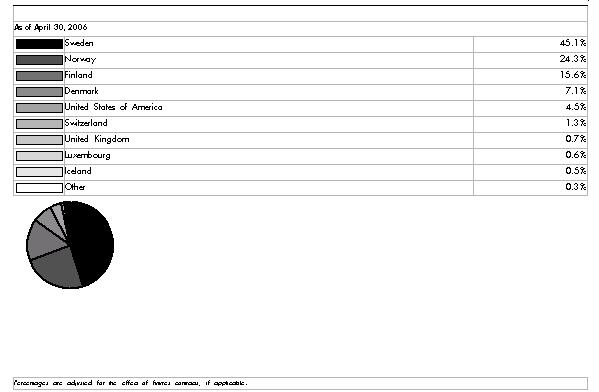
Asset Allocation |
| % of fund's
net assets | % of fund's net assets
6 months ago |
Stocks | 98.3 | 95.5 |
Short-Term Investments and Net Other Assets | 1.7 | 4.5 |
Top Ten Stocks as of October 31, 2006 |
| % of fund's
net assets | % of fund's net assets
6 months ago |
Telefonaktiebolaget LM Ericsson (B Shares) (Sweden, Communications Equipment) | 10.3 | 6.7 |
Nokia Corp. (Finland, Communications Equipment) | 8.2 | 9.0 |
Nordea Bank AB (Sweden, Commercial Banks) | 5.6 | 4.8 |
Hennes & Mauritz AB (H&M) (B Shares) (Sweden, Specialty Retail) | 4.0 | 1.9 |
Investor AB (B Shares) (Sweden, Diversified Financial Services) | 3.8 | 1.9 |
DnB Nor ASA (Norway, Commercial Banks) | 3.3 | 2.8 |
Danske Bank AS (Denmark, Commercial Banks) | 3.1 | 3.8 |
Aker Kvaerner ASA (Norway, Energy Equipment & Services) | 3.1 | 1.8 |
Telenor ASA (Norway, Diversified Telecommunication Services) | 3.1 | 1.3 |
TeliaSonera AB (Sweden, Diversified Telecommunication Services) | 3.1 | 0.0 |
| 47.6 | |
Market Sectors as of October 31, 2006 |
| % of fund's
net assets | % of fund's net assets
6 months ago |
Financials | 26.9 | 22.6 |
Information Technology | 19.6 | 17.4 |
Industrials | 16.3 | 24.0 |
Consumer Discretionary | 10.2 | 5.9 |
Energy | 8.5 | 13.6 |
Telecommunication Services | 7.1 | 2.1 |
Materials | 4.5 | 1.5 |
Health Care | 3.2 | 5.1 |
Consumer Staples | 1.7 | 1.4 |
Utilities | 0.3 | 1.9 |
Annual Report
Nordic
Investments October 31, 2006
Showing Percentage of Net Assets
Common Stocks - 98.3% |
| Shares | | Value (Note 1) |
Bermuda - 0.2% |
SeaDrill Ltd. (a) | 60,800 | | $ 862,246 |
Denmark - 6.7% |
Danske Bank AS | 259,720 | | 10,896,161 |
FLS Industries | 32,550 | | 1,716,737 |
Novo Nordisk AS Series B | 62,995 | | 4,757,148 |
Rockwool International AS Series B | 17,100 | | 2,650,005 |
Vestas Wind Systems AS (a) | 117,600 | | 3,312,648 |
TOTAL DENMARK | | 23,332,699 |
Estonia - 0.3% |
Tallinna Vesi AS | 58,562 | | 1,056,944 |
Finland - 12.6% |
Kemira Oyj | 140,800 | | 2,733,497 |
Kone Oyj (B Shares) | 36,580 | | 1,733,159 |
Marimekko Oyj | 28,500 | | 529,291 |
Metso Corp. | 157,400 | | 6,840,828 |
Nokia Corp. | 1,432,300 | | 28,474,124 |
Nokian Tyres Ltd. (d) | 185,070 | | 3,543,350 |
TOTAL FINLAND | | 43,854,249 |
Iceland - 0.9% |
Exista ehf (a) | 162,563 | | 53,102 |
Kaupthing Bank Hf | 153,000 | | 1,890,592 |
Ossur hf (a) | 689,370 | | 1,238,023 |
TOTAL ICELAND | | 3,181,717 |
Liberia - 0.7% |
Royal Caribbean Cruises Ltd. | 62,400 | | 2,527,200 |
Luxembourg - 0.5% |
Transcom WorldWide SA Series B | 158,200 | | 1,642,806 |
Norway - 21.6% |
Acta Holding ASA | 137,500 | | 635,269 |
Aker Kvaerner ASA | 104,500 | | 10,871,095 |
Awilco Offshore ASA (a)(d) | 320,500 | | 2,892,865 |
DnB Nor ASA | 870,400 | | 11,398,317 |
Farstad Shipping ASA | 89,200 | | 1,855,888 |
Havila Shipping ASA (d) | 57,300 | | 674,984 |
Kongsberg Gruppen ASA | 3,900 | | 94,269 |
Norsk Hydro ASA | 152,340 | | 3,526,671 |
Norwegian Air Shuttle AS (a)(d) | 374,000 | | 5,435,548 |
Ocean RIG ASA (a)(d) | 256,600 | | 1,688,003 |
Otrum Electronics ASA (a) | 94,000 | | 163,938 |
PAN Fish ASA (a) | 1,575,000 | | 1,233,669 |
Petroleum Geo-Services ASA (a) | 26,700 | | 1,554,225 |
Schibsted ASA (B Shares) | 74,200 | | 2,247,591 |
|
| Shares | | Value (Note 1) |
Solstad Offshore ASA | 147,000 | | $ 2,743,628 |
Statoil ASA | 137,254 | | 3,469,881 |
Steen & Stroem ASA | 4,800 | | 242,328 |
Storebrand ASA (A Shares) | 502,300 | | 5,924,690 |
TANDBERG ASA | 214,400 | | 2,476,394 |
TANDBERG Television ASA (a) | 88,000 | | 911,422 |
Telenor ASA | 683,400 | | 10,794,763 |
Tomra Systems AS (d) | 116,900 | | 785,998 |
Yara International ASA | 202,800 | | 3,552,397 |
TOTAL NORWAY | | 75,173,833 |
Sweden - 54.6% |
AarhusKarlshamn AB | 10,600 | | 270,783 |
ABB Ltd. (Sweden) | 591,500 | | 8,804,033 |
Assa Abloy AB (B Shares) | 173,602 | | 3,341,089 |
Atlas Copco AB (A Shares) | 129,300 | | 3,777,456 |
Elekta AB (B Shares) | 147,500 | | 3,063,386 |
Forenings Sparbanken AB (A Shares) | 252,500 | | 8,268,200 |
Gant Co. AB | 64,400 | | 1,868,049 |
Hennes & Mauritz AB (H&M) (B Shares) | 320,590 | | 13,826,953 |
Hexagon AB (B Shares) (d) | 137,725 | | 5,129,600 |
Holmen AB (B Shares) | 131,600 | | 5,794,307 |
Investor AB (B Shares) | 597,500 | | 13,402,055 |
Invik & Co. AB (B Shares) | 18,300 | | 311,655 |
Mekonomen AB (d) | 103,700 | | 1,256,334 |
Modern Times Group AB (MTG) (B Shares) | 82,100 | | 4,728,844 |
NCC AB Series B | 26,000 | | 583,186 |
NeoNet AB | 864,000 | | 2,500,221 |
Nordea Bank AB | 1,417,000 | | 19,521,419 |
Orexo AB | 107,800 | | 1,858,260 |
rnb Retail & Brands AB (d) | 637,050 | | 5,137,927 |
Sandvik AB | 299,000 | | 3,653,460 |
Skandinaviska Enskilda Banken AB (A Shares) | 364,000 | | 10,180,549 |
Skanska AB (B Shares) | 178,800 | | 3,187,375 |
SKF AB (B Shares) | 208,000 | | 3,347,918 |
Svenska Cellulosa AB (SCA) (B Shares) | 73,100 | | 3,355,207 |
Svenska Handelsbanken AB (A Shares) | 333,616 | | 8,637,876 |
Swedish Match Co. | 254,000 | | 4,061,946 |
TELE2 AB (B Shares) | 312,800 | | 3,291,537 |
Teleca AB (B Shares) (a) | 101,600 | | 354,497 |
Telefonaktiebolaget LM Ericsson (B Shares) | 9,541,000 | | 36,084,066 |
TeliaSonera AB | 1,468,500 | | 10,674,603 |
TOTAL SWEDEN | | 190,272,791 |
United Kingdom - 0.2% |
Group 4 Securicor PLC (Denmark) | 184,418 | | 618,958 |
TOTAL COMMON STOCKS (Cost $275,034,138) | 342,523,443 |
Money Market Funds - 3.0% |
| Shares | | Value (Note 1) |
Fidelity Cash Central Fund, 5.34% (b) | 3,032,274 | | $ 3,032,274 |
Fidelity Securities Lending Cash Central Fund, 5.35% (b)(c) | 7,346,145 | | 7,346,145 |
TOTAL MONEY MARKET FUNDS (Cost $10,378,419) | 10,378,419 |
TOTAL INVESTMENT PORTFOLIO - 101.3% (Cost $285,412,557) | | 352,901,862 |
NET OTHER ASSETS - (1.3)% | | (4,419,507) |
NET ASSETS - 100% | $ 348,482,355 |
Legend |
(a) Non-income producing |
(b) Affiliated fund that is available only to investment companies and other accounts managed by Fidelity Investments. The rate quoted is the annualized seven-day yield of the fund at period end. A complete unaudited listing of the fund's holdings as of its most recent quarter end is available upon request. |
(c) Investment made with cash collateral received from securities on loan. |
(d) Security or a portion of the security is on loan at period end. |
Affiliated Central Funds |
Information regarding fiscal year to date income earned by the Fund from investments in Fidelity Central Funds is as follows: |
Fund | Income earned |
Fidelity Cash Central Fund | $ 406,231 |
Fidelity Securities Lending Cash Central Fund | 383,347 |
Total | $ 789,578 |
Annual Report
See accompanying notes which are an integral part of the financial statements.
Nordic
Financial Statements
Statement of Assets and Liabilities
October 31, 2006 |
| | |
Assets | | |
Investment in securities, at value (including securities loaned of $7,036,019) - See accompanying schedule: Unaffiliated issuers (cost $275,034,138) | $ 342,523,443 | |
Fidelity Central Funds (cost $10,378,419) | 10,378,419 | |
Total Investments (cost $285,412,557) | | $ 352,901,862 |
Receivable for investments sold | | 5,722,136 |
Receivable for fund shares sold | | 1,104,929 |
Dividends receivable | | 23,607 |
Interest receivable | | 24,704 |
Other receivables | | 16,691 |
Total assets | | 359,793,929 |
| | |
Liabilities | | |
Payable for investments purchased | $ 3,164,293 | |
Payable for fund shares redeemed | 446,761 | |
Accrued management fee | 199,736 | |
Other affiliated payables | 86,150 | |
Other payables and accrued expenses | 68,489 | |
Collateral on securities loaned, at value | 7,346,145 | |
Total liabilities | | 11,311,574 |
| | |
Net Assets | | $ 348,482,355 |
Net Assets consist of: | | |
Paid in capital | | $ 270,362,167 |
Undistributed net investment income | | 3,970,778 |
Accumulated undistributed net realized gain (loss) on investments and foreign currency transactions | | 6,658,808 |
Net unrealized appreciation (depreciation) on investments and assets and liabilities in foreign currencies | | 67,490,602 |
Net Assets, for 9,525,813 shares outstanding | | $ 348,482,355 |
Net Asset Value, offering price and redemption price per share ($348,482,355 ÷ 9,525,813 shares) | | $ 36.58 |
Statement of Operations
Year ended October 31, 2006 |
| | |
Investment Income | | |
Dividends | | $ 7,187,468 |
Interest | | 35 |
Income from Fidelity Central Funds (including $383,347 from security lending) | | 789,578 |
| | 7,977,081 |
Less foreign taxes withheld | | (1,019,096) |
Total income | | 6,957,985 |
| | |
Expenses | | |
Management fee | $ 1,909,989 | |
Transfer agent fees | 708,179 | |
Accounting and security lending fees | 135,894 | |
Custodian fees and expenses | 182,709 | |
Independent trustees' compensation | 983 | |
Registration fees | 52,714 | |
Audit | 54,834 | |
Legal | 3,528 | |
Miscellaneous | 1,843 | |
Total expenses before reductions | 3,050,673 | |
Expense reductions | (92,053) | 2,958,620 |
Net investment income (loss) | | 3,999,365 |
Realized and Unrealized Gain (Loss) Net realized gain (loss) on: | | |
Investment securities: | | |
Unaffiliated issuers | 7,927,925 | |
Foreign currency transactions | (3,499) | |
Total net realized gain (loss) | | 7,924,426 |
Change in net unrealized appreciation (depreciation) on: Investment securities | 41,898,811 | |
Assets and liabilities in foreign currencies | 1,928 | |
Total change in net unrealized appreciation (depreciation) | | 41,900,739 |
Net gain (loss) | | 49,825,165 |
Net increase (decrease) in net assets resulting from operations | | $ 53,824,530 |
Annual Report
See accompanying notes which are an integral part of the financial statements.
Nordic
Financial Statements - continued
Statement of Changes in Net Assets
| Year ended
October 31,
2006 | Year ended
October 31,
2005 |
Increase (Decrease) in Net Assets | | |
Operations | | |
Net investment income (loss) | $ 3,999,365 | $ 3,127,018 |
Net realized gain (loss) | 7,924,426 | 22,607,311 |
Change in net unrealized appreciation (depreciation) | 41,900,739 | 8,539,542 |
Net increase (decrease) in net assets resulting from operations | 53,824,530 | 34,273,871 |
Distributions to shareholders from net investment income | (2,048,598) | (1,181,664) |
Distributions to shareholders from net realized gain | (14,574,214) | - |
Total distributions | (16,622,812) | (1,181,664) |
Share transactions
Proceeds from sales of shares | 241,880,689 | 95,465,404 |
Reinvestment of distributions | 16,097,675 | 1,146,167 |
Cost of shares redeemed | (135,218,842) | (58,327,971) |
Net increase (decrease) in net assets resulting from share transactions | 122,759,522 | 38,283,600 |
Redemption fees | 509,855 | 142,810 |
Total increase (decrease) in net assets | 160,471,095 | 71,518,617 |
| | |
Net Assets | | |
Beginning of period | 188,011,260 | 116,492,643 |
End of period (including undistributed net investment income of $3,970,778 and undistributed net investment income of $3,006,975, respectively) | $ 348,482,355 | $ 188,011,260 |
Other Information Shares | | |
Sold | 7,006,522 | 3,292,109 |
Issued in reinvestment of distributions | 544,945 | 43,024 |
Redeemed | (4,105,858) | (2,021,076) |
Net increase (decrease) | 3,445,609 | 1,314,057 |
Financial Highlights
Years ended October 31, | 2006 | 2005 | 2004 | 2003 | 2002 |
Selected Per-Share Data | | | | | |
Net asset value, beginning of period | $ 30.92 | $ 24.44 | $ 19.49 | $ 15.36 | $ 17.31 |
Income from Investment Operations | | | | | |
Net investment income (loss) C | .50 | .55 | .26 | .11 | .10 |
Net realized and unrealized gain (loss) | 7.94 | 6.12 | 4.80 | 4.14 | (1.99) |
Total from investment operations | 8.44 | 6.67 | 5.06 | 4.25 | (1.89) |
Distributions from net investment income | (.35) | (.22) | (.15) | (.12) | (.06) |
Distributions from net realized gain | (2.49) | - | - | - | - |
Total distributions | (2.84) | (.22) | (.15) | (.12) | (.06) |
Redemption fees added to paid in capital C | .06 | .03 | .04 | - G | - G |
Net asset value, end of period | $ 36.58 | $ 30.92 | $ 24.44 | $ 19.49 | $ 15.36 |
Total Return A,B | 29.68% | 27.56% | 26.31% | 27.87% | (10.97)% |
Ratios to Average Net Assets D,F | | | | | |
Expenses before reductions | 1.14% | 1.17% | 1.28% | 1.43% | 1.35% |
Expenses net of fee waivers, if any | 1.14% | 1.17% | 1.28% | 1.43% | 1.35% |
Expenses net of all reductions | 1.10% | 1.13% | 1.24% | 1.40% | 1.30% |
Net investment income (loss) | 1.49% | 1.89% | 1.16% | .67% | .57% |
Supplemental Data | | | | | |
Net assets, end of period (000 omitted) | $ 348,482 | $ 188,011 | $ 116,493 | $ 81,337 | $ 73,992 |
Portfolio turnover rate E | 67% | 76% | 90% | 96% | 106% |
A Total returns would have been lower had certain expenses not been reduced during the periods shown. B Total returns do not include the effect of the former sales charges. C Calculated based on average shares outstanding during the period. D Fees and expenses of the underlying Fidelity Central Funds are not included in the Fund's expense ratio. The Fund indirectly bears its proportionate share of the expense of any underlying Fidelity Central Funds. E Amount does not include the portfolio activity of any underlying Fidelity Central Funds. F Expense ratios reflect operating expenses of the Fund. Expenses before reductions do not reflect amounts reimbursed by the investment adviser or reductions from brokerage service arrangements or other expense offset arrangements and do not represent the amount paid by the Fund during periods when reimbursements or reductions occur. Expenses net of fee waivers reflect expenses after reimbursement by the investment adviser but prior to reductions from brokerage service arrangements or other expense offset arrangements. Expenses net of all reductions represent the net expenses paid by the Fund. G Amount represents less than $.01 per share. |
Annual Report
See accompanying notes which are an integral part of the financial statements.
Pacific Basin
Performance: The Bottom Line
Average annual total return reflects the change in the value of an investment, assuming reinvestment of the fund's dividend income and capital gains (the profits earned upon the sale of securities that have grown in value) and assuming a constant rate of performance each year. The $10,000 table and the fund's returns do not reflect the deduction of taxes that a shareholder would pay on fund distributions or the redemption of fund shares. During periods of reimbursement by Fidelity, a fund's total returns will be greater than it would be had the reimbursement not occurred. How a fund did yesterday is no guarantee of how it will do tomorrow.
Average Annual Total Returns
Periods ended
October 31, 2006 | Past 1
year | Past 5
years | Past 10
years |
Fidelity Pacific Basin Fund | 24.55% | 16.85% | 8.07% |
$10,000 Over 10 Years
Let's say hypothetically that $10,000 was invested in Fidelity Pacific Basin Fund on October 31, 1996. The chart shows how the value of your investment would have changed, and also shows how the MSCI All Country Pacific Index performed over the same period.
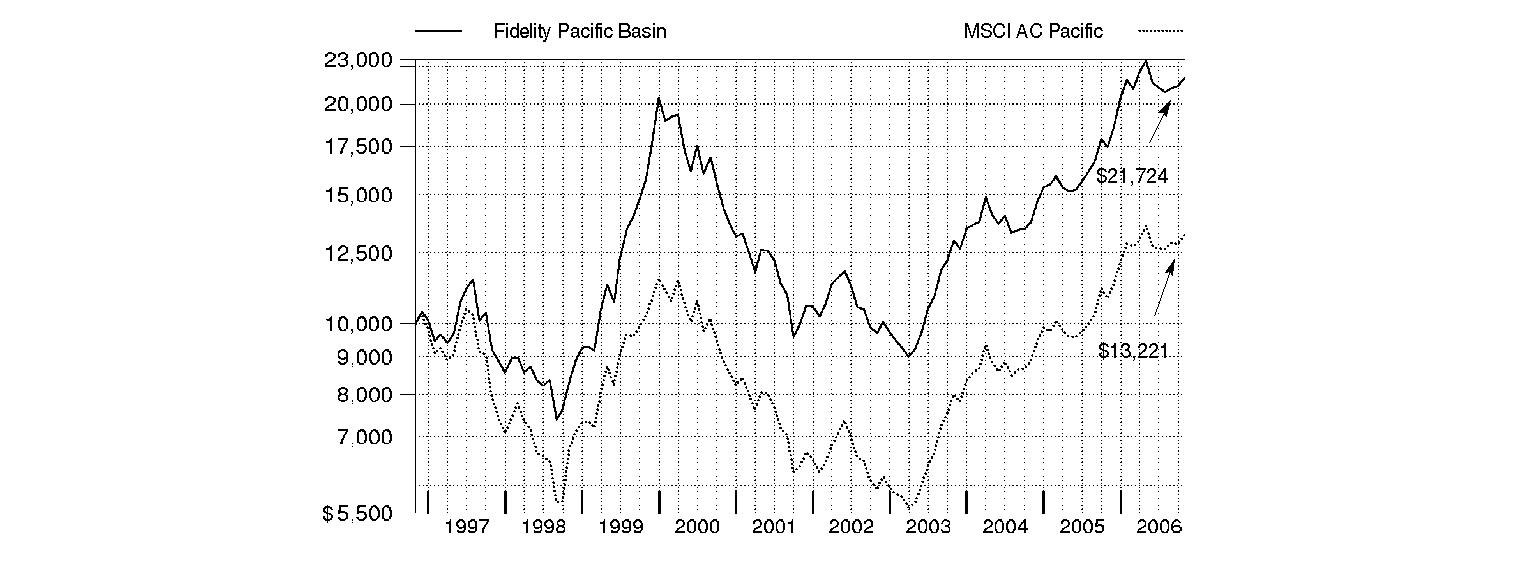
Annual Report
Pacific Basin
Management's Discussion of Fund Performance
Comments from Dale Nicholls, Portfolio Manager of Fidelity® Pacific Basin Fund
International equity markets as a whole outpaced their U.S. counterparts for the 12 months ending October 31, 2006 - partly as a result of favorable currency exchanges that boosted returns for U.S. investors. The Morgan Stanley Capital InternationalSM Europe, Australasia, Far East (MSCI® EAFE®) Index - a gauge of developed stock markets outside the United States and Canada - gained 27.72% during that time. European markets benefited from solid corporate profit growth and attractive dividends, which helped the MSCI Europe index advance 31.95%. Strong performing Latin American and Asian emerging markets drove the MSCI Emerging Markets index to a lofty 35.42% return. Japan was somewhat of an exception to the generally stellar foreign market performance after struggling in the middle part of the period. Still, its earlier gains helped the Tokyo Stock Exchange Stock Price Index (TOPIX) - - a benchmark of the largest and better-established stocks traded on the Tokyo Stock Exchange - rise 12.47% overall. Natural-resources-rich Canada also struggled over the final six months as energy prices fell, but the S&P/TSX Composite Index managed a 12-month return of 28.21%.
During the past year, the fund returned 24.55%, versus 22.10% for the MSCI All Country Pacific Index. Out-of-index exposure to India and stock selection in Singapore, along with overweightings in China and Indonesia, helped versus the benchmark. Hong Kong-listed names - including some incorporated in the Cayman Islands - boosted results as well. Currency fluctuations further aided the fund's returns. On the other hand, my picks in Japan hurt performance, although underweighting that country helped. Among sectors, stock selection helped in the capital goods segment of industrials and in telecommunication services, financials and utilities. Conversely, stock picking and an overweighting in consumer discretionary hurt, along with my choices in software and services. In terms of individual holdings, Softbank, a Japanese technology conglomerate, aided performance, and I sold it on news that the company obtained a license to enter the cellular handset market. Stakes in South Korean Internet search provider NHN, Indonesian natural gas utility Perusahaan Gas Negara and China Life Insurance also proved rewarding. In addition, not owning Japan-based index component Mitsubishi UFJ Financial Group was timely. Conversely, Access, a maker of Web browsers for cellular phones, suffered from a high valuation. Manufacturing design services provider ARRK also hurt, as did security software company Intelligent Wave, which I sold. Not owning wireless services provider China Mobile detracted as well. All detractors I mentioned except China Mobile are Japan-based.
The views expressed above reflect those of the portfolio manager(s) only through the end of the period as stated on the cover of this report and do not necessarily represent the views of Fidelity or any other person in the Fidelity organization. Any such views are subject to change at any time based upon market or other conditions and Fidelity disclaims any responsibility to update such views. These views may not be relied on as investment advice and, because investment decisions for a Fidelity fund are based on numerous factors, may not be relied on as an indication of trading intent on behalf of any Fidelity fund.
Annual Report
Pacific Basin
Investment Changes
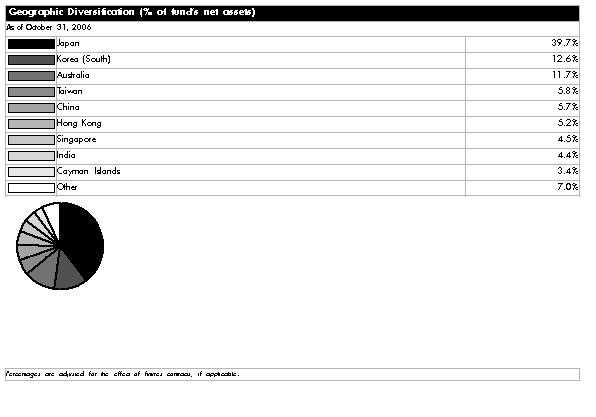
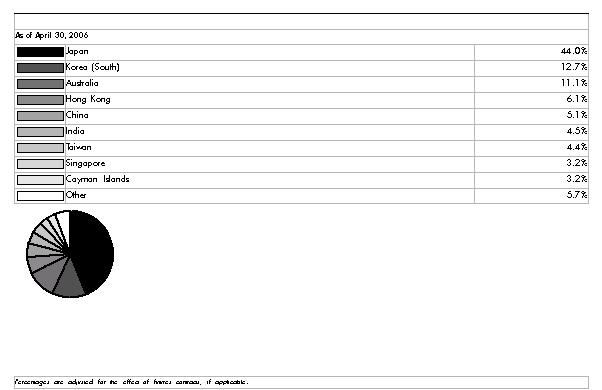
Asset Allocation |
| % of fund's
net assets | % of fund's net assets
6 months ago |
Stocks | 99.9 | 100.1 |
Bonds | 0.0 | 0.1 |
Short-Term Investments and Net Other Assets | 0.1 | (0.2) |
Top Ten Stocks as of October 31, 2006 |
| % of fund's
net assets | % of fund's net assets
6 months ago |
Toyota Motor Corp. (Japan, Automobiles) | 2.6 | 2.4 |
Mizuho Financial Group, Inc. (Japan, Commercial Banks) | 2.0 | 1.6 |
Sumitomo Mitsui Financial Group, Inc. (Japan, Commercial Banks) | 1.7 | 1.8 |
NHN Corp. (Korea (South), Internet Software & Services) | 1.6 | 1.4 |
BHP Billiton Ltd. (Australia, Metals & Mining) | 1.4 | 1.8 |
National Australia Bank Ltd. (Australia, Commercial Banks) | 1.3 | 1.0 |
ORIX Corp. (Japan, Consumer Finance) | 1.2 | 1.0 |
Computershare Ltd. (Australia, IT Services) | 1.1 | 0.9 |
Financial Technology (India) Ltd. (India, Diversified Financial Services) | 1.1 | 1.4 |
Esprit Holdings Ltd. (Hong Kong, Specialty Retail) | 1.1 | 1.2 |
| 15.1 | |
Market Sectors as of October 31, 2006 |
| % of fund's
net assets | % of fund's net assets
6 months ago |
Financials | 23.2 | 23.0 |
Information Technology | 20.7 | 19.0 |
Consumer Discretionary | 17.7 | 20.4 |
Industrials | 16.1 | 15.2 |
Materials | 6.1 | 7.9 |
Consumer Staples | 5.6 | 5.7 |
Energy | 3.8 | 2.9 |
Health Care | 3.5 | 3.1 |
Telecommunication Services | 1.8 | 0.8 |
Utilities | 1.4 | 2.1 |
Annual Report
Pacific Basin
Investments October 31, 2006
Showing Percentage of Net Assets
Common Stocks - 99.9% |
| Shares | | Value (Note 1) |
Australia - 11.7% |
AMP Ltd. | 829,204 | | $ 6,098,319 |
Australian Wealth Management Ltd. | 123,000 | | 247,573 |
BHP Billiton Ltd. | 627,175 | | 13,349,420 |
Billabong International Ltd. | 278,212 | | 3,377,124 |
Cochlear Ltd. | 52,300 | | 2,253,969 |
Computershare Ltd. | 1,876,162 | | 11,183,717 |
CSR Ltd. | 1,856,319 | | 4,656,105 |
Downer EDI Ltd. | 1,498,082 | | 7,468,727 |
Energy Resources of Australia Ltd. | 152,160 | | 2,089,677 |
HFA Holdings Ltd. | 1,216,855 | | 1,752,173 |
Macquarie Airports unit | 954,994 | | 2,373,181 |
Macquarie Bank Ltd. | 84,972 | | 4,903,979 |
Macquarie Infrastructure Group unit | 1,908,108 | | 4,992,807 |
National Australia Bank Ltd. | 439,624 | | 12,942,531 |
Newcrest Mining Ltd. | 298,077 | | 5,503,538 |
Origin Energy Ltd. | 186,913 | | 1,037,490 |
QBE Insurance Group Ltd. | 290,971 | | 5,563,803 |
Reverse Corp. Ltd. | 751,900 | | 2,054,754 |
Seek Ltd. | 1,207,394 | | 4,972,626 |
Sonic Healthcare Ltd. | 357,799 | | 3,642,420 |
United Group Ltd. | 586,893 | | 6,637,954 |
Woodside Petroleum Ltd. | 117,400 | | 3,412,740 |
WorleyParsons Ltd. | 249,585 | | 3,506,875 |
TOTAL AUSTRALIA | | 114,021,502 |
Bermuda - 0.9% |
Noble Group Ltd. | 2,918,000 | | 2,173,417 |
Peace Mark Holdings Ltd. | 2,711,750 | | 1,848,001 |
Ports Design Ltd. | 2,045,500 | | 3,555,928 |
Sinolink Worldwide Holdings Ltd. | 4,726,085 | | 1,008,757 |
TOTAL BERMUDA | | 8,586,103 |
Cayman Islands - 3.4% |
AAC Acoustic Technology Holdings, Inc. (a) | 1,910,000 | | 2,220,131 |
China Shineway Pharmaceutical Group Ltd. | 821,000 | | 506,712 |
Ctrip.com International Ltd. sponsored ADR | 29,349 | | 1,438,101 |
Foxconn International Holdings Ltd. (a) | 1,622,000 | | 5,391,233 |
Hutchison Telecommunications International Ltd. (a) | 1,796,000 | | 3,459,353 |
Kingboard Chemical Holdings Ltd. | 1,671,400 | | 5,942,268 |
Prime Success International Group Ltd. | 2,490,000 | | 2,042,663 |
SinoCom Software Group Ltd. | 23,410,000 | | 4,605,424 |
Solomon Systech International Ltd. | 5,296,000 | | 926,112 |
The9 Ltd. sponsored ADR (a)(d) | 118,000 | | 2,785,980 |
Xinao Gas Holdings Ltd. | 3,068,000 | | 3,088,829 |
Xinhua Finance Ltd. (a)(d) | 1,890 | | 727,980 |
TOTAL CAYMAN ISLANDS | | 33,134,786 |
China - 5.7% |
Baidu.com, Inc. sponsored ADR (a) | 28,196 | | 2,460,947 |
|
| Shares | | Value (Note 1) |
Beijing Media Corp. Ltd. (H Shares) | 1,084,000 | | $ 1,226,560 |
China Life Insurance Co. Ltd. (H Shares) | 4,111,000 | | 8,658,409 |
China Mengniu Dairy Co. Ltd. | 1,878,000 | | 3,414,458 |
China Shipping Development Co. Ltd. (H Shares) | 1,203,719 | | 1,309,400 |
China Sun Bio-chem Technology Group Co. Ltd. | 5,852,000 | | 2,555,130 |
Chitaly Holdings Ltd. | 5,102,000 | | 741,303 |
Focus Media Holding Ltd. ADR (a) | 65,370 | | 3,457,419 |
Global Bio-Chem Technology Group Co. Ltd. | 5,722,000 | | 1,677,488 |
Home Inns & Hotels Management, Inc. sponsored ADR | 1,100 | | 26,994 |
Industrial & Commercial Bank of China | 1,266,000 | | 566,487 |
Li Ning Co. Ltd. | 2,582,000 | | 3,054,364 |
Macau Success Ltd. | 16,700,000 | | 1,567,531 |
PetroChina Co. Ltd. (H Shares) | 8,712,000 | | 9,617,177 |
Shenzhou International Group Holdings Ltd. | 3,828,000 | | 1,584,910 |
Tencent Holdings Ltd. | 648,000 | | 1,548,094 |
Tong Ren Tang Technologies Co. Ltd. (H Shares) | 567,000 | | 962,351 |
Vision Grande Group Holdings Ltd. | 4,392,000 | | 3,783,675 |
Weichai Power Co. Ltd. (H Shares) | 1,877,000 | | 4,503,526 |
Yantai Changyu Pioneer Wine Co. (B Shares) | 826,775 | | 2,817,150 |
TOTAL CHINA | | 55,533,373 |
Hong Kong - 5.2% |
Bank of East Asia Ltd. | 502,400 | | 2,399,856 |
China Overseas Land & Investment Ltd. | 5,424,750 | | 4,945,414 |
China Resources Enterprise Ltd. | 1,102,000 | | 2,553,366 |
China State Construction International Holdings Ltd. | 12,090,098 | | 6,156,044 |
China Unicom Ltd. | 1,756,000 | | 1,933,356 |
CNOOC Ltd. | 6,852,000 | | 5,743,346 |
Esprit Holdings Ltd. | 1,058,500 | | 10,248,553 |
Guangzhou Investment Co. Ltd. | 21,464,000 | | 4,139,793 |
IPE Group Ltd. | 13,410,000 | | 2,293,280 |
PYI Corp. Ltd. | 10,163,631 | | 3,724,521 |
Television Broadcasts Ltd. | 419,000 | | 2,402,844 |
Tingyi (Cayman Island) Holding Corp. | 2,044,742 | | 1,543,311 |
Vtech Holdings Ltd. | 443,000 | | 2,227,190 |
TOTAL HONG KONG | | 50,310,874 |
India - 4.4% |
Bajaj Auto Ltd. | 30,383 | | 1,858,693 |
Cipla Ltd. | 402,940 | | 2,350,184 |
Financial Technology (India) Ltd. | 294,990 | | 10,582,077 |
Geodesic Information Systems Ltd. | 748,445 | | 3,099,082 |
HCL Infosystems Ltd. | 227,933 | | 657,109 |
IVRCL Infrastructures & Projects Ltd. | 604,455 | | 3,843,107 |
Max India Ltd. (a) | 218,465 | | 4,553,381 |
Pfizer Ltd. | 85,600 | | 1,636,824 |
Praj Industries Ltd. (a) | 539,390 | | 2,208,233 |
Common Stocks - continued |
| Shares | | Value (Note 1) |
India - continued |
Reliance Industries Ltd. | 48,441 | | $ 1,322,099 |
Sasken Communication Technologies Ltd. | 126,110 | | 1,196,389 |
Shree Renuka Sugars Ltd. | 120,690 | | 1,632,485 |
State Bank of India | 156,475 | | 4,599,013 |
Suzlon Energy Ltd. | 104,027 | | 3,029,335 |
TOTAL INDIA | | 42,568,011 |
Indonesia - 1.9% |
PT Astra International Tbk | 2,942,000 | | 4,326,928 |
PT Bank Niaga Tbk | 21,558,000 | | 2,058,543 |
PT Mitra Adiperkasa Tbk | 29,415,000 | | 3,131,647 |
PT Perusahaan Gas Negara Tbk Series B | 4,389,348 | | 5,492,083 |
PT Perushahaan Perkebunan London Sumatra Tbk | 4,284,000 | | 2,174,670 |
PT Semen Gresik Tbk | 559,500 | | 1,787,003 |
TOTAL INDONESIA | | 18,970,874 |
Japan - 39.7% |
Access Co. Ltd. (a)(d) | 844 | | 5,621,375 |
Aeon Co. Ltd. | 137,200 | | 3,231,755 |
Aida Engineering Ltd. | 391,000 | | 2,356,832 |
ARRK Corp. | 199,500 | | 2,669,438 |
Aruze Corp. | 108,100 | | 2,245,922 |
Asics Corp. | 317,000 | | 4,247,085 |
Bandai Visual Co. Ltd. | 566 | | 1,776,009 |
Canon, Inc. | 143,400 | | 7,656,126 |
Commuture Corp. | 234,000 | | 1,914,655 |
CyberAgent, Inc. (d) | 1,060 | | 1,377,565 |
Daiei, Inc. (a)(d) | 130,200 | | 2,443,477 |
Daiichi Sankyo Co. Ltd. | 252,900 | | 7,524,727 |
Daiwa House Industry Co. Ltd. | 283,000 | | 5,105,421 |
Daiwa Securities Group, Inc. | 530,000 | | 6,013,253 |
DCM Japan Holdings Co. Ltd. (a)(d) | 179,740 | | 2,059,265 |
eAccess Ltd. (d) | 3,893 | | 2,246,730 |
EDION Corp. | 95,900 | | 1,381,596 |
Fanuc Ltd. | 48,100 | | 4,174,205 |
Fujifilm Holdings Corp. | 141,200 | | 5,239,467 |
Fujitsu Ltd. | 806,000 | | 6,574,248 |
Hamakyorex Co. Ltd. (d) | 133,200 | | 3,541,826 |
Hamamatsu Photonics KK (d) | 83,600 | | 2,415,937 |
Hitachi Metals Ltd. | 246,000 | | 2,544,973 |
Horiba Ltd. | 106,100 | | 3,084,302 |
Ise Chemical Corp. | 527,000 | | 4,866,279 |
Japan Excellent, Inc. | 253 | | 1,349,795 |
Japan Logistics Fund, Inc. | 388 | | 2,886,115 |
JSR Corp. | 223,700 | | 5,623,102 |
Kansai Urban Banking Corp. (d) | 637,600 | | 2,812,941 |
Kato Works Co. Ltd. | 753,000 | | 2,794,135 |
Keihanshin Real Estate Co. Ltd. | 204,000 | | 1,381,396 |
Kobayashi Pharmaceutical Co. Ltd. | 67,500 | | 2,591,271 |
Konica Minolta Holdings, Inc. | 446,000 | | 5,941,074 |
Kyoritsu Maintenance Co. Ltd. (d) | 86,200 | | 2,034,131 |
|
| Shares | | Value (Note 1) |
Leopalace21 Corp. | 134,300 | | $ 5,052,326 |
Lintec Corp. | 198,100 | | 4,522,290 |
Mandom Corp. (d) | 244,000 | | 5,945,623 |
Mitsubishi Estate Co. Ltd. | 381,000 | | 9,121,067 |
Mitsui & Co. Ltd. | 475,000 | | 6,485,765 |
Mizuho Financial Group, Inc. | 2,443 | | 19,028,498 |
Musashi Seimitsu Industry Co. Ltd. (d) | 162,400 | | 4,109,987 |
Nabtesco Corp. | 288,000 | | 3,459,644 |
Nidec Corp. | 43,800 | | 3,351,659 |
Nidec Sankyo Corp. | 252,000 | | 2,813,885 |
Nintendo Co. Ltd. | 20,600 | | 4,212,996 |
Nippon Electric Glass Co. Ltd. | 463,000 | | 9,975,719 |
Nippon Oil Corp. | 147,000 | | 1,093,451 |
Nippon Parkerizing Co. Ltd. | 65,000 | | 1,147,615 |
Nippon Seiki Co. Ltd. | 143,000 | | 3,417,280 |
Nissan Motor Co. Ltd. (d) | 786,800 | | 9,424,648 |
Nissin Food Products Co. Ltd. | 98,700 | | 2,978,890 |
Nittoku Engineering Co. Ltd. | 139,700 | | 1,057,067 |
NTT Urban Development Co. | 461 | | 3,980,934 |
Omron Corp. | 158,000 | | 4,079,686 |
Organo Corp. | 259,000 | | 2,442,519 |
ORIX Corp. | 40,610 | | 11,440,660 |
Rakuten, Inc. | 19,683 | | 8,750,992 |
Rex Holdings Co. Ltd. | 438 | | 760,209 |
Risa Partners, Inc. (d) | 302 | | 1,407,233 |
Sanyo Special Steel Co. Ltd. | 255,000 | | 1,698,401 |
Seikoh Giken Co. Ltd. | 31,200 | | 874,966 |
SFCG Co. Ltd. | 20,530 | | 3,796,716 |
Shoei Co. (d) | 101,700 | | 3,243,340 |
Sompo Japan Insurance, Inc. | 535,000 | | 7,117,476 |
Sony Corp. | 38,700 | | 1,585,926 |
St. Marc Holdings Co. Ltd. | 34,500 | | 2,306,686 |
Sumitomo Metal Industries Ltd. | 1,668,000 | | 6,274,966 |
Sumitomo Mitsui Financial Group, Inc. | 1,548 | | 16,941,177 |
Sysmex Corp. (d) | 53,200 | | 2,142,374 |
T&D Holdings, Inc. | 127,600 | | 9,327,805 |
Takara Holdings, Inc. (d) | 537,000 | | 3,356,250 |
Take & Give Needs Co. Ltd. (d) | 2,702 | | 2,656,720 |
Takeda Pharamaceutical Co. Ltd. | 115,400 | | 7,409,833 |
Telewave, Inc. (d) | 1,729 | | 3,444,400 |
The Nippon Synthetic Chemical Industry Co. Ltd. (d) | 399,000 | | 1,545,375 |
The Sumitomo Warehouse Co. Ltd. (d) | 401,000 | | 2,831,960 |
TIS, Inc. | 75,000 | | 1,664,031 |
Tohcello Co. Ltd. | 147,000 | | 1,878,976 |
Token Corp. | 55,260 | | 4,171,903 |
Tokyo Steel Manufacturing Co. Ltd. | 149,900 | | 2,296,690 |
Tokyo Tomin Bank Ltd. | 80,500 | | 3,276,163 |
Toyota Motor Corp. | 421,800 | | 24,886,197 |
Trend Micro, Inc. | 90,000 | | 2,885,602 |
Tsubakimoto Chain Co. | 359,000 | | 1,909,183 |
Tsutsumi Jewelry Co. Ltd. | 76,200 | | 2,097,846 |
UNY Co. Ltd. | 175,000 | | 2,197,974 |
V Technology Co. Ltd. | 411 | | 2,002,993 |
Common Stocks - continued |
| Shares | | Value (Note 1) |
Japan - continued |
Valor Co. Ltd. | 176,900 | | $ 2,601,471 |
Yaskawa Electric Corp. (d) | 325,000 | | 3,467,852 |
Yasuragi Co. Ltd. (d) | 101,500 | | 1,319,084 |
Yokogawa Electric Corp. | 224,000 | | 3,073,872 |
TOTAL JAPAN | | 386,071,279 |
Korea (South) - 12.6% |
Binggrea Co. Ltd. | 38,230 | | 1,704,069 |
CDNetworks Co. Ltd. (a) | 141,885 | | 4,728,243 |
Cheil Industries, Inc. | 119,163 | | 4,957,482 |
China LotSynergy Holdings Ltd. (a) | 16,436,000 | | 1,902,021 |
Core Logic, Inc. | 54,100 | | 1,728,214 |
Doosan Heavy Industries & Construction Co. Ltd. | 73,626 | | 2,812,985 |
Duzon Digital Ware Co. Ltd. | 103,938 | | 2,051,734 |
Hana Tour Service, Inc. | 30,424 | | 1,840,453 |
Hyundai Engineering & Construction Co. Ltd. (a) | 100,802 | | 5,637,849 |
Hyundai Mipo Dockyard Co. Ltd. | 22,382 | | 2,969,221 |
Hyunjin Materials Co. Ltd. | 118,199 | | 1,869,105 |
INTOPS Co. Ltd. | 119,506 | | 3,310,274 |
KH Vatec Co. Ltd. (a) | 152,899 | | 2,093,283 |
Kookmin Bank | 37,406 | | 2,973,423 |
Korea Information Service, Inc. | 57,510 | | 1,419,057 |
Korean Reinsurance Co. | 356,926 | | 4,034,237 |
Kyeryong Construction Industrial Co. Ltd. | 67,780 | | 2,776,659 |
LG Dacom Corp. | 48,772 | | 1,133,570 |
LG Electronics, Inc. | 52,340 | | 3,166,228 |
LG Household & Health Care Ltd. | 51,550 | | 4,759,722 |
Lotte Chilsung Beverage Co. Ltd. | 924 | | 1,164,990 |
Macquarie Korea Infrastructure Fund GDR (e) | 258,800 | | 1,733,960 |
Mobilians Co. Ltd. (a) | 76,477 | | 454,520 |
NHN Corp. | 156,345 | | 15,514,196 |
Nice e-Banking Services | 29,047 | | 1,202,263 |
Orion Corp. | 15,485 | | 4,190,685 |
Phoenix PDE Co. Ltd. | 708,094 | | 3,825,096 |
S.M. Entertainment Co. Ltd. (a) | 285,148 | | 2,178,896 |
Samsung Corp. | 126,820 | | 4,232,940 |
Samsung Electronics Co. Ltd. | 12,833 | | 8,321,528 |
Samsung Fire & Marine Insurance Co. Ltd. | 10,822 | | 1,676,849 |
Seoul Semiconductor Co. Ltd. | 130,028 | | 2,490,851 |
SFA Engineering Corp. | 151,735 | | 4,750,523 |
Taewoong Co. Ltd. | 52,527 | | 1,452,192 |
TK Corp. | 85,040 | | 1,046,923 |
TSM Tech Co. Ltd. | 173,088 | | 2,755,446 |
Woongjin Coway Co. Ltd. | 124,340 | | 3,266,027 |
YBM Sisa.com, Inc. | 120,314 | | 2,598,449 |
Yuhan Corp. | 11,461 | | 1,927,904 |
TOTAL KOREA (SOUTH) | | 122,652,067 |
|
| Shares | | Value (Note 1) |
Malaysia - 1.4% |
Bumiputra-Commerce Holdings BHD | 1,512,900 | | $ 2,858,045 |
IOI Corp. BHD | 1,051,600 | | 4,952,093 |
PPB Oil Palms BHD | 490,200 | | 1,100,517 |
Tenaga Nasional BHD | 1,757,425 | | 4,811,567 |
TOTAL MALAYSIA | | 13,722,222 |
New Zealand - 0.3% |
Pumpkin Patch Ltd. | 1,101,053 | | 2,951,262 |
Papua New Guinea - 0.3% |
Oil Search Ltd. | 1,102,528 | | 2,919,045 |
Philippines - 0.6% |
Banco de Oro Universal Bank (a) | 1,257,700 | | 1,085,094 |
Philippine Long Distance Telephone Co. | 92,000 | | 4,356,340 |
TOTAL PHILIPPINES | | 5,441,434 |
Singapore - 4.5% |
Ascendas Real Estate Investment Trust (A-REIT) | 2,751,550 | | 3,833,866 |
CapitaCommercial Trust (REIT) | 2,668,300 | | 3,700,737 |
CapitaLand Ltd. | 541,000 | | 1,893,187 |
Centillion Env & Recycling Ltd. (a) | 1,791,000 | | 195,499 |
Cosco Corp. Singapore Ltd. | 2,819,000 | | 3,475,331 |
DBS Group Holdings Ltd. | 383,000 | | 5,016,823 |
Ezra Holdings Ltd. | 1,033,000 | | 2,600,077 |
GES International Ltd. | 2,930,000 | | 2,314,049 |
Goodpack Ltd. | 2,903,000 | | 3,056,967 |
HTL International Holdings Ltd. | 2,826,250 | | 2,141,373 |
Keppel Corp. Ltd. | 653,000 | | 6,624,759 |
Keppel Land Ltd. | 1,133,000 | | 4,001,220 |
KS Energy Services Ltd. | 858,000 | | 1,366,277 |
Pertama Holdings Ltd. | 10,623,000 | | 2,864,813 |
Raffles Education Corp. Ltd. | 333,000 | | 568,756 |
TOTAL SINGAPORE | | 43,653,734 |
Taiwan - 5.8% |
China Life Insurance Co. Ltd. (TW) (a) | 5,674,000 | | 2,787,828 |
Chipbond Technology Corp. | 1,494,637 | | 1,367,362 |
Delta Electronics, Inc. | 687,000 | | 1,946,586 |
Formosan Rubber Group (a) | 8,007,000 | | 3,934,110 |
Holtek Semiconductor, Inc. | 1,109,189 | | 2,233,424 |
Hon Hai Precision Industry Co. Ltd. (Foxconn) | 1,438,885 | | 9,346,789 |
Macronix International Co. Ltd. (a) | 2,677,000 | | 903,765 |
MediaTek, Inc. | 315,040 | | 3,081,552 |
Phoenix Precision Technology Corp. | 1,675,434 | | 1,785,278 |
PixArt Imaging, Inc. | 299,000 | | 2,460,497 |
Powertech Technology, Inc. | 372,000 | | 1,073,109 |
Common Stocks - continued |
| Shares | | Value (Note 1) |
Taiwan - continued |
Shin Kong Financial Holding Co.: warrants (UBS Warrant Programme) 12/14/06 (a) | 3,382,203 | | $ 2,989,456 |
warrants (UBS Warrant Programme) 12/14/06 (a) | 5,772,480 | | 4,191,068 |
warrants (UBS Warrant Programme) 12/19/06 (a) | 4,794,201 | | 4,237,490 |
Springsoft, Inc. | 2,080,139 | | 2,530,026 |
Taishin Financial Holdings Co. Ltd. (a) | 6,793,000 | | 3,491,203 |
Taiwan Secom Co. | 1,444,562 | | 2,281,689 |
Tsann Kuen Enterprise Co. Ltd. | 3,460,260 | | 2,920,491 |
Wistron Corp. | 2,585,981 | | 3,001,063 |
TOTAL TAIWAN | | 56,562,786 |
Thailand - 1.5% |
AAPICO Hitech PCL (For. Reg.) | 11,800 | | 6,304 |
ACL Bank PCL (For. Reg.) (a) | 8,517,800 | | 1,067,990 |
Bumrungrad Hospital PCL (For. Reg.) | 3,725,400 | | 3,731,747 |
Khon Kaen Sugar Industry PCL (For. Reg.) | 8,372,100 | | 2,259,183 |
Sino Thai Engineering & Construction PCL (For. Reg.) | 14,247,200 | | 2,213,534 |
Thai Oil PCL (For. Reg.) | 992,000 | | 1,649,390 |
Thai Stanley Electric PCL | 49,100 | | 219,486 |
Total Access Communication PCL (a) | 644,676 | | 2,578,704 |
True Corp. PCL (For. Reg.) (a) | 5,273,000 | | 1,207,310 |
True Corp. PCL (For. Reg.) rights 4/30/08 (a) | 206,113 | | 0 |
TOTAL THAILAND | | 14,933,648 |
TOTAL COMMON STOCKS (Cost $809,110,298) | 972,033,000 |
Money Market Funds - 4.8% |
| Shares | | Value (Note 1) |
Fidelity Securities Lending Cash Central Fund, 5.35% (b)(c)
(Cost $46,913,910) | 46,913,910 | | $ 46,913,910 |
TOTAL INVESTMENT PORTFOLIO - 104.7% (Cost $856,024,208) | 1,018,946,910 |
NET OTHER ASSETS - (4.7)% | | (46,141,736) |
NET ASSETS - 100% | $ 972,805,174 |
Legend |
(a) Non-income producing |
(b) Affiliated fund that is available only to investment companies and other accounts managed by Fidelity Investments. The rate quoted is the annualized seven-day yield of the fund at period end. A complete unaudited listing of the fund's holdings as of its most recent quarter end is available upon request. |
(c) Investment made with cash collateral received from securities on loan. |
(d) Security or a portion of the security is on loan at period end. |
(e) Security exempt from registration under Rule 144A of the Securities Act of 1933. These securities may be resold in transactions exempt from registration, normally to qualified institutional buyers. At the end of the period, the value of these securities amounted to $1,733,960 or 0.2% of net assets. |
Affiliated Central Funds |
Information regarding fiscal year to date income earned by the Fund from investments in Fidelity Central Funds is as follows: |
Fund | Income earned |
Fidelity Cash Central Fund | $ 379,606 |
Fidelity Securities Lending Cash Central Fund | 796,238 |
Total | $ 1,175,844 |
Annual Report
See accompanying notes which are an integral part of the financial statements.
Pacific Basin
Financial Statements
Statement of Assets and Liabilities
October 31, 2006 |
| | |
Assets | | |
Investment in securities, at value (including securities loaned of $44,630,439) - See accompanying schedule: Unaffiliated issuers (cost $809,110,298) | $ 972,033,000 | |
Fidelity Central Funds (cost $46,913,910) | 46,913,910 | |
Total Investments (cost $856,024,208) | | $ 1,018,946,910 |
Receivable for investments sold | | 15,297,528 |
Receivable for fund shares sold | | 872,745 |
Dividends receivable | | 1,705,933 |
Interest receivable | | 1,377 |
Other receivables | | 184,318 |
Total assets | | 1,037,008,811 |
| | |
Liabilities | | |
Payable to custodian bank | $ 1,203,837 | |
Payable for investments purchased | 10,892,844 | |
Payable for fund shares redeemed | 3,756,290 | |
Accrued management fee | 611,931 | |
Other affiliated payables | 243,789 | |
Other payables and accrued expenses | 581,036 | |
Collateral on securities loaned, at value | 46,913,910 | |
Total liabilities | | 64,203,637 |
| | |
Net Assets | | $ 972,805,174 |
Net Assets consist of: | | |
Paid in capital | | $ 715,934,543 |
Undistributed net investment income | | 5,642,285 |
Accumulated undistributed net realized gain (loss) on investments and foreign currency transactions | | 88,717,061 |
Net unrealized appreciation (depreciation) on investments and assets and liabilities in foreign currencies | | 162,511,285 |
Net Assets, for 35,559,082 shares outstanding | | $ 972,805,174 |
Net Asset Value, offering price and redemption price per share ($972,805,174 ÷ 35,559,082 shares) | | $ 27.36 |
Statement of Operations
Year ended October 31, 2006 |
| | |
Investment Income | | |
Dividends | | $ 16,986,664 |
Interest | | 5,732 |
Income from Fidelity Central Funds (including $796,238 from security lending) | | 1,175,844 |
| | 18,168,240 |
Less foreign taxes withheld | | (1,075,371) |
Total income | | 17,092,869 |
| | |
Expenses | | |
Management fee
Basic fee | $ 7,292,626 | |
Performance adjustment | 444,040 | |
Transfer agent fees | 2,384,851 | |
Accounting and security lending fees | 466,273 | |
Custodian fees and expenses | 698,335 | |
Independent trustees' compensation | 4,130 | |
Registration fees | 86,216 | |
Audit | 93,890 | |
Legal | 18,192 | |
Interest | 61,837 | |
Miscellaneous | 6,414 | |
Total expenses before reductions | 11,556,804 | |
Expense reductions | (602,727) | 10,954,077 |
Net investment income (loss) | | 6,138,792 |
Realized and Unrealized Gain (Loss) Net realized gain (loss) on: | | |
Investment securities: | | |
Unaffiliated issuers (net of foreign taxes of $311,687) | 97,481,566 | |
Foreign currency transactions | 15,528 | |
Total net realized gain (loss) | | 97,497,094 |
Change in net unrealized appreciation (depreciation) on: Investment securities (net of decrease in deferred foreign taxes of $270,144) | 59,189,489 | |
Assets and liabilities in foreign currencies | 84,109 | |
Total change in net unrealized appreciation (depreciation) | | 59,273,598 |
Net gain (loss) | | 156,770,692 |
Net increase (decrease) in net assets resulting from operations | | $ 162,909,484 |
Annual Report
See accompanying notes which are an integral part of the financial statements.
Pacific Basin
Financial Statements - continued
Statement of Changes in Net Assets
| Year ended
October 31,
2006 | Year ended
October 31,
2005 |
Increase (Decrease) in Net Assets | | |
Operations | | |
Net investment income (loss) | $ 6,138,792 | $ 5,769,041 |
Net realized gain (loss) | 97,497,094 | 48,906,097 |
Change in net unrealized appreciation (depreciation) | 59,273,598 | 65,122,361 |
Net increase (decrease) in net assets resulting from operations | 162,909,484 | 119,797,499 |
Distributions to shareholders from net investment income | (5,529,029) | (1,990,052) |
Distributions to shareholders from net realized gain | (9,829,319) | (3,233,832) |
Total distributions | (15,358,348) | (5,223,884) |
Share transactions
Proceeds from sales of shares | 667,355,117 | 203,333,895 |
Reinvestment of distributions | 14,211,173 | 4,800,773 |
Cost of shares redeemed | (505,973,121) | (119,138,687) |
Net increase (decrease) in net assets resulting from share transactions | 175,593,169 | 88,995,981 |
Redemption fees | 810,944 | 153,147 |
Total increase (decrease) in net assets | 323,955,249 | 203,722,743 |
| | |
Net Assets | | |
Beginning of period | 648,849,925 | 445,127,182 |
End of period (including undistributed net investment income of $5,642,285 and undistributed net investment income of $5,234,889, respectively) | $ 972,805,174 | $ 648,849,925 |
Other Information Shares | | |
Sold | 25,188,605 | 9,742,425 |
Issued in reinvestment of distributions | 586,996 | 262,912 |
Redeemed | (19,160,860) | (5,917,502) |
Net increase (decrease) | 6,614,741 | 4,087,835 |
Financial Highlights
Years ended October 31, | 2006 | 2005 | 2004 | 2003 | 2002 |
Selected Per-Share Data | | | | | |
Net asset value, beginning of period | $ 22.42 | $ 17.91 | $ 17.06 | $ 12.73 | $ 13.09 |
Income from Investment Operations | | | | | |
Net investment income (loss) D | .16 | .22 G | .07 | .06 | (.02) |
Net realized and unrealized gain (loss) | 5.26 | 4.49 | .92 | 4.26 | (.36) |
Total from investment operations | 5.42 | 4.71 | .99 | 4.32 | (.38) |
Distributions from net investment income | (.18) | (.08) | (.16) | - | - |
Distributions from net realized gain | (.32) | (.13) | - | - | - |
Total distributions | (.50) | (.21) | (.16) | - | - |
Redemption fees added to paid in capital D | .02 | .01 | .02 | .01 | .02 |
Net asset value, end of period | $ 27.36 | $ 22.42 | $ 17.91 | $ 17.06 | $ 12.73 |
Total Return A,B,C | 24.55% | 26.62% | 5.98% | 34.01% | (2.75)% |
Ratios to Average Net Assets E,H | | | | | |
Expenses before reductions | 1.14% | 1.10% | 1.20% | 1.17% | 1.51% |
Expenses net of fee waivers, if any | 1.14% | 1.10% | 1.20% | 1.17% | 1.51% |
Expenses net of all reductions | 1.08% | 1.05% | 1.19% | 1.17% | 1.50% |
Net investment income (loss) | .60% | 1.09% G | .42% | .41% | (.15)% |
Supplemental Data | | | | | |
Net assets, end of period (000 omitted) | $ 972,805 | $ 648,850 | $ 445,127 | $ 419,251 | $ 306,206 |
Portfolio turnover rate F | 75% | 78% | 145% | 97% | 98% |
A Total returns would have been lower had certain expenses not been reduced during the periods shown. B Total returns do not include the effect of the former sales charges. C Total returns do not include the effect of the contingent deferred sales charge. D Calculated based on average shares outstanding during the period. EFees and expenses of the underlying Fidelity Central Funds are not included in the Fund's expense ratio. The Fund indirectly bears its proportionate share of the expense of any underlying Fidelity Central Funds. F Amount does not include the portfolio activity of any underlying Fidelity Central Funds. G Investment income per share reflects a special dividend which amounted to $.05 per share. Excluding the special dividend, the ratio of net investment income (loss) to average net assets would have been .84%. H Expense ratios reflect operating expenses of the Fund. Expenses before reductions do not reflect amounts reimbursed by the investment adviser or reductions from brokerage service arrangements or other expense offset arrangements and do not represent the amount paid by the Fund during periods when reimbursements or reductions occur. Expenses net of fee waivers reflect expenses after reimbursement by the investment adviser but prior to reductions from brokerage service arrangements or other expense offset arrangements. Expenses net of all reductions represent the net expenses paid by the Fund. |
Annual Report
See accompanying notes which are an integral part of the financial statements.
Southeast Asia
Performance: The Bottom Line
Average annual total return reflects the change in the value of an investment, assuming reinvestment of the fund's dividend income and capital gains (the profits earned upon the sale of securities that have grown in value) and assuming a constant rate of performance each year. The $10,000 table and the fund's returns do not reflect the deduction of taxes that a shareholder would pay on fund distributions or the redemption of fund shares. During periods of reimbursement by Fidelity, a fund's total returns will be greater than it would be had the reimbursement not occurred. How a fund did yesterday is no guarantee of how it will do tomorrow.
Average Annual Total Returns
Periods ended
October 31, 2006 | Past 1
year | Past 5
years | Past 10
years |
Fidelity Southeast Asia Fund | 41.50% | 24.50% | 6.86% |
$10,000 Over 10 Years
Let's say hypothetically that $10,000 was invested in Fidelity Southeast Asia Fund on October 31, 1996. The chart shows how the value of your investment would have changed, and also shows how the MSCI AC Far East ex Japan Index performed over the same period.
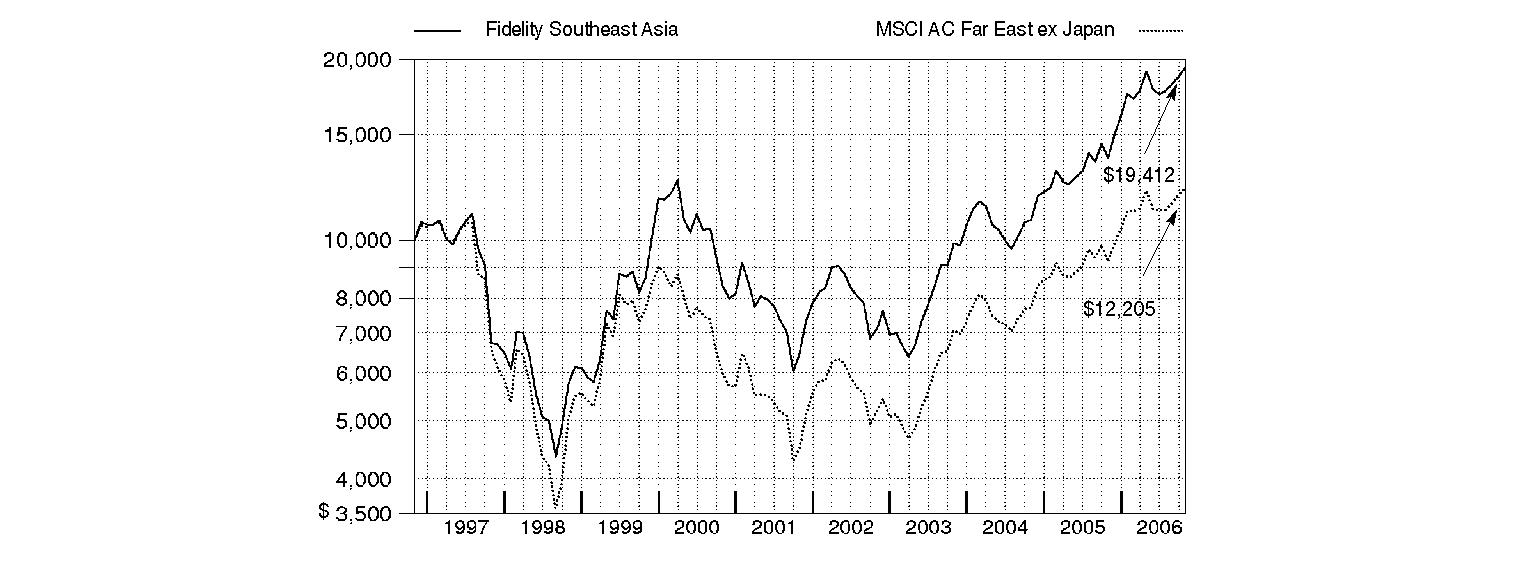
Annual Report
Southeast Asia
Management's Discussion of Fund Performance
Comments from Allan Liu, Portfolio Manager of Fidelity® Southeast Asia Fund
International equity markets as a whole outpaced their U.S. counterparts for the 12 months ending October 31, 2006 - partly as a result of favorable currency exchanges that boosted returns for U.S. investors. The Morgan Stanley Capital InternationalSM Europe, Australasia, Far East (MSCI® EAFE®) Index - a gauge of developed stock markets outside the United States and Canada - gained 27.72% during that time. European markets benefited from solid corporate profit growth and attractive dividends, which helped the MSCI Europe index advance 31.95%. Strong performing Latin American and Asian emerging markets drove the MSCI Emerging Markets index to a lofty 35.42% return. Japan was somewhat of an exception to the generally stellar foreign market performance after struggling in the middle part of the period. Still, its earlier gains helped the Tokyo Stock Exchange Stock Price Index (TOPIX) - - a benchmark of the largest and better-established stocks traded on the Tokyo Stock Exchange - rise 12.47% overall. Natural-resources-rich Canada also struggled over the final six months as energy prices fell, but the S&P/TSX Composite Index managed a 12-month return of 28.21%.
During the past year, the fund returned 41.50%, handily beating the 32.63% return of the MSCI All Country Far East ex Japan Index. Favorable stock selection in financials, information technology, utilities and industrials helped the fund's performance versus the index. On a country basis, my picks in China, South Korea and Singapore - together with some Hong Kong-listed names incorporated in the Cayman Islands - aided performance, along with overweightings in China and Indonesia. The top contributor was Indonesian natural gas utility Perusahaan Gas Negara. Two manufacturers for the cellular handset industry, Foxconn International Holdings and AAC Acoustic Technology Holdings - both Hong Kong-listed but incorporated in the Cayman Islands - - were strong contributors. Further adding value was Singapore-listed Cosco Corp., which enjoyed solid results from its shipping repair operations in China, along with Korea-based Hynix Semiconductor, which I sold to collect profits. The Hynix sale was part of a reduction of exposure to semiconductors and the broader technology sector, as I became concerned about potential inventory build-ups and the companies' sensitivity to any economic deceleration that might occur. Conversely, my picks in energy, consumer staples and health care could have been better. Hyundai Motor, a Korean automaker, was a major detractor, along with Nan Ya Printed Circuit Board, a Taiwanese electronic materials producer. Far EasTone Telecommunications, a Taiwanese provider of wireless telecom services, managed to post a single-digit gain but trailed the index. Further holding back performance was power tool maker Techtronic Industries. I sold both Nan Ya and Techtronic by period end.
The views expressed above reflect those of the portfolio manager(s) only through the end of the period as stated on the cover of this report and do not necessarily represent the views of Fidelity or any other person in the Fidelity organization. Any such views are subject to change at any time based upon market or other conditions and Fidelity disclaims any responsibility to update such views. These views may not be relied on as investment advice and, because investment decisions for a Fidelity fund are based on numerous factors, may not be relied on as an indication of trading intent on behalf of any Fidelity fund.
Annual Report
Southeast Asia
Investment Changes
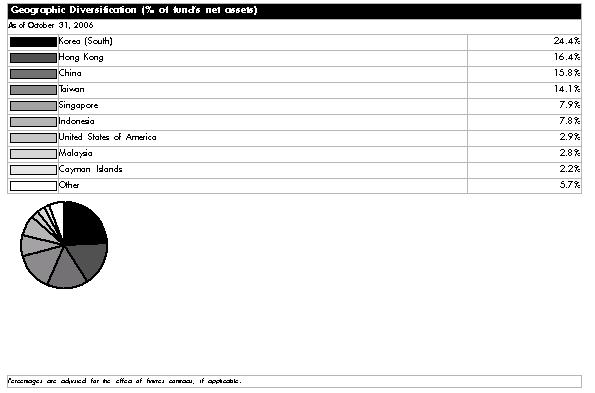
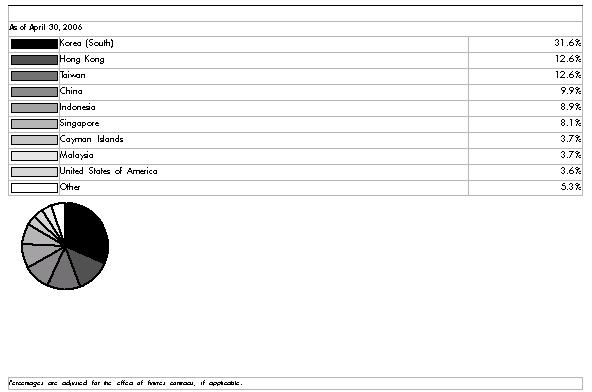
Asset Allocation |
| % of fund's
net assets | % of fund's net assets
6 months ago |
Stocks and Investment Companies | 97.1 | 96.4 |
Short-Term Investments and Net Other Assets | 2.9 | 3.6 |
Top Ten Stocks as of October 31, 2006 |
| % of fund's
net assets | % of fund's net assets
6 months ago |
Samsung Electronics Co. Ltd. (Korea (South), Semiconductors & Semiconductor Equipment) | 3.8 | 5.7 |
China Mobile (Hong Kong) Ltd. (Hong Kong, Wireless Telecommunication Services) | 3.4 | 1.5 |
Hon Hai Precision Industry Co. Ltd. (Foxconn) (Taiwan, Electronic Equipment & Instruments) | 3.1 | 2.3 |
PT Perusahaan Gas Negara Tbk Series B (Indonesia, Gas Utilities) | 2.8 | 3.4 |
Kookmin Bank (Korea (South), Commercial Banks) | 2.7 | 2.9 |
Shinhan Financial Group Co. Ltd. (Korea (South), Commercial Banks) | 2.5 | 2.4 |
PetroChina Co. Ltd. (H Shares) (China, Oil, Gas & Consumable Fuels) | 1.8 | 0.9 |
Taiwan Semiconductor Manufacturing Co. Ltd. (Taiwan, Semiconductors & Semiconductor Equipment) | 1.7 | 0.5 |
CNOOC Ltd. (Hong Kong, Oil, Gas & Consumable Fuels) | 1.5 | 0.8 |
Hyundai Heavy Industries Co. Ltd. (Korea (South), Machinery) | 1.3 | 0.0 |
| 24.6 | |
Market Sectors as of October 31, 2006 |
| % of fund's
net assets | % of fund's net assets
6 months ago |
Financials | 27.0 | 24.5 |
Information Technology | 15.0 | 22.4 |
Industrials | 14.4 | 12.9 |
Energy | 9.5 | 5.9 |
Materials | 7.5 | 6.0 |
Utilities | 7.5 | 6.3 |
Consumer Discretionary | 7.3 | 9.8 |
Telecommunication Services | 5.6 | 5.3 |
Consumer Staples | 2.4 | 2.5 |
Health Care | 0.2 | 0.8 |
Annual Report
Southeast Asia
Investments October 31, 2006
Showing Percentage of Net Assets
Common Stocks - 95.4% |
| Shares | | Value (Note 1) |
Australia - 1.5% |
HFA Holdings Ltd. | 2,000,000 | | $ 2,879,838 |
Paladin Resources Ltd. (a) | 1,200,000 | | 5,360,215 |
Rinker Group Ltd. | 280,000 | | 4,020,935 |
Seek Ltd. | 1,170,000 | | 4,818,619 |
WorleyParsons Ltd. | 490,000 | | 6,884,903 |
TOTAL AUSTRALIA | | 23,964,510 |
Bermuda - 1.3% |
eSun Holdings Ltd. (a) | 4,800,000 | | 4,628,915 |
NWS Holdings Ltd. (d) | 4,000,000 | | 8,280,615 |
Sinochem Hong Kong Holding Ltd. | 20,461,400 | | 7,129,866 |
TOTAL BERMUDA | | 20,039,396 |
Cayman Islands - 2.2% |
AAC Acoustic Technology Holdings, Inc. (a) | 7,400,000 | | 8,601,553 |
Foxconn International Holdings Ltd. (a) | 3,230,000 | | 10,735,933 |
New World China Land Ltd. | 14,000,000 | | 6,714,499 |
Semiconductor Manufacturing International Corp. (a) | 24,000,000 | | 2,808,209 |
Shimao Property Holdings Ltd. | 1,200,000 | | 1,617,034 |
Tianjin Port Development Holdings Ltd. | 15,400,000 | | 5,069,177 |
TOTAL CAYMAN ISLANDS | | 35,546,405 |
China - 15.8% |
Angang New Steel Co. Ltd. (H Shares) | 7,600,000 | | 7,768,863 |
Anhui Conch Cement Co. Ltd. (H Shares) | 3,860,000 | | 8,586,381 |
Baidu.com, Inc. sponsored ADR (a) | 54,000 | | 4,713,120 |
Bank of Communications Co. Ltd. (H Shares) | 6,400,000 | | 4,805,843 |
Beijing Datang Power Generation Co. Ltd. | 7,900,000 | | 6,694,054 |
China Construction Bank Corp. (H Shares) | 35,000,000 | | 15,751,170 |
China Life Insurance Co. Ltd. (H Shares) | 6,600,000 | | 13,900,633 |
China Mengniu Dairy Co. Ltd. | 4,400,000 | | 7,999,794 |
China Merchants Bank Co. Ltd. (H Shares) (a) | 9,664,000 | | 15,085,244 |
China National Building Materials Co. Ltd. (H Shares) | 6,800,000 | | 3,785,938 |
China Oilfield Services Ltd. (H Shares) | 15,640,000 | | 8,788,099 |
China Petroleum & Chemical Corp. (H Shares) | 24,000,000 | | 16,648,800 |
China Shenhua Energy Co. Ltd. (H Shares) | 4,257,000 | | 7,488,011 |
Dongfang Electrical Machinery Co. Ltd. (H Shares) | 1,880,000 | | 3,625,984 |
Focus Media Holding Ltd. ADR (a) | 170,000 | | 8,991,300 |
Harbin Power Equipment Co. Ltd. (H Shares) | 6,000,000 | | 5,168,955 |
Huadian Power International Corp. Ltd. (H shares) | 10,000,000 | | 3,368,822 |
Huaneng Power International, Inc. (H Shares) | 12,500,000 | | 9,820,372 |
|
| Shares | | Value (Note 1) |
Hunan Non-Ferrous Metals Corp. Ltd. (H Shares) | 17,000,000 | | $ 8,044,026 |
Industrial & Commercial Bank of China | 5,586,000 | | 2,499,522 |
Jiangxi Copper Co. Ltd. (H Shares) | 7,280,000 | | 7,919,148 |
Li Ning Co. Ltd. | 5,400,000 | | 6,387,903 |
Lingbao Gold Co. Ltd. (H Shares) | 4,000,000 | | 3,497,403 |
Maanshan Iron & Steel Co. Ltd. (H Shares) | 8,000,000 | | 3,178,522 |
Mindray Medical International Ltd. sponsored ADR | 117,300 | | 2,123,130 |
PetroChina Co. Ltd. (H Shares) | 25,800,000 | | 28,480,620 |
Shanghai Electric (Group) Corp. (H Shares) | 35,600,000 | | 12,542,303 |
Shanghai Forte Land Co. Ltd. (H Shares) | 8,600,000 | | 3,792,882 |
Shanghai Prime Machinery Co. Ltd. (H Shares) | 11,600,000 | | 3,758,679 |
Sinopec Shanghai Petrochemical Co. Ltd. (H Shares) | 6,200,000 | | 2,630,767 |
Tencent Holdings Ltd. | 4,000,000 | | 9,556,138 |
Yantai Changyu Pioneer Wine Co. (B Shares) | 248,300 | | 846,056 |
Zijin Mining Group Co. Ltd. (H Shares) | 6,600,000 | | 3,835,828 |
TOTAL CHINA | | 252,084,310 |
Hong Kong - 15.7% |
Asia Financial Holdings Ltd. | 9,400,000 | | 3,807,283 |
Bank of East Asia Ltd. | 2,040,000 | | 9,744,638 |
Cheung Kong Holdings Ltd. | 1,911,000 | | 20,787,764 |
China Mobile (Hong Kong) Ltd. | 6,580,000 | | 53,666,480 |
China Power International Development Ltd. | 5,000,000 | | 2,391,606 |
China Resources Enterprise Ltd. | 3,200,000 | | 7,414,494 |
China Resources Power Holdings Co. Ltd. | 2,800,000 | | 3,492,259 |
CLP Holdings Ltd. | 2,600,000 | | 16,514,941 |
CNOOC Ltd. | 28,400,000 | | 23,804,880 |
CNPC (Hong Kong) Ltd. | 20,600,000 | | 10,330,196 |
Dynasty Fine Wines Group Ltd. (d) | 12,758,000 | | 4,921,308 |
Esprit Holdings Ltd. | 1,780,000 | | 17,234,223 |
Guangnan Holdings Ltd. | 4,128,000 | | 700,633 |
Hong Kong & China Gas Co. Ltd. | 8,000,000 | | 18,330,505 |
Hong Kong Exchanges & Clearing Ltd. | 1,750,000 | | 13,861,030 |
Hong Kong Land Holdings Ltd. | 840,000 | | 3,158,400 |
Johnson Electric Holdings Ltd. | 4,000,000 | | 3,152,806 |
Midland Holdings Ltd. | 10,000,000 | | 4,963,226 |
New World Development Co. Ltd. | 6,200,000 | | 10,618,732 |
PYI Corp. Ltd. | 17,300,314 | | 6,339,800 |
Sun Hung Kai Properties Ltd. | 796,000 | | 8,704,907 |
Swire Pacific Ltd. (A Shares) | 604,000 | | 6,380,008 |
TOTAL HONG KONG | | 250,320,119 |
Indonesia - 7.8% |
Arpeni Pratama Ocean Line PT | 10,000,000 | | 1,668,306 |
Bakrie Telecom PT | 56,000,000 | | 1,167,814 |
PT Apexindo Pratama Duta Tbk | 11,000,000 | | 1,907,577 |
Common Stocks - continued |
| Shares | | Value (Note 1) |
Indonesia - continued |
PT Astra Agro Lestari Tbk | 2,400,000 | | $ 2,568,314 |
PT Astra International Tbk | 9,016,500 | | 13,260,961 |
PT Bakrie & Brothers Tbk (a) | 307,576,000 | | 5,232,586 |
PT Bank Mandiri Persero Tbk | 29,300,000 | | 8,763,273 |
PT Bank Niaga Tbk | 44,000,000 | | 4,201,498 |
PT Bank Rakyat Indonesia Tbk | 14,000,000 | | 7,529,330 |
PT Bumi Resources Tbk | 18,000,000 | | 1,521,232 |
PT Energi Mega Persada Tbk (a) | 79,480,000 | | 4,536,213 |
PT Hexindo Adiperkasa Tbk | 22,500,000 | | 2,074,407 |
PT Indosat Tbk | 5,500,000 | | 3,139,050 |
PT International Nickel Indonesia Tbk | 634,000 | | 1,830,110 |
PT Jakarta International Hotel & Development Tbk (a) | 52,000,000 | | 3,538,566 |
PT Medco Energi International Tbk | 19,500,000 | | 7,116,370 |
PT Perusahaan Gas Negara Tbk Series B | 35,400,000 | | 44,293,535 |
PT Perushahaan Perkebunan London Sumatra Tbk | 6,600,000 | | 3,350,332 |
PT Summarecon Agung Tbk | 12,000,000 | | 1,554,159 |
PT United Tractors Tbk | 7,500,000 | | 5,391,813 |
TOTAL INDONESIA | | 124,645,446 |
Korea (South) - 23.4% |
Amorepacific Corp. (a) | 3,090 | | 1,600,339 |
Cheil Industries, Inc. | 239,550 | | 9,965,886 |
Daewoo Engineering & Construction Co. Ltd. | 750,000 | | 16,237,722 |
Daewoo Securities Co. Ltd. | 305,000 | | 5,648,445 |
Daishin Securities Co. Ltd. | 240,000 | | 5,425,309 |
Dongkuk Steel Mill Co. Ltd. | 325,000 | | 6,139,557 |
Doosan Heavy Industries & Construction Co. Ltd. | 229,000 | | 8,749,267 |
Hanbit Soft, Inc. (a) | 460,000 | | 3,500,343 |
Hansol Paper Co. Ltd. | 240,000 | | 3,578,667 |
Hyundai Heavy Industries Co. Ltd. | 145,000 | | 21,313,336 |
Hyundai Industrial Development & Construction Co. | 207,000 | | 10,435,124 |
Hyundai Mipo Dockyard Co. Ltd. | 128,000 | | 16,980,624 |
Hyundai Motor Co. | 71,000 | | 5,771,926 |
Hyunjin Materials Co. Ltd. | 10,882 | | 172,079 |
INI Steel Co. | 165,000 | | 5,857,519 |
Kookmin Bank | 533,000 | | 42,368,461 |
Korea Investment Holdings Co. Ltd. | 242,590 | | 11,585,614 |
Korean Reinsurance Co. | 494,087 | | 5,584,531 |
Macquarie Korea Infrastructure Fund GDR (e) | 595,400 | | 3,989,180 |
Meritz Fire & Marine Insurance Co. Ltd. | 580,000 | | 3,631,731 |
NHN Corp. | 43,498 | | 4,316,329 |
POSCO | 60,500 | | 16,790,388 |
Pyeong San Co. Ltd. | 33,432 | | 860,415 |
Samsung Electronics Co. Ltd. | 88,872 | | 57,628,832 |
Samsung Electronics Co. Ltd. GDR | 8,200 | | 2,658,850 |
Samsung Engineering Co. Ltd. | 388,000 | | 17,768,313 |
|
| Shares | | Value (Note 1) |
Samsung Fire & Marine Insurance Co. Ltd. | 66,000 | | $ 10,226,581 |
Seoul Semiconductor Co. Ltd. | 190,000 | | 3,639,691 |
Shinhan Financial Group Co. Ltd. | 865,000 | | 39,887,751 |
Shinsegae Co. Ltd. | 22,400 | | 12,908,670 |
SK Corp. | 202,000 | | 14,813,684 |
Tong Yang Major Corp. (a) | 350,000 | | 2,258,423 |
TOTAL KOREA (SOUTH) | | 372,293,587 |
Malaysia - 2.8% |
Bintulu Port Holdings BHD | 340,000 | | 431,923 |
Bumiputra-Commerce Holdings BHD | 2,550,000 | | 4,817,248 |
Bursa Malaysia BHD | 4,000,000 | | 6,516,085 |
DiGi.com BHD | 1,000,000 | | 3,258,042 |
IJM Corp. BHD | 1,700,000 | | 2,862,423 |
Lafarge Malayan Cement BHD | 15,000,000 | | 3,942,505 |
POS Malaysia & Services Holding BHD | 2,250,000 | | 3,055,441 |
PPB Oil Palms BHD | 1,800,000 | | 4,041,068 |
Public Bank BHD (For. Reg.) | 1,490,625 | | 2,795,560 |
Scomi Marine BHD | 1,430,000 | | 295,592 |
Tenaga Nasional BHD | 4,500,000 | | 12,320,329 |
YTL Power International BHD | 1,460,700 | | 875,820 |
TOTAL MALAYSIA | | 45,212,036 |
Papua New Guinea - 0.4% |
Oil Search Ltd. | 2,350,000 | | 6,221,844 |
Philippines - 1.0% |
Bank of the Philippine Islands (BPI) | 2,160,000 | | 2,686,998 |
Philippine Long Distance Telephone Co. | 280,000 | | 13,258,427 |
TOTAL PHILIPPINES | | 15,945,425 |
Singapore - 7.9% |
Advanced Holdings Ltd. | 6,000,000 | | 1,367,664 |
Cosco Corp. Singapore Ltd. | 12,200,000 | | 15,040,452 |
DBS Group Holdings Ltd. | 610,000 | | 7,990,240 |
Hotel Properties Ltd. | 1,840,000 | | 3,024,528 |
Keppel Corp. Ltd. | 1,785,000 | | 18,109,028 |
Keppel Land Ltd. | 2,150,000 | | 7,592,783 |
SembCorp Marine Ltd. | 6,500,000 | | 14,273,790 |
Singapore Exchange Ltd. | 6,585,000 | | 19,026,904 |
Singapore Land Ltd. | 1,400,000 | | 7,640,940 |
Singapore Petroleum Co. Ltd. | 2,750,000 | | 8,016,566 |
The Ascott Group Ltd. | 13,150,000 | | 9,456,787 |
United Overseas Bank Ltd. | 410,000 | | 4,659,689 |
Uol Group Ltd. | 3,500,000 | | 8,989,341 |
TOTAL SINGAPORE | | 125,188,712 |
Taiwan - 14.1% |
Cheng Uei Precision Industries Co. Ltd. | 1,180,000 | | 4,090,430 |
China Life Insurance Co. Ltd. (TW) (a) | 7,400,000 | | 3,635,870 |
Chong Hong Construction Co. Ltd. | 2,677,888 | | 7,176,013 |
Far East Department Stores Co. Ltd. | 8,133,000 | | 4,130,853 |
Far EasTone Telecommunications Co. Ltd. | 5,080,000 | | 5,818,839 |
Farglory Developers Co. Ltd. | 3,100,000 | | 3,821,854 |
Common Stocks - continued |
| Shares | | Value (Note 1) |
Taiwan - continued |
Foxconn Technology Co. Ltd. | 647,645 | | $ 6,334,915 |
Goldsun Development & Construction Co. Ltd. | 8,364,000 | | 3,580,069 |
High Tech Computer Corp. | 470,000 | | 11,688,018 |
Hon Hai Precision Industry Co. Ltd. (Foxconn) | 7,527,025 | | 48,894,465 |
Huaku Construction Co. Ltd. | 3,520,000 | | 7,172,630 |
Hung Poo Real Estate Development Co. Ltd. | 5,285,000 | | 5,846,556 |
Ichia Technologies, Inc. (a) | 3,210,000 | | 3,202,743 |
Inventec Corp. | 9,600,000 | | 6,944,989 |
KEE TAI Properties Co. Ltd. (a) | 6,449,000 | | 3,780,951 |
King Yuan Electronics Co. Ltd. | 6,570,820 | | 4,654,537 |
Largan Precision Co. Ltd. | 393,000 | | 7,842,231 |
Macronix International Co. Ltd. (a) | 7,973,000 | | 2,691,714 |
MediaTek, Inc. | 1,520,000 | | 14,867,822 |
Motech Industries, Inc. | 240,000 | | 3,240,995 |
Shin Kong Financial Holding Co.: | | | |
warrants (UBS Warrant Programme) 12/13/06 (a) | 637,951 | | 563,871 |
warrants (UBS Warrant Programme) 12/20/06 (a) | 637,951 | | 563,871 |
warrants (UBS Warrant Programme) 1/31/07 (a) | 2,721,924 | | 2,405,849 |
warrants (UBS Warrant Programme) 2/7/07 (a) | 4,040,356 | | 3,571,183 |
Shin Kong Financial Holding Co. Ltd. | 5,500,000 | | 4,874,152 |
Shinkong Insurance Co. Ltd. | 662,000 | | 332,247 |
Taiwan Chi Cheng Enterprise Co. Ltd. | 2,946,000 | | 7,858,960 |
Taiwan Fertilizer Co. Ltd. | 9,400,000 | | 15,300,678 |
Taiwan Semiconductor Manufacturing Co. Ltd. | 14,750,604 | | 27,122,437 |
Yulon Motor Co. Ltd. | 3,195,750 | | 3,174,076 |
TOTAL TAIWAN | | 225,183,818 |
Thailand - 0.8% |
Bangkok Dusit Medical Service PCL (For. Reg.) | 2,600,000 | | 1,984,327 |
Central Pattana PCL (For. Reg.) | 5,216,600 | | 3,113,964 |
Total Access Communication PCL (a) | 1,868,600 | | 7,474,400 |
True Corp. PCL (For. Reg.) (a) | 100 | | 23 |
TOTAL THAILAND | | 12,572,714 |
United Kingdom - 0.7% |
HSBC Holdings PLC (Hong Kong) (Reg.) | 420,022 | | 8,019,900 |
Standard Chartered PLC (Hong Kong) | 80,000 | | 2,254,796 |
TOTAL UNITED KINGDOM | | 10,274,696 |
TOTAL COMMON STOCKS (Cost $1,160,518,228) | 1,519,493,018 |
Nonconvertible Preferred Stocks - 1.0% |
| Shares | | Value (Note 1) |
Korea (South) - 1.0% |
Hyundai Motor Co. Series 2 | 241,000 | | $ 11,381,794 |
Samsung Electronics Co. Ltd. | 10,200 | | 4,947,093 |
TOTAL NONCONVERTIBLE PREFERRED STOCKS (Cost $5,912,017) | 16,328,887 |
Investment Companies - 0.7% |
| | | |
Hong Kong - 0.7% |
iShares FTSE/Xinhua A50 China Tracker
(Cost $9,118,654) | 1,160,000 | | 10,306,537 |
Money Market Funds - 3.0% |
| | | |
Fidelity Cash Central Fund, 5.34% (b) | 45,984,670 | | 45,984,670 |
Fidelity Securities Lending Cash Central Fund, 5.35% (b)(c) | 1,837,400 | | 1,837,400 |
TOTAL MONEY MARKET FUNDS (Cost $47,822,070) | 47,822,070 |
TOTAL INVESTMENT PORTFOLIO - 100.1% (Cost $1,223,370,969) | | 1,593,950,512 |
NET OTHER ASSETS - (0.1)% | | (1,002,825) |
NET ASSETS - 100% | $ 1,592,947,687 |
Legend |
(a) Non-income producing |
(b) Affiliated fund that is available only to investment companies and other accounts managed by Fidelity Investments. The rate quoted is the annualized seven-day yield of the fund at period end. A complete unaudited listing of the fund's holdings as of its most recent quarter end is available upon request. |
(c) Investment made with cash collateral received from securities on loan. |
(d) Security or a portion of the security is on loan at period end. |
(e) Security exempt from registration under Rule 144A of the Securities Act of 1933. These securities may be resold in transactions exempt from registration, normally to qualified institutional buyers. At the end of the period, the value of these securities amounted to $3,989,180 or 0.3% of net assets. |
Affiliated Central Funds |
Information regarding fiscal year to date income earned by the Fund from investments in Fidelity Central Funds is as follows: |
Fund | Income earned |
Fidelity Cash Central Fund | $ 1,445,739 |
Fidelity Securities Lending Cash Central Fund | 117,560 |
Total | $ 1,563,299 |
Other Affiliated Issuers |
An affiliated company is a company in which the fund has ownership of at least 5% of the voting securities. Fiscal year to date transactions with companies which are or were affiliates are as follows: |
Affiliate | Value, beginning of period | Purchases | Sales
Proceeds | Dividend
Income | Value,
end of
period |
Wilmar International Ltd. | $ - | $ 1,266,618 | $ 1,730,041 | $ - | $ - |
Annual Report
See accompanying notes which are an integral part of the financial statements.
Southeast Asia
Financial Statements
Statement of Assets and Liabilities
October 31, 2006 |
| | |
Assets | | |
Investment in securities, at value (including securities loaned of $1,661,962) - See accompanying schedule: Unaffiliated issuers (cost $1,175,548,899) | $ 1,546,128,442 | |
Fidelity Central Funds (cost $47,822,070) | 47,822,070 | |
Total Investments (cost $1,223,370,969) | | $ 1,593,950,512 |
Foreign currency held at value (cost $1,035,932) | | 1,036,875 |
Receivable for investments sold | | 5,941,110 |
Receivable for fund shares sold | | 5,545,244 |
Dividends receivable | | 526,448 |
Interest receivable | | 205,502 |
Other receivables | | 588,807 |
Total assets | | 1,607,794,498 |
| | |
Liabilities | | |
Payable for investments purchased | $ 10,291,130 | |
Payable for fund shares redeemed | 1,119,017 | |
Accrued management fee | 1,036,995 | |
Other affiliated payables | 324,535 | |
Other payables and accrued expenses | 237,734 | |
Collateral on securities loaned, at value | 1,837,400 | |
Total liabilities | | 14,846,811 |
| | |
Net Assets | | $ 1,592,947,687 |
Net Assets consist of: | | |
Paid in capital | | $ 1,107,526,021 |
Undistributed net investment income | | 13,779,108 |
Accumulated undistributed net realized gain (loss) on investments and foreign currency transactions | | 101,038,426 |
Net unrealized appreciation (depreciation) on investments and assets and liabilities in foreign currencies | | 370,604,132 |
Net Assets, for 62,255,419 shares outstanding | | $ 1,592,947,687 |
Net Asset Value, offering price and redemption price per share ($1,592,947,687 ÷ 62,255,419 shares) | | $ 25.59 |
Statement of Operations
Year ended October 31, 2006 |
| | |
Investment Income | | |
Dividends | | $ 33,136,228 |
Interest | | 69,881 |
Income from Fidelity Central Funds (including $117,560 from security lending) | | 1,563,299 |
| | 34,769,408 |
Less foreign taxes withheld | | (3,732,486) |
Total income | | 31,036,922 |
| | |
Expenses | | |
Management fee
Basic fee | $ 8,952,086 | |
Performance adjustment | 1,237,060 | |
Transfer agent fees | 2,808,810 | |
Accounting and security lending fees | 551,555 | |
Custodian fees and expenses | 1,428,126 | |
Independent trustees' compensation | 4,748 | |
Registration fees | 107,704 | |
Audit | 91,130 | |
Legal | 20,838 | |
Miscellaneous | 7,808 | |
Total expenses before reductions | 15,209,865 | |
Expense reductions | (2,163,671) | 13,046,194 |
Net investment income (loss) | | 17,990,728 |
Realized and Unrealized Gain (Loss) Net realized gain (loss) on: | | |
Investment securities: | | |
Unaffiliated issuers | 102,629,193 | |
Other affiliated issuers | 463,423 | |
Foreign currency transactions | (1,521,848) | |
Total net realized gain (loss) | | 101,570,768 |
Change in net unrealized appreciation (depreciation) on: Investment securities | 243,769,647 | |
Assets and liabilities in foreign currencies | 17,435 | |
Total change in net unrealized appreciation (depreciation) | | 243,787,082 |
Net gain (loss) | | 345,357,850 |
Net increase (decrease) in net assets resulting from operations | | $ 363,348,578 |
Annual Report
See accompanying notes which are an integral part of the financial statements.
Southeast Asia
Financial Statements - continued
Statement of Changes in Net Assets
| Year ended
October 31,
2006 | Year ended
October 31,
2005 |
Increase (Decrease) in Net Assets | | |
Operations | | |
Net investment income (loss) | $ 17,990,728 | $ 10,708,090 |
Net realized gain (loss) | 101,570,768 | 63,732,767 |
Change in net unrealized appreciation (depreciation) | 243,787,082 | 54,484,965 |
Net increase (decrease) in net assets resulting from operations | 363,348,578 | 128,925,822 |
Distributions to shareholders from net investment income | (11,222,484) | (4,393,636) |
Distributions to shareholders from net realized gain | (18,514,528) | - |
Total distributions | (29,737,012) | (4,393,636) |
Share transactions
Proceeds from sales of shares | 839,465,156 | 334,452,814 |
Reinvestment of distributions | 28,757,013 | 4,237,758 |
Cost of shares redeemed | (393,593,644) | (144,703,410) |
Net increase (decrease) in net assets resulting from share transactions | 474,628,525 | 193,987,162 |
Redemption fees | 942,767 | 371,624 |
Total increase (decrease) in net assets | 809,182,858 | 318,890,972 |
| | |
Net Assets | | |
Beginning of period | 783,764,829 | 464,873,857 |
End of period (including undistributed net investment income of $13,779,108 and undistributed net investment income of $8,443,957, respectively) | $ 1,592,947,687 | $ 783,764,829 |
Other Information Shares | | |
Sold | 36,006,623 | 18,599,917 |
Issued in reinvestment of distributions | 1,416,326 | 261,752 |
Redeemed | (17,069,282) | (8,212,035) |
Net increase (decrease) | 20,353,667 | 10,649,634 |
Financial Highlights
Years ended October 31, | 2006 | 2005 | 2004 | 2003 | 2002 |
Selected Per-Share Data | | | | | |
Net asset value, beginning of period | $ 18.70 | $ 14.87 | $ 13.72 | $ 9.96 | $ 9.10 |
Income from Investment Operations | | | | | |
Net investment income (loss) C | .33 | .30 | .16 | .15 | .06 |
Net realized and unrealized gain (loss) | 7.23 | 3.66 | 1.10 | 3.68 | .81 |
Total from investment operations | 7.56 | 3.96 | 1.26 | 3.83 | .87 |
Distributions from net investment income | (.26) | (.14) | (.13) | (.08) | (.03) |
Distributions from net realized gain | (.43) | - | - | - | - |
Total distributions | (.69) | (.14) | (.13) | (.08) | (.03) |
Redemption fees added to paid in capital C | .02 | .01 | .02 | .01 | .02 |
Net asset value, end of period | $ 25.59 | $ 18.70 | $ 14.87 | $ 13.72 | $ 9.96 |
Total Return A,B | 41.50% | 26.84% | 9.39% | 38.81% | 9.75% |
Ratios to Average Net Assets D,F | | | | | |
Expenses before reductions | 1.21% | 1.20% | 1.21% | 1.32% | 1.54% |
Expenses net of fee waivers, if any | 1.21% | 1.20% | 1.21% | 1.32% | 1.54% |
Expenses net of all reductions | 1.04% | 1.09% | 1.20% | 1.32% | 1.50% |
Net investment income (loss) | 1.44% | 1.71% | 1.11% | 1.35% | .54% |
Supplemental Data | | | | | |
Net assets, end of period (000 omitted) | $ 1,592,948 | $ 783,765 | $ 464,874 | $ 395,554 | $ 245,651 |
Portfolio turnover rate E | 100% | 109% | 131% | 115% | 131% |
A Total returns would have been lower had certain expenses not been reduced during the periods shown. B Total returns do not include the effect of the former sales charges. C Calculated based on average shares outstanding during the period. D Fees and expenses of the underlying Fidelity Central Funds are not included in the Fund's expense ratio. The Fund indirectly bears its proportionate share of the expense of any underlying Fidelity Central Funds. E Amount does not include the portfolio activity of any underlying Fidelity Central Funds. F Expense ratios reflect operating expenses of the Fund. Expenses before reductions do not reflect amounts reimbursed by the investment adviser or reductions from brokerage service arrangements or other expense offset arrangements and do not represent the amount paid by the Fund during periods when reimbursements or reductions occur. Expenses net of fee waivers reflect expenses after reimbursement by the investment adviser but prior to reductions from brokerage service arrangements or other expense offset arrangements. Expenses net of all reductions represent the net expenses paid by the Fund. |
Annual Report
See accompanying notes which are an integral part of the financial statements.
Notes to Financial Statements
For the period ended October 31, 2006
1. Significant Accounting Policies.
Fidelity Canada Fund, Fidelity China Region Fund, Fidelity Emerging Markets Fund, Fidelity Europe Fund, Fidelity Europe Capital Appreciation Fund, Fidelity Japan Fund, Fidelity Japan Smaller Companies Fund, Fidelity Latin America Fund, Fidelity Nordic Fund, Fidelity Pacific Basin Fund, and Fidelity Southeast Asia Fund (the Funds) are Funds of Fidelity Investment Trust (the trust). The trust is registered under the Investment Company Act of 1940, as amended (the 1940 Act), as an open-end management investment company organized as a Massachusetts business trust. The Funds are diversified with the exception of Fidelity Latin America Fund. Each Fund is authorized to issue an unlimited number of shares. Effective the close of business on February 28, 2006, Fidelity Japan Smaller Companies Fund was closed to most new accounts. Certain Funds' investments in emerging markets can be subject to social, economic, regulatory, and political uncertainties and can be extremely volatile. The Funds may invest in Fidelity Central Funds which are open-end investment companies available to investment companies and other accounts managed by Fidelity Management & Research Company (FMR) and its affiliates. The financial statements have been prepared in conformity with accounting principles generally accepted in the United States of America, which require management to make certain estimates and assumptions at the date of the financial statements. The following summarizes the significant accounting policies of the Funds, which are also consistently followed by the Fidelity Central Funds:
Security Valuation. Investments are valued and net asset value (NAV) per share is calculated (NAV calculation) as of the close of business of the New York Stock Exchange (NYSE), normally 4:00 p.m. Eastern time. Wherever possible, each Fund uses independent pricing services approved by the Board of Trustees to value their investments.
Equity securities, including restricted securities, for which market quotations are readily available, are valued at the last reported sale price or official closing price as reported by an independent pricing service on the primary market or exchange on which they are traded. In the event there were no sales during the day or closing prices are not available, securities are valued at the last quoted bid price. Debt securities, including restricted securities, for which quotations are readily available, are valued by independent pricing services or by dealers who make markets in such securities. Pricing services consider yield or price of bonds of comparable quality, coupon, maturity and type as well as dealer supplied prices. Investments in open-end mutual Funds, including the Fidelity Central Funds, are valued at their closing net asset value each business day. Short-term securities with remaining maturities of sixty days or less for which quotations are not readily available are valued at amortized cost, which approximates value.
When current market prices or quotations are not readily available or do not accurately reflect fair value, valuations may be determined in accordance with procedures adopted by the Board of Trustees. For example, when developments occur between the close of a market and the close of the NYSE that may materially affect the value of some or all of the securities, or when trading in a security is halted, those securities may be fair valued. Factors used in the determination of fair value may include monitoring news to identify significant market or security specific events such as changes in the value of U.S. securities markets, reviewing developments in foreign markets and evaluating the performance of ADRs, futures contracts and exchange-traded funds. Because each Fund's utilization of fair value pricing depends on market activity, the frequency with which fair value pricing is used can not be predicted and may be utilized to a significant extent. The value of securities used for NAV calculation under fair value pricing may differ from published prices for the same securities.
Foreign Currency. Certain Funds may use foreign currency contracts to facilitate transactions in foreign-denominated securities. Losses from these transactions may arise from changes in the value of the foreign currency or if the counterparties do not perform under the contracts' terms.
Foreign-denominated assets, including investment securities, and liabilities are translated into U.S. dollars at the exchange rate at period end. Purchases and sales of investment securities, income and dividends received and expenses denominated in foreign currencies are translated into U.S. dollars at the exchange rate in effect on the transaction date.
The effects of exchange rate fluctuations on investments are included with the net realized and unrealized gain (loss) on investment securities. Other foreign currency transactions resulting in realized and unrealized gain (loss) are disclosed separately.
Investment Transactions and Income. Security transactions, including the Fund's investment activity in the Fidelity Central Funds, are accounted for as of trade date. Gains and losses on securities sold are determined on the basis of identified cost and may include proceeds received from litigation. Dividend income is recorded on the ex-dividend date, except for certain dividends from foreign securities where the ex-dividend date may have passed, which are recorded as soon as the Fund is informed of the ex-dividend date. Non-cash dividends included in dividend income, if any, are recorded at the fair market value of the securities received. Distributions received on securities that represent a return of capital or capital gain are recorded as a reduction of cost of investments and/or as a realized gain. The Funds estimate the components of distributions received that may be considered return of capital distributions or capital gain distributions. Large, non-recurring dividends recognized by the Funds are presented separately on the Statement of Operations as "Special Dividends" and the impact of these dividends is presented in the Financial Highlights. Interest income and distributions from the Fidelity Central Funds are accrued as earned. Interest income includes coupon interest and amortization of premium and accretion of discount on debt securities. Investment income is recorded net of foreign taxes withheld where recovery of such taxes is uncertain.
Annual Report
Notes to Financial Statements - continued
1. Significant Accounting Policies - continued
Expenses. Most expenses of the trust can be directly attributed to a Fund. Expenses which cannot be directly attributed are apportioned among each Fund in the trust. Expense estimates are accrued in the period to which they relate and adjustments are made when actual amounts are known.
Income Tax Information and Distributions to Shareholders. Each year, each Fund intends to qualify as a regulated investment company by distributing all of its taxable income and realized gains under Subchapter M of the Internal Revenue Code. As a result, no provision for income taxes is required in the accompanying financial statements. Foreign taxes are provided for based on each Fund's understanding of the tax rules and rates that exist in the foreign markets in which it invests.
Distributions are recorded on the ex-dividend date. Income and capital gain distributions are determined in accordance with income tax regulations, which may differ from generally accepted accounting principles. In addition, certain Funds will claim a portion of the payment made to redeeming shareholders as a distribution for income tax purposes.
Capital accounts within the financial statements are adjusted for permanent book-tax differences. These adjustments have no impact on net assets or the results of operations. Temporary book-tax differences will reverse in a subsequent period.
Book-tax differences are primarily due to short-term capital gains, foreign currency transactions, certain foreign taxes, passive foreign investment companies (PFIC), market discount, deferred trustees compensation, capital loss carryforwards and losses deferred due to wash sales.
The tax-basis components of distributable earnings and the federal tax cost as of period end were as follows for each Fund:
| Cost for Federal
Income Tax Purposes | Unrealized
Appreciation | Unrealized
Depreciation | Net Unrealized
Appreciation/
(Depreciation) |
Canada | $ 2,593,022,747 | $ 748,831,362 | $ (42,560,057) | $ 706,271,305 |
China Region | 581,224,096 | 164,666,654 | (9,502,497) | 155,164,157 |
Emerging Markets A | 2,461,317,288 | 527,177,754 | (139,395,612) | 387,782,142 |
Europe | 3,563,010,009 | 518,285,375 | (27,918,708) | 490,366,667 |
Europe Capital Appreciation | 1,008,906,970 | 111,200,919 | (20,178,233) | 91,022,686 |
Japan | 1,640,357,256 | 247,959,938 | (32,496,480) | 215,463,458 |
Japan Smaller Companies | 1,068,190,107 | 307,323,977 | (49,459,248) | 257,864,729 |
Latin America | 2,205,385,772 | 955,403,306 | (50,367,474) | 905,035,832 |
Nordic | 285,795,757 | 71,666,335 | (4,560,230) | 67,106,105 |
Pacific Basin | 865,883,204 | 209,802,857 | (56,739,151) | 153,063,706 |
Southeast Asia | 1,225,279,180 | 388,260,354 | (19,589,022) | 368,671,332 |
| Undistributed
Ordinary Income | Undistributed
Long-term Capital
Gain | Capital Loss
Carryforward |
Canada | $ 37,445,537 | $ 44,242,104 | $ - |
China Region | 8,832,964 | 6,820,131 | - |
Emerging Markets A | 15,836,412 | - | (68,894,724) |
Europe | 117,473,117 | 417,963,692 | - |
Europe Capital Appreciation | 19,924,327 | 82,471,161 | - |
Japan | 592,249 | 23,360,642 | - |
Japan Smaller Companies | 622,390 | 30,592,320 | - |
Latin America | 38,057,944 | 59,944,863 | - |
Nordic | 2,982,841 | 5,290,808 | - |
Pacific Basin | 14,384,230 | 66,684,071 | - |
Southeast Asia | 33,462,088 | 64,217,791 | - |
A Tax information based on the Fund's tax year end of September 30, 2006.
Annual Report
1. Significant Accounting Policies - continued
Income Tax Information and Distributions to Shareholders - continued
The tax character of distributions paid was as follows:
October 31, 2006 | Ordinary Income | Long-term
Capital Gains | Return of Capital | Total |
Canada | $ 7,894,925 | $ - | $ - | $ 7,894,925 |
China Region | 4,953,820 | - | - | 4,953,820 |
Emerging Markets | 21,238,863 | - | - | 21,238,863 |
Europe | 123,923,515 | 170,050,004 | - | 293,973,519 |
Europe Capital Appreciation | 20,210,635 | 39,400,503 | - | 59,611,138 |
Japan | 2,482,546 | - | - | 2,482,546 |
Japan Smaller Companies | 2,096,615 | 87,009,291 | - | 89,105,906 |
Latin America | 25,559,551 | 20,858,777 | - | 46,418,328 |
Nordic | 2,048,598 | 14,574,214 | - | 16,622,812 |
Pacific Basin | 10,443,689 | 4,914,659 | - | 15,358,348 |
Southeast Asia | 11,222,484 | 18,514,528 | - | 29,737,012 |
October 31, 2005 | | | | |
Canada | $ 1,384,456 | $ - | $ - | $ 1,384,456 |
China Region | 4,953,877 | - | - | 4,953,877 |
Emerging Markets | 5,999,282 | - | - | 5,999,282 |
Europe | 10,681,206 | - | - | 10,681,206 |
Europe Capital Appreciation | 4,798,330 | - | - | 4,798,330 |
Japan | - | - | - | - |
Japan Smaller Companies | 2,127,742 | 4,259,030 | - | 6,386,772 |
Latin America | 6,575,674 | - | - | 6,575,674 |
Nordic | 1,181,664 | - | - | 1,181,664 |
Pacific Basin | 5,223,884 | - | - | 5,223,884 |
Southeast Asia | 4,393,636 | - | - | 4,393,636 |
New Accounting Pronouncements. In July 2006, Financial Accounting Standards Board Interpretation No. 48, Accounting for Uncertainty in Income Taxes - an interpretation of FASB Statement 109 (FIN 48), was issued and is effective for fiscal years beginning after December 15, 2006. FIN 48 sets forth a threshold for financial statement recognition, measurement and disclosure of a tax position taken or expected to be taken on a tax return. Management is currently evaluating the impact, if any, the adoption of FIN 48 will have on the Funds' net assets, results of operations and financial statement disclosures.
In addition, in September 2006, Statement of Financial Accounting Standards No. 157, Fair Value Measurements (SFAS 157), was issued and is effective for fiscal years beginning after November 15, 2007. SFAS 157 defines fair value, establishes a framework for measuring fair value and expands disclosures about fair value measurements. Management is currently evaluating the impact the adoption of SFAS 157 will have on the Funds' financial statement disclosures.
Short-Term Trading (Redemption) Fees. Shares held in Canada, China Region, Emerging Markets, Japan, Japan Smaller Companies, Latin America, Nordic, Pacific Basin and Southeast Asia less than 90 days are subject to a redemption fee equal to 1.50% of the proceeds of the redeemed shares. Shares held in Europe and Europe Capital Appreciation less than 30 days are subject to a redemption fee equal to 1.00% of the proceeds of the redeemed shares. All redemption fees, including any estimated redemption fees paid by FMR, are retained by the Funds and accounted for as an addition to paid in capital.
2. Operating Policies.
Repurchase Agreements. FMR has received an Exemptive Order from the Securities and Exchange Commission (the SEC) which permits certain Funds and other affiliated entities of FMR to transfer uninvested cash balances into joint trading accounts which are then invested in repurchase agreements. Certain Funds may also invest directly with institutions in repurchase agreements. Repurchase agreements are collateralized by government or non-government securities. Upon settlement date, collateral is held in segregated accounts with custodian banks and may be obtained in the event of a default of the counterparty. Each applicable Fund monitors, on a daily basis, the value of the collateral to ensure it is at least equal to the principal amount of the repurchase agreement (including accrued interest). In the event of a default by the counterparty, realization of the collateral proceeds could be delayed, during which time the value of the collateral may decline.
Annual Report
Notes to Financial Statements - continued
2. Operating Policies - continued
Futures Contracts. Certain Funds may use futures contracts to manage their exposure to the stock market. Buying futures tends to increase a Fund's exposure to the underlying instrument, while selling futures tends to decrease a Fund's exposure to the underlying instrument or hedge other Fund investments. Upon entering into a futures contract, a Fund is required to deposit with a clearing broker, no later than the following business day, an amount ("initial margin") equal to a certain percentage of the face value of the contract. The initial margin may be in the form of cash or securities and is transferred to a segregated account on settlement date. Subsequent payments ("variation margin") are made or received by a Fund depending on the daily fluctuations in the value of the futures contract and are accounted for as unrealized gains or losses. Realized gains (losses) are recorded upon the expiration or closing of the futures contract. Securities deposited to meet margin requirements are identified in each applicable Fund's Schedule of Investments. Losses may arise from changes in the value of the underlying instruments or if the counterparties do not perform under the contract's terms. Futures contracts are valued at the settlement price established each day by the board of trade or exchange on which they are traded.
Restricted Securities. Certain Funds may invest in securities that are subject to legal or contractual restrictions on resale. These securities generally may be resold in transactions exempt from registration or to the public if the securities are registered. Disposal of these securities may involve time-consuming negotiations and expense, and prompt sale at an acceptable price may be difficult. Information regarding restricted securities is included at the end of each applicable Fund's Schedule of Investments.
3. Purchases and Sales of Investments.
Purchases and sales of securities, other than short-term securities, are noted in the table below.
| Purchases ($) | Sales ($) |
Canada | 2,188,856,341 | 1,279,329,289 |
China Region | 321,521,474 | 182,029,415 |
Emerging Markets | 2,665,253,794 | 1,704,424,978 |
Europe | 4,764,484,679 | 4,009,626,045 |
Europe Capital Appreciation | 1,178,604,214 | 915,505,539 |
Japan | 1,892,647,788 | 1,341,274,857 |
Japan Smaller Companies | 1,607,360,476 | 1,740,288,204 |
Latin America | 2,585,248,374 | 1,487,546,255 |
Nordic | 279,900,687 | 175,553,382 |
Pacific Basin | 929,562,673 | 748,085,312 |
Southeast Asia | 1,640,186,583 | 1,216,091,869 |
4. Fees and Other Transactions with Affiliates.
Management Fee. FMR and its affiliates provide the Funds with investment management related services for which the Funds pay a monthly management fee. The management fee is the sum of an individual fund fee rate and a group fee rate. The individual fund fee rate is applied to each Fund's average net assets. The group fee rate is based upon the average net assets of all the mutual funds advised by FMR. The group fee rate decreases as assets under management increase and increases as assets under management decrease. In addition, the management fee for Canada, Europe, Europe Capital Appreciation, Japan, Pacific Basin, and Southeast Asia is subject to a performance adjustment (up to a maximum ±.20% of each applicable Fund's average net assets over a 36 month performance period). The upward or downward adjustment to the management fee is based on each Fund's relative investment performance as compared to an appropriate benchmark index. For the period, each Fund's annual management fee rate expressed as a percentage of each Fund's average net assets, including the performance adjustment, if applicable was as follows:
| Individual Rate | Group Rate | Total |
Canada | .45% | .27% | .70% |
China Region | .45% | .27% | .71% |
Emerging Markets | .45% | .27% | .72% |
Europe | .45% | .27% | .84% |
Europe Capital Appreciation | .45% | .27% | .76% |
Japan | .45% | .27% | .77% |
Japan Smaller Companies | .45% | .27% | .72% |
Latin America | .45% | .27% | .72% |
Nordic | .45% | .27% | .71% |
Pacific Basin | .45% | .27% | .76% |
Southeast Asia | .45% | .27% | .81% |
Annual Report
4. Fees and Other Transactions with Affiliates - continued
Transfer Agent Fees. Fidelity Service Company, Inc. (FSC), an affiliate of FMR, is the Funds' transfer, dividend disbursing and shareholder servicing agent. FSC receives account fees and asset-based fees that vary according to account size and type of account. FSC pays for typesetting, printing and mailing of shareholder reports, except proxy statements. For the period, the transfer agent fees were equivalent to the following annual rates expressed as a percentage of average net assets:
Canada | .23% |
China Region | .26% |
Emerging Markets | .22% |
Europe | .23% |
Europe Capital Appreciation | .22% |
Japan | .22% |
Japan Smaller Companies | .20% |
Latin America | .21% |
Nordic | .26% |
Pacific Basin | .23% |
Southeast Asia | .22% |
Accounting and Security Lending Fees. FSC maintains each Fund's accounting records. The accounting fee is based on the level of average net assets for the month. Under a separate contract, FSC administers the security lending program. The security lending fee is based on the number and duration of lending transactions.
Investments in Fidelity Central Funds. The Funds may invest in Fidelity Central Funds. The Funds' Schedule of Investments lists each of the Fidelity Central Funds as an investment of each Fund but does not include the underlying holdings of each Fidelity Central Fund. As an Investing Fund, the Funds indirectly bear their proportionate share of the expenses of the underlying Fidelity Central Funds. A complete unaudited list of holdings for each Fidelity Central Fund is available upon request. In addition, the financial statements of the Fidelity Central Funds, which are not covered by the Funds' Report of Independent Registered Public Accounting Firm, are available on the EDGAR Database on the SEC's web site, www.sec.gov, or upon request.
The Money Market Central Funds seek preservation of capital and current income and are managed by Fidelity Investments Money Management, Inc. (FIMM), an affiliate of FMR.
Brokerage Commissions. Certain Funds placed a portion of their portfolio transactions with brokerage firms which are affiliates of the investment adviser. The commissions paid to these affiliated firms were as follows:
| Amount |
Canada | $ 1,348 |
Emerging Markets | 1,131 |
Europe Capital Appreciation | 73 |
Latin America | 7,206 |
Pacific Basin | 19 |
Southeast Asia | 192 |
Interfund Lending Program. Pursuant to an Exemptive Order issued by the SEC, the Funds, along with other registered investment companies having management contracts with FMR, may participate in an interfund lending program. This program provides an alternative credit facility allowing the Funds to borrow from, or lend money to, other participating affiliated Funds. At period end, there were no interfund loans outstanding. Each applicable Fund's activity in this program during the period for which loans were outstanding was as follows:
| Borrower or
Lender | Average Daily Loan Balance | Weighted Average Interest Rate | Interest
Expense |
Canada | Borrower | $ 8,941,400 | 5.16% | $ 6,407 |
Emerging Markets | Borrower | 35,841,000 | 5.13% | 143,131 |
Europe | Borrower | 10,759,143 | 4.13% | 8,644 |
Japan | Borrower | 6,416,000 | 4.39% | 782 |
Japan Smaller Companies | Borrower | 8,983,333 | 5.23% | 3,918 |
Latin America | Borrower | 61,462,889 | 5.14% | 157,914 |
Pacific Basin | Borrower | 8,615,484 | 5.19% | 38,517 |
Annual Report
Notes to Financial Statements - continued
5. Committed Line of Credit.
Certain Funds participate with other Funds managed by FMR in a $4.2 billion credit facility (the "line of credit") to be utilized for temporary or emergency purposes to fund shareholder redemptions or for other short-term liquidity purposes. The participating Funds have agreed to pay commitment fees on their pro rata portion of the line of credit, which is reflected in Miscellaneous Expense on the Statement of Operations, and is as follows:
Canada | $ 7,000 |
China Region | 1,447 |
Emerging Markets | 5,918 |
Europe | 8,652 |
Europe Capital Appreciation | 1,804 |
Japan | 4,666 |
Japan Smaller Companies | 4,767 |
Latin America | 5,674 |
Nordic | 695 |
Pacific Basin | 2,270 |
Southeast Asia | 2,747 |
During the period, there were no borrowings on this line of credit.
6. Security Lending.
Certain Funds lend portfolio securities from time to time in order to earn additional income. On the settlement date of the loan, each applicable Fund receives collateral (in the form of U.S. Treasury obligations, letters of credit and/or cash) against the loaned securities and maintains collateral in an amount not less than 100% of the market value of the loaned securities during the period of the loan. The market value of the loaned securities is determined at the close of business of the Funds and any additional required collateral is delivered to the Funds on the next business day. If the borrower defaults on its obligation to return the securities loaned because of insolvency or other reasons, a Fund could experience delays and costs in recovering the securities loaned or in gaining access to the collateral. Any cash collateral received is invested in the Fidelity Securities Lending Cash Central Fund. The value of loaned securities and cash collateral at period end are disclosed on each applicable Fund's Statement of Assets and Liabilities. Security lending income represents the income earned on investing cash collateral, less fees and expenses associated with the loan, plus any premium payments that may be received on the loan of certain types of securities. Security lending income is presented on each applicable Fund's Statement of Operations as a component of income from Fidelity Central Funds.
7. Bank Borrowings.
Each Fund is permitted to have bank borrowings for temporary or emergency purposes to fund shareholder redemptions. Each Fund has established borrowing arrangements with certain banks. The interest rate on the borrowings is the bank's base rate, as revised from time to time. At period end, there were no bank borrowings outstanding. Each applicable Fund's activity in this program during the period for which loans were outstanding was as follows:
| Average Daily
Loan Balance | Weighted Average
Interest Rate |
Canada | $ 9,500,000 | 5.06% |
Emerging Markets | 24,604,455 | 5.27% |
Europe | 61,478,000 | 4.44% |
Latin America | 1,536,000 | 5.25% |
Pacific Basin | 9,459,500 | 5.55% |
Annual Report
8. Expense Reductions.
Many of the brokers with whom FMR places trades on behalf of certain Funds provided services to these Funds in addition to trade execution. These services included payments of expenses on behalf of each applicable Fund. In addition, through arrangements with each applicable Fund's custodian and transfer agent, credits realized as a result of uninvested cash balances were used to reduce each applicable Fund's expenses. All of the applicable expense reductions are noted in the table below.
| Brokerage
Service
Arrangements | Custody
expense
reduction | Transfer Agent
expense
reduction |
Canada | $ 705,540 | $ 54,443 | $ 57,564 |
China Region | 334,568 | 2,064 | 7,480 |
Emerging Markets | 2,486,881 | 7,794 | 60,947 |
Europe | 3,244,162 | 5,861 | 207,241 |
Europe Capital Appreciation | 648,597 | - | 7,614 |
Japan | 307,888 | 48 | 60,497 |
Japan Smaller Companies | 232,049 | 40 | 14,586 |
Latin America | 665,080 | 9,095 | 43,344 |
Nordic | 87,527 | - | 4,526 |
Pacific Basin | 572,164 | - | 30,563 |
Southeast Asia | 2,127,637 | - | 36,034 |
9. Other.
The Funds' organizational documents provide former and current trustees and officers with a limited indemnification against liabilities arising in connection with the performance of their duties to the Funds. In the normal course of business, the Funds may also enter into contracts that provide general indemnifications. The Funds' maximum exposure under these arrangements is unknown as this would be dependent on future claims that may be made against the Funds. The risk of material loss from such claims is considered remote.
At the end of the period, Fidelity Freedom Fund 2010 was the owner of record of approximately 10% of the total outstanding shares of Europe. Fidelity Freedom Fund 2020 was the owner of record of approximately 19% and 12% of the total outstanding shares of Europe and Japan, respectively. Fidelity Freedom Fund 2030 was the owner of record of approximately 14% of the total outstanding shares of Europe. The Fidelity Freedom Funds were the owners of record, in the aggregate, of approximately 61%, 39% and 22% of the total outstanding shares of Europe, Japan and Southeast Asia, respectively.
10. Other Matters Regarding Canada, China Region, Emerging Markets, Europe, Europe Capital Appreciation and Latin America.
The United States Securities and Exchange Commission ("SEC") is conducting an investigation of FMR (covering the years 2002 to 2004) arising from gifts, gratuities and business entertainment provided by certain brokers to certain individuals who were employed on FMR's domestic equity trading desk during that period. FMR is in discussions with the SEC staff regarding the possible resolution of the matter, but as of period-end no final resolution has been reached.
In December 2006, the Independent Trustees completed their own investigation of the matter with the assistance of independent counsel. The Independent Trustees and FMR agree that, despite the absence of proof that the Fidelity mutual funds experienced diminished execution quality as a result of the improper receipt of gifts and business entertainment, the conduct at issue was serious and is worthy of redress. Accordingly, the Independent Trustees have requested and FMR has agreed to pay $42 million to Fidelity mutual funds, plus interest to be determined at the time that payment is made. A method of allocating this payment among the funds has not yet been determined. In addition, FMR has agreed to reimburse related legal expenses. The total payment to each of the Funds listed above is not anticipated to have a material impact on such Fund's net assets.
11. Reorganization.
On December 14, 2006, the Board of Trustees of Fidelity Europe Fund and Fidelity Nordic Fund approved an Agreement and Plan of Reorganization between Fidelity Europe Fund and Fidelity Nordic Fund. The agreement provides for the transfer of all of the assets and the assumption of all of the liabilities of Fidelity Nordic Fund in exchange solely for the number of equivalent shares of Fidelity Europe Fund, having the same aggregate net asset value as the outstanding shares of Fidelity Nordic Fund, on the day that the reorganization is effective.
A shareholder meeting of Fidelity Nordic Fund is expected to be held on May 16, 2007 to vote on the reorganization. If approved by shareholders of Fidelity Nordic Fund the reorganization is expected to become effective on or about June 22, 2007. The reorganization is expected to qualify as a tax-free transaction with no gain or loss recognized by the Funds or their shareholders.
Annual Report
Report of Independent Registered Public Accounting Firm
To the Trustees of Fidelity Investment Trust and the Shareholders of:
Fidelity Canada Fund,
Fidelity China Region Fund,
Fidelity Emerging Markets Fund,
Fidelity Europe Fund,
Fidelity Japan Fund,
Fidelity Japan Smaller Companies Fund,
Fidelity Latin America Fund,
Fidelity Nordic Fund,
Fidelity Pacific Basin Fund,
Fidelity Southeast Asia Fund
In our opinion, the accompanying statements of assets and liabilities, including the schedules of investments, and the related statements of operations and of changes in net assets and the financial highlights present fairly, in all material respects, the financial position of Fidelity Canada Fund, Fidelity China Region Fund, Fidelity Emerging Markets Fund, Fidelity Europe Fund, Fidelity Japan Fund, Fidelity Japan Smaller Companies Fund, Fidelity Latin America Fund, Fidelity Nordic Fund, Fidelity Pacific Basin Fund and Fidelity Southeast Asia Fund (funds of Fidelity Investment Trust) at October 31, 2006 and the results of their operations for the year then ended, the changes in their net assets for each of the two years in the period then ended and the financial highlights for each of the five years in the period then ended, in conformity with accounting principles generally accepted in the United States of America. These financial statements and financial highlights (hereafter referred to as "financial statements") are the responsibility of the Fidelity Investment Trust's management; our responsibility is to express an opinion on these financial statements based on our audits. We conducted our audits of these financial statements in accordance with the standards of the Public Company Accounting Oversight Board (United States). Those standards require that we plan and perform the audit to obtain reasonable assurance about whether the financial statements are free of material misstatement. An audit includes examining, on a test basis, evidence supporting the amounts and disclosures in the financial statements, assessing the accounting principles used and significant estimates made by management, and evaluating the overall financial statement presentation. We believe that our audits, which included confirmation of securities at October 31, 2006 by correspondence with the custodians and brokers, provide a reasonable basis for our opinion.
/s/PricewaterhouseCoopers LLP
PricewaterhouseCoopers LLP
Boston, Massachusetts
December 21, 2006
Annual Report
Report of Independent Registered Public Accounting Firm
To the Trustees of Fidelity Investment Trust and Shareholders of Fidelity Europe Capital Appreciation Fund:
We have audited the accompanying statement of assets and liabilities of Fidelity Europe Capital Appreciation Fund (the Fund), a fund of Fidelity Investment Trust (the Trust), including the schedule of investments, as of October 31, 2006, and the related statement of operations for the year then ended, the statement of changes in net assets for each of the two years in the period then ended, and the financial highlights for each of the five years in the period then ended. These financial statements and financial highlights are the responsibility of the Fund's management. Our responsibility is to express an opinion on these financial statements and financial highlights based on our audits.
We conducted our audits in accordance with standards of the Public Company Accounting Oversight Board (United States). Those standards require that we plan and perform the audit to obtain reasonable assurance about whether the financial statements and financial highlights are free of material misstatement. The Fund is not required to have, nor were we engaged to perform, an audit of its internal control over financial reporting. Our audits included consideration of internal control over financial reporting as a basis for designing audit procedures that are appropriate in the circumstances, but not for the purpose of expressing an opinion on the effectiveness of the Fund's internal control over financial reporting. Accordingly, we express no such opinion. An audit also includes examining, on a test basis, evidence supporting the amounts and disclosures in the financial statements, assessing the accounting principles used and significant estimates made by management, as well as evaluating the overall financial statement presentation. Our procedures included confirmation of securities owned as of October 31, 2006, by correspondence with the custodians and brokers; where replies were not received from brokers, we performed other auditing procedures. We believe that our audits provide a reasonable basis for our opinion.
In our opinion, the financial statements and financial highlights referred to above present fairly, in all material respects, the financial position of Fidelity Europe Capital Appreciation Fund as of October 31, 2006, the results of its operations for the year then ended, the changes in its net assets for each of the two years in the period then ended, and its financial highlights for each of the five years in the period then ended, in conformity with accounting principles generally accepted in the United States of America.
DELOITTE & TOUCHE LLP
Boston, Massachusetts
December 21, 2006
Annual Report
Trustees and Officers
The Trustees, Members of the Advisory Board, and executive officers of the trust and funds, as applicable, are listed below. The Board of Trustees governs each fund and is responsible for protecting the interests of shareholders. The Trustees are experienced executives who meet periodically throughout the year to oversee each fund's activities, review contractual arrangements with companies that provide services to each fund, and review each fund's performance. Except for William O. McCoy, each of the Trustees oversees 348 funds advised by FMR or an affiliate. Mr. McCoy oversees 350 funds advised by FMR or an affiliate.
The Trustees hold office without limit in time except that (a) any Trustee may resign; (b) any Trustee may be removed by written instrument, signed by at least two-thirds of the number of Trustees prior to such removal; (c) any Trustee who requests to be retired or who has become incapacitated by illness or injury may be retired by written instrument signed by a majority of the other Trustees; and (d) any Trustee may be removed at any special meeting of shareholders by a two-thirds vote of the outstanding voting securities of the trust. Each Trustee who is not an interested person (as defined in the 1940 Act) (Independent Trustee), shall retire not later than the last day of the calendar year in which his or her 72nd birthday occurs. The Independent Trustees may waive this mandatory retirement age policy with respect to individual Trustees. The executive officers and Advisory Board Members hold office without limit in time, except that any officer and Advisory Board Member may resign or may be removed by a vote of a majority of the Trustees at any regular meeting or any special meeting of the Trustees. Except as indicated, each individual has held the office shown or other offices in the same company for the past five years.
The funds' Statement of Additional Information (SAI) includes more information about the Trustees. To request a free copy, call Fidelity at 1-800-544-8544.
Interested Trustees*:
Correspondence intended for each Trustee who is an interested person may be sent to Fidelity Investments, 82 Devonshire Street, Boston, Massachusetts 02109.
Name, Age; Principal Occupation |
Edward C. Johnson 3d (76) |
| Year of Election or Appointment: 1984 Mr. Johnson is Chairman of the Board of Trustees. Mr. Johnson serves as President (2006-present), Chief Executive Officer, Chairman, and a Director of FMR Corp.; Chairman and a Director of FMR; Chairman and a Director of Fidelity Research & Analysis Company (FRAC); Chairman and a Director of Fidelity Investments Money Management, Inc.; and Chairman (2001- present) and a Director of FMR Co., Inc. In addition, Mr. Johnson serves as Chairman and Director of Fidelity International Limited (FIL). |
Stephen P. Jonas (53) |
| Year of Election or Appointment: 2005 Mr. Jonas is Senior Vice President of Canada (2005-present), China Region (2005-present), Emerging Markets (2005-present), Europe (2005-present), Europe Capital Apperciation (2005-present), Japan (2005-present), Japan Smaller Companies (2005-present), Latin America (2005-present), Nordic (2005-present), Pacific Basin (2005-present), and Southeast Asia (2005-present). He also serves as Senior Vice President of other Fidelity funds (2005-present). Mr. Jonas is Executive Director of FMR (2005-present) and FMR Co., Inc. (2005-present). He also serves as a Director of Fidelity Investments Money Management, Inc. (2005-present) and FMR Corp. (2003-present). Previously, Mr. Jonas served as President of Fidelity Enterprise Operations and Risk Services (2004-2005), Chief Administrative Officer (2002-2004), and Chief Financial Officer of FMR Corp. (1998-2002). In addition, he serves on the Boards of Boston Ballet (2003-present) and Simmons College (2003-present). |
Robert L. Reynolds (54) |
| Year of Election or Appointment: 2003 Mr. Reynolds is President and a Director of FMR (2005-present), Fidelity Investments Money Management, Inc. (2005-present), and FMR Co., Inc. (2005-present). Mr. Reynolds also serves as Vice Chairman (2006-present), a Director (2003-present), and Chief Operating Officer of FMR Corp. and a Director of Strategic Advisers, Inc. (2005-present). He also serves on the Board at Fidelity Investments Canada, Ltd. |
* Trustees have been determined to be "Interested Trustees" by virtue of, among other things, their affiliation with the trust or various entities under common control with FMR.
Annual Report
Trustees and Officers - continued
Independent Trustees:
Correspondence intended for each Independent Trustee (that is, the Trustees other than the Interested Trustees) may be sent to Fidelity Investments, P.O. Box 55235, Boston, Massachusetts 02205-5235.
Name, Age; Principal Occupation |
Dennis J. Dirks (58) |
| Year of Election or Appointment: 2005 Prior to his retirement in May 2003, Mr. Dirks was Chief Operating Officer and a member of the Board of The Depository Trust & Clearing Corporation (DTCC) (1999-2003). He also served as President, Chief Operating Officer, and Board member of The Depository Trust Company (DTC) (1999-2003) and President and Board member of the National Securities Clearing Corporation (NSCC) (1999-2003). In addition, Mr. Dirks served as Chief Executive Officer and Board member of the Government Securities Clearing Corporation (2001-2003) and Chief Executive Officer and Board member of the Mortgage-Backed Securities Clearing Corporation (2001-2003). Mr. Dirks also serves as a Trustee and a member of the Finance Committee of Manhattan College (2005-present) and a Trustee and a member of the Finance Committee of AHRC of Nassau County (2006-present). |
Albert R. Gamper, Jr. (64) |
| Year of Election or Appointment: 2006 Prior to his retirement in December 2004, Mr. Gamper served as Chairman of the Board of CIT Group Inc. (commercial finance). During his tenure with CIT Group Inc. Mr. Gamper served in numerous senior management positions, including Chairman (1987-1989; 1999-2001; 2002-2004), Chief Executive Officer (1987-2004), and President (1989-2002). He currently serves as a member of the Board of Directors of Public Service Enterprise Group (utilities, 2001-present), Chairman of the Board of Governors, Rutgers University (2004-present), and Chairman of the Board of Saint Barnabas Health Care System. |
George H. Heilmeier (70) |
| Year of Election or Appointment: 2004 Dr. Heilmeier is Chairman Emeritus of Telcordia Technologies (communication software and systems), where prior to his retirement, he served as company Chairman and Chief Executive Officer. He currently serves on the Boards of Directors of The Mitre Corporation (systems engineering and information technology support for the government), and HRL Laboratories (private research and development, 2004-present). He is Chairman of the General Motors Science & Technology Advisory Board and a Life Fellow of the Institute of Electrical and Electronics Engineers (IEEE). Dr. Heilmeier is a member of the Defense Science Board and the National Security Agency Advisory Board. He is also a member of the National Academy of Engineering, the American Academy of Arts and Sciences, and the Board of Overseers of the School of Engineering and Applied Science of the University of Pennsylvania. Previously, Dr. Heilmeier served as a Director of TRW Inc. (automotive, space, defense, and information technology, 1992-2002), Compaq (1994-2002), Automatic Data Processing, Inc. (ADP) (technology-based business outsourcing, 1995-2002), INET Technologies Inc. (telecommunications network surveillance, 2001-2004), and Teletech Holdings (customer management services). He is the recipient of the 2005 Kyoto Prize in Advanced Technology for his invention of the liquid crystal display, and a member of the Consumer Electronics Hall of Fame. |
Marie L. Knowles (60) |
| Year of Election or Appointment: 2001 Prior to Ms. Knowles' retirement in June 2000, she served as Executive Vice President and Chief Financial Officer of Atlantic Richfield Company (ARCO) (diversified energy, 1996-2000). From 1993 to 1996, she was a Senior Vice President of ARCO and President of ARCO Transportation Company. She served as a Director of ARCO from 1996 to 1998. She currently serves as a Director of Phelps Dodge Corporation (copper mining and manufacturing) and McKesson Corporation (healthcare service, 2002-present). Ms. Knowles is a Trustee of the Brookings Institution and the Catalina Island Conservancy and also serves as a member of the Advisory Board for the School of Engineering of the University of Southern California. |
Ned C. Lautenbach (62) |
| Year of Election or Appointment: 2000 Mr. Launtenbach is Chairman of the Independent Trustees (2006-present). Mr. Lautenbach has been a partner of Clayton, Dubilier & Rice, Inc. (private equity investment firm) since September 1998. Previously, Mr. Lautenbach was with the International Business Machines Corporation (IBM) from 1968 until his retirement in 1998. Mr. Lautenbach serves as a Director of Sony Corporation (2006-present) and Eaton Corporation (diversified industrial) as well as the Philharmonic Center for the Arts in Naples, Florida. He also is a member of the Board of Trustees of Fairfield University (2005-present), as well as a member of the Council on Foreign Relations. |
William O. McCoy (73) |
| Year of Election or Appointment: 1997 Prior to his retirement in December 1994, Mr. McCoy was Vice Chairman of the Board of BellSouth Corporation (telecommunications) and President of BellSouth Enterprises. He is currently a Director of Duke Realty Corporation (real estate). He is also a partner of Franklin Street Partners (private investment management firm). In addition, Mr. McCoy served as the Interim Chancellor (1999-2000) and a member of the Board of Visitors for the University of North Carolina at Chapel Hill and currently serves as Chairman of the Board of Directors of the University of North Carolina Health Care System. He also served as Vice President of Finance for the University of North Carolina (16-school system). |
Cornelia M. Small (62) |
| Year of Election or Appointment: 2005 Ms. Small is a member (2000-present) and Chairperson (2002-present) of the Investment Committee, and a member (2002- present) of the Board of Trustees of Smith College. Previously, she served as Chief Investment Officer (1999-2000), Director of Global Equity Investments (1996-1999), and a member of the Board of Directors of Scudder, Stevens & Clark (1990-1997) and Scudder Kemper Investments (1997-1999). In addition, Ms. Small served as Co-Chair (2000-2003) of the Annual Fund for the Fletcher School of Law and Diplomacy. |
William S. Stavropoulos (67) |
| Year of Election or Appointment: 2001 Mr. Stavropoulos is Chairman Emeritus of the Board of Directors of The Dow Chemical Company. Since joining The Dow Chemical Company in 1967, Mr. Stavropoulos served in numerous senior management positions, including President (1993-2000; 2002-2003), CEO (1995-2000; 2002-2004), and Chairman of the Executive Committee (2000-2004). Currently, he is a Director of NCR Corporation (data warehousing and technology solutions), BellSouth Corporation (telecommunications), Chemical Financial Corporation, Maersk Inc. (industrial conglomerate, 2002-present), and Metalmark Capital (private equity investment firm, 2005-present). He also serves as a member of the Board of Trustees of the American Enterprise Institute for Public Policy Research. In addition, Mr. Stavropoulos is a member of The Business Council, J.P. Morgan International Council and the University of Notre Dame Advisory Council for the College of Science. |
Kenneth L. Wolfe (67) |
| Year of Election or Appointment: 2005 Prior to his retirement in 2001, Mr. Wolfe was Chairman and Chief Executive Officer of Hershey Foods Corporation (1993-2001). He currently serves as a member of the boards of Adelphia Communications Corporation (2003-present), Bausch & Lomb, Inc., and Revlon Inc. (2004-present). |
Annual Report
Trustees and Officers - continued
Advisory Board Members and Executive Officers:
Correspondence intended for Mr. Keyes may be sent to Fidelity Investments, P.O. Box 55235, Boston, Massachusetts 02205-5235. Correspondence intended for each executive officer and Mr. Lynch may be sent to Fidelity Investments, 82 Devonshire Street, Boston, Massachusetts 02109.
Name, Age; Principal Occupation |
James H. Keyes (66) |
| Year of Election or Appointment: 2006 Member of the Advisory Board of Fidelity Investment Trust. Prior to his retirement in 2003, Mr. Keyes was Chairman, President, and Chief Executive Officer of Johnson Controls, Inc. (automotive supplier, 1993-2003). He currently serves as a member of the boards of LSI Logic Corporation (semiconductor technologies), Navistar International Corporation (manufacture and sale of trucks, buses, and diesel engines, 2002-present), and Pitney Bowes, Inc. (integrated mail, messaging, and document management solutions). |
Peter S. Lynch (62) |
| Year of Election or Appointment: 2003 Member of the Advisory Board of Fidelity Investment Trust. Mr. Lynch is Vice Chairman and a Director of FMR, and Vice Chairman (2001-present) and a Director of FMR Co., Inc. Previously, Mr. Lynch served as a Trustee of the Fidelity funds (1990-2003). In addition, he serves as a Trustee of Boston College and as the Chairman of the Inner-City Scholarship Fund. |
Dwight D. Churchill (52) |
| Year of Election or Appointment: 2005 Vice President of Canada, China Region, Emerging Markets, Europe, Europe Capital Appreciation, Japan, Japan Smaller Companies, Latin America, Nordic, Pacific Basin, and Southeast Asia. Mr. Churchill also serves as Vice President of certain Equity Funds (2005-present). Mr. Churchill is Executive Vice President of FMR (2005-present) and FMR Co., Inc. (2005-present). Previously, Mr. Churchill served as Senior Vice President of Fidelity Investments Money Management, Inc. (2005-2006), Head of Fidelity's Fixed-Income Division (2000-2005), Vice President of Fidelity's Money Market Funds (2000-2005), Vice President of Fidelity's Bond Funds, and Senior Vice President of FMR. |
Eric M. Wetlaufer (44) |
| Year of Election or Appointment: 2006 Vice President of Canada, China Region, Emerging Markets, Europe, Europe Capital Appreciation, Japan, Japan Smaller Companies, Latin America, Nordic, Pacific Basin, and Southeast Asia. Mr. Wetlaufer also serves as Vice President of certain International Equity Funds (2006-present). Mr. Wetlaufer is Senior Vice President of FMR (2006-present) and FMR Co., Inc. (2006-present), and President and Director of Fidelity Management & Research (U.K.) Inc. (2006-present) and Fidelity Research & Analysis Company (2006-present). Before joining Fidelity Investments in 2005, Mr. Wetlaufer was a partner in Oxhead Capital Management (2004-2005). Previously, Mr. Wetlaufer served as a Chief Investment Officer of Putnam Investments (1997-2003). |
Yoko Ishibashi (42) |
| Year of Election or Appointment: 2002
Vice President of Japan. Prior to assuming her current responsibilities, Ms. Ishibashi worked as an analyst and portfolio manager. |
Maxime LeMieux (32) |
| Year of Election or Appointment: 2002
Vice President of Fidelity Canada. Prior to assuming his current responsibilities, Mr. LeMieux worked as a research analyst and manager. Previously, Mr. LeMieux served as Vice President of FMR and FMR Co., Inc. (2006). |
Allan Liu (45) |
| Year of Election or Appointment: 1993
Vice President of Southeast Asia Fund. Prior to assuming his current responsibilities, Mr. Liu worked as a research analyst and manager. |
Darren Maupin (30) |
| Year of Election or Appointment: 2006
Vice President of Europe Capital Appreciation. Mr. Maupin also serves as Vice President of other funds advised by FMR. Prior to assuming his current responsibilities, Mr. Maupin worked as a research analyst and a portfolio manager. Mr. Maupin also serves as a Vice President of FMR and FMR Co., Inc. (2006). |
Kenichi Mizushita (50) |
| Year of Election or Appointment: 1996
Vice President of Japan Smaller Companies. Prior to assuming his current responsibilities, Mr. Mizushita worked as a research analyst and manager. |
Dale Nicholls (38) |
| Year of Election or Appointment: 2004
Vice President of Pacific Basin. Mr. Nicholls also serves as Vice President of other funds advised by FMR. Prior to assuming his current responsibilities, Mr. Nicholls worked as a research analyst and manager. |
Trygve Toraasen (43) |
| Year of Election or Appointment: 1998 and 2006
Vice President of Europe (2006) and Nordic (1998). Prior to assuming his current responsibilities, Mr. Toraasen worked as a research analyst and manager. |
Robert von Rekowsky (40) |
| Year of Election or Appointment: 2004
Vice President of Fidelity Emerging Markets. Mr. von Rekowsky also serves as Vice President of other funds advised by FMR. Prior to his current responsibilities, Mr. von Rekowsky worked as a research analyst and manager. Mr. von Rekowsky also serves as a Vice President of FMR and FMR Co., Inc. (2004). |
Eric D. Roiter (57) |
| Year of Election or Appointment: 1998 Secretary of Canada, China Region, Emerging Markets, Europe, Europe Capital Appreciation, Japan, Japan Smaller Companies, Latin America, Nordic, Pacific Basin, and Southeast Asia. He also serves as Secretary of other Fidelity funds; Vice President, General Counsel, and Secretary of FMR Co., Inc. (2001-present) and FMR; Assistant Secretary of Fidelity Management & Research (U.K.) Inc. (2001-present), Fidelity Research & Analysis Company (2001-present), and Fidelity Investments Money Management, Inc. (2001-present). Mr. Roiter is an Adjunct Member, Faculty of Law, at Boston College Law School (2003-present). Previously, Mr. Roiter served as Vice President and Secretary of Fidelity Distributors Corporation (FDC) (1998-2005). |
Stuart Fross (47) |
| Year of Election or Appointment: 2003 Assistant Secretary of Canada, China Region, Emerging Markets, Europe, Europe Capital Appreciation, Japan, Japan Smaller Companies, Latin America, Nordic, Pacific Basin, and Southeast Asia. Mr. Fross also serves as Assistant Secretary of other Fidelity funds (2003-present), Vice President and Secretary of FDC (2005-present), and is an employee of FMR. |
Christine Reynolds (48) |
| Year of Election or Appointment: 2004 President and Treasurer of Canada, China Region, Emerging Markets, Europe, Europe Capital Appreciation, Japan, Japan Smaller Companies, Latin America, Nordic, Pacific Basin, and Southeast Asia. Ms. Reynolds also serves as President and Treasurer of other Fidelity funds (2004-present) and is a Vice President (2003-present) and an employee (2002-present) of FMR. Before joining Fidelity Investments, Ms. Reynolds worked at PricewaterhouseCoopers LLP (PwC) (1980-2002), where she was most recently an audit partner with PwC's investment management practice. |
R. Stephen Ganis (40) |
| Year of Election or Appointment: 2006 Anti-Money Laundering (AML) officer of Canada, China Region, Emerging Markets, Europe, Europe Capital Appreciation, Japan, Japan Smaller Companies, Latin America, Nordic, Pacific Basin, and Southeast Asia. Mr. Ganis also serves as AML officer of other Fidelity funds (2006-present) and FMR Corp. (2003-present). Before joining Fidelity Investments, Mr. Ganis practiced law at Goodwin Procter, LLP (2000-2002). |
Joseph B. Hollis (58) |
| Year of Election or Appointment: 2006 Chief Financial Officer of Canada, China Region, Emerging Markets, Europe, Europe Capital Appreciation, Japan, Japan Smaller Companies, Latin America, Nordic, Pacific Basin, and Southeast Asia. Mr. Hollis also serves as Chief Financial Officer of other Fidelity funds. Mr. Hollis is President of Fidelity Pricing and Cash Management Services (FPCMS) (2005-present). Mr. Hollis also serves as President and Director of Fidelity Service Company, Inc. (2006-present). Previously, Mr. Hollis served as Senior Vice President of Cash Management Services (1999-2002) and Investment Management Operations (2002-2005). |
Kenneth A. Rathgeber (59) |
| Year of Election or Appointment: 2004 Chief Compliance Officer of Canada, China Region, Emerging Markets, Europe, Europe Capital Appreciation, Japan, Japan Smaller Companies, Latin America, Nordic, Pacific Basin, and Southeast Asia. Mr. Rathgeber also serves as Chief Compliance Officer of other Fidelity funds (2004-present) and Executive Vice President of Risk Oversight for Fidelity Investments (2002-present). He is Chief Compliance Officer of FMR (2005-present), FMR Co., Inc. (2005-present), Fidelity Management & Research (U.K.) Inc. (2005-present), Fidelity Research & Analysis Company (2005-present), Fidelity Investments Money Management, Inc. (2005- present), and Strategic Advisers, Inc. (2005-present). Previously, Mr. Rathgeber served as Executive Vice President and Chief Operating Officer for Fidelity Investments Institutional Services Company, Inc. (1998-2002). |
Bryan A. Mehrmann (45) |
| Year of Election or Appointment: 2005 Deputy Treasurer of Canada, China Region, Emerging Markets, Europe, Europe Capital Appreciation, Japan, Japan Smaller Companies, Latin America, Nordic, Pacific Basin, and Southeast Asia. Mr. Mehrmann also serves as Deputy Treasurer of other Fidelity funds (2005-present) and is an employee of FMR. Previously, Mr. Mehrmann served as Vice President of Fidelity Investments Institutional Services Group (FIIS)/Fidelity Investments Institutional Operations Corporation, Inc. (FIIOC) Client Services (1998-2004). |
Kimberley H. Monasterio (42) |
| Year of Election or Appointment: 2004 Deputy Treasurer of Canada, China Region, Emerging Markets, Europe, Europe Capital Appreciation, Japan, Japan Smaller Companies, Latin America, Nordic, Pacific Basin, and Southeast Asia. Ms. Monasterio also serves as Deputy Treasurer of other Fidelity funds (2004) and is an employee of FMR (2004). Before joining Fidelity Investments, Ms. Monasterio served as Treasurer (2000-2004) and Chief Financial Officer (2002-2004) of the Franklin Templeton Funds and Senior Vice President of Franklin Templeton Services, LLC (2000-2004). |
Kenneth B. Robins (37) |
| Year of Election or Appointment:2005 Deputy Treasurer of Canada, China Region, Emerging Markets, Europe, Europe Capital Appreciation, Japan, Japan Smaller Companies, Latin America, Nordic, Pacific Basin, and Southeast Asia. Mr. Robins also serves as Deputy Treasurer of other Fidelity funds (2005-present) and is an employee of FMR (2004-present). Before joining Fidelity Investments, Mr. Robins worked at KPMG LLP, where he was a partner in KPMG's department of professional practice (2002-2004) and a Senior Manager (1999-2000). In addition, Mr. Robins served as Assistant Chief Accountant, United States Securities and Exchange Commission (2000-2002). |
Robert G. Byrnes (39) |
| Year of Election or Appointment: 2005 Assistant Treasurer of Canada, China Region, Emerging Markets, Europe, Europe Capital Appreciation, Japan, Japan Smaller Companies, Latin America, Nordic, Pacific Basin, and Southeast Asia. Mr. Byrnes also serves as Assistant Treasurer of other Fidelity funds (2005-present) and is an employee of FMR (2005-present). Previously, Mr. Byrnes served as Vice President of FPCMS (2003-2005). Before joining Fidelity Investments, Mr. Byrnes worked at Deutsche Asset Management where he served as Vice President of the Investment Operations Group (2000-2003). |
John H. Costello (60) |
| Year of Election or Appointment: 1986, 1987, 1990, 1992, 1993, or 1995 Assistant Treasurer of Canada (1987), China Region (1995), Emerging Markets (1990), Europe (1986), Europe Capital Appreciation (1993), Japan (1992), Japan Smaller Companies (1995), Latin America (1993), Nordic (1995), Pacific Basin (1986), and Southeast Asia (1993). Mr. Costello also serves as Assistant Treasurer of other Fidelity funds and is an employee of FMR. |
Peter L. Lydecker (52) |
| Year of Election or Appointment: 2004 Assistant Treasurer of Canada, China Region, Emerging Markets, Europe, Europe Capital Appreciation, Japan, Japan Smaller Companies, Latin America, Nordic, Pacific Basin, and Southeast Asia. Mr. Lydecker also serves as Assistant Treasurer of other Fidelity funds (2004) and is an employee of FMR. |
Mark Osterheld (51) |
| Year of Election or Appointment: 2002 Assistant Treasurer of Canada, China Region, Emerging Markets, Europe, Europe Capital Appreciation, Japan, Japan Smaller Companies, Latin America, Nordic, Pacific Basin, and Southeast Asia. Mr. Osterheld also serves as Assistant Treasurer of other Fidelity funds (2002) and is an employee of FMR. |
Gary W. Ryan (48) |
| Year of Election or Appointment: 2005 Assistant Treasurer of Canada, China Region, Emerging Markets, Europe, Europe Capital Appreciation, Japan, Japan Smaller Companies, Latin America, Nordic, Pacific Basin, and Southeast Asia. Mr. Ryan also serves as Assistant Treasurer of other Fidelity funds (2005-present) and is an employee of FMR (2005-present). Previously, Mr. Ryan served as Vice President of Fund Reporting in FPCMS (1999-2005). |
Salvatore Schiavone (40) |
| Year of Election or Appointment: 2005 Assistant Treasurer of Canada, China Region, Emerging Markets, Europe, Europe Capital Appreciation, Japan, Japan Smaller Companies, Latin America, Nordic, Pacific Basin, and Southeast Asia. Mr. Schiavone also serves as Assistant Treasurer of other Fidelity funds (2005-present) and is an employee of FMR (2005-present). Before joining Fidelity Investments, Mr. Schiavone worked at Deutsche Asset Management, where he most recently served as Assistant Treasurer (2003-2005) of the Scudder Funds and Vice President and Head of Fund Reporting (1996-2003). |
Annual Report
Distributions
The Board of Trustees of each fund voted to pay to shareholders of record at the opening of business on record date, the following distributions per share derived from capital gains realized from sales of portfolio securities, and dividends derived from net investment income:
Fund | Pay Date | Record Date | Dividends | Capital Gains |
Canada | 12/04/06 | 12/01/06 | $ .36 | $ 1.03 |
China Region | 12/04/06 | 12/01/06 | $ .29 | $ .20 |
Emerging Markets | 12/11/06 | 12/08/06 | $ .20 | $ - |
Europe | 12/11/06 | 12/08/06 | $ .46 | $ 5.07 |
Europe Capital Appreciation | 12/11/06 | 12/08/06 | $ .22 | $ 2.25 |
Japan | 12/04/06 | 12/01/06 | $ .01 | $ .23 |
Japan Smaller Companies | 12/11/06 | 12/08/06 | $ .01 | $ .36 |
Latin America | 12/11/06 | 12/08/06 | $ .58 | $ .77 |
Nordic | 12/11/06 | 12/08/06 | $ .29 | $ .51 |
Pacific Basin | 12/11/06 | 12/08/06 | $ .16 | $ 2.24 |
Southeast Asia | 12/11/06 | 12/08/06 | $ .23 | $ 1.29 |
The funds hereby designate as capital gain dividends the amounts noted below for the taxable year ended October 31, 2006, or, if subsequently determined to be different, the net capital gain of such year.
Fund | October 31, 2006 |
Canada | $ 44,242,104 |
China Region | $ 8,092,947 |
Europe | $ 417,963,692 |
Europe Capital Appreciation | $ 82,471,161 |
Japan | $ 49,723,562 |
Japan Smaller Companies | $ 72,687,275 |
Latin America | $ 61,300,462 |
Nordic | $ 7,048,821 |
Pacific Basin | $ 66,684,071 |
Southeast Asia | $ 64,464,799 |
A percentage of the dividends distributed during the fiscal year for the following funds may be taken into account as a dividend for purposes of the maximum rate under section 1(h)(11) of the Internal Revenue Code.
Fund | |
Canada | 95% |
China Region | 61% |
Emerging Markets | 95% |
Europe | 20% |
Europe Capital Appreciation | 32% |
Japan | 93% |
Japan Smaller Companies | 100% |
Latin America | 76% |
Nordic | 63% |
Pacific Basin | 55% |
Southeast Asia | 68% |
Annual Report
Distributions - continued
The amounts per share which represent income derived from sources within, and taxes paid to, foreign countries or possessions of the United States are as follows:
Fund | Pay Date | Income | Taxes |
Canada | 12/05/05 | $ .196 | $ .0259 |
China Region | 12/05/05 | $ .262 | $ .0418 |
Emerging Markets | 12/12/05 | $ .155 | $ .0314 |
| 12/30/05 | $ .007 | $ .0000 |
Europe | 12/12/05 | $ .501 | $ .0439 |
Europe Capital Appreciation | 12/12/05 | $ .358 | $ .0169 |
Japan | 12/05/05 | $ .036 | $ .0056 |
Japan Smaller Companies | 12/12/05 | $ .026 | $ .0064 |
Latin America | 12/12/05 | $ .310 | $ .0309 |
| 12/30/05 | $ .090 | $ .0000 |
Nordic | 12/12/05 | $ .382 | $ .0320 |
Pacific Basin | 12/12/05 | $ .263 | $ .0668 |
Southeast Asia | 12/12/05 | $ .301 | $ .0512 |
| 12/30/05 | $ .010 | $ .0000 |
The fund will notify shareholders in January 2007 of amounts for use in preparing 2006 income tax returns.
Annual Report
Board Approval of Investment Advisory Contracts and Management Fees
Targeted International Equity Funds
Each year, typically in July, the Board of Trustees, including the Independent Trustees (together, the Board), votes on the renewal of the management contract and sub-advisory agreements (together, the Advisory Contracts) for each fund. The Board, assisted by the advice of fund counsel and Independent Trustees' counsel, requests and considers a broad range of information throughout the year.
The Board meets regularly each month except August and takes into account throughout the year matters bearing on Advisory Contracts. The Board, acting directly and through its separate committees, considers at each of its meetings factors that are relevant to the annual renewal of each fund's Advisory Contracts, including the services and support provided to each fund and its shareholders. At the time of the renewal, the Board had 12 standing committees, each composed of Independent Trustees with varying backgrounds, to which the Board has assigned specific subject matter responsibilities in order to enhance effective decision-making by the Board. Each committee has adopted a written charter outlining the structure and purposes of the committee. One such committee, the Equity Contract Committee, meets periodically as needed throughout the year to consider matters specifically related to the annual renewal of Advisory Contracts. The committee requests and receives information on, and makes recommendations to the Independent Trustees concerning, the approval and annual review of the Advisory Contracts.
At its July 2006 meeting, the Board of Trustees, including the Independent Trustees, unanimously determined to renew the Advisory Contracts for each fund. In reaching its determination, the Board considered all factors it believed relevant, including (i) the nature, extent, and quality of the services to be provided to each fund and its shareholders (including the investment performance of each fund); (ii) the competitiveness of the management fee and total expenses of each fund; (iii) the total costs of the services to be provided by and the profits to be realized by the investment adviser and its affiliates from the relationship with each fund; (iv) the extent to which economies of scale would be realized as each fund grows; and (v) whether fee levels reflect these economies of scale, if any, for the benefit of fund shareholders.
In determining whether to renew the Advisory Contracts for each fund, the Board ultimately reached a determination, with the assistance of fund counsel and Independent Trustees' counsel, that the renewal of the Advisory Contracts and the compensation to be received by Fidelity under the management contracts is consistent with Fidelity's fiduciary duty under applicable law. In addition to evaluating the specific factors noted above, the Board, in reaching its determination, is aware that shareholders in each fund have a broad range of investment choices available to them, including a wide choice among mutual funds offered by competitors to Fidelity, and that each fund's shareholders, with the opportunity to review and weigh the disclosure provided by the fund in its prospectus and other public disclosures, have chosen to invest in that fund, managed by Fidelity.
Nature, Extent, and Quality of Services Provided. The Board considered staffing within the investment adviser, FMR, and the sub-advisers (together, the Investment Advisers), including the backgrounds of the funds' portfolio managers and the funds' investment objectives and disciplines. The Independent Trustees also had discussions with senior management of Fidelity's investment operations and investment groups. The Board considered the structure of the portfolio manager compensation program and whether this structure provides appropriate incentives.
Resources Dedicated to Investment Management and Support Services. The Board reviewed the size, education, and experience of the Investment Advisers' investment staff, their use of technology, and the Investment Advisers' approach to recruiting, training, and retaining portfolio managers and other research, advisory, and management personnel. The Board considered Fidelity's extensive global research capabilities that enable the Investment Advisers to aggregate data from various sources in an effort to produce positive investment results. The Board noted that Fidelity's analysts have access to a variety of technological tools that enable them to perform both fundamental and quantitative analysis and to specialize in various disciplines. The Board also considered that Fidelity's portfolio managers and analysts have access to daily portfolio attribution that allows for monitoring of a fund's portfolio, as well as an electronic communication system that provides immediate real-time access to research concerning issuers and credit enhancers.
Shareholder and Administrative Services. The Board considered (i) the nature, extent, quality, and cost of administrative, distribution, and shareholder services performed by the Investment Advisers and their affiliates under the Advisory Contracts and under separate agreements covering transfer agency, pricing and bookkeeping, and securities lending services for each fund; (ii) the nature and extent of the Investment Advisers' supervision of third party service providers, principally custodians and subcustodians; and (iii) the resources devoted to, and the record of compliance with, each fund's compliance policies and procedures. The Board reviewed the allocation of fund brokerage, including allocations to brokers affiliated with the Investment Advisers, the use of brokerage commissions to pay fund expenses, and the use of "soft" commission dollars to pay for research services. The Board also considered that Fidelity voluntarily pays for market data out of its own resources.
The Board noted that the growth of fund assets across the complex allows Fidelity to reinvest in the development of services designed to enhance the value or convenience of the Fidelity funds as investment vehicles. These services include 24-hour access to account information and market information through phone representatives and over the Internet, and investor education materials and asset allocation tools.
Investment in a Large Fund Family. The Board considered the benefits to shareholders of investing in a Fidelity fund, including the benefits of investing in a fund that is part of a large family of funds offering a variety of investment disciplines and providing for a large variety of mutual fund investor services. For example, fund shareholders are offered the privilege of exchanging shares of a fund for shares of other Fidelity funds, as set forth in the fund's prospectus, without paying a sales charge. The Board noted that, since the last Advisory Contract renewals in July 2005, Fidelity has taken a number of actions that benefited particular funds, including (i) dedicating additional resources to investment research and to restructure the investment research teams; (ii) voluntarily entering into contractual arrangements with certain brokers pursuant to which Fidelity pays for research products and services separately out of its own resources, rather than bundling with fund commissions; (iii) launching the Fidelity Advantage Class of its five Spartan stock index funds and three Spartan bond index funds, which is a lower-fee class available to shareholders with higher account balances; (iv) contractually agreeing to impose expense limitations on Fidelity U.S. Bond Index Fund and reducing the fund's initial investment minimum; and (v) offering shareholders of each of the Fidelity Institutional Money Market Funds the privilege of exchanging shares of the fund for shares of other Fidelity funds.
Annual Report
Board Approval of Investment Advisory Contracts and Management Fees - continued
Investment Performance and Compliance. The Board considered whether each fund has operated within its investment objective, as well as its record of compliance with its investment restrictions. It also reviewed each fund's absolute investment performance, as well as each fund's relative investment performance measured against (i) a broad-based securities market index (or a proprietary custom index, in the case of China Region Fund), and (ii) a peer group of mutual funds over multiple periods. For each fund, the following charts considered by the Board show, over the one-, three-, and five-year periods ended December 31, 2005, the fund's cumulative total returns, the cumulative total returns of a broad-based securities market index (or a proprietary custom index, in the case of China Region Fund) ("benchmark"), and a range of cumulative total returns of a peer group of mutual funds identified by Lipper Inc. as having an investment objective similar to that of the fund. The box within each chart shows the 25th percentile return (bottom of box) and the 75th percentile return (top of box) of the Lipper peer group. Returns shown above the box are in the first quartile and returns shown below the box are in the fourth quartile. The percentage beaten number noted below each chart corresponds to the percentile box and represents the percentage of funds in the Lipper peer group whose performance was equal to or lower than that of the fund. For China Region Fund, the proprietary custom index is an index developed by FMR that represents the performance of the Hang Seng Index until September 1, 2000 and the Morgan Stanley Capital International Golden Dragon Plus Index beginning September 1, 2000.
Fidelity Canada Fund
The Board reviewed the fund's relative investment performance against its Lipper peer group and stated that the performance of the fund was in the first quartile for all the periods shown. The Board noted that FMR does not consider that Lipper peer group to be a meaningful comparison for the fund, however, because unlike many of its Lipper peers, the fund focuses its investments on securities of Canadian issuers. The Board also stated that the relative investment performance of the fund compared favorably to its benchmark for the one- and five-year periods, although the fund's three-year cumulative total return was lower than its benchmark.
Annual Report
Fidelity China Region Fund
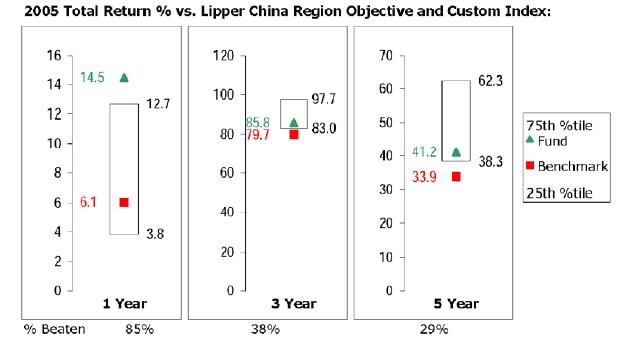
The Board reviewed the fund's relative investment performance against its Lipper peer group and stated that the performance of the fund was in the first quartile for the one-year period and the third quartile for the three- and five-year periods. The Board also stated that the relative investment performance of the fund compared favorably to its benchmark for all the periods shown.
Fidelity Emerging Markets Fund
The Board reviewed the fund's relative investment performance against its Lipper peer group and stated that the performance of the fund was in the first quartile for the one-year period and the second quartile for the three- and five-year periods. The Board also stated that the relative investment performance of the fund was lower than its benchmark for the three- and five-year periods, although the fund's one-year cumulative total return compared favorably to its benchmark. The Board also reviewed the fund's relative investment performance against a peer group defined by Morningstar.
Annual Report
Board Approval of Investment Advisory Contracts and Management Fees - continued
Fidelity Europe Fund
The Board reviewed the fund's relative investment performance against its Lipper peer group and stated that the performance of the fund was in the first quartile for the one- and three-year periods and the second quartile for the five-year period. The Board also stated that the relative investment performance of the fund compared favorably to its benchmark for all the periods shown.
Fidelity Europe Capital Appreciation Fund
The Board reviewed the fund's relative investment performance against its Lipper peer group and stated that the performance of the fund was in the first quartile for the one-year period and the second quartile for the three- and five-year periods. The Board also stated that the relative investment performance of the fund compared favorably to its benchmark for all the periods shown. The Board also reviewed the fund's relative investment performance against a peer group defined by Morningstar.
Annual Report
Fidelity Japan Fund
The Board reviewed the fund's relative investment performance against its Lipper peer group and stated that the performance of the fund was in the first quartile for the one-year period and the second quartile for the three- and five-year periods. The Board also stated that the relative investment performance of the fund compared favorably to its benchmark for all the periods shown.
Fidelity Japan Smaller Companies Fund
The Board reviewed the fund's relative investment performance against its Lipper peer group and stated that the performance of the fund was in the first quartile for all the periods shown. The Board noted that FMR does not consider that Lipper peer group to be a meaningful comparison for the fund, however, because the fund's investment strategy of investing in securities of companies with smaller market capitalizations is more specialized than that of the other funds in the peer group. The Board also stated that the relative investment performance of the fund compared favorably to its benchmark for all the periods shown.
Annual Report
Board Approval of Investment Advisory Contracts and Management Fees - continued
Fidelity Latin America Fund
The Board reviewed the fund's relative investment performance against its Lipper peer group and stated that the performance of the fund was in the first quartile for the one-year period and the second quartile for the three- and five-year periods. The Board also stated that the relative investment performance of the fund was lower than its benchmark for the three- and five-year periods, although the fund's one-year cumulative total return compared favorably to its benchmark.
Fidelity Nordic Fund
The Board reviewed the fund's relative investment performance against its Lipper peer group and stated that the performance of the fund was in the first quartile for the one- and three-year periods and the second quartile for the five-year period. The Board noted that FMR does not consider that Lipper peer group to be a meaningful comparison for the fund, however, because unlike many of its Lipper peers, which typically have broader investment mandates, the fund focuses its investments on securities of issuers in Norway, Sweden, Finland, and Denmark. The Board also stated that the relative investment performance of the fund compared favorably to its benchmark for all the periods shown.
Annual Report
Fidelity Pacific Basin Fund
The Board reviewed the fund's relative investment performance against its Lipper peer group and stated that the performance of the fund was in the second quartile for all the periods shown. The Board also stated that the relative investment performance of the fund compared favorably to its benchmark for all the periods shown.
Fidelity Southeast Asia Fund
The Board reviewed the fund's relative investment performance against its Lipper peer group and stated that the performance of the fund was in the first quartile for the one- and three-year periods and the second quartile for the five-year period. The Board noted that FMR does not consider that Lipper peer group to be a meaningful comparison for the fund, however, because the peer group includes funds that focus on securities in a single market, while the fund invests in various emerging markets. The Board also stated that the relative investment performance of the fund compared favorably to its benchmark for all the periods shown.
The Board also considered that each of Canada Fund's, Europe Fund's, Europe Capital Appreciation Fund's, Japan Fund's, Pacific Basin Fund's, and Southeast Asia Fund's management fee is subject to upward or downward adjustment depending upon whether, and to what extent, the fund's investment performance for the performance period exceeds, or is exceeded by, the record (over the same period) of a Board-approved performance adjustment index. The Board realizes that the performance adjustment provides FMR with a strong economic incentive to seek to achieve superior performance for each fund's shareholders and helps to more closely align the interests of FMR and each fund's shareholders.
Annual Report
Board Approval of Investment Advisory Contracts and Management Fees - continued
The Board considered that FMR has taken steps to refocus and strengthen equity research, equity portfolio management, and compliance. The Board noted with favor FMR's reorganization of its senior management team in 2005 and FMR's dedication of additional resources to investment research, and participated in the process that led to those changes.
Based on its review, and giving particular weight to the nature and quality of the resources dedicated by the Investment Advisers to maintain and improve relative performance, the Board concluded that the nature, extent, and quality of the services provided to each fund will benefit each fund's shareholders, particularly in light of the Board's view that each fund's shareholders benefit from investing in a fund that is part of a large family of funds offering a variety of investment disciplines and services.
Competitiveness of Management Fee and Total Fund Expenses. The Board considered each fund's management fee and total expenses compared to "mapped groups" of competitive funds and classes. Fidelity creates "mapped groups" by combining similar Lipper investment objective categories that have comparable management fee characteristics. Combining Lipper investment objective categories aids the Board's management fee and total expense comparisons by broadening the competitive group used for comparison and by reducing the number of universes to which various Fidelity funds are compared.
The Board considered two proprietary management fee comparisons for the 12-month periods shown in the charts below. The group of Lipper funds used by the Board for management fee comparisons is referred to below as the "Total Mapped Group" and, for the reasons explained above, is broader than the Lipper peer group used by the Board for performance comparisons. The Total Mapped Group comparison focuses on a fund's standing relative to the total universe of comparable funds available to investors, in terms of gross management fees before expense reimbursements or caps, and without giving effect to a fund's performance adjustment (if applicable). "TMG %" represents the percentage of funds in the Total Mapped Group that had management fees that were lower than a fund's. For example, a TMG % of 13% would mean that 87% of the funds in the Total Mapped Group had higher management fees than a fund. The "Asset-Size Peer Group" (ASPG) comparison focuses on a fund's standing relative to non-Fidelity funds similar in size to the fund within the Total Mapped Group. The ASPG represents at least 15% of the funds in the Total Mapped Group with comparable asset size and management fee characteristics, subject to a minimum of 50 funds (or all funds in the Total Mapped Group if fewer than 50). Additional information, such as the ASPG quartile in which a fund's management fee ranked and the impact of a fund's performance adjustment (if applicable), is also included in the charts and considered by the Board.
Fidelity Canada Fund
The Board noted that the fund's management fee ranked below the median of its Total Mapped Group and below the median of its ASPG for 2005. The Board also noted the effect of the fund's negative performance adjustment on the fund's management fee ranking. The Board noted that the performance adjustment for each year represents calculations for rolling 36-month periods that differ from the periods shown in the performance charts above.
Annual Report
Fidelity China Region Fund
The Board noted that the fund's management fee ranked below the median of its Total Mapped Group and below the median of its ASPG for 2005.
Fidelity Emerging Markets Fund
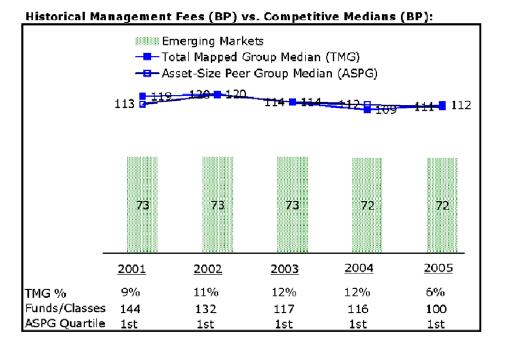
The Board noted that the fund's management fee ranked below the median of its Total Mapped Group and below the median of its ASPG for 2005.
Annual Report
Board Approval of Investment Advisory Contracts and Management Fees - continued
Fidelity Europe Fund
The Board noted that the fund's management fee ranked below the median of its Total Mapped Group and below the median of its ASPG for 2005. The Board also noted the effect of the fund's positive performance adjustment on the fund's management fee ranking. The Board noted that the performance adjustment for each year represents calculations for rolling 36-month periods that differ from the periods shown in the performance charts above.
Fidelity Europe Capital Appreciation Fund
The Board noted that the fund's management fee ranked below the median of its Total Mapped Group and below the median of its ASPG for 2005. The Board also noted the effect of the fund's negative performance adjustment on the fund's management fee ranking. The Board noted that the performance adjustment for each year represents calculations for rolling 36-month periods that differ from the periods shown in the performance charts above.
Annual Report
Fidelity Japan Fund
The Board noted that the fund's management fee ranked below the median of its Total Mapped Group and below the median of its ASPG for 2005. The Board noted that the performance adjustment for each year represents calculations for rolling 36-month periods that differ from the periods shown in the performance charts above.
Fidelity Japan Smaller Companies Fund
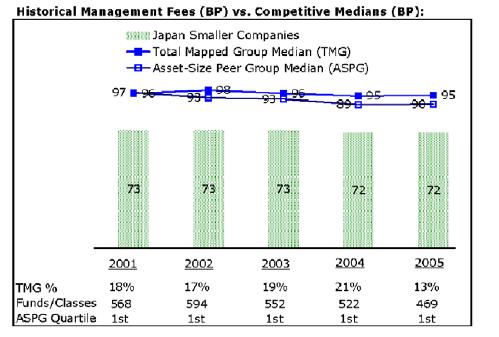
The Board noted that the fund's management fee ranked below the median of its Total Mapped Group and below the median of its ASPG for 2005.
Annual Report
Board Approval of Investment Advisory Contracts and Management Fees - continued
Fidelity Latin America Fund
The Board noted that the fund's management fee ranked below the median of its Total Mapped Group and below the median of its ASPG for 2005.
Fidelity Nordic Fund
The Board noted that the fund's management fee ranked below the median of its Total Mapped Group and below the median of its ASPG for 2005.
Annual Report
Fidelity Pacific Basin Fund
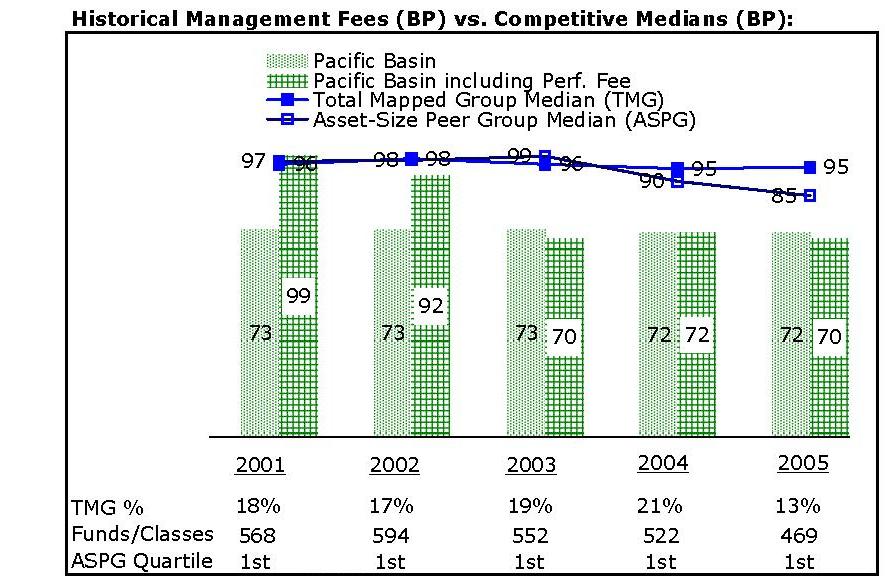
The Board noted that the fund's management fee ranked below the median of its Total Mapped Group and below the median of its ASPG for 2005. The Board also noted the effect of the fund's negative performance adjustment on the fund's management fee ranking. The Board noted that the performance adjustment for each year represents calculations for rolling 36-month periods that differ from the periods shown in the performance charts above.
Furthermore, the Board considered that shareholders of Pacific Basin Fund approved a prospective change in the index used to calculate the fund's performance adjustment, beginning April 1, 2001. The Board also considered that, because the performance adjustment is based on a rolling 36-month measurement period, during a transition period the fund's performance is compared to a blended index return that reflects the performance of the former index for the portion of the measurement period prior to April 1, 2001 and the performance of the current index for the remainder of the measurement period. The Board noted that the fund's performance adjustments for 2001 through 2004 shown in the chart above reflect the effect of using the blended index return to calculate the fund's performance adjustment.
Fidelity Southeast Asia Fund
The Board noted that the fund's management fee ranked below the median of its Total Mapped Group and below the median of its ASPG for 2005. The Board also noted the effect of the fund's positive performance adjustment on the fund's management fee ranking. The Board noted that the performance adjustment for each year represents calculations for rolling 36-month periods that differ from the periods shown in the performance charts above.
Annual Report
Board Approval of Investment Advisory Contracts and Management Fees - continued
Based on its review, the Board concluded that each fund's management fee was fair and reasonable in light of the services that the fund receives and the other factors considered.
In its review of each fund's total expenses, the Board considered the fund's management fee as well as other fund expenses, such as transfer agent fees, pricing and bookkeeping fees, and custodial, legal, and audit fees. The Board also noted the effects of any waivers and reimbursements on fees and expenses, as well as Europe Fund's and Southeast Asia Fund's positive performance adjustment, and Canada Fund's, Europe Capital Appreciation Fund's and Pacific Basin Fund's negative performance adjustment. As part of its review, the Board also considered current and historical total expenses of each fund compared to competitive fund median expenses. Each fund is compared to those funds and classes in the Total Mapped Group (used by the Board for management fee comparisons) that have a similar sales load structure.
The Board noted that each fund's total expenses ranked below its competitive median for 2005.
In its review of total expenses, the Board also considered Fidelity fee structures and other information on clients that FMR and its affiliates service in other competitive markets, such as other mutual funds advised or subadvised by FMR or its affiliates, pension plan clients, and other institutional clients.
Based on its review, the Board concluded that each fund's total expenses were reasonable in light of the services that the fund and its shareholders receive and the other factors considered.
Costs of the Services and Profitability. The Board considered the revenues earned and the expenses incurred by Fidelity in conducting the business of developing, marketing, distributing, managing, administering and servicing each fund and its shareholders. The Board also considered the level of Fidelity's profits in respect of all the Fidelity funds.
On an annual basis, FMR presents to the Board Fidelity's profitability for each fund. Fidelity calculates the profitability for each fund, as well as aggregate profitability for groups of Fidelity funds and all Fidelity funds, using a series of detailed revenue and cost allocation methodologies which originate with the audited books and records of Fidelity. The Audit Committee of the Board reviews any significant changes from the prior year's methodologies.
PricewaterhouseCoopers LLP (PwC), independent registered accounting firm and auditor to Fidelity and certain Fidelity funds, has been engaged annually by the Board as part of the Board's assessment of the results of Fidelity's profitability analysis. PwC's engagement includes the review and assessment of Fidelity's methodologies used in determining the revenues and expenses attributable to Fidelity's mutual fund business, and completion of agreed-upon procedures surrounding the mathematical accuracy of fund profitability and its conformity to allocation methodologies. After considering PwC's reports issued under the engagement and information provided by Fidelity, the Board believes that while other allocation methods may also be reasonable, Fidelity's profitability methodologies are reasonable in all material respects.
The Board has also reviewed Fidelity's non-fund businesses and any fall-out benefits related to the mutual fund business as well as cases where Fidelity's affiliates may benefit from or be related to the funds' business.
The Board considered the costs of the services provided by and the profits realized by Fidelity in connection with the operation of each fund and determined that the amount of profit is a fair entrepreneurial profit for the management of each fund.
Economies of Scale. The Board considered whether there have been economies of scale in respect of the management of the Fidelity funds, whether the Fidelity funds (including each fund) have appropriately benefited from any such economies of scale, and whether there is potential for realization of any further economies of scale. The Board considered the extent to which each fund will benefit from economies of scale through increased services to the fund, through waivers or reimbursements, or through fee or expense reductions, including reductions that occur through operation of the transfer agent agreement. The transfer agent fee varies in part based on the number of accounts in each fund. If the number of accounts decreases or the average account size increases, the overall transfer agent fee rate decreases.
The Board recognized that each fund's management contract incorporates a "group fee" structure, which provides for lower fee rates as total fund assets under FMR's management increase, and for higher fee rates as total fund assets under FMR's management decrease. The Board considered that the group fee is designed to deliver the benefits of economies of scale to fund shareholders when total fund assets increase, even if assets of any particular fund are unchanged or have declined, because some portion of Fidelity's costs are attributable to services provided to all Fidelity funds, and all funds benefit if those costs can be allocated among more assets. The Board also considered that although Japan Smaller Companies Fund is partially closed to new investors, it continues to incur investment management expenses, and marketing and distribution expenses related to the retention of existing shareholders and assets. The Board further noted that Japan Smaller Companies Fund may continue to realize benefits from the group fee structure, even though assets may not be expected to grow significantly at the fund level. The Board concluded that, given the group fee structure, fund shareholders will achieve a certain level of economies of scale as assets under FMR's management increase at the fund complex level, regardless of whether Fidelity achieves any such economies of scale.
The Board further concluded that any potential economies of scale are being shared between fund shareholders and Fidelity in an appropriate manner.
Annual Report
Additional Information Requested by the Board. In order to develop fully the factual basis for consideration of the Advisory Contracts, the Board requested additional information on several topics, including (i) Fidelity's fund profitability methodology and profitability trends within certain funds; (ii) portfolio manager compensation; (iii) the extent to which any economies of scale exist and are shared between the funds and Fidelity; (iv) the total expenses of certain funds and classes relative to competitors, including the extent to which the expenses of certain funds have been or could be capped; (v) fund performance trends; and (vi) Fidelity's fee structures, including use of performance fees.
Based on its evaluation of all of the conclusions noted above, and after considering all material factors, the Board ultimately concluded that the advisory fee structures are fair and reasonable, and that each fund's Advisory Contracts should be renewed.
Annual Report
Annual Report
Investment Adviser
Fidelity Management & Research Company
Boston, MA
Investment Sub-Advisers
FMR Co., Inc.
Fidelity Management & Research (U.K.) Inc.
Fidelity Research & Analysis Company
(formerly Fidelity Management & Research (Far East) Inc.)
Fidelity Investments Japan Limited
Fidelity International Investment Advisors
Fidelity International Investment Advisors
(U.K.) Limited
General Distributor
Fidelity Distributors Corporation
Boston, MA
Transfer and Service Agent
Fidelity Service Company, Inc.
Boston, MA
Custodians
JPMorgan Chase Bank
New York, NY
Emerging Markets Fund, Europe Fund, Europe Capital Appreciation Fund, Japan Fund, Pacific Basin Fund, Southeast Asia Fund
Brown Brothers Harriman & Co.
Boston, MA
Canada Fund, China Region Fund, Japan Smaller Companies Fund, Latin America Fund, Nordic Fund
Fidelity's International Equity Funds
Aggressive International Fund
Canada Fund
China Region Fund
Diversified International Fund
Emerging Markets Fund
Europe Fund
Europe Capital Appreciation Fund
Global Balanced Fund
International Discovery Fund
International Small Cap Fund
International Small Cap Opportunities Fund
International Value Fund
Japan Fund
Japan Smaller Companies Fund
Latin America Fund
Nordic Fund
Overseas Fund
Pacific Basin Fund
Southeast Asia Fund
Worldwide Fund
Corporate Headquarters
82 Devonshire Street
Boston, MA 02109
www.fidelity.com
The Fidelity Telephone Connection
Mutual Fund 24-Hour Service
Exchanges/Redemptions
and Account Assistance 1-800-544-6666
Product Information 1-800-544-6666
Retirement Accounts 1-800-544-4774
(8 a.m. - 9 p.m.)
TDD Service 1-800-544-0118
for the deaf and hearing impaired
(9 a.m. - 9 p.m. Eastern time)
Fidelity Automated Service
Telephone (FAST®) (automated graphic) 1-800-544-5555
(automated graphic) Automated line for quickest service
TIF-UANNPRO-1206
1.784781.103
Item 2. Code of Ethics
As of the end of the period, October 31, 2006, Fidelity Investment Trust (the trust) has adopted a code of ethics, as defined in Item 2 of Form N-CSR, that applies to its President and Treasurer and its Chief Financial Officer. A copy of the code of ethics is filed as an exhibit to this Form N-CSR.
Item 3. Audit Committee Financial Expert
The Board of Trustees of the trust has determined that Marie L. Knowles is an audit committee financial expert, as defined in Item 3 of Form N-CSR. Ms. Knowles is independent for purposes of Item 3 of Form N-CSR.
Item 4. Principal Accountant Fees and Services
(a) Audit Fees.
For the fiscal years ended October 31, 2006 and October 31, 2005, the aggregate Audit Fees billed by PricewaterhouseCoopers LLP (PwC) for professional services rendered for the audits of the financial statements, or services that are normally provided in connection with statutory and regulatory filings or engagements for those fiscal years, for Fidelity Canada Fund, Fidelity China Region Fund, Fidelity Emerging Markets Fund, Fidelity Europe Fund, Fidelity Global Balanced Fund, Fidelity International Discovery Fund, Fidelity Japan Fund, Fidelity Japan Smaller Companies Fund, Fidelity Latin America Fund, Fidelity Nordic Fund, Fidelity Overseas Fund, Fidelity Pacific Basin Fund and Fidelity Southeast Asia Fund (the funds) and for all funds in the Fidelity Group of Funds are shown in the table below.
Fund | 2006A | 2005A |
Fidelity Canada Fund | $62,000 | $53,000 |
Fidelity China Region Fund | $53,000 | $48,000 |
Fidelity Emerging Markets Fund | $117,000 | $102,000 |
Fidelity Europe Fund | $71,000 | $63,000 |
Fidelity Global Balanced Fund | $74,000 | $66,000 |
Fidelity International Discovery Fund | $80,000 | $66,000 |
Fidelity Japan Fund | $60,000 | $52,000 |
Fidelity Japan Smaller Companies Fund | $51,000 | $46,000 |
Fidelity Latin America Fund | $76,000 | $65,000 |
Fidelity Nordic Fund | $47,000 | $42,000 |
Fidelity Overseas Fund | $109,000 | $98,000 |
Fidelity Pacific Basin Fund | $58,000 | $52,000 |
Fidelity Southeast Asia Fund | $74,000 | $65,000 |
All funds in the Fidelity Group of Funds audited by PwC | $13,400,000 | $11,900,000 |
A | Aggregate amounts may reflect rounding. |
For the fiscal years ended October 31, 2006 and October 31, 2005, the aggregate Audit Fees billed by Deloitte & Touche LLP, the member firms of Deloitte Touche Tohmatsu, and their respective affiliates (collectively, "Deloitte Entities") for professional services rendered for the audits of the financial statements, or services that are normally provided in connection with statutory and regulatory filings or engagements for those fiscal years, for Fidelity Aggressive International Fund, Fidelity Diversified International Fund, Fidelity Europe Capital Appreciation Fund, Fidelity International Small Cap Fund, Fidelity International Small Cap Opportunities Fund, Fidelity International Value Fund and Fidelity Worldwide Fund (the funds) and for all funds in the Fidelity Group of Funds are shown in the table below.
Fund | 2006A | 2005A,B,C |
Fidelity Aggressive International Fund | $45,000 | $41,000 |
Fidelity Diversified International Fund | $120,000 | $102,000 |
Fidelity Europe Capital Appreciation Fund | $39,000 | $42,000 |
Fidelity International Small Cap Fund | $70,000 | $37,000 |
Fidelity International Small Cap Opportunities Fund | $41,000 | $36,000 |
Fidelity International Value Fund | $43,000 | $0 |
Fidelity Worldwide Fund | $45,000 | $43,000 |
All funds in the Fidelity Group of Funds audited by Deloitte Entities | $6,500,000 | $5,400,000 |
A | Aggregate amounts may reflect rounding. |
B | No Audit Fees were billed by Deloitte Entities for professional services rendered for the audit of the annual financial statements, or services that are normally provided in connection with the statutory and regulatory filings or engagements, to Fidelity International Value Fund as the fund did not commence operations until May 18, 2006. |
C | Fidelity International Small Cap Opportunities Fund commenced operations on August 2, 2005. |
(b) Audit-Related Fees.
In each of the fiscal years ended October 31, 2006 and October 31, 2005, the aggregate Audit-Related Fees billed by PwC for services rendered for assurance and related services to each fund that are reasonably related to the performance of the audit or review of the fund's financial statements, but not reported as Audit Fees, are shown in the table below.
Fund | 2006A | 2005 A |
Fidelity Canada Fund | $0 | $0 |
Fidelity China Region Fund | $0 | $0 |
Fidelity Emerging Markets Fund | $0 | $0 |
Fidelity Europe Fund | $0 | $0 |
Fidelity Global Balanced Fund | $0 | $0 |
Fidelity International Discovery Fund | $0 | $0 |
Fidelity Japan Fund | $0 | $0 |
Fidelity Japan Smaller Companies Fund | $0 | $0 |
Fidelity Latin America Fund | $0 | $0 |
Fidelity Nordic Fund | $0 | $0 |
Fidelity Overseas Fund | $0 | $0 |
Fidelity Pacific Basin Fund | $0 | $0 |
Fidelity Southeast Asia Fund | $0 | $0 |
A | Aggregate amounts may reflect rounding. |
In each of the fiscal years ended October 31, 2006 and October 31, 2005, the aggregate Audit-Related Fees billed by Deloitte Entities for services rendered for assurance and related services to each fund that are reasonably related to the performance of the audit or review of the fund's financial statements, but not reported as Audit Fees, are shown in the table below.
Fund | 2006A | 2005 A,B,C |
Fidelity Aggressive International Fund | $0 | $0 |
Fidelity Diversified International Fund | $0 | $0 |
Fidelity Europe Capital Appreciation Fund | $0 | $0 |
Fidelity International Small Cap Fund | $0 | $0 |
Fidelity International Small Cap Opportunities Fund | $0 | $0 |
Fidelity International Value Fund | $0 | $0 |
Fidelity Worldwide Fund | $0 | $0 |
A | Aggregate amounts may reflect rounding. |
B | No Audit-Related Fees were billed by Deloitte Entities for services rendered for assurance and related services to the fund that are reasonably related to the performance of the audit or review of the fund's financial statements, but not reported as Audit Fees to Fidelity International Value Fund as the fund did not commence operations until May 18, 2006. |
C | Fidelity International Small Cap Opportunities Fund commenced operations on August 2, 2005. |
In each of the fiscal years ended October 31, 2006 and October 31, 2005, the aggregate Audit-Related Fees that were billed by PwC and Deloitte Entities that were required to be approved by the Audit Committee for services rendered on behalf of Fidelity Management & Research Company (FMR) and entities controlling, controlled by, or under common control with FMR (not including any sub-adviser whose role is primarily portfolio management and is subcontracted with or overseen by another investment adviser) that provide ongoing services to the funds ("Fund Service Providers") for assurance and related services that relate directly to the operations and financial reporting of each fund that are reasonably related to the performance of the audit or review of the fund's financial statements, but not reported as Audit Fees, are shown in the table below.
Billed By | 2006 A,B | 2005A,B |
PwC | $0 | $0 |
Deloitte Entities | $0 | $0 |
A | Aggregate amounts may reflect rounding. |
B | May include amounts billed prior to Fidelity International Value Fund's commencement of operations. |
Fees included in the audit-related category comprise assurance and related services (e.g., due diligence services) that are traditionally performed by the independent registered public accounting firm. These audit-related services include due diligence related to mergers and acquisitions, accounting consultations and audits in connection with acquisitions, internal control reviews, attest services that are not required by statute or regulation and consultation concerning financial accounting and reporting standards.
(c) Tax Fees.
In each of the fiscal years ended October 31, 2006 and October 31, 2005, the aggregate Tax Fees billed by PwC for professional services rendered for tax compliance, tax advice, and tax planning for each fund is shown in the table below.
Fund | 2006A | 2005A |
Fidelity Canada Fund | $4,600 | $4,200 |
Fidelity China Region Fund | $4,600 | $4,200 |
Fidelity Emerging Markets Fund | $22,900 | $34,600 |
Fidelity Europe Fund | $4,600 | $4,200 |
Fidelity Global Balanced Fund | $4,600 | $4,200 |
Fidelity International Discovery Fund | $15,800 | $26,500 |
Fidelity Japan Fund | $7,600 | $4,700 |
Fidelity Japan Smaller Companies Fund | $4,600 | $4,200 |
Fidelity Latin America Fund | $4,600 | $4,200 |
Fidelity Nordic Fund | $4,600 | $4,200 |
Fidelity Overseas Fund | $4,600 | $4,200 |
Fidelity Pacific Basin Fund | $27,600 | $27,800 |
Fidelity Southeast Asia Fund | $6,100 | $16,300 |
A | Aggregate amounts may reflect rounding. |
In each of the fiscal years ended October 31, 2006 and October 31, 2005, the aggregate Tax Fees billed by Deloitte Entities for professional services rendered for tax compliance, tax advice, and tax planning for each fund is shown in the table below.
Fund | 2006A | 2005A,B,C |
Fidelity Aggressive International Fund | $4,000 | $3,900 |
Fidelity Diversified International Fund | $4,000 | $4,000 |
Fidelity Europe Capital Appreciation Fund | $4,200 | $4,000 |
Fidelity International Small Cap Fund | $4,000 | $3,600 |
Fidelity International Small Cap Opportunities Fund | $3,800 | $3,800 |
Fidelity International Value Fund | $3,900 | $0 |
Fidelity Worldwide Fund | $4,000 | $4,000 |
A | Aggregate amounts may reflect rounding. |
B | No Tax Fees were billed by Deloitte Entities for services rendered for tax compliance, tax advice, and tax planning for Fidelity International Value Fund as the fund did not commence operations until May 18, 2006. |
C | Fidelity International Small Cap Opportunities Fund commenced operations on August 2, 2005. |
In each of the fiscal years ended October 31, 2006 and October 31, 2005, the aggregate Tax Fees billed by PwC and Deloitte Entities that were required to be approved by the Audit Committee for professional services rendered on behalf of the Fund Service Providers for tax compliance, tax advice, and tax planning that relate directly to the operations and financial reporting of each fund is shown in the table below.
Billed By | 2006A,B | 2005A,B |
PwC | $0 | $0 |
Deloitte Entities | $0 | $0 |
A | Aggregate amounts may reflect rounding. |
B | May include amounts billed prior to Fidelity International Value Fund's commencement of operations. |
Fees included in the Tax Fees category comprise all services performed by professional staff in the independent registered public accounting firm's tax division except those services related to the audit. Typically, this category would include fees for tax compliance, tax planning, and tax advice. Tax compliance, tax advice, and tax planning services include preparation of original and amended tax returns, claims for refund and tax payment-planning services, assistance with tax audits and appeals, tax advice related to mergers and acquisitions and requests for rulings or technical advice from taxing authorities.
(d) All Other Fees.
In each of the fiscal years ended October 31, 2006 and October 31, 2005, the aggregate Other Fees billed by PwC for all other non-audit services rendered to the funds is shown in the table below.
Fund | 2006A | 2005A |
Fidelity Canada Fund | $3,000 | $2,200 |
Fidelity China Region Fund | $1,600 | $1,700 |
Fidelity Emerging Markets Fund | $3,000 | $2,200 |
Fidelity Europe Fund | $3,400 | $3,400 |
Fidelity Global Balanced Fund | $1,300 | $1,500 |
Fidelity International Discovery Fund | $5,400 | $4,000 |
Fidelity Japan Fund | $2,500 | $2,000 |
Fidelity Japan Smaller Companies Fund | $2,500 | $2,400 |
Fidelity Latin America Fund | $3,000 | $2,000 |
Fidelity Nordic Fund | $1,400 | $1,500 |
Fidelity Overseas Fund | $5,500 | $5,400 |
Fidelity Pacific Basin Fund | $1,900 | $1,800 |
Fidelity Southeast Asia Fund | $2,000 | $1,900 |
A | Aggregate amounts may reflect rounding. |
In each of the fiscal years ended October 31, 2006 and October 31, 2005, the aggregate Other Fees billed by Deloitte Entities for all other non-audit services rendered to the funds is shown in the table below.
Fund | 2006A | 2005A,B,C |
Fidelity Aggressive International Fund | $0 | $0 |
Fidelity Diversified International Fund | $0 | $0 |
Fidelity Europe Capital Appreciation Fund | $0 | $0 |
Fidelity International Small Cap Fund | $0 | $0 |
Fidelity International Small Cap Opportunities Fund | $0 | $0 |
Fidelity International Value Fund | $0 | $0 |
Fidelity Worldwide Fund | $0 | $0 |
A | Aggregate amounts may reflect rounding. |
B | No Other Fees were billed by Deloitte Entities for all other non-audit services rendered to Fidelity International Value Fund as the fund did not commence operations May 18, 2006. |
C | Fidelity International Small Cap Opportunities Fund commenced operations on August 2, 2005. |
In each of the fiscal years ended October 31, 2006 and October 31, 2005, the aggregate Other Fees billed by PwC and Deloitte Entities that were required to be approved by the Audit Committee for all other non-audit services rendered on behalf of the Fund Service Providers that relate directly to the operations and financial reporting of each fund is shown in the table below.
Billed By | 2006A,B | 2005A,B |
PwC | $20,000 | $420,000 |
Deloitte Entities | $255,000 | $210,000 |
A | Aggregate amounts may reflect rounding. |
B | May include amounts billed prior to Fidelity International Value Fund's commencement of operations. |
Fees included in the All Other Fees category include services related to internal control reviews, strategy and other consulting, financial information systems design and implementation, consulting on other information systems, and other tax services unrelated to the fund.
(e) (1) | Audit Committee Pre-Approval Policies and Procedures: |
The trust's Audit Committee must pre-approve all audit and non-audit services provided by the independent registered public accounting firm relating to the operations or financial reporting of the funds. Prior to the commencement of any audit or non-audit services to a fund, the Audit Committee reviews the services to determine whether they are appropriate and permissible under applicable law.
The trust's Audit Committee has adopted policies and procedures to, among other purposes, provide a framework for the Committee's consideration of non-audit services by the audit firms that audit the Fidelity funds. The policies and procedures require that any non-audit service provided by a fund audit firm to a Fidelity Fund and any non-audit service provided by a fund auditor to a Fund Service Provider that relates directly to the operations and financial reporting of a Fidelity fund (Covered Service) are subject to approval by the Audit Committee before such service is provided. Non-audit services provided by a fund audit firm for a Fund Service Provider that do not relate directly to the operations and financial reporting of a Fidelity fund (Non-Covered Service) but that are expected to exceed $50,000 are also subject to pre-approval by the Audit Committee.
All Covered Services, as well as Non-Covered Services that are expected to exceed $50,000, must be approved in advance of provision of the service either: (i) by formal resolution of the Audit Committee, or (ii) by oral or written approval of the service by the Chair of the Audit Committee (or if the Chair is unavailable, such other member of the Audit Committee as may be designated by the Chair to act in the Chair's absence). The approval contemplated by (ii) above is permitted where the Treasurer determines that action on such an engagement is necessary before the next meeting of the Audit Committee. Neither pre-approval nor advance notice of Non-Covered Service engagements for which fees are not expected to exceed $50,000 is required; such engagements are to be reported to the Audit Committee monthly.
(e) (2) | Services approved pursuant to paragraph (c)(7)(i)(C) of Rule 2-01 of Regulation S-X: |
Audit-Related Fees:
There were no amounts that were approved by the Audit Committee pursuant to the de minimis exception for the fiscal years ended October 31, 2006 and October 31, 2005 on behalf of each fund.
There were no amounts that were required to be approved by the Audit Committee pursuant to the de minimis exception for the fiscal years ended October 31, 2006 and October 31, 2005 on behalf of the Fund Service Providers that relate directly to the operations and financial reporting of each fund.
Tax Fees:
There were no amounts that were approved by the Audit Committee pursuant to the de minimis exception for the fiscal years ended October 31, 2006 and October 31, 2005 on behalf of each fund.
There were no amounts that were required to be approved by the Audit Committee pursuant to the de minimis exception for the fiscal years ended October 31, 2006 and October 31, 2005 on behalf of the Fund Service Providers that relate directly to the operations and financial reporting of each fund.
All Other Fees:
There were no amounts that were approved by the Audit Committee pursuant to the de minimis exception for the fiscal years ended October 31, 2006 and October 31, 2005 on behalf of each fund.
There were no amounts that were required to be approved by the Audit Committee pursuant to the de minimis exception for the fiscal years ended October 31, 2006 and October 31, 2005 on behalf of the Fund Service Providers that relate directly to the operations and financial reporting of each fund.
(f) Not applicable.
(g) For the fiscal years ended October 31, 2006 and October 31, 2005, the aggregate fees billed by PwC of $875,000A and $1,800,000A,B for non-audit services rendered on behalf of the funds, FMR (not including any sub-adviser whose role is primarily portfolio management and is subcontracted with or overseen by another investment adviser) and Fund Service Providers relating to Covered Services and Non-Covered Services are shown in the table below.
| 2006A | 2005A |
Covered Services | $175,000 | $600,000 |
Non-Covered Services | $700,000 | $1,200,000 B |
A | Aggregate amounts may reflect rounding. |
B | Reflects current period presentation. |
For the fiscal years ended October 31, 2006 and October 31, 2005, the aggregate fees billed by Deloitte Entities of $815,000A and $560,000A,B,C for non-audit services rendered on behalf of the fund, FMR (not including any sub-adviser whose role is primarily portfolio management and is subcontracted with or overseen by another investment adviser) and Fund Service Providers relating to Covered Services and Non-Covered Services are shown in the table below.
| 2006A | 2005A,B |
Covered Services | $285,000 | $250,000 |
Non-Covered Services | $530,000 | $310,000 C |
A | Aggregate amounts may reflect rounding. |
B | May include amounts billed prior to Fidelity International Value Fund's commencement of operations. |
C | Reflects current period presentation. |
(h) The trust's Audit Committee has considered Non-Covered Services that were not pre-approved that were provided by PwC and Deloitte Entities to Fund Service Providers to be compatible with maintaining the independence of PwC and Deloitte Entities in their audit of the funds, taking into account representations from PwC and Deloitte Entities, in accordance with Independence Standards Board Standard No.1, regarding their independence from the funds and their related entities.
Item 5. Audit Committee of Listed Registrants
Not applicable.
Item 6. Schedule of Investments
Not applicable.
Item 7. Disclosure of Proxy Voting Policies and Procedures for Closed-End Management Investment Companies
Not applicable.
Item 8. Portfolio Managers of Closed-End Management Investment Companies
Not applicable.
Item 9. Purchase of Equity Securities by Closed-End Management Investment Company and Affiliated Purchasers
Not applicable.
Item 10. Submission of Matters to a Vote of Security Holders
There were no material changes to the procedures by which shareholders may recommend nominees to the trust's Board of Trustees.
Item 11. Controls and Procedures
(a)(i) The President and Treasurer and the Chief Financial Officer have concluded that the trust's disclosure controls and procedures (as defined in Rule 30a-3(c) under the Investment Company Act) provide reasonable assurances that material information relating to the trust is made known to them by the appropriate persons, based on their evaluation of these controls and procedures as of a date within 90 days of the filing date of this report.
(a)(ii) There was no change in the trust's internal control over financial reporting (as defined in Rule 30a-3(d) under the Investment Company Act) that occurred during the second fiscal quarter of the period covered by this report that has materially affected, or is reasonably likely to materially affect, the trust's internal control over financial reporting.
Item 12. Exhibits
(a) | (1) | Code of Ethics pursuant to Item 2 of Form N-CSR is filed and attached hereto as EX-99.CODE ETH. |
(a) | (2) | Certification pursuant to Rule 30a-2(a) under the Investment Company Act of 1940 (17 CFR 270.30a-2(a)) is filed and attached hereto as Exhibit 99.CERT. |
(a) | (3) | Not applicable. |
(b) | | Certification pursuant to Rule 30a-2(b) under the Investment Company Act of 1940 (17 CFR 270.30a-2(b)) is furnished and attached hereto as Exhibit 99.906CERT. |
SIGNATURES
Pursuant to the requirements of the Securities Exchange Act of 1934 and the Investment Company Act of 1940, the registrant has duly caused this report to be signed on its behalf by the undersigned, thereunto duly authorized.
Fidelity Investment Trust
By: | /s/Christine Reynolds |
| Christine Reynolds |
| President and Treasurer |
| |
Date: | December 22, 2006 |
Pursuant to the requirements of the Securities Exchange Act of 1934 and the Investment Company Act of 1940, this report has been signed below by the following persons on behalf of the registrant and in the capacities and on the dates indicated.
By: | /s/Christine Reynolds |
| Christine Reynolds |
| President and Treasurer |
| |
Date: | December 22, 2006 |
By: | /s/Joseph B. Hollis |
| Joseph B. Hollis |
| Chief Financial Officer |
| |
Date: | December 22, 2006 |