UNITED STATES
SECURITIES AND EXCHANGE COMMISSION
Washington, D.C. 20549
FORM N-CSR
CERTIFIED SHAREHOLDER REPORT OF REGISTERED
MANAGEMENT INVESTMENT COMPANIES
Investment Company Act file number 811-4008
Fidelity Investment Trust
(Exact name of registrant as specified in charter)
82 Devonshire St., Boston, Massachusetts 02109
(Address of principal executive offices) (Zip code)
Scott C. Goebel, Secretary
82 Devonshire St.
Boston, Massachusetts 02109
(Name and address of agent for service)
Registrant's telephone number, including area code: 617-563-7000
Date of fiscal year end: | October 31 |
| |
Date of reporting period: | October 31, 2008 |
Item 1. Reports to Stockholders
Fidelity's
Broadly Diversified International Equity
Funds
Fidelity® Diversified International Fund
Fidelity Aggressive International Fund
(To be renamed Fidelity International Capital Appreciation Fund effective December 2008)
Fidelity Overseas Fund
Fidelity Worldwide Fund
Annual Report
October 31, 2008
(2_fidelity_logos) (Registered_Trademark)
Contents
Annual Report
To view a fund's proxy voting guidelines and proxy voting record for the 12-month period ended June 30, visit http://www.fidelity.com (search for "proxy voting guidelines") or visit the Securities and Exchange Commission's (SEC) web site at http://www.sec.gov. You may also call 1-800-544-8544 to request a free copy of the proxy voting guidelines.
Standard & Poor's, S&P and S&P 500 are registered service marks of The McGraw-Hill Companies, Inc. and have been licensed for use by Fidelity Distributors Corporation.
Other third party marks appearing herein are the property of their respective owners.
All other marks appearing herein are registered or unregistered trademarks or service marks of FMR LLC or an affiliated company.
This report and the financial statements contained herein are submitted for the general information of the shareholders of the funds. This report is not authorized for distribution to prospective investors in the funds unless preceded or accompanied by an effective prospectus.
A fund files its complete schedule of portfolio holdings with the SEC for the first and third quarters of each fiscal year on Form N-Q. Forms N-Q are available on the SEC's web site at http://www.sec.gov. A fund's Forms N-Q may be reviewed and copied at the SEC's Public Reference Room in Washington, DC. Information regarding the operation of the SEC's Public Reference Room may be obtained by calling 1-800-SEC-0330. For a complete list of a fund's portfolio holdings, view the most recent holdings listing, semiannual report, or annual report on Fidelity's web site at http://www.fidelity.com or http://www.advisor.fidelity.com, as applicable.
NOT FDIC INSURED · MAY LOSE VALUE · NO BANK GUARANTEE
Neither the funds nor Fidelity Distributors Corporation is a bank.
Annual Report
(photo_of_Edward_C_Johnson_3d)
Dear Shareholder:
Turmoil has been the watchword for the world's securities markets in 2008, with domestic and international stocks down sharply amid the global credit squeeze. A flight to quality boosted returns for U.S. Treasuries, one of the few asset classes with positive results heading into the latter stages of the year. Financial markets are always unpredictable, but there are a number of time-tested principles that can put the historical odds in your favor.
One of the basic tenets is to invest for the long term. Over time, riding out the markets' inevitable ups and downs has proven much more effective than selling into panic or chasing the hottest trend. Even missing only a few of the markets' best days can significantly diminish investor returns. Patience also affords the benefits of compounding - of earning interest on additional income or reinvested dividends and capital gains. There are tax advantages and cost benefits to consider as well. The more you sell, the more taxes you pay, and the more you trade, the higher the costs. While staying the course doesn't eliminate risk, it can considerably lessen the effect of short-term declines.
You can further manage your investing risk through diversification. And today, more than ever, geographic diversification should be taken into account. Studies indicate that asset allocation is the single most important determinant of a portfolio's long-term success. The right mix of stocks, bonds and cash - aligned to your particular risk tolerance and investment objective - is very important. Age-appropriate rebalancing is also an essential aspect of asset allocation. For younger investors, an emphasis on equities - which historically have been the best-performing asset class over time - is encouraged. As investors near their specific goal, such as retirement or sending a child to college, consideration may be given to replacing volatile assets (e.g. common stocks) with more-stable fixed investments (bonds or savings plans).
A third investment principle - investing regularly - can help lower the average cost of your purchases. Investing a certain amount of money each month or quarter helps ensure you won't pay for all your shares at market highs. This strategy - known as dollar cost averaging - also reduces unconstructive "emotion" from investing, helping shareholders avoid selling weak performers just prior to an upswing, or chasing a hot performer just before a correction.
We invite you to contact us via the Internet, through our Investor Centers or over the phone. It is our privilege to provide you the information you need to make the investments that are right for you.
Sincerely,
/s/Edward C. Johnson 3d
Edward C. Johnson 3d
Annual Report
Diversified International
Shareholder Expense Example
As a shareholder of the Fund, you incur two types of costs: (1) transaction costs, including redemption fees, and (2) ongoing costs, including management fees and other Fund expenses. This Example is intended to help you understand your ongoing costs (in dollars) of investing in the Fund and to compare these costs with the ongoing costs of investing in other mutual funds.
The actual expense Example is based on an investment of $1,000 invested at the beginning of the period and held for the entire period (May 1, 2008 to October 31, 2008) for Diversified International and for the entire period (May 9, 2008 to October 31, 2008) for Class K. The hypothetical expense Example is based on an investment of $1,000 invested for the one-half year period (May 1, 2008 to October 31, 2008).
Actual Expenses
The first line of the accompanying table for each class of the Fund provides information about actual account values and actual expenses. You may use the information in this line, together with the amount you invested, to estimate the expenses that you paid over the period. Simply divide your account value by $1,000.00 (for example, an $8,600 account value divided by $1,000.00 = 8.6), then multiply the result by the number in the first line for a class of the Fund under the heading entitled "Expenses Paid During Period" to estimate the expenses you paid on your account during this period. A small balance maintenance fee of $12.00 that is charged once a year may apply for certain accounts with a value of less than $2,000. This fee is not included in the table below. If it was, the estimate of expenses you paid during the period would be higher, and your ending account value lower, by this amount. In addition, the Fund, as a shareholder in the underlying Fidelity Central Funds, will indirectly bear its pro rata share of the fees and expenses incurred by the underlying Fidelity Central Funds. These fees and expenses are not included in the Fund's annualized expense ratio used to calculate the expense estimate in the table below.
Hypothetical Example for Comparison Purposes
The second line of the accompanying table for each class of the Fund provides information about hypothetical account values and hypothetical expenses based on a Class' actual expense ratio and an assumed rate of return of 5% per year before expenses, which is not the Class' actual return. The hypothetical account values and expenses may not be used to estimate the actual ending account balance or expenses you paid for the period. You may use this information to compare the ongoing costs of investing in the Fund and other funds. To do so, compare this 5% hypothetical example with the 5% hypothetical examples that appear in the shareholder reports of the other funds. A small balance maintenance fee of $12.00 that is charged once a year may apply for certain accounts with a value of less than $2,000. This fee is not included in the table below. If it was, the estimate of expenses you paid during the period would be higher, and your ending account value lower, by this amount. In addition, the Fund, as a shareholder in the underlying Fidelity Central Funds, will indirectly bear its pro rata share of the fees and expenses incurred by the underlying Fidelity Central Funds. These fees and expenses are not included in the Fund's annualized expense ratio used to calculate the expense estimate in the table below.
Please note that the expenses shown in the table are meant to highlight your ongoing costs only and do not reflect any transaction costs. Therefore, the second line of the table is useful in comparing ongoing costs only, and will not help you determine the relative total costs of owning different funds. In addition, if these transactional costs were included, your costs would have been higher.
| Annualized
Expense Ratio | Beginning
Account Value | Ending
Account Value
October 31, 2008 | Expenses Paid
During Period |
Diversified International | 1.03% | | | |
Actual | | $ 1,000.00 | $ 575.20 | $ 4.08 B |
HypotheticalA | | $ 1,000.00 | $ 1,019.96 | $ 5.23 C |
Class K | .88% | | | |
Actual | | $ 1,000.00 | $ 572.50 | $ 3.33 B |
HypotheticalA | | $ 1,000.00 | $ 1,020.71 | $ 4.47 C |
A 5% return per year before expenses
B Actual expenses are equal to each Class' annualized expense ratio, multiplied by the average account value over the period, multiplied by 184/366 (to reflect the one-half year period) for Diversified International and multiplied by 176/366 (to reflect the period May 9, 2008 to October 31, 2008) for Class K.
C Hypothetical expenses are equal to each Class' annualized expense ratio, multiplied by the average account value over the period, multiplied by 184/366 (to reflect the one-half year period).
Annual Report
Diversified International
Performance: The Bottom Line
Average annual total return reflects the change in the value of an investment, assuming reinvestment of the class' dividend income and capital gains (the profits earned upon the sale of securities that have grown in value, if any) and assuming a constant rate of performance each year. The $10,000 table and the fund's returns do not reflect the deduction of taxes that a shareholder would pay on fund distributions or the redemption of fund shares. During periods of reimbursement by Fidelity, a fund's total return will be greater than it would be had the reimbursement not occurred. How a fund did yesterday is no guarantee of how it will do tomorrow.
Average Annual Total Returns
Periods ended October 31, 2008 | Past 1
year | Past 5
years | Past 10
years |
Diversified International | -48.04% | 3.71% | 6.12% |
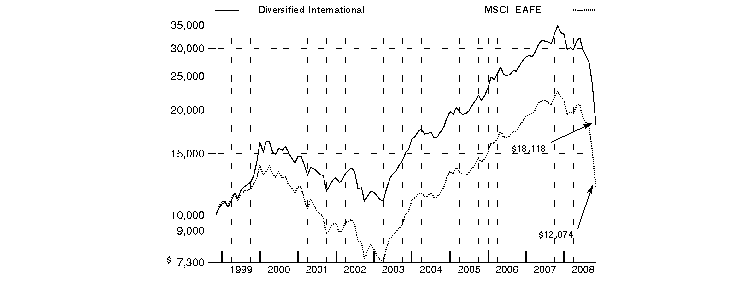
$10,000 Over 10 Years
Let's say hypothetically that $10,000 was invested in Diversified International, a class of the fund, on October 31, 1998. The chart shows how the value of your investment would have changed, and also shows how the MSCI® EAFE ® (Europe, Australasia, Far East) Index performed over the same period.
Annual Report
Diversified International
Management's Discussion of Fund Performance
Comments from William Bower, Portfolio Manager of Fidelity® Diversified International Fund
In a dramatic reversal of what had been a multiyear global growth story, international stocks fell long and hard during the 12 months ending October 31, 2008, especially so during the latter stages of the period and mostly as a result of fallout from the financial crisis that emanated from the United States. The viral spread of this financial contagion - which began in the U.S. subprime mortgage market, then seized up the credit markets, hobbled major financial institutions and eventually slowed economic growth worldwide - left virtually no corner of the globe untouched. Developed international equity markets - as gauged by the MSCI® Europe, Australasia, Far East (EAFE®) Index, which monitors established markets outside the U.S. and Canada - fell 46.54%, while the Standard & Poor's 500SM Index, a measure of U.S. stocks, dropped 36.10%. Among countries constituting at least 1% of the EAFE index, Switzerland had the "least worst" showing, falling roughly 32%, followed by Japan, where stocks slid by around 37%. Meanwhile, the weakest overall performance came from Belgium, where stocks slipped by nearly 70%. In the United Kingdom, the largest component of the index, equities were down almost 48%. Emerging markets were the weakest performers among the global economies, declining 56.22% as measured by the MSCI Emerging Markets Index.
For the year, the fund's Retail Class shares returned -48.04%, underperforming the MSCI EAFE index. The main detractors were unfavorable security selection in the energy and consumer discretionary groups. On the plus side, positive stock selection and an underweighting in financials helped, as did the fund's modest cash position. Geographically, weak security selection and an underweighting in Japan hurt, as did poor stock selection in Italy, France and the United Kingdom. Overweighting Switzerland and the United States helped, although unfavorable stock selection among U.S. stocks offset most of this benefit. Not owning German automaker and index component Volkswagen was the main detractor, with underperforming holdings of Italian automaker Fiat also a negative. Several underweightings hurt further: Swiss pharmaceutical company Novartis and integrated oil companies Total in France, U.K.-listed Royal Dutch Shell and BP - the latter of which I didn't own at all. A formerly held out-of-benchmark position in U.S. oil refiner and marketer Valero Energy also underperformed. U.K. household and personal products manufacturer Reckitt Benckiser contributed to the fund's relative return, as did two Swiss firms - pharmaceutical companies Roche Holding and Actelion - and U.S.-listed health care equipment/services provider Synthes. Australia-based blood plasma product company CSL Ltd. also helped.
The views expressed above reflect those of the portfolio manager(s) only through the end of the period as stated on the cover of this report and do not necessarily represent the views of Fidelity or any other person in the Fidelity organization. Any such views are subject to change at any time based upon market or other conditions and Fidelity disclaims any responsibility to update such views. These views may not be relied on as investment advice and, because investment decisions for a Fidelity fund are based on numerous factors, may not be relied on as an indication of trading intent on behalf of any Fidelity fund.
Annual Report
Diversified International
Investment Changes (Unaudited)
Geographic Diversification (% of fund's net assets) |
As of October 31, 2008 |
 | United Kingdom | 15.6% | |
 | Switzerland | 12.7% | |
 | United States of America | 12.2% | |
 | Japan | 10.6% | |
 | Germany | 9.7% | |
 | France | 7.1% | |
 | Canada | 6.9% | |
 | Spain | 3.9% | |
 | Australia | 3.1% | |
 | Other | 18.2% | |

Percentages are adjusted for the effect of futures contracts, if applicable. |
|
As of April 30, 2008 |
| United Kingdom | 14.4% | |
| Japan | 10.5% | |
| Germany | 10.5% | |
| United States of America | 9.8% | |
| Switzerland | 9.4% | |
| France | 7.7% | |
| Canada | 7.6% | |
| Spain | 4.0% | |
| Australia | 3.7% | |
| Other | 22.4% | |

Percentages are adjusted for the effect of futures contracts, if applicable. |
Asset Allocation |
| % of fund's
net assets | % of fund's net assets
6 months ago |
Stocks and Investment Companies | 94.1 | 94.0 |
Short-Term Investments and Net Other Assets | 5.9 | 6.0 |
Top Ten Stocks as of October 31, 2008 |
| % of fund's
net assets | % of fund's net assets
6 months ago |
Nestle SA (Reg.) (Switzerland, Food Products) | 2.9 | 1.9 |
E.ON AG (Germany, Electric Utilities) | 2.2 | 2.0 |
Telefonica SA (Spain, Diversified Telecommunication Services) | 2.0 | 1.6 |
Roche Holding AG (participation certificate) (Switzerland, Pharmaceuticals) | 1.8 | 1.4 |
Tesco PLC (United Kingdom, Food & Staples Retailing) | 1.8 | 1.4 |
Reckitt Benckiser Group PLC (United Kingdom, Household Products) | 1.7 | 1.3 |
Vodafone Group PLC sponsored ADR (United Kingdom, Wireless Telecommunication Services) | 1.7 | 1.7 |
Toyota Motor Corp. sponsored ADR (Japan, Automobiles) | 1.5 | 1.1 |
Canadian Natural Resources Ltd. (Canada, Oil, Gas & Consumable Fuels) | 1.3 | 1.1 |
HSBC Holdings PLC sponsored ADR (United Kingdom, Commercial Banks) | 1.3 | 0.6 |
| 18.2 | |
Market Sectors as of October 31, 2008 |
| % of fund's
net assets | % of fund's net assets
6 months ago |
Financials | 17.3 | 17.6 |
Consumer Staples | 13.8 | 9.4 |
Health Care | 13.3 | 7.0 |
Industrials | 11.1 | 12.1 |
Energy | 7.7 | 10.3 |
Information Technology | 7.4 | 8.1 |
Consumer Discretionary | 6.9 | 8.1 |
Telecommunication Services | 5.8 | 6.1 |
Materials | 5.5 | 10.6 |
Utilities | 5.2 | 4.6 |
Annual Report
Diversified International
Investments October 31, 2008
Showing Percentage of Net Assets
Common Stocks - 93.5% |
| Shares | | Value |
Australia - 3.1% |
AMP Ltd. | 8,000,000 | | $ 29,084,972 |
BHP Billiton Ltd. sponsored ADR (d) | 5,600,492 | | 217,747,129 |
Brambles Ltd. | 10,000,000 | | 53,312,487 |
Cochlear Ltd. | 800,000 | | 30,336,825 |
Commonwealth Bank of Australia | 1,500,000 | | 40,982,130 |
Computershare Ltd. | 7,000,000 | | 39,553,770 |
CSL Ltd. | 13,100,000 | | 318,421,605 |
Newcrest Mining Ltd. | 1,991,200 | | 27,357,569 |
QBE Insurance Group Ltd. | 9,000,000 | | 153,468,225 |
TOTAL AUSTRALIA | | 910,264,712 |
Belgium - 0.5% |
InBev SA (d) | 3,337,000 | | 134,591,656 |
KBC Groupe SA | 28,900 | | 1,242,476 |
Nyrstar SA/NV | 2,250,000 | | 6,984,638 |
TOTAL BELGIUM | | 142,818,770 |
Bermuda - 0.3% |
Clear Media Ltd. (a) | 22,325,000 | | 4,036,755 |
Covidien Ltd. | 1,950,000 | | 86,365,500 |
TOTAL BERMUDA | | 90,402,255 |
Brazil - 0.8% |
Banco do Brasil SA | 3,000,000 | | 19,822,567 |
BM&F BOVESPA SA | 3,000,000 | | 7,970,613 |
Cosan SA Industria e Comercio (a) | 3,174,893 | | 15,667,617 |
Petroleo Brasileiro SA - Petrobras sponsored ADR | 565,100 | | 15,195,539 |
Uniao de Bancos Brasileiros SA (Unibanco) GDR | 2,122,000 | | 133,855,760 |
Vivo Participacoes SA sponsored ADR | 2,750,000 | | 30,085,000 |
TOTAL BRAZIL | | 222,597,096 |
Canada - 6.9% |
Agnico-Eagle Mines Ltd. | 896,500 | | 24,728,471 |
Barrick Gold Corp. | 1,286,600 | | 29,406,781 |
Bombardier, Inc. Class B (sub. vtg.) (d) | 14,008,100 | | 54,020,289 |
Canadian Natural Resources Ltd. | 7,550,000 | | 380,818,544 |
Canadian Pacific Railway Ltd. | 2,900,000 | | 131,195,057 |
EnCana Corp. | 5,900,000 | | 299,599,436 |
Flint Energy Services Ltd. (a)(e) | 3,500,000 | | 20,173,329 |
Goldcorp, Inc. | 1,513,100 | | 28,284,354 |
Niko Resources Ltd. (e) | 4,450,000 | | 194,858,186 |
OPTI Canada, Inc. (a) | 2,900,000 | | 7,720,186 |
OZ Optics Ltd. unit (f) | 102,000 | | 1,231,650 |
Petrobank Energy & Resources Ltd. (a)(e) | 4,700,000 | | 89,650,025 |
Potash Corp. of Saskatchewan, Inc. | 350,000 | | 29,841,001 |
Power Corp. of Canada (sub. vtg.) | 3,200,000 | | 69,530,602 |
Research In Motion Ltd. (a) | 3,100,000 | | 156,333,016 |
Rogers Communications, Inc. Class B (non-vtg.) | 2,250,000 | | 65,290,678 |
Shoppers Drug Mart Corp. | 1,200,000 | | 46,176,812 |
Silver Wheaton Corp. (a) | 8,641,000 | | 30,098,026 |
SNC-Lavalin Group, Inc. | 3,000,000 | | 78,794,162 |
|
| Shares | | Value |
Suncor Energy, Inc. | 4,899,500 | | $ 117,631,883 |
Talisman Energy, Inc. | 1,000,000 | | 9,877,260 |
Trican Well Service Ltd. (e) | 7,425,000 | | 69,582,435 |
Ultra Petroleum Corp. (a) | 1,000,000 | | 46,550,000 |
Westernzagros Resources Ltd. (a) | 7,000,000 | | 4,295,903 |
Yamana Gold, Inc. | 2,945,900 | | 14,047,873 |
TOTAL CANADA | | 1,999,735,959 |
Cayman Islands - 0.6% |
China Medical Technologies, Inc. sponsored ADR (d) | 300,000 | | 7,311,000 |
Transocean, Inc. (a) | 2,050,220 | | 168,794,613 |
TOTAL CAYMAN ISLANDS | | 176,105,613 |
China - 0.3% |
China Coal Energy Co. Ltd. (H Shares) | 20,000,000 | | 12,130,021 |
China Shenhua Energy Co. Ltd. (H Shares) | 10,000,000 | | 18,985,682 |
Focus Media Holding Ltd. ADR (a)(d) | 2,300,000 | | 42,619,000 |
Global Bio-Chem Technology Group Co. Ltd. | 38,331,600 | | 5,342,193 |
Industrial & Commercial Bank of China | 25,000,000 | | 11,762,937 |
TOTAL CHINA | | 90,839,833 |
Czech Republic - 0.1% |
Ceske Energeticke Zavody AS | 900,000 | | 38,946,333 |
Denmark - 0.6% |
Carlsberg AS Series B | 1,891,300 | | 74,457,089 |
Genmab AS (a) | 400,000 | | 18,065,168 |
Novo Nordisk AS Series B | 745,800 | | 39,976,904 |
Novozymes AS Series B | 600,000 | | 42,357,242 |
TOTAL DENMARK | | 174,856,403 |
Finland - 0.5% |
Nokia Corp. sponsored ADR | 10,323,000 | | 156,703,140 |
France - 7.1% |
Alstom SA | 1,899,600 | | 94,151,152 |
AXA SA sponsored ADR (d) | 8,700,000 | | 162,777,000 |
bioMerieux SA | 300,000 | | 24,358,086 |
BNP Paribas SA | 2,415,700 | | 174,416,677 |
Bouygues SA | 2,600,000 | | 110,708,740 |
Cap Gemini SA | 7,000,000 | | 225,538,095 |
CNP Assurances | 400,000 | | 32,231,166 |
Compagnie Generale de Geophysique SA (a) | 759,173 | | 12,275,378 |
Credit Agricole SA | 3,975,600 | | 57,515,042 |
Dassault Aviation SA (d) | 36,265 | | 20,173,856 |
Electricite de France | 850,000 | | 51,070,982 |
Essilor International SA | 2,500,000 | | 112,144,620 |
Financiere Marc de Lacharriere SA (Fimalac) (d) | 1,400,000 | | 60,897,018 |
GDF Suez | 2,861,123 | | 127,890,952 |
Groupe Danone | 1,399,550 | | 77,928,157 |
Common Stocks - continued |
| Shares | | Value |
France - continued |
Ipsen SA | 500,000 | | $ 19,004,981 |
L'Air Liquide SA | 24,650 | | 2,127,174 |
LVMH Moet Hennessy - Louis Vuitton | 1,050,000 | | 69,871,157 |
Neopost SA | 700,000 | | 58,605,722 |
Nexans SA | 500,406 | | 28,543,114 |
Pernod Ricard SA | 3,050,000 | | 198,611,986 |
Pinault Printemps-Redoute SA | 800,000 | | 50,984,351 |
Renault SA | 917,400 | | 28,116,280 |
Sanofi-Aventis | 1,000,000 | | 63,357,107 |
Societe Generale Series A | 1,524,700 | | 83,103,782 |
Total SA Series B | 688,300 | | 37,865,747 |
Veolia Environnement | 750,000 | | 18,586,211 |
VINCI SA | 2,000,000 | | 71,974,700 |
TOTAL FRANCE | | 2,074,829,233 |
Germany - 9.5% |
Adidas-Salomon AG | 3,442,100 | | 122,226,981 |
Allianz AG: | | | |
(Reg.) | 17,300 | | 1,294,676 |
sponsored ADR | 22,000,000 | | 166,760,000 |
BASF AG | 800,000 | | 26,900,999 |
Bayer AG | 6,538,510 | | 363,996,844 |
Bayerische Motoren Werke AG (BMW) | 1,680,600 | | 43,603,544 |
Deutsche Boerse AG | 800,000 | | 63,965,973 |
Deutsche Telekom AG (Reg.) | 127,600 | | 1,905,885 |
E.ON AG | 16,662,540 | | 637,455,308 |
Fresenius AG | 2,727,400 | | 161,824,419 |
Fresenius Medical Care AG | 23,100 | | 1,050,586 |
GEA Group AG | 4,500,000 | | 65,762,727 |
GFK AG | 1,600,000 | | 31,596,033 |
K&S AG | 1,100,000 | | 43,529,676 |
Linde AG | 3,120,086 | | 262,030,382 |
Muenchener Rueckversicherungs-Gesellschaft AG (Reg.) | 1,500,000 | | 199,087,514 |
Q-Cells AG (a) | 1,000,000 | | 39,340,260 |
RWE AG | 2,629,500 | | 219,744,769 |
Siemens AG sponsored ADR (d) | 4,850,300 | | 291,745,545 |
SolarWorld AG | 1,000,000 | | 25,203,564 |
Symrise AG | 500,000 | | 6,210,602 |
TOTAL GERMANY | | 2,775,236,287 |
Greece - 0.0% |
Public Power Corp. of Greece | 819,655 | | 10,135,170 |
Hong Kong - 1.0% |
China Mobile (Hong Kong) Ltd. sponsored ADR (d) | 3,450,000 | | 151,420,500 |
Esprit Holdings Ltd. | 10,000,000 | | 56,820,610 |
Hutchison Whampoa Ltd. | 5,000,000 | | 26,700,000 |
Sun Hung Kai Properties Ltd. | 5,500,000 | | 48,185,758 |
TOTAL HONG KONG | | 283,126,868 |
|
| Shares | | Value |
India - 2.4% |
Bharti Airtel Ltd. (a) | 1,700,000 | | $ 23,018,326 |
HDFC Bank Ltd. | 300,000 | | 6,393,535 |
Infosys Technologies Ltd. | 6,000,000 | | 174,896,185 |
Infosys Technologies Ltd. sponsored ADR | 3,200,000 | | 93,824,000 |
Reliance Industries Ltd. | 5,500,000 | | 156,337,837 |
Satyam Computer Services Ltd. | 23,000,000 | | 145,412,165 |
State Bank of India | 4,000,000 | | 94,272,046 |
Union Bank of India | 1,500,000 | | 3,954,228 |
TOTAL INDIA | | 698,108,322 |
Indonesia - 0.4% |
PT Bumi Resources Tbk | 120,000,000 | | 15,711,180 |
PT Indosat Tbk sponsored ADR | 3,400,000 | | 82,586,000 |
PT Perusahaan Gas Negara Tbk
Series B | 130,000,000 | | 16,522,626 |
TOTAL INDONESIA | | 114,819,806 |
Ireland - 0.8% |
Anglo Irish Bank Corp. PLC | 2,000,000 | | 6,498,081 |
CRH PLC | 4,500,000 | | 99,745,942 |
Ryanair Holdings PLC sponsored ADR (a)(d) | 6,225,000 | | 138,630,750 |
TOTAL IRELAND | | 244,874,773 |
Italy - 2.1% |
A2A SpA | 10,000,000 | | 18,226,217 |
ENI SpA | 112,800 | | 2,692,327 |
Fiat SpA | 20,938,300 | | 166,412,412 |
Impregilo SpA (a) | 8,000,000 | | 21,102,917 |
Intesa Sanpaolo SpA | 69,738,492 | | 255,100,590 |
Prysmian SpA | 2,000,000 | | 24,262,115 |
UniCredit SpA | 50,000,000 | | 122,336,229 |
TOTAL ITALY | | 610,132,807 |
Japan - 10.6% |
Asahi Glass Co. Ltd. | 4,000,000 | | 25,133,822 |
Canon, Inc. sponsored ADR (d) | 8,500,000 | | 291,295,000 |
Daiwa Securities Group, Inc. | 9,000,000 | | 50,879,146 |
East Japan Railway Co. | 5,000 | | 35,578,206 |
Fanuc Ltd. | 1,700,000 | | 113,262,968 |
Honda Motor Co. Ltd. | 1,600,000 | | 39,782,613 |
Hoya Corp. | 999,500 | | 18,249,758 |
Japan Tobacco, Inc. | 61,556 | | 218,369,569 |
JSR Corp. | 4,000,000 | | 45,117,161 |
Keyence Corp. | 920,000 | | 176,291,753 |
Konica Minolta Holdings, Inc. | 5,250,000 | | 34,476,605 |
Kubota Corp. | 8,000,000 | | 40,152,787 |
Mitsubishi Corp. | 8,500,000 | | 142,468,506 |
Mitsubishi Estate Co. Ltd. | 3,500,000 | | 62,518,550 |
Mitsubishi UFJ Financial Group, Inc. | 30,000,000 | | 188,515,602 |
Mitsui & Co. Ltd. | 13,750,000 | | 133,223,961 |
Mitsui Fudosan Co. Ltd. | 2,500,000 | | 43,605,958 |
Mizuho Financial Group, Inc. | 100 | | 244,168 |
Common Stocks - continued |
| Shares | | Value |
Japan - continued |
Mori Seiki Co. Ltd. (d) | 2,000,000 | | $ 17,262,594 |
NGK Insulators Ltd. | 3,000,000 | | 31,158,407 |
Nikon Corp. | 4,300,000 | | 60,597,431 |
Nintendo Co. Ltd. | 310,000 | | 96,719,996 |
Nomura Holdings, Inc. | 13,000,000 | | 123,160,107 |
ORIX Corp. | 1,790,000 | | 183,900,827 |
Sony Corp. | 2,500,000 | | 59,247,868 |
Sony Financial Holdings, Inc. | 38,379 | | 124,812,902 |
Sumitomo Metal Industries Ltd. | 10,000,000 | | 25,718,083 |
Sumitomo Mitsui Financial Group, Inc. | 42,150 | | 168,965,088 |
Sumitomo Trust & Banking Co. Ltd. | 9,000,000 | | 41,677,592 |
Tokai Carbon Co. Ltd. (d) | 6,000,000 | | 31,458,345 |
Tokuyama Corp. | 6,000,000 | | 30,383,455 |
Toyota Motor Corp. sponsored ADR (d) | 5,899,957 | | 448,927,728 |
TOTAL JAPAN | | 3,103,156,556 |
Korea (South) - 1.5% |
Amorepacific Corp. | 139,531 | | 61,518,420 |
LG Household & Health Care Ltd. | 389,650 | | 55,834,965 |
NHN Corp. (a) | 1,200,000 | | 128,101,379 |
Samsung Electronics Co. Ltd. | 310,000 | | 131,098,303 |
Shinhan Financial Group Co. Ltd. | 2,200,000 | | 53,687,691 |
TOTAL KOREA (SOUTH) | | 430,240,758 |
Luxembourg - 0.6% |
ArcelorMittal SA (NY Shares) Class A (d) | 1,250,000 | | 32,812,500 |
Reinet Investments SCA (a) | 273,775 | | 2,853,268 |
Reinet Investments SCA (a) | 1,726,225 | | 33,515,472 |
SES SA FDR (France) unit | 5,916,322 | | 106,432,112 |
TOTAL LUXEMBOURG | | 175,613,352 |
Malaysia - 0.1% |
DiGi.com Bhd | 6,500,000 | | 33,818,599 |
KNM Group Bhd | 18,750,000 | | 3,179,368 |
TOTAL MALAYSIA | | 36,997,967 |
Mexico - 0.6% |
America Movil SAB de CV Series L sponsored ADR | 3,825,000 | | 118,345,500 |
Grupo Televisa SA de CV (CPO) sponsored ADR | 3,700,000 | | 65,342,000 |
TOTAL MEXICO | | 183,687,500 |
Netherlands - 1.9% |
Gemalto NV (a) | 300,000 | | 8,405,181 |
Heineken NV (Bearer) | 2,900,000 | | 97,826,318 |
ING Groep NV sponsored ADR (d) | 3,000,000 | | 27,930,000 |
Koninklijke KPN NV | 8,236,900 | | 116,001,840 |
Unilever NV (Certificaten Van Aandelen) | 11,900,000 | | 286,783,766 |
TOTAL NETHERLANDS | | 536,947,105 |
Netherlands Antilles - 0.6% |
Schlumberger Ltd. (NY Shares) | 3,240,200 | | 167,356,330 |
|
| Shares | | Value |
Norway - 0.5% |
Orkla ASA (A Shares) | 4,472,494 | | $ 29,774,356 |
Petroleum Geo-Services ASA (a) | 5,500,250 | | 27,387,993 |
Pronova BioPharma ASA | 12,999,500 | | 33,771,424 |
Renewable Energy Corp. AS (a) | 4,700,000 | | 44,343,736 |
TOTAL NORWAY | | 135,277,509 |
Panama - 0.1% |
McDermott International, Inc. (a) | 1,000,000 | | 17,130,000 |
Papua New Guinea - 0.3% |
Lihir Gold Ltd. (a) | 68,988,224 | | 86,036,634 |
Russia - 0.4% |
OAO Gazprom sponsored ADR | 5,100,000 | | 104,295,000 |
Vimpel Communications sponsored ADR | 1,000,000 | | 14,500,000 |
TOTAL RUSSIA | | 118,795,000 |
South Africa - 0.2% |
Impala Platinum Holdings Ltd. | 5,400,000 | | 55,768,679 |
MTN Group Ltd. | 1,000,000 | | 11,156,602 |
TOTAL SOUTH AFRICA | | 66,925,281 |
Spain - 3.9% |
Banco Bilbao Vizcaya Argentaria SA sponsored ADR (d) | 7,900,000 | | 91,640,000 |
Banco Santander SA sponsored ADR (d) | 10,250,000 | | 110,085,000 |
Enagas SA | 5,000,649 | | 97,700,756 |
Grifols SA | 1,300,000 | | 25,871,024 |
Inditex SA | 4,750,000 | | 160,561,654 |
Red Electrica Corporacion SA | 1,700,000 | | 74,513,108 |
Repsol YPF SA | 13,200 | | 251,010 |
Telefonica SA | 31,088,200 | | 575,596,054 |
TOTAL SPAIN | | 1,136,218,606 |
Sweden - 0.3% |
Assa Abloy AB (B Shares) (d) | 3,259,600 | | 36,385,251 |
Getinge AB (B Shares) | 1,500,000 | | 20,975,177 |
H&M Hennes & Mauritz AB (B Shares) | 34,000 | | 1,218,985 |
Svenska Cellulosa AB (SCA) (B Shares) | 4,999,600 | | 36,911,907 |
TOTAL SWEDEN | | 95,491,320 |
Switzerland - 12.7% |
ABB Ltd. (Reg.) | 10,911,330 | | 143,137,874 |
Actelion Ltd. (Reg.) (a) | 4,323,540 | | 228,354,079 |
Alcon, Inc. | 1,950,000 | | 171,834,000 |
ARYZTA AG (a) | 2,000,000 | | 71,541,015 |
Compagnie Financiere Richemont
Series A | 1,500,000 | | 31,905,548 |
Credit Suisse Group sponsored ADR | 3,700,000 | | 138,380,000 |
Credit Suisse Group (Reg.) | 60,094 | | 2,246,663 |
EFG International | 500,000 | | 10,761,489 |
Julius Baer Holding AG | 5,934,441 | | 232,047,347 |
Kuehne & Nagel International AG | 1,300,000 | | 78,692,398 |
Nestle SA (Reg.) | 21,707,621 | | 843,962,154 |
Common Stocks - continued |
| Shares | | Value |
Switzerland - continued |
Nobel Biocare Holding AG (Switzerland) | 550,000 | | $ 9,446,245 |
Novartis AG: | | | |
(Reg.) | 87,694 | | 4,450,214 |
sponsored ADR | 6,450,000 | | 328,885,500 |
Roche Holding AG (participation certificate) | 3,419,834 | | 522,871,714 |
Schindler Holding AG (Reg.) | 1,400,000 | | 64,081,709 |
SGS Societe Generale de Surveillance Holding SA (Reg.) | 195,000 | | 191,943,679 |
Sonova Holding AG | 2,500,000 | | 103,854,018 |
Sulzer AG (Reg.) | 885,300 | | 52,256,739 |
Syngenta AG sponsored ADR | 2,750,000 | | 102,795,000 |
Tecan Group AG (e) | 1,100,000 | | 49,374,624 |
UBS AG: | | | |
(For. Reg.) | 120,703 | | 2,047,560 |
(NY Shares) | 5,250,000 | | 88,725,000 |
Zurich Financial Services AG (Reg.) | 1,207,564 | | 244,934,936 |
TOTAL SWITZERLAND | | 3,718,529,505 |
Taiwan - 0.3% |
Hon Hai Precision Industry Co. Ltd. (Foxconn) | 34,500,000 | | 83,674,398 |
Turkey - 0.1% |
Tupras-Turkiye Petrol Rafinerileri AS | 1,000,000 | | 12,633,216 |
United Kingdom - 15.6% |
Aegis Group PLC | 9,000,000 | | 9,483,855 |
Anglo American PLC (United Kingdom) | 1,400,000 | | 35,123,433 |
BAE Systems PLC | 11,293,800 | | 63,474,199 |
Barclays PLC | 5,000,000 | | 14,331,143 |
Bellway PLC | 2,450,000 | | 21,341,216 |
BG Group PLC | 6,000,000 | | 88,212,810 |
BHP Billiton PLC | 4,000,000 | | 67,913,786 |
Bovis Homes Group PLC (d)(e) | 6,750,000 | | 36,892,190 |
British American Tobacco PLC: | | | |
(United Kingdom) | 82,200 | | 2,254,411 |
sponsored ADR | 4,830,000 | | 262,558,800 |
British Sky Broadcasting Group PLC (BSkyB) | 2,500,000 | | 15,211,529 |
Cadbury PLC | 5,920,000 | | 54,352,020 |
Capita Group PLC | 24,346,451 | | 251,540,397 |
Centrica PLC | 2,500,000 | | 12,283,034 |
Diageo PLC | 113,400 | | 1,730,329 |
easyJet PLC (a)(e) | 30,000,000 | | 149,638,996 |
European Capital Ltd. (e) | 5,819,600 | | 13,349,451 |
Experian PLC | 15,000,000 | | 82,714,389 |
GlaxoSmithKline PLC | 6,500,000 | | 124,940,300 |
HBOS PLC | 23,999,905 | | 39,293,271 |
HSBC Holdings PLC: | | | |
(United Kingdom) (Reg.) | 401,671 | | 4,756,891 |
sponsored ADR (d) | 6,225,600 | | 367,310,400 |
Imperial Tobacco Group PLC | 5,125,900 | | 137,364,970 |
|
| Shares | | Value |
Inchcape PLC | 10,679,000 | | $ 13,614,756 |
Informa PLC (e) | 27,000,000 | | 91,463,882 |
International Power PLC | 22,504,800 | | 80,501,030 |
Lloyds TSB Group PLC | 20,200,000 | | 65,280,490 |
Man Group PLC | 20,000,000 | | 115,455,376 |
Misys PLC | 15,000,355 | | 26,856,259 |
National Grid PLC | 9,251,300 | | 104,204,102 |
NEXT PLC | 700,000 | | 11,896,434 |
Pearson PLC | 8,100,000 | | 80,668,610 |
Persimmon PLC (d) | 4,200,000 | | 20,330,635 |
Prudential PLC | 13,000,000 | | 65,295,341 |
Reckitt Benckiser Group PLC | 12,050,400 | | 509,666,692 |
Redrow PLC (d) | 4,650,000 | | 15,550,255 |
Rio Tinto PLC sponsored ADR | 900,000 | | 167,283,000 |
Royal Bank of Scotland Group PLC | 40,487,500 | | 44,592,148 |
Royal Dutch Shell PLC: | | | |
Class A sponsored ADR | 200,000 | | 11,162,000 |
Class B | 192,300 | | 5,212,949 |
Class B ADR | 900,000 | | 49,761,000 |
Smith & Nephew PLC | 5,440,500 | | 49,808,900 |
SSL International PLC | 1,500,000 | | 10,129,535 |
Standard Chartered PLC (United Kingdom) | 5,700,300 | | 94,197,397 |
Tesco PLC | 94,500,000 | | 517,712,135 |
Vodafone Group PLC sponsored ADR | 25,800,000 | | 497,166,000 |
Wolseley PLC | 197,000 | | 1,077,977 |
WPP Group PLC | 10,000,000 | | 59,810,150 |
TOTAL UNITED KINGDOM | | 4,564,768,873 |
United States of America - 6.2% |
Allergan, Inc. | 3,350,000 | | 132,894,500 |
Anheuser-Busch Companies, Inc. | 1,400,000 | | 86,842,000 |
Bank of America Corp. | 2,500,000 | | 60,425,000 |
Bank of New York Mellon Corp. | 1,350,000 | | 44,010,000 |
Baxter International, Inc. | 550,000 | | 33,269,500 |
C.R. Bard, Inc. | 900,000 | | 79,425,000 |
Flowserve Corp. | 1,700,000 | | 96,764,000 |
Genentech, Inc. (a) | 3,260,000 | | 270,384,400 |
Goldman Sachs Group, Inc. | 716,791 | | 66,303,168 |
Google, Inc. Class A (sub. vtg.) (a) | 172,645 | | 62,041,707 |
Henry Schein, Inc. (a) | 1,050,000 | | 49,150,500 |
Hess Corp. | 1,048,600 | | 63,136,206 |
JPMorgan Chase & Co. | 400,000 | | 16,500,000 |
Peabody Energy Corp. | 1,609,700 | | 55,550,747 |
Philip Morris International, Inc. | 4,000,000 | | 173,880,000 |
PNC Financial Services Group, Inc. | 874,100 | | 58,276,247 |
Stryker Corp. | 2,175,000 | | 116,275,500 |
Synthes, Inc. | 1,812,274 | | 233,809,846 |
Common Stocks - continued |
| Shares | | Value |
United States of America - continued |
Titanium Metals Corp. (d) | 3,042,409 | | $ 28,324,828 |
Visa, Inc. | 1,700,000 | | 94,095,000 |
TOTAL UNITED STATES OF AMERICA | | 1,821,358,149 |
TOTAL COMMON STOCKS (Cost $34,352,246,805) | 27,305,371,439 |
Preferred Stocks - 0.5% |
| | | |
Convertible Preferred Stocks - 0.0% |
Canada - 0.0% |
MetroPhotonics, Inc. Series 2 (a)(f) | 198,000 | | 2 |
Nonconvertible Preferred Stocks - 0.5% |
Germany - 0.2% |
Porsche Automobil Holding SE | 691,520 | | 61,892,642 |
Italy - 0.3% |
Fiat SpA | 2,000,000 | | 8,914,020 |
Intesa Sanpaolo SpA | 22,000,000 | | 65,298,874 |
TOTAL ITALY | | 74,212,894 |
TOTAL NONCONVERTIBLE PREFERRED STOCKS | | 136,105,536 |
TOTAL PREFERRED STOCKS (Cost $227,801,440) | 136,105,538 |
Investment Companies - 0.1% |
| | | |
United States of America - 0.1% |
United States Natural Gas Fund LP ETF (a)
(Cost $30,527,796) | 1,000,000 | | 28,790,000 |
Government Obligations - 0.0% |
| Principal Amount | | |
United States of America - 0.0% |
U.S. Treasury Bills, yield at date of purchase 0.6% to 1.68% 12/4/08 to 1/2/09
(Cost $6,654,775) | | $ 6,665,000 | | 6,662,939 |
Money Market Funds - 5.9% |
| Shares | | Value |
Fidelity Cash Central Fund, 1.81% (b) | 1,350,032,331 | | $ 1,350,032,331 |
Fidelity Securities Lending Cash Central Fund, 2.67% (b)(c) | 383,400,911 | | 383,400,911 |
TOTAL MONEY MARKET FUNDS (Cost $1,733,433,242) | 1,733,433,242 |
TOTAL INVESTMENT PORTFOLIO - 100.0% (Cost $36,350,664,058) | 29,210,363,158 |
NET OTHER ASSETS - 0.0% | | (3,127,172) |
NET ASSETS - 100% | $ 29,207,235,986 |
Forward Foreign Currency Contracts |
| Settlement Dates | | Value | | Unrealized Appreciation/
(Depreciation) |
Contracts to Buy |
65,370,118,500 JPY | Nov. 2008 | | $ 664,206,163 | | $ 49,526,241 |
(Payable Amount $614,679,922) |
|
The value of contracts to buy as a percentage of net assets - 2.3% |
Currency Abbreviation |
JPY | - | Japanese yen |
Legend |
(a) Non-income producing |
(b) Affiliated fund that is available only to investment companies and other accounts managed by Fidelity Investments. The rate quoted is the annualized seven-day yield of the fund at period end. A complete unaudited listing of the fund's holdings as of its most recent quarter end is available upon request. |
(c) Investment made with cash collateral received from securities on loan. |
(d) Security or a portion of the security is on loan at period end. |
(e) Affiliated company |
(f) Restricted securities - Investment in securities not registered under the Securities Act of 1933 (excluding 144A issues). At the end of the period, the value of restricted securities (excluding 144A issues) amounted to $1,231,652 or 0.0% of net assets. |
Additional information on each holding is as follows: |
Security | Acquisition Date | Acquisition Cost |
MetroPhotonics, Inc. Series 2 | 9/29/00 | $ 1,980,000 |
OZ Optics Ltd. unit | 8/18/00 | $ 1,505,520 |
Affiliated Central Funds |
Information regarding fiscal year to date income earned by the Fund from investments in Fidelity Central Funds is as follows: |
Fund | Income earned |
Fidelity Cash Central Fund | $ 77,119,703 |
Fidelity Securities Lending Cash Central Fund | 41,104,703 |
Total | $ 118,224,406 |
Other Affiliated Issuers |
An affiliated company is a company in which the fund has ownership of at least 5% of the voting securities. Fiscal year to date transactions with companies which are or were affiliates are as follows: |
Affiliates | Value,
beginning of period | Purchases | Sales
Proceeds | Dividend
Income | Value,
end of
period |
Bovis Homes Group PLC | $ - | $ 78,498,961 | $ 4,186,769 | $ 1,677,491 | $ 36,892,190 |
easyJet PLC | 124,061,753 | 190,785,609 | 6,068,257 | - | 149,638,996 |
European Capital Ltd. | 69,643,666 | - | - | 5,261,084 | 13,349,451 |
Flint Energy Services Ltd. | 64,419,614 | 19,408,647 | - | - | 20,173,329 |
Informa PLC | 177,966,681 | 81,690,889 | - | 8,504,064 | 91,463,882 |
Niko Resources Ltd. | 437,004,872 | 42,997,397 | - | 411,062 | 194,858,186 |
Petrobank Energy & Resources Ltd. | - | 220,690,532 | - | - | 89,650,025 |
Tecan Group AG | 73,599,240 | - | - | 889,931 | 49,374,624 |
Trican Well Service Ltd. | 84,727,812 | 56,858,142 | - | 586,271 | 69,582,435 |
United States Natural Gas Fund LP ETF | - | 96,039,648 | 69,817,871 | - | - |
Total | $ 1,031,423,638 | $ 786,969,825 | $ 80,072,897 | $ 17,329,903 | $ 714,983,118 |
Income Tax Information |
At October 31, 2008, the Fund had a capital loss carryforward of approximately $956,782,987 all of which will expire on October 31, 2016. |
See accompanying notes which are an integral part of the financial statements.
Annual Report
Diversified International
Financial Statements
Statement of Assets and Liabilities
| October 31, 2008 |
| | |
Assets | | |
Investment in securities, at value (including securities loaned of $376,254,296) - See accompanying schedule: Unaffiliated issuers (cost $33,176,706,808) | $ 26,761,946,798 | |
Fidelity Central Funds (cost $1,733,433,242) | 1,733,433,242 | |
Other affiliated issuers (cost $1,440,524,008) | 714,983,118 | |
Total Investments (cost $36,350,664,058) | | $ 29,210,363,158 |
Foreign currency held at value (cost $2,238) | | 2,455 |
Receivable for investments sold | | 291,404,619 |
Unrealized appreciation on foreign currency contracts | | 49,526,241 |
Receivable for closed foreign currency contracts | | 29,679,922 |
Receivable for fund shares sold | | 55,827,005 |
Dividends receivable | | 65,420,521 |
Distributions receivable from Fidelity Central Funds | | 2,087,716 |
Prepaid expenses | | 14,792 |
Other receivables | | 2,060,604 |
Total assets | | 29,706,387,033 |
| | |
Liabilities | | |
Payable to custodian bank | $ 291,338 | |
Payable for investments purchased | 62,646,341 | |
Payable for fund shares redeemed | 24,731,658 | |
Accrued management fee | 17,184,851 | |
Other affiliated payables | 8,316,159 | |
Other payables and accrued expenses | 2,579,789 | |
Collateral on securities loaned, at value | 383,400,911 | |
Total liabilities | | 499,151,047 |
| | |
Net Assets | | $ 29,207,235,986 |
Net Assets consist of: | | |
Paid in capital | | $ 37,047,989,511 |
Undistributed net investment income | | 552,385,607 |
Accumulated undistributed net realized gain (loss) on investments and foreign currency transactions | | (1,299,616,688) |
Net unrealized appreciation (depreciation) on investments and assets and liabilities in foreign currencies | | (7,093,522,444) |
Net Assets | | $ 29,207,235,986 |
Diversified International:
Net Asset Value, offering price and redemption price per share ($28,274,960,980 ÷ 1,287,814,073 shares) | | $ 21.96 |
| | |
Class K:
Net Asset Value, offering price and redemption price per share ($932,275,006 ÷ 42,419,202 shares) | | $ 21.98 |
Statement of Operations
| Year ended October 31, 2008 |
| | |
Investment Income | | |
Dividends (including $17,329,903 earned from other affiliated issuers) | | $ 1,245,912,229 |
Interest | | 527,904 |
Income from Fidelity Central Funds | | 118,224,406 |
| | 1,364,664,539 |
Less foreign taxes withheld | | (110,978,803) |
Total income | | 1,253,685,736 |
| | |
Expenses | | |
Management fee
Basic fee | $ 348,107,076 | |
Performance adjustment | 34,025,276 | |
Transfer agent fees | 107,838,956 | |
Accounting and security lending fees | 2,991,396 | |
Custodian fees and expenses | 9,470,095 | |
Independent trustees' compensation | 220,104 | |
Depreciation in deferred trustee compensation account | (287) | |
Registration fees | 467,213 | |
Audit | 252,296 | |
Legal | 261,150 | |
Miscellaneous | 5,619,033 | |
Total expenses before reductions | 509,252,308 | |
Expense reductions | (8,163,778) | 501,088,530 |
Net investment income (loss) | | 752,597,206 |
Realized and Unrealized Gain (Loss) Net realized gain (loss) on: | | |
Investment securities: | | |
Unaffiliated issuers (net of foreign taxes of $5,800,092) | (1,165,122,340) | |
Other affiliated issuers | (1,006,620) | |
Foreign currency transactions | (21,201,137) | |
Futures contracts | (35,266,379) | |
Total net realized gain (loss) | | (1,222,596,476) |
Change in net unrealized appreciation (depreciation) on: Investment securities (net of decrease in deferred foreign taxes of $12,720,916) | (27,575,257,303) | |
Assets and liabilities in foreign currencies | 34,073,636 | |
Total change in net unrealized appreciation (depreciation) | | (27,541,183,667) |
Net gain (loss) | | (28,763,780,143) |
Net increase (decrease) in net assets resulting from operations | | $ (28,011,182,937) |
See accompanying notes which are an integral part of the financial statements.
Annual Report
Statement of Changes in Net Assets
| Year ended
October 31,
2008 | Year ended
October 31,
2007 |
Increase (Decrease) in Net Assets | | |
Operations | | |
Net investment income (loss) | $ 752,597,206 | $ 610,840,044 |
Net realized gain (loss) | (1,222,596,476) | 3,897,636,523 |
Change in net unrealized appreciation (depreciation) | (27,541,183,667) | 9,174,039,868 |
Net increase (decrease) in net assets resulting from operations | (28,011,182,937) | 13,682,516,435 |
Distributions to shareholders from net investment income | (623,834,183) | (425,826,410) |
Distributions to shareholders from net realized gain | (3,411,186,315) | (2,968,965,380) |
Total distributions | (4,035,020,498) | (3,394,791,790) |
Share transactions - net increase (decrease) | 1,321,563,137 | 5,675,290,664 |
Redemption fees | 1,934,056 | 1,737,801 |
Total increase (decrease) in net assets | (30,722,706,242) | 15,964,753,110 |
| | |
Net Assets | | |
Beginning of period | 59,929,942,228 | 43,965,189,118 |
End of period (including undistributed net investment income of $552,385,607 and undistributed net investment income of $604,543,864, respectively) | $ 29,207,235,986 | $ 59,929,942,228 |
Financial Highlights - Diversified International
Years ended October 31, | 2008 | 2007 | 2006 | 2005 | 2004 |
Selected Per-Share Data | | | | | |
Net asset value, beginning of period | $ 45.41 | $ 37.58 | $ 30.80 | $ 26.08 | $ 22.35 |
Income from Investment Operations | | | | | |
Net investment income (loss) B | .55 | .47 | .46 | .30 | .16 |
Net realized and unrealized gain (loss) | (20.96) | 10.23 | 7.33 | 4.63 | 3.87 |
Total from investment operations | (20.41) | 10.70 | 7.79 | 4.93 | 4.03 |
Distributions from net investment income | (.47) | (.36) | (.28) | (.15) | (.30) |
Distributions from net realized gain | (2.57) | (2.51) | (.73) | (.06) | - |
Total distributions | (3.04) | (2.87) | (1.01) | (.21) | (.30) |
Redemption fees added to paid in capital B, F | - | - | - | - | - |
Net asset value, end of period | $ 21.96 | $ 45.41 | $ 37.58 | $ 30.80 | $ 26.08 |
Total Return A | (48.04)% | 30.37% | 25.89% | 19.01% | 18.20% |
Ratios to Average Net Assets C, E | | | | | |
Expenses before reductions | 1.04% | .93% | 1.01% | 1.10% | 1.15% |
Expenses net of fee waivers, if any | 1.04% | .93% | 1.01% | 1.10% | 1.15% |
Expenses net of all reductions | 1.02% | .91% | .97% | 1.07% | 1.12% |
Net investment income (loss) | 1.53% | 1.20% | 1.32% | 1.02% | .66% |
Supplemental Data | | | | | |
Net assets, end of period (000 omitted) | $ 28,274,961 | $ 59,929,942 | $ 43,965,189 | $ 29,637,193 | $ 19,902,063 |
Portfolio turnover rate D | 49% | 51% | 59% | 41% | 55% |
A Total returns would have been lower had certain expenses not been reduced during the periods shown. B Calculated based on average shares outstanding during the period. C Fees and expenses of the underlying Fidelity Central Funds are not included in the Fund's expense ratio. The Fund indirectly bears its proportionate share of the expenses of any underlying Fidelity Central Funds. D Amount does not include the portfolio activity of any underlying Fidelity Central Funds. E Expense ratios reflect operating expenses of the class. Expenses before reductions do not reflect amounts reimbursed by the investment adviser or reductions from brokerage service arrangements or other expense offset arrangements and do not represent the amount paid by the class during periods when reimbursements or reductions occur. Expenses net of fee waivers reflect expenses after reimbursement by the investment adviser but prior to reductions from brokerage service arrangements or other expense offset arrangements. Expenses net of all reductions represent the net expenses paid by the class. F Amount represents less than $.01 per share. |
See accompanying notes which are an integral part of the financial statements.
Annual Report
Financial Highlights - Class K
Year ended October 31, | 2008 G |
Selected Per-Share Data | |
Net asset value, beginning of period | $ 38.39 |
Income from Investment Operations | |
Net investment income (loss) D | .16 |
Net realized and unrealized gain (loss) | (16.57) |
Total from investment operations | (16.41) |
Redemption fees added to paid in capital D, I | - |
Net asset value, end of period | $ 21.98 |
Total Return B, C | (42.75)% |
Ratios to Average Net Assets E, H | |
Expenses before reductions | .88% A |
Expenses net of fee waivers, if any | .88% A |
Expenses net of all reductions | .87% A |
Net investment income (loss) | 1.45% A |
Supplemental Data | |
Net assets, end of period (000 omitted) | $ 932,275 |
Portfolio turnover rate F | 49% |
A Annualized B Total returns for periods of less than one year are not annualized. C Total returns would have been lower had certain expenses not been reduced during the periods shown. D Calculated based on average shares outstanding during the period. E Fees and expenses of the underlying Fidelity Central Funds are not included in the Fund's expense ratio. The Fund indirectly bears its proportionate share of the expenses of any underlying Fidelity Central Funds. F Amount does not include the portfolio activity of any underlying Fidelity Central Funds. G For the period May 9, 2008 (commencement of sale of shares) to October 31, 2008. H Expense ratios reflect operating expenses of the class. Expenses before reductions do not reflect amounts reimbursed by the investment adviser or reductions from brokerage service arrangements or other expense offset arrangements and do not represent the amount paid by the class during periods when reimbursements or reductions occur. Expense ratios before reductions for start-up periods may not be representative of longer-term operating periods. Expenses net of fee waivers reflect expenses after reimbursement by the investment adviser but prior to reductions from brokerage service arrangements or other expense offset arrangements. Expenses net of all reductions represent the net expenses paid by the class. I Amount represents less than $.01 per share. |
See accompanying notes which are an integral part of the financial statements.
Annual Report
Notes to Financial Statements
For the period ended October 31, 2008
1. Organization.
Fidelity Diversified International Fund (the Fund) is a fund of Fidelity Investment Trust (the trust) and is authorized to issue an unlimited number of shares. The trust is registered under the Investment Company Act of 1940, as amended (the 1940 Act), as an open-end management investment company organized as a Massachusetts business trust. The Fund offers Diversified International and Class K shares, each of which has equal rights as to assets and voting privileges. Each class has exclusive voting rights with respect to matters that affect that class. The Fund commenced sale of Class K shares and the existing class was designated Diversified International on May 9, 2008. Investment income, realized and unrealized capital gains and losses, the common expenses of the Fund, and certain fund-level expense reductions, if any, are allocated on a pro rata basis to each class based on the relative net assets of each class to the total net assets of the Fund. Each class differs with respect to transfer agent fees incurred. Certain expense reductions also differ by class. The Fund is currently closed to most new accounts. The Fund's investments in emerging markets can be subject to social, economic, regulatory, and political uncertainties and can be extremely volatile.
2. Investments in Fidelity Central Funds.
The Fund may invest in Fidelity Central Funds, which are open-end investment companies available only to other investment companies and accounts managed by Fidelity Management & Research Company (FMR) and its affiliates. The Fund's Schedule of Investments lists each of the Fidelity Central Funds held as of period end, if any, as an investment of the Fund, but does not include the underlying holdings of each Fidelity Central Fund. As an Investing Fund, the Fund indirectly bears its proportionate share of the expenses of the underlying Fidelity Central Funds.
The Money Market Central Funds seek preservation of capital and current income and are managed by Fidelity Investments Money Management, Inc. (FIMM), an affiliate of FMR.
A complete unaudited list of holdings for each Fidelity Central Fund is available upon request or at the SEC's web site at www.sec.gov. In addition, the financial statements of the Fidelity Central Funds, which are not covered by the Fund's Report of Independent Registered Public Accounting Firm, are available on the SEC's web site or upon request.
3. Significant Accounting Policies.
The financial statements have been prepared in conformity with accounting principles generally accepted in the United States of America, which require management to make certain estimates and assumptions at the date of the financial statements. Actual results could differ from those estimates. The following summarizes the significant accounting policies of the Fund:
Security Valuation. Investments are valued as of 4:00 p.m. Eastern time on the last calendar day of the period. Wherever possible, the Fund uses independent pricing services approved by the Board of Trustees to value its investments.
Equity securities, including restricted securities, for which market quotations are readily available, are valued at the last reported sale price or official closing price as reported by an independent pricing service on the primary market or exchange on which they are traded. In the event there were no sales during the day or closing prices are not available, securities are valued at the last quoted bid price. The U.S. dollar value of forward foreign currency contracts is determined using forward currency exchange rates supplied by a quotation service. Futures contracts are valued at the settlement price established each day by the board of trade or exchange on which they are traded. Investments in open-end mutual funds, including the Fidelity Central Funds, are valued at their closing net asset value each business day. Short-term securities with remaining maturities of sixty days or less for which quotations are not readily available are valued at amortized cost, which approximates value.
When current market prices or quotations are not readily available or reliable, valuations may be determined in good faith in accordance with procedures adopted by the Board of Trustees. Factors used in determining value may include significant market or security specific events, changes in interest rates and credit quality, and developments in foreign markets which are monitored by evaluating the performance of ADRs, futures contracts and exchange-traded funds. The frequency with which these procedures are used cannot be predicted and may be utilized to a significant extent. The value of securities used for net asset value (NAV) calculation under these procedures may differ from published prices for the same securities.
Foreign Currency. The Fund uses foreign currency contracts to facilitate transactions in foreign-denominated securities. Losses from these transactions may arise from changes in the value of the foreign currency or if the counterparties do not perform under the contracts' terms.
Foreign-denominated assets, including investment securities, and liabilities are translated into U.S. dollars at the exchange rate at period end. Purchases and sales of investment securities, income and dividends received and expenses denominated in foreign currencies are translated into U.S. dollars at the exchange rate in effect on the transaction date.
The effects of exchange rate fluctuations on investments are included with the net realized and unrealized gain (loss) on investment securities. Other foreign currency transactions resulting in realized and unrealized gain (loss) are disclosed separately.
Annual Report
Notes to Financial Statements - continued
3. Significant Accounting Policies - continued
Investment Transactions and Income. For financial reporting purposes, the Fund's investment holdings and NAV include trades executed through the end of the last business day of the period. The NAV per share for processing shareholder transactions is calculated as of the close of business of the New York Stock Exchange (NYSE), normally 4:00 p.m. Eastern time and includes trades executed through the end of the prior business day. Gains and losses on securities sold are determined on the basis of identified cost and may include proceeds received from litigation. Dividend income is recorded on the ex-dividend date, except for certain dividends from foreign securities where the ex-dividend date may have passed, which are recorded as soon as the Fund is informed of the ex-dividend date. Non-cash dividends included in dividend income, if any, are recorded at the fair market value of the securities received. Distributions received on securities that represent a return of capital or capital gain are recorded as a reduction of cost of investments and/or as a realized gain. The Fund estimates the components of distributions received that may be considered return of capital distributions or capital gain distributions. Interest income and distributions from the Fidelity Central Funds are accrued as earned. Interest income includes coupon interest and amortization of premium and accretion of discount on debt securities. Investment income is recorded net of foreign taxes withheld where recovery of such taxes is uncertain.
Expenses. Most expenses of the trust can be directly attributed to a fund. Expenses which cannot be directly attributed are apportioned among each Fund in the trust. Expense estimates are accrued in the period to which they relate and adjustments are made when actual amounts are known.
Deferred Trustee Compensation. Under a Deferred Compensation Plan (the Plan), independent Trustees must defer receipt of a portion of, and may elect to defer receipt of an additional portion of, their annual compensation. Deferred amounts are invested in a cross-section of Fidelity funds, are marked-to-market and remain in the Fund until distributed in accordance with the Plan. The investment of deferred amounts and the offsetting payable to the Trustees are included in the accompanying Statement of Assets and Liabilities.
Income Tax Information and Distributions to Shareholders. Each year, the Fund intends to qualify as a regulated investment company by distributing substantially all of its taxable income and realized gains under Subchapter M of the Internal Revenue Code and filing its U.S. federal tax return. As a result, no provision for income taxes is required. The Fund is subject to the provisions of FASB Interpretation No. 48, Accounting for Uncertainties in Income Taxes (FIN 48). FIN 48 sets forth a minimum threshold for financial statement recognition of the benefit of a tax position taken or expected to be taken in a tax return. The implementation of FIN 48 did not result in any unrecognized tax benefits in the accompanying financial statements. Each of the Fund's federal tax returns for the prior three fiscal years remains subject to examination by the Internal Revenue Service (IRS). Foreign taxes are provided for based on the Fund's understanding of the tax rules and rates that exist in the foreign markets in which it invests.
Distributions are recorded on the ex-dividend date. Income dividends and capital gain distributions are declared separately for each class. Income and capital gain distributions are determined in accordance with income tax regulations, which may differ from generally accepted accounting principles. In addition, the Fund will claim a portion of the payment made to redeeming shareholders as a distribution for income tax purposes.
Capital accounts within the financial statements are adjusted for permanent book-tax differences. These adjustments have no impact on net assets or the results of operations. Temporary book-tax differences will reverse in a subsequent period.
Book-tax differences are primarily due to futures and options transactions, foreign currency transactions, certain foreign taxes, passive foreign investment companies (PFIC), market discount, partnerships, deferred trustees compensation, capital loss carryforwards and losses deferred due to wash sales.
The tax-basis components of distributable earnings and the federal tax cost as of period end were as follows:
Unrealized appreciation | $ 3,488,560,069 |
Unrealized depreciation | (10,924,916,294) |
Net unrealized appreciation (depreciation) | (7,436,356,225) |
Undistributed ordinary income | 360,875,659 |
Capital loss carryforward | (956,782,987) |
| |
Cost for federal income tax purposes | $ 36,646,719,383 |
The tax character of distributions paid was as follows:
| October 31,
2008 | October 31,
2007 |
Ordinary Income | $ 623,834,183 | $ 449,483,504 |
Long-term Capital Gains | 3,411,186,315 | 2,945,308,286 |
Total | $ 4,035,020,498 | $ 3,394,791,790 |
Short-Term Trading (Redemption) Fees. Shares held in the Fund less than 30 days are subject to a redemption fee equal to 1.00% of the proceeds of the redeemed shares. All redemption fees, including any estimated redemption fees paid by FMR, are retained by the Fund and accounted for as an addition to paid in capital.
Annual Report
3. Significant Accounting Policies - continued
New Accounting Pronouncements. In September 2006, Statement of Financial Accounting Standards No. 157, Fair Value Measurements (SFAS 157), was issued and is effective for fiscal years beginning after November 15, 2007. SFAS 157 defines fair value, establishes a framework for measuring fair value and results in expanded disclosures about fair value measurements.
In addition, in March 2008, Statement of Financial Accounting Standards No. 161, Disclosures about Derivative Instruments and Hedging Activities (SFAS 161), was issued and is effective for reporting periods beginning after November 15, 2008. SFAS 161 requires enhanced disclosures to provide information about the reasons the Fund invests in derivative instruments, the accounting treatment and the effect derivatives have on financial performance.
4. Operating Policies.
Forward Foreign Currency Contracts. The Fund generally uses foreign currency contracts to facilitate transactions in foreign-denominated securities and to manage the Fund's currency exposure. Contracts to sell generally are used to hedge the Fund's investments against currency fluctuations, while contracts to buy generally are used to offset a previous contract to sell. Also, a contract to buy can be used to acquire exposure to foreign currencies and a contract to sell can be used to offset a previous contract to buy. These contracts involve market risk in excess of the unrealized gain or loss reflected in the Fund's Statement of Assets and Liabilities. The U.S. dollar value of the currencies the Fund has committed to buy or sell is shown in the Schedule of Investments under the caption "Forward Foreign Currency Contracts." This amount represents the aggregate exposure to each currency the Fund has acquired or hedged through currency contracts at period end. Losses may arise from changes in the value of foreign currency or if the counterparties do not perform under the contracts' terms.
Purchases and sales of forward foreign currency contracts having the same settlement date and broker are offset and any realized gain (loss) recognized on the date of offset: otherwise, gain (loss) is recognized on settlement date. Contracts that have been offset with different counterparties are reflected as both a contract to buy and a contract to sell in the Schedule of Investments under the caption "Forward Foreign Currency Contracts."
Repurchase Agreements. FMR has received an Exemptive Order from the Securities and Exchange Commission (the SEC) which permits the Fund and other affiliated entities of FMR to transfer uninvested cash balances into joint trading accounts which are then invested in repurchase agreements. The Fund may also invest directly with institutions in repurchase agreements. Repurchase agreements are collateralized by government or non-government securities. Upon settlement date, collateral is held in segregated accounts with custodian banks and may be obtained in the event of a default of the counterparty. The Fund monitors, on a daily basis, the value of the collateral to ensure it is at least equal to the principal amount of the repurchase agreement (including accrued interest). In the event of a default by the counterparty, realization of the collateral proceeds could be delayed, during which time the value of the collateral may decline.
Futures Contracts. The Fund may use futures contracts to manage its exposure to the stock market. Buying futures tends to increase a fund's exposure to the underlying instrument, while selling futures tends to decrease a fund's exposure to the underlying instrument or hedge other fund investments. Upon entering into a futures contract, a fund is required to deposit with a clearing broker, no later than the following business day, an amount ("initial margin") equal to a certain percentage of the face value of the contract. The initial margin may be in the form of cash or securities and is transferred to a segregated account on settlement date. Subsequent payments ("variation margin") are made or received by a fund depending on the daily fluctuations in the value of the futures contract and are accounted for as unrealized gains or losses. Realized gains (losses) are recorded upon the expiration or closing of the futures contract. Losses may arise from changes in the value of the underlying instruments or if the counterparties do not perform under the contract's terms.
Restricted Securities. The Fund may invest in securities that are subject to legal or contractual restrictions on resale. These securities generally may be resold in transactions exempt from registration or to the public if the securities are registered. Disposal of these securities may involve time-consuming negotiations and expense, and prompt sale at an acceptable price may be difficult. Information regarding restricted securities is included at the end of the Fund's Schedule of Investments.
5. Purchases and Sales of Investments.
Purchases and sales of securities, other than short-term securities, aggregated $23,096,237,447 and $24,667,165,009, respectively.
Annual Report
Notes to Financial Statements - continued
6. Fees and Other Transactions with Affiliates.
Management Fee. FMR and its affiliates provide the Fund with investment management related services for which the Fund pays a monthly management fee. The management fee is the sum of an individual fund fee rate that is based on an annual rate of .45% of the Fund's average net assets and a group fee rate that averaged .26% during the period. The group fee rate is based upon the average net assets of all the mutual funds advised by FMR. The group fee rate decreases as assets under management increase and increases as assets under management decrease. In addition, the management fee is subject to a performance adjustment (up to a maximum of± .20% of the Fund's average net assets over a 36 month performance period). The upward or downward adjustment to the management fee is based on the relative investment performance of the retail class of the Fund, Fidelity Diversified International as compared to an appropriate benchmark index. For the period, the total annual management fee rate, including the performance adjustment, was .78% of the Fund's average net assets.
Transfer Agent Fees. Fidelity Investments Institutional Operations Company, Inc. (FIIOC), an affiliate of FMR, is the transfer, dividend disbursing and shareholder servicing agent for each class of the Fund. FIIOC receives account fees and asset-based fees that vary according to account size and type of account of the shareholders of Diversified International and asset-based fees of .05% of average net assets for Class K. FIIOC pays for typesetting, printing and mailing of shareholder reports, except proxy statements. Prior to January 1, 2008, Fidelity Service Company, Inc. (FSC), also an affiliate of FMR, was the transfer agent for Diversified International. For the period, the transfer agent fees for Diversified International were equivalent to the annualized rate of .22% of average net assets.
For the period, each class paid the following transfer agent fees:
| Amount |
Diversified International | $ 107,791,225 |
Class K | 47,731 |
| $ 107,838,956 |
Accounting and Security Lending Fees. FSC maintains the Fund's accounting records. The accounting fee is based on the level of average net assets for the month. Under a separate contract, FSC administers the security lending program. The security lending fee is based on the number and duration of lending transactions.
Brokerage Commissions. The Fund placed a portion of its portfolio transactions with brokerage firms which are affiliates of the investment adviser. The commissions paid to these affiliated firms were $38,904 for the period.
7. Committed Line of Credit.
The Fund participates with other funds managed by FMR in a $4.2 billion credit facility (the "line of credit") to be utilized for temporary or emergency purposes to fund shareholder redemptions or for other short-term liquidity purposes. The Fund has agreed to pay commitment fees on its pro rata portion of the line of credit, which amounted to $100,320 and is reflected in Miscellaneous Expense on the Statement of Operations. During the period, there were no borrowings on this line of credit.
8. Security Lending.
The Fund lends portfolio securities from time to time in order to earn additional income. On the settlement date of the loan, the Fund receives collateral (in the form of U.S. Treasury obligations, letters of credit and/or cash) against the loaned securities and maintains collateral in an amount not less than 100% of the market value of the loaned securities during the period of the loan. The market value of the loaned securities is determined at the close of business of the Fund and any additional required collateral is delivered to the Fund on the next business day. If the borrower defaults on its obligation to return the securities loaned because of insolvency or other reasons, a fund could experience delays and costs in recovering the securities loaned or in gaining access to the collateral. Any cash collateral received is invested in the Fidelity Securities Lending Cash Central Fund. The value of loaned securities and cash collateral at period end are disclosed on the Fund's Statement of Assets and Liabilities. Security lending income represents the income earned on investing cash collateral, less fees and expenses associated with the loan, plus any premium payments that may be received on the loan of certain types of securities. Security lending income is presented in the Statement of Operations as a component of income from Fidelity Central Funds. Net income from lending portfolio securities during the period amounted to $41,104,703.
9. Expense Reductions.
FMR voluntarily agreed to reimburse a portion of Diversified International operating expenses. During the period, this reimbursement reduced the class' expenses by $12,762.
Many of the brokers with whom FMR places trades on behalf of the Fund provided services to the Fund in addition to trade execution. These services included payments of certain expenses on behalf of the Fund totaling $6,147,236 for the period In addition, through arrangements with each class'
Annual Report
9. Expense Reductions - continued
transfer agent, credits realized as a result of uninvested cash balances were used to reduce the Fund's expenses. During the period, these credits reduced the Fund's custody expenses by $48,429. During the period, credits reduced each class' transfer agent expense as noted in the table below.
| Transfer Agent
expense reduction |
Diversified International | $ 1,954,766 |
Class K | 585 |
Total | $ 1,955,351 |
10. Other.
The Fund's organizational documents provide former and current trustees and officers with a limited indemnification against liabilities arising in connection with the performance of their duties to the Fund. In the normal course of business, the Fund may also enter into contracts that provide general indemnifications. The Fund's maximum exposure under these arrangements is unknown as this would be dependent on future claims that may be made against the Fund. The risk of material loss from such claims is considered remote.
In December 2006, the Independent Trustees, with the assistance of independent counsel, completed an investigation regarding gifts, gratuities and business entertainment provided by certain brokers to certain individuals who were employed on FMR's domestic equity trading desk during the period 2002 to 2004. The Independent Trustees and FMR agreed that, despite the absence of proof that the Fidelity mutual funds experienced diminished execution quality as a result of the improper receipt of gifts and business entertainment, the conduct at issue was serious and was worthy of redress. Accordingly, the Independent Trustees requested, and FMR agreed to make, a payment of $42 million plus accrued interest, which equaled approximately $7.3 million, to certain Fidelity mutual funds.
In March 2008, the Trustees approved a method for allocating this payment among the funds and, in total, FMR paid the fund $46,909, which is recorded in the accompanying Statement of Operations.
In a related administrative order dated March 5, 2008, the U.S. Securities and Exchange Commission ("SEC") announced a settlement with FMR and FMR Co., Inc. (an affiliate of FMR) involving the SEC's regulatory rules for investment advisers and the improper receipt of gifts, gratuities and business entertainment. Without admitting or denying the SEC's findings, FMR agreed to pay an $8 million civil penalty to the United States Treasury.
During the period, Lehman Brothers Holdings, Inc. and certain of its affiliates (LBHI) sought protection under the insolvency laws of their jurisdictions of organization, including the United States, the United Kingdom and Japan. At the time LBHI's insolvency proceedings were instituted, the Fund had outstanding securities trades with counterparties affiliated with LBHI. As a result of the insolvency proceedings, LBHI is unable to fulfill its commitments and, in certain cases, the Fund may have terminated its trades and related agreements with the relevant entities and, where appropriate, is in the process of initiating claims for damages. FMR believes that the financial impact to the Fund relating to the terminated trades and agreements is immaterial.
11. Distributions to Shareholders.
Distributions to shareholders of each class were as follows:
Years ended October 31, | 2008 | 2007 |
From net investment income | | |
Diversified International | $ 623,834,183 | $ 425,826,410 |
From net realized gain | | |
Diversified International | $ 3,411,186,315 | $ 2,968,965,380 |
Annual Report
Notes to Financial Statements - continued
12. Share Transactions.
Transactions for each class of shares were as follows:
| Shares | Dollars |
Years ended October 31, | 2008 A | 2007 | 2008 A | 2007 |
Diversified International | | | | |
Shares sold | 306,179,666 | 326,379,078 | $ 10,595,590,795 | $ 12,905,719,605 |
Conversion to Class K | (43,282,557) | - | (933,288,874) | - |
Reinvestment of distributions | 95,512,855 | 90,046,217 | 3,896,924,337 | 3,274,080,069 |
Shares redeemed | (390,314,331) | (266,671,784) | (13,365,445,996) | (10,504,509,010) |
Net increase (decrease) | (31,904,367) | 149,753,511 | $ 193,780,262 | $ 5,675,290,664 |
Class K | | | | |
Shares sold | 1,216,070 | - | $ 245,180,524 | $ - |
Conversion from Diversified International | 43,251,317 | - | 933,288,874 | - |
Shares redeemed | (2,048,185) | - | (50,686,523) | - |
Net increase (decrease) | 42,419,202 | - | $ 1,127,782,875 | $ - |
A Share transactions for Class K are for the period May 9, 2008 (commencement of sale of shares) to October 31, 2008.
Annual Report
Overseas
Shareholder Expense Example
As a shareholder of the Fund, you incur two types of costs: (1) transaction costs, including redemption fees, and (2) ongoing costs, including management fees and other Fund expenses. This Example is intended to help you understand your ongoing costs (in dollars) of investing in the Fund and to compare these costs with the ongoing costs of investing in other mutual funds.
The actual expense Example is based on an investment on $1,000 invested at the beginning of the period and held for the entire period (May 1, 2008 to October 31, 2008) for Overseas and for the entire period (May 9, 2008 to October 31, 2008) for Class K. The hypothetical expense Example is based on an investment of $1,000 invested for the one-half year period (May 1, 2008 to October 31, 2008).
Actual Expenses
The first line of the accompanying table for each class of the Fund provides information about actual account values and actual expenses. You may use the information in this line, together with the amount you invested, to estimate the expenses that you paid over the period. Simply divide your account value by $1,000.00 (for example, an $8,600 account value divided by $1,000.00 = 8.6), then multiply the result by the number in the first line for a class of the Fund under the heading entitled "Expenses Paid During Period" to estimate the expenses you paid on your account during this period. A small balance maintenance fee of $12.00 that is charged once a year may apply for certain accounts with a value of less than $2,000. This fee is not included in the table below. If it was, the estimate of expenses you paid during the period would be higher, and your ending account value lower, by this amount. In addition, the Fund, as a shareholder in the underlying Fidelity Central Funds, will indirectly bear its pro rata share of the fees and expenses incurred by the underlying Fidelity Central Funds. These fees and expenses are not included in the Fund's annualized expense ratio used to calculate the expense estimate in the table below.
Hypothetical Example for Comparison Purposes
The second line of the accompanying table for each class of the Fund provides information about hypothetical account values and hypothetical expenses based on a Class' actual expense ratio and an assumed rate of return of 5% per year before expenses, which is not the Class' actual return. The hypothetical account values and expenses may not be used to estimate the actual ending account balance or expenses you paid for the period. You may use this information to compare the ongoing costs of investing in the Fund and other funds. To do so, compare this 5% hypothetical example with the 5% hypothetical examples that appear in the shareholder reports of the other funds. A small balance maintenance fee of $12.00 that is charged once a year may apply for certain accounts with a value of less than $2,000. This fee is not included in the table below. If it was, the estimate of expenses you paid during the period would be higher, and your ending account value lower, by this amount. In addition, the Fund, as a shareholder in the underlying Fidelity Central Funds, will indirectly bear its pro rata share of the fees and expenses incurred by the underlying Fidelity Central Funds. These fees and expenses are not included in the Fund's annualized expense ratio used to calculate the expense estimate in the table below.
Please note that the expenses shown in the table are meant to highlight your ongoing costs only and do not reflect any transaction costs. Therefore, the second line of the table is useful in comparing ongoing costs only, and will not help you determine the relative total costs of owning different funds. In addition, if these transactional costs were included, your costs would have been higher.
| Annualized
Expense Ratio | Beginning
Account Value | Ending
Account Value
October 31, 2008 | Expenses Paid
During Period |
Overseas | 1.10% | | | |
Actual | | $ 1,000.00 | $ 564.40 | $ 4.33 B |
HypotheticalA | | $ 1,000.00 | $ 1,019.61 | $ 5.58 C |
Class K | .96% | | | |
Actual | | $ 1,000.00 | $ 565.60 | $ 3.61 B |
Hypothetical A | | $ 1,000.00 | $ 1,020.31 | $ 4.88 C |
A 5% return per year before expenses
B Actual expenses are equal to each Class' annualized expense ratio, multiplied by the average account value over the period, multiplied by 184/366 (to reflect the one-half year period) for Overseas and multiplied by 176/366 (to reflect the period May 9, 2008 to October 31, 2008) for Class K.
C Hypothetical expenses are equal to each Class' annualized expense ratio, multiplied by the average account value over the period, multiplied by 184/366 (to reflect the one-half year period).
Annual Report
Overseas
Performance: The Bottom Line
Average annual total return reflects the change in the value of an investment, assuming reinvestment of the class' dividend income and capital gains (the profits earned upon the sale of securities that have grown in value, if any) and assuming a constant rate of performance each year. The $10,000 table and the fund's returns do not reflect the deduction of taxes that a shareholder would pay on fund distributions or the redemption of fund shares. During periods of reimbursement by Fidelity, a fund's total return will be greater than it would be had the reimbursement not occurred. How a fund did yesterday is no guarantee of how it will do tomorrow.
Average Annual Total Returns
Periods ended October 31, 2008 | Past 1
year | Past 5
years | Past 10
years |
Overseas | -50.88% | 2.59% | 2.03% |
$10,000 Over 10 Years
Let's say hypothetically that $10,000 was invested in Overseas, a class of the fund, on October 31, 1998. The chart shows how the value of your investment would have changed, and also shows how the MSCI EAFE Index performed over the same period.

Annual Report
Overseas
Management's Discussion of Fund Performance
Comments from Ian Hart, Portfolio Manager of Fidelity® Overseas Fund
In a dramatic reversal of what had been a multiyear global growth story, international stocks fell long and hard during the 12 months ending October 31, 2008, especially so during the latter stages of the period and mostly as a result of fallout from the financial crisis that emanated from the United States. The viral spread of this financial contagion - which began in the U.S. subprime mortgage market, then seized up the credit markets, hobbled major financial institutions and eventually slowed economic growth worldwide - left virtually no corner of the globe untouched. Developed international equity markets - as gauged by the MSCI® Europe, Australasia, Far East (EAFE®) Index, which monitors established markets outside the U.S. and Canada - fell 46.54%, while the Standard & Poor's 500SM Index, a measure of U.S. stocks, dropped 36.10%. Among countries constituting at least 1% of the EAFE index, Switzerland had the "least worst" showing, falling roughly 32%, followed by Japan, where stocks slid by around 37%. Meanwhile, the weakest overall performance came from Belgium, where stocks slipped by nearly 70%. In the United Kingdom, the largest component of the index, equities were down almost 48%. Emerging markets were the weakest performers among the global economies, declining 56.22% as measured by the MSCI Emerging Markets Index.
The fund's Retail Class shares fell 50.88% for the year, trailing the MSCI EAFE index, mostly due to unfavorable security selection. A large amount of this underperformance came from some of the fund's biggest positions, especially in the energy and utilities sectors, which were among the hardest-hit by the abrupt slowdown in global growth. Aker Solutions, a Norwegian engineering and construction services company with heavy exposure to deep-water energy production, was the biggest detractor, its order book getting thinner as oil prices retreated. Similarly, Hochtief, a German construction company, and Veolia Environnement, a French water and waste management utility, also fell hard as new orders slowed. Suzlon Energy, an out-of-index India-based maker of wind turbines, experienced a manufacturing quality-control problem, among other issues, which punished the stock and led me to sell the position. On the upside, the fund's best contributors were NTT DoCoMo, a Japanese mobile phone operator whose solid results also were helped by the appreciating yen; U.S.-based Baxter International, a multinational medical products company with interests in the growing blood plasma market; and Actelion, a Swiss drug maker. An average cash position of around 6% also gave us a nice lift.
The views expressed above reflect those of the portfolio manager(s) only through the end of the period as stated on the cover of this report and do not necessarily represent the views of Fidelity or any other person in the Fidelity organization. Any such views are subject to change at any time based upon market or other conditions and Fidelity disclaims any responsibility to update such views. These views may not be relied on as investment advice and, because investment decisions for a Fidelity fund are based on numerous factors, may not be relied on as an indication of trading intent on behalf of any Fidelity fund.
Annual Report
Overseas
Investment Changes (Unaudited)
Geographic Diversification (% of fund's net assets) |
As of October 31, 2008 |
| United Kingdom | 22.3% | |
| Japan | 16.0% | |
| France | 14.8% | |
| Germany | 10.2% | |
| Switzerland | 7.4% | |
| Hong Kong | 5.5% | |
| United States of America | 5.4% | |
| Italy | 4.3% | |
| Indonesia | 2.8% | |
| Other | 11.3% | |

Percentages are adjusted for the effect of futures contracts, if applicable. |
|
As of April 30, 2008 |
| France | 16.7% | |
| United States of America | 13.0% | |
| Japan | 10.9% | |
| United Kingdom | 10.3% | |
| Germany | 9.0% | |
| Italy | 6.7% | |
| Switzerland | 5.1% | |
| Hong Kong | 4.1% | |
| Brazil | 3.5% | |
| Other | 20.7% | |

Percentages are adjusted for the effect of futures contracts, if applicable. |
Asset Allocation |
| % of fund's
net assets | % of fund's net assets
6 months ago |
Stocks | 99.0 | 91.4 |
Short-Term Investments and Net Other Assets | 1.0 | 8.6 |
Top Ten Stocks as of October 31, 2008 |
| % of fund's
net assets | % of fund's net assets
6 months ago |
China Unicom Ltd. sponsored ADR (Hong Kong, Diversified Telecommunication Services) | 4.7 | 4.1 |
Unilever PLC (United Kingdom, Food Products) | 3.5 | 0.0 |
Pernod Ricard SA (France, Beverages) | 3.3 | 5.7 |
PT Indosat Tbk sponsored ADR (Indonesia, Diversified Telecommunication Services) | 2.8 | 2.3 |
Royal Dutch Shell PLC Class B ADR (United Kingdom, Oil, Gas & Consumable Fuels) | 2.2 | 0.0 |
Roche Holding AG (participation certificate) (Switzerland, Pharmaceuticals) | 2.0 | 0.9 |
Sodexho Alliance SA ADR (France, Hotels, Restaurants & Leisure) | 1.9 | 1.9 |
Vivo Participacoes SA sponsored ADR (Brazil, Wireless Telecommunication Services) | 1.8 | 2.4 |
NTT DoCoMo, Inc. (Japan, Wireless Telecommunication Services) | 1.6 | 1.2 |
GlaxoSmithKline PLC (United Kingdom, Pharmaceuticals) | 1.6 | 0.0 |
| 25.4 | |
Market Sectors as of October 31, 2008 |
| % of fund's
net assets | % of fund's net assets
6 months ago |
Financials | 19.2 | 23.2 |
Telecommunication Services | 13.5 | 12.1 |
Consumer Staples | 13.1 | 6.7 |
Health Care | 12.8 | 5.5 |
Consumer Discretionary | 10.5 | 6.3 |
Energy | 8.2 | 7.5 |
Materials | 5.8 | 7.0 |
Information Technology | 5.8 | 4.9 |
Industrials | 5.4 | 10.4 |
Utilities | 4.7 | 7.8 |
Annual Report
Overseas
Investments October 31, 2008
Showing Percentage of Net Assets
Common Stocks - 99.0% |
| Shares | | Value |
Australia - 1.2% |
AMP Ltd. | 5,900,427 | | $ 21,451,719 |
CSL Ltd. | 1,874,540 | | 45,564,430 |
TOTAL AUSTRALIA | | 67,016,149 |
Bermuda - 0.7% |
Willis Group Holdings Ltd. | 1,517,900 | | 39,829,696 |
Brazil - 1.8% |
Vivo Participacoes SA sponsored ADR (d) | 9,054,040 | | 99,051,198 |
Canada - 0.5% |
Harry Winston Diamond Corp. | 3,059,000 | | 29,808,633 |
China - 0.7% |
Global Bio-Chem Technology Group Co. Ltd. | 103,690,000 | | 14,451,053 |
Li Ning Co. Ltd. | 19,226,000 | | 23,792,971 |
TOTAL CHINA | | 38,244,024 |
Finland - 0.7% |
Nokia Corp. sponsored ADR | 2,429,600 | | 36,881,328 |
France - 14.8% |
Accor SA (d) | 913,100 | | 35,524,443 |
Alstom SA | 582,100 | | 28,851,014 |
AXA SA | 1,376,500 | | 26,296,713 |
BNP Paribas SA | 285,200 | | 20,591,810 |
Carrefour SA | 1,426,300 | | 60,253,971 |
Credit Agricole SA | 2,742,800 | | 39,680,113 |
GDF Suez | 1,321,000 | | 59,048,125 |
L'Oreal SA | 392,400 | | 29,714,113 |
Pernod Ricard SA | 2,824,084 | | 183,900,633 |
Pinault Printemps-Redoute SA | 420,000 | | 26,766,784 |
Sanofi-Aventis | 769,900 | | 48,778,637 |
Societe Generale Series A | 800,900 | | 43,653,059 |
Sodexo Alliance SA ADR | 2,159,000 | | 102,012,750 |
Total SA Series B | 1,083,100 | | 59,585,051 |
Unibail-Rodamco | 200,300 | | 30,041,937 |
Veolia Environnement | 825,937 | | 20,468,052 |
TOTAL FRANCE | | 815,167,205 |
Germany - 10.2% |
Adidas-Salomon AG | 1,562,900 | | 55,497,675 |
Allianz AG (Reg.) | 344,600 | | 25,788,756 |
BASF AG | 852,300 | | 28,659,652 |
Bayer AG | 973,500 | | 54,194,446 |
Daimler AG | 1,775,500 | | 61,254,750 |
Deutsche Bank AG | 346,600 | | 13,161,450 |
Deutsche Bank AG (NY Shares) | 233,800 | | 8,879,724 |
Deutsche Boerse AG | 568,883 | | 45,486,444 |
E.ON AG | 1,528,773 | | 58,485,949 |
Hochtief AG (d) | 172,994 | | 5,406,570 |
Linde AG | 615,800 | | 51,715,981 |
Muenchener Rueckversicherungs-Gesellschaft AG (Reg.) | 387,176 | | 51,387,938 |
|
| Shares | | Value |
RWE AG | 942,800 | | $ 78,788,883 |
SAP AG | 615,000 | | 21,897,789 |
TOTAL GERMANY | | 560,606,007 |
Hong Kong - 5.5% |
China Unicom Ltd. sponsored ADR (d) | 17,825,600 | | 256,866,894 |
Hutchison Whampoa Ltd. | 8,687,000 | | 46,388,580 |
TOTAL HONG KONG | | 303,255,474 |
India - 1.7% |
Allahabad Bank | 10,885,323 | | 10,799,305 |
Bank of Baroda | 6,190,852 | | 30,755,998 |
Gammon India Ltd. | 3,139,930 | | 4,904,991 |
Satyam Computer Services Ltd. sponsored ADR | 2,853,000 | | 44,877,690 |
TOTAL INDIA | | 91,337,984 |
Indonesia - 2.8% |
PT Indosat Tbk sponsored ADR (d) | 6,386,238 | | 155,121,721 |
Italy - 4.3% |
Banco Popolare Scarl | 2,395,200 | | 29,879,990 |
Enel SpA | 5,368,900 | | 35,919,306 |
ENI SpA | 3,616,300 | | 86,314,376 |
Impregilo SpA (a)(d) | 13,600,300 | | 35,875,750 |
Mediobanca SpA | 1,528,200 | | 17,447,116 |
UniCredit SpA | 12,950,400 | | 31,686,062 |
TOTAL ITALY | | 237,122,600 |
Japan - 16.0% |
Aeon Co. Ltd. | 792,900 | | 7,602,786 |
Asahi Glass Co. Ltd. | 1,758,000 | | 11,046,315 |
Bridgestone Corp. | 2,807,500 | | 49,081,003 |
Canon, Inc. sponsored ADR | 1,556,900 | | 53,354,963 |
Citizen Holdings Co. Ltd. | 5,351,200 | | 29,607,195 |
Daiichi Sankyo Co. Ltd. | 972,400 | | 19,937,971 |
East Japan Railway Co. | 5,336 | | 37,969,062 |
Fujifilm Holdings Corp. | 1,104,000 | | 25,413,193 |
Hitachi Ltd. | 6,430,000 | | 30,187,662 |
Honda Motor Co. Ltd. sponsored ADR (d) | 810,500 | | 20,076,085 |
Japan Tobacco, Inc. | 14,930 | | 52,964,092 |
Komatsu Ltd. | 711,200 | | 7,818,299 |
Mitsubishi Corp. | 1,168,800 | | 19,590,258 |
Mitsubishi UFJ Financial Group, Inc. | 13,442,100 | | 84,468,186 |
Nintendo Co. Ltd. | 83,800 | | 26,145,599 |
Nippon Yusen KK | 2,819,000 | | 13,631,089 |
Nomura Holdings, Inc. | 5,930,400 | | 56,183,746 |
NTT DoCoMo, Inc. | 57,113 | | 90,573,692 |
Ricoh Co. Ltd. | 2,680,000 | | 28,840,742 |
Seven & I Holdings Co. Ltd. | 1,274,200 | | 35,775,128 |
Sumitomo Mitsui Financial Group, Inc. | 16,164 | | 64,796,007 |
T&D Holdings, Inc. | 695,150 | | 26,554,297 |
Common Stocks - continued |
| Shares | | Value |
Japan - continued |
THK Co. Ltd. | 1,646,800 | | $ 22,550,571 |
Toyota Motor Corp. sponsored ADR | 874,000 | | 66,502,660 |
TOTAL JAPAN | | 880,670,601 |
Luxembourg - 0.5% |
ArcelorMittal SA (NY Shares)
Class A (d) | 1,015,000 | | 26,643,750 |
Netherlands - 0.1% |
Unilever NV (Certificaten Van Aandelen) | 221,300 | | 5,333,214 |
Netherlands Antilles - 0.4% |
Schlumberger Ltd. (NY Shares) | 432,500 | | 22,338,625 |
Norway - 0.3% |
Aker Solutions ASA | 3,239,950 | | 17,718,247 |
Portugal - 0.4% |
Galp Energia SGPS SA Class B | 2,433,100 | | 22,119,456 |
Spain - 1.7% |
Repsol YPF SA sponsored ADR (d) | 2,556,500 | | 48,880,280 |
Telefonica SA sponsored ADR | 778,400 | | 43,208,984 |
TOTAL SPAIN | | 92,089,264 |
Switzerland - 7.4% |
Actelion Ltd. (Reg.) (a) | 693,363 | | 36,620,979 |
EFG International | 673,735 | | 14,500,783 |
Nestle SA (Reg.) | 1,947,840 | | 75,729,314 |
Novartis AG sponsored ADR | 1,580,500 | | 80,589,695 |
Roche Holding AG (participation certificate) | 736,473 | | 112,602,220 |
Sonova Holding AG | 698,935 | | 29,034,883 |
UBS AG (For. Reg.) | 2,832,544 | | 48,050,196 |
Zurich Financial Services AG (Reg.) | 42,582 | | 8,637,074 |
TOTAL SWITZERLAND | | 405,765,144 |
Turkey - 0.6% |
Turkcell Iletisim Hizmet AS sponsored ADR | 2,678,300 | | 32,862,741 |
United Kingdom - 22.3% |
3i Group PLC | 3,985,900 | | 34,762,749 |
Anglo American PLC ADR | 2,950,200 | | 37,025,010 |
BAE Systems PLC | 8,241,700 | | 46,320,575 |
Barclays PLC Sponsored ADR (d) | 1,996,700 | | 21,504,459 |
BG Group PLC | 2,270,500 | | 33,381,197 |
BT Group PLC | 10,661,000 | | 20,030,039 |
Experian PLC | 4,923,800 | | 27,151,274 |
GlaxoSmithKline PLC | 4,576,800 | | 87,973,349 |
HBOS PLC | 2,103,841 | | 3,444,463 |
HSBC Holdings PLC sponsored ADR (d) | 1,037,100 | | 61,188,900 |
Kingfisher PLC | 12,348,400 | | 22,789,191 |
Land Securities Group PLC | 1,906,600 | | 33,839,383 |
Lloyds TSB Group PLC sponsored ADR (d) | 3,016,600 | | 38,129,824 |
Man Group PLC | 4,212,300 | | 24,316,634 |
|
| Shares | | Value |
Marks & Spencer Group PLC | 7,576,600 | | $ 26,856,971 |
Misys PLC | 11,932,200 | | 21,363,111 |
Pearson PLC | 2,180,700 | | 21,717,783 |
Prudential PLC | 2,669,000 | | 13,405,636 |
Rexam PLC | 4,242,700 | | 25,562,541 |
Rio Tinto PLC (Reg.) | 1,380,500 | | 64,478,162 |
Royal Bank of Scotland Group PLC | 7,681,297 | | 8,460,032 |
Royal Dutch Shell PLC Class B ADR | 2,154,300 | | 119,111,247 |
Shire PLC | 3,897,100 | | 51,246,650 |
Smith & Nephew PLC | 5,925,800 | | 54,251,922 |
Standard Chartered PLC (United Kingdom) | 1,896,800 | | 31,344,600 |
Unilever PLC | 8,647,200 | | 194,242,572 |
Vodafone Group PLC sponsored ADR | 2,245,900 | | 43,278,493 |
William Hill PLC | 6,391,800 | | 19,650,410 |
WPP Group PLC | 7,373,000 | | 44,098,024 |
TOTAL UNITED KINGDOM | | 1,230,925,201 |
United States of America - 4.4% |
Baxter International, Inc. | 794,800 | | 48,077,452 |
Estee Lauder Companies, Inc. Class A | 920,100 | | 33,160,404 |
Freeport-McMoRan Copper & Gold, Inc. Class B | 1,917,100 | | 55,787,610 |
Hess Corp. | 612,400 | | 36,872,604 |
Johnson & Johnson | 525,000 | | 32,203,500 |
The Coca-Cola Co. | 609,400 | | 26,850,164 |
Virgin Media, Inc. | 1,454,543 | | 8,378,168 |
TOTAL UNITED STATES OF AMERICA | | 241,329,902 |
TOTAL COMMON STOCKS (Cost $7,355,907,113) | 5,451,238,164 |
Money Market Funds - 6.9% |
| | | |
Fidelity Cash Central Fund, 1.81% (b) | 314,710,301 | | 314,710,301 |
Fidelity Securities Lending Cash Central Fund, 2.67% (b)(c) | 65,761,125 | | 65,761,125 |
TOTAL MONEY MARKET FUNDS (Cost $380,471,426) | 380,471,426 |
TOTAL INVESTMENT PORTFOLIO - 105.9% (Cost $7,736,378,539) | | 5,831,709,590 |
NET OTHER ASSETS - (5.9)% | | (322,531,422) |
NET ASSETS - 100% | 5,509,178,168 |
Legend |
(a) Non-income producing |
(b) Affiliated fund that is available only to investment companies and other accounts managed by Fidelity Investments. The rate quoted is the annualized seven-day yield of the fund at period end. A complete unaudited listing of the fund's holdings as of its most recent quarter end is available upon request. |
(c) Investment made with cash collateral received from securities on loan. |
(d) Security or a portion of the security is on loan at period end. |
Affiliated Central Funds |
Information regarding fiscal year to date income earned by the Fund from investments in Fidelity Central Funds is as follows: |
Fund | Income earned |
Fidelity Cash Central Fund | $ 13,797,316 |
Fidelity Securities Lending Cash Central Fund | 10,402,470 |
Total | $ 24,199,786 |
Other Affiliated Issuers |
An affiliated company is a company in which the fund has ownership of at least 5% of the voting securities. Fiscal year to date transactions with companies which are or were affiliates are as follows: |
Affiliates | Value,
beginning
of period | Purchases | Sales
Proceeds | Dividend
Income | Value,
end of
period |
Aker Solutions ASA | $ 509,546,689 | $ 14,659,742 | $ 238,544,438 | $ 4,093,592 | $ - |
Global Bio-Chem Technology Group Co. Ltd. | 42,632,796 | 14,345,947 | 12,428,483 | 556,974 | - |
Harry Winston Diamond Corp. | - | 15,228,392 | 10,609,736 | 507,037 | - |
Impregilo SpA | 135,232,253 | 46,487,532 | 46,151,761 | - | - |
Total | $ 687,411,738 | $ 90,721,613 | $ 307,734,418 | $ 5,157,603 | $ - |
Income Tax Information |
At October 31, 2008, the Fund had a capital loss carryforward of approximately $859,201,568 all of which will expire on October 31, 2016. |
See accompanying notes which are an integral part of the financial statements.
Annual Report
Overseas
Financial Statements
Statement of Assets and Liabilities
| October 31, 2008 |
| | |
Assets | | |
Investment in securities, at value (including securities loaned of $62,305,881) - See accompanying schedule: Unaffiliated issuers (cost $7,355,907,113) | $ 5,451,238,164 | |
Fidelity Central Funds (cost $380,471,426) | 380,471,426 | |
Total Investments (cost $7,736,378,539) | | $ 5,831,709,590 |
Receivable for investments sold | | 161,451,447 |
Receivable for fund shares sold | | 19,472,456 |
Dividends receivable | | 13,604,003 |
Distributions receivable from Fidelity Central Funds | | 800,371 |
Prepaid expenses | | 2,499 |
Other receivables | | 9,811,804 |
Total assets | | 6,036,852,170 |
| | |
Liabilities | | |
Payable to custodian bank | $ 15,624,667 | |
Payable for investments purchased | 437,886,164 | |
Payable for fund shares redeemed | 2,793,734 | |
Accrued management fee | 3,443,571 | |
Other affiliated payables | 1,632,523 | |
Other payables and accrued expenses | 532,218 | |
Collateral on securities loaned, at value | 65,761,125 | |
Total liabilities | | 527,674,002 |
| | |
Net Assets | | $ 5,509,178,168 |
Net Assets consist of: | | |
Paid in capital | | $ 8,217,883,477 |
Undistributed net investment income | | 101,205,874 |
Accumulated undistributed net realized gain (loss) on investments and foreign currency transactions | | (905,086,866) |
Net unrealized appreciation (depreciation) on investments and assets and liabilities in foreign currencies | | (1,904,824,317) |
Net Assets | | $ 5,509,178,168 |
| | |
Overseas:
Net Asset Value, offering price and redemption price per share ($5,464,901,080 ÷ 214,875,924 shares) | | $ 25.43 |
| | |
Class K:
Net Asset Value, offering price and redemption price per share ($44,277,088 ÷ 1,739,432 shares) | | $ 25.45 |
Statement of Operations
| Year ended October 31, 2008 |
| | |
Investment Income | | |
Dividends (including $5,157,603 earned from other affiliated issuers) | | $ 192,592,406 |
Interest | | 142,565 |
Income from Fidelity Central Funds (including $10,402,470 from security lending) | | 24,199,786 |
| | 216,934,757 |
Less foreign taxes withheld | | (19,577,193) |
Total income | | 197,357,564 |
| | |
Expenses | | |
Management fee
Basic fee | $ 57,800,495 | |
Performance adjustment | 10,393,355 | |
Transfer agent fees | 19,460,444 | |
Accounting and security lending fees | 1,755,747 | |
Custodian fees and expenses | 1,632,455 | |
Independent trustees' compensation | 36,451 | |
Depreciation in deferred trustee compensation account | (2,521) | |
Registration fees | 118,692 | |
Audit | 102,454 | |
Legal | 48,842 | |
Interest | 15,524 | |
Miscellaneous | 843,473 | |
Total expenses before reductions | 92,205,411 | |
Expense reductions | (2,978,136) | 89,227,275 |
Net investment income (loss) | | 108,130,289 |
Realized and Unrealized Gain (Loss) Net realized gain (loss) on: | | |
Investment securities: | | |
Unaffiliated issuers | (797,144,495) | |
Other affiliated issuers | (103,193,270) | |
Foreign currency transactions | (2,599,494) | |
Total net realized gain (loss) | | (902,937,259) |
Change in net unrealized appreciation (depreciation) on: Investment securities (net of decrease in deferred foreign taxes of $350,879) | (4,444,932,593) | |
Assets and liabilities in foreign currencies | (21,643) | |
Total change in net unrealized appreciation (depreciation) | | (4,444,954,236) |
Net gain (loss) | | (5,347,891,495) |
Net increase (decrease) in net assets resulting from operations | | $ (5,239,761,206) |
See accompanying notes which are an integral part of the financial statements.
Annual Report
Statement of Changes in Net Assets
| Year ended
October 31,
2008 | Year ended
October 31,
2007 |
Increase (Decrease) in Net Assets | | |
Operations | | |
Net investment income (loss) | $ 108,130,289 | $ 119,216,448 |
Net realized gain (loss) | (902,937,259) | 1,120,668,756 |
Change in net unrealized appreciation (depreciation) | (4,444,954,236) | 1,583,404,106 |
Net increase (decrease) in net assets resulting from operations | (5,239,761,206) | 2,823,289,310 |
Distributions to shareholders from net investment income | (93,919,303) | (85,344,347) |
Distributions to shareholders from net realized gain | (947,430,820) | (719,995,618) |
Total distributions | (1,041,350,123) | (805,339,965) |
Share transactions - net increase (decrease) | 2,246,479,755 | 307,878,697 |
Redemption fees | 456,294 | 238,697 |
Total increase (decrease) in net assets | (4,034,175,280) | 2,326,066,739 |
| | |
Net Assets | | |
Beginning of period | 9,543,353,448 | 7,217,286,709 |
End of period (including undistributed net investment income of $101,205,874 and undistributed net investment income of $106,479,330, respectively) | $ 5,509,178,168 | $ 9,543,353,448 |
Financial Highlights - Overseas
Years ended October 31, | 2008 | 2007 | 2006 | 2005 | 2004 |
Selected Per-Share Data | | | | | |
Net asset value, beginning of period | $ 58.39 | $ 47.08 | $ 37.65 | $ 32.21 | $ 29.19 |
Income from Investment Operations | | | | | |
Net investment income (loss) B | .55 | .70 | .63 | .39 | .17 E |
Net realized and unrealized gain (loss) | (27.19) | 15.80 | 9.37 | 5.35 | 3.15 |
Total from investment operations | (26.64) | 16.50 | 10.00 | 5.74 | 3.32 |
Distributions from net investment income | (.57) | (.55) | (.41) | (.19) | (.30) |
Distributions from net realized gain | (5.75) | (4.64) | (.16) | (.11) | - |
Total distributions | (6.32) | (5.19) | (.57) | (.30) | (.30) |
Redemption fees added to paid in capital B, G | - | - | - | - | - |
Net asset value, end of period | $ 25.43 | $ 58.39 | $ 47.08 | $ 37.65 | $ 32.21 |
Total Return A | (50.88)% | 38.79% | 26.83% | 17.90% | 11.45% |
Ratios to Average Net Assets C, F | | | | | |
Expenses before reductions | 1.13% | .95% | 1.00% | .93% | 1.05% |
Expenses net of fee waivers, if any | 1.13% | .95% | 1.00% | .93% | 1.05% |
Expenses net of all reductions | 1.10% | .91% | .90% | .86% | 1.01% |
Net investment income (loss) | 1.33% | 1.43% | 1.43% | 1.11% | .55% E |
Supplemental Data | | | | | |
Net assets, end of period (000 omitted) | $ 5,464,901 | $ 9,543,353 | $ 7,217,287 | $ 4,733,797 | $ 4,182,103 |
Portfolio turnover rate D | 113% | 87% | 132% | 87% | 79% |
A Total returns would have been lower had certain expenses not been reduced during the periods shown. B Calculated based on average shares outstanding during the period. C Fees and expenses of the underlying Fidelity Central Funds are not included in the Fund's expense ratio. The Fund indirectly bears its proportionate share of the expenses of any underlying Fidelity Central Funds. D Amount does not include the portfolio activity of any underlying Fidelity Central Funds. E Net investment income per share includes approximately $.01 per share received as a result of a reorganization of an issuer that was in bankruptcy. Excluding this non-recurring amount, the ratio of net investment income (loss) to average net assets would have been ..52%. F Expense ratios reflect operating expenses of the class. Expenses before reductions do not reflect amounts reimbursed by the investment adviser or reductions from brokerage service arrangements or other expense offset arrangements and do not represent the amount paid by the class during periods when reimbursements or reductions occur. Expenses net of fee waivers reflect expenses after reimbursement by the investment adviser but prior to reductions from brokerage service arrangements or other expense offset arrangements. Expenses net of all reductions represent the net expenses paid by the class. G Amount represents less than $.01 per share. |
See accompanying notes which are an integral part of the financial statements.
Annual Report
Financial Highlights - Class K
Year ended October 31, | 2008 G |
Selected Per-Share Data | |
Net asset value, beginning of period | $ 45.00 |
Income from Investment Operations | |
Net investment income (loss) D | .13 |
Net realized and unrealized gain (loss) | (19.68) |
Total from investment operations | (19.55) |
Redemption fees added to paid in capital D, I | - |
Net asset value, end of period | $ 25.45 |
Total Return B, C | (43.44)% |
Ratios to Average Net Assets E, H | |
Expenses before reductions | .96% A |
Expenses net of fee waivers, if any | .96% A |
Expenses net of all reductions | .93% A |
Net investment income (loss) | 1.08% A |
Supplemental Data | |
Net assets, end of period (000 omitted) | $ 44,277 |
Portfolio turnover rate F | 113% |
A Annualized B Total returns for periods of less than one year are not annualized. C Total returns would have been lower had certain expenses not been reduced during the periods shown. D Calculated based on average shares outstanding during the period. E Fees and expenses of the underlying Fidelity Central Funds are not included in the Fund's expense ratio. The Fund indirectly bears its proportionate share of the expenses of any underlying Fidelity Central Funds. F Amount does not include the portfolio activity of any underlying Fidelity Central Funds. G For the period May 9, 2008 (commencement of sale of shares) to October 31, 2008. H Expense ratios reflect operating expenses of the class. Expenses before reductions do not reflect amounts reimbursed by the investment adviser or reductions from brokerage service arrangements or other expense offset arrangements and do not represent the amount paid by the class during periods when reimbursements or reductions occur. Expense ratios before reductions for start-up periods may not be representative of long-term operating periods. Expenses net of fee waivers reflect expenses after reimbursement by the investment adviser but prior to reductions from brokerage service arrangements or other expense offset arrangements. Expenses net of all reductions represent the net expenses paid by the class. I Amount represents less than $.01 per share. |
See accompanying notes which are an integral part of the financial statements.
Annual Report
Notes to Financial Statements
For the period ended October 31, 2008
1. Organization.
Fidelity Overseas Fund (the Fund) is a fund of Fidelity Investment Trust (the trust) and is authorized to issue an unlimited number of shares. The trust is registered under the Investment Company Act of 1940, as amended (the 1940 Act), as an open-end management investment company organized as a Massachusetts business trust. The Fund offers Overseas and Class K shares, each of which has equal rights as to assets and voting privileges. Each class has exclusive voting rights with respect to matters that affect that class. The Fund commenced sale of Class K shares and the existing class was designated Overseas on May 9, 2008. Investment income, realized and unrealized capital gains and losses, the common expenses of the Fund, and certain fund-level expense reductions, if any, are allocated on a pro rata basis to each class based on the relative net assets of each class to the total net assets of the Fund. Each class differs with respect to transfer agent fees incurred. Certain expense reductions also differ by class. The Fund's investments in emerging markets can be subject to social, economic, regulatory, and political uncertainties and can be extremely volatile.
2. Investments in Fidelity Central Funds.
The Fund may invest in Fidelity Central Funds, which are open-end investment companies available only to other investment companies and accounts managed by Fidelity Management & Research Company (FMR) and its affiliates. The Fund's Schedule of Investments lists each of the Fidelity Central Funds held as of period end, if any, as an investment of the Fund, but does not include the underlying holdings of each Fidelity Central Fund. As an Investing Fund, the Fund indirectly bears its proportionate share of the expenses of the underlying Fidelity Central Funds.
The Money Market Central Funds seek preservation of capital and current income and are managed by Fidelity Investments Money Management, Inc. (FIMM), an affiliate of FMR.
A complete unaudited list of holdings for each Fidelity Central Fund is available upon request or at the SEC's web site at www.sec.gov. In addition, the financial statements of the Fidelity Central Funds, which are not covered by the Fund's Report of Independent Registered Public Accounting Firm, are available on the SEC's web site or upon request.
3. Significant Accounting Policies.
The financial statements have been prepared in conformity with accounting principles generally accepted in the United States of America, which require management to make certain estimates and assumptions at the date of the financial statements. Actual results could differ from those estimates. The following summarizes the significant accounting policies of the Fund:
Security Valuation. Investments are valued as of 4:00 p.m. Eastern time on the last calendar day of the period. Wherever possible, the Fund uses independent pricing services approved by the Board of Trustees to value its investments.
Equity securities, including restricted securities, for which market quotations are readily available, are valued at the last reported sale price or official closing price as reported by an independent pricing service on the primary market or exchange on which they are traded. In the event there were no sales during the day or closing prices are not available, securities are valued at the last quoted bid price. Investments in open-end mutual funds, including the Fidelity Central Funds, are valued at their closing net asset value each business day. Short-term securities with remaining maturities of sixty days or less for which quotations are not readily available are valued at amortized cost, which approximates value.
When current market prices or quotations are not readily available or reliable, valuations may be determined in good faith in accordance with procedures adopted by the Board of Trustees. Factors used in determining value may include significant market or security specific events, changes in interest rates and credit quality, and developments in foreign markets which are monitored by evaluating the performance of ADRs, futures contracts and exchange-traded funds. The frequency with which these procedures are used cannot be predicted and may be utilized to a significant extent. The value of securities used for net asset value (NAV) calculation under these procedures may differ from published prices for the same securities.
Foreign Currency. The Fund uses foreign currency contracts to facilitate transactions in foreign-denominated securities. Losses from these transactions may arise from changes in the value of the foreign currency or if the counterparties do not perform under the contracts' terms.
Foreign-denominated assets, including investment securities, and liabilities are translated into U.S. dollars at the exchange rate at period end. Purchases and sales of investment securities, income and dividends received and expenses denominated in foreign currencies are translated into U.S. dollars at the exchange rate in effect on the transaction date.
The effects of exchange rate fluctuations on investments are included with the net realized and unrealized gain (loss) on investment securities. Other foreign currency transactions resulting in realized and unrealized gain (loss) are disclosed separately.
Annual Report
3. Significant Accounting Policies - continued
Investment Transactions and Income. For financial reporting purposes, the Fund's investment holdings and NAV include trades executed through the end of the last business day of the period. The NAV per share for processing shareholder transactions is calculated as of the close of business of the New York Stock Exchange (NYSE), normally 4:00 p.m. Eastern time and includes trades executed through the end of the prior business day. Gains and losses on securities sold are determined on the basis of identified cost and may include proceeds received from litigation. Dividend income is recorded on the ex-dividend date, except for certain dividends from foreign securities where the ex-dividend date may have passed, which are recorded as soon as the Fund is informed of the ex-dividend date. Non-cash dividends included in dividend income, if any, are recorded at the fair market value of the securities received. Interest income and distributions from the Fidelity Central Funds are accrued as earned. Interest income includes coupon interest and amortization of premium and accretion of discount on debt securities. Investment income is recorded net of foreign taxes withheld where recovery of such taxes is uncertain.
Expenses. Most expenses of the trust can be directly attributed to a fund. Expenses which cannot be directly attributed are apportioned among each Fund in the trust. Expense estimates are accrued in the period to which they relate and adjustments are made when actual amounts are known.
Deferred Trustee Compensation. Under a Deferred Compensation Plan (the Plan), independent Trustees must defer receipt of a portion of, and may elect to defer receipt of an additional portion of, their annual compensation. Deferred amounts are invested in a cross-section of Fidelity funds, are marked-to-market and remain in the Fund until distributed in accordance with the Plan. The investment of deferred amounts and the offsetting payable to the Trustees are included in the accompanying Statement of Assets and Liabilities.
Income Tax Information and Distributions to Shareholders. Each year, the Fund intends to qualify as a regulated investment company by distributing substantially all of its taxable income and realized gains under Subchapter M of the Internal Revenue Code and filing its U.S. federal tax return. As a result, no provision for income taxes is required. The Fund is subject to the provisions of FASB Interpretation No. 48, Accounting for Uncertainties in Income Taxes (FIN 48). FIN 48 sets forth a minimum threshold for financial statement recognition of the benefit of a tax position taken or expected to be taken in a tax return. The implementation of FIN 48 did not result in any unrecognized tax benefits in the accompanying financial statements. Each of the Fund's federal tax returns for the prior three fiscal years remains subject to examination by the Internal Revenue Service (IRS). Foreign taxes are provided for based on the Fund's understanding of the tax rules and rates that exist in the foreign markets in which it invests.
Distributions are recorded on the ex-dividend date. Income dividends and capital gain distributions are declared separately for each class. Income and capital gain distributions are determined in accordance with income tax regulations, which may differ from generally accepted accounting principles. In addition, the Fund will claim a portion of the payment made to redeeming shareholders as a distribution for income tax purposes.
Capital accounts within the financial statements are adjusted for permanent book-tax differences. These adjustments have no impact on net assets or the results of operations. Temporary book-tax differences will reverse in a subsequent period.
Book-tax differences are primarily due to foreign currency transactions, passive foreign investment companies (PFIC), deferred trustees compensation and losses deferred due to wash sales.
The tax-basis components of distributable earnings and the federal tax cost as of period end were as follows:
Unrealized appreciation | $ 169,074,168 |
Unrealized depreciation | (2,119,783,780) |
Net unrealized appreciation (depreciation) | (1,950,709,612) |
Undistributed ordinary income | 60,427,430 |
Capital loss carryforward | (859,201,568) |
| |
Cost for federal income tax purposes | $ 7,782,419,202 |
The tax character of distributions paid was as follows:
| October 31, 2008 | October 31, 2007 |
Ordinary Income | $ 204,315,590 | $ 313,446,407 |
Long-term Capital Gains | 837,034,533 | 491,893,558 |
Total | $ 1,041,350,123 | $ 805,339,965 |
Short-Term Trading (Redemption) Fees. Shares held in the Fund less than 30 days are subject to a redemption fee equal to 1.00% of the proceeds of the redeemed shares. All redemption fees, including any estimated redemption fees paid by FMR, are retained by the Fund and accounted for as an addition to paid in capital.
Annual Report
Notes to Financial Statements - continued
3. Significant Accounting Policies - continued
New Accounting Pronouncement. In September 2006, Statement of Financial Accounting Standards No. 157, Fair Value Measurements (SFAS 157), was issued and is effective for fiscal years beginning after November 15, 2007. SFAS 157 defines fair value, establishes a framework for measuring fair value and results in expanded disclosures about fair value measurements.
4. Operating Policies.
Repurchase Agreements. FMR has received an Exemptive Order from the Securities and Exchange Commission (the SEC) which permits the Fund and other affiliated entities of FMR to transfer uninvested cash balances into joint trading accounts which are then invested in repurchase agreements. The Fund may also invest directly with institutions in repurchase agreements. Repurchase agreements are collateralized by government or non-government securities. Upon settlement date, collateral is held in segregated accounts with custodian banks and may be obtained in the event of a default of the counterparty. The Fund monitors, on a daily basis, the value of the collateral to ensure it is at least equal to the principal amount of the repurchase agreement (including accrued interest). In the event of a default by the counterparty, realization of the collateral proceeds could be delayed, during which time the value of the collateral may decline.
5. Purchases and Sales of Investments.
Purchases and sales of securities, other than short-term securities, aggregated $10,177,265,207 and $8,779,633,729, respectively.
6. Fees and Other Transactions with Affiliates.
Management Fee. FMR and its affiliates provide the Fund with investment management related services for which the Fund pays a monthly management fee. The management fee is the sum of an individual fund fee rate that is based on an annual rate of .45% of the Fund's average net assets and a group fee rate that averaged .26% during the period. The group fee rate is based upon the average net assets of all the mutual funds advised by FMR. The group fee rate decreases as assets under management increase and increases as assets under management decrease. In addition, the management fee is subject to a performance adjustment (up to a maximum of± .20% of the Fund's average net assets over a 36 month performance period). The upward or downward adjustment to the management fee is based on the relative investment performance of the retail class of the Fund, Fidelity Overseas as compared to an appropriate benchmark index. For the period, the total annual management fee rate, including the performance adjustment, was .84% of the Fund's average net assets.
Transfer Agent Fees. Fidelity Investments Institutional Operations Company, Inc. (FIIOC), an affiliate of FMR, is the transfer, dividend disbursing and shareholder servicing agent for each class of the Fund. FIIOC receives account fees and asset-based fees that vary according to account size and type of account of the shareholders of Overseas and asset-based fees of .05% of average net assets for Class K. FIIOC pays for typesetting, printing and mailing of shareholder reports, except proxy statements. Prior to January 1, 2008, Fidelity Service Company, Inc. (FSC), also an affiliate of FMR, was the transfer agent for Overseas. For the period, the transfer agent fees for Overseas were equivalent to an annualized rate of ..24% of average net assets.
For the period, each class paid the following transfer agent fees:
| Amount |
Overseas | $ 19,458,605 |
Class K | 1,839 |
| $ 19,460,444 |
Accounting and Security Lending Fees. FSC maintains the Fund's accounting records. The accounting fee is based on the level of average net assets for the month. Under a separate contract, FSC administers the security lending program. The security lending fee is based on the number and duration of lending transactions.
Brokerage Commissions. The Fund placed a portion of its portfolio transactions with brokerage firms which are affiliates of the investment adviser. The commissions paid to these affiliated firms were $19,859 for the period.
Interfund Lending Program. Pursuant to an Exemptive Order issued by the SEC, the Fund, along with other registered investment companies having management contracts with FMR, may participate in an interfund lending program. This program provides an alternative credit facility allowing the funds to borrow from, or lend money to, other participating affiliated funds. At period end, there were no interfund loans outstanding. The Fund's activity in this program during the period for which loans were outstanding was as follows:
Borrower or Lender | Average Daily Loan Balance | Weighted Average Interest Rate | Interest Expense |
Borrower | $ 56,930,500 | 4.75% | $ 15,023 |
Annual Report
7. Committed Line of Credit.
The Fund participates with other funds managed by FMR in a $4.2 billion credit facility (the "line of credit") to be utilized for temporary or emergency purposes to fund shareholder redemptions or for other short-term liquidity purposes. The Fund has agreed to pay commitment fees on its pro rata portion of the line of credit, which amounted to $16,603 and is reflected in Miscellaneous Expense on the Statement of Operations. During the period, there were no borrowings on this line of credit.
8. Security Lending.
The Fund lends portfolio securities from time to time in order to earn additional income. On the settlement date of the loan, the Fund receives collateral (in the form of U.S. Treasury obligations, letters of credit and/or cash) against the loaned securities and maintains collateral in an amount not less than 100% of the market value of the loaned securities during the period of the loan. The market value of the loaned securities is determined at the close of business of the Fund and any additional required collateral is delivered to the Fund on the next business day. If the borrower defaults on its obligation to return the securities loaned because of insolvency or other reasons, a fund could experience delays and costs in recovering the securities loaned or in gaining access to the collateral. Any cash collateral received is invested in the Fidelity Securities Lending Cash Central Fund. The value of loaned securities and cash collateral at period end are disclosed on the Fund's Statement of Assets and Liabilities. Security lending income represents the income earned on investing cash collateral, less fees and expenses associated with the loan, plus any premium payments that may be received on the loan of certain types of securities.
9. Bank Borrowings.
The Fund is permitted to have bank borrowings for temporary or emergency purposes to fund shareholder redemptions. The Fund has established borrowing arrangements with certain banks. The interest rate on the borrowings is the bank's base rate, as revised from time to time. The average daily loan balance during the period for which loans were outstanding amounted to $7,800,000. The weighted average interest rate was 2.31%. The interest expense amounted to $501 under the bank borrowing program. At period end, there were no bank borrowings outstanding.
10. Expense Reductions.
FMR voluntarily agreed to reimburse a portion of Overseas operating expenses. During the period, this reimbursement reduced the class' expenses by $12,763.
Many of the brokers with whom FMR places trades on behalf of the Fund provided services to the Fund in addition to trade execution. These services included payments of certain expenses on behalf of the Fund totaling $2,579,319 for the period. In addition, through arrangements with and each class' transfer agent, credits realized as a result of uninvested cash balances were used to reduce the Fund's expenses. During the period, these credits reduced the Fund's custody expenses by $15,936. During the period, credits reduced each class' transfer agent expense as noted in the table below.
| Transfer Agent
expense reduction |
Overseas | $ 370,118 |
11. Other.
The Fund's organizational documents provide former and current trustees and officers with a limited indemnification against liabilities arising in connection with the performance of their duties to the Fund. In the normal course of business, the Fund may also enter into contracts that provide general indemnifications. The Fund's maximum exposure under these arrangements is unknown as this would be dependent on future claims that may be made against the Fund. The risk of material loss from such claims is considered remote.
At the end of the period, Fidelity Freedom 2020 Fund was the owner of record of approximately 11% of the total outstanding shares of the Fund. The Fidelity Freedom Funds were the owners of record, in the aggregate of approximately 44% of the total outstanding shares of the Fund.
In December 2006, the Independent Trustees, with the assistance of independent counsel, completed an investigation regarding gifts, gratuities and business entertainment provided by certain brokers to certain individuals who were employed on FMR's domestic equity trading desk during the period 2002 to 2004. The Independent Trustees and FMR agreed that, despite the absence of proof that the Fidelity mutual funds experienced diminished execution quality as a result of the improper receipt of gifts and business entertainment, the conduct at issue was serious and was worthy of redress. Accordingly, the Independent Trustees requested, and FMR agreed to make, a payment of $42 million plus accrued interest, which equaled approximately $7.3 million, to certain Fidelity mutual funds.
In March 2008, the Trustees approved a method for allocating this payment among the funds and, in total, FMR paid the fund $55,778, which is recorded in the accompanying Statement of Operations.
Annual Report
Notes to Financial Statements - continued
11. Other - continued
In a related administrative order dated March 5, 2008, the U.S. Securities and Exchange Commission ("SEC") announced a settlement with FMR and FMR Co., Inc. (an affiliate of FMR) involving the SEC's regulatory rules for investment advisers and the improper receipt of gifts, gratuities and business entertainment. Without admitting or denying the SEC's findings, FMR agreed to pay an $8 million civil penalty to the United States Treasury.
During the period, Lehman Brothers Holdings, Inc. and certain of its affiliates (LBHI) sought protection under the insolvency laws of their jurisdictions of organization, including the United States, the United Kingdom and Japan. At the time LBHI's insolvency proceedings were instituted, the Fund had outstanding securities trades with counterparties affiliated with LBHI. As a result of the insolvency proceedings, LBHI is unable to fulfill its commitments and, in certain cases, the Fund may have terminated its trades and related agreements with the relevant entities and, where appropriate, is in the process of initiating claims for damages. FMR believes that the financial impact to the Fund relating to the terminated trades and agreements is immaterial.
12. Distributions to Shareholders.
Distributions to shareholders of each class were as follows:
Years ended October 31, | 2008 | 2007 |
From net investment income | | |
Overseas | $ 93,919,303 | $ 85,344,347 |
From net realized gain | | |
Overseas | $ 947,430,820 | $ 719,995,618 |
13. Share Transactions.
Transactions for each class of shares were as follows:
| Shares | Dollars |
Years ended October 31, | 2008A | 2007 | 2008A | 2007 |
Overseas | | | | |
Shares sold | 76,040,831 | 41,499,511 | $ 2,985,572,846 | $ 2,023,578,024 |
Conversion to Class K | (1,789,301) | - | (50,752,081) | - |
Reinvestment of distributions | 20,825,405 | 18,292,055 | 1,030,024,482 | 797,167,795 |
Shares redeemed | (43,642,881) | (49,648,078) | (1,767,850,377) | (2,512,867,122) |
Net increase (decrease) | 51,434,054 | 10,143,488 | $ 2,196,994,870 | $ 307,878,697 |
Class K | | | | |
Shares sold | 23,823 | - | $ 671,729 | $ - |
Conversion from Overseas | 1,787,998 | - | 50,752,081 | - |
Shares redeemed | (72,389) | - | (1,938,925) | - |
Net increase (decrease) | 1,739,432 | - | $ 49,484,885 | $ - |
A Share transactions for Class K are for the period May 9, 2008 (commencement of sale of shares) to October 31, 2008.
Annual Report
As a shareholder of a Fund, you incur two types of costs: (1) transaction costs, including redemption fees, and (2) ongoing costs, including management fees and other Fund expenses. This Example is intended to help you understand your ongoing costs (in dollars) of investing in the Funds and to compare these costs with the ongoing costs of investing in other mutual funds.
The Example is based on an investment of $1,000 invested at the beginning of the period and held for the entire period (May 1, 2008 to October 31, 2008).
Actual Expenses
The first line of the accompanying table for each fund provides information about actual account values and actual expenses. You may use the information in this line, together with the amount you invested, to estimate the expenses that you paid over the period. Simply divide your account value by $1,000.00 (for example, an $8,600 account value divided by $1,000.00 = 8.6), then multiply the result by the number in the first line for a fund under the heading entitled "Expenses Paid During Period" to estimate the expenses you paid on your account during this period. A small balance maintenance fee of $12.00 that is charged once a year may apply for certain accounts with a value of less than $2,000. This fee is not included in the table below. If it was, the estimate of expenses you paid during the period would be higher, and your ending account value lower, by this amount. In addition, each Fund, as a shareholder in the underlying Fidelity Central Funds, will indirectly bear its pro rata share of the fees and expenses incurred by the underlying Fidelity Central Funds. These fees and expenses are not included in the Fund's annualized expense ratio used to calculate the expense estimate in the table below.
Hypothetical Example for Comparison Purposes
The second line of the accompanying table for each fund provides information about hypothetical account values and hypothetical expenses based on a fund's actual expense ratio and an assumed rate of return of 5% per year before expenses, which is not the Fund's actual return. The hypothetical account values and expenses may not be used to estimate the actual ending account balance or expenses you paid for the period. You may use this information to compare the ongoing costs of investing in the Fund and other funds. To do so, compare this 5% hypothetical example with the 5% hypothetical examples that appear in the shareholder reports of the other funds. A small balance maintenance fee of $12.00 that is charged once a year may apply for certain accounts with a value of less than $2,000. This fee is not included in the table below. If it was, the estimate of expenses you paid during the period would be higher, and your ending account value lower, by this amount. In addition, each Fund, as a shareholder in the underlying Fidelity Central Funds, will indirectly bear its pro rata share of the fees and expenses incurred by the underlying Fidelity Central Funds. These fees and expenses are not included in the Fund's annualized expense ratio used to calculate the expense estimate in the table below.
Please note that the expenses shown in the table are meant to highlight your ongoing costs only and do not reflect any transaction costs. Therefore, the second line of the table is useful in comparing ongoing costs only, and will not help you determine the relative total costs of owning different funds. In addition, if these transactional costs were included, your costs would have been higher.
| Annualized
Expense Ratio | Beginning
Account Value
May 1, 2008 | Ending
Account Value
October 31, 2008 | Expenses Paid
During Period*
May 1, 2008 to
October 31, 2008 |
Aggressive International | .83% | | | |
Actual | | $ 1,000.00 | $ 518.90 | $ 3.17 |
HypotheticalA | | $ 1,000.00 | $ 1,020.96 | $ 4.22 |
Worldwide | 1.23% | | | |
Actual | | $ 1,000.00 | $ 658.80 | $ 5.13 |
HypotheticalA | | $ 1,000.00 | $ 1,018.95 | $ 6.24 |
A 5% return per year before expenses
* Expenses are equal to each Fund's annualized expense ratio, multiplied by the average account value over the period, multiplied by 184/366(to reflect the one-half year period).
Annual Report
Aggressive International
Performance: The Bottom Line
Average annual total return reflects the change in the value of an investment, assuming reinvestment of the fund's dividend income and capital gains (the profits earned upon the sale of securities that have grown in value, if any) and assuming a constant rate of performance each year. The $10,000 table and the fund's returns do not reflect the deduction of taxes that a shareholder would pay on fund distributions or the redemption of fund shares. During periods of reimbursement by Fidelity, a fund's total return will be greater than it would be had the reimbursement not occurred. How a fund did yesterday is no guarantee of how it will do tomorrow.
Average Annual Total Returns
Periods ended October 31, 2008 | Past 1
year | Past 5
years | Past 10 years |
Fidelity Aggressive International Fund A | -55.30% | -4.42% | 0.39% |
A Prior to February 11, 2000, Aggressive International operated under certain different investment policies. The fund's historical performance may not represent its current investment policies.
$10,000 Over 10 Years
Let's say hypothetically that $10,000 was invested in Fidelity Aggressive International Fund on October 31, 1998. The chart shows how the value of your investment would have changed, and also shows how the MSCI ACWISM (All Country World Index) ex USA Index performed over the same period.
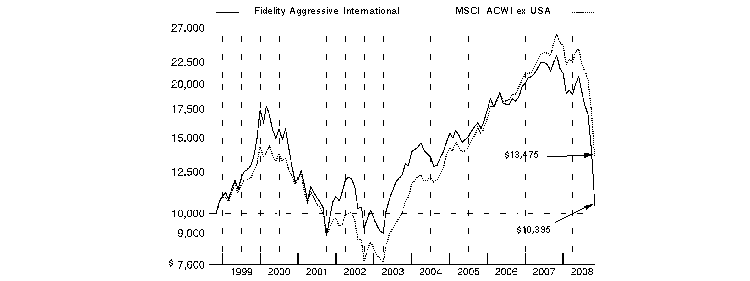
Annual Report
Aggressive International
Management's Discussion of Fund Performance
Comments from Sammy Simnegar, Portfolio Manager of Fidelity® Aggressive International Fund
In a dramatic reversal of what had been a multiyear global growth story, international stocks fell long and hard during the 12 months ending October 31, 2008, especially so during the latter stages of the period and mostly as a result of fallout from the financial crisis that emanated from the United States. The viral spread of this financial contagion - which began in the U.S. subprime mortgage market, then seized up the credit markets, hobbled major financial institutions and eventually slowed economic growth worldwide - left virtually no corner of the globe untouched. Developed international equity markets - as gauged by the MSCI® Europe, Australasia, Far East (EAFE®) Index, which monitors established markets outside the U.S. and Canada - fell 46.54%, while the Standard & Poor's 500SM Index, a measure of U.S. stocks, dropped 36.10%. Among countries constituting at least 1% of the EAFE index, Switzerland had the "least worst" showing, falling roughly 32%, followed by Japan, where stocks slid by around 37%. Meanwhile, the weakest overall performance came from Belgium, where stocks slipped by nearly 70%. In the United Kingdom, the largest component of the index, equities were down almost 48%. Emerging markets were the weakest performers among the global economies, declining 56.22% as measured by the MSCI Emerging Markets Index.
Aggressive International was down 55.30% for the 12-month period, compared with a 48.46% drop for the MSCI All Country World ex USA Index. Ineffective stock picks accounted for all of this underperformance and easily offset the small gain achieved versus the index through our overweightings in the traditionally defensive health care and consumer staples sectors, as well as an underweighting in the weak financials group and maintaining an average cash position of around 3%. Several of the fund's worst performers were in the hard-hit materials sector, including out-of-index positions in Mercator Minerals, a Canadian mining company, and U.S.-listed paper/pulp producer AbitibiBowater, the latter of which was sold by period end. Several of our holdings in energy, consumer discretionary, financials and information technology also took significant body blows, among them Babcock & Brown, an Australian asset management company that is no longer held in the portfolio, and Gazprom, the giant Russian natural gas producer. On the plus side, our best results came from Tokyo-based Shinsei Bank, which was sold from the portfolio at a nice profit; Swiss consumer staples giant Nestle; and out-of-index tobacco retailer Philip Morris International.
The views expressed above reflect those of the portfolio manager(s) only through the end of the period as stated on the cover of this report and do not necessarily represent the views of Fidelity or any other person in the Fidelity organization. Any such views are subject to change at any time based upon market or other conditions and Fidelity disclaims any responsibility to update such views. These views may not be relied on as investment advice and, because investment decisions for a Fidelity fund are based on numerous factors, may not be relied on as an indication of trading intent on behalf of any Fidelity fund.
Annual Report
Aggressive International
Investment Changes (Unaudited)
Geographic Diversification (% of fund's net assets) |
As of October 31, 2008 |
| United Kingdom | 15.4% | |
| United States of America | 10.8% | |
| Japan | 10.6% | |
| Germany | 7.8% | |
| Canada | 7.7% | |
| Switzerland | 7.3% | |
| France | 7.1% | |
| Russia | 4.9% | |
| Spain | 3.2% | |
| Other | 25.2% | |

Percentages are adjusted for the effect of futures contracts, if applicable. |
As of April 30, 2008 |
| United Kingdom | 14.0% | |
| Japan | 12.0% | |
| Germany | 8.7% | |
| Canada | 7.9% | |
| France | 6.7% | |
| Australia | 5.6% | |
| United States of America | 5.5% | |
| Switzerland | 3.8% | |
| Italy | 3.5% | |
| Other | 32.3% | |

Percentages are adjusted for the effect of futures contracts, if applicable. |
Asset Allocation |
| % of fund's
net assets | % of fund's net assets
6 months ago |
Stocks | 96.0 | 95.0 |
Bonds | 1.1 | 0.0 |
Short-Term Investments and Net Other Assets | 2.9 | 5.0 |
Top Ten Stocks as of October 31, 2008 |
| % of fund's
net assets | % of fund's net assets
6 months ago |
OAO Gazprom sponsored ADR (Russia, Oil, Gas & Consumable Fuels) | 3.0 | 1.9 |
Nestle SA (Reg.) (Switzerland, Food Products) | 3.0 | 1.9 |
HSBC Holdings PLC sponsored ADR (United Kingdom, Commercial Banks) | 2.4 | 0.0 |
Telefonica SA (Spain, Diversified Telecommunication Services) | 2.2 | 1.5 |
BHP Billiton PLC (United Kingdom, Metals & Mining) | 2.1 | 0.0 |
E.ON AG (Germany, Electric Utilities) | 2.0 | 1.5 |
RWE AG (Germany, Multi-Utilities) | 1.9 | 0.0 |
GDF Suez (France, Multi-Utilities) | 1.9 | 0.0 |
East Japan Railway Co. (Japan, Road & Rail) | 1.7 | 1.0 |
Imperial Tobacco Group PLC (United Kingdom, Tobacco) | 1.7 | 0.0 |
| 21.9 | |
Market Sectors as of October 31, 2008 |
| % of fund's
net assets | % of fund's net assets
6 months ago |
Financials | 24.3 | 22.6 |
Industrials | 13.0 | 12.5 |
Energy | 11.9 | 9.7 |
Materials | 11.1 | 10.2 |
Consumer Staples | 9.9 | 7.6 |
Health Care | 8.7 | 4.3 |
Utilities | 8.2 | 6.3 |
Telecommunication Services | 4.8 | 7.5 |
Consumer Discretionary | 3.1 | 9.3 |
Information Technology | 2.1 | 5.0 |
Annual Report
Aggressive International
Investments October 31, 2008
Showing Percentage of Net Assets
Common Stocks - 96.0% |
| Shares | | Value |
Australia - 1.1% |
CSL Ltd. | 92,249 | | $ 2,242,296 |
Bermuda - 0.7% |
Central European Media Enterprises Ltd. Class A (a) | 54,100 | | 1,445,011 |
Brazil - 2.8% |
Companhia Vale do Rio Doce (PN-A) sponsored ADR | 246,100 | | 2,881,831 |
MRV Engenharia e Participacoes SA | 243,500 | | 1,261,267 |
Uniao de Bancos Brasileiros SA (Unibanco) GDR | 23,700 | | 1,494,996 |
TOTAL BRAZIL | | 5,638,094 |
Canada - 7.7% |
Absolute Software Corp. (a) | 402,100 | | 1,300,539 |
Agnico-Eagle Mines Ltd. | 66,200 | | 1,826,018 |
Canadian Natural Resources Ltd. | 53,600 | | 2,703,559 |
Consolidated Thompson Iron Mines Ltd. (a) | 717,800 | | 1,160,814 |
EnCana Corp. | 55,400 | | 2,813,188 |
Goldcorp, Inc. | 112,600 | | 2,104,830 |
Mercator Minerals Ltd. (a) | 875,600 | | 1,750,038 |
Suncor Energy, Inc. | 87,700 | | 2,105,586 |
TOTAL CANADA | | 15,764,572 |
Cayman Islands - 1.1% |
Suntech Power Holdings Co. Ltd. sponsored ADR (a) | 125,900 | | 2,203,250 |
China - 0.8% |
Focus Media Holding Ltd. ADR (a)(d) | 92,900 | | 1,721,437 |
Czech Republic - 1.3% |
Ceske Energeticke Zavody AS | 60,800 | | 2,631,041 |
Denmark - 1.2% |
Vestas Wind Systems AS (a) | 59,000 | | 2,416,623 |
France - 7.1% |
Alstom SA | 45,100 | | 2,235,322 |
AXA SA | 124,000 | | 2,368,901 |
BNP Paribas SA | 43,200 | | 3,119,096 |
GDF Suez | 86,600 | | 3,870,982 |
Saft Groupe SA | 55,000 | | 1,606,841 |
Societe Generale Series A | 25,100 | | 1,368,076 |
TOTAL FRANCE | | 14,569,218 |
Germany - 7.8% |
Allianz AG (Reg.) | 30,100 | | 2,252,587 |
E.ON AG | 104,300 | | 3,990,183 |
Q-Cells AG (a)(d) | 62,675 | | 2,465,651 |
RWE AG | 47,700 | | 3,986,243 |
Siemens AG sponsored ADR (d) | 52,900 | | 3,181,935 |
TOTAL GERMANY | | 15,876,599 |
Greece - 1.1% |
Public Power Corp. of Greece | 176,100 | | 2,177,506 |
|
| Shares | | Value |
Hong Kong - 0.9% |
CNOOC Ltd. | 2,300,000 | | $ 1,888,471 |
India - 0.5% |
ICICI Bank Ltd. sponsored ADR | 65,300 | | 1,115,977 |
Ireland - 1.6% |
CRH PLC sponsored ADR | 98,900 | | 2,092,724 |
Dragon Oil PLC (a) | 430,800 | | 1,114,503 |
TOTAL IRELAND | | 3,207,227 |
Israel - 2.3% |
Israel Chemicals Ltd. | 188,700 | | 1,829,154 |
Teva Pharmaceutical Industries Ltd. sponsored ADR (d) | 65,800 | | 2,821,504 |
TOTAL ISRAEL | | 4,650,658 |
Italy - 2.2% |
Intesa Sanpaolo SpA | 616,300 | | 2,254,401 |
UniCredit SpA | 928,800 | | 2,272,518 |
TOTAL ITALY | | 4,526,919 |
Japan - 10.6% |
East Japan Railway Co. | 492 | | 3,500,895 |
Hisamitsu Pharmaceutical Co., Inc. | 44,200 | | 1,842,141 |
Mitsubishi Corp. | 154,700 | | 2,592,927 |
Mitsubishi UFJ Financial Group, Inc. sponsored ADR | 510,042 | | 3,197,963 |
Mitsui & Co. Ltd. | 228,000 | | 2,209,096 |
Nomura Holdings, Inc. sponsored ADR (d) | 228,500 | | 2,147,900 |
Sumitomo Mitsui Financial Group, Inc. | 649 | | 2,601,621 |
Terumo Corp. | 51,300 | | 2,137,920 |
Tsumura & Co. | 60,700 | | 1,553,368 |
TOTAL JAPAN | | 21,783,831 |
Mexico - 0.3% |
Desarrolladora Homex Sab de CV (a) | 146,500 | | 561,773 |
Netherlands - 1.3% |
Unilever NV (NY Shares) | 111,363 | | 2,678,280 |
Norway - 0.7% |
Renewable Energy Corp. AS (a)(d) | 153,800 | | 1,451,078 |
Russia - 4.9% |
Mobile TeleSystems OJSC sponsored ADR | 48,716 | | 1,907,231 |
OAO Gazprom sponsored ADR | 301,865 | | 6,173,137 |
OJSC Rosneft unit | 439,300 | | 2,020,780 |
TOTAL RUSSIA | | 10,101,148 |
South Africa - 1.9% |
FirstRand Ltd. | 1,026,800 | | 1,470,310 |
MTN Group Ltd. | 217,900 | | 2,431,024 |
TOTAL SOUTH AFRICA | | 3,901,334 |
Common Stocks - continued |
| Shares | | Value |
Spain - 3.2% |
Grifols SA | 107,110 | | $ 2,131,573 |
Telefonica SA | 238,500 | | 4,415,812 |
TOTAL SPAIN | | 6,547,385 |
Switzerland - 7.3% |
Alcon, Inc. | 11,400 | | 1,004,568 |
Credit Suisse Group sponsored ADR | 61,100 | | 2,285,140 |
Nestle SA (Reg.) | 156,956 | | 6,102,231 |
UBS AG (NY Shares) | 194,200 | | 3,281,980 |
Zurich Financial Services AG (Reg.) | 10,869 | | 2,204,602 |
TOTAL SWITZERLAND | | 14,878,521 |
Taiwan - 0.5% |
HTC Corp. | 94,000 | | 1,121,389 |
Turkey - 1.8% |
Tupras-Turkiye Petrol Rafinerileri AS | 145,000 | | 1,831,816 |
Turkiye Garanti Bankasi AS (a) | 1,194,000 | | 1,949,325 |
TOTAL TURKEY | | 3,781,141 |
United Kingdom - 15.4% |
BAE Systems PLC | 436,800 | | 2,454,934 |
BG Group PLC | 220,400 | | 3,240,351 |
BHP Billiton PLC | 247,012 | | 4,193,880 |
British American Tobacco PLC (United Kingdom) | 98,800 | | 2,709,681 |
HSBC Holdings PLC sponsored ADR (d) | 81,500 | | 4,808,500 |
Imperial Tobacco Group PLC | 130,300 | | 3,491,807 |
Man Group PLC | 398,600 | | 2,301,026 |
Prudential PLC | 374,700 | | 1,882,013 |
Reckitt Benckiser Group PLC | 58,600 | | 2,478,463 |
Vedanta Resources PLC (d) | 139,200 | | 1,927,530 |
Xstrata PLC | 123,200 | | 2,106,992 |
TOTAL UNITED KINGDOM | | 31,595,177 |
United States of America - 7.9% |
Baxter International, Inc. | 32,300 | | 1,953,827 |
Citigroup, Inc. | 71,500 | | 975,975 |
Goldman Sachs Group, Inc. | 14,200 | | 1,313,500 |
MasterCard, Inc. Class A | 13,500 | | 1,995,570 |
Medco Health Solutions, Inc. (a) | 61,800 | | 2,345,310 |
Meritage Homes Corp. (a) | 107,900 | | 1,481,467 |
Merrill Lynch & Co., Inc. | 56,600 | | 1,052,194 |
Philip Morris International, Inc. | 63,800 | | 2,773,386 |
ProLogis Trust | 76,600 | | 1,072,400 |
SL Green Realty Corp. | 27,200 | | 1,143,488 |
TOTAL UNITED STATES OF AMERICA | | 16,107,117 |
TOTAL COMMON STOCKS (Cost $302,535,578) | 196,583,073 |
Nonconvertible Bonds - 1.1% |
| Principal Amount | | Value |
Luxembourg - 1.1% |
Evraz Group SA 8.875% 4/24/13 (e) | | $ 2,030,000 | | $ 862,750 |
TNK-BP Finance SA 7.5% 3/13/13 (Reg. S) | | 860,000 | | 430,000 |
Vimpel Communications 8.375% 4/30/13 (Issued by VIP Finance Ireland Ltd. for Vimpel Communications) (e) | | 1,660,000 | | 979,400 |
TOTAL NONCONVERTIBLE BONDS (Cost $2,092,850) | 2,272,150 |
Money Market Funds - 9.4% |
| Shares | | |
Fidelity Cash Central Fund, 1.81% (b) | 4,212,698 | | 4,212,698 |
Fidelity Securities Lending Cash Central Fund, 2.67% (b)(c) | 14,959,930 | | 14,959,930 |
TOTAL MONEY MARKET FUNDS (Cost $19,172,628) | 19,172,628 |
TOTAL INVESTMENT PORTFOLIO - 106.5% (Cost $323,801,056) | | 218,027,851 |
NET OTHER ASSETS - (6.5)% | | (13,284,843) |
NET ASSETS - 100% | $ 204,743,008 |
Legend |
(a) Non-income producing |
(b) Affiliated fund that is available only to investment companies and other accounts managed by Fidelity Investments. The rate quoted is the annualized seven-day yield of the fund at period end. A complete unaudited listing of the fund's holdings as of its most recent quarter end is available upon request. |
(c) Investment made with cash collateral received from securities on loan. |
(d) Security or a portion of the security is on loan at period end. |
(e) Security exempt from registration under Rule 144A of the Securities Act of 1933. These securities may be resold in transactions exempt from registration, normally to qualified institutional buyers. At the end of the period, the value of these securities amounted to $1,842,150 or 0.9% of net assets. |
Affiliated Central Funds |
Information regarding fiscal year to date income earned by the Fund from investments in Fidelity Central Funds is as follows: |
Fund | Income earned |
Fidelity Cash Central Fund | $ 650,683 |
Fidelity Securities Lending Cash Central Fund | 418,042 |
Total | $ 1,068,725 |
Income Tax Information |
At October 31, 2008, the Fund had a capital loss carryforward of approximately $160,032,733 all of which will expire on October 31, 2016. |
See accompanying notes which are an integral part of the financial statements.
Annual Report
Aggressive International
Financial Statements
Statement of Assets and Liabilities
| October 31, 2008 |
| | |
Assets | | |
Investment in securities, at value (including securities loaned of $14,668,090) - See accompanying schedule: Unaffiliated issuers (cost $304,628,428) | $ 198,855,223 | |
Fidelity Central Funds (cost $19,172,628) | 19,172,628 | |
Total Investments (cost $323,801,056) | | $ 218,027,851 |
Foreign currency held at value (cost $858,713) | | 858,672 |
Receivable for investments sold | | 7,466,575 |
Receivable for fund shares sold | | 387,192 |
Dividends receivable | | 636,525 |
Interest receivable | | 12,564 |
Distributions receivable from Fidelity Central Funds | | 23,865 |
Prepaid expenses | | 189 |
Other receivables | | 471,762 |
Total assets | | 227,885,195 |
| | |
Liabilities | | |
Payable for investments purchased | $ 7,753,014 | |
Payable for fund shares redeemed | 222,967 | |
Accrued management fee | 40,424 | |
Other affiliated payables | 87,752 | |
Other payables and accrued expenses | 78,100 | |
Collateral on securities loaned, at value | 14,959,930 | |
Total liabilities | | 23,142,187 |
| | |
Net Assets | | $ 204,743,008 |
Net Assets consist of: | | |
Paid in capital | | $ 472,784,321 |
Distributions in excess of net investment income | | (22) |
Accumulated undistributed net realized gain (loss) on investments and foreign currency transactions | | (162,321,049) |
Net unrealized appreciation (depreciation) on investments and assets and liabilities in foreign currencies | | (105,720,242) |
Net Assets, for 27,601,194 shares outstanding | | $ 204,743,008 |
Net Asset Value, offering price and redemption price per share ($204,743,008 ÷ 27,601,194 shares) | | $ 7.42 |
Statement of Operations
| Year ended October 31, 2008 |
| | |
Investment Income | | |
Dividends | | $ 9,080,110 |
Interest | | 42,943 |
Income from Fidelity Central Funds | | 1,068,725 |
| | 10,191,778 |
Less foreign taxes withheld | | (934,627) |
Total income | | 9,257,151 |
| | |
Expenses | | |
Management fee
Basic fee | $ 3,110,991 | |
Performance adjustment | (1,159,612) | |
Transfer agent fees | 1,267,635 | |
Accounting and security lending fees | 229,038 | |
Custodian fees and expenses | 208,204 | |
Independent trustees' compensation | 2,053 | |
Registration fees | 29,091 | |
Audit | 74,031 | |
Legal | 2,947 | |
Interest | 18,295 | |
Miscellaneous | 119,416 | |
Total expenses before reductions | 3,902,089 | |
Expense reductions | (738,557) | 3,163,532 |
Net investment income (loss) | | 6,093,619 |
Realized and Unrealized Gain (Loss) Net realized gain (loss) on: | | |
Investment securities: | | |
Unaffiliated issuers (net of foreign taxes of $306,372) | (151,106,531) | |
Foreign currency transactions | (551,528) | |
Total net realized gain (loss) | | (151,658,059) |
Change in net unrealized appreciation (depreciation) on: Investment securities (net of decrease in deferred foreign taxes of $279,881) | (154,300,416) | |
Assets and liabilities in foreign currencies | (708,346) | |
Total change in net unrealized appreciation (depreciation) | | (155,008,762) |
Net gain (loss) | | (306,666,821) |
Net increase (decrease) in net assets resulting from operations | | $ (300,573,202) |
See accompanying notes which are an integral part of the financial statements.
Annual Report
Statement of Changes in Net Assets
| Year ended
October 31,
2008 | Year ended
October 31,
2007 |
Increase (Decrease) in Net Assets | | |
Operations | | |
Net investment income (loss) | $ 6,093,619 | $ 6,518,932 |
Net realized gain (loss) | (151,658,059) | 88,866,136 |
Change in net unrealized appreciation (depreciation) | (155,008,762) | 21,496,472 |
Net increase (decrease) in net assets resulting from operations | (300,573,202) | 116,881,540 |
Distributions to shareholders from net investment income | (5,367,651) | (5,378,123) |
Distributions to shareholders from net realized gain | (91,658,633) | (70,991,187) |
Total distributions | (97,026,284) | (76,369,310) |
Share transactions
Proceeds from sales of shares | 80,650,507 | 446,155,386 |
Reinvestment of distributions | 93,225,308 | 73,093,150 |
Cost of shares redeemed | (318,648,389) | (288,846,638) |
Net increase (decrease) in net assets resulting from share transactions | (144,772,574) | 230,401,898 |
Redemption fees | 20,218 | 33,598 |
Total increase (decrease) in net assets | (542,351,842) | 270,947,726 |
| | |
Net Assets | | |
Beginning of period | 747,094,850 | 476,147,124 |
End of period (including distributions in excess of net investment income of $22 and undistributed net investment income of $6,211,246, respectively) | $ 204,743,008 | $ 747,094,850 |
Other Information Shares | | |
Sold | 5,806,116 | 24,579,741 |
Issued in reinvestment of distributions | 5,991,344 | 4,454,183 |
Redeemed | (22,909,358) | (16,564,041) |
Net increase (decrease) | (11,111,898) | 12,469,883 |
Financial Highlights
Years ended October 31, | 2008 | 2007 | 2006 | 2005 | 2004 |
Selected Per-Share Data | | | | | |
Net asset value, beginning of period | $ 19.30 | $ 18.14 | $ 17.19 | $ 15.21 | $ 14.36 |
Income from Investment Operations | | | | | |
Net investment income (loss) B | .19 | .20 | .24 | .20 | .04 |
Net realized and unrealized gain (loss) | (9.54) | 3.80 | 2.70 | 1.83 | .91 |
Total from investment operations | (9.35) | 4.00 | 2.94 | 2.03 | .95 |
Distributions from net investment income | (.14) | (.20) | (.23) | (.05) | (.10) |
Distributions from net realized gain | (2.39) | (2.64) | (1.77) | - | - |
Total distributions | (2.53) | (2.84) | (2.00) | (.05) | (.10) |
Redemption fees added to paid in capital B | - F | - F | .01 | - F | - F |
Net asset value, end of period | $ 7.42 | $ 19.30 | $ 18.14 | $ 17.19 | $ 15.21 |
Total Return A | (55.30)% | 24.81% | 18.26% | 13.37% | 6.65% |
Ratios to Average Net Assets C, E | | | | | |
Expenses before reductions | .89% | .85% | .87% | .97% | 1.24% |
Expenses net of fee waivers, if any | .89% | .85% | .87% | .97% | 1.24% |
Expenses net of all reductions | .72% | .79% | .75% | .84% | 1.16% |
Net investment income (loss) | 1.39% | 1.11% | 1.36% | 1.20% | .27% |
Supplemental Data | | | | | |
Net assets, end of period (000 omitted) | $ 204,743 | $ 747,095 | $ 476,147 | $ 695,714 | $ 721,144 |
Portfolio turnover rate D | 387% | 138% | 176% | 185% | 161% |
A Total returns would have been lower had certain expenses not been reduced during the periods shown. B Calculated based on average shares outstanding during the period. C Fees and expenses of the underlying Fidelity Central Funds are not included in the Fund's expense ratio. The Fund indirectly bears its proportionate share of the expenses of any underlying Fidelity Central Funds. D Amount does not include the portfolio activity of any underlying Fidelity Central Funds. E Expense ratios reflect operating expenses of the Fund. Expenses before reductions do not reflect amounts reimbursed by the investment adviser or reductions from brokerage service arrangements or other expense offset arrangements and do not represent the amount paid by the Fund during periods when reimbursements or reductions occur. Expenses net of fee waivers reflect expenses after reimbursement by the investment adviser but prior to reductions from brokerage service arrangements or other expense offset arrangements. Expenses net of all reductions represent the net expenses paid by the Fund. F Amount represents less than $.01 per share. |
See accompanying notes which are an integral part of the financial statements.
Annual Report
Worldwide
Performance: The Bottom Line
Average annual total return reflects the change in the value of an investment, assuming reinvestment of the fund's dividend income and capital gains (the profits earned upon the sale of securities that have grown in value, if any) and assuming a constant rate of performance each year. The $10,000 table and the fund's returns do not reflect the deduction of taxes that a shareholder would pay on fund distributions or the redemption of fund shares. During periods of reimbursement by Fidelity, a fund's total return will be greater than it would be had the reimbursement not occurred. How a fund did yesterday is no guarantee of how it will do tomorrow.
Average Annual Total Returns
Periods ended October 31, 2008 | Past 1
year | Past 5
years | Past 10
years |
Fidelity Worldwide Fund | -40.66% | 3.63% | 4.45% |
$10,000 Over 10 Years
Let's say hypothetically that $10,000 was invested in Fidelity Worldwide Fund on October 31, 1998. The chart shows how the value of your investment would have changed, and also shows how the MSCI World Index performed over the same period.
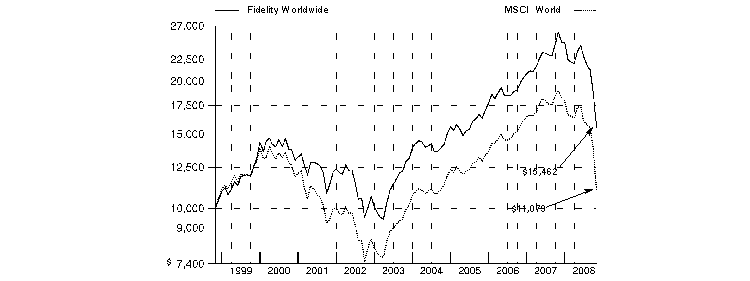
Annual Report
Worldwide
Management's Discussion of Fund Performance
Comments from William Kennedy, Lead Portfolio Manager of Fidelity® Worldwide Fund and manager of its non-U.S. equity investments, and from Stephen DuFour, Co-Portfolio Manager responsible for the fund's U.S. equity subportfolio
In a dramatic reversal of what had been a multiyear global growth story, international stocks fell long and hard during the 12 months ending October 31, 2008, especially so during the latter stages of the period and mostly as a result of fallout from the financial crisis that emanated from the United States. The viral spread of this financial contagion - which began in the U.S. subprime mortgage market, then seized up the credit markets, hobbled major financial institutions and eventually slowed economic growth worldwide - left virtually no corner of the globe untouched. Developed international equity markets - as gauged by the MSCI® Europe, Australasia, Far East (EAFE®) Index, which monitors established markets outside the U.S. and Canada - fell 46.54%, while the Standard & Poor's 500SM Index, a measure of U.S. stocks, dropped 36.10%. Among countries constituting at least 1% of the EAFE index, Switzerland had the "least worst" showing, falling roughly 32%, followed by Japan, where stocks slid by around 37%. Meanwhile, the weakest overall performance came from Belgium, where stocks slipped by nearly 70%. In the United Kingdom, the largest component of the index, equities were down almost 48%. Emerging markets were the weakest performers among the global economies, declining 56.22% as measured by the MSCI Emerging Markets Index.
For the 12 months ending October 31, 2008, the fund returned a disappointing -40.66%, compared with -41.63% for the MSCI World Index. The U.S. subportfolio solidly beat its part of the benchmark, while the foreign subportfolio came out behind its portion. For the fund overall, stock picking was weakest in technology, Europe and Japan. Individual detractors included Google, the Internet search engine company, and VMware, a company that develops server-virtualization software. Both U.S.-listed names were hurt by the slowing economy. VMware was no longer in the portfolio at period end. Not owning index component Volkswagen, the German car maker, also was costly, as the stock climbed sharply higher. Masco, a U.S. maker of home building products, fell amid slower consumer spending. The fund picked up ground versus the index from several U.S. stock holdings, investments in financials and energy, and a moderate cash position. Top contributors included Southwestern Energy, a U.S. natural gas company, and Bank of America, a diversified financials firm. Southwestern's gains came initially from rising gas prices and also from its strong production outlook. Bank of America was a winner for the fund because of opportunistic buying.
The views expressed above reflect those of the portfolio manager(s) only through the end of the period as stated on the cover of this report and do not necessarily represent the views of Fidelity or any other person in the Fidelity organization. Any such views are subject to change at any time based upon market or other conditions and Fidelity disclaims any responsibility to update such views. These views may not be relied on as investment advice and, because investment decisions for a Fidelity fund are based on numerous factors, may not be relied on as an indication of trading intent on behalf of any Fidelity fund.
Annual Report
Worldwide
Investment Changes (Unaudited)
Geographic Diversification (% of fund's net assets) |
As of October 31, 2008 |
| United States of America | 54.0% | |
| United Kingdom | 11.6% | |
| Switzerland | 7.0% | |
| Japan | 6.9% | |
| Germany | 5.8% | |
| France | 2.9% | |
| Australia | 2.5% | |
| Spain | 1.9% | |
| Italy | 0.9% | |
| Other | 6.5% | |

Percentages are adjusted for the effect of futures contracts, if applicable. |
As of April 30, 2008 |
| United States of America | 46.1% | |
| United Kingdom | 9.2% | |
| Japan | 8.2% | |
| Germany | 7.1% | |
| Switzerland | 4.3% | |
| Australia | 4.0% | |
| France | 3.5% | |
| Canada | 2.1% | |
| Spain | 1.9% | |
| Other | 13.6% | |

Percentages are adjusted for the effect of futures contracts, if applicable. |
Asset Allocation |
| % of fund's
net assets | % of fund's net assets
6 months ago |
Stocks | 94.6 | 98.7 |
Short-Term Investments and Net Other Assets | 5.4 | 1.3 |
Top Ten Stocks as of October 31, 2008 |
| % of fund's
net assets | % of fund's net assets
6 months ago |
Union Pacific Corp. (United States of America, Road & Rail) | 3.8 | 0.6 |
Bank of America Corp. (United States of America, Diversified Financial Services) | 3.0 | 0.0 |
Wal-Mart Stores, Inc. (United States of America, Food & Staples Retailing) | 2.9 | 0.6 |
Wells Fargo & Co. (United States of America, Commercial Banks) | 2.8 | 0.0 |
VF Corp. (United States of America, Textiles, Apparel & Luxury Goods) | 2.7 | 0.0 |
Google, Inc. Class A (sub. vtg.) (United States of America, Internet Software & Services) | 2.2 | 1.5 |
Apple, Inc. (United States of America, Computers & Peripherals) | 2.2 | 1.8 |
Oracle Corp. (United States of America, Software) | 2.0 | 0.4 |
Philip Morris International, Inc. (United States of America, Tobacco) | 1.9 | 1.0 |
Pulte Homes, Inc. (United States of America, Household Durables) | 1.7 | 0.0 |
| 25.2 | |
Market Sectors as of October 31, 2008 |
| % of fund's
net assets | % of fund's net assets
6 months ago |
Financials | 19.3 | 21.4 |
Health Care | 15.6 | 8.2 |
Information Technology | 12.6 | 11.0 |
Consumer Staples | 11.2 | 6.5 |
Industrials | 8.9 | 13.7 |
Consumer Discretionary | 8.9 | 7.3 |
Energy | 6.3 | 12.7 |
Materials | 4.2 | 8.1 |
Telecommunication Services | 3.9 | 3.5 |
Utilities | 3.7 | 5.7 |
Annual Report
Worldwide
Investments October 31, 2008
Showing Percentage of Net Assets
Common Stocks - 93.9% |
| Shares | | Value |
Australia - 2.5% |
ABB Grain Ltd. | 161,565 | | $ 882,306 |
Commonwealth Bank of Australia | 90,041 | | 2,460,048 |
Computershare Ltd. | 414,627 | | 2,342,866 |
CSL Ltd. | 389,101 | | 9,457,875 |
National Australia Bank Ltd. | 123,243 | | 1,998,703 |
QBE Insurance Group Ltd. | 125,667 | | 2,142,877 |
Westpac Banking Corp. | 14,002 | | 192,014 |
Woolworths Ltd. | 186,332 | | 3,471,709 |
TOTAL AUSTRALIA | | 22,948,398 |
Belgium - 0.1% |
Hansen Transmission International NV | 373,400 | | 626,311 |
Brazil - 0.2% |
BM&F BOVESPA SA | 236,098 | | 627,282 |
Vivo Participacoes SA sponsored ADR | 154,825 | | 1,693,786 |
TOTAL BRAZIL | | 2,321,068 |
Canada - 0.8% |
Canadian Natural Resources Ltd. | 35,400 | | 1,785,560 |
Niko Resources Ltd. | 32,300 | | 1,414,364 |
Open Text Corp. (a) | 106,200 | | 2,691,551 |
Petrobank Energy & Resources Ltd. (a) | 46,800 | | 892,685 |
Talisman Energy, Inc. | 73,100 | | 722,028 |
Timminco Ltd. (a) | 27,800 | | 156,776 |
TOTAL CANADA | | 7,662,964 |
Cayman Islands - 0.1% |
China Dongxiang Group Co. Ltd. | 2,856,000 | | 840,212 |
China - 0.1% |
ZTE Corp. (H Shares) | 539,680 | | 1,220,318 |
Cyprus - 0.0% |
Aisi Realty Public Ltd. (a) | 583,060 | | 85,454 |
Czech Republic - 0.2% |
Ceske Energeticke Zavody AS | 41,000 | | 1,774,222 |
Denmark - 0.5% |
Novo Nordisk AS Series B | 87,500 | | 4,690,237 |
Finland - 0.4% |
Nokia Corp. sponsored ADR | 239,800 | | 3,640,164 |
France - 2.9% |
Alstom SA | 64,000 | | 3,172,075 |
AXA SA | 101,700 | | 1,942,881 |
BNP Paribas SA | 72,482 | | 5,233,295 |
Cap Gemini SA | 41,400 | | 1,333,897 |
CNP Assurances | 13,200 | | 1,063,628 |
Eutelsat Communications | 134,400 | | 2,884,661 |
GDF Suez | 89,851 | | 4,016,301 |
L'Air Liquide SA | 41,600 | | 3,589,875 |
LVMH Moet Hennessy - Louis Vuitton | 15,300 | | 1,018,123 |
Orpea (a) | 34,000 | | 1,106,183 |
|
| Shares | | Value |
Sechilienne-Sidec | 11,800 | | $ 453,076 |
Societe Generale Series A | 26,085 | | 1,421,763 |
TOTAL FRANCE | | 27,235,758 |
Germany - 5.2% |
Allianz AG (Reg.) | 43,300 | | 3,240,433 |
Bayer AG | 23,100 | | 1,285,970 |
Bayer AG sponsored ADR | 14,000 | | 772,940 |
Beiersdorf AG | 5,200 | | 275,666 |
Daimler AG (Reg.) | 20,600 | | 712,363 |
Deutsche Bank AG | 29,400 | | 1,116,407 |
Deutsche Boerse AG | 15,700 | | 1,255,332 |
Deutsche Telekom AG (Reg.) | 235,500 | | 3,517,522 |
E.ON AG | 256,900 | | 9,828,170 |
Fresenius Medical Care AG | 45,200 | | 2,055,692 |
GEA Group AG | 99,700 | | 1,457,010 |
Gerresheimer AG | 71,500 | | 2,506,645 |
Linde AG | 31,914 | | 2,680,195 |
Muenchener Rueckversicherungs-Gesellschaft AG (Reg.) | 45,600 | | 6,052,260 |
Q-Cells AG (a) | 21,600 | | 849,750 |
RWE AG | 70,500 | | 5,891,617 |
Siemens AG (Reg.) | 37,500 | | 2,247,232 |
SolarWorld AG | 55,200 | | 1,391,237 |
Symrise AG | 103,800 | | 1,289,321 |
Wincor Nixdorf AG | 14,900 | | 651,898 |
TOTAL GERMANY | | 49,077,660 |
Greece - 0.1% |
Public Power Corp. of Greece | 108,200 | | 1,337,911 |
Hong Kong - 0.5% |
Cheung Kong Holdings Ltd. | 224,000 | | 2,150,728 |
China Unicom (Hong Kong) Ltd. | 774,000 | | 1,105,036 |
Hang Seng Bank Ltd. | 136,200 | | 1,699,423 |
TOTAL HONG KONG | | 4,955,187 |
India - 0.4% |
Infosys Technologies Ltd. | 42,311 | | 1,233,339 |
Reliance Industries Ltd. | 21,798 | | 619,609 |
Satyam Computer Services Ltd. | 197,732 | | 1,250,115 |
Titan Industries Ltd. | 20,000 | | 419,205 |
TOTAL INDIA | | 3,522,268 |
Indonesia - 0.1% |
PT Bumi Resources Tbk | 2,570,500 | | 336,547 |
PT Indosat Tbk | 1,434,000 | | 694,188 |
TOTAL INDONESIA | | 1,030,735 |
Ireland - 0.2% |
Paddy Power PLC (Ireland) | 85,800 | | 1,462,867 |
Common Stocks - continued |
| Shares | | Value |
Israel - 0.4% |
Nice Systems Ltd. sponsored ADR (a) | 55,700 | | $ 1,245,452 |
Teva Pharmaceutical Industries Ltd. sponsored ADR | 58,600 | | 2,512,768 |
TOTAL ISRAEL | | 3,758,220 |
Italy - 0.8% |
ENI SpA | 183,600 | | 4,382,192 |
Fiat SpA | 178,400 | | 1,417,879 |
Finmeccanica SpA | 46,272 | | 566,109 |
Finmeccanica SpA rights 11/7/08 (a) | 72,300 | | 30,746 |
Prysmian SpA | 63,500 | | 770,322 |
UniCredit SpA | 302,400 | | 739,890 |
TOTAL ITALY | | 7,907,138 |
Japan - 6.9% |
Aeon Mall Co. Ltd. | 62,100 | | 1,532,915 |
Asics Corp. | 216,000 | | 1,353,324 |
Canon Marketing Japan, Inc. | 132,200 | | 2,211,483 |
Canon, Inc. | 101,650 | | 3,556,720 |
Daiwa Securities Group, Inc. | 312,000 | | 1,763,810 |
East Japan Railway Co. | 569 | | 4,048,800 |
Konica Minolta Holdings, Inc. | 119,000 | | 781,470 |
Matsushita Electric Industrial Co. Ltd. | 232,000 | | 3,735,877 |
Mitsubishi Corp. | 181,000 | | 3,033,741 |
Mitsubishi UFJ Financial Group, Inc. | 1,059,900 | | 6,660,256 |
Mitsui & Co. Ltd. | 167,000 | | 1,618,066 |
Nintendo Co. Ltd. | 5,500 | | 1,716,000 |
Nippon Building Fund, Inc. | 157 | | 1,508,535 |
Nippon Telegraph & Telephone Corp. | 587 | | 2,395,263 |
Nomura Holdings, Inc. | 566,900 | | 5,370,728 |
Promise Co. Ltd. | 79,850 | | 1,433,168 |
Rakuten, Inc. | 2,616 | | 1,296,785 |
Ricoh Co. Ltd. | 195,000 | | 2,098,487 |
Seven & I Holdings Co. Ltd. | 65,800 | | 1,847,436 |
Sony Corp. sponsored ADR | 28,900 | | 671,636 |
Sony Financial Holdings, Inc. | 430 | | 1,398,409 |
Sumitomo Mitsui Financial Group, Inc. | 1,180 | | 4,730,221 |
Tokyo Electron Ltd. | 38,500 | | 1,283,673 |
Toyota Motor Corp. | 169,900 | | 6,634,414 |
Toyota Motor Corp. sponsored ADR | 20,000 | | 1,521,800 |
TOTAL JAPAN | | 64,203,017 |
Korea (South) - 0.4% |
LG Household & Health Care Ltd. | 11,830 | | 1,695,182 |
NHN Corp. (a) | 19,788 | | 2,112,392 |
TOTAL KOREA (SOUTH) | | 3,807,574 |
Luxembourg - 0.3% |
Reinet Investments SCA (a) | 1,666 | | 17,363 |
Reinet Investments SCA (a) | 10,498 | | 203,824 |
SES SA (A Shares) FDR unit | 138,742 | | 2,377,259 |
TOTAL LUXEMBOURG | | 2,598,446 |
|
| Shares | | Value |
Malaysia - 0.0% |
KNM Group Bhd | 1,950,800 | | $ 330,790 |
Mexico - 0.2% |
America Movil SAB de CV Series L sponsored ADR | 72,000 | | 2,227,680 |
Netherlands - 0.8% |
AMG Advanced Metallurgical Group NV (a)(d) | 33,700 | | 545,506 |
ASML Holding NV (Netherlands) | 27,900 | | 488,427 |
Gemalto NV (a) | 24,700 | | 692,027 |
Koninklijke KPN NV | 377,100 | | 5,310,772 |
TOTAL NETHERLANDS | | 7,036,732 |
Norway - 0.1% |
Pronova BioPharma ASA | 296,200 | | 769,499 |
Papua New Guinea - 0.1% |
Oil Search Ltd. | 377,501 | | 1,143,074 |
Russia - 0.2% |
OAO Gazprom sponsored ADR | 93,900 | | 1,920,255 |
Singapore - 0.1% |
Singapore Exchange Ltd. | 146,000 | | 522,600 |
Spain - 1.9% |
Banco Santander SA | 191,400 | | 2,070,021 |
Grifols SA | 204,453 | | 4,068,776 |
Red Electrica Corporacion SA | 36,400 | | 1,595,457 |
Repsol YPF SA | 64,200 | | 1,220,820 |
Telefonica SA | 463,500 | | 8,581,673 |
TOTAL SPAIN | | 17,536,747 |
Sweden - 0.1% |
Modern Times Group MTG AB (B Shares) | 32,000 | | 686,522 |
Switzerland - 7.0% |
Actelion Ltd. (Reg.) (a) | 102,940 | | 5,436,926 |
BB BIOTECH AG | 21,794 | | 1,381,921 |
Credit Suisse Group (Reg.) | 69,371 | | 2,593,491 |
EFG International | 114,200 | | 2,457,924 |
Julius Baer Holding AG | 31,314 | | 1,224,434 |
Nestle SA (Reg.) | 355,656 | | 13,827,411 |
Novartis AG: | | | |
(Reg.) | 45,155 | | 2,291,484 |
sponsored ADR | 239,800 | | 12,227,402 |
Roche Holding AG (participation certificate) | 64,541 | | 9,867,924 |
SGS Societe Generale de Surveillance Holding SA (Reg.) | 1,632 | | 1,606,421 |
Sonova Holding AG | 32,712 | | 1,358,909 |
Syngenta AG (Switzerland) | 23,161 | | 4,328,628 |
Tecan Group AG | 18,800 | | 843,857 |
The Swatch Group AG (Bearer) | 4,250 | | 663,044 |
UBS AG (For. Reg.) | 30,440 | | 516,373 |
Zurich Financial Services AG (Reg.) | 22,441 | | 4,551,796 |
TOTAL SWITZERLAND | | 65,177,945 |
Common Stocks - continued |
| Shares | | Value |
Thailand - 0.1% |
Total Access Communication PCL (For. Reg.) | 807,450 | | $ 574,004 |
United Kingdom - 11.6% |
AstraZeneca PLC: | | | |
(United Kingdom) | 89,200 | | 3,779,695 |
sponsored ADR (d) | 180,000 | | 7,642,800 |
Autonomy Corp. PLC (a) | 84,700 | | 1,342,809 |
BAE Systems PLC | 479,600 | | 2,695,481 |
Barclays PLC | 224,100 | | 642,322 |
BG Group PLC | 222,700 | | 3,274,165 |
BG Group PLC sponsored ADR | 12,700 | | 951,230 |
BHP Billiton PLC | 382,900 | | 6,501,047 |
BP PLC | 393,100 | | 3,203,952 |
British American Tobacco PLC (United Kingdom) | 239,300 | | 6,563,022 |
Capita Group PLC | 226,719 | | 2,342,394 |
Compass Group PLC | 224,200 | | 1,042,421 |
Diageo PLC | 82,600 | | 1,260,363 |
GlaxoSmithKline PLC sponsored ADR | 80,800 | | 3,126,960 |
HSBC Holdings PLC: | | | |
(Hong Kong) (Reg.) | 219,638 | | 2,614,436 |
(United Kingdom) (Reg.) | 708,200 | | 8,387,039 |
Imperial Tobacco Group PLC | 93,500 | | 2,505,633 |
Informa PLC | 464,800 | | 1,574,534 |
Man Group PLC | 631,700 | | 3,646,658 |
Misys PLC | 480,200 | | 859,738 |
Prudential PLC | 376,900 | | 1,893,063 |
Reckitt Benckiser Group PLC | 152,500 | | 6,449,925 |
Rio Tinto PLC (Reg.) | 96,300 | | 4,497,825 |
Royal Bank of Scotland Group PLC | 579,508 | | 638,259 |
Royal Dutch Shell PLC Class B | 451,900 | | 12,250,295 |
Shire PLC | 103,100 | | 1,355,759 |
SSL International PLC | 366,600 | | 2,475,658 |
Standard Chartered PLC (United Kingdom) | 55,100 | | 910,527 |
Unilever PLC | 198,100 | | 4,449,932 |
Vodafone Group PLC | 3,905,700 | | 7,512,530 |
Vodafone Group PLC sponsored ADR | 73,312 | | 1,412,722 |
William Morrison Supermarkets PLC | 251,900 | | 1,072,442 |
TOTAL UNITED KINGDOM | | 108,875,636 |
United States of America - 48.6% |
Amazon.com, Inc. (a) | 105,000 | | 6,010,200 |
Amgen, Inc. (a) | 190,000 | | 11,379,100 |
Apple, Inc. (a) | 192,000 | | 20,657,280 |
Bank of America Corp. | 1,147,600 | | 27,737,492 |
Baxter International, Inc. | 175,000 | | 10,585,750 |
|
| Shares | | Value |
Bristol-Myers Squibb Co. | 680,000 | | $ 13,974,000 |
C.R. Bard, Inc. | 15,000 | | 1,323,750 |
Capital One Financial Corp. (d) | 351,600 | | 13,754,592 |
Chevron Corp. | 90,000 | | 6,714,000 |
Electronic Arts, Inc. (a) | 46,000 | | 1,047,880 |
Exxon Mobil Corp. | 142,700 | | 10,576,924 |
FMC Corp. | 346,200 | | 15,073,548 |
Genzyme Corp. (a) | 33,000 | | 2,405,040 |
Gilead Sciences, Inc. (a) | 150,000 | | 6,877,500 |
Google, Inc. Class A (sub. vtg.) (a) | 57,800 | | 20,771,008 |
Johnson & Johnson | 235,000 | | 14,414,900 |
Macquarie Infrastructure Co. LLC | 8,300 | | 84,245 |
Masco Corp. | 685,000 | | 6,952,750 |
Meritage Homes Corp. (a) | 225,000 | | 3,089,250 |
Microsoft Corp. | 635,000 | | 14,179,550 |
Oracle Corp. (a) | 1,000,800 | | 18,304,632 |
PACCAR, Inc. | 487,800 | | 14,263,272 |
Philip Morris International, Inc. | 418,000 | | 18,170,460 |
PNC Financial Services Group, Inc. | 50,000 | | 3,333,500 |
Procter & Gamble Co. | 110,000 | | 7,099,400 |
Pulte Homes, Inc. | 1,412,090 | | 15,730,683 |
QUALCOMM, Inc. | 308,800 | | 11,814,688 |
Questar Corp. | 265,000 | | 9,131,900 |
Southwestern Energy Co. (a) | 249,000 | | 8,869,380 |
The Coca-Cola Co. | 170,000 | | 7,490,200 |
The Travelers Companies, Inc. | 205,000 | | 8,722,750 |
Union Pacific Corp. | 534,600 | | 35,695,237 |
VF Corp. (d) | 450,300 | | 24,811,530 |
Visa, Inc. | 24,800 | | 1,372,680 |
W.R. Berkley Corp. | 316,100 | | 8,303,947 |
Wal-Mart Stores, Inc. | 477,600 | | 26,654,856 |
Wells Fargo & Co. | 780,700 | | 26,582,835 |
TOTAL UNITED STATES OF AMERICA | | 453,960,709 |
TOTAL COMMON STOCKS (Cost $1,024,713,101) | 877,468,322 |
Nonconvertible Preferred Stocks - 0.7% |
| | | |
Germany - 0.6% |
Fresenius AG (non-vtg.) | 79,700 | | 5,140,031 |
Italy - 0.1% |
Intesa Sanpaolo SpA | 378,900 | | 1,124,625 |
TOTAL NONCONVERTIBLE PREFERRED STOCKS (Cost $7,997,277) | 6,264,656 |
Government Obligations - 0.0% |
| Principal Amount | | |
United States of America - 0.0% |
U.S. Treasury Bills, yield at date of purchase 1.68% 12/4/08
(Cost $499,202) | | $ 500,000 | | 499,871 |
Money Market Funds - 9.4% |
| Shares | | Value |
Fidelity Cash Central Fund, 1.81% (b) | 72,616,115 | | $ 72,616,115 |
Fidelity Securities Lending Cash Central Fund, 2.67% (b)(c) | 15,655,600 | | 15,655,600 |
TOTAL MONEY MARKET FUNDS (Cost $88,271,715) | 88,271,715 |
TOTAL INVESTMENT PORTFOLIO - 104.0% (Cost $1,121,481,295) | | 972,504,564 |
NET OTHER ASSETS - (4.0)% | | (37,619,217) |
NET ASSETS - 100% | $ 934,885,347 |
Legend |
(a) Non-income producing |
(b) Affiliated fund that is available only to investment companies and other accounts managed by Fidelity Investments. The rate quoted is the annualized seven-day yield of the fund at period end. A complete unaudited listing of the fund's holdings as of its most recent quarter end is available upon request. |
(c) Investment made with cash collateral received from securities on loan. |
(d) Security or a portion of the security is on loan at period end. |
Affiliated Central Funds |
Information regarding fiscal year to date income earned by the Fund from investments in Fidelity Central Funds is as follows: |
Fund | Income earned |
Fidelity Cash Central Fund | $ 1,902,128 |
Fidelity Securities Lending Cash Central Fund | 607,439 |
Total | $ 2,509,567 |
Income Tax Information |
At October 31, 2008, the Fund had a capital loss carryforward of approximately $115,059,396 all of which will expire on October 31, 2016. |
See accompanying notes which are an integral part of the financial statements.
Annual Report
Worldwide
Financial Statements
Statement of Assets and Liabilities
| October 31, 2008 |
| | |
Assets | | |
Investment in securities, at value (including securities loaned of $15,491,487) - See accompanying schedule: Unaffiliated issuers (cost $1,033,209,580) | $ 884,232,849 | |
Fidelity Central Funds (cost $88,271,715) | 88,271,715 | |
Total Investments (cost $1,121,481,295) | | $ 972,504,564 |
Foreign currency held at value (cost $1,576) | | 1,563 |
Receivable for investments sold | | 24,186,465 |
Receivable for fund shares sold | | 1,067,601 |
Dividends receivable | | 1,622,514 |
Distributions receivable from Fidelity Central Funds | | 127,530 |
Prepaid expenses | | 434 |
Other receivables | | 128,099 |
Total assets | | 999,638,770 |
| | |
Liabilities | | |
Payable for investments purchased | $ 47,150,485 | |
Payable for fund shares redeemed | 766,827 | |
Accrued management fee | 764,959 | |
Other affiliated payables | 296,178 | |
Other payables and accrued expenses | 119,374 | |
Collateral on securities loaned, at value | 15,655,600 | |
Total liabilities | | 64,753,423 |
| | |
Net Assets | | $ 934,885,347 |
Net Assets consist of: | | |
Paid in capital | | $ 1,220,065,652 |
Undistributed net investment income | | 10,091,805 |
Accumulated undistributed net realized gain (loss) on investments and foreign currency transactions | | (146,251,996) |
Net unrealized appreciation (depreciation) on investments and assets and liabilities in foreign currencies | | (149,020,114) |
Net Assets, for 69,747,170 shares outstanding | | $ 934,885,347 |
Net Asset Value, offering price and redemption price per share ($934,885,347 ÷ 69,747,170 shares) | | $ 13.40 |
Statement of Operations
| Year ended October 31, 2008 |
| | |
Investment Income | | |
Dividends | | $ 28,980,945 |
Interest | | 32,612 |
Income from Fidelity Central Funds | | 2,509,567 |
| | 31,523,124 |
Less foreign taxes withheld | | (1,666,415) |
Total income | | 29,856,709 |
| | |
Expenses | | |
Management fee
Basic fee | $ 10,448,749 | |
Performance adjustment | 2,637,233 | |
Transfer agent fees | 3,408,160 | |
Accounting and security lending fees | 668,807 | |
Custodian fees and expenses | 325,833 | |
Independent trustees' compensation | 6,262 | |
Registration fees | 48,244 | |
Audit | 84,312 | |
Legal | 8,160 | |
Miscellaneous | 215,919 | |
Total expenses before reductions | 17,851,679 | |
Expense reductions | (362,166) | 17,489,513 |
Net investment income (loss) | | 12,367,196 |
Realized and Unrealized Gain (Loss) Net realized gain (loss) on: | | |
Investment securities: | | |
Unaffiliated issuers (net of foreign taxes of $62,896) | (141,261,115) | |
Foreign currency transactions | (534,888) | |
Futures contracts | (1,967,127) | |
Total net realized gain (loss) | | (143,763,130) |
Change in net unrealized appreciation (depreciation) on: Investment securities (net of decrease in deferred foreign taxes of $305,771) | (564,477,704) | |
Assets and liabilities in foreign currencies | (54,922) | |
Total change in net unrealized appreciation (depreciation) | | (564,532,626) |
Net gain (loss) | | (708,295,756) |
Net increase (decrease) in net assets resulting from operations | | $ (695,928,560) |
See accompanying notes which are an integral part of the financial statements.
Annual Report
Worldwide
Financial Statements - continued
Statement of Changes in Net Assets
| Year ended
October 31,
2008 | Year ended
October 31,
2007 |
Increase (Decrease) in Net Assets | | |
Operations | | |
Net investment income (loss) | $ 12,367,196 | $ 9,612,679 |
Net realized gain (loss) | (143,763,130) | 184,057,906 |
Change in net unrealized appreciation (depreciation) | (564,532,626) | 221,656,286 |
Net increase (decrease) in net assets resulting from operations | (695,928,560) | 415,326,871 |
Distributions to shareholders from net investment income | (8,541,065) | (10,242,312) |
Distributions to shareholders from net realized gain | (169,398,247) | (160,260,858) |
Total distributions | (177,939,312) | (170,503,170) |
Share transactions
Proceeds from sales of shares | 303,265,276 | 384,029,331 |
Reinvestment of distributions | 172,247,752 | 166,220,804 |
Cost of shares redeemed | (440,446,176) | (349,745,488) |
Net increase (decrease) in net assets resulting from share transactions | 35,066,852 | 200,504,647 |
Redemption fees | 83,803 | 55,036 |
Total increase (decrease) in net assets | (838,717,217) | 445,383,384 |
| | |
Net Assets | | |
Beginning of period | 1,773,602,564 | 1,328,219,180 |
End of period (including undistributed net investment income of $10,091,805 and undistributed net investment income of $9,207,582, respectively) | $ 934,885,347 | $ 1,773,602,564 |
Other Information Shares | | |
Sold | 15,425,394 | 17,316,232 |
Issued in reinvestment of distributions | 7,926,720 | 8,382,290 |
Redeemed | (24,051,522) | (16,127,334) |
Net increase (decrease) | (699,408) | 9,571,188 |
Financial Highlights
Years ended October 31, | 2008 | 2007 | 2006 | 2005 | 2004 |
Selected Per-Share Data | | | | | |
Net asset value, beginning of period | $ 25.18 | $ 21.82 | $ 19.05 | $ 16.72 | $ 15.30 |
Income from Investment Operations | | | | | |
Net investment income (loss) B | .16 | .14 | .17 | .15 E | .05 F |
Net realized and unrealized gain (loss) | (9.44) | 6.05 | 3.74 | 2.30 | 1.44 |
Total from investment operations | (9.28) | 6.19 | 3.91 | 2.45 | 1.49 |
Distributions from net investment income | (.12) | (.17) | (.10) | (.10) | (.07) |
Distributions from net realized gain | (2.38) | (2.66) | (1.04) | (.02) | - |
Total distributions | (2.50) | (2.83) | (1.14) | (.12) | (.07) |
Redemption fees added to paid in capital B, H | - | - | - | - | - |
Net asset value, end of period | $ 13.40 | $ 25.18 | $ 21.82 | $ 19.05 | $ 16.72 |
Total Return A | (40.66)% | 31.87% | 21.31% | 14.71% | 9.77% |
Ratios to Average Net Assets C, G | | | | | |
Expenses before reductions | 1.21% | 1.04% | 1.08% | 1.07% | 1.23% |
Expenses net of fee waivers, if any | 1.21% | 1.04% | 1.08% | 1.07% | 1.23% |
Expenses net of all reductions | 1.19% | 1.02% | 1.02% | 1.01% | 1.19% |
Net investment income (loss) | .84% | .66% | .85% | .82% E | .29% F |
Supplemental Data | | | | | |
Net assets, end of period (000 omitted) | $ 934,885 | $ 1,773,603 | $ 1,328,219 | $ 1,181,044 | $ 1,064,162 |
Portfolio turnover rate D | 264% | 128% | 205% | 93% | 95% |
A Total returns would have been lower had certain expenses not been reduced during the periods shown. B Calculated based on average shares outstanding during the period. C Fees and expenses of the underlying Fidelity Central Funds are not included in the Fund's expense ratio. The Fund indirectly bears its proportionate share of the expenses of any underlying Fidelity Central Funds. D Amount does not include the portfolio activity of any underlying Fidelity Central Funds. E Investment income per share reflects a special dividend which amounted to $.04 per share. Excluding the special dividend, the ratio of net investment income (loss) to average net assets would have been .60%. F Net investment income per share includes approximately $.01 per share received as a result of a reorganization of an issuer that was in bankruptcy. Excluding this non-recurring amount, the ratio of net investment income (loss) to average net assets would have been .25%. G Expense ratios reflect operating expenses of the Fund. Expenses before reductions do not reflect amounts reimbursed by the investment adviser or reductions from brokerage service arrangements or other expense offset arrangements and do not represent the amount paid by the Fund during periods when reimbursements or reductions occur. Expenses net of fee waivers reflect expenses after reimbursement by the investment adviser but prior to reductions from brokerage service arrangements or other expense offset arrangements. Expenses net of all reductions represent the net expenses paid by the Fund. H Amount represents less than $.01 per share. |
See accompanying notes which are an integral part of the financial statements.
Annual Report
Notes to Financial Statements
For the period ended October 31, 2008
1. Organization.
Fidelity Aggressive International Fund and Fidelity Worldwide Fund (the Funds) are funds of Fidelity Investment Trust (the trust). The trust is registered under the Investment Company Act of 1940, as amended (the 1940 Act), as an open-end management investment company organized as a Massachusetts business trust. Each Fund is authorized to issue an unlimited number of shares. On November 18, 2008, the Board of Trustees of Fidelity Worldwide Fund approved the creation of additional classes of shares. The Fund will commence sale of shares of Class A, Class T, Class B, Class C and Institutional Class and the existing class will be designated Worldwide on or about January 28, 2009. Certain Funds' investments in emerging markets can be subject to social, economic, regulatory, and political uncertainties and can be extremely volatile.
2. Investments in Fidelity Central Funds.
The Funds may invest in Fidelity Central Funds, which are open-end investment companies available only to other investment companies and accounts managed by Fidelity Management & Research Company (FMR) and its affiliates. The Funds' Schedules of Investments list each of the Fidelity Central Funds held as of period end, if any, as an investment of each Fund, but does not include the underlying holdings of each Fidelity Central Fund. As an Investing Fund, the Funds indirectly bear their proportionate share of the expenses of the underlying Fidelity Central Funds.
The Money Market Central Funds seek preservation of capital and current income and are managed by Fidelity Investments Money Management, Inc. (FIMM), an affiliate of FMR.
A complete unaudited list of holdings for each Fidelity Central Fund is available upon request or at the SEC's web site at www.sec.gov. In addition, the financial statements of the Fidelity Central Funds, which are not covered by the Funds' Report of Independent Registered Public Accounting Firm, are available on the SEC's web site or upon request.
3. Significant Accounting Policies.
The financial statements have been prepared in conformity with accounting principles generally accepted in the United States of America, which require management to make certain estimates and assumptions at the date of the financial statements. Actual results could differ from those estimates. The following summarizes the significant accounting policies of the Funds:
Security Valuation. Investments are valued as of 4:00 p.m. Eastern time on the last calendar day of the period. Wherever possible, each Fund uses independent pricing services approved by the Board of Trustees to value their investments.
Equity securities, including restricted securities, for which market quotations are readily available, are valued at the last reported sale price or official closing price as reported by an independent pricing service on the primary market or exchange on which they are traded. In the event there were no sales during the day or closing prices are not available, securities are valued at the last quoted bid price. Debt securities, including restricted securities, are valued by independent pricing services or by dealers who make markets in such securities. Pricing services consider yield or price of bonds of comparable quality, coupon, maturity and type as well as dealer supplied prices. Futures contracts are valued at the settlement price established each day by the board of trade or exchange on which they are traded. Investments in open-end mutual funds, including the Fidelity Central Funds, are valued at their closing net asset value each business day. Short-term securities with remaining maturities of sixty days or less for which quotations are not readily available are valued at amortized cost, which approximates value.
When current market prices or quotations are not readily available or reliable, valuations may be determined in good faith in accordance with procedures adopted by the Board of Trustees. Factors used in determining value may include significant market or security specific events, changes in interest rates and credit quality, and developments in foreign markets which are monitored by evaluating the performance of ADRs, futures contracts and exchange-traded funds. The frequency with which these procedures are used cannot be predicted and may be utilized to a significant extent. The value of securities used for net asset value (NAV) calculation under these procedures may differ from published prices for the same securities.
Foreign Currency. Certain Funds may use foreign currency contracts to facilitate transactions in foreign-denominated securities. Losses from these transactions may arise from changes in the value of the foreign currency or if the counterparties do not perform under the contracts' terms.
Foreign-denominated assets, including investment securities, and liabilities are translated into U.S. dollars at the exchange rate at period end. Purchases and sales of investment securities, income and dividends received and expenses denominated in foreign currencies are translated into U.S. dollars at the exchange rate in effect on the transaction date.
The effects of exchange rate fluctuations on investments are included with the net realized and unrealized gain (loss) on investment securities. Other foreign currency transactions resulting in realized and unrealized gain (loss) are disclosed separately.
Annual Report
Notes to Financial Statements - continued
3. Significant Accounting Policies - continued
Investment Transactions and Income. For financial reporting purposes, the Funds' investment holdings and NAV include trades executed through the end of the last business day of the period. The NAV per share for processing shareholder transactions is calculated as of the close of business of the New York Stock Exchange (NYSE), normally 4:00 p.m. Eastern time and includes trades executed through the end of the prior business day. Gains and losses on securities sold are determined on the basis of identified cost and may include proceeds received from litigation. Dividend income is recorded on the ex-dividend date, except for certain dividends from foreign securities where the ex-dividend date may have passed, which are recorded as soon as the Funds are informed of the ex-dividend date. Non-cash dividends included in dividend income, if any, are recorded at the fair market value of the securities received. Distributions received on securities that represent a return of capital or capital gain are recorded as a reduction of cost of investments and/or as a realized gain. The Funds estimate the components of distributions received that may be considered return of capital distributions or capital gain distributions. Interest income and distributions from the Fidelity Central Funds are accrued as earned. Interest income includes coupon interest and amortization of premium and accretion of discount on debt securities. Investment income is recorded net of foreign taxes withheld where recovery of such taxes is uncertain.
Expenses. Most expenses of the trust can be directly attributed to a fund. Expenses which cannot be directly attributed are apportioned among each Fund in the trust. Expense estimates are accrued in the period to which they relate and adjustments are made when actual amounts are known.
Income Tax Information and Distributions to Shareholders. Each year, each Fund intends to qualify as a regulated investment company by distributing substantially all of its taxable income and realized gains under Subchapter M of the Internal Revenue Code and filing its U.S. federal tax return. As a result, no provision for income taxes is required. Each Fund is subject to the provisions of FASB Interpretation No. 48, Accounting for Uncertainties in Income Taxes (FIN 48). FIN 48 sets forth a minimum threshold for financial statement recognition of the benefit of a tax position taken or expected to be taken in a tax return. The implementation of FIN 48 did not result in any unrecognized tax benefits in the accompanying financial statements. Each of the Funds' federal tax returns for the prior three fiscal years remains subject to examination by the Internal Revenue Service (IRS). Foreign taxes are provided for based on each Fund's understanding of the tax rules and rates that exist in the foreign markets in which it invests.
Distributions are recorded on the ex-dividend date. Income and capital gain distributions are determined in accordance with income tax regulations, which may differ from generally accepted accounting principles. In addition, the Funds will claim a portion of the payment made to redeeming shareholders as a distribution for income tax purposes.
Capital accounts within the financial statements are adjusted for permanent book-tax differences. These adjustments have no impact on net assets or the results of operations. Temporary book-tax differences will reverse in a subsequent period.
Book-tax differences are primarily due to futures and options transactions, foreign currency transactions, certain foreign taxes, passive foreign investment companies (PFIC), market discount, deferred trustee compensation, capital loss carryforwards, and losses deferred due to wash sales.
The tax-basis components of distributable earnings and the federal tax cost as of period end were as follows for each Fund:
| Cost for Federal
Income Tax Purposes | Unrealized
Appreciation | Unrealized
Depreciation | Net Unrealized
Appreciation/
(Depreciation) |
Aggressive International | $ 326,036,399 | $ 4,384,563 | $ (112,393,111) | $ (108,008,548) |
Worldwide | 1,152,717,290 | 40,682,186 | (220,894,912) | (180,212,726) |
| Undistributed
Ordinary Income | Capital Loss
Carryforward |
Aggressive International | $ - | $ (160,032,733) |
Worldwide | 9,276,960 | (115,059,396) |
The tax character of distributions paid was as follows:
October 31, 2008 | | | |
| Ordinary Income | Long-term
Capital Gains | Total |
Aggressive International | $ 74,015,749 | $ 23,010,535 | $ 97,026,284 |
Worldwide | 54,093,535 | 123,845,777 | 177,939,312 |
October 31, 2007 | | | |
| Ordinary Income | Long-term
Capital Gains | Total |
Aggressive International | $ 10,756,243 | $ 65,613,067 | $ 76,369,310 |
Worldwide | 44,085,022 | 126,418,148 | 170,503,170 |
Annual Report
3. Significant Accounting Policies - continued
Short-Term Trading (Redemption) Fees. Shares held in the Funds less than 30 days are subject to a redemption fee equal to 1.00% of the proceeds of the redeemed shares. All redemption fees, including any estimated redemption fees paid by FMR, are retained by the Fund and accounted for as an addition to paid in capital.
New Accounting Pronouncements. In September 2006, Statement of Financial Accounting Standards No. 157, Fair Value Measurements (SFAS 157), was issued and is effective for fiscal years beginning after November 15, 2007. SFAS 157 defines fair value, establishes a framework for measuring fair value and results in expanded disclosures about fair value measurements.
In addition, in March 2008, Statement of Financial Accounting Standards No. 161, Disclosures about Derivative Instruments and Hedging Activities (SFAS 161), was issued and is effective for reporting periods beginning after November 15, 2008. SFAS 161 requires enhanced disclosures to provide information about the reasons the Funds invest in derivative instruments, the accounting treatment and the effect derivatives have on financial performance.
4. Operating Policies.
Repurchase Agreements. FMR has received an Exemptive Order from the Securities and Exchange Commission (the SEC) which permits certain Funds and other affiliated entities of FMR to transfer uninvested cash balances into joint trading accounts which are then invested in repurchase agreements. Certain Funds may also invest directly with institutions in repurchase agreements. Repurchase agreements are collateralized by government or non-government securities. Upon settlement date, collateral is held in segregated accounts with custodian banks and may be obtained in the event of a default of the counterparty. Each applicable Fund monitors, on a daily basis, the value of the collateral to ensure it is at least equal to the principal amount of the repurchase agreement (including accrued interest). In the event of a default by the counterparty, realization of the collateral proceeds could be delayed, during which time the value of the collateral may decline.
Futures Contracts. Certain Funds may use futures contracts to manage their exposure to the stock market. Buying futures tends to increase a fund's exposure to the underlying instrument, while selling futures tends to decrease a fund's exposure to the underlying instrument or hedge other fund investments. Upon entering into a futures contract, a fund is required to deposit with a clearing broker, no later than the following business day, an amount ("initial margin") equal to a certain percentage of the face value of the contract. The initial margin may be in the form of cash or securities and is transferred to a segregated account on settlement date. Subsequent payments ("variation margin") are made or received by a fund depending on the daily fluctuations in the value of the futures contract and are accounted for as unrealized gains or losses. Realized gains (losses) are recorded upon the expiration or closing of the futures contract. Securities deposited to meet margin requirements are identified in each applicable fund's Schedule of Investments. Losses may arise from changes in the value of the underlying instruments or if the counterparties do not perform under the contract's terms.
Restricted Securities. Certain Funds may invest in securities that are subject to legal or contractual restrictions on resale. These securities generally may be resold in transactions exempt from registration or to the public if the securities are registered. Disposal of these securities may involve time-consuming negotiations and expense, and prompt sale at an acceptable price may be difficult. Information regarding restricted securities is included at the end of each applicable Fund's Schedule of Investments.
5. Purchases and Sales of Investments.
Purchases and sales of securities, other than short-term securities, are noted in the table below.
| Purchases ($) | Sales ($) |
Aggressive International | 1,634,355,367 | 1,800,122,787 |
Worldwide | 3,765,035,798 | 3,897,782,128 |
6. Fees and Other Transactions with Affiliates.
Management Fee. FMR and its affiliates provide the Funds with investment management related services for which the Funds pay a monthly management fee. The management fee is the sum of an individual fund fee rate and a group fee rate. The individual fund fee rate is applied to each Fund's average net assets. The group fee rate is based upon the average net assets of all the mutual funds advised by FMR. The group fee rate decreases as assets under management increase and increases as assets under management decrease. In addition, the management fee for Aggressive International and Worldwide is subject to a performance adjustment (up to a maximum± .20% of each applicable Funds' average net assets over a 36 month performance period). The upward or downward adjustment to the management fee is based on each Fund's relative investment performance as compared to an appropriate benchmark index.
Annual Report
Notes to Financial Statements - continued
6. Fees and Other Transactions with Affiliates - continued
Management Fee - continued
For the period, each Fund's annual management fee rate expressed as a percentage of each Fund's average net assets, including the performance adjustment, if applicable was as follows:
| Individual Rate | Group Rate | Total |
Aggressive International | .45% | .26% | .45% |
Worldwide | .45% | .26% | .89% |
Transfer Agent Fees. Fidelity Investments Institutional Operations Company, Inc. (FIIOC), an affiliate of FMR, is the Funds' transfer, dividend disbursing and shareholder servicing agent. FIIOC receives account fees and asset-based fees that vary according to account size and type of account. FIIOC pays for typesetting, printing and mailing of shareholder reports, except proxy statements. Prior to January 1, 2008, Fidelity Service Company, Inc. (FSC), also an affiliate of FMR, was the Funds' transfer agent. For the period, the transfer agent fees were equivalent to the following annual rates expressed as a percentage of average net assets:
Aggressive International | .29% |
Worldwide | .23% |
Accounting and Security Lending Fees. FSC maintains each Fund's accounting records. The accounting fee is based on the level of average net assets for the month. Under a separate contract, FSC administers the security lending program. The security lending fee is based on the number and duration of lending transactions.
Brokerage Commissions. Certain Funds placed a portion of their portfolio transactions with brokerage firms which are affiliates of the investment adviser. The commissions paid to these affiliated firms were as follows:
| Amount |
Aggressive International | $ 1,456 |
Worldwide | 40,445 |
Interfund Lending Program. Pursuant to an Exemptive Order issued by the SEC, the Funds, along with other registered investment companies having management contracts with FMR, may participate in an interfund lending program. This program provides an alternative credit facility allowing the funds to borrow from, or lend money to, other participating affiliated funds. At period end, there were no interfund loans outstanding. Each applicable fund's activity in this program during the period for which loans were outstanding was as follows:
| Borrower
or Lender | Average
Daily Loan
Balance | Weighted
Average
Interest Rate | Interest
Expense |
Aggressive International | Borrower | $ 7,397,150 | 4.34% | $ 17,842 |
7. Committed Line of Credit.
Certain Funds participate with other funds managed by FMR in a $4.2 billion credit facility (the "line of credit") to be utilized for temporary or emergency purposes to fund shareholder redemptions or for other short-term liquidity purposes. The participating funds have agreed to pay commitment fees on their pro rata portion of the line of credit, which is reflected in Miscellaneous Expense on the Statement of Operations, and is as follows:
Aggressive International | $ 934 |
Worldwide | 2,999 |
During the period, there were no borrowings on this line of credit.
8. Security Lending.
Certain Funds lend portfolio securities from time to time in order to earn additional income. On the settlement date of the loan, each applicable Fund receives collateral (in the form of U.S. Treasury obligations, letters of credit and/or cash) against the loaned securities and maintains collateral in an amount not less than 100% of the market value of the loaned securities during the period of the loan. The market value of the loaned securities is determined at the close of business of the Funds and any additional required collateral is delivered to the Funds on the next business day. If the borrower defaults on its obligation to return the securities loaned because of insolvency or other reasons, a fund could experience delays and costs in recovering the securities loaned or in gaining access to the collateral. Any cash collateral received is invested in the Fidelity Securities Lending Cash Central Fund. The value of loaned securities and cash collateral at period end are disclosed on each applicable Fund's Statement of Assets and Liabilities. Security lending income represents the income earned on investing cash collateral, less fees and expenses associated with the loan, plus any premium
Annual Report
8. Security Lending - continued
payments that may be received on the loan of certain types of securities. Security lending income is presented on each applicable Fund's Statement of Operations as a component of income from Fidelity Central Funds. Net income from lending portfolio securities during the period amounted to:
Aggressive International | $ 418,042 |
Worldwide | 607,439 |
9. Bank Borrowings.
Each Fund is permitted to have bank borrowings for temporary or emergency purposes to fund shareholder redemptions. Each Fund has established borrowing arrangements with certain banks. The interest rate on the borrowings is the bank's base rate, as revised from time to time. At period end, there were no bank borrowings outstanding. Each applicable Fund's activity in this program during the period for which loans were outstanding was as follows:
| Average Daily
Loan Balance | Weighted
Average
Interest Rate | Interest
Expense |
Aggressive International | $ 2,135,000 | 3.82% | $ 453 |
10. Expense Reductions.
Many of the brokers with whom FMR places trades on behalf of certain Funds provided services to these Funds in addition to trade execution. These services included payments of expenses on behalf of each applicable Fund. In addition, through arrangements with each applicable Fund's custodian and transfer agent, credits realized as a result of uninvested cash balances were used to reduce each applicable Fund's expenses. All of the applicable expense reductions are noted in the table below.
| Brokerage
Service
Arrangements | Custody
expense
reduction | Transfer
Agent
expense
reduction |
| | | |
Aggressive International | $ 723,903 | $ 4,337 | $ 10,317 |
Worldwide | 328,836 | 3,064 | 30,266 |
11. Other.
The Funds' organizational documents provide former and current trustees and officers with a limited indemnification against liabilities arising in connection with the performance of their duties to the Funds. In the normal course of business, the Funds may also enter into contracts that provide general indemnifications. The Funds' maximum exposure under these arrangements is unknown as this would be dependent on future claims that may be made against the Funds. The risk of material loss from such claims is considered remote.
In December 2006, the Independent Trustees, with the assistance of independent counsel, completed an investigation regarding gifts, gratuities and business entertainment provided by certain brokers to certain individuals who were employed on FMR's domestic equity trading desk during the period 2002 to 2004. The Independent Trustees and FMR agreed that, despite the absence of proof that the Fidelity mutual funds experienced diminished execution quality as a result of the improper receipt of gifts and business entertainment, the conduct at issue was serious and was worthy of redress. Accordingly, the Independent Trustees requested, and FMR agreed to make, a payment of $42 million plus accrued interest, which equaled approximately $7.3 million, to certain Fidelity mutual funds.
In March 2008, the Trustees approved a method for allocating this payment among the funds and, in total, FMR paid each fund the following amounts, which is recorded in each applicable Fund's accompanying Statement of Operations:
| |
Aggressive International | $ 1,589 |
Worldwide | 116,981 |
During the period, Lehman Brothers Holdings, Inc. and certain of its affiliates (LBHI) sought protection under the insolvency laws of their jurisdictions of organization, including the United States, the United Kingdom and Japan. At the time LBHI's insolvency proceedings were instituted, Fidelity Worldwide Fund had outstanding securities trades with counterparties affiliated with LBHI. As a result of the insolvency proceedings, LBHI is unable to fulfill its commitments and, in certain cases, Fidelity Worldwide Fund may have terminated its trades and related agreements with the relevant entities and, where appropriate, is in the process of initiating claims for damages. FMR believes that the financial impact to Fidelity Worldwide Fund relating to the terminated trades and agreements is immaterial.
Annual Report
Report of Independent Registered Public Accounting Firm
To the Trustees of Fidelity Investment Trust and Shareholders of Fidelity Diversified International Fund, Fidelity Aggressive International Fund and Fidelity Worldwide Fund:
We have audited the accompanying statements of assets and liabilities of Fidelity Diversified International Fund, Fidelity Aggressive International Fund and Fidelity Worldwide Fund (the Funds), funds of Fidelity Investment Trust (the Trust), including the schedules of investments as of October 31, 2008, and the related statements of operations for the year then ended, the statements of changes in net assets for each of the two years in the period then ended, and the financial highlights for each of the five years in the period then ended. These financial statements and financial highlights are the responsibility of the Funds' management. Our responsibility is to express an opinion on these financial statements and financial highlights based on our audits.
We conducted our audits in accordance with standards of the Public Company Accounting Oversight Board (United States). Those standards require that we plan and perform the audit to obtain reasonable assurance about whether the financial statements and financial highlights are free of material misstatement. The Funds are not required to have, nor were we engaged to perform, an audit of its internal control over financial reporting. Our audits included consideration of internal control over financial reporting as a basis for designing audit procedures that are appropriate in the circumstances, but not for the purpose of expressing an opinion on the effectiveness of the Fund's internal control over financial reporting. Accordingly, we express no such opinion. An audit also includes examining, on a test basis, evidence supporting the amounts and disclosures in the financial statements, assessing the accounting principles used and significant estimates made by management, as well as evaluating the overall financial statement presentation. Our procedures included confirmation of securities owned as of October 31, 2008, by correspondence with the custodians and brokers; where replies were not received from brokers, we performed other auditing procedures. We believe that our audits provide a reasonable basis for our opinion.
In our opinion, the financial statements and financial highlights referred to above present fairly, in all material respects, the financial positions of Fidelity Diversified International Fund, Fidelity Aggressive International Fund and Fidelity Worldwide Fund as of October 31, 2008, the results of their operations for the year then ended, the changes in their net assets for each of the two years in the period then ended, and their financial highlights for each of the five years in the period then ended, in conformity with accounting principles generally accepted in the United States of America.
/s/ Deloitte & Touche LLP
DELOITTE & TOUCHE LLP
Boston, Massachusetts
December 23, 2008
Annual Report
Report of Independent Registered Public Accounting Firm
To the Trustees of Fidelity Investment Trust and the Shareholders of Fidelity Overseas Fund:
In our opinion, the accompanying statement of assets and liabilities, including the schedule of investments, and the related statements of operations and of changes in net assets and the financial highlights present fairly, in all material respects, the financial position of Fidelity Overseas Fund (a fund of Fidelity Investment Trust) at October 31, 2008, the results of its operations for the year then ended, the changes in its net assets for each of the two years in the period then ended and the financial highlights for each of the periods indicated in conformity with accounting principles generally accepted in the United States of America. These financial statements and financial highlights (hereafter referred to as "financial statements") are the responsibility of the Fidelity Overseas Fund's management. Our responsibility is to express an opinion on these financial statements based on our audits. We conducted our audits of these financial statements in accordance with the standards of the Public Company Accounting Oversight Board (United States). Those standards require that we plan and perform the audit to obtain reasonable assurance about whether the financial statements are free of material misstatement. An audit includes examining, on a test basis, evidence supporting the amounts and disclosures in the financial statements, assessing the accounting principles used and significant estimates made by management, and evaluating the overall financial statement presentation. We believe that our audits, which included confirmation of securities at October 31, 2008 by correspondence with the custodian and brokers, provide a reasonable basis for our opinion.
/s/ PricewaterhouseCoopers LLP
PricewaterhouseCoopers LLP
Boston, Massachusetts
December 23, 2008
Annual Report
The Trustees, Member of the Advisory Board, and executive officers of the trust and funds, as applicable, are listed below. The Board of Trustees governs each fund and is responsible for protecting the interests of shareholders. The Trustees are experienced executives who meet periodically throughout the year to oversee each fund's activities, review contractual arrangements with companies that provide services to each fund, and review each fund's performance. Except for Edward C. Johnson 3d and James C. Curvey, each of the Trustees oversees 220 funds advised by FMR or an affiliate. Messrs. Johnson and Curvey oversee 379 funds advised by FMR or an affiliate.
The Trustees hold office without limit in time except that (a) any Trustee may resign; (b) any Trustee may be removed by written instrument, signed by at least two-thirds of the number of Trustees prior to such removal; (c) any Trustee who requests to be retired or who has become incapacitated by illness or injury may be retired by written instrument signed by a majority of the other Trustees; and (d) any Trustee may be removed at any special meeting of shareholders by a two-thirds vote of the outstanding voting securities of the trust. Each Trustee who is not an interested person (as defined in the 1940 Act) (Independent Trustee), shall retire not later than the last day of the calendar year in which his or her 72nd birthday occurs. The Independent Trustees may waive this mandatory retirement age policy with respect to individual Trustees. The executive officers and Advisory Board Member hold office without limit in time, except that any officer and Advisory Board Member may resign or may be removed by a vote of a majority of the Trustees at any regular meeting or any special meeting of the Trustees. Except as indicated, each individual has held the office shown or other offices in the same company for the past five years.
The funds' Statement of Additional Information (SAI) includes more information about the Trustees. To request a free copy, call Fidelity at 1-800-544-8544.
Interested Trustees*:
Correspondence intended for each Trustee who is an interested person may be sent to Fidelity Investments, 82 Devonshire Street, Boston, Massachusetts 02109.
Name, Age; Principal Occupation |
Edward C. Johnson 3d (78) |
| Year of Election or Appointment: 1984
Mr. Johnson is Chairman of the Board of Trustees. Mr. Johnson serves as Chief Executive Officer, Chairman, and a Director of FMR LLC; Chairman and a Director of FMR; Chairman and a Director of Fidelity Research & Analysis Company (FRAC); Chairman and a Director of Fidelity Investments Money Management, Inc.; and Chairman and a Director of FMR Co., Inc. In addition, Mr. Johnson serves as Chairman and Director of FIL Limited. Previously, Mr. Johnson served as President of FMR LLC (2006-2007). |
James C. Curvey (73) |
| Year of Election or Appointment: 2007 Mr. Curvey also serves as Trustee (2007-present) of other investment companies advised by FMR. Mr. Curvey is a Director of FMR and FMR Co., Inc. (2007-present). Mr. Curvey is also Vice Chairman (2006-present) and Director of FMR LLC. In addition, Mr. Curvey serves as an Overseer for the Boston Symphony Orchestra and a member of the Trustees of Villanova University. |
* Trustees have been determined to be "Interested Trustees" by virtue of, among other things, their affiliation with the trust or various entities under common control with FMR. FMR Corp. merged with and into FMR LLC on October 1, 2007. Any references to FMR LLC for prior periods are deemed to be references to the prior entity.
Independent Trustees:
Correspondence intended for each Independent Trustee (that is, the Trustees other than the Interested Trustees) may be sent to Fidelity Investments, P.O. Box 55235, Boston, Massachusetts 02205-5235.
Name, Age; Principal Occupation |
Dennis J. Dirks (60) |
| Year of Election or Appointment: 2005 Prior to his retirement in May 2003, Mr. Dirks was Chief Operating Officer and a member of the Board of The Depository Trust & Clearing Corporation (DTCC) (1999-2003). He also served as President, Chief Operating Officer, and Board member of The Depository Trust Company (DTC) (1999-2003) and President and Board member of the National Securities Clearing Corporation (NSCC) (1999-2003). In addition, Mr. Dirks served as a Trustee and a member of the Finance Committee of Manhattan College (2005-2008), and as Chief Executive Officer and Board member of the Government Securities Clearing Corporation (2001-2003) and Chief Executive Officer and Board member of the Mortgage-Backed Securities Clearing Corporation (2001-2003). Mr. Dirks also serves as a Trustee and a member of the Finance Committee of AHRC of Nassau County (2006-present). |
Alan J. Lacy (55) |
| Year of Election or Appointment: 2008 Mr. Lacy serves as Senior Adviser (2007-present) of Oak Hill Capital Partners, L.P. (a private equity firm). Mr. Lacy also served as Chief Executive Officer (2000-2005) and Vice Chairman (2005-2006) of Sears Holdings Corporation and Sears, Roebuck and Co. (retail). In addition, Mr. Lacy serves as a member of the Board of Directors of The Western Union Company (global money transfer, 2006-present) and Bristol-Myers Squibb (global pharmaceuticals, 2007-present). Mr. Lacy is a Trustee of the National Parks Conservation Association and The Field Museum of Natural History. |
Ned C. Lautenbach (64) |
| Year of Election or Appointment: 2000 Mr. Lautenbach is Chairman of the Independent Trustees (2006-present). Mr. Lautenbach is an Advisory Partner of Clayton, Dubilier & Rice, Inc. (private equity investment firm). Previously, Mr. Lautenbach was with the International Business Machines Corporation (IBM) from 1968 until his retirement in 1998. Mr. Lautenbach serves as a Director of Eaton Corporation (diversified industrial) as well as the Philharmonic Center for the Arts in Naples, Florida. He also is a member of the Board of Trustees of Fairfield University (2005-present), as well as a member of the Council on Foreign Relations. Previously, Mr. Lautenbach served as a Director of Sony Corporation (2006-2007). |
Joseph Mauriello (64) |
| Year of Election or Appointment: 2008 Prior to his retirement in January 2006, Mr. Mauriello served in numerous senior management positions including Deputy Chairman and Chief Operating Officer (2004-2005), and Vice Chairman of Financial Services (2002-2004) of KPMG LLP US (professional services firm, 1965-2005). Mr. Mauriello currently serves as a member of the Board of Directors of XL Capital Ltd. (global insurance and re-insurance company, 2006-present) and of Arcadia Resources Inc. (health care services and products, 2007-
present). He also served as a Director of the Hamilton Funds of the Bank of New York (2006-2007). |
Cornelia M. Small (64) |
| Year of Election or Appointment: 2005 Ms. Small is a member of the Investment Committee, and Chair (2008-present) and a member of the Board of Trustees of Smith College. Ms. Small also serves on the Investment Committee of the Berkshire Taconic Community Foundation (2008-present). Previously, Ms. Small served as Chairperson of the Investment Committee (2002-2008) of Smith College and as Co-Chair (2000-
2003) of the Annual Fund for the Fletcher School of Law and Diplomacy. In addition, she served as Chief Investment Officer, Director of Global Equity Investments, and a member of the Board of Directors of Scudder, Stevens & Clark and Scudder Kemper Investments. |
William S. Stavropoulos (69) |
| Year of Election or Appointment: 2001 Mr. Stavropoulos is Chairman Emeritus of the Board of Directors of The Dow Chemical Company, where he previously served in numerous senior management positions, including President (1993-2000; 2002-2003), CEO (1995-2000; 2002-2004), Chairman of the Executive Committee (2000-2006), and as a member of the Board of Directors (1990-2006). Currently, he is a Director of Teradata Corporation (data warehousing and technology solutions, 2008-present), Chemical Financial Corporation, Maersk Inc. (industrial conglomerate), Tyco International, Inc. (multinational manufacturing and services, 2007-present), and a member of the Advisory Board for Metalmark Capital (private equity investment firm, 2005-present). He is a special advisor to Clayton, Dubilier & Rice, Inc. (private equity investment). In addition, Mr. Stavropoulos is a member of the University of Notre Dame Advisory Council for the College of Science. |
David M. Thomas (59) |
| Year of Election or Appointment: 2008 Previously, Mr. Thomas served as Executive Chairman (2005-2006) and Chairman and Chief Executive Officer (2000-2005) of IMS Health, Inc. (pharmaceutical and healthcare information solutions). In addition, Mr. Thomas serves as a member of the Board of Directors of Fortune Brands, Inc. (consumer products holding company), and Interpublic Group of Companies, Inc. (marketing communication, 2004-present). |
Michael E. Wiley (58) |
| Year of Election or Appointment: 2008 Mr. Wiley also serves as a member of the Board of Trustees of the University of Tulsa (2000-2006; 2007-present). He serves as a Director of Tesoro Corporation (independent oil refiner and marketer, 2005-present), and a Director of Bill Barrett Corporation (exploration and production company, 2005-present). In addition, he also serves as a Director of Post Oak Bank (privately-held bank, 2004-present). Previously, Mr. Wiley served as a Sr. Energy Advisor of Katzenbach Partners, LLC (consulting firm, 2006-
2007), as an Advisory Director of Riverstone Holdings (private investment firm), Chairman, President, and CEO of Baker Hughes, Inc. (oilfield services company, 2000-2004), and as Director of Spinnaker Exploration Company (exploration and production company, 2001-2005). |
Annual Report
Advisory Board Member and Executive Officers**:
Correspondence intended for each executive officer and Mr. Lynch may be sent to Fidelity Investments, 82 Devonshire Street, Boston, Massachusetts 02109.
Name, Age; Principal Occupation |
Peter S. Lynch (66) |
| Year of Election or Appointment: 2003 Member of the Advisory Board of Fidelity's Equity and High Income Funds. Mr. Lynch is Vice Chairman and a Director of FMR, and Vice Chairman (2001-present) and a Director of FMR Co., Inc. Previously, Mr. Lynch served as a Trustee of the Fidelity funds (1990-2003). In addition, he serves as a Trustee of Boston College and as the Chairman of the Inner-City Scholarship Fund. Previously, Mr. Lynch served on the Special Olympics International Board of Directors (1997-2006). |
Kenneth B. Robins (39) |
| Year of Election or Appointment: 2008 President and Treasurer of Fidelity's Equity and High Income Funds. Mr. Robins is an employee of Fidelity Investments (2004-
present). Before joining Fidelity Investments, Mr. Robins worked at KPMG LLP, where he was a partner in KPMG's department of professional practice (2002-2004). |
Walter C. Donovan (46) |
| Year of Election or Appointment: 2007 Vice President of Fidelity's Equity Funds. Mr. Donovan also serves as President of FMR and FMR Co., Inc., and Executive Vice President of Fidelity Investments Money Management, Inc. (2007-present). Previously, Mr. Donovan served as Executive Vice President of FMR and FMR Co., Inc. (2005-2007) and Senior Vice President of FMR (2003-2005) and FMR Co., Inc. (2004-2005). |
Bruce T. Herring (43) |
| Year of Election or Appointment: 2006 Vice President of certain Equity Funds. Mr. Herring also serves as Group Chief Investments Officer of FMR. Previously, Mr. Herring served as a portfolio manager for Fidelity U.S. Equity Funds. |
Eric M. Wetlaufer (46) |
| Year of Election or Appointment: 2006 Vice President of Fidelity's International Equity Funds. Mr. Wetlaufer also serves as Group Chief Investment Officer of FMR. Mr. Wetlaufer is Chairman, Chief Executive Officer, and President of Fidelity Management & Research (Hong Kong) Limited (2008-present); Chairman, Chief Executive Officer, President, and a Director of Fidelity Management & Research (Japan) Inc. (2008-present); Chairman and Chief Executive Officer (2007-present) and President and a Director (2006-present) of Fidelity Management & Research (U.K.) Inc. and President and a Director of Fidelity Research & Analysis Company (2006-present). Before joining Fidelity Investments in 2005, Mr. Wetlaufer was a partner in Oxhead Capital Management (2004-2005) and a Chief Investment Officer of Putnam Investments (1997-2003). |
Scott C. Goebel (40) |
| Year of Election or Appointment: 2008 Secretary and Chief Legal Officer (CLO) of the Fidelity funds. Mr. Goebel also serves as General Counsel, Secretary, and Senior Vice President of FMR (2008-present); Deputy General Counsel of FMR LLC; Chief Legal Secretary of Fidelity Management & Research (Hong Kong) Limited (2008-present) and Assistant Secretary of Fidelity Management & Research (Japan) Inc. (2008-
present). Previously, Mr. Goebel served as Assistant Secretary of the Funds (2007-2008) and as Vice President and Secretary of Fidelity Distributors Corporation (FDC) (2005-2007). |
John B. McGinty, Jr. (46) |
| Year of Election or Appointment: 2008 Assistant Secretary of Fidelity's Equity and High Income Funds. Mr. McGinty is an employee of Fidelity Investments (2004-present). Mr. McGinty also serves as Senior Vice President, Secretary, and Chief Legal Officer of FDC (2007-present). Before joining Fidelity Investments, Mr. McGinty practiced law at Ropes & Gray, LLP. |
Holly C. Laurent (54) |
| Year of Election or Appointment: 2008 Anti-Money Laundering (AML) Officer of the Fidelity funds. Ms. Laurent is an employee of Fidelity Investments. Previously, Ms. Laurent was Senior Vice President and Head of Legal for Fidelity Business Services India Pvt. Ltd. (2006-2008), Senior Vice President, Deputy General Counsel and Group Head for FMR LLC (2005-2006). |
Christine Reynolds (50) |
| Year of Election or Appointment: 2008 Chief Financial Officer of the Fidelity funds. Ms. Reynolds became President of Fidelity Pricing and Cash Management Services (FPCMS) in August 2008. She served as Chief Operating Officer of FPCMS from 2007 through July 2008. Previously, Ms. Reynolds served as President, Treasurer, and Anti-Money Laundering officer of the Fidelity funds (2004-2007). Before joining Fidelity Investments, Ms. Reynolds worked at PricewaterhouseCoopers LLP (PwC) (1980-2002), where she was an audit partner with PwC's investment management practice. |
Kenneth A. Rathgeber (61) |
| Year of Election or Appointment: 2004 Chief Compliance Officer of Fidelity's Equity and High Income Funds. Mr. Rathgeber is Chief Compliance Officer of Fidelity Management & Research (Hong Kong) Limited (2008-present), Fidelity Management & Research (Japan) Inc. (2008-present), FMR (2005-present), FMR Co., Inc. (2005-present), Fidelity Management & Research (U.K.) Inc. (2005-present), Fidelity Research & Analysis Company (2005-present), Fidelity Investments Money Management, Inc. (2005-present), and Strategic Advisers, Inc. (2005-present). |
Bryan A. Mehrmann (47) |
| Year of Election or Appointment: 2005 Deputy Treasurer of the Fidelity funds. Mr. Mehrmann is an employee of Fidelity Investments. Previously, Mr. Mehrmann served as Vice President of Fidelity Investments Institutional Services Group (FIIS)/Fidelity Investments Institutional Operations Corporation, Inc. (FIIOC) Client Services (1998-2004). |
Adrien E. Deberghes (41) |
| Year of Election or Appointment: 2008 Deputy Treasurer of Fidelity's Equity and High Income Funds. Mr. Deberghes is an employee of Fidelity Investments (2008-present). Previously, Mr. Deberghes served as Senior Vice President of Mutual Fund Administration at State Street Corporation (2007-2008), Senior Director of Mutual Fund Administration at Investors Bank & Trust (2005-2007), and Director of Finance for Dunkin' Brands (2000-2005). |
Robert G. Byrnes (41) |
| Year of Election or Appointment: 2005 Assistant Treasurer of the Fidelity funds. Mr. Byrnes is an employee of Fidelity Investments (2005-present). Previously, Mr. Byrnes served as Vice President of Fidelity Pricing and Cash Management Services (FPCMS) (2003-2005). Before joining Fidelity Investments, Mr. Byrnes worked at Deutsche Asset Management where he served as Vice President of the Investment Operations Group (2000-2003). |
Peter L. Lydecker (54) |
| Year of Election or Appointment: 2004 Assistant Treasurer of the Fidelity funds. Mr. Lydecker is an employee of Fidelity Investments. |
Paul M. Murphy (61) |
| Year of Election or Appointment: 2007 Assistant Treasurer of the Fidelity funds. Mr. Murphy is an employee of Fidelity Investments (2007-present). Previously, Mr. Murphy served as Chief Financial Officer of the Fidelity Funds (2005-2006), Vice President and Associate General Counsel of FMR (2007), and Senior Vice President of Fidelity Pricing and Cash Management Services (FPCMS) (1994-2007). |
Gary W. Ryan (50) |
| Year of Election or Appointment: 2005 Assistant Treasurer of the Fidelity funds. Mr. Ryan is an employee of Fidelity Investments. Previously, Mr. Ryan served as Vice President of Fund Reporting in Fidelity Pricing and Cash Management Services (FPCMS) (1999-2005). |
** FMR Corp. merged with and into FMR LLC on October 1, 2007. Any references to FMR LLC for prior periods are deemed to be references to the prior entity.
Annual Report
A percentage of the dividends distributed during the fiscal year for the following funds was derived from interest on U.S. Government securities which is generally exempt from state income tax:
Fidelity Aggressive International Fund | .86% |
A percentage of the dividends distributed during the fiscal year for the following funds may be taken into account as a dividend for purposes of the maximum rate under section 1(h) (11) of the Internal Revenue Code:
Fidelity Diversified International Fund | 98% |
Fidelity Aggressive International Fund | 8% |
Fidelity Overseas Fund | 50% |
Fidelity Worldwide Fund | 38% |
The amounts per share which represent income derived from sources within, and taxes paid to, foreign countries or possessions of the United States are as follows:
| Pay Date | Income | Taxes |
Fidelity Diversified International Fund | 12/10/07 | $0.438 | $0.0683 |
Fidelity Aggressive International Fund | 12/10/07 | $0.134 | $0.0268 |
Fidelity Overseas Fund | 12/10/07 | $0.679 | $0.0952 |
Fidelity Worldwide Fund | 12/10/07 | $0.121 | $0.0235 |
The funds will notify shareholders in January 2009 of amounts for use in preparing 2008 income tax returns.
Annual Report
A special meeting of each fund's shareholders was held on December 13, 2007. The results of votes taken among shareholders on the proposals before them are reported below. Each vote reported represents one dollar of net asset value held on the record date for the meeting.
PROPOSAL 1 |
To amend the Declaration of Trust to reduce the required quorum for shareholder meetings.A |
| # of
Votes | % of
Votes |
Affirmative | 45,014,793,255.82 | 80.372 |
Against | 6,871,112,667.08 | 12.268 |
Abstain | 2,163,456,438.02 | 3.863 |
Broker
Non-Votes | 1,958,633,563.89 | 3.497 |
TOTAL | 56,007,995,924.81 | 100.000 |
PROPOSAL 2 |
To elect the nominees specified below as Trustees.A |
James C. Curvey |
Affirmative | 53,384,952,361.03 | 95.317 |
Withheld | 2,623,043,563.78 | 4.683 |
TOTAL | 56,007,995,924.81 | 100.000 |
Dennis J. Dirks |
Affirmative | 53,595,104,608.67 | 95.692 |
Withheld | 2,412,891,316.14 | 4.308 |
TOTAL | 56,007,995,924.81 | 100.000 |
Albert R. Gamper, Jr. |
Affirmative | 53,570,235,221.69 | 95.647 |
Withheld | 2,437,760,703.12 | 4.353 |
TOTAL | 56,007,995,924.81 | 100.000 |
George H. Heilmeier |
Affirmative | 53,166,350,588.50 | 94.926 |
Withheld | 2,841,645,336.31 | 5.074 |
TOTAL | 56,007,995,924.81 | 100.000 |
Edward C. Johnson 3d |
Affirmative | 53,230,508,654.93 | 95.041 |
Withheld | 2,777,487,269.88 | 4.959 |
TOTAL | 56,007,995,924.81 | 100.000 |
James H. Keyes |
Affirmative | 53,549,161,456.52 | 95.610 |
Withheld | 2,458,834,468.29 | 4.390 |
TOTAL | 56,007,995,924.81 | 100.000 |
Marie L. Knowles |
Affirmative | 53,543,925,066.86 | 95.601 |
Withheld | 2,464,070,857.95 | 4.399 |
TOTAL | 56,007,995,924.81 | 100.000 |
Ned C. Lautenbach |
Affirmative | 53,547,116,322.50 | 95.606 |
Withheld | 2,460,879,602.31 | 4.394 |
TOTAL | 56,007,995,924.81 | 100.000 |
Cornelia M. Small |
Affirmative | 53,564,793,514.25 | 95.638 |
Withheld | 2,443,202,410.56 | 4.362 |
TOTAL | 56,007,995,924.81 | 100.000 |
| # of
Votes | % of
Votes |
William S. Stavropoulos |
Affirmative | 53,426,544,502.76 | 95.391 |
Withheld | 2,581,451,422.05 | 4.609 |
TOTAL | 56,007,995,924.81 | 100.000 |
Kenneth L. Wolfe |
Affirmative | 53,229,881,790.63 | 95.040 |
Withheld | 2,778,114,134.18 | 4.960 |
TOTAL | 56,007,995,924.81 | 100.000 |
A Denotes trust-wide proposal and voting results.
Annual Report
Proxy Voting Results
A special meeting of each fund's shareholders was held on April 16, 2008. The results of votes taken among shareholders on the proposals before them are reported below. Each vote reported represents one dollar of net asset value held on the record date for the meeting.
PROPOSAL 1 |
To elect a Board of Trustees.A |
| # of
Votes | % of
Votes |
James C. Curvey |
Affirmative | 44,485,656,811.55 | 94.702 |
Withheld | 2,488,551,854.62 | 5.298 |
TOTAL | 46,974,208,666.17 | 100.000 |
Dennis J. Dirks |
Affirmative | 44,706,671,638.31 | 95.173 |
Withheld | 2,267,537,027.86 | 4.827 |
TOTAL | 46,974,208,666.17 | 100.000 |
Edward C. Johnson 3d |
Affirmative | 44,294,881,638.16 | 94.296 |
Withheld | 2,679,327,028.01 | 5.704 |
TOTAL | 46,974,208,666.17 | 100.000 |
Alan J. Lacy |
Affirmative | 44,685,373,413.16 | 95.127 |
Withheld | 2,288,835,253.01 | 4.873 |
TOTAL | 46,974,208,666.17 | 100.000 |
Ned C. Lautenbach |
Affirmative | 44,634,541,379.41 | 95.019 |
Withheld | 2,339,667,286.76 | 4.981 |
TOTAL | 46,974,208,666.17 | 100.000 |
Joseph Mauriello |
Affirmative | 44,683,962,099.80 | 95.124 |
Withheld | 2,290,246,566.37 | 4.876 |
TOTAL | 46,974,208,666.17 | 100.000 |
Cornelia M. Small |
Affirmative | 44,671,688,375.36 | 95.098 |
Withheld | 2,302,520,290.81 | 4.902 |
TOTAL | 46,974,208,666.17 | 100.000 |
William S. Stavropoulos |
Affirmative | 44,465,262,087.61 | 94.659 |
Withheld | 2,508,946,578.56 | 5.341 |
TOTAL | 46,974,208,666.17 | 100.000 |
David M. Thomas |
Affirmative | 44,694,340,813.87 | 95.147 |
Withheld | 2,279,867,852.30 | 4.853 |
TOTAL | 46,974,208,666.17 | 100.000 |
Michael E. Wiley |
Affirmative | 44,686,513,174.78 | 95.130 |
Withheld | 2,287,695,491.39 | 4.870 |
TOTAL | 46,974,208,666.17 | 100.000 |
PROPOSAL 5 |
Shareholder proposal for Fidelity Overseas Fund concerning "oversight procedures to screen out investments in companies that, in the judgement of the Board, substantially contribute to genocide, patterns of extraordinary and egregious violations of human rights, or crimes against humanity." |
| # of
Votes | % of
Votes |
Affirmative | 1,027,473,497.30 | 22.075 |
Against | 3,357,951,287.91 | 72.144 |
Abstain | 211,338,442.15 | 4.541 |
Broker Non-Votes | 57,735,630.82 | 1.240 |
TOTAL | 4,654,498,858.18 | 100.000 |
PROPOSAL 5 |
A shareholder proposal for Fidelity Diversified International Fund concerning "oversight procedures to screen out investments in companies that, in the judgement of the Board, substantially contribute to genocide, patterns of extraordinary and egregious violations of human rights, or crimes against humanity." The fund did not achieve quorum with respect to this proposal, and therefore no action was taken at the meeting and subsequent adjournments. Because sufficient votes in favor of the proposal were not received, on June 18, 2008, the proxies in their discretion determined not to adjourn the meeting further on this item. |
A Denotes trust-wide proposal and voting results.
Annual Report
Board Approval of Investment Advisory Contracts and Management Fees
Broadly Diversified International Equity Funds
Each year, typically in July, the Board of Trustees, including the Independent Trustees (together, the Board), votes on the renewal of the management contract and sub-advisory agreements (together, the Advisory Contracts) for each fund. The Board, assisted by the advice of fund counsel and Independent Trustees' counsel, requests and considers a broad range of information throughout the year.
The Board meets regularly and, acting directly and through its separate committees, requests and receives information concerning, and considers at each of its meetings factors that are relevant to, its annual consideration of the renewal of each fund's Advisory Contracts, including the services and support provided to each fund and its shareholders. At the time of the renewal, the Board had 12 standing committees, each composed of Independent Trustees with varying backgrounds, to which the Board has assigned specific subject matter responsibilities in order to enhance effective decision-making by the Board. Each committee has a written charter outlining the structure and purposes of the committee. The Board also meets as needed to consider matters specifically related to the Board's annual consideration of the renewal of Advisory Contracts.
At its July 2008 meeting, the Board of Trustees, including the Independent Trustees, unanimously determined to renew each fund's Advisory Contracts. In reaching its determination, the Board considered all factors it believed relevant, including (i) the nature, extent, and quality of the services to be provided to each fund and its shareholders (including the investment performance of each fund); (ii) the competitiveness of each fund's management fee and total expenses; (iii) the total costs of the services to be provided by and the profits to be realized by Fidelity from its relationship with each fund; (iv) the extent to which economies of scale would be realized as each fund grows; and (v) whether fee levels reflect these economies of scale, if any, for the benefit of fund shareholders. The Board also approved agreements with foreign sub-advisers Fidelity Management & Research (Japan) Inc. and Fidelity Management & Research (Hong Kong) Limited, as well as amendments to each fund's agreement with Fidelity Management & Research (U.K.) Inc.
In considering whether to renew the Advisory Contracts for each fund, the Board ultimately reached a determination, with the assistance of fund counsel and Independent Trustees' counsel and through the exercise of its business judgment, that the renewal of the Advisory Contracts and the compensation to be received by Fidelity under the management contracts is consistent with Fidelity's fiduciary duty under applicable law. The Board's decision to renew the Advisory Contracts was not based on any single factor noted above, but rather was based on a comprehensive consideration of all the information provided to the Board at its meetings throughout the year. The Board, in reaching its determination to renew the Advisory Contracts, is aware that shareholders in each fund have a broad range of investment choices available to them, including a wide choice among mutual funds offered by competitors to Fidelity, and that each fund's shareholders, with the opportunity to review and weigh the disclosure provided by the fund in its prospectus and other public disclosures, have chosen to invest in that fund, managed by Fidelity.
Nature, Extent, and Quality of Services Provided. The Board considered staffing within the investment adviser, FMR, and the sub-advisers (together, the Investment Advisers), including the backgrounds of the funds' investment personnel and the funds' investment objectives and disciplines. The Independent Trustees also had discussions with senior management of Fidelity's investment operations and investment groups. The Board considered the structure of the portfolio manager compensation program and whether this structure provides appropriate incentives.
Resources Dedicated to Investment Management and Support Services. The Board reviewed the size, education, and experience of the Investment Advisers' investment staff, their use of technology, and the Investment Advisers' approach to recruiting, training, and retaining portfolio managers and other research, advisory, and management personnel. The Board noted that Fidelity's analysts have access to a variety of technological tools that enable them to perform both fundamental and quantitative analysis and to specialize in various disciplines. The Board considered Fidelity's extensive global research capabilities that enable the Investment Advisers to aggregate data from various sources in an effort to produce positive investment results. The Board also considered that Fidelity's portfolio managers and analysts have access to daily portfolio attribution that allows for monitoring of a fund's portfolio, as well as an electronic communication system that provides immediate real-time access to research concerning issuers and credit enhancers.
Shareholder and Administrative Services. The Board considered (i) the nature, extent, quality, and cost of advisory, administrative, distribution, and shareholder services performed by the Investment Advisers and their affiliates under the Advisory Contracts and under separate agreements covering transfer agency, pricing and bookkeeping, and securities lending services for each fund; (ii) the nature and extent of the Investment Advisers' supervision of third party service providers, principally custodians and subcustodians; and (iii) the resources devoted to, and the record of compliance with, each fund's compliance policies and procedures. The Board also reviewed the allocation of fund brokerage, including allocations to brokers affiliated with the Investment Advisers, the use of brokerage commissions to pay fund expenses, and the use of "soft" commission dollars to pay for research services. The Board further considered that Fidelity voluntarily pays for market data out of its own resources.
The Board noted that the growth of fund assets across the complex allows Fidelity to reinvest in the development of services designed to enhance the value or convenience of the Fidelity funds as investment vehicles. These services include 24-hour access to account information and market information through phone representatives and over the Internet, and investor education materials and asset allocation tools.
Investment in a Large Fund Family. The Board considered the benefits to shareholders of investing in a Fidelity fund, including the benefits of investing in a fund that is part of a large family of funds offering a variety of investment disciplines and providing for a large variety of mutual fund investor services. For example, fund shareholders are offered the privilege of exchanging shares of a fund for shares of other Fidelity funds, as set forth in the fund's prospectus, without paying a sales charge. The Board noted that Fidelity has taken a number of actions over the previous year that benefited particular funds, including (i) dedicating additional resources to investment research and to restructure the investment research teams; (ii) contractually agreeing to reduce the management fees on Fidelity's Institutional Money Market Funds and launching Class IV and Institutional Class of certain of these funds; (iii) reducing the transfer agent fees for the Fidelity Select Portfolios and Investor Class of the VIP funds; and (iv) launching Class K of 29 equity funds as a lower-fee class available to certain employer-sponsored retirement plans.
Annual Report
Board Approval of Investment Advisory Contracts and Management Fees - continued
Investment Performance. The Board considered whether each fund has operated within its investment objective, as well as its record of compliance with its investment restrictions. It also reviewed each fund's absolute investment performance, as well as each fund's relative investment performance measured against (i) a broad-based securities market index, and (ii) a peer group of mutual funds (or a custom peer group of mutual funds, in the case of Aggressive International Fund) deemed appropriate by the Board over multiple periods.
For each of Diversified International Fund, Overseas Fund, and Worldwide Fund, the following charts considered by the Board show, over the one-, three-, and five-year periods ended December 31, 2007, the fund's cumulative total returns, the cumulative total returns of a broad-based securities market index ("benchmark"), and a range of cumulative total returns of a peer group of mutual funds identified by Morningstar, Inc. as having an investment style similar to that of the fund based on underlying portfolio holdings. (Diversified International Fund and Overseas Fund did not offer Class K as of December 31, 2007.)
For Aggressive International Fund, the following charts considered by the Board show, over the one-, three-, and five-year periods ended December 31, 2007, the fund's cumulative total returns, the cumulative total returns of a broad-based securities market index ("benchmark"), and a range of cumulative total returns of a custom peer group of mutual funds defined by FMR based on categories assigned by Morningstar, Inc. The fund's custom peer group, defined by FMR, is a peer group that FMR believes provides a more meaningful performance comparison than the peer group assigned by Morningstar, Inc., which assigns mutual funds to categories based on their investment styles as measured by their underlying portfolio holdings.
The box within each chart shows the 25th percentile return (bottom of box) and the 75th percentile return (top of box) of the peer group. Returns shown above the box are in the first quartile and returns shown below the box are in the fourth quartile. The percentage beaten number noted below each chart corresponds to the percentile box and represents the percentage of funds in the peer group whose performance was equal to or lower than that of the fund.
Fidelity Diversified International Fund

The Board reviewed the fund's relative investment performance against its peer group and stated that the performance of the fund was in the first quartile for the one- and five-year periods and the second quartile for the three-year period. The Board also stated that the investment performance of the fund compared favorably to its benchmark for all the periods shown.
Annual Report
Fidelity Aggressive International Fund
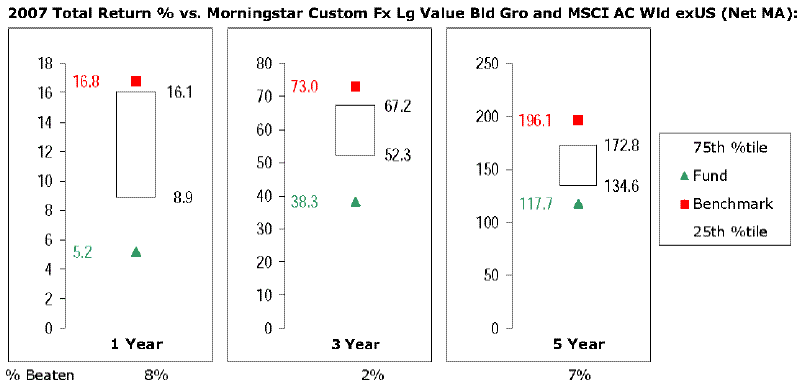
The Board reviewed the fund's relative investment performance against its peer group and stated that the performance of the fund was in the fourth quartile for all the periods shown. The Board also stated that the investment performance of the fund was lower than its benchmark for all the periods shown. The Board discussed with FMR actions that may be taken by FMR to improve the fund's disappointing performance relative to its peer group and benchmark. The Board will continue to closely monitor the performance of the fund in the coming year and discuss with FMR other appropriate actions to address the performance of the fund.
Fidelity Overseas Fund
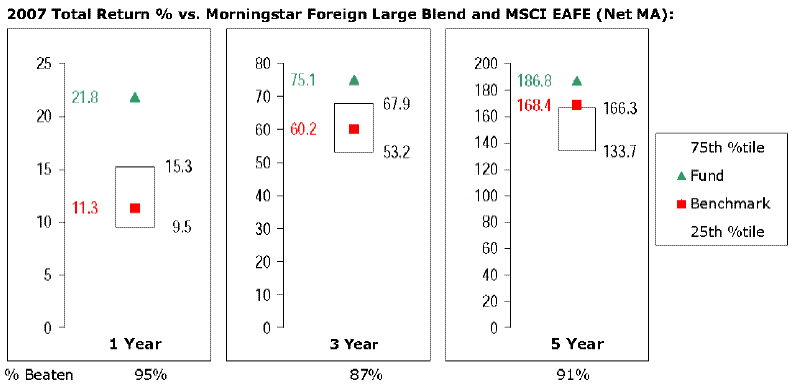
The Board reviewed the fund's relative investment performance against its peer group and stated that the performance of the fund was in the first quartile for all the periods shown. The Board also stated that the investment performance of the fund compared favorably to its benchmark for all periods shown.
Annual Report
Board Approval of Investment Advisory Contracts and Management Fees - continued
Fidelity Worldwide Fund
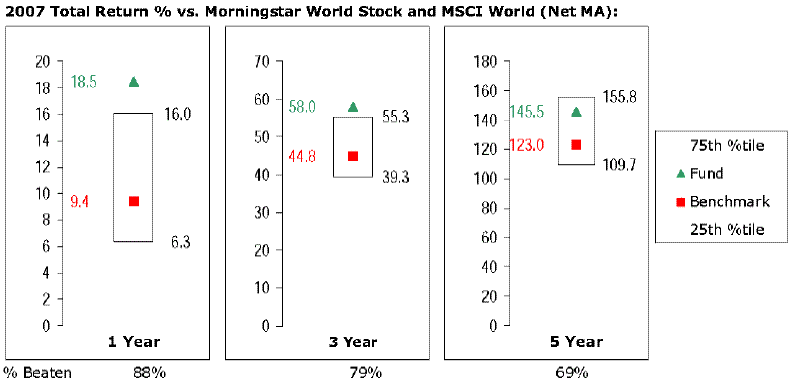
The Board reviewed the fund's relative investment performance against its peer group and stated that the performance of the fund was in the first quartile for the one- and three-year periods and the second quartile for the five-year period. The Board also stated that the investment performance of the fund compared favorably to its benchmark for all the periods shown.
The Board also considered that each fund's management fee is subject to upward or downward adjustment depending upon whether, and to what extent, the fund's investment performance for the performance period exceeds, or is exceeded by, the record (over the same period) of a Board-approved performance adjustment index. The Board realizes that the performance adjustment provides FMR with a strong economic incentive to seek to achieve superior performance for each fund's shareholders and helps to more closely align the interests of FMR and each fund's shareholders.
The Board considered that FMR has taken steps to refocus and strengthen equity research, equity portfolio management, and compliance.
Based on its review, and giving particular weight to the nature and quality of the resources dedicated by the Investment Advisers to maintain and improve relative performance, the Board concluded that the nature, extent, and quality of the services provided to each fund will benefit each fund's shareholders, particularly in light of the Board's view that each fund's shareholders benefit from investing in a fund that is part of a large family of funds offering a variety of investment disciplines and services.
Competitiveness of Management Fee and Total Fund Expenses. The Board considered each fund's management fee and total expenses compared to "mapped groups" of competitive funds and classes. Fidelity creates "mapped groups" by combining similar Lipper investment objective categories that have comparable management fee characteristics. Combining Lipper investment objective categories aids the Board's management fee and total expense comparisons by broadening the competitive group used for comparison and by reducing the number of universes to which various Fidelity funds are compared. The Board also considered supplemental information about how each fund's management fee and total expenses ranked relative to groups based on Lipper classifications, which take into account a fund's market capitalization and style.
The Board considered two proprietary management fee comparisons for the 12-month periods shown in the charts below. The group of Lipper funds used by the Board for management fee comparisons is referred to below as the "Total Mapped Group." The Total Mapped Group comparison focuses on a fund's standing relative to the total universe of comparable funds available to investors, in terms of gross management fees before expense reimbursements or caps, and without giving effect to a fund's performance adjustment (if applicable). "TMG %" represents the percentage of funds in the Total Mapped Group that had management fees that were lower than a fund's. For example, a TMG % of 14% means that 86% of the funds in the Total Mapped Group had higher management fees than a fund. The "Asset-Size Peer Group" (ASPG) comparison focuses on a fund's standing relative to non-Fidelity funds similar in size to the fund within the Total Mapped Group. The ASPG represents at least 15% of the funds in the Total Mapped Group with comparable asset size and management fee characteristics, subject to a minimum of 50 funds (or all funds in the Total Mapped Group if fewer than 50). Additional information, such as the ASPG quartile in which a fund's management fee ranked and the impact of a fund's performance adjustment, is also included in the charts and considered by the Board.
Annual Report
Fidelity Diversified International Fund
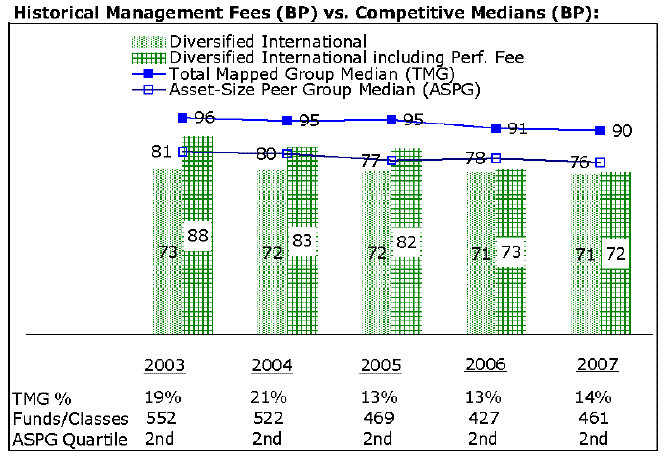
The Board noted that the fund's management fee ranked below the median of its Total Mapped Group and below the median of its ASPG for 2007. The Board also noted the effect of the fund's positive performance adjustment on the fund's management fee ranking. The Board noted that the performance adjustment for each year represents calculations for performance periods that differ from the periods shown in the performance charts above.
In connection with the renewal of the fund's management contract, the Board also approved non-material amendments to the fund's management contract to clarify certain provisions regarding the calculation of the fund's performance adjustment.
Fidelity Aggressive International Fund
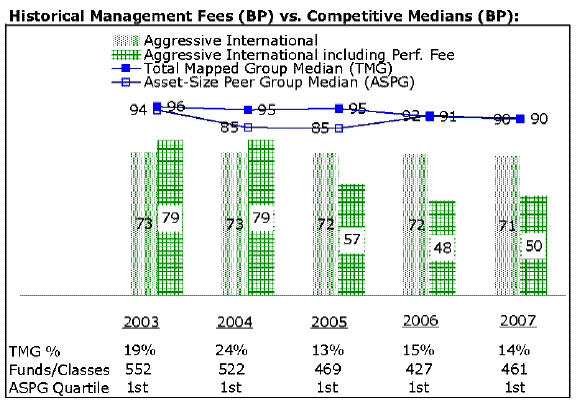
The Board noted that the fund's management fee ranked below the median of its Total Mapped Group and below the median of its ASPG for 2007. The Board also noted the effect of the fund's negative performance adjustment on the fund's management fee ranking. The Board noted that the performance adjustment for each year represents calculations for performance periods that differ from the periods shown in the performance charts above.
Furthermore, the Board considered that shareholders of Aggressive International Fund approved a prospective change in the index used to calculate the fund's performance adjustment, beginning March 1, 2001. The Board also considered that, because the performance adjustment is based on a rolling 36-month measurement period, during a transition period the fund's performance is compared to a blended index return that reflects the performance of the former index for the portion of the measurement period prior to March 1, 2001 and the performance of the current index for the remainder of the measurement period. The Board noted that the fund's performance adjustments for 2003 and 2004 shown in the chart above reflect the effect of using the blended index return to calculate the fund's performance adjustment.
Annual Report
Board Approval of Investment Advisory Contracts and Management Fees - continued
Fidelity Overseas Fund

The Board noted that the fund's management fee ranked below the median of its Total Mapped Group and below the median of its ASPG for 2007. The Board also noted the effect of the fund's positive performance adjustment on the fund's management fee ranking. The Board noted that the performance adjustment for each year represents calculations for performance periods that differ from the periods shown in the performance charts above.
In connection with the renewal of the fund's management contract, the Board also approved non-material amendments to the fund's management contract to clarify certain provisions regarding the calculation of the fund's performance adjustment.
Fidelity Worldwide Fund
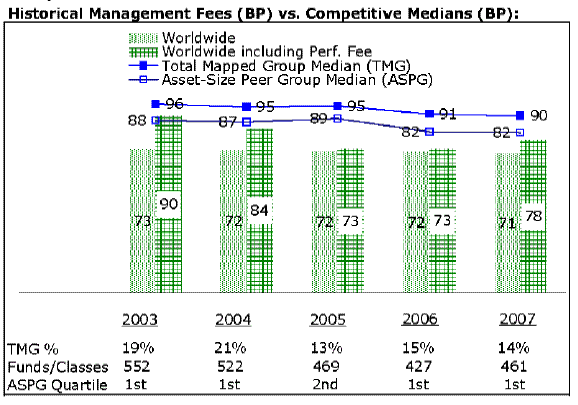
The Board noted that the fund's management fee ranked below the median of its Total Mapped Group and below the median of its ASPG for 2007. The Board also noted the effect of the fund's positive performance adjustment on the fund's management fee ranking. The Board noted that the performance adjustment for each year represents calculations for performance periods that differ from the periods shown in the performance charts above.
Based on its review, the Board concluded that each fund's management fee was fair and reasonable in light of the services that the fund receives and the other factors considered.
In its review of each fund's total expenses, the Board considered the fund's management fee as well as other fund expenses, such as transfer agent fees, pricing and bookkeeping fees, and custodial, legal, and audit fees. The Board also noted the effects of any waivers and reimbursements on fees and expenses, as well as the impact of each fund's performance adjustment. As part of its review, the Board also considered current and historical total expenses of each fund compared to competitive fund median expenses. Each fund is compared to those funds and classes in the Total Mapped Group (used by the Board for management fee comparisons) that have a similar sales load structure.
Annual Report
The Board noted that each fund's total expenses ranked below its competitive median for 2007.
In its review of total expenses, the Board also considered Fidelity fee structures and other information on clients that FMR and its affiliates service in other competitive markets, such as other mutual funds advised or subadvised by FMR or its affiliates, pension plan clients, and other institutional clients.
Based on its review, the Board concluded that each fund's total expenses were reasonable in light of the services that the fund and its shareholders receive and the other factors considered.
Costs of the Services and Profitability. The Board considered the revenues earned and the expenses incurred by Fidelity in conducting the business of developing, marketing, distributing, managing, administering and servicing each fund and its shareholders. The Board also considered the level of Fidelity's profits in respect of all the Fidelity funds.
On an annual basis, FMR presents to the Board Fidelity's profitability for each fund. Fidelity calculates the profitability for each fund, as well as aggregate profitability for groups of Fidelity funds and all Fidelity funds, using a series of detailed revenue and cost allocation methodologies which originate with the audited books and records of Fidelity. The Audit Committee of the Board reviews any significant changes from the prior year's methodologies.
PricewaterhouseCoopers LLP (PwC), independent registered public accounting firm and auditor to Fidelity and certain Fidelity funds, has been engaged annually by the Board as part of the Board's assessment of the results of Fidelity's profitability analysis. PwC's engagement includes the review and assessment of Fidelity's methodologies used in determining the revenues and expenses attributable to Fidelity's mutual fund business, and completion of agreed-upon procedures surrounding the mathematical accuracy of fund profitability and its conformity to allocation methodologies. After considering PwC's reports issued under the engagement and information provided by Fidelity, the Board believes that while other allocation methods may also be reasonable, Fidelity's profitability methodologies are reasonable in all material respects.
The Board has also reviewed Fidelity's non-fund businesses and any fall-out benefits related to the mutual fund business as well as cases where Fidelity's affiliates may benefit from or be related to the funds' business.
The Board considered the costs of the services provided by and the profits realized by Fidelity in connection with the operation of each fund and determined that the amount of profit is a fair entrepreneurial profit for the management of each fund.
Economies of Scale. The Board considered whether there have been economies of scale in respect of the management of the Fidelity funds, whether the Fidelity funds (including each fund) have appropriately benefited from any such economies of scale, and whether there is potential for realization of any further economies of scale. The Board considered the extent to which each fund will benefit from economies of scale through increased services to the fund, through waivers or reimbursements, or through fee or expense reductions.
The Board recognized that each fund's management contract incorporates a "group fee" structure, which provides for lower group fee rates as total fund assets under FMR's management increase, and for higher group fee rates as total fund assets under FMR's management decrease. FMR determines the group fee rates based on a tiered asset "breakpoint" schedule. The Board considered that the group fee is designed to deliver the benefits of economies of scale to fund shareholders when total fund assets increase, even if assets of any particular fund are unchanged or have declined, because some portion of Fidelity's costs are attributable to services provided to all Fidelity funds, and all funds benefit if those costs can be allocated among more assets. The Board also considered that although Diversified International Fund is partially closed to new investors, it continues to incur investment management expenses, and marketing and distribution expenses related to the retention of existing shareholders and assets. The Board further noted that Diversified International Fund may continue to realize benefits from the group fee structure, even though assets may not be expected to grow significantly at the fund level. The Board concluded that, given the group fee structure, fund shareholders will achieve a certain level of economies of scale as assets under FMR's management increase at the fund complex level, regardless of whether Fidelity achieves any such economies of scale.
The Board further concluded that any potential economies of scale are being shared between fund shareholders and Fidelity in an appropriate manner.
Additional Information Requested by the Board. In order to develop fully the factual basis for consideration of the Fidelity funds' Advisory Contracts, the Board requested and received additional information on certain topics, including (i) fund performance trends and actions to be taken by FMR to improve certain funds' overall performance; (ii) portfolio manager changes that have occurred during the past year; (iii) Fidelity's fund profitability methodology, the profitability of certain fund service providers, and profitability trends for certain funds; (iv) Fidelity's compensation structure for portfolio managers and key personnel, including its effects on fund profitability and the extent to which portfolio manager compensation is linked to fund performance; (v) Fidelity's fee structures and rationale for recommending different fees among categories of funds; and (vi) Fidelity's rationale for recommending which funds should have a performance adjustment component as part of their management fees.
Based on its evaluation of all of the conclusions noted above, and after considering all material factors, the Board ultimately concluded that the advisory fee structures are fair and reasonable, and that each fund's Advisory Contracts should be renewed.
Annual Report
Investment Adviser
Fidelity Management & Research Company
Boston, MA
Investment Sub-Advisers
FMR Co., Inc.
Fidelity Management & Research (U.K.) Inc.
Fidelity Research & Analysis Company
FIL Investment Advisors
FIL Investment Advisors (U.K.) Ltd.
Fidelity Investments Japan Limited
Fidelity Management & Research
(Hong Kong) Limited
Fidelity Management & Research
(Japan) Inc.
General Distributor
Fidelity Distributors Corporation
Boston, MA
Transfer and Service Agents
Fidelity Investments Institutional
Operations Company, Inc.
Boston, MA
Fidelity Service Company, Inc.
Boston, MA
Custodian
JPMorgan Chase Bank
New York, NY
Corporate Headquarters
82 Devonshire Street
Boston, MA 02109
1-800-544-8888
The Fidelity Telephone Connection
Mutual Fund 24-Hour Service
Exchanges/Redemptions
and Account Assistance 1-800-544-6666
Product Information 1-800-544-6666
Retirement Accounts 1-800-544-4774
(8 a.m. - 9 p.m.)
TDD Service 1-800-544-0118
for the deaf and hearing impaired
(9 a.m. - 9 p.m. Eastern time)
Fidelity Automated Service
Telephone (FAST®) 1-800-544-5555
Automated line for quickest service

IBD-UANN-1208
1.888175.100
Fidelity
Diversified International
Fund -
Class K
Annual Report
October 31, 2008
(2_fidelity_logos) (Registered_Trademark)
Contents
Chairman's Message | <Click Here> | Ned Johnson's message to shareholders. |
Performance | <Click Here> | How the fund has done over time. |
Management's Discussion | <Click Here> | The manager's review of fund performance, strategy and outlook. |
Shareholder Expense Example | <Click Here> | An example of shareholder expenses. |
Investment Changes | <Click Here> | A summary of major shifts in the fund's investments over the past six months. |
Investments | <Click Here> | A complete list of the fund's investments with their market values. |
Financial Statements | <Click Here> | Statements of assets and liabilities, operations, and changes in net assets, as well as financial highlights. |
Notes | <Click Here> | Notes to the financial statements. |
Report of Independent Registered Public Accounting Firm | <Click Here> | |
Trustees and Officers | <Click Here> | |
Proxy Voting Results | <Click Here> | |
Board Approval of Investment Advisory Contracts and Management Fees | <Click Here> | |
To view a fund's proxy voting guidelines and proxy voting record for the 12-month period ended June 30, visit http://www.fidelity.com (search for "proxy voting guidelines") or visit the Securities and Exchange Commission's (SEC) web site at http://www.sec.gov. You may also call 1-800-544-8544 to request a free copy of the proxy voting guidelines.
Standard & Poor's, S&P and S&P 500 are registered service marks of The McGraw-Hill Companies, Inc. and have been licensed for use by Fidelity Distributors Corporation.
Other third party marks appearing herein are the property of their respective owners.
All other marks appearing herein are registered or unregistered trademarks or service marks of FMR LLC or an affiliated company.
This report and the financial statements contained herein are submitted for the general information of the shareholders of the fund. This report is not authorized for distribution to prospective investors in the fund unless preceded or accompanied by an effective prospectus.
A fund files its complete schedule of portfolio holdings with the SEC for the first and third quarters of each fiscal year on Form N-Q. Forms N-Q are available on the SEC's web site at http://www.sec.gov. A fund's Forms N-Q may be reviewed and copied at the SEC's Public Reference Room in Washington, DC. Information regarding the operation of the SEC's Public Reference Room may be obtained by calling 1-800-SEC-0330. For a complete list of a fund's portfolio holdings, view the most recent holdings listing, semiannual report, or annual report on Fidelity's web site at http://www.fidelity.com or http://www.advisor.fidelity.com, as applicable.
NOT FDIC INSURED · MAY LOSE VALUE · NO BANK GUARANTEE
Neither the fund nor Fidelity Distributors Corporation is a bank.
Annual Report
(photo_of_Edward_C_Johnson_3d)
Dear Shareholder:
Turmoil has been the watchword for the world's securities markets in 2008, with domestic and international stocks down sharply amid the global credit squeeze. A flight to quality boosted returns for U.S. Treasuries, one of the few asset classes with positive results heading into the latter stages of the year. Financial markets are always unpredictable, but there are a number of time-tested principles that can put the historical odds in your favor.
One of the basic tenets is to invest for the long term. Over time, riding out the markets' inevitable ups and downs has proven much more effective than selling into panic or chasing the hottest trend. Even missing only a few of the markets' best days can significantly diminish investor returns. Patience also affords the benefits of compounding - of earning interest on additional income or reinvested dividends and capital gains. There are tax advantages and cost benefits to consider as well. The more you sell, the more taxes you pay, and the more you trade, the higher the costs. While staying the course doesn't eliminate risk, it can considerably lessen the effect of short-term declines.
You can further manage your investing risk through diversification. And today, more than ever, geographic diversification should be taken into account. Studies indicate that asset allocation is the single most important determinant of a portfolio's long-term success. The right mix of stocks, bonds and cash - aligned to your particular risk tolerance and investment objective - is very important. Age-appropriate rebalancing is also an essential aspect of asset allocation. For younger investors, an emphasis on equities - which historically have been the best-performing asset class over time - is encouraged. As investors near their specific goal, such as retirement or sending a child to college, consideration may be given to replacing volatile assets (e.g. common stocks) with more-stable fixed investments (bonds or savings plans).
A third investment principle - investing regularly - can help lower the average cost of your purchases. Investing a certain amount of money each month or quarter helps ensure you won't pay for all your shares at market highs. This strategy - known as dollar cost averaging - also reduces unconstructive "emotion" from investing, helping shareholders avoid selling weak performers just prior to an upswing, or chasing a hot performer just before a correction.
We invite you to contact us via the Internet, through our Investor Centers or over the phone. It is our privilege to provide you the information you need to make the investments that are right for you.
Sincerely,
/s/Edward C. Johnson 3d
Edward C. Johnson 3d
Annual Report
Average annual total return reflects the change in the value of an investment, assuming reinvestment of the class' dividend income and capital gains (the profits earned upon the sale of securities that have grown in value, if any) and assuming a constant rate of performance each year. The $10,000 table and the fund's returns do not reflect the deduction of taxes that a shareholder would pay on fund distributions or the redemption of fund shares. During periods of reimbursement by Fidelity, a fund's total return will be greater than it would be had the reimbursement not occurred. How a fund did yesterday is no guarantee of how it will do tomorrow.
Average Annual Total Returns
Periods ended October 31, 2008 | Past 1
year | Past 5
years | Past 10
years |
Class K A | -47.99% | 3.73% | 6.13% |
A The initial offering of Class K shares took place on May 9, 2008. Returns prior to May 9, 2008 are those of Diversified International, the original class of the fund.
$10,000 Over 10 Years
Let's say hypothetically that $10,000 was invested in Fidelity Diversified International Fund - Class K on October 31, 1998. The chart shows how the value of your investment would have changed, and also shows how the MSCI® Europe, Australasia, and Far East (EAFE®) Index performed over the same period. The initial offering of Class K took place on May 9, 2008. See above for additional information regarding the performance of Class K.
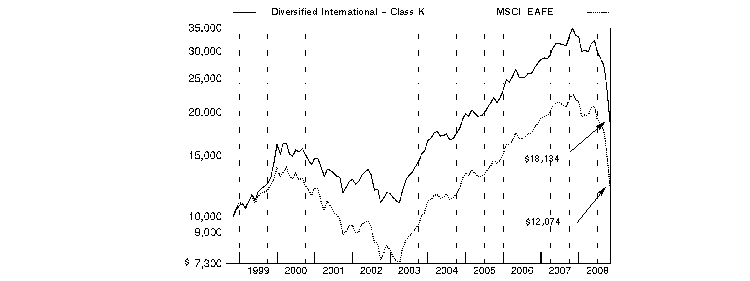
Annual Report
Comments from William Bower, Portfolio Manager of Fidelity® Diversified International Fund
In a dramatic reversal of what had been a multiyear global growth story, international stocks fell long and hard during the 12 months ending October 31, 2008, especially so during the latter stages of the period and mostly as a result of fallout from the financial crisis that emanated from the United States. The viral spread of this financial contagion - which began in the U.S. subprime mortgage market, then seized up the credit markets, hobbled major financial institutions and eventually slowed economic growth worldwide - left virtually no corner of the globe untouched. Developed international equity markets - as gauged by the MSCI® Europe, Australasia, Far East (EAFE®) Index, which monitors established markets outside the U.S. and Canada - fell 46.54%, while the Standard & Poor's 500SM Index, a measure of U.S. stocks, dropped 36.10%. Among countries constituting at least 1% of the EAFE index, Switzerland had the "least worst" showing, falling roughly 32%, followed by Japan, where stocks slid by around 37%. Meanwhile, the weakest overall performance came from Belgium, where stocks slipped by nearly 70%. In the United Kingdom, the largest component of the index, equities were down almost 48%. Emerging markets were the weakest performers among the global economies, declining 56.22% as measured by the MSCI Emerging Markets Index.
For the year, the fund's Class K shares underperformed the MSCI EAFE index. (For specific class-level returns, please see the performance section of this report.) The main detractors were unfavorable security selection in the energy and consumer discretionary groups. On the plus side, positive stock selection and an underweighting in financials helped, as did the fund's modest cash position. Geographically, weak security selection and an underweighting in Japan hurt, as did poor stock selection in Italy, France and the United Kingdom. Overweighting Switzerland and the United States helped, although unfavorable stock selection among U.S. stocks offset most of this benefit. Not owning German automaker and index component Volkswagen was the main detractor, with underperforming holdings of Italian automaker Fiat also a negative. Several underweightings hurt further: Swiss pharmaceutical company Novartis and integrated oil companies Total in France, U.K.-listed Royal Dutch Shell and BP - the latter of which I didn't own at all. A formerly held out-of-benchmark position in U.S. oil refiner and marketer Valero Energy also underperformed. U.K. household and personal products manufacturer Reckitt Benckiser contributed to the fund's relative return, as did two Swiss firms - pharmaceutical companies Roche Holding and Actelion - and U.S.-listed health care equipment/services provider Synthes. Australia-based blood plasma product company CSL Ltd. also helped.
The views expressed above reflect those of the portfolio manager(s) only through the end of the period as stated on the cover of this report and do not necessarily represent the views of Fidelity or any other person in the Fidelity organization. Any such views are subject to change at any time based upon market or other conditions and Fidelity disclaims any responsibility to update such views. These views may not be relied on as investment advice and, because investment decisions for a Fidelity fund are based on numerous factors, may not be relied on as an indication of trading intent on behalf of any Fidelity fund.
Annual Report
Diversified International
Shareholder Expense Example
As a shareholder of the Fund, you incur two types of costs: (1) transaction costs, including redemption fees, and (2) ongoing costs, including management fees and other Fund expenses. This Example is intended to help you understand your ongoing costs (in dollars) of investing in the Fund and to compare these costs with the ongoing costs of investing in other mutual funds.
The actual expense Example is based on an investment of $1,000 invested at the beginning of the period and held for the entire period (May 1, 2008 to October 31, 2008) for Diversified International and for the entire period (May 9, 2008 to October 31, 2008) for Class K. The hypothetical expense Example is based on an investment of $1,000 invested for the one-half year period (May 1, 2008 to October 31, 2008).
Actual Expenses
The first line of the accompanying table for each class of the Fund provides information about actual account values and actual expenses. You may use the information in this line, together with the amount you invested, to estimate the expenses that you paid over the period. Simply divide your account value by $1,000.00 (for example, an $8,600 account value divided by $1,000.00 = 8.6), then multiply the result by the number in the first line for a class of the Fund under the heading entitled "Expenses Paid During Period" to estimate the expenses you paid on your account during this period. A small balance maintenance fee of $12.00 that is charged once a year may apply for certain accounts with a value of less than $2,000. This fee is not included in the table below. If it was, the estimate of expenses you paid during the period would be higher, and your ending account value lower, by this amount. In addition, the Fund, as a shareholder in the underlying Fidelity Central Funds, will indirectly bear its pro rata share of the fees and expenses incurred by the underlying Fidelity Central Funds. These fees and expenses are not included in the Fund's annualized expense ratio used to calculate the expense estimate in the table below.
Hypothetical Example for Comparison Purposes
The second line of the accompanying table for each class of the Fund provides information about hypothetical account values and hypothetical expenses based on a Class' actual expense ratio and an assumed rate of return of 5% per year before expenses, which is not the Class' actual return. The hypothetical account values and expenses may not be used to estimate the actual ending account balance or expenses you paid for the period. You may use this information to compare the ongoing costs of investing in the Fund and other funds. To do so, compare this 5% hypothetical example with the 5% hypothetical examples that appear in the shareholder reports of the other funds. A small balance maintenance fee of $12.00 that is charged once a year may apply for certain accounts with a value of less than $2,000. This fee is not included in the table below. If it was, the estimate of expenses you paid during the period would be higher, and your ending account value lower, by this amount. In addition, the Fund, as a shareholder in the underlying Fidelity Central Funds, will indirectly bear its pro rata share of the fees and expenses incurred by the underlying Fidelity Central Funds. These fees and expenses are not included in the Fund's annualized expense ratio used to calculate the expense estimate in the table below.
Please note that the expenses shown in the table are meant to highlight your ongoing costs only and do not reflect any transaction costs. Therefore, the second line of the table is useful in comparing ongoing costs only, and will not help you determine the relative total costs of owning different funds. In addition, if these transactional costs were included, your costs would have been higher.
| Annualized
Expense Ratio | Beginning
Account Value | Ending
Account Value
October 31, 2008 | Expenses Paid
During Period |
Diversified International | 1.03% | | | |
Actual | | $ 1,000.00 | $ 575.20 | $ 4.08 B |
HypotheticalA | | $ 1,000.00 | $ 1,019.96 | $ 5.23 C |
Class K | .88% | | | |
Actual | | $ 1,000.00 | $ 572.50 | $ 3.33 B |
HypotheticalA | | $ 1,000.00 | $ 1,020.71 | $ 4.47 C |
A 5% return per year before expenses
B Actual expenses are equal to each Class' annualized expense ratio, multiplied by the average account value over the period, multiplied by 184/366 (to reflect the one-half year period) for Diversified International and multiplied by 176/366 (to reflect the period May 9, 2008 to October 31, 2008) for Class K.
C Hypothetical expenses are equal to each Class' annualized expense ratio, multiplied by the average account value over the period, multiplied by 184/366 (to reflect the one-half year period).
Annual Report
Diversified International
Investment Changes (Unaudited)
Geographic Diversification (% of fund's net assets) |
As of October 31, 2008 |
 | United Kingdom | 15.6% | |
 | Switzerland | 12.7% | |
 | United States of America | 12.2% | |
 | Japan | 10.6% | |
 | Germany | 9.7% | |
 | France | 7.1% | |
 | Canada | 6.9% | |
 | Spain | 3.9% | |
 | Australia | 3.1% | |
 | Other | 18.2% | |

Percentages are adjusted for the effect of futures contracts, if applicable. |
|
As of April 30, 2008 |
| United Kingdom | 14.4% | |
| Japan | 10.5% | |
| Germany | 10.5% | |
| United States of America | 9.8% | |
| Switzerland | 9.4% | |
| France | 7.7% | |
| Canada | 7.6% | |
| Spain | 4.0% | |
| Australia | 3.7% | |
| Other | 22.4% | |

Percentages are adjusted for the effect of futures contracts, if applicable. |
Asset Allocation |
| % of fund's
net assets | % of fund's net assets
6 months ago |
Stocks and Investment Companies | 94.1 | 94.0 |
Short-Term Investments and Net Other Assets | 5.9 | 6.0 |
Top Ten Stocks as of October 31, 2008 |
| % of fund's
net assets | % of fund's net assets
6 months ago |
Nestle SA (Reg.) (Switzerland, Food Products) | 2.9 | 1.9 |
E.ON AG (Germany, Electric Utilities) | 2.2 | 2.0 |
Telefonica SA (Spain, Diversified Telecommunication Services) | 2.0 | 1.6 |
Roche Holding AG (participation certificate) (Switzerland, Pharmaceuticals) | 1.8 | 1.4 |
Tesco PLC (United Kingdom, Food & Staples Retailing) | 1.8 | 1.4 |
Reckitt Benckiser Group PLC (United Kingdom, Household Products) | 1.7 | 1.3 |
Vodafone Group PLC sponsored ADR (United Kingdom, Wireless Telecommunication Services) | 1.7 | 1.7 |
Toyota Motor Corp. sponsored ADR (Japan, Automobiles) | 1.5 | 1.1 |
Canadian Natural Resources Ltd. (Canada, Oil, Gas & Consumable Fuels) | 1.3 | 1.1 |
HSBC Holdings PLC sponsored ADR (United Kingdom, Commercial Banks) | 1.3 | 0.6 |
| 18.2 | |
Market Sectors as of October 31, 2008 |
| % of fund's
net assets | % of fund's net assets
6 months ago |
Financials | 17.3 | 17.6 |
Consumer Staples | 13.8 | 9.4 |
Health Care | 13.3 | 7.0 |
Industrials | 11.1 | 12.1 |
Energy | 7.7 | 10.3 |
Information Technology | 7.4 | 8.1 |
Consumer Discretionary | 6.9 | 8.1 |
Telecommunication Services | 5.8 | 6.1 |
Materials | 5.5 | 10.6 |
Utilities | 5.2 | 4.6 |
Annual Report
Diversified International
Investments October 31, 2008
Showing Percentage of Net Assets
Common Stocks - 93.5% |
| Shares | | Value |
Australia - 3.1% |
AMP Ltd. | 8,000,000 | | $ 29,084,972 |
BHP Billiton Ltd. sponsored ADR (d) | 5,600,492 | | 217,747,129 |
Brambles Ltd. | 10,000,000 | | 53,312,487 |
Cochlear Ltd. | 800,000 | | 30,336,825 |
Commonwealth Bank of Australia | 1,500,000 | | 40,982,130 |
Computershare Ltd. | 7,000,000 | | 39,553,770 |
CSL Ltd. | 13,100,000 | | 318,421,605 |
Newcrest Mining Ltd. | 1,991,200 | | 27,357,569 |
QBE Insurance Group Ltd. | 9,000,000 | | 153,468,225 |
TOTAL AUSTRALIA | | 910,264,712 |
Belgium - 0.5% |
InBev SA (d) | 3,337,000 | | 134,591,656 |
KBC Groupe SA | 28,900 | | 1,242,476 |
Nyrstar SA/NV | 2,250,000 | | 6,984,638 |
TOTAL BELGIUM | | 142,818,770 |
Bermuda - 0.3% |
Clear Media Ltd. (a) | 22,325,000 | | 4,036,755 |
Covidien Ltd. | 1,950,000 | | 86,365,500 |
TOTAL BERMUDA | | 90,402,255 |
Brazil - 0.8% |
Banco do Brasil SA | 3,000,000 | | 19,822,567 |
BM&F BOVESPA SA | 3,000,000 | | 7,970,613 |
Cosan SA Industria e Comercio (a) | 3,174,893 | | 15,667,617 |
Petroleo Brasileiro SA - Petrobras sponsored ADR | 565,100 | | 15,195,539 |
Uniao de Bancos Brasileiros SA (Unibanco) GDR | 2,122,000 | | 133,855,760 |
Vivo Participacoes SA sponsored ADR | 2,750,000 | | 30,085,000 |
TOTAL BRAZIL | | 222,597,096 |
Canada - 6.9% |
Agnico-Eagle Mines Ltd. | 896,500 | | 24,728,471 |
Barrick Gold Corp. | 1,286,600 | | 29,406,781 |
Bombardier, Inc. Class B (sub. vtg.) (d) | 14,008,100 | | 54,020,289 |
Canadian Natural Resources Ltd. | 7,550,000 | | 380,818,544 |
Canadian Pacific Railway Ltd. | 2,900,000 | | 131,195,057 |
EnCana Corp. | 5,900,000 | | 299,599,436 |
Flint Energy Services Ltd. (a)(e) | 3,500,000 | | 20,173,329 |
Goldcorp, Inc. | 1,513,100 | | 28,284,354 |
Niko Resources Ltd. (e) | 4,450,000 | | 194,858,186 |
OPTI Canada, Inc. (a) | 2,900,000 | | 7,720,186 |
OZ Optics Ltd. unit (f) | 102,000 | | 1,231,650 |
Petrobank Energy & Resources Ltd. (a)(e) | 4,700,000 | | 89,650,025 |
Potash Corp. of Saskatchewan, Inc. | 350,000 | | 29,841,001 |
Power Corp. of Canada (sub. vtg.) | 3,200,000 | | 69,530,602 |
Research In Motion Ltd. (a) | 3,100,000 | | 156,333,016 |
Rogers Communications, Inc. Class B (non-vtg.) | 2,250,000 | | 65,290,678 |
Shoppers Drug Mart Corp. | 1,200,000 | | 46,176,812 |
Silver Wheaton Corp. (a) | 8,641,000 | | 30,098,026 |
SNC-Lavalin Group, Inc. | 3,000,000 | | 78,794,162 |
|
| Shares | | Value |
Suncor Energy, Inc. | 4,899,500 | | $ 117,631,883 |
Talisman Energy, Inc. | 1,000,000 | | 9,877,260 |
Trican Well Service Ltd. (e) | 7,425,000 | | 69,582,435 |
Ultra Petroleum Corp. (a) | 1,000,000 | | 46,550,000 |
Westernzagros Resources Ltd. (a) | 7,000,000 | | 4,295,903 |
Yamana Gold, Inc. | 2,945,900 | | 14,047,873 |
TOTAL CANADA | | 1,999,735,959 |
Cayman Islands - 0.6% |
China Medical Technologies, Inc. sponsored ADR (d) | 300,000 | | 7,311,000 |
Transocean, Inc. (a) | 2,050,220 | | 168,794,613 |
TOTAL CAYMAN ISLANDS | | 176,105,613 |
China - 0.3% |
China Coal Energy Co. Ltd. (H Shares) | 20,000,000 | | 12,130,021 |
China Shenhua Energy Co. Ltd. (H Shares) | 10,000,000 | | 18,985,682 |
Focus Media Holding Ltd. ADR (a)(d) | 2,300,000 | | 42,619,000 |
Global Bio-Chem Technology Group Co. Ltd. | 38,331,600 | | 5,342,193 |
Industrial & Commercial Bank of China | 25,000,000 | | 11,762,937 |
TOTAL CHINA | | 90,839,833 |
Czech Republic - 0.1% |
Ceske Energeticke Zavody AS | 900,000 | | 38,946,333 |
Denmark - 0.6% |
Carlsberg AS Series B | 1,891,300 | | 74,457,089 |
Genmab AS (a) | 400,000 | | 18,065,168 |
Novo Nordisk AS Series B | 745,800 | | 39,976,904 |
Novozymes AS Series B | 600,000 | | 42,357,242 |
TOTAL DENMARK | | 174,856,403 |
Finland - 0.5% |
Nokia Corp. sponsored ADR | 10,323,000 | | 156,703,140 |
France - 7.1% |
Alstom SA | 1,899,600 | | 94,151,152 |
AXA SA sponsored ADR (d) | 8,700,000 | | 162,777,000 |
bioMerieux SA | 300,000 | | 24,358,086 |
BNP Paribas SA | 2,415,700 | | 174,416,677 |
Bouygues SA | 2,600,000 | | 110,708,740 |
Cap Gemini SA | 7,000,000 | | 225,538,095 |
CNP Assurances | 400,000 | | 32,231,166 |
Compagnie Generale de Geophysique SA (a) | 759,173 | | 12,275,378 |
Credit Agricole SA | 3,975,600 | | 57,515,042 |
Dassault Aviation SA (d) | 36,265 | | 20,173,856 |
Electricite de France | 850,000 | | 51,070,982 |
Essilor International SA | 2,500,000 | | 112,144,620 |
Financiere Marc de Lacharriere SA (Fimalac) (d) | 1,400,000 | | 60,897,018 |
GDF Suez | 2,861,123 | | 127,890,952 |
Groupe Danone | 1,399,550 | | 77,928,157 |
Common Stocks - continued |
| Shares | | Value |
France - continued |
Ipsen SA | 500,000 | | $ 19,004,981 |
L'Air Liquide SA | 24,650 | | 2,127,174 |
LVMH Moet Hennessy - Louis Vuitton | 1,050,000 | | 69,871,157 |
Neopost SA | 700,000 | | 58,605,722 |
Nexans SA | 500,406 | | 28,543,114 |
Pernod Ricard SA | 3,050,000 | | 198,611,986 |
Pinault Printemps-Redoute SA | 800,000 | | 50,984,351 |
Renault SA | 917,400 | | 28,116,280 |
Sanofi-Aventis | 1,000,000 | | 63,357,107 |
Societe Generale Series A | 1,524,700 | | 83,103,782 |
Total SA Series B | 688,300 | | 37,865,747 |
Veolia Environnement | 750,000 | | 18,586,211 |
VINCI SA | 2,000,000 | | 71,974,700 |
TOTAL FRANCE | | 2,074,829,233 |
Germany - 9.5% |
Adidas-Salomon AG | 3,442,100 | | 122,226,981 |
Allianz AG: | | | |
(Reg.) | 17,300 | | 1,294,676 |
sponsored ADR | 22,000,000 | | 166,760,000 |
BASF AG | 800,000 | | 26,900,999 |
Bayer AG | 6,538,510 | | 363,996,844 |
Bayerische Motoren Werke AG (BMW) | 1,680,600 | | 43,603,544 |
Deutsche Boerse AG | 800,000 | | 63,965,973 |
Deutsche Telekom AG (Reg.) | 127,600 | | 1,905,885 |
E.ON AG | 16,662,540 | | 637,455,308 |
Fresenius AG | 2,727,400 | | 161,824,419 |
Fresenius Medical Care AG | 23,100 | | 1,050,586 |
GEA Group AG | 4,500,000 | | 65,762,727 |
GFK AG | 1,600,000 | | 31,596,033 |
K&S AG | 1,100,000 | | 43,529,676 |
Linde AG | 3,120,086 | | 262,030,382 |
Muenchener Rueckversicherungs-Gesellschaft AG (Reg.) | 1,500,000 | | 199,087,514 |
Q-Cells AG (a) | 1,000,000 | | 39,340,260 |
RWE AG | 2,629,500 | | 219,744,769 |
Siemens AG sponsored ADR (d) | 4,850,300 | | 291,745,545 |
SolarWorld AG | 1,000,000 | | 25,203,564 |
Symrise AG | 500,000 | | 6,210,602 |
TOTAL GERMANY | | 2,775,236,287 |
Greece - 0.0% |
Public Power Corp. of Greece | 819,655 | | 10,135,170 |
Hong Kong - 1.0% |
China Mobile (Hong Kong) Ltd. sponsored ADR (d) | 3,450,000 | | 151,420,500 |
Esprit Holdings Ltd. | 10,000,000 | | 56,820,610 |
Hutchison Whampoa Ltd. | 5,000,000 | | 26,700,000 |
Sun Hung Kai Properties Ltd. | 5,500,000 | | 48,185,758 |
TOTAL HONG KONG | | 283,126,868 |
|
| Shares | | Value |
India - 2.4% |
Bharti Airtel Ltd. (a) | 1,700,000 | | $ 23,018,326 |
HDFC Bank Ltd. | 300,000 | | 6,393,535 |
Infosys Technologies Ltd. | 6,000,000 | | 174,896,185 |
Infosys Technologies Ltd. sponsored ADR | 3,200,000 | | 93,824,000 |
Reliance Industries Ltd. | 5,500,000 | | 156,337,837 |
Satyam Computer Services Ltd. | 23,000,000 | | 145,412,165 |
State Bank of India | 4,000,000 | | 94,272,046 |
Union Bank of India | 1,500,000 | | 3,954,228 |
TOTAL INDIA | | 698,108,322 |
Indonesia - 0.4% |
PT Bumi Resources Tbk | 120,000,000 | | 15,711,180 |
PT Indosat Tbk sponsored ADR | 3,400,000 | | 82,586,000 |
PT Perusahaan Gas Negara Tbk
Series B | 130,000,000 | | 16,522,626 |
TOTAL INDONESIA | | 114,819,806 |
Ireland - 0.8% |
Anglo Irish Bank Corp. PLC | 2,000,000 | | 6,498,081 |
CRH PLC | 4,500,000 | | 99,745,942 |
Ryanair Holdings PLC sponsored ADR (a)(d) | 6,225,000 | | 138,630,750 |
TOTAL IRELAND | | 244,874,773 |
Italy - 2.1% |
A2A SpA | 10,000,000 | | 18,226,217 |
ENI SpA | 112,800 | | 2,692,327 |
Fiat SpA | 20,938,300 | | 166,412,412 |
Impregilo SpA (a) | 8,000,000 | | 21,102,917 |
Intesa Sanpaolo SpA | 69,738,492 | | 255,100,590 |
Prysmian SpA | 2,000,000 | | 24,262,115 |
UniCredit SpA | 50,000,000 | | 122,336,229 |
TOTAL ITALY | | 610,132,807 |
Japan - 10.6% |
Asahi Glass Co. Ltd. | 4,000,000 | | 25,133,822 |
Canon, Inc. sponsored ADR (d) | 8,500,000 | | 291,295,000 |
Daiwa Securities Group, Inc. | 9,000,000 | | 50,879,146 |
East Japan Railway Co. | 5,000 | | 35,578,206 |
Fanuc Ltd. | 1,700,000 | | 113,262,968 |
Honda Motor Co. Ltd. | 1,600,000 | | 39,782,613 |
Hoya Corp. | 999,500 | | 18,249,758 |
Japan Tobacco, Inc. | 61,556 | | 218,369,569 |
JSR Corp. | 4,000,000 | | 45,117,161 |
Keyence Corp. | 920,000 | | 176,291,753 |
Konica Minolta Holdings, Inc. | 5,250,000 | | 34,476,605 |
Kubota Corp. | 8,000,000 | | 40,152,787 |
Mitsubishi Corp. | 8,500,000 | | 142,468,506 |
Mitsubishi Estate Co. Ltd. | 3,500,000 | | 62,518,550 |
Mitsubishi UFJ Financial Group, Inc. | 30,000,000 | | 188,515,602 |
Mitsui & Co. Ltd. | 13,750,000 | | 133,223,961 |
Mitsui Fudosan Co. Ltd. | 2,500,000 | | 43,605,958 |
Mizuho Financial Group, Inc. | 100 | | 244,168 |
Common Stocks - continued |
| Shares | | Value |
Japan - continued |
Mori Seiki Co. Ltd. (d) | 2,000,000 | | $ 17,262,594 |
NGK Insulators Ltd. | 3,000,000 | | 31,158,407 |
Nikon Corp. | 4,300,000 | | 60,597,431 |
Nintendo Co. Ltd. | 310,000 | | 96,719,996 |
Nomura Holdings, Inc. | 13,000,000 | | 123,160,107 |
ORIX Corp. | 1,790,000 | | 183,900,827 |
Sony Corp. | 2,500,000 | | 59,247,868 |
Sony Financial Holdings, Inc. | 38,379 | | 124,812,902 |
Sumitomo Metal Industries Ltd. | 10,000,000 | | 25,718,083 |
Sumitomo Mitsui Financial Group, Inc. | 42,150 | | 168,965,088 |
Sumitomo Trust & Banking Co. Ltd. | 9,000,000 | | 41,677,592 |
Tokai Carbon Co. Ltd. (d) | 6,000,000 | | 31,458,345 |
Tokuyama Corp. | 6,000,000 | | 30,383,455 |
Toyota Motor Corp. sponsored ADR (d) | 5,899,957 | | 448,927,728 |
TOTAL JAPAN | | 3,103,156,556 |
Korea (South) - 1.5% |
Amorepacific Corp. | 139,531 | | 61,518,420 |
LG Household & Health Care Ltd. | 389,650 | | 55,834,965 |
NHN Corp. (a) | 1,200,000 | | 128,101,379 |
Samsung Electronics Co. Ltd. | 310,000 | | 131,098,303 |
Shinhan Financial Group Co. Ltd. | 2,200,000 | | 53,687,691 |
TOTAL KOREA (SOUTH) | | 430,240,758 |
Luxembourg - 0.6% |
ArcelorMittal SA (NY Shares) Class A (d) | 1,250,000 | | 32,812,500 |
Reinet Investments SCA (a) | 273,775 | | 2,853,268 |
Reinet Investments SCA (a) | 1,726,225 | | 33,515,472 |
SES SA FDR (France) unit | 5,916,322 | | 106,432,112 |
TOTAL LUXEMBOURG | | 175,613,352 |
Malaysia - 0.1% |
DiGi.com Bhd | 6,500,000 | | 33,818,599 |
KNM Group Bhd | 18,750,000 | | 3,179,368 |
TOTAL MALAYSIA | | 36,997,967 |
Mexico - 0.6% |
America Movil SAB de CV Series L sponsored ADR | 3,825,000 | | 118,345,500 |
Grupo Televisa SA de CV (CPO) sponsored ADR | 3,700,000 | | 65,342,000 |
TOTAL MEXICO | | 183,687,500 |
Netherlands - 1.9% |
Gemalto NV (a) | 300,000 | | 8,405,181 |
Heineken NV (Bearer) | 2,900,000 | | 97,826,318 |
ING Groep NV sponsored ADR (d) | 3,000,000 | | 27,930,000 |
Koninklijke KPN NV | 8,236,900 | | 116,001,840 |
Unilever NV (Certificaten Van Aandelen) | 11,900,000 | | 286,783,766 |
TOTAL NETHERLANDS | | 536,947,105 |
Netherlands Antilles - 0.6% |
Schlumberger Ltd. (NY Shares) | 3,240,200 | | 167,356,330 |
|
| Shares | | Value |
Norway - 0.5% |
Orkla ASA (A Shares) | 4,472,494 | | $ 29,774,356 |
Petroleum Geo-Services ASA (a) | 5,500,250 | | 27,387,993 |
Pronova BioPharma ASA | 12,999,500 | | 33,771,424 |
Renewable Energy Corp. AS (a) | 4,700,000 | | 44,343,736 |
TOTAL NORWAY | | 135,277,509 |
Panama - 0.1% |
McDermott International, Inc. (a) | 1,000,000 | | 17,130,000 |
Papua New Guinea - 0.3% |
Lihir Gold Ltd. (a) | 68,988,224 | | 86,036,634 |
Russia - 0.4% |
OAO Gazprom sponsored ADR | 5,100,000 | | 104,295,000 |
Vimpel Communications sponsored ADR | 1,000,000 | | 14,500,000 |
TOTAL RUSSIA | | 118,795,000 |
South Africa - 0.2% |
Impala Platinum Holdings Ltd. | 5,400,000 | | 55,768,679 |
MTN Group Ltd. | 1,000,000 | | 11,156,602 |
TOTAL SOUTH AFRICA | | 66,925,281 |
Spain - 3.9% |
Banco Bilbao Vizcaya Argentaria SA sponsored ADR (d) | 7,900,000 | | 91,640,000 |
Banco Santander SA sponsored ADR (d) | 10,250,000 | | 110,085,000 |
Enagas SA | 5,000,649 | | 97,700,756 |
Grifols SA | 1,300,000 | | 25,871,024 |
Inditex SA | 4,750,000 | | 160,561,654 |
Red Electrica Corporacion SA | 1,700,000 | | 74,513,108 |
Repsol YPF SA | 13,200 | | 251,010 |
Telefonica SA | 31,088,200 | | 575,596,054 |
TOTAL SPAIN | | 1,136,218,606 |
Sweden - 0.3% |
Assa Abloy AB (B Shares) (d) | 3,259,600 | | 36,385,251 |
Getinge AB (B Shares) | 1,500,000 | | 20,975,177 |
H&M Hennes & Mauritz AB (B Shares) | 34,000 | | 1,218,985 |
Svenska Cellulosa AB (SCA) (B Shares) | 4,999,600 | | 36,911,907 |
TOTAL SWEDEN | | 95,491,320 |
Switzerland - 12.7% |
ABB Ltd. (Reg.) | 10,911,330 | | 143,137,874 |
Actelion Ltd. (Reg.) (a) | 4,323,540 | | 228,354,079 |
Alcon, Inc. | 1,950,000 | | 171,834,000 |
ARYZTA AG (a) | 2,000,000 | | 71,541,015 |
Compagnie Financiere Richemont
Series A | 1,500,000 | | 31,905,548 |
Credit Suisse Group sponsored ADR | 3,700,000 | | 138,380,000 |
Credit Suisse Group (Reg.) | 60,094 | | 2,246,663 |
EFG International | 500,000 | | 10,761,489 |
Julius Baer Holding AG | 5,934,441 | | 232,047,347 |
Kuehne & Nagel International AG | 1,300,000 | | 78,692,398 |
Nestle SA (Reg.) | 21,707,621 | | 843,962,154 |
Common Stocks - continued |
| Shares | | Value |
Switzerland - continued |
Nobel Biocare Holding AG (Switzerland) | 550,000 | | $ 9,446,245 |
Novartis AG: | | | |
(Reg.) | 87,694 | | 4,450,214 |
sponsored ADR | 6,450,000 | | 328,885,500 |
Roche Holding AG (participation certificate) | 3,419,834 | | 522,871,714 |
Schindler Holding AG (Reg.) | 1,400,000 | | 64,081,709 |
SGS Societe Generale de Surveillance Holding SA (Reg.) | 195,000 | | 191,943,679 |
Sonova Holding AG | 2,500,000 | | 103,854,018 |
Sulzer AG (Reg.) | 885,300 | | 52,256,739 |
Syngenta AG sponsored ADR | 2,750,000 | | 102,795,000 |
Tecan Group AG (e) | 1,100,000 | | 49,374,624 |
UBS AG: | | | |
(For. Reg.) | 120,703 | | 2,047,560 |
(NY Shares) | 5,250,000 | | 88,725,000 |
Zurich Financial Services AG (Reg.) | 1,207,564 | | 244,934,936 |
TOTAL SWITZERLAND | | 3,718,529,505 |
Taiwan - 0.3% |
Hon Hai Precision Industry Co. Ltd. (Foxconn) | 34,500,000 | | 83,674,398 |
Turkey - 0.1% |
Tupras-Turkiye Petrol Rafinerileri AS | 1,000,000 | | 12,633,216 |
United Kingdom - 15.6% |
Aegis Group PLC | 9,000,000 | | 9,483,855 |
Anglo American PLC (United Kingdom) | 1,400,000 | | 35,123,433 |
BAE Systems PLC | 11,293,800 | | 63,474,199 |
Barclays PLC | 5,000,000 | | 14,331,143 |
Bellway PLC | 2,450,000 | | 21,341,216 |
BG Group PLC | 6,000,000 | | 88,212,810 |
BHP Billiton PLC | 4,000,000 | | 67,913,786 |
Bovis Homes Group PLC (d)(e) | 6,750,000 | | 36,892,190 |
British American Tobacco PLC: | | | |
(United Kingdom) | 82,200 | | 2,254,411 |
sponsored ADR | 4,830,000 | | 262,558,800 |
British Sky Broadcasting Group PLC (BSkyB) | 2,500,000 | | 15,211,529 |
Cadbury PLC | 5,920,000 | | 54,352,020 |
Capita Group PLC | 24,346,451 | | 251,540,397 |
Centrica PLC | 2,500,000 | | 12,283,034 |
Diageo PLC | 113,400 | | 1,730,329 |
easyJet PLC (a)(e) | 30,000,000 | | 149,638,996 |
European Capital Ltd. (e) | 5,819,600 | | 13,349,451 |
Experian PLC | 15,000,000 | | 82,714,389 |
GlaxoSmithKline PLC | 6,500,000 | | 124,940,300 |
HBOS PLC | 23,999,905 | | 39,293,271 |
HSBC Holdings PLC: | | | |
(United Kingdom) (Reg.) | 401,671 | | 4,756,891 |
sponsored ADR (d) | 6,225,600 | | 367,310,400 |
Imperial Tobacco Group PLC | 5,125,900 | | 137,364,970 |
|
| Shares | | Value |
Inchcape PLC | 10,679,000 | | $ 13,614,756 |
Informa PLC (e) | 27,000,000 | | 91,463,882 |
International Power PLC | 22,504,800 | | 80,501,030 |
Lloyds TSB Group PLC | 20,200,000 | | 65,280,490 |
Man Group PLC | 20,000,000 | | 115,455,376 |
Misys PLC | 15,000,355 | | 26,856,259 |
National Grid PLC | 9,251,300 | | 104,204,102 |
NEXT PLC | 700,000 | | 11,896,434 |
Pearson PLC | 8,100,000 | | 80,668,610 |
Persimmon PLC (d) | 4,200,000 | | 20,330,635 |
Prudential PLC | 13,000,000 | | 65,295,341 |
Reckitt Benckiser Group PLC | 12,050,400 | | 509,666,692 |
Redrow PLC (d) | 4,650,000 | | 15,550,255 |
Rio Tinto PLC sponsored ADR | 900,000 | | 167,283,000 |
Royal Bank of Scotland Group PLC | 40,487,500 | | 44,592,148 |
Royal Dutch Shell PLC: | | | |
Class A sponsored ADR | 200,000 | | 11,162,000 |
Class B | 192,300 | | 5,212,949 |
Class B ADR | 900,000 | | 49,761,000 |
Smith & Nephew PLC | 5,440,500 | | 49,808,900 |
SSL International PLC | 1,500,000 | | 10,129,535 |
Standard Chartered PLC (United Kingdom) | 5,700,300 | | 94,197,397 |
Tesco PLC | 94,500,000 | | 517,712,135 |
Vodafone Group PLC sponsored ADR | 25,800,000 | | 497,166,000 |
Wolseley PLC | 197,000 | | 1,077,977 |
WPP Group PLC | 10,000,000 | | 59,810,150 |
TOTAL UNITED KINGDOM | | 4,564,768,873 |
United States of America - 6.2% |
Allergan, Inc. | 3,350,000 | | 132,894,500 |
Anheuser-Busch Companies, Inc. | 1,400,000 | | 86,842,000 |
Bank of America Corp. | 2,500,000 | | 60,425,000 |
Bank of New York Mellon Corp. | 1,350,000 | | 44,010,000 |
Baxter International, Inc. | 550,000 | | 33,269,500 |
C.R. Bard, Inc. | 900,000 | | 79,425,000 |
Flowserve Corp. | 1,700,000 | | 96,764,000 |
Genentech, Inc. (a) | 3,260,000 | | 270,384,400 |
Goldman Sachs Group, Inc. | 716,791 | | 66,303,168 |
Google, Inc. Class A (sub. vtg.) (a) | 172,645 | | 62,041,707 |
Henry Schein, Inc. (a) | 1,050,000 | | 49,150,500 |
Hess Corp. | 1,048,600 | | 63,136,206 |
JPMorgan Chase & Co. | 400,000 | | 16,500,000 |
Peabody Energy Corp. | 1,609,700 | | 55,550,747 |
Philip Morris International, Inc. | 4,000,000 | | 173,880,000 |
PNC Financial Services Group, Inc. | 874,100 | | 58,276,247 |
Stryker Corp. | 2,175,000 | | 116,275,500 |
Synthes, Inc. | 1,812,274 | | 233,809,846 |
Common Stocks - continued |
| Shares | | Value |
United States of America - continued |
Titanium Metals Corp. (d) | 3,042,409 | | $ 28,324,828 |
Visa, Inc. | 1,700,000 | | 94,095,000 |
TOTAL UNITED STATES OF AMERICA | | 1,821,358,149 |
TOTAL COMMON STOCKS (Cost $34,352,246,805) | 27,305,371,439 |
Preferred Stocks - 0.5% |
| | | |
Convertible Preferred Stocks - 0.0% |
Canada - 0.0% |
MetroPhotonics, Inc. Series 2 (a)(f) | 198,000 | | 2 |
Nonconvertible Preferred Stocks - 0.5% |
Germany - 0.2% |
Porsche Automobil Holding SE | 691,520 | | 61,892,642 |
Italy - 0.3% |
Fiat SpA | 2,000,000 | | 8,914,020 |
Intesa Sanpaolo SpA | 22,000,000 | | 65,298,874 |
TOTAL ITALY | | 74,212,894 |
TOTAL NONCONVERTIBLE PREFERRED STOCKS | | 136,105,536 |
TOTAL PREFERRED STOCKS (Cost $227,801,440) | 136,105,538 |
Investment Companies - 0.1% |
| | | |
United States of America - 0.1% |
United States Natural Gas Fund LP ETF (a)
(Cost $30,527,796) | 1,000,000 | | 28,790,000 |
Government Obligations - 0.0% |
| Principal Amount | | |
United States of America - 0.0% |
U.S. Treasury Bills, yield at date of purchase 0.6% to 1.68% 12/4/08 to 1/2/09
(Cost $6,654,775) | | $ 6,665,000 | | 6,662,939 |
Money Market Funds - 5.9% |
| Shares | | Value |
Fidelity Cash Central Fund, 1.81% (b) | 1,350,032,331 | | $ 1,350,032,331 |
Fidelity Securities Lending Cash Central Fund, 2.67% (b)(c) | 383,400,911 | | 383,400,911 |
TOTAL MONEY MARKET FUNDS (Cost $1,733,433,242) | 1,733,433,242 |
TOTAL INVESTMENT PORTFOLIO - 100.0% (Cost $36,350,664,058) | 29,210,363,158 |
NET OTHER ASSETS - 0.0% | | (3,127,172) |
NET ASSETS - 100% | $ 29,207,235,986 |
Forward Foreign Currency Contracts |
| Settlement Dates | | Value | | Unrealized Appreciation/
(Depreciation) |
Contracts to Buy |
65,370,118,500 JPY | Nov. 2008 | | $ 664,206,163 | | $ 49,526,241 |
(Payable Amount $614,679,922) |
|
The value of contracts to buy as a percentage of net assets - 2.3% |
Currency Abbreviation |
JPY | - | Japanese yen |
Legend |
(a) Non-income producing |
(b) Affiliated fund that is available only to investment companies and other accounts managed by Fidelity Investments. The rate quoted is the annualized seven-day yield of the fund at period end. A complete unaudited listing of the fund's holdings as of its most recent quarter end is available upon request. |
(c) Investment made with cash collateral received from securities on loan. |
(d) Security or a portion of the security is on loan at period end. |
(e) Affiliated company |
(f) Restricted securities - Investment in securities not registered under the Securities Act of 1933 (excluding 144A issues). At the end of the period, the value of restricted securities (excluding 144A issues) amounted to $1,231,652 or 0.0% of net assets. |
Additional information on each holding is as follows: |
Security | Acquisition Date | Acquisition Cost |
MetroPhotonics, Inc. Series 2 | 9/29/00 | $ 1,980,000 |
OZ Optics Ltd. unit | 8/18/00 | $ 1,505,520 |
Affiliated Central Funds |
Information regarding fiscal year to date income earned by the Fund from investments in Fidelity Central Funds is as follows: |
Fund | Income earned |
Fidelity Cash Central Fund | $ 77,119,703 |
Fidelity Securities Lending Cash Central Fund | 41,104,703 |
Total | $ 118,224,406 |
Other Affiliated Issuers |
An affiliated company is a company in which the fund has ownership of at least 5% of the voting securities. Fiscal year to date transactions with companies which are or were affiliates are as follows: |
Affiliates | Value,
beginning of period | Purchases | Sales
Proceeds | Dividend
Income | Value,
end of
period |
Bovis Homes Group PLC | $ - | $ 78,498,961 | $ 4,186,769 | $ 1,677,491 | $ 36,892,190 |
easyJet PLC | 124,061,753 | 190,785,609 | 6,068,257 | - | 149,638,996 |
European Capital Ltd. | 69,643,666 | - | - | 5,261,084 | 13,349,451 |
Flint Energy Services Ltd. | 64,419,614 | 19,408,647 | - | - | 20,173,329 |
Informa PLC | 177,966,681 | 81,690,889 | - | 8,504,064 | 91,463,882 |
Niko Resources Ltd. | 437,004,872 | 42,997,397 | - | 411,062 | 194,858,186 |
Petrobank Energy & Resources Ltd. | - | 220,690,532 | - | - | 89,650,025 |
Tecan Group AG | 73,599,240 | - | - | 889,931 | 49,374,624 |
Trican Well Service Ltd. | 84,727,812 | 56,858,142 | - | 586,271 | 69,582,435 |
United States Natural Gas Fund LP ETF | - | 96,039,648 | 69,817,871 | - | - |
Total | $ 1,031,423,638 | $ 786,969,825 | $ 80,072,897 | $ 17,329,903 | $ 714,983,118 |
Income Tax Information |
At October 31, 2008, the Fund had a capital loss carryforward of approximately $956,782,987 all of which will expire on October 31, 2016. |
See accompanying notes which are an integral part of the financial statements.
Annual Report
Diversified International
Financial Statements
Statement of Assets and Liabilities
| October 31, 2008 |
| | |
Assets | | |
Investment in securities, at value (including securities loaned of $376,254,296) - See accompanying schedule: Unaffiliated issuers (cost $33,176,706,808) | $ 26,761,946,798 | |
Fidelity Central Funds (cost $1,733,433,242) | 1,733,433,242 | |
Other affiliated issuers (cost $1,440,524,008) | 714,983,118 | |
Total Investments (cost $36,350,664,058) | | $ 29,210,363,158 |
Foreign currency held at value (cost $2,238) | | 2,455 |
Receivable for investments sold | | 291,404,619 |
Unrealized appreciation on foreign currency contracts | | 49,526,241 |
Receivable for closed foreign currency contracts | | 29,679,922 |
Receivable for fund shares sold | | 55,827,005 |
Dividends receivable | | 65,420,521 |
Distributions receivable from Fidelity Central Funds | | 2,087,716 |
Prepaid expenses | | 14,792 |
Other receivables | | 2,060,604 |
Total assets | | 29,706,387,033 |
| | |
Liabilities | | |
Payable to custodian bank | $ 291,338 | |
Payable for investments purchased | 62,646,341 | |
Payable for fund shares redeemed | 24,731,658 | |
Accrued management fee | 17,184,851 | |
Other affiliated payables | 8,316,159 | |
Other payables and accrued expenses | 2,579,789 | |
Collateral on securities loaned, at value | 383,400,911 | |
Total liabilities | | 499,151,047 |
| | |
Net Assets | | $ 29,207,235,986 |
Net Assets consist of: | | |
Paid in capital | | $ 37,047,989,511 |
Undistributed net investment income | | 552,385,607 |
Accumulated undistributed net realized gain (loss) on investments and foreign currency transactions | | (1,299,616,688) |
Net unrealized appreciation (depreciation) on investments and assets and liabilities in foreign currencies | | (7,093,522,444) |
Net Assets | | $ 29,207,235,986 |
Diversified International:
Net Asset Value, offering price and redemption price per share ($28,274,960,980 ÷ 1,287,814,073 shares) | | $ 21.96 |
| | |
Class K:
Net Asset Value, offering price and redemption price per share ($932,275,006 ÷ 42,419,202 shares) | | $ 21.98 |
Statement of Operations
| Year ended October 31, 2008 |
| | |
Investment Income | | |
Dividends (including $17,329,903 earned from other affiliated issuers) | | $ 1,245,912,229 |
Interest | | 527,904 |
Income from Fidelity Central Funds | | 118,224,406 |
| | 1,364,664,539 |
Less foreign taxes withheld | | (110,978,803) |
Total income | | 1,253,685,736 |
| | |
Expenses | | |
Management fee
Basic fee | $ 348,107,076 | |
Performance adjustment | 34,025,276 | |
Transfer agent fees | 107,838,956 | |
Accounting and security lending fees | 2,991,396 | |
Custodian fees and expenses | 9,470,095 | |
Independent trustees' compensation | 220,104 | |
Depreciation in deferred trustee compensation account | (287) | |
Registration fees | 467,213 | |
Audit | 252,296 | |
Legal | 261,150 | |
Miscellaneous | 5,619,033 | |
Total expenses before reductions | 509,252,308 | |
Expense reductions | (8,163,778) | 501,088,530 |
Net investment income (loss) | | 752,597,206 |
Realized and Unrealized Gain (Loss) Net realized gain (loss) on: | | |
Investment securities: | | |
Unaffiliated issuers (net of foreign taxes of $5,800,092) | (1,165,122,340) | |
Other affiliated issuers | (1,006,620) | |
Foreign currency transactions | (21,201,137) | |
Futures contracts | (35,266,379) | |
Total net realized gain (loss) | | (1,222,596,476) |
Change in net unrealized appreciation (depreciation) on: Investment securities (net of decrease in deferred foreign taxes of $12,720,916) | (27,575,257,303) | |
Assets and liabilities in foreign currencies | 34,073,636 | |
Total change in net unrealized appreciation (depreciation) | | (27,541,183,667) |
Net gain (loss) | | (28,763,780,143) |
Net increase (decrease) in net assets resulting from operations | | $ (28,011,182,937) |
See accompanying notes which are an integral part of the financial statements.
Annual Report
Statement of Changes in Net Assets
| Year ended
October 31,
2008 | Year ended
October 31,
2007 |
Increase (Decrease) in Net Assets | | |
Operations | | |
Net investment income (loss) | $ 752,597,206 | $ 610,840,044 |
Net realized gain (loss) | (1,222,596,476) | 3,897,636,523 |
Change in net unrealized appreciation (depreciation) | (27,541,183,667) | 9,174,039,868 |
Net increase (decrease) in net assets resulting from operations | (28,011,182,937) | 13,682,516,435 |
Distributions to shareholders from net investment income | (623,834,183) | (425,826,410) |
Distributions to shareholders from net realized gain | (3,411,186,315) | (2,968,965,380) |
Total distributions | (4,035,020,498) | (3,394,791,790) |
Share transactions - net increase (decrease) | 1,321,563,137 | 5,675,290,664 |
Redemption fees | 1,934,056 | 1,737,801 |
Total increase (decrease) in net assets | (30,722,706,242) | 15,964,753,110 |
| | |
Net Assets | | |
Beginning of period | 59,929,942,228 | 43,965,189,118 |
End of period (including undistributed net investment income of $552,385,607 and undistributed net investment income of $604,543,864, respectively) | $ 29,207,235,986 | $ 59,929,942,228 |
Financial Highlights - Diversified International
Years ended October 31, | 2008 | 2007 | 2006 | 2005 | 2004 |
Selected Per-Share Data | | | | | |
Net asset value, beginning of period | $ 45.41 | $ 37.58 | $ 30.80 | $ 26.08 | $ 22.35 |
Income from Investment Operations | | | | | |
Net investment income (loss) B | .55 | .47 | .46 | .30 | .16 |
Net realized and unrealized gain (loss) | (20.96) | 10.23 | 7.33 | 4.63 | 3.87 |
Total from investment operations | (20.41) | 10.70 | 7.79 | 4.93 | 4.03 |
Distributions from net investment income | (.47) | (.36) | (.28) | (.15) | (.30) |
Distributions from net realized gain | (2.57) | (2.51) | (.73) | (.06) | - |
Total distributions | (3.04) | (2.87) | (1.01) | (.21) | (.30) |
Redemption fees added to paid in capital B, F | - | - | - | - | - |
Net asset value, end of period | $ 21.96 | $ 45.41 | $ 37.58 | $ 30.80 | $ 26.08 |
Total Return A | (48.04)% | 30.37% | 25.89% | 19.01% | 18.20% |
Ratios to Average Net Assets C, E | | | | | |
Expenses before reductions | 1.04% | .93% | 1.01% | 1.10% | 1.15% |
Expenses net of fee waivers, if any | 1.04% | .93% | 1.01% | 1.10% | 1.15% |
Expenses net of all reductions | 1.02% | .91% | .97% | 1.07% | 1.12% |
Net investment income (loss) | 1.53% | 1.20% | 1.32% | 1.02% | .66% |
Supplemental Data | | | | | |
Net assets, end of period (000 omitted) | $ 28,274,961 | $ 59,929,942 | $ 43,965,189 | $ 29,637,193 | $ 19,902,063 |
Portfolio turnover rate D | 49% | 51% | 59% | 41% | 55% |
A Total returns would have been lower had certain expenses not been reduced during the periods shown. B Calculated based on average shares outstanding during the period. C Fees and expenses of the underlying Fidelity Central Funds are not included in the Fund's expense ratio. The Fund indirectly bears its proportionate share of the expenses of any underlying Fidelity Central Funds. D Amount does not include the portfolio activity of any underlying Fidelity Central Funds. E Expense ratios reflect operating expenses of the class. Expenses before reductions do not reflect amounts reimbursed by the investment adviser or reductions from brokerage service arrangements or other expense offset arrangements and do not represent the amount paid by the class during periods when reimbursements or reductions occur. Expenses net of fee waivers reflect expenses after reimbursement by the investment adviser but prior to reductions from brokerage service arrangements or other expense offset arrangements. Expenses net of all reductions represent the net expenses paid by the class. F Amount represents less than $.01 per share. |
See accompanying notes which are an integral part of the financial statements.
Annual Report
Financial Highlights - Class K
Year ended October 31, | 2008 G |
Selected Per-Share Data | |
Net asset value, beginning of period | $ 38.39 |
Income from Investment Operations | |
Net investment income (loss) D | .16 |
Net realized and unrealized gain (loss) | (16.57) |
Total from investment operations | (16.41) |
Redemption fees added to paid in capital D, I | - |
Net asset value, end of period | $ 21.98 |
Total Return B, C | (42.75)% |
Ratios to Average Net Assets E, H | |
Expenses before reductions | .88% A |
Expenses net of fee waivers, if any | .88% A |
Expenses net of all reductions | .87% A |
Net investment income (loss) | 1.45% A |
Supplemental Data | |
Net assets, end of period (000 omitted) | $ 932,275 |
Portfolio turnover rate F | 49% |
A Annualized B Total returns for periods of less than one year are not annualized. C Total returns would have been lower had certain expenses not been reduced during the periods shown. D Calculated based on average shares outstanding during the period. E Fees and expenses of the underlying Fidelity Central Funds are not included in the Fund's expense ratio. The Fund indirectly bears its proportionate share of the expenses of any underlying Fidelity Central Funds. F Amount does not include the portfolio activity of any underlying Fidelity Central Funds. G For the period May 9, 2008 (commencement of sale of shares) to October 31, 2008. H Expense ratios reflect operating expenses of the class. Expenses before reductions do not reflect amounts reimbursed by the investment adviser or reductions from brokerage service arrangements or other expense offset arrangements and do not represent the amount paid by the class during periods when reimbursements or reductions occur. Expense ratios before reductions for start-up periods may not be representative of longer-term operating periods. Expenses net of fee waivers reflect expenses after reimbursement by the investment adviser but prior to reductions from brokerage service arrangements or other expense offset arrangements. Expenses net of all reductions represent the net expenses paid by the class. I Amount represents less than $.01 per share. |
See accompanying notes which are an integral part of the financial statements.
Annual Report
Notes to Financial Statements
For the period ended October 31, 2008
1. Organization.
Fidelity Diversified International Fund (the Fund) is a fund of Fidelity Investment Trust (the trust) and is authorized to issue an unlimited number of shares. The trust is registered under the Investment Company Act of 1940, as amended (the 1940 Act), as an open-end management investment company organized as a Massachusetts business trust. The Fund offers Diversified International and Class K shares, each of which has equal rights as to assets and voting privileges. Each class has exclusive voting rights with respect to matters that affect that class. The Fund commenced sale of Class K shares and the existing class was designated Diversified International on May 9, 2008. Investment income, realized and unrealized capital gains and losses, the common expenses of the Fund, and certain fund-level expense reductions, if any, are allocated on a pro rata basis to each class based on the relative net assets of each class to the total net assets of the Fund. Each class differs with respect to transfer agent fees incurred. Certain expense reductions also differ by class. The Fund is currently closed to most new accounts. The Fund's investments in emerging markets can be subject to social, economic, regulatory, and political uncertainties and can be extremely volatile.
2. Investments in Fidelity Central Funds.
The Fund may invest in Fidelity Central Funds, which are open-end investment companies available only to other investment companies and accounts managed by Fidelity Management & Research Company (FMR) and its affiliates. The Fund's Schedule of Investments lists each of the Fidelity Central Funds held as of period end, if any, as an investment of the Fund, but does not include the underlying holdings of each Fidelity Central Fund. As an Investing Fund, the Fund indirectly bears its proportionate share of the expenses of the underlying Fidelity Central Funds.
The Money Market Central Funds seek preservation of capital and current income and are managed by Fidelity Investments Money Management, Inc. (FIMM), an affiliate of FMR.
A complete unaudited list of holdings for each Fidelity Central Fund is available upon request or at the SEC's web site at www.sec.gov. In addition, the financial statements of the Fidelity Central Funds, which are not covered by the Fund's Report of Independent Registered Public Accounting Firm, are available on the SEC's web site or upon request.
3. Significant Accounting Policies.
The financial statements have been prepared in conformity with accounting principles generally accepted in the United States of America, which require management to make certain estimates and assumptions at the date of the financial statements. Actual results could differ from those estimates. The following summarizes the significant accounting policies of the Fund:
Security Valuation. Investments are valued as of 4:00 p.m. Eastern time on the last calendar day of the period. Wherever possible, the Fund uses independent pricing services approved by the Board of Trustees to value its investments.
Equity securities, including restricted securities, for which market quotations are readily available, are valued at the last reported sale price or official closing price as reported by an independent pricing service on the primary market or exchange on which they are traded. In the event there were no sales during the day or closing prices are not available, securities are valued at the last quoted bid price. The U.S. dollar value of forward foreign currency contracts is determined using forward currency exchange rates supplied by a quotation service. Futures contracts are valued at the settlement price established each day by the board of trade or exchange on which they are traded. Investments in open-end mutual funds, including the Fidelity Central Funds, are valued at their closing net asset value each business day. Short-term securities with remaining maturities of sixty days or less for which quotations are not readily available are valued at amortized cost, which approximates value.
When current market prices or quotations are not readily available or reliable, valuations may be determined in good faith in accordance with procedures adopted by the Board of Trustees. Factors used in determining value may include significant market or security specific events, changes in interest rates and credit quality, and developments in foreign markets which are monitored by evaluating the performance of ADRs, futures contracts and exchange-traded funds. The frequency with which these procedures are used cannot be predicted and may be utilized to a significant extent. The value of securities used for net asset value (NAV) calculation under these procedures may differ from published prices for the same securities.
Foreign Currency. The Fund uses foreign currency contracts to facilitate transactions in foreign-denominated securities. Losses from these transactions may arise from changes in the value of the foreign currency or if the counterparties do not perform under the contracts' terms.
Foreign-denominated assets, including investment securities, and liabilities are translated into U.S. dollars at the exchange rate at period end. Purchases and sales of investment securities, income and dividends received and expenses denominated in foreign currencies are translated into U.S. dollars at the exchange rate in effect on the transaction date.
The effects of exchange rate fluctuations on investments are included with the net realized and unrealized gain (loss) on investment securities. Other foreign currency transactions resulting in realized and unrealized gain (loss) are disclosed separately.
Annual Report
3. Significant Accounting Policies - continued
Investment Transactions and Income. For financial reporting purposes, the Fund's investment holdings and NAV include trades executed through the end of the last business day of the period. The NAV per share for processing shareholder transactions is calculated as of the close of business of the New York Stock Exchange (NYSE), normally 4:00 p.m. Eastern time and includes trades executed through the end of the prior business day. Gains and losses on securities sold are determined on the basis of identified cost and may include proceeds received from litigation. Dividend income is recorded on the ex-dividend date, except for certain dividends from foreign securities where the ex-dividend date may have passed, which are recorded as soon as the Fund is informed of the ex-dividend date. Non-cash dividends included in dividend income, if any, are recorded at the fair market value of the securities received. Distributions received on securities that represent a return of capital or capital gain are recorded as a reduction of cost of investments and/or as a realized gain. The Fund estimates the components of distributions received that may be considered return of capital distributions or capital gain distributions. Interest income and distributions from the Fidelity Central Funds are accrued as earned. Interest income includes coupon interest and amortization of premium and accretion of discount on debt securities. Investment income is recorded net of foreign taxes withheld where recovery of such taxes is uncertain.
Expenses. Most expenses of the trust can be directly attributed to a fund. Expenses which cannot be directly attributed are apportioned among each Fund in the trust. Expense estimates are accrued in the period to which they relate and adjustments are made when actual amounts are known.
Deferred Trustee Compensation. Under a Deferred Compensation Plan (the Plan), independent Trustees must defer receipt of a portion of, and may elect to defer receipt of an additional portion of, their annual compensation. Deferred amounts are invested in a cross-section of Fidelity funds, are marked-to-market and remain in the Fund until distributed in accordance with the Plan. The investment of deferred amounts and the offsetting payable to the Trustees are included in the accompanying Statement of Assets and Liabilities.
Income Tax Information and Distributions to Shareholders. Each year, the Fund intends to qualify as a regulated investment company by distributing substantially all of its taxable income and realized gains under Subchapter M of the Internal Revenue Code and filing its U.S. federal tax return. As a result, no provision for income taxes is required. The Fund is subject to the provisions of FASB Interpretation No. 48, Accounting for Uncertainties in Income Taxes (FIN 48). FIN 48 sets forth a minimum threshold for financial statement recognition of the benefit of a tax position taken or expected to be taken in a tax return. The implementation of FIN 48 did not result in any unrecognized tax benefits in the accompanying financial statements. Each of the Fund's federal tax returns for the prior three fiscal years remains subject to examination by the Internal Revenue Service (IRS). Foreign taxes are provided for based on the Fund's understanding of the tax rules and rates that exist in the foreign markets in which it invests.
Distributions are recorded on the ex-dividend date. Income dividends and capital gain distributions are declared separately for each class. Income and capital gain distributions are determined in accordance with income tax regulations, which may differ from generally accepted accounting principles. In addition, the Fund will claim a portion of the payment made to redeeming shareholders as a distribution for income tax purposes.
Capital accounts within the financial statements are adjusted for permanent book-tax differences. These adjustments have no impact on net assets or the results of operations. Temporary book-tax differences will reverse in a subsequent period.
Book-tax differences are primarily due to futures and options transactions, foreign currency transactions, certain foreign taxes, passive foreign investment companies (PFIC), market discount, partnerships, deferred trustees compensation, capital loss carryforwards and losses deferred due to wash sales.
The tax-basis components of distributable earnings and the federal tax cost as of period end were as follows:
Unrealized appreciation | $ 3,488,560,069 |
Unrealized depreciation | (10,924,916,294) |
Net unrealized appreciation (depreciation) | (7,436,356,225) |
Undistributed ordinary income | 360,875,659 |
Capital loss carryforward | (956,782,987) |
| |
Cost for federal income tax purposes | $ 36,646,719,383 |
The tax character of distributions paid was as follows:
| October 31,
2008 | October 31,
2007 |
Ordinary Income | $ 623,834,183 | $ 449,483,504 |
Long-term Capital Gains | 3,411,186,315 | 2,945,308,286 |
Total | $ 4,035,020,498 | $ 3,394,791,790 |
Short-Term Trading (Redemption) Fees. Shares held in the Fund less than 30 days are subject to a redemption fee equal to 1.00% of the proceeds of the redeemed shares. All redemption fees, including any estimated redemption fees paid by FMR, are retained by the Fund and accounted for as an addition to paid in capital.
Annual Report
Notes to Financial Statements - continued
3. Significant Accounting Policies - continued
New Accounting Pronouncements. In September 2006, Statement of Financial Accounting Standards No. 157, Fair Value Measurements (SFAS 157), was issued and is effective for fiscal years beginning after November 15, 2007. SFAS 157 defines fair value, establishes a framework for measuring fair value and results in expanded disclosures about fair value measurements.
In addition, in March 2008, Statement of Financial Accounting Standards No. 161, Disclosures about Derivative Instruments and Hedging Activities (SFAS 161), was issued and is effective for reporting periods beginning after November 15, 2008. SFAS 161 requires enhanced disclosures to provide information about the reasons the Fund invests in derivative instruments, the accounting treatment and the effect derivatives have on financial performance.
4. Operating Policies.
Forward Foreign Currency Contracts. The Fund generally uses foreign currency contracts to facilitate transactions in foreign-denominated securities and to manage the Fund's currency exposure. Contracts to sell generally are used to hedge the Fund's investments against currency fluctuations, while contracts to buy generally are used to offset a previous contract to sell. Also, a contract to buy can be used to acquire exposure to foreign currencies and a contract to sell can be used to offset a previous contract to buy. These contracts involve market risk in excess of the unrealized gain or loss reflected in the Fund's Statement of Assets and Liabilities. The U.S. dollar value of the currencies the Fund has committed to buy or sell is shown in the Schedule of Investments under the caption "Forward Foreign Currency Contracts." This amount represents the aggregate exposure to each currency the Fund has acquired or hedged through currency contracts at period end. Losses may arise from changes in the value of foreign currency or if the counterparties do not perform under the contracts' terms.
Purchases and sales of forward foreign currency contracts having the same settlement date and broker are offset and any realized gain (loss) recognized on the date of offset: otherwise, gain (loss) is recognized on settlement date. Contracts that have been offset with different counterparties are reflected as both a contract to buy and a contract to sell in the Schedule of Investments under the caption "Forward Foreign Currency Contracts."
Repurchase Agreements. FMR has received an Exemptive Order from the Securities and Exchange Commission (the SEC) which permits the Fund and other affiliated entities of FMR to transfer uninvested cash balances into joint trading accounts which are then invested in repurchase agreements. The Fund may also invest directly with institutions in repurchase agreements. Repurchase agreements are collateralized by government or non-government securities. Upon settlement date, collateral is held in segregated accounts with custodian banks and may be obtained in the event of a default of the counterparty. The Fund monitors, on a daily basis, the value of the collateral to ensure it is at least equal to the principal amount of the repurchase agreement (including accrued interest). In the event of a default by the counterparty, realization of the collateral proceeds could be delayed, during which time the value of the collateral may decline.
Futures Contracts. The Fund may use futures contracts to manage its exposure to the stock market. Buying futures tends to increase a fund's exposure to the underlying instrument, while selling futures tends to decrease a fund's exposure to the underlying instrument or hedge other fund investments. Upon entering into a futures contract, a fund is required to deposit with a clearing broker, no later than the following business day, an amount ("initial margin") equal to a certain percentage of the face value of the contract. The initial margin may be in the form of cash or securities and is transferred to a segregated account on settlement date. Subsequent payments ("variation margin") are made or received by a fund depending on the daily fluctuations in the value of the futures contract and are accounted for as unrealized gains or losses. Realized gains (losses) are recorded upon the expiration or closing of the futures contract. Losses may arise from changes in the value of the underlying instruments or if the counterparties do not perform under the contract's terms.
Restricted Securities. The Fund may invest in securities that are subject to legal or contractual restrictions on resale. These securities generally may be resold in transactions exempt from registration or to the public if the securities are registered. Disposal of these securities may involve time-consuming negotiations and expense, and prompt sale at an acceptable price may be difficult. Information regarding restricted securities is included at the end of the Fund's Schedule of Investments.
5. Purchases and Sales of Investments.
Purchases and sales of securities, other than short-term securities, aggregated $23,096,237,447 and $24,667,165,009, respectively.
Annual Report
6. Fees and Other Transactions with Affiliates.
Management Fee. FMR and its affiliates provide the Fund with investment management related services for which the Fund pays a monthly management fee. The management fee is the sum of an individual fund fee rate that is based on an annual rate of .45% of the Fund's average net assets and a group fee rate that averaged .26% during the period. The group fee rate is based upon the average net assets of all the mutual funds advised by FMR. The group fee rate decreases as assets under management increase and increases as assets under management decrease. In addition, the management fee is subject to a performance adjustment (up to a maximum of± .20% of the Fund's average net assets over a 36 month performance period). The upward or downward adjustment to the management fee is based on the relative investment performance of the retail class of the Fund, Fidelity Diversified International as compared to an appropriate benchmark index. For the period, the total annual management fee rate, including the performance adjustment, was .78% of the Fund's average net assets.
Transfer Agent Fees. Fidelity Investments Institutional Operations Company, Inc. (FIIOC), an affiliate of FMR, is the transfer, dividend disbursing and shareholder servicing agent for each class of the Fund. FIIOC receives account fees and asset-based fees that vary according to account size and type of account of the shareholders of Diversified International and asset-based fees of .05% of average net assets for Class K. FIIOC pays for typesetting, printing and mailing of shareholder reports, except proxy statements. Prior to January 1, 2008, Fidelity Service Company, Inc. (FSC), also an affiliate of FMR, was the transfer agent for Diversified International. For the period, the transfer agent fees for Diversified International were equivalent to the annualized rate of .22% of average net assets.
For the period, each class paid the following transfer agent fees:
| Amount |
Diversified International | $ 107,791,225 |
Class K | 47,731 |
| $ 107,838,956 |
Accounting and Security Lending Fees. FSC maintains the Fund's accounting records. The accounting fee is based on the level of average net assets for the month. Under a separate contract, FSC administers the security lending program. The security lending fee is based on the number and duration of lending transactions.
Brokerage Commissions. The Fund placed a portion of its portfolio transactions with brokerage firms which are affiliates of the investment adviser. The commissions paid to these affiliated firms were $38,904 for the period.
7. Committed Line of Credit.
The Fund participates with other funds managed by FMR in a $4.2 billion credit facility (the "line of credit") to be utilized for temporary or emergency purposes to fund shareholder redemptions or for other short-term liquidity purposes. The Fund has agreed to pay commitment fees on its pro rata portion of the line of credit, which amounted to $100,320 and is reflected in Miscellaneous Expense on the Statement of Operations. During the period, there were no borrowings on this line of credit.
8. Security Lending.
The Fund lends portfolio securities from time to time in order to earn additional income. On the settlement date of the loan, the Fund receives collateral (in the form of U.S. Treasury obligations, letters of credit and/or cash) against the loaned securities and maintains collateral in an amount not less than 100% of the market value of the loaned securities during the period of the loan. The market value of the loaned securities is determined at the close of business of the Fund and any additional required collateral is delivered to the Fund on the next business day. If the borrower defaults on its obligation to return the securities loaned because of insolvency or other reasons, a fund could experience delays and costs in recovering the securities loaned or in gaining access to the collateral. Any cash collateral received is invested in the Fidelity Securities Lending Cash Central Fund. The value of loaned securities and cash collateral at period end are disclosed on the Fund's Statement of Assets and Liabilities. Security lending income represents the income earned on investing cash collateral, less fees and expenses associated with the loan, plus any premium payments that may be received on the loan of certain types of securities. Security lending income is presented in the Statement of Operations as a component of income from Fidelity Central Funds. Net income from lending portfolio securities during the period amounted to $41,104,703.
9. Expense Reductions.
FMR voluntarily agreed to reimburse a portion of Diversified International operating expenses. During the period, this reimbursement reduced the class' expenses by $12,762.
Many of the brokers with whom FMR places trades on behalf of the Fund provided services to the Fund in addition to trade execution. These services included payments of certain expenses on behalf of the Fund totaling $6,147,236 for the period In addition, through arrangements with each class'
Annual Report
Notes to Financial Statements - continued
9. Expense Reductions - continued
transfer agent, credits realized as a result of uninvested cash balances were used to reduce the Fund's expenses. During the period, these credits reduced the Fund's custody expenses by $48,429. During the period, credits reduced each class' transfer agent expense as noted in the table below.
| Transfer Agent
expense reduction |
Diversified International | $ 1,954,766 |
Class K | 585 |
Total | $ 1,955,351 |
10. Other.
The Fund's organizational documents provide former and current trustees and officers with a limited indemnification against liabilities arising in connection with the performance of their duties to the Fund. In the normal course of business, the Fund may also enter into contracts that provide general indemnifications. The Fund's maximum exposure under these arrangements is unknown as this would be dependent on future claims that may be made against the Fund. The risk of material loss from such claims is considered remote.
In December 2006, the Independent Trustees, with the assistance of independent counsel, completed an investigation regarding gifts, gratuities and business entertainment provided by certain brokers to certain individuals who were employed on FMR's domestic equity trading desk during the period 2002 to 2004. The Independent Trustees and FMR agreed that, despite the absence of proof that the Fidelity mutual funds experienced diminished execution quality as a result of the improper receipt of gifts and business entertainment, the conduct at issue was serious and was worthy of redress. Accordingly, the Independent Trustees requested, and FMR agreed to make, a payment of $42 million plus accrued interest, which equaled approximately $7.3 million, to certain Fidelity mutual funds.
In March 2008, the Trustees approved a method for allocating this payment among the funds and, in total, FMR paid the fund $46,909, which is recorded in the accompanying Statement of Operations.
In a related administrative order dated March 5, 2008, the U.S. Securities and Exchange Commission ("SEC") announced a settlement with FMR and FMR Co., Inc. (an affiliate of FMR) involving the SEC's regulatory rules for investment advisers and the improper receipt of gifts, gratuities and business entertainment. Without admitting or denying the SEC's findings, FMR agreed to pay an $8 million civil penalty to the United States Treasury.
During the period, Lehman Brothers Holdings, Inc. and certain of its affiliates (LBHI) sought protection under the insolvency laws of their jurisdictions of organization, including the United States, the United Kingdom and Japan. At the time LBHI's insolvency proceedings were instituted, the Fund had outstanding securities trades with counterparties affiliated with LBHI. As a result of the insolvency proceedings, LBHI is unable to fulfill its commitments and, in certain cases, the Fund may have terminated its trades and related agreements with the relevant entities and, where appropriate, is in the process of initiating claims for damages. FMR believes that the financial impact to the Fund relating to the terminated trades and agreements is immaterial.
11. Distributions to Shareholders.
Distributions to shareholders of each class were as follows:
Years ended October 31, | 2008 | 2007 |
From net investment income | | |
Diversified International | $ 623,834,183 | $ 425,826,410 |
From net realized gain | | |
Diversified International | $ 3,411,186,315 | $ 2,968,965,380 |
Annual Report
12. Share Transactions.
Transactions for each class of shares were as follows:
| Shares | Dollars |
Years ended October 31, | 2008 A | 2007 | 2008 A | 2007 |
Diversified International | | | | |
Shares sold | 306,179,666 | 326,379,078 | $ 10,595,590,795 | $ 12,905,719,605 |
Conversion to Class K | (43,282,557) | - | (933,288,874) | - |
Reinvestment of distributions | 95,512,855 | 90,046,217 | 3,896,924,337 | 3,274,080,069 |
Shares redeemed | (390,314,331) | (266,671,784) | (13,365,445,996) | (10,504,509,010) |
Net increase (decrease) | (31,904,367) | 149,753,511 | $ 193,780,262 | $ 5,675,290,664 |
Class K | | | | |
Shares sold | 1,216,070 | - | $ 245,180,524 | $ - |
Conversion from Diversified International | 43,251,317 | - | 933,288,874 | - |
Shares redeemed | (2,048,185) | - | (50,686,523) | - |
Net increase (decrease) | 42,419,202 | - | $ 1,127,782,875 | $ - |
A Share transactions for Class K are for the period May 9, 2008 (commencement of sale of shares) to October 31, 2008.
Annual Report
Report of Independent Registered Public Accounting Firm
To the Trustees of Fidelity Investment Trust and Shareholders of Fidelity Diversified International Fund:
We have audited the accompanying statement of assets and liabilities of Fidelity Diversified International Fund (the Fund), a fund of Fidelity Investment Trust, including the schedule of investments, as of October 31, 2008, and the related statement of operations for the year then ended, the statement of changes in net assets for each of the two years in the period then ended, and the financial highlights for each of the five years in the period then ended. These financial statements and financial highlights are the responsibility of the Fund's management. Our responsibility is to express an opinion on these financial statements and financial highlights based on our audits.
We conducted our audits in accordance with standards of the Public Company Accounting Oversight Board (United States). Those standards require that we plan and perform the audit to obtain reasonable assurance about whether the financial statements and financial highlights are free of material misstatement. The Fund is not required to have, nor were we engaged to perform, an audit of its internal control over financial reporting. Our audits included consideration of internal control over financial reporting as a basis for designing audit procedures that are appropriate in the circumstances, but not for the purpose of expressing an opinion on the effectiveness of the Fund's internal control over financial reporting. Accordingly, we express no such opinion. An audit also includes examining, on a test basis, evidence supporting the amounts and disclosures in the financial statements, assessing the accounting principles used and significant estimates made by management, as well as evaluating the overall financial statement presentation. Our procedures included confirmation of securities owned as of October 31, 2008, by correspondence with the custodians and brokers[; where replies were not received from brokers, we performed other auditing procedures]. We believe that our audits provide a reasonable basis for our opinion.
In our opinion, the financial statements and financial highlights referred to above present fairly, in all material respects, the financial position of Fidelity Diversified International Fund as of October 31, 2008, the results of its operations for the year then ended, the changes in its net assets for each of the two years in the period then ended, and its financial highlights for each of the five years in the period then ended, in conformity with accounting principles generally accepted in the United States of America.
/s/ Deloitte & Touche LLP
DELOITTE & TOUCHE LLP
Boston, Massachusetts
December 23, 2008
Annual Report
The Trustees, Member of the Advisory Board, and executive officers of the trust and fund, as applicable, are listed below. The Board of Trustees governs the fund and is responsible for protecting the interests of shareholders. The Trustees are experienced executives who meet periodically throughout the year to oversee the fund's activities, review contractual arrangements with companies that provide services to the fund, and review the fund's performance. Except for Edward C. Johnson 3d and James C. Curvey, each of the Trustees oversees 220 funds advised by FMR or an affiliate. Messrs. Johnson and Curvey oversee 379 funds advised by FMR or an affiliate.
The Trustees hold office without limit in time except that (a) any Trustee may resign; (b) any Trustee may be removed by written instrument, signed by at least two-thirds of the number of Trustees prior to such removal; (c) any Trustee who requests to be retired or who has become incapacitated by illness or injury may be retired by written instrument signed by a majority of the other Trustees; and (d) any Trustee may be removed at any special meeting of shareholders by a two-thirds vote of the outstanding voting securities of the trust. Each Trustee who is not an interested person (as defined in the 1940 Act) (Independent Trustee), shall retire not later than the last day of the calendar year in which his or her 72nd birthday occurs. The Independent Trustees may waive this mandatory retirement age policy with respect to individual Trustees. The executive officers and Advisory Board Member hold office without limit in time, except that any officer and Advisory Board Member may resign or may be removed by a vote of a majority of the Trustees at any regular meeting or any special meeting of the Trustees. Except as indicated, each individual has held the office shown or other offices in the same company for the past five years.
The fund's Statement of Additional Information (SAI) includes more information about the Trustees. To request a free copy, call Fidelity at 1-800-544-8544.
Interested Trustees*:
Correspondence intended for each Trustee who is an interested person may be sent to Fidelity Investments, 82 Devonshire Street, Boston, Massachusetts 02109.
Name, Age; Principal Occupation |
Edward C. Johnson 3d (78) |
| Year of Election or Appointment: 1984 Mr. Johnson is Chairman of the Board of Trustees. Mr. Johnson serves as Chief Executive Officer, Chairman, and a Director of FMR LLC; Chairman and a Director of FMR; Chairman and a Director of Fidelity Research & Analysis Company (FRAC); Chairman and a Director of Fidelity Investments Money Management, Inc.; and Chairman and a Director of FMR Co., Inc. In addition, Mr. Johnson serves as Chairman and Director of FIL Limited. Previously, Mr. Johnson served as President of FMR LLC (2006-2007). |
James C. Curvey (73) |
| Year of Election or Appointment: 2007 Mr. Curvey also serves as Trustee (2007-present) of other investment companies advised by FMR. Mr. Curvey is a Director of FMR and FMR Co., Inc. (2007-present). Mr. Curvey is also Vice Chairman (2006-present) and Director of FMR LLC. In addition, Mr. Curvey serves as an Overseer for the Boston Symphony Orchestra and a member of the Trustees of Villanova University. |
* Trustees have been determined to be "Interested Trustees" by virtue of, among other things, their affiliation with the trust or various entities under common control with FMR. FMR Corp. merged with and into FMR LLC on October 1, 2007. Any references to FMR LLC for prior periods are deemed to be references to the prior entity.
Independent Trustees:
Correspondence intended for each Independent Trustee (that is, the Trustees other than the Interested Trustees) may be sent to Fidelity Investments, P.O. Box 55235, Boston, Massachusetts 02205-5235.
Name, Age; Principal Occupation |
Dennis J. Dirks (60) |
| Year of Election or Appointment: 2005 Prior to his retirement in May 2003, Mr. Dirks was Chief Operating Officer and a member of the Board of The Depository Trust & Clearing Corporation (DTCC) (1999-2003). He also served as President, Chief Operating Officer, and Board member of The Depository Trust Company (DTC) (1999-2003) and President and Board member of the National Securities Clearing Corporation (NSCC) (1999-2003). In addition, Mr. Dirks served as a Trustee and a member of the Finance Committee of Manhattan College (2005-2008), and as Chief Executive Officer and Board member of the Government Securities Clearing Corporation (2001-2003) and Chief Executive Officer and Board member of the Mortgage-Backed Securities Clearing Corporation (2001-2003). Mr. Dirks also serves as a Trustee and a member of the Finance Committee of AHRC of Nassau County (2006-present). |
Alan J. Lacy (55) |
| Year of Election or Appointment: 2008 Mr. Lacy serves as Senior Adviser (2007-present) of Oak Hill Capital Partners, L.P. (a private equity firm). Mr. Lacy also served as Chief Executive Officer (2000-2005) and Vice Chairman (2005-2006) of Sears Holdings Corporation and Sears, Roebuck and Co. (retail). In addition, Mr. Lacy serves as a member of the Board of Directors of The Western Union Company (global money transfer, 2006-present) and Bristol-Myers Squibb (global pharmaceuticals, 2007-present). Mr. Lacy is a Trustee of the National Parks Conservation Association and The Field Museum of Natural History. |
Ned C. Lautenbach (64) |
| Year of Election or Appointment: 2000 Mr. Lautenbach is Chairman of the Independent Trustees (2006-present). Mr. Lautenbach is an Advisory Partner of Clayton, Dubilier & Rice, Inc. (private equity investment firm). Previously, Mr. Lautenbach was with the International Business Machines Corporation (IBM) from 1968 until his retirement in 1998. Mr. Lautenbach serves as a Director of Eaton Corporation (diversified industrial) as well as the Philharmonic Center for the Arts in Naples, Florida. He also is a member of the Board of Trustees of Fairfield University (2005-present), as well as a member of the Council on Foreign Relations. Previously, Mr. Lautenbach served as a Director of Sony Corporation (2006-2007). |
Joseph Mauriello (64) |
| Year of Election or Appointment: 2008 Prior to his retirement in January 2006, Mr. Mauriello served in numerous senior management positions including Deputy Chairman and Chief Operating Officer (2004-2005), and Vice Chairman of Financial Services (2002-2004) of KPMG LLP US (professional services firm, 1965-2005). Mr. Mauriello currently serves as a member of the Board of Directors of XL Capital Ltd. (global insurance and re-insurance company, 2006-present) and of Arcadia Resources Inc. (health care services and products, 2007-
present). He also served as a Director of the Hamilton Funds of the Bank of New York (2006-2007). |
Cornelia M. Small (64) |
| Year of Election or Appointment: 2005 Ms. Small is a member of the Investment Committee, and Chair (2008-present) and a member of the Board of Trustees of Smith College. Ms. Small also serves on the Investment Committee of the Berkshire Taconic Community Foundation (2008-present). Previously, Ms. Small served as Chairperson of the Investment Committee (2002-2008) of Smith College and as Co-Chair (2000-
2003) of the Annual Fund for the Fletcher School of Law and Diplomacy. In addition, she served as Chief Investment Officer, Director of Global Equity Investments, and a member of the Board of Directors of Scudder, Stevens & Clark and Scudder Kemper Investments. |
William S. Stavropoulos (69) |
| Year of Election or Appointment: 2001 Mr. Stavropoulos is Chairman Emeritus of the Board of Directors of The Dow Chemical Company, where he previously served in numerous senior management positions, including President (1993-2000; 2002-2003), CEO (1995-2000; 2002-2004), Chairman of the Executive Committee (2000-2006), and as a member of the Board of Directors (1990-2006). Currently, he is a Director of Teradata Corporation (data warehousing and technology solutions, 2008-present), Chemical Financial Corporation, Maersk Inc. (industrial conglomerate), Tyco International, Inc. (multinational manufacturing and services, 2007-present), and a member of the Advisory Board for Metalmark Capital (private equity investment firm, 2005-present). He is a special advisor to Clayton, Dubilier & Rice, Inc. (private equity investment). In addition, Mr. Stavropoulos is a member of the University of Notre Dame Advisory Council for the College of Science. |
David M. Thomas (59) |
| Year of Election or Appointment: 2008 Previously, Mr. Thomas served as Executive Chairman (2005-2006) and Chairman and Chief Executive Officer (2000-2005) of IMS Health, Inc. (pharmaceutical and healthcare information solutions). In addition, Mr. Thomas serves as a member of the Board of Directors of Fortune Brands, Inc. (consumer products holding company), and Interpublic Group of Companies, Inc. (marketing communication, 2004-present). |
Michael E. Wiley (58) |
| Year of Election or Appointment: 2008 Mr. Wiley also serves as a member of the Board of Trustees of the University of Tulsa (2000-2006; 2007-present). He serves as a Director of Tesoro Corporation (independent oil refiner and marketer, 2005-present), and a Director of Bill Barrett Corporation (exploration and production company, 2005-present). In addition, he also serves as a Director of Post Oak Bank (privately-held bank, 2004-present). Previously, Mr. Wiley served as a Sr. Energy Advisor of Katzenbach Partners, LLC (consulting firm, 2006-
2007), as an Advisory Director of Riverstone Holdings (private investment firm), Chairman, President, and CEO of Baker Hughes, Inc. (oilfield services company, 2000-2004), and as Director of Spinnaker Exploration Company (exploration and production company, 2001-2005). |
Annual Report
Trustees and Officers - continued
Advisory Board Member and Executive Officers**:
Correspondence intended for each executive officer and Mr. Lynch may be sent to Fidelity Investments, 82 Devonshire Street, Boston, Massachusetts 02109.
Name, Age; Principal Occupation |
Peter S. Lynch (64) |
| Year of Election or Appointment: 2003 Member of the Advisory Board of the Fidelity's Equity and High Income Funds. Mr. Lynch is Vice Chairman and a Director of FMR, and Vice Chairman (2001-present) and a Director of FMR Co., Inc. Previously, Mr. Lynch served as a Trustee of the Fidelity funds (1990-2003). In addition, he serves as a Trustee of Boston College and as the Chairman of the Inner-City Scholarship Fund. Previously, Mr. Lynch served on the Special Olympics International Board of Directors (1997-2006). |
Kenneth B. Robins (39) |
| Year of Election or Appointment: 2008 President and Treasurer of Fidelity's Equity and High Income Funds. Mr. Robins is an employee of Fidelity Investments (2004-
present). Before joining Fidelity Investments, Mr. Robins worked at KPMG LLP, where he was a partner in KPMG's department of professional practice (2002-2004). |
Walter C. Donovan (46) |
| Year of Election or Appointment: 2007 Vice President of Fidelity's Equity Funds. Mr. Donovan also serves as President of FMR and FMR Co., Inc., and Executive Vice President of Fidelity Investments Money Management, Inc. (2007-present). Previously, Mr. Donovan served as Executive Vice President of FMR and FMR Co., Inc. (2005-2007) and Senior Vice President of FMR (2003-2005) and FMR Co., Inc. (2004-2005). |
Eric M. Wetlaufer (46) |
| Year of Election or Appointment: 2006 Vice President of Fidelity's International Equity Funds. Mr. Wetlaufer also serves as Group Chief Investment Officer of FMR. Mr. Wetlaufer is Chairman, Chief Executive Officer, and President of Fidelity Management & Research (Hong Kong) Limited (2008-
present); Chairman, Chief Executive Officer, President, and a Director of Fidelity Management & Research (Japan) Inc. (2008-
present); Chairman and Chief Executive Officer (2007-present) and President and a Director (2006-present) of Fidelity Management & Research (U.K.) Inc. and President and a Director of Fidelity Research & Analysis Company (2006-present). Before joining Fidelity Investments in 2005, Mr. Wetlaufer was a partner in Oxhead Capital Management (2004-2005) and a Chief Investment Officer of Putnam Investments (1997-2003). |
Scott C. Goebel (40) |
| Year of Election or Appointment: 2008 Secretary and Chief Legal Officer (CLO) of the Fidelity funds. Mr. Goebel also serves as General Counsel, Secretary, and Senior Vice President of FMR (2008-present); Deputy General Counsel of FMR LLC; Chief Legal Secretary of Fidelity Management & Research (Hong Kong) Limited (2008-present) and Assistant Secretary of Fidelity Management & Research (Japan) Inc. (2008-
present). Previously, Mr. Goebel served as Assistant Secretary of the Funds (2007-2008) and as Vice President and Secretary of Fidelity Distributors Corporation (FDC) (2005-2007). |
John B. McGinty, Jr. (46) |
| Year of Election or Appointment: 2008 Assistant Secretary of Fidelity's Equity and High Income Funds. Mr. McGinty is an employee of Fidelity Investments (2004-present). Mr. McGinty also serves as Senior Vice President, Secretary, and Chief Legal Officer of FDC (2007-present). Before joining Fidelity Investments, Mr. McGinty practiced law at Ropes & Gray, LLP. |
Holly C. Laurent (54) |
| Year of Election or Appointment: 2008 Anti-Money Laundering (AML) Officer of the Fidelity funds. Ms. Laurent is an employee of Fidelity Investments. Previously, Ms. Laurent was Senior Vice President and Head of Legal for Fidelity Business Services India Pvt. Ltd. (2006-2008), Senior Vice President, Deputy General Counsel and Group Head for FMR LLC (2005-2006). |
Christine Reynolds (50) |
| Year of Election or Appointment: 2008 Chief Financial Officer of the Fidelity funds. Ms. Reynolds became President of Fidelity Pricing and Cash Management Services (FPCMS) in August 2008. She served as Chief Operating Officer of FPCMS from 2007 through July 2008. Previously, Ms. Reynolds served as President, Treasurer, and Anti-Money Laundering officer of the Fidelity funds (2004-2007). Before joining Fidelity Investments, Ms. Reynolds worked at PricewaterhouseCoopers LLP (PwC) (1980-2002), where she was an audit partner with PwC's investment management practice. |
Kenneth A. Rathgeber (61) |
| Year of Election or Appointment: 2004 Chief Compliance Officer of Fidelity's Equity and High Income Funds. Mr. Rathgeber is Chief Compliance Officer of Fidelity Management & Research (Hong Kong) Limited (2008-present), Fidelity Management & Research (Japan) Inc. (2008-present), FMR (2005-present), FMR Co., Inc. (2005-present), Fidelity Management & Research (U.K.) Inc. (2005-present), Fidelity Research & Analysis Company (2005-present), Fidelity Investments Money Management, Inc. (2005-present), and Strategic Advisers, Inc. (2005-present). |
Bryan A. Mehrmann (47) |
| Year of Election or Appointment: 2005 Deputy Treasurer of the Fidelity funds. Mr. Mehrmann is an employee of Fidelity Investments. Previously, Mr. Mehrmann served as Vice President of Fidelity Investments Institutional Services Group (FIIS)/Fidelity Investments Institutional Operations Corporation, Inc. (FIIOC) Client Services (1998-2004). |
Adrien E. Deberghes (41) |
| Year of Election or Appointment: 2008 Deputy Treasurer of Fidelity's Equity and High Income Funds. Mr. Deberghes is an employee of Fidelity Investments (2008-present). Previously, Mr. Deberghes served as Senior Vice President of Mutual Fund Administration at State Street Corporation (2007-2008), Senior Director of Mutual Fund Administration at Investors Bank & Trust (2005-2007), and Director of Finance for Dunkin' Brands (2000-2005). |
Robert G. Byrnes (41) |
| Year of Election or Appointment: 2005 Assistant Treasurer of the Fidelity funds. Mr. Byrnes is an employee of Fidelity Investments (2005-present). Previously, Mr. Byrnes served as Vice President of Fidelity Pricing and Cash Management Services (FPCMS) (2003-2005). Before joining Fidelity Investments, Mr. Byrnes worked at Deutsche Asset Management where he served as Vice President of the Investment Operations Group (2000-2003). |
Peter L. Lydecker (54) |
| Year of Election or Appointment: 2004 Assistant Treasurer of the Fidelity funds. Mr. Lydecker is an employee of Fidelity Investments. |
Paul M. Murphy (61) |
| Year of Election or Appointment: 2007 Assistant Treasurer of the Fidelity funds. Mr. Murphy is an employee of Fidelity Investments (2007-present). Previously, Mr. Murphy served as Chief Financial Officer of the Fidelity Funds (2005-2006), Vice President and Associate General Counsel of FMR (2007), and Senior Vice President of Fidelity Pricing and Cash Management Services (FPCMS) (1994-2007). |
Gary W. Ryan (50) |
| Year of Election or Appointment: 2005 Assistant Treasurer of the Fidelity funds. Mr. Ryan is an employee of Fidelity Investments. Previously, Mr. Ryan served as Vice President of Fund Reporting in Fidelity Pricing and Cash Management Services (FPCMS) (1999-2005). |
** FMR Corp. merged with and into FMR LLC on October 1, 2007. Any references to FMR LLC for prior periods are deemed to be references to the prior entity.
Annual Report
A special meeting of each fund's shareholders was held on April 16, 2008. The results of votes taken among shareholders on the proposals before them are reported below. Each vote reported represents one dollar of net asset value held on the record date for the meeting.
PROPOSAL 1 |
To elect a Board of Trustees.A |
| # of
Votes | % of
Votes |
James C. Curvey |
Affirmative | 44,485,656,811.55 | 94.702 |
Withheld | 2,488,551,854.62 | 5.298 |
TOTAL | 46,974,208,666.17 | 100.000 |
Dennis J. Dirks |
Affirmative | 44,706,671,638.31 | 95.173 |
Withheld | 2,267,537,027.86 | 4.827 |
TOTAL | 46,974,208,666.17 | 100.000 |
Edward C. Johnson 3d |
Affirmative | 44,294,881,638.16 | 94.296 |
Withheld | 2,679,327,028.01 | 5.704 |
TOTAL | 46,974,208,666.17 | 100.000 |
Alan J. Lacy |
Affirmative | 44,685,373,413.16 | 95.127 |
Withheld | 2,288,835,253.01 | 4.873 |
TOTAL | 46,974,208,666.17 | 100.000 |
Ned C. Lautenbach |
Affirmative | 44,634,541,379.41 | 95.019 |
Withheld | 2,339,667,286.76 | 4.981 |
TOTAL | 46,974,208,666.17 | 100.000 |
Joseph Mauriello |
Affirmative | 44,683,962,099.80 | 95.124 |
Withheld | 2,290,246,566.37 | 4.876 |
TOTAL | 46,974,208,666.17 | 100.000 |
Cornelia M. Small |
Affirmative | 44,671,688,375.36 | 95.098 |
Withheld | 2,302,520,290.81 | 4.902 |
TOTAL | 46,974,208,666.17 | 100.000 |
William S. Stavropoulos |
Affirmative | 44,465,262,087.61 | 94.659 |
Withheld | 2,508,946,578.56 | 5.341 |
TOTAL | 46,974,208,666.17 | 100.000 |
David M. Thomas |
Affirmative | 44,694,340,813.87 | 95.147 |
Withheld | 2,279,867,852.30 | 4.853 |
TOTAL | 46,974,208,666.17 | 100.000 |
Michael E. Wiley |
Affirmative | 44,686,513,174.78 | 95.130 |
Withheld | 2,287,695,491.39 | 4.870 |
TOTAL | 46,974,208,666.17 | 100.000 |
PROPOSAL 5 |
A shareholder proposal for Fidelity Diversified International Fund concerning "oversight procedures to screen out investments in companies that, in the judgement of the Board, substantially contribute to genocide, patterns of extraordinary and egregious violations of human rights, or crimes against humanity." The fund did not achieve quorum with respect to this proposal, and therefore no action was taken at the meeting and subsequent adjournments. Because sufficient votes in favor of the proposal were not received, on June 18, 2008, the proxies in their discretion determined not to adjourn the meeting further on this item. |
A Denotes trust-wide proposal and voting results.
Annual Report
Proxy Voting Results
A special meeting of the fund's shareholders was held on December 13, 2007. The results of votes taken among shareholders on the proposals before them are reported below. Each vote reported represents one dollar of net asset value held on the record date for the meeting.
PROPOSAL 1 |
To amend the Declaration of Trust to reduce the required quorum for shareholder meetings.A |
| # of
Votes | % of
Votes |
Affirmative | 45,014,793,255.82 | 80.372 |
Against | 6,871,112,667.08 | 12.268 |
Abstain | 2,163,456,438.02 | 3.863 |
Broker
Non-Votes | 1,958,633,563.89 | 3.497 |
TOTAL | 56,007,995,924.81 | 100.000 |
PROPOSAL 2 |
To elect the nominees specified below as Trustees.A |
James C. Curvey |
Affirmative | 53,384,952,361.03 | 95.317 |
Withheld | 2,623,043,563.78 | 4.683 |
TOTAL | 56,007,995,924.81 | 100.000 |
Dennis J. Dirks |
Affirmative | 53,595,104,608.67 | 95.692 |
Withheld | 2,412,891,316.14 | 4.308 |
TOTAL | 56,007,995,924.81 | 100.000 |
Albert R. Gamper, Jr. |
Affirmative | 53,570,235,221.69 | 95.647 |
Withheld | 2,437,760,703.12 | 4.353 |
TOTAL | 56,007,995,924.81 | 100.000 |
George H. Heilmeier |
Affirmative | 53,166,350,588.50 | 94.926 |
Withheld | 2,841,645,336.31 | 5.074 |
TOTAL | 56,007,995,924.81 | 100.000 |
Edward C. Johnson 3d |
Affirmative | 53,230,508,654.93 | 95.041 |
Withheld | 2,777,487,269.88 | 4.959 |
TOTAL | 56,007,995,924.81 | 100.000 |
James H. Keyes |
Affirmative | 53,549,161,456.52 | 95.610 |
Withheld | 2,458,834,468.29 | 4.390 |
TOTAL | 56,007,995,924.81 | 100.000 |
Marie L. Knowles |
Affirmative | 53,543,925,066.86 | 95.601 |
Withheld | 2,464,070,857.95 | 4.399 |
TOTAL | 56,007,995,924.81 | 100.000 |
Ned C. Lautenbach |
Affirmative | 53,547,116,322.50 | 95.606 |
Withheld | 2,460,879,602.31 | 4.394 |
TOTAL | 56,007,995,924.81 | 100.000 |
Cornelia M. Small |
Affirmative | 53,564,793,514.25 | 95.638 |
Withheld | 2,443,202,410.56 | 4.362 |
TOTAL | 56,007,995,924.81 | 100.000 |
| # of
Votes | % of
Votes |
William S. Stavropoulos |
Affirmative | 53,426,544,502.76 | 95.391 |
Withheld | 2,581,451,422.05 | 4.609 |
TOTAL | 56,007,995,924.81 | 100.000 |
Kenneth L. Wolfe |
Affirmative | 53,229,881,790.63 | 95.040 |
Withheld | 2,778,114,134.18 | 4.960 |
TOTAL | 56,007,995,924.81 | 100.000 |
A Denotes trust-wide proposal and voting results.
Annual Report
Board Approval of Investment Advisory Contracts and Management Fees
Fidelity Diversified International Fund
Each year, typically in July, the Board of Trustees, including the Independent Trustees (together, the Board), votes on the renewal of the management contract and sub-advisory agreements (together, the Advisory Contracts) for the fund. The Board, assisted by the advice of fund counsel and Independent Trustees' counsel, requests and considers a broad range of information throughout the year.
The Board meets regularly and, acting directly and through its separate committees, requests and receives information concerning, and considers at each of its meetings factors that are relevant to, its annual consideration of the renewal of the fund's Advisory Contracts, including the services and support provided to the fund and its shareholders. At the time of the renewal, the Board had 12 standing committees, each composed of Independent Trustees with varying backgrounds, to which the Board has assigned specific subject matter responsibilities in order to enhance effective decision-making by the Board. Each committee has a written charter outlining the structure and purposes of the committee. The Board also meets as needed to consider matters specifically related to the Board's annual consideration of the renewal of Advisory Contracts.
At its July 2008 meeting, the Board of Trustees, including the Independent Trustees, unanimously determined to renew the fund's Advisory Contracts. In reaching its determination, the Board considered all factors it believed relevant, including (i) the nature, extent, and quality of the services to be provided to the fund and its shareholders (including the investment performance of the fund); (ii) the competitiveness of the fund's management fee and total expenses; (iii) the total costs of the services to be provided by and the profits to be realized by Fidelity from its relationship with the fund; (iv) the extent to which economies of scale would be realized as the fund grows; and (v) whether fee levels reflect these economies of scale, if any, for the benefit of fund shareholders. The Board also approved agreements with foreign sub-advisers Fidelity Management & Research (Japan) Inc. and Fidelity Management & Research (Hong Kong) Limited, as well as amendments to the fund's agreement with Fidelity Management & Research (U.K.) Inc.
In considering whether to renew the Advisory Contracts for the fund, the Board ultimately reached a determination, with the assistance of fund counsel and Independent Trustees' counsel and through the exercise of its business judgment, that the renewal of the Advisory Contracts and the compensation to be received by Fidelity under the management contract is consistent with Fidelity's fiduciary duty under applicable law. The Board's decision to renew the Advisory Contracts was not based on any single factor noted above, but rather was based on a comprehensive consideration of all the information provided to the Board at its meetings throughout the year. The Board, in reaching its determination to renew the Advisory Contracts, is aware that shareholders in the fund have a broad range of investment choices available to them, including a wide choice among mutual funds offered by competitors to Fidelity, and that the fund's shareholders, with the opportunity to review and weigh the disclosure provided by the fund in its prospectus and other public disclosures, have chosen to invest in that fund, managed by Fidelity.
Nature, Extent, and Quality of Services Provided. The Board considered staffing within the investment adviser, FMR, and the sub-advisers (together, the Investment Advisers), including the backgrounds of the fund's investment personnel and the fund's investment objectives and disciplines. The Independent Trustees also had discussions with senior management of Fidelity's investment operations and investment groups. The Board considered the structure of the portfolio manager compensation program and whether this structure provides appropriate incentives.
Resources Dedicated to Investment Management and Support Services. The Board reviewed the size, education, and experience of the Investment Advisers' investment staff, their use of technology, and the Investment Advisers' approach to recruiting, training, and retaining portfolio managers and other research, advisory, and management personnel. The Board noted that Fidelity's analysts have access to a variety of technological tools that enable them to perform both fundamental and quantitative analysis and to specialize in various disciplines. The Board considered Fidelity's extensive global research capabilities that enable the Investment Advisers to aggregate data from various sources in an effort to produce positive investment results. The Board also considered that Fidelity's portfolio managers and analysts have access to daily portfolio attribution that allows for monitoring of a fund's portfolio, as well as an electronic communication system that provides immediate real-time access to research concerning issuers and credit enhancers.
Shareholder and Administrative Services. The Board considered (i) the nature, extent, quality, and cost of advisory, administrative, distribution, and shareholder services performed by the Investment Advisers and their affiliates under the Advisory Contracts and under separate agreements covering transfer agency, pricing and bookkeeping, and securities lending services for the fund; (ii) the nature and extent of the Investment Advisers' supervision of third party service providers, principally custodians and subcustodians; and (iii) the resources devoted to, and the record of compliance with, the fund's compliance policies and procedures. The Board also reviewed the allocation of fund brokerage, including allocations to brokers affiliated with the Investment Advisers, the use of brokerage commissions to pay fund expenses, and the use of "soft" commission dollars to pay for research services. The Board further considered that Fidelity voluntarily pays for market data out of its own resources.
The Board noted that the growth of fund assets across the complex allows Fidelity to reinvest in the development of services designed to enhance the value or convenience of the Fidelity funds as investment vehicles. These services include 24-hour access to account information and market information through phone representatives and over the Internet, and investor education materials and asset allocation tools.
Investment in a Large Fund Family. The Board considered the benefits to shareholders of investing in a Fidelity fund, including the benefits of investing in a fund that is part of a large family of funds offering a variety of investment disciplines and providing for a large variety of mutual fund investor services. For example, fund shareholders are offered the privilege of exchanging shares of a fund for shares of other Fidelity funds, as set forth in the fund's prospectus, without paying a sales charge. The Board noted that Fidelity has taken a number of actions over the previous year that benefited particular funds, including (i) dedicating additional resources to investment research and to restructure the investment research teams; (ii) contractually agreeing to reduce the management fees on Fidelity's Institutional Money Market Funds and launching Class IV and Institutional Class of certain of these funds; (iii) reducing the transfer agent fees for the Fidelity Select Portfolios and Investor Class of the VIP funds; and (iv) launching Class K of 29 equity funds as a lower-fee class available to certain employer-sponsored retirement plans.
Annual Report
Board Approval of Investment Advisory Contracts and Management Fees - continued
Investment Performance. The Board considered whether the fund has operated within its investment objective, as well as its record of compliance with its investment restrictions. It also reviewed the fund's absolute investment performance, as well as the fund's relative investment performance measured against (i) a broad-based securities market index, and (ii) a peer group of mutual funds deemed appropriate by the Board over multiple periods.
The following charts considered by the Board show, over the one-, three-, and five-year periods ended December 31, 2007, the fund's cumulative total returns, the cumulative total returns of a broad-based securities market index ("benchmark"), and a range of cumulative total returns of a peer group of mutual funds identified by Morningstar, Inc. as having an investment style similar to that of the fund based on underlying portfolio holdings. (Diversified International Fund did not offer Class K as of December 31, 2007.) The box within each chart shows the 25th percentile return (bottom of box) and the 75th percentile return (top of box) of the peer group. Returns shown above the box are in the first quartile and returns shown below the box are in the fourth quartile. The percentage beaten number noted below each chart corresponds to the percentile box and represents the percentage of funds in the peer group whose performance was equal to or lower than that of the fund.
Fidelity Diversified International Fund
The Board reviewed the fund's relative investment performance against its peer group and stated that the performance of the fund was in the first quartile for the one- and five-year periods and the second quartile for the three-year period. The Board also stated that the investment performance of the fund compared favorably to its benchmark for all the periods shown.
The Board also considered that the fund's management fee is subject to upward or downward adjustment depending upon whether, and to what extent, the fund's investment performance for the performance period exceeds, or is exceeded by, the record (over the same period) of a Board-approved performance adjustment index. The Board realizes that the performance adjustment provides FMR with a strong economic incentive to seek to achieve superior performance for the fund's shareholders and helps to more closely align the interests of FMR and the fund's shareholders.
The Board considered that FMR has taken steps to refocus and strengthen equity research, equity portfolio management, and compliance.
Based on its review, and giving particular weight to the nature and quality of the resources dedicated by the Investment Advisers to maintain and improve relative performance, the Board concluded that the nature, extent, and quality of the services provided to the fund will benefit the fund's shareholders, particularly in light of the Board's view that the fund's shareholders benefit from investing in a fund that is part of a large family of funds offering a variety of investment disciplines and services.
Competitiveness of Management Fee and Total Fund Expenses. The Board considered the fund's management fee and total expenses compared to "mapped groups" of competitive funds and classes. Fidelity creates "mapped groups" by combining similar Lipper investment objective categories that have comparable management fee characteristics. Combining Lipper investment objective categories aids the Board's management fee and total expense comparisons by broadening the competitive group used for comparison and by reducing the number of universes to which various Fidelity funds are compared. The Board also considered supplemental information about how the fund's management fee and total expenses ranked relative to groups based on Lipper classifications, which take into account a fund's market capitalization and style.
Annual Report
The Board considered two proprietary management fee comparisons for the 12-month periods shown in the charts below. The group of Lipper funds used by the Board for management fee comparisons is referred to below as the "Total Mapped Group." The Total Mapped Group comparison focuses on a fund's standing relative to the total universe of comparable funds available to investors, in terms of gross management fees before expense reimbursements or caps, and without giving effect to the fund's performance adjustment. "TMG %" represents the percentage of funds in the Total Mapped Group that had management fees that were lower than the fund's. For example, a TMG % of 14% means that 86% of the funds in the Total Mapped Group had higher management fees than the fund. The "Asset-Size Peer Group" (ASPG) comparison focuses on a fund's standing relative to non-Fidelity funds similar in size to the fund within the Total Mapped Group. The ASPG represents at least 15% of the funds in the Total Mapped Group with comparable asset size and management fee characteristics, subject to a minimum of 50 funds (or all funds in the Total Mapped Group if fewer than 50). Additional information, such as the ASPG quartile in which the fund's management fee ranked and the impact of the fund's performance adjustment, is also included in the charts and considered by the Board.
Fidelity Diversified International Fund
The Board noted that the fund's management fee ranked below the median of its Total Mapped Group and below the median of its ASPG for 2007. The Board also noted the effect of the fund's positive performance adjustment on the fund's management fee ranking. The Board noted that the performance adjustment for each year represents calculations for performance periods that differ from the periods shown in the performance charts above.
In connection with the renewal of the fund's management contract, the Board also approved non-material amendments to the fund's management contract to clarify certain provisions regarding the calculation of the fund's performance adjustment.
Based on its review, the Board concluded that the fund's management fee was fair and reasonable in light of the services that the fund receives and the other factors considered.
In its review of the fund's total expenses, the Board considered the fund's management fee as well as other fund expenses, such as transfer agent fees, pricing and bookkeeping fees, and custodial, legal, and audit fees. The Board also noted the effects of any waivers and reimbursements on fees and expenses, as well as the impact of the fund's performance adjustment. As part of its review, the Board also considered current and historical total expenses of the fund compared to competitive fund median expenses. The fund is compared to those funds and classes in the Total Mapped Group (used by the Board for management fee comparisons) that have a similar sales load structure.
The Board noted that the fund's total expenses ranked below its competitive median for 2007.
In its review of total expenses, the Board also considered Fidelity fee structures and other information on clients that FMR and its affiliates service in other competitive markets, such as other mutual funds advised or subadvised by FMR or its affiliates, pension plan clients, and other institutional clients.
Based on its review, the Board concluded that the fund's total expenses were reasonable in light of the services that the fund and its shareholders receive and the other factors considered.
Annual Report
Board Approval of Investment Advisory Contracts and Management Fees - continued
Costs of the Services and Profitability. The Board considered the revenues earned and the expenses incurred by Fidelity in conducting the business of developing, marketing, distributing, managing, administering and servicing the fund and its shareholders. The Board also considered the level of Fidelity's profits in respect of all the Fidelity funds.
On an annual basis, FMR presents to the Board Fidelity's profitability for the fund. Fidelity calculates the profitability for the fund, as well as aggregate profitability for groups of Fidelity funds and all Fidelity funds, using a series of detailed revenue and cost allocation methodologies which originate with the audited books and records of Fidelity. The Audit Committee of the Board reviews any significant changes from the prior year's methodologies.
PricewaterhouseCoopers LLP (PwC), independent registered public accounting firm and auditor to Fidelity and certain Fidelity funds, has been engaged annually by the Board as part of the Board's assessment of the results of Fidelity's profitability analysis. PwC's engagement includes the review and assessment of Fidelity's methodologies used in determining the revenues and expenses attributable to Fidelity's mutual fund business, and completion of agreed-upon procedures surrounding the mathematical accuracy of fund profitability and its conformity to allocation methodologies. After considering PwC's reports issued under the engagement and information provided by Fidelity, the Board believes that while other allocation methods may also be reasonable, Fidelity's profitability methodologies are reasonable in all material respects.
The Board has also reviewed Fidelity's non-fund businesses and any fall-out benefits related to the mutual fund business as well as cases where Fidelity's affiliates may benefit from or be related to the fund's business.
The Board considered the costs of the services provided by and the profits realized by Fidelity in connection with the operation of the fund and determined that the amount of profit is a fair entrepreneurial profit for the management of the fund.
Economies of Scale. The Board considered whether there have been economies of scale in respect of the management of the Fidelity funds, whether the Fidelity funds (including the fund) have appropriately benefited from any such economies of scale, and whether there is potential for realization of any further economies of scale. The Board considered the extent to which the fund will benefit from economies of scale through increased services to the fund, through waivers or reimbursements, or through fee or expense reductions.
The Board recognized that the fund's management contract incorporates a "group fee" structure, which provides for lower group fee rates as total fund assets under FMR's management increase, and for higher group fee rates as total fund assets under FMR's management decrease. FMR determines the group fee rates based on a tiered asset "breakpoint" schedule. The Board considered that the group fee is designed to deliver the benefits of economies of scale to fund shareholders when total fund assets increase, even if assets of any particular fund are unchanged or have declined, because some portion of Fidelity's costs are attributable to services provided to all Fidelity funds, and all funds benefit if those costs can be allocated among more assets. The Board also considered that although Diversified International Fund is partially closed to new investors, it continues to incur investment management expenses, and marketing and distribution expenses related to the retention of existing shareholders and assets. The Board further noted that Diversified International Fund may continue to realize benefits from the group fee structure, even though assets may not be expected to grow significantly at the fund level. The Board concluded that, given the group fee structure, fund shareholders will achieve a certain level of economies of scale as assets under FMR's management increase at the fund complex level, regardless of whether Fidelity achieves any such economies of scale.
The Board further concluded that any potential economies of scale are being shared between fund shareholders and Fidelity in an appropriate manner.
Additional Information Requested by the Board. In order to develop fully the factual basis for consideration of the Fidelity funds' Advisory Contracts, the Board requested and received additional information on certain topics, including (i) fund performance trends and actions to be taken by FMR to improve certain funds' overall performance; (ii) portfolio manager changes that have occurred during the past year; (iii) Fidelity's fund profitability methodology, the profitability of certain fund service providers, and profitability trends for certain funds; (iv) Fidelity's compensation structure for portfolio managers and key personnel, including its effects on fund profitability and the extent to which portfolio manager compensation is linked to fund performance; (v) Fidelity's fee structures and rationale for recommending different fees among categories of funds; and (vi) Fidelity's rationale for recommending which funds should have a performance adjustment component as part of their management fees.
Based on its evaluation of all of the conclusions noted above, and after considering all material factors, the Board ultimately concluded that the advisory fee structures are fair and reasonable, and that the fund's Advisory Contracts should be renewed.
Annual Report
Managing Your Investments
Fidelity offers several ways to conveniently manage your personal investments via your telephone or PC. You can access your account information, conduct trades and research your investments 24 hours a day.
By Phone
Fidelity Automated Service Telephone provides a single toll-free number to access account balances, positions, quotes and trading. It's easy to navigate the service, and on your first call, the system will help you create a personal identification number (PIN) for security.
(phone_graphic)
Fidelity Automated Service Telephone (FAST®)
1-800-544-5555
Press
 For mutual fund and brokerage trading.
 For quotes.*
 For account balances and holdings.
 To review orders and mutual fund activity.
 To change your PIN.

 To speak to a Fidelity representative.
By PC
Fidelity's web site on the Internet provides a wide range of information, including daily financial news, fund performance, interactive planning tools and news about Fidelity products and services.
(computer_graphic)
Fidelity's Web Site
www.fidelity.com
* When you call the quotes line, please remember that a fund's yield and return will vary and, except for money market funds, share price will also vary. This means that you may have a gain or loss when you sell your shares. There is no assurance that money market funds will be able to maintain a stable $1 share price; an investment in a money market fund is not insured or guaranteed by the U.S. government. Total returns are historical and include changes in share price, reinvestment of dividends and capital gains, and the effects of any sales charges.
Annual Report
To Write Fidelity
We'll give your correspondence immediate attention and send you written confirmation upon completion of your request.
(letter_graphic)
Making Changes
To Your Account
(such as changing name, address, bank, etc.)
Fidelity Investments
P.O. Box 770001
Cincinnati, OH 45277-0002
(letter_graphic)
For Non-Retirement
Accounts
Buying shares
Fidelity Investments
P.O. Box 770001
Cincinnati, OH 45277-0003
Overnight Express
Fidelity Investments
Attn: Distribution Services
100 Crosby Parkway - KC1H
Covington, KY 41015
Selling shares
Fidelity Investments
P.O. Box 770001
Cincinnati, OH 45277-0035
Overnight Express
Fidelity Investments
Attn: Distribution Services
100 Crosby Parkway - KC1H
Covington, KY 41015
General Correspondence
Fidelity Investments
P.O. Box 500
Merrimack, NH 03054-0500
(letter_graphic)
For Retirement
Accounts
Buying shares
Fidelity Investments
P.O. Box 770001
Cincinnati, OH 45277-0003
Selling shares
Fidelity Investments
P.O. Box 770001
Cincinnati, OH 45277-0035
Overnight Express
Fidelity Investments
Attn: Distribution Services
100 Crosby Parkway - KC1H
Covington, KY 41015
General Correspondence
Fidelity Investments
P.O. Box 500
Merrimack, NH 03054-0500
Annual Report
Investment Adviser
Fidelity Management & Research Company
Boston, MA
Investment Sub-Advisers
FMR Co., Inc.
Fidelity Management & Research (U.K.) Inc.
Fidelity Research & Analysis Company
FIL Investment Advisors
FIL Investment Advisors (U.K.) Ltd.
Fidelity Investments Japan Limited
Fidelity Management & Research
(Hong Kong) Limited
Fidelity Management & Research
(Japan) Inc.
General Distributor
Fidelity Distributors Corporation
Boston, MA
Transfer and Service Agents
Fidelity Investments Institutional
Operations Company, Inc.
Boston, MA
Fidelity Service Company, Inc.
Boston, MA
Custodian
JPMorgan Chase Bank
New York, NY
Corporate Headquarters
82 Devonshire Street
Boston, MA 02109
1-800-544-8888
The Fidelity Telephone Connection
Mutual Fund 24-Hour Service
Exchanges/Redemptions
and Account Assistance 1-800-544-6666
Product Information 1-800-544-8888
Retirement Accounts 1-800-544-4774
(8 a.m. - 9 p.m.)
TDD Service 1-800-544-0118
for the deaf and hearing impaired
(9 a.m. - 9 p.m. Eastern time)
Fidelity Automated Service
Telephone (FAST®) 1-800-544-5555
Automated line for quickest service
DIF-K-UANN-1208
1.863004.100

Fidelity®
Overseas
Fund -
Class K
Annual Report
October 31, 2008
(2_fidelity_logos) (Registered_Trademark)
Contents
Chairman's Message | <Click Here> | Ned Johnson's message to shareholders. |
Performance | <Click Here> | How the fund has done over time. |
Management's Discussion | <Click Here> | The manager's review of fund performance, strategy and outlook. |
Shareholder Expense Example | <Click Here> | An example of shareholder expenses. |
Investment Changes | <Click Here> | A summary of major shifts in the fund's investments over the past six months. |
Investments | <Click Here> | A complete list of the fund's investments with their market values. |
Financial Statements | <Click Here> | Statements of assets and liabilities, operations, and changes in net assets, as well as financial highlights. |
Notes | <Click Here> | Notes to the financial statements. |
Report of Independent Registered Public Accounting Firm | <Click Here> | |
Trustees and Officers | <Click Here> | |
Proxy Voting Results | <Click Here> | |
Board Approval of Investment Advisory Contracts and Management Fees | <Click Here> | |
To view a fund's proxy voting guidelines and proxy voting record for the 12-month period ended June 30, visit http://www.fidelity.com (search for "proxy voting guidelines") or visit the Securities and Exchange Commission's (SEC) web site at http://www.sec.gov. You may also call 1-800-544-8544 to request a free copy of the proxy voting guidelines.
Standard & Poor's, S&P and S&P 500 are registered service marks of The McGraw-Hill Companies, Inc. and have been licensed for use by Fidelity Distributors Corporation.
Other third party marks appearing herein are the property of their respective owners.
All other marks appearing herein are registered or unregistered trademarks or service marks of FMR LLC or an affiliated company.
This report and the financial statements contained herein are submitted for the general information of the shareholders of the fund. This report is not authorized for distribution to prospective investors in the fund unless preceded or accompanied by an effective prospectus.
A fund files its complete schedule of portfolio holdings with the SEC for the first and third quarters of each fiscal year on Form N-Q. Forms N-Q are available on the SEC's web site at http://www.sec.gov. A fund's Forms N-Q may be reviewed and copied at the SEC's Public Reference Room in Washington, DC. Information regarding the operation of the SEC's Public Reference Room may be obtained by calling 1-800-SEC-0330. For a complete list of a fund's portfolio holdings, view the most recent holdings listing, semiannual report, or annual report on Fidelity's web site at http://www.fidelity.com or http://www.advisor.fidelity.com, as applicable.
NOT FDIC INSURED · MAY LOSE VALUE · NO BANK GUARANTEE
Neither the funds nor Fidelity Distributors Corporation is a bank.
Annual Report
(photo_of_Edward_C_Johnson_3d)
Dear Shareholder:
Turmoil has been the watchword for the world's securities markets in 2008, with domestic and international stocks down sharply amid the global credit squeeze. A flight to quality boosted returns for U.S. Treasuries, one of the few asset classes with positive results heading into the latter stages of the year. Financial markets are always unpredictable, but there are a number of time-tested principles that can put the historical odds in your favor.
One of the basic tenets is to invest for the long term. Over time, riding out the markets' inevitable ups and downs has proven much more effective than selling into panic or chasing the hottest trend. Even missing only a few of the markets' best days can significantly diminish investor returns. Patience also affords the benefits of compounding - of earning interest on additional income or reinvested dividends and capital gains. There are tax advantages and cost benefits to consider as well. The more you sell, the more taxes you pay, and the more you trade, the higher the costs. While staying the course doesn't eliminate risk, it can considerably lessen the effect of short-term declines.
You can further manage your investing risk through diversification. And today, more than ever, geographic diversification should be taken into account. Studies indicate that asset allocation is the single most important determinant of a portfolio's long-term success. The right mix of stocks, bonds and cash - aligned to your particular risk tolerance and investment objective - is very important. Age-appropriate rebalancing is also an essential aspect of asset allocation. For younger investors, an emphasis on equities - which historically have been the best-performing asset class over time - is encouraged. As investors near their specific goal, such as retirement or sending a child to college, consideration may be given to replacing volatile assets (e.g. common stocks) with more-stable fixed investments (bonds or savings plans).
A third investment principle - investing regularly - can help lower the average cost of your purchases. Investing a certain amount of money each month or quarter helps ensure you won't pay for all your shares at market highs. This strategy - known as dollar cost averaging - also reduces unconstructive "emotion" from investing, helping shareholders avoid selling weak performers just prior to an upswing, or chasing a hot performer just before a correction.
We invite you to contact us via the Internet, through our Investor Centers or over the phone. It is our privilege to provide you the information you need to make the investments that are right for you.
Sincerely,
/s/Edward C. Johnson 3d
Edward C. Johnson 3d
Annual Report
Average annual total return reflects the change in the value of an investment, assuming reinvestment of the class' dividend income and capital gains (the profits earned upon the sale of securities that have grown in value, if any) and assuming a constant rate of performance each year. The $10,000 table and the fund's returns do not reflect the deduction of taxes that a shareholder would pay on fund distributions or the redemption of fund shares. During periods of reimbursement by Fidelity, a fund's total return will be greater than it would be had the reimbursement not occurred. How a fund did yesterday is no guarantee of how it will do tomorrow.
Average Annual Total Returns
Periods ended October 31, 2008 | Past 1
year | Past 5
years | Past 10
years |
Class K A | -50.84% | 2.60% | 2.04% |
A The initial offering of Class K shares took place on May 9, 2008. Returns prior to May 9, 2008 are those of Overseas, the original class of the fund.
$10,000 Over 10 Years
Let's say hypothetically that $10,000 was invested in Fidelity® Overseas Fund - Class K on October 31, 1998. The chart shows how the value of your investment would have changed, and also shows how the MSCI® Europe, Australasia, Far East (MSCI EAFE®) Index performed over the same period. The initial offering of Class K took place on May 9, 2008. See above for additional information regarding the performance of Class K.
Annual Report
Comments from Ian Hart, Portfolio Manager of Fidelity® Overseas Fund
In a dramatic reversal of what had been a multiyear global growth story, international stocks fell long and hard during the 12 months ending October 31, 2008, especially so during the latter stages of the period and mostly as a result of fallout from the financial crisis that emanated from the United States. The viral spread of this financial contagion - which began in the U.S. subprime mortgage market, then seized up the credit markets, hobbled major financial institutions and eventually slowed economic growth worldwide - left virtually no corner of the globe untouched. Developed international equity markets - as gauged by the MSCI® Europe, Australasia, Far East (EAFE®) Index, which monitors established markets outside the U.S. and Canada - fell 46.54%, while the Standard & Poor's 500SM Index, a measure of U.S. stocks, dropped 36.10%. Among countries constituting at least 1% of the EAFE index, Switzerland had the "least worst" showing, falling roughly 32%, followed by Japan, where stocks slid by around 37%. Meanwhile, the weakest overall performance came from Belgium, where stocks slipped by nearly 70%. In the United Kingdom, the largest component of the index, equities were down almost 48%. Emerging markets were the weakest performers among the global economies, declining 56.22% as measured by the MSCI Emerging Markets Index.
The fund's Class K shares trailed the MSCI EAFE index during the past year, mostly due to unfavorable security selection. (For specific class-level returns, please see the performance section of this report.) A large amount of this underperformance came from some of the fund's biggest positions, especially in the energy and utilities sectors, which were among the hardest-hit by the abrupt slowdown in global growth. Aker Solutions, a Norwegian engineering and construction services company with heavy exposure to deep-water energy production, was the biggest detractor, its order book getting thinner as oil prices retreated. Similarly, Hochtief, a German construction company, and Veolia Environnement, a French water and waste management utility, also fell hard as new orders slowed. Suzlon Energy, an out-of-index India-based maker of wind turbines, experienced a manufacturing quality-control problem, among other issues, which punished the stock and led me to sell the position. On the upside, the fund's best contributors were NTT DoCoMo, a Japanese mobile phone operator whose solid results also were helped by the appreciating yen; U.S.-based Baxter International, a multinational medical products company with interests in the growing blood plasma market; and Actelion, a Swiss drug maker. An average cash position of around 6% also gave us a nice lift.
The views expressed above reflect those of the portfolio manager(s) only through the end of the period as stated on the cover of this report and do not necessarily represent the views of Fidelity or any other person in the Fidelity organization. Any such views are subject to change at any time based upon market or other conditions and Fidelity disclaims any responsibility to update such views. These views may not be relied on as investment advice and, because investment decisions for a Fidelity fund are based on numerous factors, may not be relied on as an indication of trading intent on behalf of any Fidelity fund.
Annual Report
Overseas
Shareholder Expense Example
As a shareholder of the Fund, you incur two types of costs: (1) transaction costs, including redemption fees, and (2) ongoing costs, including management fees and other Fund expenses. This Example is intended to help you understand your ongoing costs (in dollars) of investing in the Fund and to compare these costs with the ongoing costs of investing in other mutual funds.
The actual expense Example is based on an investment on $1,000 invested at the beginning of the period and held for the entire period (May 1, 2008 to October 31, 2008) for Overseas and for the entire period (May 9, 2008 to October 31, 2008) for Class K. The hypothetical expense Example is based on an investment of $1,000 invested for the one-half year period (May 1, 2008 to October 31, 2008).
Actual Expenses
The first line of the accompanying table for each class of the Fund provides information about actual account values and actual expenses. You may use the information in this line, together with the amount you invested, to estimate the expenses that you paid over the period. Simply divide your account value by $1,000.00 (for example, an $8,600 account value divided by $1,000.00 = 8.6), then multiply the result by the number in the first line for a class of the Fund under the heading entitled "Expenses Paid During Period" to estimate the expenses you paid on your account during this period. A small balance maintenance fee of $12.00 that is charged once a year may apply for certain accounts with a value of less than $2,000. This fee is not included in the table below. If it was, the estimate of expenses you paid during the period would be higher, and your ending account value lower, by this amount. In addition, the Fund, as a shareholder in the underlying Fidelity Central Funds, will indirectly bear its pro rata share of the fees and expenses incurred by the underlying Fidelity Central Funds. These fees and expenses are not included in the Fund's annualized expense ratio used to calculate the expense estimate in the table below.
Hypothetical Example for Comparison Purposes
The second line of the accompanying table for each class of the Fund provides information about hypothetical account values and hypothetical expenses based on a Class' actual expense ratio and an assumed rate of return of 5% per year before expenses, which is not the Class' actual return. The hypothetical account values and expenses may not be used to estimate the actual ending account balance or expenses you paid for the period. You may use this information to compare the ongoing costs of investing in the Fund and other funds. To do so, compare this 5% hypothetical example with the 5% hypothetical examples that appear in the shareholder reports of the other funds. A small balance maintenance fee of $12.00 that is charged once a year may apply for certain accounts with a value of less than $2,000. This fee is not included in the table below. If it was, the estimate of expenses you paid during the period would be higher, and your ending account value lower, by this amount. In addition, the Fund, as a shareholder in the underlying Fidelity Central Funds, will indirectly bear its pro rata share of the fees and expenses incurred by the underlying Fidelity Central Funds. These fees and expenses are not included in the Fund's annualized expense ratio used to calculate the expense estimate in the table below.
Please note that the expenses shown in the table are meant to highlight your ongoing costs only and do not reflect any transaction costs. Therefore, the second line of the table is useful in comparing ongoing costs only, and will not help you determine the relative total costs of owning different funds. In addition, if these transactional costs were included, your costs would have been higher.
| Annualized
Expense Ratio | Beginning
Account Value | Ending
Account Value
October 31, 2008 | Expenses Paid
During Period |
Overseas | 1.10% | | | |
Actual | | $ 1,000.00 | $ 564.40 | $ 4.33 B |
HypotheticalA | | $ 1,000.00 | $ 1,019.61 | $ 5.58 C |
Class K | .96% | | | |
Actual | | $ 1,000.00 | $ 565.60 | $ 3.61 B |
Hypothetical A | | $ 1,000.00 | $ 1,020.31 | $ 4.88 C |
A 5% return per year before expenses
B Actual expenses are equal to each Class' annualized expense ratio, multiplied by the average account value over the period, multiplied by 184/366 (to reflect the one-half year period) for Overseas and multiplied by 176/366 (to reflect the period May 9, 2008 to October 31, 2008) for Class K.
C Hypothetical expenses are equal to each Class' annualized expense ratio, multiplied by the average account value over the period, multiplied by 184/366 (to reflect the one-half year period).
Annual Report
Overseas
Investment Changes (Unaudited)
Geographic Diversification (% of fund's net assets) |
As of October 31, 2008 |
| United Kingdom | 22.3% | |
| Japan | 16.0% | |
| France | 14.8% | |
| Germany | 10.2% | |
| Switzerland | 7.4% | |
| Hong Kong | 5.5% | |
| United States of America | 5.4% | |
| Italy | 4.3% | |
| Indonesia | 2.8% | |
| Other | 11.3% | |

Percentages are adjusted for the effect of futures contracts, if applicable. |
|
As of April 30, 2008 |
| France | 16.7% | |
| United States of America | 13.0% | |
| Japan | 10.9% | |
| United Kingdom | 10.3% | |
| Germany | 9.0% | |
| Italy | 6.7% | |
| Switzerland | 5.1% | |
| Hong Kong | 4.1% | |
| Brazil | 3.5% | |
| Other | 20.7% | |

Percentages are adjusted for the effect of futures contracts, if applicable. |
Asset Allocation |
| % of fund's
net assets | % of fund's net assets
6 months ago |
Stocks | 99.0 | 91.4 |
Short-Term Investments and Net Other Assets | 1.0 | 8.6 |
Top Ten Stocks as of October 31, 2008 |
| % of fund's
net assets | % of fund's net assets
6 months ago |
China Unicom Ltd. sponsored ADR (Hong Kong, Diversified Telecommunication Services) | 4.7 | 4.1 |
Unilever PLC (United Kingdom, Food Products) | 3.5 | 0.0 |
Pernod Ricard SA (France, Beverages) | 3.3 | 5.7 |
PT Indosat Tbk sponsored ADR (Indonesia, Diversified Telecommunication Services) | 2.8 | 2.3 |
Royal Dutch Shell PLC Class B ADR (United Kingdom, Oil, Gas & Consumable Fuels) | 2.2 | 0.0 |
Roche Holding AG (participation certificate) (Switzerland, Pharmaceuticals) | 2.0 | 0.9 |
Sodexho Alliance SA ADR (France, Hotels, Restaurants & Leisure) | 1.9 | 1.9 |
Vivo Participacoes SA sponsored ADR (Brazil, Wireless Telecommunication Services) | 1.8 | 2.4 |
NTT DoCoMo, Inc. (Japan, Wireless Telecommunication Services) | 1.6 | 1.2 |
GlaxoSmithKline PLC (United Kingdom, Pharmaceuticals) | 1.6 | 0.0 |
| 25.4 | |
Market Sectors as of October 31, 2008 |
| % of fund's
net assets | % of fund's net assets
6 months ago |
Financials | 19.2 | 23.2 |
Telecommunication Services | 13.5 | 12.1 |
Consumer Staples | 13.1 | 6.7 |
Health Care | 12.8 | 5.5 |
Consumer Discretionary | 10.5 | 6.3 |
Energy | 8.2 | 7.5 |
Materials | 5.8 | 7.0 |
Information Technology | 5.8 | 4.9 |
Industrials | 5.4 | 10.4 |
Utilities | 4.7 | 7.8 |
Annual Report
Overseas
Investments October 31, 2008
Showing Percentage of Net Assets
Common Stocks - 99.0% |
| Shares | | Value |
Australia - 1.2% |
AMP Ltd. | 5,900,427 | | $ 21,451,719 |
CSL Ltd. | 1,874,540 | | 45,564,430 |
TOTAL AUSTRALIA | | 67,016,149 |
Bermuda - 0.7% |
Willis Group Holdings Ltd. | 1,517,900 | | 39,829,696 |
Brazil - 1.8% |
Vivo Participacoes SA sponsored ADR (d) | 9,054,040 | | 99,051,198 |
Canada - 0.5% |
Harry Winston Diamond Corp. | 3,059,000 | | 29,808,633 |
China - 0.7% |
Global Bio-Chem Technology Group Co. Ltd. | 103,690,000 | | 14,451,053 |
Li Ning Co. Ltd. | 19,226,000 | | 23,792,971 |
TOTAL CHINA | | 38,244,024 |
Finland - 0.7% |
Nokia Corp. sponsored ADR | 2,429,600 | | 36,881,328 |
France - 14.8% |
Accor SA (d) | 913,100 | | 35,524,443 |
Alstom SA | 582,100 | | 28,851,014 |
AXA SA | 1,376,500 | | 26,296,713 |
BNP Paribas SA | 285,200 | | 20,591,810 |
Carrefour SA | 1,426,300 | | 60,253,971 |
Credit Agricole SA | 2,742,800 | | 39,680,113 |
GDF Suez | 1,321,000 | | 59,048,125 |
L'Oreal SA | 392,400 | | 29,714,113 |
Pernod Ricard SA | 2,824,084 | | 183,900,633 |
Pinault Printemps-Redoute SA | 420,000 | | 26,766,784 |
Sanofi-Aventis | 769,900 | | 48,778,637 |
Societe Generale Series A | 800,900 | | 43,653,059 |
Sodexo Alliance SA ADR | 2,159,000 | | 102,012,750 |
Total SA Series B | 1,083,100 | | 59,585,051 |
Unibail-Rodamco | 200,300 | | 30,041,937 |
Veolia Environnement | 825,937 | | 20,468,052 |
TOTAL FRANCE | | 815,167,205 |
Germany - 10.2% |
Adidas-Salomon AG | 1,562,900 | | 55,497,675 |
Allianz AG (Reg.) | 344,600 | | 25,788,756 |
BASF AG | 852,300 | | 28,659,652 |
Bayer AG | 973,500 | | 54,194,446 |
Daimler AG | 1,775,500 | | 61,254,750 |
Deutsche Bank AG | 346,600 | | 13,161,450 |
Deutsche Bank AG (NY Shares) | 233,800 | | 8,879,724 |
Deutsche Boerse AG | 568,883 | | 45,486,444 |
E.ON AG | 1,528,773 | | 58,485,949 |
Hochtief AG (d) | 172,994 | | 5,406,570 |
Linde AG | 615,800 | | 51,715,981 |
Muenchener Rueckversicherungs-Gesellschaft AG (Reg.) | 387,176 | | 51,387,938 |
|
| Shares | | Value |
RWE AG | 942,800 | | $ 78,788,883 |
SAP AG | 615,000 | | 21,897,789 |
TOTAL GERMANY | | 560,606,007 |
Hong Kong - 5.5% |
China Unicom Ltd. sponsored ADR (d) | 17,825,600 | | 256,866,894 |
Hutchison Whampoa Ltd. | 8,687,000 | | 46,388,580 |
TOTAL HONG KONG | | 303,255,474 |
India - 1.7% |
Allahabad Bank | 10,885,323 | | 10,799,305 |
Bank of Baroda | 6,190,852 | | 30,755,998 |
Gammon India Ltd. | 3,139,930 | | 4,904,991 |
Satyam Computer Services Ltd. sponsored ADR | 2,853,000 | | 44,877,690 |
TOTAL INDIA | | 91,337,984 |
Indonesia - 2.8% |
PT Indosat Tbk sponsored ADR (d) | 6,386,238 | | 155,121,721 |
Italy - 4.3% |
Banco Popolare Scarl | 2,395,200 | | 29,879,990 |
Enel SpA | 5,368,900 | | 35,919,306 |
ENI SpA | 3,616,300 | | 86,314,376 |
Impregilo SpA (a)(d) | 13,600,300 | | 35,875,750 |
Mediobanca SpA | 1,528,200 | | 17,447,116 |
UniCredit SpA | 12,950,400 | | 31,686,062 |
TOTAL ITALY | | 237,122,600 |
Japan - 16.0% |
Aeon Co. Ltd. | 792,900 | | 7,602,786 |
Asahi Glass Co. Ltd. | 1,758,000 | | 11,046,315 |
Bridgestone Corp. | 2,807,500 | | 49,081,003 |
Canon, Inc. sponsored ADR | 1,556,900 | | 53,354,963 |
Citizen Holdings Co. Ltd. | 5,351,200 | | 29,607,195 |
Daiichi Sankyo Co. Ltd. | 972,400 | | 19,937,971 |
East Japan Railway Co. | 5,336 | | 37,969,062 |
Fujifilm Holdings Corp. | 1,104,000 | | 25,413,193 |
Hitachi Ltd. | 6,430,000 | | 30,187,662 |
Honda Motor Co. Ltd. sponsored ADR (d) | 810,500 | | 20,076,085 |
Japan Tobacco, Inc. | 14,930 | | 52,964,092 |
Komatsu Ltd. | 711,200 | | 7,818,299 |
Mitsubishi Corp. | 1,168,800 | | 19,590,258 |
Mitsubishi UFJ Financial Group, Inc. | 13,442,100 | | 84,468,186 |
Nintendo Co. Ltd. | 83,800 | | 26,145,599 |
Nippon Yusen KK | 2,819,000 | | 13,631,089 |
Nomura Holdings, Inc. | 5,930,400 | | 56,183,746 |
NTT DoCoMo, Inc. | 57,113 | | 90,573,692 |
Ricoh Co. Ltd. | 2,680,000 | | 28,840,742 |
Seven & I Holdings Co. Ltd. | 1,274,200 | | 35,775,128 |
Sumitomo Mitsui Financial Group, Inc. | 16,164 | | 64,796,007 |
T&D Holdings, Inc. | 695,150 | | 26,554,297 |
Common Stocks - continued |
| Shares | | Value |
Japan - continued |
THK Co. Ltd. | 1,646,800 | | $ 22,550,571 |
Toyota Motor Corp. sponsored ADR | 874,000 | | 66,502,660 |
TOTAL JAPAN | | 880,670,601 |
Luxembourg - 0.5% |
ArcelorMittal SA (NY Shares)
Class A (d) | 1,015,000 | | 26,643,750 |
Netherlands - 0.1% |
Unilever NV (Certificaten Van Aandelen) | 221,300 | | 5,333,214 |
Netherlands Antilles - 0.4% |
Schlumberger Ltd. (NY Shares) | 432,500 | | 22,338,625 |
Norway - 0.3% |
Aker Solutions ASA | 3,239,950 | | 17,718,247 |
Portugal - 0.4% |
Galp Energia SGPS SA Class B | 2,433,100 | | 22,119,456 |
Spain - 1.7% |
Repsol YPF SA sponsored ADR (d) | 2,556,500 | | 48,880,280 |
Telefonica SA sponsored ADR | 778,400 | | 43,208,984 |
TOTAL SPAIN | | 92,089,264 |
Switzerland - 7.4% |
Actelion Ltd. (Reg.) (a) | 693,363 | | 36,620,979 |
EFG International | 673,735 | | 14,500,783 |
Nestle SA (Reg.) | 1,947,840 | | 75,729,314 |
Novartis AG sponsored ADR | 1,580,500 | | 80,589,695 |
Roche Holding AG (participation certificate) | 736,473 | | 112,602,220 |
Sonova Holding AG | 698,935 | | 29,034,883 |
UBS AG (For. Reg.) | 2,832,544 | | 48,050,196 |
Zurich Financial Services AG (Reg.) | 42,582 | | 8,637,074 |
TOTAL SWITZERLAND | | 405,765,144 |
Turkey - 0.6% |
Turkcell Iletisim Hizmet AS sponsored ADR | 2,678,300 | | 32,862,741 |
United Kingdom - 22.3% |
3i Group PLC | 3,985,900 | | 34,762,749 |
Anglo American PLC ADR | 2,950,200 | | 37,025,010 |
BAE Systems PLC | 8,241,700 | | 46,320,575 |
Barclays PLC Sponsored ADR (d) | 1,996,700 | | 21,504,459 |
BG Group PLC | 2,270,500 | | 33,381,197 |
BT Group PLC | 10,661,000 | | 20,030,039 |
Experian PLC | 4,923,800 | | 27,151,274 |
GlaxoSmithKline PLC | 4,576,800 | | 87,973,349 |
HBOS PLC | 2,103,841 | | 3,444,463 |
HSBC Holdings PLC sponsored ADR (d) | 1,037,100 | | 61,188,900 |
Kingfisher PLC | 12,348,400 | | 22,789,191 |
Land Securities Group PLC | 1,906,600 | | 33,839,383 |
Lloyds TSB Group PLC sponsored ADR (d) | 3,016,600 | | 38,129,824 |
Man Group PLC | 4,212,300 | | 24,316,634 |
|
| Shares | | Value |
Marks & Spencer Group PLC | 7,576,600 | | $ 26,856,971 |
Misys PLC | 11,932,200 | | 21,363,111 |
Pearson PLC | 2,180,700 | | 21,717,783 |
Prudential PLC | 2,669,000 | | 13,405,636 |
Rexam PLC | 4,242,700 | | 25,562,541 |
Rio Tinto PLC (Reg.) | 1,380,500 | | 64,478,162 |
Royal Bank of Scotland Group PLC | 7,681,297 | | 8,460,032 |
Royal Dutch Shell PLC Class B ADR | 2,154,300 | | 119,111,247 |
Shire PLC | 3,897,100 | | 51,246,650 |
Smith & Nephew PLC | 5,925,800 | | 54,251,922 |
Standard Chartered PLC (United Kingdom) | 1,896,800 | | 31,344,600 |
Unilever PLC | 8,647,200 | | 194,242,572 |
Vodafone Group PLC sponsored ADR | 2,245,900 | | 43,278,493 |
William Hill PLC | 6,391,800 | | 19,650,410 |
WPP Group PLC | 7,373,000 | | 44,098,024 |
TOTAL UNITED KINGDOM | | 1,230,925,201 |
United States of America - 4.4% |
Baxter International, Inc. | 794,800 | | 48,077,452 |
Estee Lauder Companies, Inc. Class A | 920,100 | | 33,160,404 |
Freeport-McMoRan Copper & Gold, Inc. Class B | 1,917,100 | | 55,787,610 |
Hess Corp. | 612,400 | | 36,872,604 |
Johnson & Johnson | 525,000 | | 32,203,500 |
The Coca-Cola Co. | 609,400 | | 26,850,164 |
Virgin Media, Inc. | 1,454,543 | | 8,378,168 |
TOTAL UNITED STATES OF AMERICA | | 241,329,902 |
TOTAL COMMON STOCKS (Cost $7,355,907,113) | 5,451,238,164 |
Money Market Funds - 6.9% |
| | | |
Fidelity Cash Central Fund, 1.81% (b) | 314,710,301 | | 314,710,301 |
Fidelity Securities Lending Cash Central Fund, 2.67% (b)(c) | 65,761,125 | | 65,761,125 |
TOTAL MONEY MARKET FUNDS (Cost $380,471,426) | 380,471,426 |
TOTAL INVESTMENT PORTFOLIO - 105.9% (Cost $7,736,378,539) | | 5,831,709,590 |
NET OTHER ASSETS - (5.9)% | | (322,531,422) |
NET ASSETS - 100% | 5,509,178,168 |
Legend |
(a) Non-income producing |
(b) Affiliated fund that is available only to investment companies and other accounts managed by Fidelity Investments. The rate quoted is the annualized seven-day yield of the fund at period end. A complete unaudited listing of the fund's holdings as of its most recent quarter end is available upon request. |
(c) Investment made with cash collateral received from securities on loan. |
(d) Security or a portion of the security is on loan at period end. |
Affiliated Central Funds |
Information regarding fiscal year to date income earned by the Fund from investments in Fidelity Central Funds is as follows: |
Fund | Income earned |
Fidelity Cash Central Fund | $ 13,797,316 |
Fidelity Securities Lending Cash Central Fund | 10,402,470 |
Total | $ 24,199,786 |
Other Affiliated Issuers |
An affiliated company is a company in which the fund has ownership of at least 5% of the voting securities. Fiscal year to date transactions with companies which are or were affiliates are as follows: |
Affiliates | Value,
beginning
of period | Purchases | Sales
Proceeds | Dividend
Income | Value,
end of
period |
Aker Solutions ASA | $ 509,546,689 | $ 14,659,742 | $ 238,544,438 | $ 4,093,592 | $ - |
Global Bio-Chem Technology Group Co. Ltd. | 42,632,796 | 14,345,947 | 12,428,483 | 556,974 | - |
Harry Winston Diamond Corp. | - | 15,228,392 | 10,609,736 | 507,037 | - |
Impregilo SpA | 135,232,253 | 46,487,532 | 46,151,761 | - | - |
Total | $ 687,411,738 | $ 90,721,613 | $ 307,734,418 | $ 5,157,603 | $ - |
Income Tax Information |
At October 31, 2008, the Fund had a capital loss carryforward of approximately $859,201,568 all of which will expire on October 31, 2016. |
See accompanying notes which are an integral part of the financial statements.
Annual Report
Overseas
Financial Statements
Statement of Assets and Liabilities
| October 31, 2008 |
| | |
Assets | | |
Investment in securities, at value (including securities loaned of $62,305,881) - See accompanying schedule: Unaffiliated issuers (cost $7,355,907,113) | $ 5,451,238,164 | |
Fidelity Central Funds (cost $380,471,426) | 380,471,426 | |
Total Investments (cost $7,736,378,539) | | $ 5,831,709,590 |
Receivable for investments sold | | 161,451,447 |
Receivable for fund shares sold | | 19,472,456 |
Dividends receivable | | 13,604,003 |
Distributions receivable from Fidelity Central Funds | | 800,371 |
Prepaid expenses | | 2,499 |
Other receivables | | 9,811,804 |
Total assets | | 6,036,852,170 |
| | |
Liabilities | | |
Payable to custodian bank | $ 15,624,667 | |
Payable for investments purchased | 437,886,164 | |
Payable for fund shares redeemed | 2,793,734 | |
Accrued management fee | 3,443,571 | |
Other affiliated payables | 1,632,523 | |
Other payables and accrued expenses | 532,218 | |
Collateral on securities loaned, at value | 65,761,125 | |
Total liabilities | | 527,674,002 |
| | |
Net Assets | | $ 5,509,178,168 |
Net Assets consist of: | | |
Paid in capital | | $ 8,217,883,477 |
Undistributed net investment income | | 101,205,874 |
Accumulated undistributed net realized gain (loss) on investments and foreign currency transactions | | (905,086,866) |
Net unrealized appreciation (depreciation) on investments and assets and liabilities in foreign currencies | | (1,904,824,317) |
Net Assets | | $ 5,509,178,168 |
| | |
Overseas:
Net Asset Value, offering price and redemption price per share ($5,464,901,080 ÷ 214,875,924 shares) | | $ 25.43 |
| | |
Class K:
Net Asset Value, offering price and redemption price per share ($44,277,088 ÷ 1,739,432 shares) | | $ 25.45 |
Statement of Operations
| Year ended October 31, 2008 |
| | |
Investment Income | | |
Dividends (including $5,157,603 earned from other affiliated issuers) | | $ 192,592,406 |
Interest | | 142,565 |
Income from Fidelity Central Funds (including $10,402,470 from security lending) | | 24,199,786 |
| | 216,934,757 |
Less foreign taxes withheld | | (19,577,193) |
Total income | | 197,357,564 |
| | |
Expenses | | |
Management fee
Basic fee | $ 57,800,495 | |
Performance adjustment | 10,393,355 | |
Transfer agent fees | 19,460,444 | |
Accounting and security lending fees | 1,755,747 | |
Custodian fees and expenses | 1,632,455 | |
Independent trustees' compensation | 36,451 | |
Depreciation in deferred trustee compensation account | (2,521) | |
Registration fees | 118,692 | |
Audit | 102,454 | |
Legal | 48,842 | |
Interest | 15,524 | |
Miscellaneous | 843,473 | |
Total expenses before reductions | 92,205,411 | |
Expense reductions | (2,978,136) | 89,227,275 |
Net investment income (loss) | | 108,130,289 |
Realized and Unrealized Gain (Loss) Net realized gain (loss) on: | | |
Investment securities: | | |
Unaffiliated issuers | (797,144,495) | |
Other affiliated issuers | (103,193,270) | |
Foreign currency transactions | (2,599,494) | |
Total net realized gain (loss) | | (902,937,259) |
Change in net unrealized appreciation (depreciation) on: Investment securities (net of decrease in deferred foreign taxes of $350,879) | (4,444,932,593) | |
Assets and liabilities in foreign currencies | (21,643) | |
Total change in net unrealized appreciation (depreciation) | | (4,444,954,236) |
Net gain (loss) | | (5,347,891,495) |
Net increase (decrease) in net assets resulting from operations | | $ (5,239,761,206) |
See accompanying notes which are an integral part of the financial statements.
Annual Report
Statement of Changes in Net Assets
| Year ended
October 31,
2008 | Year ended
October 31,
2007 |
Increase (Decrease) in Net Assets | | |
Operations | | |
Net investment income (loss) | $ 108,130,289 | $ 119,216,448 |
Net realized gain (loss) | (902,937,259) | 1,120,668,756 |
Change in net unrealized appreciation (depreciation) | (4,444,954,236) | 1,583,404,106 |
Net increase (decrease) in net assets resulting from operations | (5,239,761,206) | 2,823,289,310 |
Distributions to shareholders from net investment income | (93,919,303) | (85,344,347) |
Distributions to shareholders from net realized gain | (947,430,820) | (719,995,618) |
Total distributions | (1,041,350,123) | (805,339,965) |
Share transactions - net increase (decrease) | 2,246,479,755 | 307,878,697 |
Redemption fees | 456,294 | 238,697 |
Total increase (decrease) in net assets | (4,034,175,280) | 2,326,066,739 |
| | |
Net Assets | | |
Beginning of period | 9,543,353,448 | 7,217,286,709 |
End of period (including undistributed net investment income of $101,205,874 and undistributed net investment income of $106,479,330, respectively) | $ 5,509,178,168 | $ 9,543,353,448 |
Financial Highlights - Overseas
Years ended October 31, | 2008 | 2007 | 2006 | 2005 | 2004 |
Selected Per-Share Data | | | | | |
Net asset value, beginning of period | $ 58.39 | $ 47.08 | $ 37.65 | $ 32.21 | $ 29.19 |
Income from Investment Operations | | | | | |
Net investment income (loss) B | .55 | .70 | .63 | .39 | .17 E |
Net realized and unrealized gain (loss) | (27.19) | 15.80 | 9.37 | 5.35 | 3.15 |
Total from investment operations | (26.64) | 16.50 | 10.00 | 5.74 | 3.32 |
Distributions from net investment income | (.57) | (.55) | (.41) | (.19) | (.30) |
Distributions from net realized gain | (5.75) | (4.64) | (.16) | (.11) | - |
Total distributions | (6.32) | (5.19) | (.57) | (.30) | (.30) |
Redemption fees added to paid in capital B, G | - | - | - | - | - |
Net asset value, end of period | $ 25.43 | $ 58.39 | $ 47.08 | $ 37.65 | $ 32.21 |
Total Return A | (50.88)% | 38.79% | 26.83% | 17.90% | 11.45% |
Ratios to Average Net Assets C, F | | | | | |
Expenses before reductions | 1.13% | .95% | 1.00% | .93% | 1.05% |
Expenses net of fee waivers, if any | 1.13% | .95% | 1.00% | .93% | 1.05% |
Expenses net of all reductions | 1.10% | .91% | .90% | .86% | 1.01% |
Net investment income (loss) | 1.33% | 1.43% | 1.43% | 1.11% | .55% E |
Supplemental Data | | | | | |
Net assets, end of period (000 omitted) | $ 5,464,901 | $ 9,543,353 | $ 7,217,287 | $ 4,733,797 | $ 4,182,103 |
Portfolio turnover rate D | 113% | 87% | 132% | 87% | 79% |
A Total returns would have been lower had certain expenses not been reduced during the periods shown. B Calculated based on average shares outstanding during the period. C Fees and expenses of the underlying Fidelity Central Funds are not included in the Fund's expense ratio. The Fund indirectly bears its proportionate share of the expenses of any underlying Fidelity Central Funds. D Amount does not include the portfolio activity of any underlying Fidelity Central Funds. E Net investment income per share includes approximately $.01 per share received as a result of a reorganization of an issuer that was in bankruptcy. Excluding this non-recurring amount, the ratio of net investment income (loss) to average net assets would have been ..52%. F Expense ratios reflect operating expenses of the class. Expenses before reductions do not reflect amounts reimbursed by the investment adviser or reductions from brokerage service arrangements or other expense offset arrangements and do not represent the amount paid by the class during periods when reimbursements or reductions occur. Expenses net of fee waivers reflect expenses after reimbursement by the investment adviser but prior to reductions from brokerage service arrangements or other expense offset arrangements. Expenses net of all reductions represent the net expenses paid by the class. G Amount represents less than $.01 per share. |
See accompanying notes which are an integral part of the financial statements.
Annual Report
Financial Highlights - Class K
Year ended October 31, | 2008 G |
Selected Per-Share Data | |
Net asset value, beginning of period | $ 45.00 |
Income from Investment Operations | |
Net investment income (loss) D | .13 |
Net realized and unrealized gain (loss) | (19.68) |
Total from investment operations | (19.55) |
Redemption fees added to paid in capital D, I | - |
Net asset value, end of period | $ 25.45 |
Total Return B, C | (43.44)% |
Ratios to Average Net Assets E, H | |
Expenses before reductions | .96% A |
Expenses net of fee waivers, if any | .96% A |
Expenses net of all reductions | .93% A |
Net investment income (loss) | 1.08% A |
Supplemental Data | |
Net assets, end of period (000 omitted) | $ 44,277 |
Portfolio turnover rate F | 113% |
A Annualized B Total returns for periods of less than one year are not annualized. C Total returns would have been lower had certain expenses not been reduced during the periods shown. D Calculated based on average shares outstanding during the period. E Fees and expenses of the underlying Fidelity Central Funds are not included in the Fund's expense ratio. The Fund indirectly bears its proportionate share of the expenses of any underlying Fidelity Central Funds. F Amount does not include the portfolio activity of any underlying Fidelity Central Funds. G For the period May 9, 2008 (commencement of sale of shares) to October 31, 2008. H Expense ratios reflect operating expenses of the class. Expenses before reductions do not reflect amounts reimbursed by the investment adviser or reductions from brokerage service arrangements or other expense offset arrangements and do not represent the amount paid by the class during periods when reimbursements or reductions occur. Expense ratios before reductions for start-up periods may not be representative of long-term operating periods. Expenses net of fee waivers reflect expenses after reimbursement by the investment adviser but prior to reductions from brokerage service arrangements or other expense offset arrangements. Expenses net of all reductions represent the net expenses paid by the class. I Amount represents less than $.01 per share. |
See accompanying notes which are an integral part of the financial statements.
Annual Report
Notes to Financial Statements
For the period ended October 31, 2008
1. Organization.
Fidelity Overseas Fund (the Fund) is a fund of Fidelity Investment Trust (the trust) and is authorized to issue an unlimited number of shares. The trust is registered under the Investment Company Act of 1940, as amended (the 1940 Act), as an open-end management investment company organized as a Massachusetts business trust. The Fund offers Overseas and Class K shares, each of which has equal rights as to assets and voting privileges. Each class has exclusive voting rights with respect to matters that affect that class. The Fund commenced sale of Class K shares and the existing class was designated Overseas on May 9, 2008. Investment income, realized and unrealized capital gains and losses, the common expenses of the Fund, and certain fund-level expense reductions, if any, are allocated on a pro rata basis to each class based on the relative net assets of each class to the total net assets of the Fund. Each class differs with respect to transfer agent fees incurred. Certain expense reductions also differ by class. The Fund's investments in emerging markets can be subject to social, economic, regulatory, and political uncertainties and can be extremely volatile.
2. Investments in Fidelity Central Funds.
The Fund may invest in Fidelity Central Funds, which are open-end investment companies available only to other investment companies and accounts managed by Fidelity Management & Research Company (FMR) and its affiliates. The Fund's Schedule of Investments lists each of the Fidelity Central Funds held as of period end, if any, as an investment of the Fund, but does not include the underlying holdings of each Fidelity Central Fund. As an Investing Fund, the Fund indirectly bears its proportionate share of the expenses of the underlying Fidelity Central Funds.
The Money Market Central Funds seek preservation of capital and current income and are managed by Fidelity Investments Money Management, Inc. (FIMM), an affiliate of FMR.
A complete unaudited list of holdings for each Fidelity Central Fund is available upon request or at the SEC's web site at www.sec.gov. In addition, the financial statements of the Fidelity Central Funds, which are not covered by the Fund's Report of Independent Registered Public Accounting Firm, are available on the SEC's web site or upon request.
3. Significant Accounting Policies.
The financial statements have been prepared in conformity with accounting principles generally accepted in the United States of America, which require management to make certain estimates and assumptions at the date of the financial statements. Actual results could differ from those estimates. The following summarizes the significant accounting policies of the Fund:
Security Valuation. Investments are valued as of 4:00 p.m. Eastern time on the last calendar day of the period. Wherever possible, the Fund uses independent pricing services approved by the Board of Trustees to value its investments.
Equity securities, including restricted securities, for which market quotations are readily available, are valued at the last reported sale price or official closing price as reported by an independent pricing service on the primary market or exchange on which they are traded. In the event there were no sales during the day or closing prices are not available, securities are valued at the last quoted bid price. Investments in open-end mutual funds, including the Fidelity Central Funds, are valued at their closing net asset value each business day. Short-term securities with remaining maturities of sixty days or less for which quotations are not readily available are valued at amortized cost, which approximates value.
When current market prices or quotations are not readily available or reliable, valuations may be determined in good faith in accordance with procedures adopted by the Board of Trustees. Factors used in determining value may include significant market or security specific events, changes in interest rates and credit quality, and developments in foreign markets which are monitored by evaluating the performance of ADRs, futures contracts and exchange-traded funds. The frequency with which these procedures are used cannot be predicted and may be utilized to a significant extent. The value of securities used for net asset value (NAV) calculation under these procedures may differ from published prices for the same securities.
Foreign Currency. The Fund uses foreign currency contracts to facilitate transactions in foreign-denominated securities. Losses from these transactions may arise from changes in the value of the foreign currency or if the counterparties do not perform under the contracts' terms.
Foreign-denominated assets, including investment securities, and liabilities are translated into U.S. dollars at the exchange rate at period end. Purchases and sales of investment securities, income and dividends received and expenses denominated in foreign currencies are translated into U.S. dollars at the exchange rate in effect on the transaction date.
The effects of exchange rate fluctuations on investments are included with the net realized and unrealized gain (loss) on investment securities. Other foreign currency transactions resulting in realized and unrealized gain (loss) are disclosed separately.
Annual Report
3. Significant Accounting Policies - continued
Investment Transactions and Income. For financial reporting purposes, the Fund's investment holdings and NAV include trades executed through the end of the last business day of the period. The NAV per share for processing shareholder transactions is calculated as of the close of business of the New York Stock Exchange (NYSE), normally 4:00 p.m. Eastern time and includes trades executed through the end of the prior business day. Gains and losses on securities sold are determined on the basis of identified cost and may include proceeds received from litigation. Dividend income is recorded on the ex-dividend date, except for certain dividends from foreign securities where the ex-dividend date may have passed, which are recorded as soon as the Fund is informed of the ex-dividend date. Non-cash dividends included in dividend income, if any, are recorded at the fair market value of the securities received. Interest income and distributions from the Fidelity Central Funds are accrued as earned. Interest income includes coupon interest and amortization of premium and accretion of discount on debt securities. Investment income is recorded net of foreign taxes withheld where recovery of such taxes is uncertain.
Expenses. Most expenses of the trust can be directly attributed to a fund. Expenses which cannot be directly attributed are apportioned among each Fund in the trust. Expense estimates are accrued in the period to which they relate and adjustments are made when actual amounts are known.
Deferred Trustee Compensation. Under a Deferred Compensation Plan (the Plan), independent Trustees must defer receipt of a portion of, and may elect to defer receipt of an additional portion of, their annual compensation. Deferred amounts are invested in a cross-section of Fidelity funds, are marked-to-market and remain in the Fund until distributed in accordance with the Plan. The investment of deferred amounts and the offsetting payable to the Trustees are included in the accompanying Statement of Assets and Liabilities.
Income Tax Information and Distributions to Shareholders. Each year, the Fund intends to qualify as a regulated investment company by distributing substantially all of its taxable income and realized gains under Subchapter M of the Internal Revenue Code and filing its U.S. federal tax return. As a result, no provision for income taxes is required. The Fund is subject to the provisions of FASB Interpretation No. 48, Accounting for Uncertainties in Income Taxes (FIN 48). FIN 48 sets forth a minimum threshold for financial statement recognition of the benefit of a tax position taken or expected to be taken in a tax return. The implementation of FIN 48 did not result in any unrecognized tax benefits in the accompanying financial statements. Each of the Fund's federal tax returns for the prior three fiscal years remains subject to examination by the Internal Revenue Service (IRS). Foreign taxes are provided for based on the Fund's understanding of the tax rules and rates that exist in the foreign markets in which it invests.
Distributions are recorded on the ex-dividend date. Income dividends and capital gain distributions are declared separately for each class. Income and capital gain distributions are determined in accordance with income tax regulations, which may differ from generally accepted accounting principles. In addition, the Fund will claim a portion of the payment made to redeeming shareholders as a distribution for income tax purposes.
Capital accounts within the financial statements are adjusted for permanent book-tax differences. These adjustments have no impact on net assets or the results of operations. Temporary book-tax differences will reverse in a subsequent period.
Book-tax differences are primarily due to foreign currency transactions, passive foreign investment companies (PFIC), deferred trustees compensation and losses deferred due to wash sales.
The tax-basis components of distributable earnings and the federal tax cost as of period end were as follows:
Unrealized appreciation | $ 169,074,168 |
Unrealized depreciation | (2,119,783,780) |
Net unrealized appreciation (depreciation) | (1,950,709,612) |
Undistributed ordinary income | 60,427,430 |
Capital loss carryforward | (859,201,568) |
| |
Cost for federal income tax purposes | $ 7,782,419,202 |
The tax character of distributions paid was as follows:
| October 31, 2008 | October 31, 2007 |
Ordinary Income | $ 204,315,590 | $ 313,446,407 |
Long-term Capital Gains | 837,034,533 | 491,893,558 |
Total | $ 1,041,350,123 | $ 805,339,965 |
Short-Term Trading (Redemption) Fees. Shares held in the Fund less than 30 days are subject to a redemption fee equal to 1.00% of the proceeds of the redeemed shares. All redemption fees, including any estimated redemption fees paid by FMR, are retained by the Fund and accounted for as an addition to paid in capital.
Annual Report
Notes to Financial Statements - continued
3. Significant Accounting Policies - continued
New Accounting Pronouncement. In September 2006, Statement of Financial Accounting Standards No. 157, Fair Value Measurements (SFAS 157), was issued and is effective for fiscal years beginning after November 15, 2007. SFAS 157 defines fair value, establishes a framework for measuring fair value and results in expanded disclosures about fair value measurements.
4. Operating Policies.
Repurchase Agreements. FMR has received an Exemptive Order from the Securities and Exchange Commission (the SEC) which permits the Fund and other affiliated entities of FMR to transfer uninvested cash balances into joint trading accounts which are then invested in repurchase agreements. The Fund may also invest directly with institutions in repurchase agreements. Repurchase agreements are collateralized by government or non-government securities. Upon settlement date, collateral is held in segregated accounts with custodian banks and may be obtained in the event of a default of the counterparty. The Fund monitors, on a daily basis, the value of the collateral to ensure it is at least equal to the principal amount of the repurchase agreement (including accrued interest). In the event of a default by the counterparty, realization of the collateral proceeds could be delayed, during which time the value of the collateral may decline.
5. Purchases and Sales of Investments.
Purchases and sales of securities, other than short-term securities, aggregated $10,177,265,207 and $8,779,633,729, respectively.
6. Fees and Other Transactions with Affiliates.
Management Fee. FMR and its affiliates provide the Fund with investment management related services for which the Fund pays a monthly management fee. The management fee is the sum of an individual fund fee rate that is based on an annual rate of .45% of the Fund's average net assets and a group fee rate that averaged .26% during the period. The group fee rate is based upon the average net assets of all the mutual funds advised by FMR. The group fee rate decreases as assets under management increase and increases as assets under management decrease. In addition, the management fee is subject to a performance adjustment (up to a maximum of± .20% of the Fund's average net assets over a 36 month performance period). The upward or downward adjustment to the management fee is based on the relative investment performance of the retail class of the Fund, Fidelity Overseas as compared to an appropriate benchmark index. For the period, the total annual management fee rate, including the performance adjustment, was .84% of the Fund's average net assets.
Transfer Agent Fees. Fidelity Investments Institutional Operations Company, Inc. (FIIOC), an affiliate of FMR, is the transfer, dividend disbursing and shareholder servicing agent for each class of the Fund. FIIOC receives account fees and asset-based fees that vary according to account size and type of account of the shareholders of Overseas and asset-based fees of .05% of average net assets for Class K. FIIOC pays for typesetting, printing and mailing of shareholder reports, except proxy statements. Prior to January 1, 2008, Fidelity Service Company, Inc. (FSC), also an affiliate of FMR, was the transfer agent for Overseas. For the period, the transfer agent fees for Overseas were equivalent to an annualized rate of ..24% of average net assets.
For the period, each class paid the following transfer agent fees:
| Amount |
Overseas | $ 19,458,605 |
Class K | 1,839 |
| $ 19,460,444 |
Accounting and Security Lending Fees. FSC maintains the Fund's accounting records. The accounting fee is based on the level of average net assets for the month. Under a separate contract, FSC administers the security lending program. The security lending fee is based on the number and duration of lending transactions.
Brokerage Commissions. The Fund placed a portion of its portfolio transactions with brokerage firms which are affiliates of the investment adviser. The commissions paid to these affiliated firms were $19,859 for the period.
Interfund Lending Program. Pursuant to an Exemptive Order issued by the SEC, the Fund, along with other registered investment companies having management contracts with FMR, may participate in an interfund lending program. This program provides an alternative credit facility allowing the funds to borrow from, or lend money to, other participating affiliated funds. At period end, there were no interfund loans outstanding. The Fund's activity in this program during the period for which loans were outstanding was as follows:
Borrower or Lender | Average Daily Loan Balance | Weighted Average Interest Rate | Interest Expense |
Borrower | $ 56,930,500 | 4.75% | $ 15,023 |
Annual Report
7. Committed Line of Credit.
The Fund participates with other funds managed by FMR in a $4.2 billion credit facility (the "line of credit") to be utilized for temporary or emergency purposes to fund shareholder redemptions or for other short-term liquidity purposes. The Fund has agreed to pay commitment fees on its pro rata portion of the line of credit, which amounted to $16,603 and is reflected in Miscellaneous Expense on the Statement of Operations. During the period, there were no borrowings on this line of credit.
8. Security Lending.
The Fund lends portfolio securities from time to time in order to earn additional income. On the settlement date of the loan, the Fund receives collateral (in the form of U.S. Treasury obligations, letters of credit and/or cash) against the loaned securities and maintains collateral in an amount not less than 100% of the market value of the loaned securities during the period of the loan. The market value of the loaned securities is determined at the close of business of the Fund and any additional required collateral is delivered to the Fund on the next business day. If the borrower defaults on its obligation to return the securities loaned because of insolvency or other reasons, a fund could experience delays and costs in recovering the securities loaned or in gaining access to the collateral. Any cash collateral received is invested in the Fidelity Securities Lending Cash Central Fund. The value of loaned securities and cash collateral at period end are disclosed on the Fund's Statement of Assets and Liabilities. Security lending income represents the income earned on investing cash collateral, less fees and expenses associated with the loan, plus any premium payments that may be received on the loan of certain types of securities.
9. Bank Borrowings.
The Fund is permitted to have bank borrowings for temporary or emergency purposes to fund shareholder redemptions. The Fund has established borrowing arrangements with certain banks. The interest rate on the borrowings is the bank's base rate, as revised from time to time. The average daily loan balance during the period for which loans were outstanding amounted to $7,800,000. The weighted average interest rate was 2.31%. The interest expense amounted to $501 under the bank borrowing program. At period end, there were no bank borrowings outstanding.
10. Expense Reductions.
FMR voluntarily agreed to reimburse a portion of Overseas operating expenses. During the period, this reimbursement reduced the class' expenses by $12,763.
Many of the brokers with whom FMR places trades on behalf of the Fund provided services to the Fund in addition to trade execution. These services included payments of certain expenses on behalf of the Fund totaling $2,579,319 for the period. In addition, through arrangements with and each class' transfer agent, credits realized as a result of uninvested cash balances were used to reduce the Fund's expenses. During the period, these credits reduced the Fund's custody expenses by $15,936. During the period, credits reduced each class' transfer agent expense as noted in the table below.
| Transfer Agent
expense reduction |
Overseas | $ 370,118 |
11. Other.
The Fund's organizational documents provide former and current trustees and officers with a limited indemnification against liabilities arising in connection with the performance of their duties to the Fund. In the normal course of business, the Fund may also enter into contracts that provide general indemnifications. The Fund's maximum exposure under these arrangements is unknown as this would be dependent on future claims that may be made against the Fund. The risk of material loss from such claims is considered remote.
At the end of the period, Fidelity Freedom 2020 Fund was the owner of record of approximately 11% of the total outstanding shares of the Fund. The Fidelity Freedom Funds were the owners of record, in the aggregate of approximately 44% of the total outstanding shares of the Fund.
In December 2006, the Independent Trustees, with the assistance of independent counsel, completed an investigation regarding gifts, gratuities and business entertainment provided by certain brokers to certain individuals who were employed on FMR's domestic equity trading desk during the period 2002 to 2004. The Independent Trustees and FMR agreed that, despite the absence of proof that the Fidelity mutual funds experienced diminished execution quality as a result of the improper receipt of gifts and business entertainment, the conduct at issue was serious and was worthy of redress. Accordingly, the Independent Trustees requested, and FMR agreed to make, a payment of $42 million plus accrued interest, which equaled approximately $7.3 million, to certain Fidelity mutual funds.
In March 2008, the Trustees approved a method for allocating this payment among the funds and, in total, FMR paid the fund $55,778, which is recorded in the accompanying Statement of Operations.
Annual Report
Notes to Financial Statements - continued
11. Other - continued
In a related administrative order dated March 5, 2008, the U.S. Securities and Exchange Commission ("SEC") announced a settlement with FMR and FMR Co., Inc. (an affiliate of FMR) involving the SEC's regulatory rules for investment advisers and the improper receipt of gifts, gratuities and business entertainment. Without admitting or denying the SEC's findings, FMR agreed to pay an $8 million civil penalty to the United States Treasury.
During the period, Lehman Brothers Holdings, Inc. and certain of its affiliates (LBHI) sought protection under the insolvency laws of their jurisdictions of organization, including the United States, the United Kingdom and Japan. At the time LBHI's insolvency proceedings were instituted, the Fund had outstanding securities trades with counterparties affiliated with LBHI. As a result of the insolvency proceedings, LBHI is unable to fulfill its commitments and, in certain cases, the Fund may have terminated its trades and related agreements with the relevant entities and, where appropriate, is in the process of initiating claims for damages. FMR believes that the financial impact to the Fund relating to the terminated trades and agreements is immaterial.
12. Distributions to Shareholders.
Distributions to shareholders of each class were as follows:
Years ended October 31, | 2008 | 2007 |
From net investment income | | |
Overseas | $ 93,919,303 | $ 85,344,347 |
From net realized gain | | |
Overseas | $ 947,430,820 | $ 719,995,618 |
13. Share Transactions.
Transactions for each class of shares were as follows:
| Shares | Dollars |
Years ended October 31, | 2008A | 2007 | 2008A | 2007 |
Overseas | | | | |
Shares sold | 76,040,831 | 41,499,511 | $ 2,985,572,846 | $ 2,023,578,024 |
Conversion to Class K | (1,789,301) | - | (50,752,081) | - |
Reinvestment of distributions | 20,825,405 | 18,292,055 | 1,030,024,482 | 797,167,795 |
Shares redeemed | (43,642,881) | (49,648,078) | (1,767,850,377) | (2,512,867,122) |
Net increase (decrease) | 51,434,054 | 10,143,488 | $ 2,196,994,870 | $ 307,878,697 |
Class K | | | | |
Shares sold | 23,823 | - | $ 671,729 | $ - |
Conversion from Overseas | 1,787,998 | - | 50,752,081 | - |
Shares redeemed | (72,389) | - | (1,938,925) | - |
Net increase (decrease) | 1,739,432 | - | $ 49,484,885 | $ - |
A Share transactions for Class K are for the period May 9, 2008 (commencement of sale of shares) to October 31, 2008.
Annual Report
Report of Independent Registered Public Accounting Firm
To the Trustees of Fidelity Investment Trust and the Shareholders of Fidelity Overseas Fund:
In our opinion, the accompanying statement of assets and liabilities, including the schedule of investments, and the related statements of operations and of changes in net assets and the financial highlights present fairly, in all material respects, the financial position of Fidelity Overseas Fund (a fund of Fidelity Investment Trust) at October 31, 2008, the results of its operations for the year then ended, the changes in its net assets for each of the two years in the period then ended and the financial highlights for each of the periods indicated in conformity with accounting principles generally accepted in the United States of America. These financial statements and financial highlights (hereafter referred to as "financial statements") are the responsibility of the Fidelity Overseas Fund's management. Our responsibility is to express an opinion on these financial statements based on our audits. We conducted our audits of these financial statements in accordance with the standards of the Public Company Accounting Oversight Board (United States). Those standards require that we plan and perform the audit to obtain reasonable assurance about whether the financial statements are free of material misstatement. An audit includes examining, on a test basis, evidence supporting the amounts and disclosures in the financial statements, assessing the accounting principles used and significant estimates made by management, and evaluating the overall financial statement presentation. We believe that our audits, which included confirmation of securities at October 31, 2008 by correspondence with the custodian and brokers, provide a reasonable basis for our opinion.
/s/ PricewaterhouseCoopers LLP
PricewaterhouseCoopers LLP
Boston, Massachusetts
December 23, 2008
Annual Report
The Trustees, Member of the Advisory Board, and executive officers of the trust and fund, as applicable, are listed below. The Board of Trustees governs the fund and is responsible for protecting the interests of shareholders. The Trustees are experienced executives who meet periodically throughout the year to oversee the fund's activities, review contractual arrangements with companies that provide services to the fund, and review the fund's performance. Except for Edward C. Johnson 3d and James C. Curvey, each of the Trustees oversees 220 funds advised by FMR or an affiliate. Messrs. Johnson and Curvey oversee 379 funds advised by FMR or an affiliate.
The Trustees hold office without limit in time except that (a) any Trustee may resign; (b) any Trustee may be removed by written instrument, signed by at least two-thirds of the number of Trustees prior to such removal; (c) any Trustee who requests to be retired or who has become incapacitated by illness or injury may be retired by written instrument signed by a majority of the other Trustees; and (d) any Trustee may be removed at any special meeting of shareholders by a two-thirds vote of the outstanding voting securities of the trust. Each Trustee who is not an interested person (as defined in the 1940 Act) (Independent Trustee), shall retire not later than the last day of the calendar year in which his or her 72nd birthday occurs. The Independent Trustees may waive this mandatory retirement age policy with respect to individual Trustees. The executive officers and Advisory Board Member hold office without limit in time, except that any officer and Advisory Board Member may resign or may be removed by a vote of a majority of the Trustees at any regular meeting or any special meeting of the Trustees. Except as indicated, each individual has held the office shown or other offices in the same company for the past five years.
The fund's Statement of Additional Information (SAI) includes more information about the Trustees. To request a free copy, call Fidelity at 1-800-544-8544.
Interested Trustees*:
Correspondence intended for each Trustee who is an interested person may be sent to Fidelity Investments, 82 Devonshire Street, Boston, Massachusetts 02109.
Name, Age; Principal Occupation |
Edward C. Johnson 3d (78) |
| Year of Election or Appointment: 1984 Mr. Johnson is Chairman of the Board of Trustees. Mr. Johnson serves as Chief Executive Officer, Chairman, and a Director of FMR LLC; Chairman and a Director of FMR; Chairman and a Director of Fidelity Research & Analysis Company (FRAC); Chairman and a Director of Fidelity Investments Money Management, Inc.; and Chairman and a Director of FMR Co., Inc. In addition, Mr. Johnson serves as Chairman and Director of FIL Limited. Previously, Mr. Johnson served as President of FMR LLC (2006-2007). |
James C. Curvey (73) |
| Year of Election or Appointment: 2007 Mr. Curvey also serves as Trustee (2007-present) of other investment companies advised by FMR. Mr. Curvey is a Director of FMR and FMR Co., Inc. (2007-present). Mr. Curvey is also Vice Chairman (2006-present) and Director of FMR LLC. In addition, Mr. Curvey serves as an Overseer for the Boston Symphony Orchestra and a member of the Trustees of Villanova University. |
* Trustees have been determined to be "Interested Trustees" by virtue of, among other things, their affiliation with the trust or various entities under common control with FMR. FMR Corp. merged with and into FMR LLC on October 1, 2007. Any references to FMR LLC for prior periods are deemed to be references to the prior entity.
Independent Trustees:
Correspondence intended for each Independent Trustee (that is, the Trustees other than the Interested Trustees) may be sent to Fidelity Investments, P.O. Box 55235, Boston, Massachusetts 02205-5235.
Name, Age; Principal Occupation |
Dennis J. Dirks (60) |
| Year of Election or Appointment: 2005 Prior to his retirement in May 2003, Mr. Dirks was Chief Operating Officer and a member of the Board of The Depository Trust & Clearing Corporation (DTCC) (1999-2003). He also served as President, Chief Operating Officer, and Board member of The Depository Trust Company (DTC) (1999-2003) and President and Board member of the National Securities Clearing Corporation (NSCC) (1999-2003). In addition, Mr. Dirks served as a Trustee and a member of the Finance Committee of Manhattan College (2005-2008), and as Chief Executive Officer and Board member of the Government Securities Clearing Corporation (2001-2003) and Chief Executive Officer and Board member of the Mortgage-Backed Securities Clearing Corporation (2001-2003). Mr. Dirks also serves as a Trustee and a member of the Finance Committee of AHRC of Nassau County (2006-present). |
Alan J. Lacy (55) |
| Year of Election or Appointment: 2008 Mr. Lacy serves as Senior Adviser (2007-present) of Oak Hill Capital Partners, L.P. (a private equity firm). Mr. Lacy also served as Chief Executive Officer (2000-2005) and Vice Chairman (2005-2006) of Sears Holdings Corporation and Sears, Roebuck and Co. (retail). In addition, Mr. Lacy serves as a member of the Board of Directors of The Western Union Company (global money transfer, 2006-present) and Bristol-Myers Squibb (global pharmaceuticals, 2007-present). Mr. Lacy is a Trustee of the National Parks Conservation Association and The Field Museum of Natural History. |
Ned C. Lautenbach (64) |
| Year of Election or Appointment: 2000 Mr. Lautenbach is Chairman of the Independent Trustees (2006-present). Mr. Lautenbach is an Advisory Partner of Clayton, Dubilier & Rice, Inc. (private equity investment firm). Previously, Mr. Lautenbach was with the International Business Machines Corporation (IBM) from 1968 until his retirement in 1998. Mr. Lautenbach serves as a Director of Eaton Corporation (diversified industrial) as well as the Philharmonic Center for the Arts in Naples, Florida. He also is a member of the Board of Trustees of Fairfield University (2005-present), as well as a member of the Council on Foreign Relations. Previously, Mr. Lautenbach served as a Director of Sony Corporation (2006-2007). |
Joseph Mauriello (64) |
| Year of Election or Appointment: 2008 Prior to his retirement in January 2006, Mr. Mauriello served in numerous senior management positions including Deputy Chairman and Chief Operating Officer (2004-2005), and Vice Chairman of Financial Services (2002-2004) of KPMG LLP US (professional services firm, 1965-2005). Mr. Mauriello currently serves as a member of the Board of Directors of XL Capital Ltd. (global insurance and re-insurance company, 2006-present) and of Arcadia Resources Inc. (health care services and products, 2007-
present). He also served as a Director of the Hamilton Funds of the Bank of New York (2006-2007). |
Cornelia M. Small (64) |
| Year of Election or Appointment: 2005 Ms. Small is a member of the Investment Committee, and Chair (2008-present) and a member of the Board of Trustees of Smith College. Ms. Small also serves on the Investment Committee of the Berkshire Taconic Community Foundation (2008-present). Previously, Ms. Small served as Chairperson of the Investment Committee (2002-2008) of Smith College and as Co-Chair (2000-
2003) of the Annual Fund for the Fletcher School of Law and Diplomacy. In addition, she served as Chief Investment Officer, Director of Global Equity Investments, and a member of the Board of Directors of Scudder, Stevens & Clark and Scudder Kemper Investments. |
William S. Stavropoulos (69) |
| Year of Election or Appointment: 2001 Mr. Stavropoulos is Chairman Emeritus of the Board of Directors of The Dow Chemical Company, where he previously served in numerous senior management positions, including President (1993-2000; 2002-2003), CEO (1995-2000; 2002-2004), Chairman of the Executive Committee (2000-2006), and as a member of the Board of Directors (1990-2006). Currently, he is a Director of Teradata Corporation (data warehousing and technology solutions, 2008-present), Chemical Financial Corporation, Maersk Inc. (industrial conglomerate), Tyco International, Inc. (multinational manufacturing and services, 2007-present), and a member of the Advisory Board for Metalmark Capital (private equity investment firm, 2005-present). He is a special advisor to Clayton, Dubilier & Rice, Inc. (private equity investment). In addition, Mr. Stavropoulos is a member of the University of Notre Dame Advisory Council for the College of Science. |
David M. Thomas (59) |
| Year of Election or Appointment: 2008 Previously, Mr. Thomas served as Executive Chairman (2005-2006) and Chairman and Chief Executive Officer (2000-2005) of IMS Health, Inc. (pharmaceutical and healthcare information solutions). In addition, Mr. Thomas serves as a member of the Board of Directors of Fortune Brands, Inc. (consumer products holding company), and Interpublic Group of Companies, Inc. (marketing communication, 2004-present). |
Michael E. Wiley (58) |
| Year of Election or Appointment: 2008 Mr. Wiley also serves as a member of the Board of Trustees of the University of Tulsa (2000-2006; 2007-present). He serves as a Director of Tesoro Corporation (independent oil refiner and marketer, 2005-present), and a Director of Bill Barrett Corporation (exploration and production company, 2005-present). In addition, he also serves as a Director of Post Oak Bank (privately-held bank, 2004-present). Previously, Mr. Wiley served as a Sr. Energy Advisor of Katzenbach Partners, LLC (consulting firm, 2006-
2007), as an Advisory Director of Riverstone Holdings (private investment firm), Chairman, President, and CEO of Baker Hughes, Inc. (oilfield services company, 2000-2004), and as Director of Spinnaker Exploration Company (exploration and production company, 2001-2005). |
Annual Report
Trustees and Officers - continued
Advisory Board Member and Executive Officers**:
Correspondence intended for each executive officer and Mr. Lynch may be sent to Fidelity Investments, 82 Devonshire Street, Boston, Massachusetts 02109.
Name, Age; Principal Occupation |
Peter S. Lynch (64) |
| Year of Election or Appointment: 2003 Member of the Advisory Board of Fidelity's Equity and High Income Funds. Mr. Lynch is Vice Chairman and a Director of FMR, and Vice Chairman (2001-present) and a Director of FMR Co., Inc. Previously, Mr. Lynch served as a Trustee of the Fidelity funds (1990-2003). In addition, he serves as a Trustee of Boston College and as the Chairman of the Inner-City Scholarship Fund. Previously, Mr. Lynch served on the Special Olympics International Board of Directors (1997-2006). |
Kenneth B. Robins (39) |
| Year of Election or Appointment: 2008 President and Treasurer of Fidelity's Equity and High Income Funds. Mr. Robins is an employee of Fidelity Investments (2004-
present). Before joining Fidelity Investments, Mr. Robins worked at KPMG LLP, where he was a partner in KPMG's department of professional practice (2002-2004). |
Walter C. Donovan (46) |
| Year of Election or Appointment: 2007 Vice President of Fidelity's Equity Funds. Mr. Donovan also serves as President of FMR and FMR Co., Inc., and Executive Vice President of Fidelity Investments Money Management, Inc. (2007-present). Previously, Mr. Donovan served as Executive Vice President of FMR and FMR Co., Inc. (2005-2007) and Senior Vice President of FMR (2003-2005) and FMR Co., Inc. (2004-2005). |
Eric M. Wetlaufer (46) |
| Year of Election or Appointment: 2006 Vice President of Fidelity's International Equity Funds. Mr. Wetlaufer also serves as Group Chief Investment Officer of FMR. Mr. Wetlaufer is Chairman, Chief Executive Officer, and President of Fidelity Management & Research (Hong Kong) Limited (2008-present); Chairman, Chief Executive Officer, President, and a Director of Fidelity Management & Research (Japan) Inc. (2008-present); Chairman and Chief Executive Officer (2007-present) and President and a Director (2006-present) of Fidelity Management & Research (U.K.) Inc. and President and a Director of Fidelity Research & Analysis Company (2006-present). Before joining Fidelity Investments in 2005, Mr. Wetlaufer was a partner in Oxhead Capital Management (2004-2005) and a Chief Investment Officer of Putnam Investments (1997-2003). |
Scott C. Goebel (40) |
| Year of Election or Appointment: 2008 Secretary and Chief Legal Officer (CLO) of the Fidelity funds. Mr. Goebel also serves as General Counsel, Secretary, and Senior Vice President of FMR (2008-present); Deputy General Counsel of FMR LLC; Chief Legal Secretary of Fidelity Management & Research (Hong Kong) Limited (2008-present) and Assistant Secretary of Fidelity Management & Research (Japan) Inc. (2008-
present). Previously, Mr. Goebel served as Assistant Secretary of the Funds (2007-2008) and as Vice President and Secretary of Fidelity Distributors Corporation (FDC) (2005-2007). |
John B. McGinty, Jr. (46) |
| Year of Election or Appointment: 2008 Assistant Secretary of Fidelity's Equity and High Income Funds. Mr. McGinty is an employee of Fidelity Investments (2004-present). Mr. McGinty also serves as Senior Vice President, Secretary, and Chief Legal Officer of FDC (2007-present). Before joining Fidelity Investments, Mr. McGinty practiced law at Ropes & Gray, LLP. |
Holly C. Laurent (54) |
| Year of Election or Appointment: 2008 Anti-Money Laundering (AML) Officer of the Fidelity funds. Ms. Laurent is an employee of Fidelity Investments. Previously, Ms. Laurent was Senior Vice President and Head of Legal for Fidelity Business Services India Pvt. Ltd. (2006-2008), Senior Vice President, Deputy General Counsel and Group Head for FMR LLC (2005-2006). |
Christine Reynolds (50) |
| Year of Election or Appointment: 2008 Chief Financial Officer of the Fidelity funds. Ms. Reynolds became President of Fidelity Pricing and Cash Management Services (FPCMS) in August 2008. She served as Chief Operating Officer of FPCMS from 2007 through July 2008. Previously, Ms. Reynolds served as President, Treasurer, and Anti-Money Laundering officer of the Fidelity funds (2004-2007). Before joining Fidelity Investments, Ms. Reynolds worked at PricewaterhouseCoopers LLP (PwC) (1980-2002), where she was an audit partner with PwC's investment management practice. |
Kenneth A. Rathgeber (61) |
| Year of Election or Appointment: 2004 Chief Compliance Officer of Fidelity's Equity and High Income Funds. Mr. Rathgeber is Chief Compliance Officer of Fidelity Management & Research (Hong Kong) Limited (2008-present), Fidelity Management & Research (Japan) Inc. (2008-present), FMR (2005-present), FMR Co., Inc. (2005-present), Fidelity Management & Research (U.K.) Inc. (2005-present), Fidelity Research & Analysis Company (2005-present), Fidelity Investments Money Management, Inc. (2005-present), and Strategic Advisers, Inc. (2005-present). |
Bryan A. Mehrmann (47) |
| Year of Election or Appointment: 2005 Deputy Treasurer of the Fidelity funds. Mr. Mehrmann is an employee of Fidelity Investments. Previously, Mr. Mehrmann served as Vice President of Fidelity Investments Institutional Services Group (FIIS)/Fidelity Investments Institutional Operations Corporation, Inc. (FIIOC) Client Services (1998-2004). |
Adrien E. Deberghes (41) |
| Year of Election or Appointment: 2008 Deputy Treasurer of Fidelity's Equity and High Income Funds. Mr. Deberghes is an employee of Fidelity Investments (2008-present). Previously, Mr. Deberghes served as Senior Vice President of Mutual Fund Administration at State Street Corporation (2007-2008), Senior Director of Mutual Fund Administration at Investors Bank & Trust (2005-2007), and Director of Finance for Dunkin' Brands (2000-2005). |
Robert G. Byrnes (41) |
| Year of Election or Appointment: 2005 Assistant Treasurer of the Fidelity funds. Mr. Byrnes is an employee of Fidelity Investments (2005-present). Previously, Mr. Byrnes served as Vice President of Fidelity Pricing and Cash Management Services (FPCMS) (2003-2005). Before joining Fidelity Investments, Mr. Byrnes worked at Deutsche Asset Management where he served as Vice President of the Investment Operations Group (2000-2003). |
Peter L. Lydecker (54) |
| Year of Election or Appointment: 2004 Assistant Treasurer of the Fidelity funds. Mr. Lydecker is an employee of Fidelity Investments. |
Paul M. Murphy (61) |
| Year of Election or Appointment: 2007 Assistant Treasurer of the Fidelity funds. Mr. Murphy is an employee of Fidelity Investments (2007-present). Previously, Mr. Murphy served as Chief Financial Officer of the Fidelity Funds (2005-2006), Vice President and Associate General Counsel of FMR (2007), and Senior Vice President of Fidelity Pricing and Cash Management Services (FPCMS) (1994-2007). |
Gary W. Ryan (50) |
| Year of Election or Appointment: 2005 Assistant Treasurer of the Fidelity funds. Mr. Ryan is an employee of Fidelity Investments. Previously, Mr. Ryan served as Vice President of Fund Reporting in Fidelity Pricing and Cash Management Services (FPCMS) (1999-2005). |
** FMR Corp. merged with and into FMR LLC on October 1, 2007. Any references to FMR LLC for prior periods are deemed to be references to the prior entity.
Annual Report
A special meeting of the fund's shareholders was held on December 13, 2007. The results of votes taken among shareholders on the proposals before them are reported below. Each vote reported represents one dollar of net asset value held on the record date for the meeting.
PROPOSAL 1 |
To amend the Declaration of Trust to reduce the required quorum for shareholder meetings.A |
| # of
Votes | % of
Votes |
Affirmative | 45,014,793,255.82 | 80.372 |
Against | 6,871,112,667.08 | 12.268 |
Abstain | 2,163,456,438.02 | 3.863 |
Broker
Non-Votes | 1,958,633,563.89 | 3.497 |
TOTAL | 56,007,995,924.81 | 100.000 |
PROPOSAL 2 |
To elect the nominees specified below as Trustees.A |
James C. Curvey |
Affirmative | 53,384,952,361.03 | 95.317 |
Withheld | 2,623,043,563.78 | 4.683 |
TOTAL | 56,007,995,924.81 | 100.000 |
Dennis J. Dirks |
Affirmative | 53,595,104,608.67 | 95.692 |
Withheld | 2,412,891,316.14 | 4.308 |
TOTAL | 56,007,995,924.81 | 100.000 |
Albert R. Gamper, Jr. |
Affirmative | 53,570,235,221.69 | 95.647 |
Withheld | 2,437,760,703.12 | 4.353 |
TOTAL | 56,007,995,924.81 | 100.000 |
George H. Heilmeier |
Affirmative | 53,166,350,588.50 | 94.926 |
Withheld | 2,841,645,336.31 | 5.074 |
TOTAL | 56,007,995,924.81 | 100.000 |
Edward C. Johnson 3d |
Affirmative | 53,230,508,654.93 | 95.041 |
Withheld | 2,777,487,269.88 | 4.959 |
TOTAL | 56,007,995,924.81 | 100.000 |
James H. Keyes |
Affirmative | 53,549,161,456.52 | 95.610 |
Withheld | 2,458,834,468.29 | 4.390 |
TOTAL | 56,007,995,924.81 | 100.000 |
Marie L. Knowles |
Affirmative | 53,543,925,066.86 | 95.601 |
Withheld | 2,464,070,857.95 | 4.399 |
TOTAL | 56,007,995,924.81 | 100.000 |
Ned C. Lautenbach |
Affirmative | 53,547,116,322.50 | 95.606 |
Withheld | 2,460,879,602.31 | 4.394 |
TOTAL | 56,007,995,924.81 | 100.000 |
Cornelia M. Small |
Affirmative | 53,564,793,514.25 | 95.638 |
Withheld | 2,443,202,410.56 | 4.362 |
TOTAL | 56,007,995,924.81 | 100.000 |
| # of
Votes | % of
Votes |
William S. Stavropoulos |
Affirmative | 53,426,544,502.76 | 95.391 |
Withheld | 2,581,451,422.05 | 4.609 |
TOTAL | 56,007,995,924.81 | 100.000 |
Kenneth L. Wolfe |
Affirmative | 53,229,881,790.63 | 95.040 |
Withheld | 2,778,114,134.18 | 4.960 |
TOTAL | 56,007,995,924.81 | 100.000 |
ADenotes trust-wide proposal and voting results.
Annual Report
Proxy Voting Results
A special meeting of the fund's shareholders was held on April 16, 2008. The results of votes taken among shareholders on the proposals before them are reported below. Each vote reported represents one dollar of net asset value held on the record date for the meeting.
PROPOSAL 1 |
To elect a Board of Trustees.A |
| # of
Votes | % of
Votes |
James C. Curvey |
Affirmative | 44,485,656,811.55 | 94.702 |
Withheld | 2,488,551,854.62 | 5.298 |
TOTAL | 46,974,208,666.17 | 100.000 |
Dennis J. Dirks |
Affirmative | 44,706,671,638.31 | 95.173 |
Withheld | 2,267,537,027.86 | 4.827 |
TOTAL | 46,974,208,666.17 | 100.000 |
Edward C. Johnson 3d |
Affirmative | 44,294,881,638.16 | 94.296 |
Withheld | 2,679,327,028.01 | 5.704 |
TOTAL | 46,974,208,666.17 | 100.000 |
Alan J. Lacy |
Affirmative | 44,685,373,413.16 | 95.127 |
Withheld | 2,288,835,253.01 | 4.873 |
TOTAL | 46,974,208,666.17 | 100.000 |
Ned C. Lautenbach |
Affirmative | 44,634,541,379.41 | 95.019 |
Withheld | 2,339,667,286.76 | 4.981 |
TOTAL | 46,974,208,666.17 | 100.000 |
Joseph Mauriello |
Affirmative | 44,683,962,099.80 | 95.124 |
Withheld | 2,290,246,566.37 | 4.876 |
TOTAL | 46,974,208,666.17 | 100.000 |
Cornelia M. Small |
Affirmative | 44,671,688,375.36 | 95.098 |
Withheld | 2,302,520,290.81 | 4.902 |
TOTAL | 46,974,208,666.17 | 100.000 |
William S. Stavropoulos |
Affirmative | 44,465,262,087.61 | 94.659 |
Withheld | 2,508,946,578.56 | 5.341 |
TOTAL | 46,974,208,666.17 | 100.000 |
David M. Thomas |
Affirmative | 44,694,340,813.87 | 95.147 |
Withheld | 2,279,867,852.30 | 4.853 |
TOTAL | 46,974,208,666.17 | 100.000 |
Michael E. Wiley |
Affirmative | 44,686,513,174.78 | 95.130 |
Withheld | 2,287,695,491.39 | 4.870 |
TOTAL | 46,974,208,666.17 | 100.000 |
PROPOSAL 5 |
Shareholder proposal for Fidelity Overseas Fund concerning "oversight procedures to screen out investments in companies that, in the judgement of the Board, substantially contribute to genocide, patterns of extraordinary and egregious violations of human rights, or crimes against humanity." |
| # of
Votes | % of
Votes |
Affirmative | 1,027,473,497.30 | 22.075 |
Against | 3,357,951,287.91 | 72.144 |
Abstain | 211,338,442.15 | 4.541 |
Broker Non-Votes | 57,735,630.82 | 1.240 |
TOTAL | 4,654,498,858.18 | 100.000 |
A Denotes trust-wide proposal and voting results.
Annual Report
Board Approval of Investment Advisory Contracts and Management Fees
Fidelity Overseas Fund
Each year, typically in July, the Board of Trustees, including the Independent Trustees (together, the Board), votes on the renewal of the management contract and sub-advisory agreements (together, the Advisory Contracts) for the fund. The Board, assisted by the advice of fund counsel and Independent Trustees' counsel, requests and considers a broad range of information throughout the year.
The Board meets regularly and, acting directly and through its separate committees, requests and receives information concerning, and considers at each of its meetings factors that are relevant to, its annual consideration of the renewal of the fund's Advisory Contracts, including the services and support provided to the fund and its shareholders. At the time of the renewal, the Board had 12 standing committees, each composed of Independent Trustees with varying backgrounds, to which the Board has assigned specific subject matter responsibilities in order to enhance effective decision-making by the Board. Each committee has a written charter outlining the structure and purposes of the committee. The Board also meets as needed to consider matters specifically related to the Board's annual consideration of the renewal of Advisory Contracts.
At its July 2008 meeting, the Board of Trustees, including the Independent Trustees, unanimously determined to renew the fund's Advisory Contracts. In reaching its determination, the Board considered all factors it believed relevant, including (i) the nature, extent, and quality of the services to be provided to the fund and its shareholders (including the investment performance of the fund); (ii) the competitiveness of the fund's management fee and total expenses; (iii) the total costs of the services to be provided by and the profits to be realized by Fidelity from its relationship with the fund; (iv) the extent to which economies of scale would be realized as the fund grows; and (v) whether fee levels reflect these economies of scale, if any, for the benefit of fund shareholders. The Board also approved agreements with foreign sub-advisers Fidelity Management & Research (Japan) Inc. and Fidelity Management & Research (Hong Kong) Limited, as well as amendments to the fund's agreement with Fidelity Management & Research (U.K.) Inc.
In considering whether to renew the Advisory Contracts for the fund, the Board ultimately reached a determination, with the assistance of fund counsel and Independent Trustees' counsel and through the exercise of its business judgment, that the renewal of the Advisory Contracts and the compensation to be received by Fidelity under the management contract is consistent with Fidelity's fiduciary duty under applicable law. The Board's decision to renew the Advisory Contracts was not based on any single factor noted above, but rather was based on a comprehensive consideration of all the information provided to the Board at its meetings throughout the year. The Board, in reaching its determination to renew the Advisory Contracts, is aware that shareholders in the fund have a broad range of investment choices available to them, including a wide choice among mutual funds offered by competitors to Fidelity, and that the fund's shareholders, with the opportunity to review and weigh the disclosure provided by the fund in its prospectus and other public disclosures, have chosen to invest in that fund, managed by Fidelity.
Nature, Extent, and Quality of Services Provided. The Board considered staffing within the investment adviser, FMR, and the sub-advisers (together, the Investment Advisers), including the backgrounds of the fund's investment personnel and the fund's investment objectives and disciplines. The Independent Trustees also had discussions with senior management of Fidelity's investment operations and investment groups. The Board considered the structure of the portfolio manager compensation program and whether this structure provides appropriate incentives.
Resources Dedicated to Investment Management and Support Services. The Board reviewed the size, education, and experience of the Investment Advisers' investment staff, their use of technology, and the Investment Advisers' approach to recruiting, training, and retaining portfolio managers and other research, advisory, and management personnel. The Board noted that Fidelity's analysts have access to a variety of technological tools that enable them to perform both fundamental and quantitative analysis and to specialize in various disciplines. The Board considered Fidelity's extensive global research capabilities that enable the Investment Advisers to aggregate data from various sources in an effort to produce positive investment results. The Board also considered that Fidelity's portfolio managers and analysts have access to daily portfolio attribution that allows for monitoring of a fund's portfolio, as well as an electronic communication system that provides immediate real-time access to research concerning issuers and credit enhancers.
Shareholder and Administrative Services. The Board considered (i) the nature, extent, quality, and cost of advisory, administrative, distribution, and shareholder services performed by the Investment Advisers and their affiliates under the Advisory Contracts and under separate agreements covering transfer agency, pricing and bookkeeping, and securities lending services for the fund; (ii) the nature and extent of the Investment Advisers' supervision of third party service providers, principally custodians and subcustodians; and (iii) the resources devoted to, and the record of compliance with, the fund's compliance policies and procedures. The Board also reviewed the allocation of fund brokerage, including allocations to brokers affiliated with the Investment Advisers, the use of brokerage commissions to pay fund expenses, and the use of "soft" commission dollars to pay for research services. The Board further considered that Fidelity voluntarily pays for market data out of its own resources.
The Board noted that the growth of fund assets across the complex allows Fidelity to reinvest in the development of services designed to enhance the value or convenience of the Fidelity funds as investment vehicles. These services include 24-hour access to account information and market information through phone representatives and over the Internet, and investor education materials and asset allocation tools.
Investment in a Large Fund Family. The Board considered the benefits to shareholders of investing in a Fidelity fund, including the benefits of investing in a fund that is part of a large family of funds offering a variety of investment disciplines and providing for a large variety of mutual fund investor services. For example, fund shareholders are offered the privilege of exchanging shares of a fund for shares of other Fidelity funds, as set forth in the fund's prospectus, without paying a sales charge. The Board noted that Fidelity has taken a number of actions over the previous year that benefited particular funds, including (i) dedicating additional resources to investment research and to restructure the investment research teams; (ii) contractually agreeing to reduce the management fees on Fidelity's Institutional Money Market Funds and launching Class IV and Institutional Class of certain of these funds; (iii) reducing the transfer agent fees for the Fidelity Select Portfolios and Investor Class of the VIP funds; and (iv) launching Class K of 29 equity funds as a lower-fee class available to certain employer-sponsored retirement plans.
Annual Report
Board Approval of Investment Advisory Contracts and Management Fees - continued
Investment Performance. The Board considered whether the fund has operated within its investment objective, as well as its record of compliance with its investment restrictions. It also reviewed the fund's absolute investment performance, as well as the fund's relative investment performance measured against (i) a broad-based securities market index, and (ii) a peer group of mutual funds deemed appropriate by the Board over multiple periods.
The following charts considered by the Board show, over the one-, three-, and five-year periods ended December 31, 2007, the fund's cumulative total returns, the cumulative total returns of a broad-based securities market index ("benchmark"), and a range of cumulative total returns of a peer group of mutual funds identified by Morningstar, Inc. as having an investment style similar to that of the fund based on underlying portfolio holdings. (Overseas Fund did not offer Class K as of December 31, 2007.) The box within each chart shows the 25th percentile return (bottom of box) and the 75th percentile return (top of box) of the peer group. Returns shown above the box are in the first quartile and returns shown below the box are in the fourth quartile. The percentage beaten number noted below each chart corresponds to the percentile box and represents the percentage of funds in the peer group whose performance was equal to or lower than that of the fund.
Fidelity Overseas Fund

The Board reviewed the fund's relative investment performance against its peer group and stated that the performance of the fund was in the first quartile for all the periods shown. The Board also stated that the investment performance of the fund compared favorably to its benchmark for all periods shown.
The Board also considered that the fund's management fee is subject to upward or downward adjustment depending upon whether, and to what extent, the fund's investment performance for the performance period exceeds, or is exceeded by, the record (over the same period) of a Board-approved performance adjustment index. The Board realizes that the performance adjustment provides FMR with a strong economic incentive to seek to achieve superior performance for the fund's shareholders and helps to more closely align the interests of FMR and the fund's shareholders.
The Board considered that FMR has taken steps to refocus and strengthen equity research, equity portfolio management, and compliance.
Based on its review, and giving particular weight to the nature and quality of the resources dedicated by the Investment Advisers to maintain and improve relative performance, the Board concluded that the nature, extent, and quality of the services provided to the fund will benefit the fund's shareholders, particularly in light of the Board's view that the fund's shareholders benefit from investing in a fund that is part of a large family of funds offering a variety of investment disciplines and services.
Competitiveness of Management Fee and Total Fund Expenses. The Board considered the fund's management fee and total expenses compared to "mapped groups" of competitive funds and classes. Fidelity creates "mapped groups" by combining similar Lipper investment objective categories that have comparable management fee characteristics. Combining Lipper investment objective categories aids the Board's management fee and total expense comparisons by broadening the competitive group used for comparison and by reducing the number of universes to which various Fidelity funds are compared. The Board also considered supplemental information about how the fund's management fee and total expenses ranked relative to groups based on Lipper classifications, which take into account a fund's market capitalization and style.
Annual Report
The Board considered two proprietary management fee comparisons for the 12-month periods shown in the charts below. The group of Lipper funds used by the Board for management fee comparisons is referred to below as the "Total Mapped Group." The Total Mapped Group comparison focuses on a fund's standing relative to the total universe of comparable funds available to investors, in terms of gross management fees before expense reimbursements or caps, and without giving effect to the fund's performance adjustment. "TMG %" represents the percentage of funds in the Total Mapped Group that had management fees that were lower than the fund's. For example, a TMG % of 14% means that 86% of the funds in the Total Mapped Group had higher management fees than the fund. The "Asset-Size Peer Group" (ASPG) comparison focuses on a fund's standing relative to non-Fidelity funds similar in size to the fund within the Total Mapped Group. The ASPG represents at least 15% of the funds in the Total Mapped Group with comparable asset size and management fee characteristics, subject to a minimum of 50 funds (or all funds in the Total Mapped Group if fewer than 50). Additional information, such as the ASPG quartile in which the fund's management fee ranked and the impact of the fund's performance adjustment, is also included in the charts and considered by the Board.
Fidelity Overseas Fund
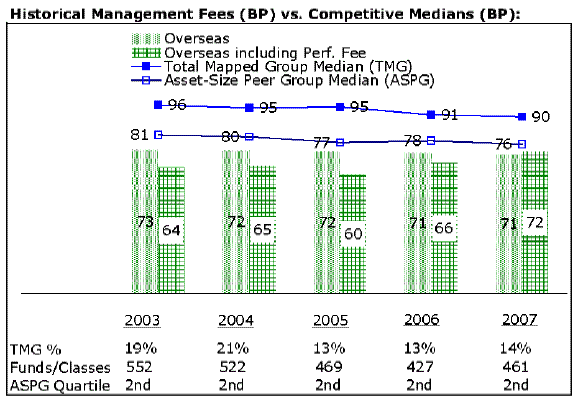
The Board noted that the fund's management fee ranked below the median of its Total Mapped Group and below the median of its ASPG for 2007. The Board also noted the effect of the fund's positive performance adjustment on the fund's management fee ranking. The Board noted that the performance adjustment for each year represents calculations for performance periods that differ from the periods shown in the performance charts above.
In connection with the renewal of the fund's management contract, the Board also approved non-material amendments to the fund's management contract to clarify certain provisions regarding the calculation of the fund's performance adjustment.
Based on its review, the Board concluded that the fund's management fee was fair and reasonable in light of the services that the fund receives and the other factors considered.
In its review of the fund's total expenses, the Board considered the fund's management fee as well as other fund expenses, such as transfer agent fees, pricing and bookkeeping fees, and custodial, legal, and audit fees. The Board also noted the effects of any waivers and reimbursements on fees and expenses, as well as the impact of the fund's performance adjustment. As part of its review, the Board also considered current and historical total expenses of the fund compared to competitive fund median expenses. The fund is compared to those funds and classes in the Total Mapped Group (used by the Board for management fee comparisons) that have a similar sales load structure.
The Board noted that the fund's total expenses ranked below its competitive median for 2007.
In its review of total expenses, the Board also considered Fidelity fee structures and other information on clients that FMR and its affiliates service in other competitive markets, such as other mutual funds advised or subadvised by FMR or its affiliates, pension plan clients, and other institutional clients.
Based on its review, the Board concluded that the fund's total expenses were reasonable in light of the services that the fund and its shareholders receive and the other factors considered.
Annual Report
Board Approval of Investment Advisory Contracts and Management Fees - continued
Costs of the Services and Profitability. The Board considered the revenues earned and the expenses incurred by Fidelity in conducting the business of developing, marketing, distributing, managing, administering and servicing the fund and its shareholders. The Board also considered the level of Fidelity's profits in respect of all the Fidelity funds.
On an annual basis, FMR presents to the Board Fidelity's profitability for the fund. Fidelity calculates the profitability for the fund, as well as aggregate profitability for groups of Fidelity funds and all Fidelity funds, using a series of detailed revenue and cost allocation methodologies which originate with the audited books and records of Fidelity. The Audit Committee of the Board reviews any significant changes from the prior year's methodologies.
PricewaterhouseCoopers LLP (PwC), independent registered public accounting firm and auditor to Fidelity and certain Fidelity funds, has been engaged annually by the Board as part of the Board's assessment of the results of Fidelity's profitability analysis. PwC's engagement includes the review and assessment of Fidelity's methodologies used in determining the revenues and expenses attributable to Fidelity's mutual fund business, and completion of agreed-upon procedures surrounding the mathematical accuracy of fund profitability and its conformity to allocation methodologies. After considering PwC's reports issued under the engagement and information provided by Fidelity, the Board believes that while other allocation methods may also be reasonable, Fidelity's profitability methodologies are reasonable in all material respects.
The Board has also reviewed Fidelity's non-fund businesses and any fall-out benefits related to the mutual fund business as well as cases where Fidelity's affiliates may benefit from or be related to the fund's business.
The Board considered the costs of the services provided by and the profits realized by Fidelity in connection with the operation of the fund and determined that the amount of profit is a fair entrepreneurial profit for the management of the fund.
Economies of Scale. The Board considered whether there have been economies of scale in respect of the management of the Fidelity funds, whether the Fidelity funds (including the fund) have appropriately benefited from any such economies of scale, and whether there is potential for realization of any further economies of scale. The Board considered the extent to which the fund will benefit from economies of scale through increased services to the fund, through waivers or reimbursements, or through fee or expense reductions.
The Board recognized that the fund's management contract incorporates a "group fee" structure, which provides for lower group fee rates as total fund assets under FMR's management increase, and for higher group fee rates as total fund assets under FMR's management decrease. FMR determines the group fee rates based on a tiered asset "breakpoint" schedule. The Board considered that the group fee is designed to deliver the benefits of economies of scale to fund shareholders when total fund assets increase, even if assets of any particular fund are unchanged or have declined, because some portion of Fidelity's costs are attributable to services provided to all Fidelity funds, and all funds benefit if those costs can be allocated among more assets. The Board concluded that, given the group fee structure, fund shareholders will achieve a certain level of economies of scale as assets under FMR's management increase at the fund complex level, regardless of whether Fidelity achieves any such economies of scale.
The Board further concluded that any potential economies of scale are being shared between fund shareholders and Fidelity in an appropriate manner.
Additional Information Requested by the Board. In order to develop fully the factual basis for consideration of the Fidelity funds' Advisory Contracts, the Board requested and received additional information on certain topics, including (i) fund performance trends and actions to be taken by FMR to improve certain funds' overall performance; (ii) portfolio manager changes that have occurred during the past year; (iii) Fidelity's fund profitability methodology, the profitability of certain fund service providers, and profitability trends for certain funds; (iv) Fidelity's compensation structure for portfolio managers and key personnel, including its effects on fund profitability and the extent to which portfolio manager compensation is linked to fund performance; (v) Fidelity's fee structures and rationale for recommending different fees among categories of funds; and (vi) Fidelity's rationale for recommending which funds should have a performance adjustment component as part of their management fees.
Based on its evaluation of all of the conclusions noted above, and after considering all material factors, the Board ultimately concluded that the advisory fee structures are fair and reasonable, and that the fund's Advisory Contracts should be renewed.
Annual Report
Managing Your Investments
Fidelity offers several ways to conveniently manage your personal investments via your telephone or PC. You can access your account information, conduct trades and research your investments 24 hours a day.
By Phone
Fidelity Automated Service Telephone provides a single toll-free number to access account balances, positions, quotes and trading. It's easy to navigate the service, and on your first call, the system will help you create a personal identification number (PIN) for security.
(phone_graphic)
Fidelity Automated Service Telephone (FAST®)
1-800-544-5555
Press
For mutual fund and brokerage trading.
For quotes.*
For account balances and holdings.
To review orders and mutual fund activity.
To change your PIN.
To speak to a Fidelity representative.
By PC
Fidelity's web site on the Internet provides a wide range of information, including daily financial news, fund performance, interactive planning tools and news about Fidelity products and services.
(computer_graphic)
Fidelity's Web Site
www.fidelity.com
* When you call the quotes line, please remember that a fund's yield and return will vary and, except for money market funds, share price will also vary. This means that you may have a gain or loss when you sell your shares. There is no assurance that money market funds will be able to maintain a stable $1 share price; an investment in a money market fund is not insured or guaranteed by the U.S. government. Total returns are historical and include changes in share price, reinvestment of dividends and capital gains, and the effects of any sales charges.
Annual Report
To Write Fidelity
We'll give your correspondence immediate attention and send you written confirmation upon completion of your request.
(letter_graphic)
Making Changes
To Your Account
(such as changing name, address, bank, etc.)
Fidelity Investments
P.O. Box 770001
Cincinnati, OH 45277-0002
(letter_graphic)
For Non-Retirement
Accounts
Buying shares
Fidelity Investments
P.O. Box 770001
Cincinnati, OH 45277-0003
Overnight Express
Fidelity Investments
Attn: Distribution Services
100 Crosby Parkway - KC1H
Covington, KY 41015
Selling shares
Fidelity Investments
P.O. Box 770001
Cincinnati, OH 45277-0035
Overnight Express
Fidelity Investments
Attn: Distribution Services
100 Crosby Parkway - KC1H
Covington, KY 41015
General Correspondence
Fidelity Investments
P.O. Box 500
Merrimack, NH 03054-0500
(letter_graphic)
For Retirement
Accounts
Buying shares
Fidelity Investments
P.O. Box 770001
Cincinnati, OH 45277-0003
Selling shares
Fidelity Investments
P.O. Box 770001
Cincinnati, OH 45277-0035
Overnight Express
Fidelity Investments
Attn: Distribution Services
100 Crosby Parkway - KC1H
Covington, KY 41015
General Correspondence
Fidelity Investments
P.O. Box 500
Merrimack, NH 03054-0500
Annual Report
To Visit Fidelity
For directions and hours,
please call 1-800-544-9797.
Arizona
7001 West Ray Road
Chandler, AZ
15445 N. Scottsdale Road
Scottsdale, AZ
California
815 East Birch Street
Brea, CA
1411 Chapin Avenue
Burlingame, CA
851 East Hamilton Avenue
Campbell, CA
19200 Von Karman Avenue
Irvine, CA
601 Larkspur Landing Circle
Larkspur, CA
2000 Avenue of the Stars
Los Angeles, CA
27101 Puerta Real
Mission Viejo, CA
73-575 El Paseo
Palm Desert, CA
251 University Avenue
Palo Alto, CA
123 South Lake Avenue
Pasadena, CA
16656 Bernardo Ctr. Drive
Rancho Bernardo, CA
1220 Roseville Parkway
Roseville, CA
1740 Arden Way
Sacramento, CA
7676 Hazard Center Drive
San Diego, CA
11943 El Camino Real
San Diego, CA
8 Montgomery Street
San Francisco, CA
3793 State Street
Santa Barbara, CA
1200 Wilshire Boulevard
Santa Monica, CA
398 West El Camino Real
Sunnyvale, CA
111 South Westlake Blvd
Thousand Oaks, CA
21701 Hawthorne Boulevard
Torrance, CA
2001 North Main Street
Walnut Creek, CA
6326 Canoga Avenue
Woodland Hills, CA
Colorado
281 East Flatiron Circle
Broomfield, CO
1625 Broadway
Denver, CO
9185 Westview Road
Lone Tree, CO
Connecticut
48 West Putnam Avenue
Greenwich, CT
265 Church Street
New Haven, CT
300 Atlantic Street
Stamford, CT
29 South Main Street
West Hartford, CT
Delaware
400 Delaware Avenue
Wilmington, DE
Florida
175 East Altamonte Drive
Altamonte Springs, FL
4400 N. Federal Highway
Boca Raton, FL
121 Alhambra Plaza
Coral Gables, FL
2948 N. Federal Highway
Ft. Lauderdale, FL
4671 Town Center Parkway
Jacksonville, FL
8880 Tamiami Trail, North
Naples, FL
230 Royal Palm Way
Palm Beach, FL
3501 PGA Boulevard
Palm Beach Gardens, FL
3550 Tamiami Trail, South
Sarasota, FL
1502 N. Westshore Blvd.
Tampa, FL
2465 State Road 7
Wellington, FL
Georgia
3445 Peachtree Road, N.E.
Atlanta, GA
1000 Abernathy Road
Atlanta, GA
Illinois
One North LaSalle Street
Chicago, IL
401 North Michigan Avenue
Chicago, IL
One Skokie Valley Road
Highland Park, IL
1415 West 22nd Street
Oak Brook, IL
15105 S LaGrange Road
Orland Park, IL
1572 East Golf Road
Schaumburg, IL
Indiana
4729 East 82nd Street
Indianapolis, IN
8480 Keystone Crossing
Indianapolis, IN
Kansas
5400 College Boulevard
Overland Park, KS
Maine
Three Canal Plaza
Portland, ME
Maryland
7315 Wisconsin Avenue
Bethesda, MD
610 York Road
Towson, MD
Massachusetts
801 Boylston Street
Boston, MA
155 Congress Street
Boston, MA
300 Granite Street
Braintree, MA
44 Mall Road
Burlington, MA
238 Main Street
Cambridge, MA
200 Endicott Street
Danvers, MA
405 Cochituate Road
Framingham, MA
551 Boston Turnpike
Shrewsbury, MA
Michigan
500 E. Eisenhower Pkwy.
Ann Arbor, MI
280 Old N. Woodward Ave.
Birmingham, MI
30200 Northwestern Hwy.
Farmington Hills, MI
43420 Grand River Avenue
Novi, MI
Minnesota
7740 France Avenue South
Edina, MN
8342 3rd Street North
Oakdale, MN
Missouri
1524 South Lindbergh Blvd.
St. Louis, MO
Nevada
2225 Village Walk Drive
Henderson, NV
New Jersey
501 Route 73 South
Marlton, NJ
150 Essex Street
Millburn, NJ
35 Morris Street
Morristown, NJ
396 Route 17, North
Paramus, NJ
3518 Route 1 North
Princeton, NJ
530 Broad Street
Shrewsbury, NJ
New Mexico
2261 Q Street NE
Albuquerque, NM
New York
1130 Franklin Avenue
Garden City, NY
37 West Jericho Turnpike
Huntington Station, NY
1271 Avenue of the Americas
New York, NY
980 Madison Avenue
New York, NY
61 Broadway
New York, NY
350 Park Avenue
New York, NY
200 Fifth Avenue
New York, NY
733 Third Avenue
New York, NY
11 Penn Plaza
New York, NY
2070 Broadway
New York, NY
1075 Northern Blvd.
Roslyn, NY
799 Central Park Avenue
Scarsdale, NY
North Carolina
4611 Sharon Road
Charlotte, NC
7011 Fayetteville Road
Durham, NC
Ohio
3805 Edwards Road
Cincinnati, OH
1324 Polaris Parkway
Columbus, OH
1800 Crocker Road
Westlake, OH
28699 Chagrin Boulevard
Woodmere Village, OH
Oregon
7493 SW Bridgeport Road
Tigard, OR
Pennsylvania
600 West DeKalb Pike
King of Prussia, PA
1735 Market Street
Philadelphia, PA
12001 Perry Highway
Wexford, PA
Rhode Island
10 Memorial Boulevard
Providence, RI
Tennessee
3018 Peoples Street
Johnson City, TN
7628 West Farmington Blvd.
Germantown, TN
2035 Mallory Lane
Franklin, TN
Texas
10000 Research Boulevard
Austin, TX
4001 Northwest Parkway
Dallas, TX
12532 Memorial Drive
Houston, TX
2701 Drexel Drive
Houston, TX
6560 Fannin Street
Houston, TX
1701 Lake Robbins Drive
The Woodlands, TX
6500 N. MacArthur Blvd.
Irving, TX
6005 West Park Boulevard
Plano, TX
14100 San Pedro
San Antonio, TX
1576 East Southlake Blvd.
Southlake, TX
Utah
279 West South Temple
Salt Lake City, UT
Virginia
1861 International Drive
McLean, VA
Washington
10500 NE 8th Street
Bellevue, WA
1518 6th Avenue
Seattle, WA
Washington, DC
1900 K Street, N.W.
Washington, DC
Wisconsin
16020 West Bluemound Road
Brookfield, WI
Annual Report
Investment Adviser
Fidelity Management & Research Company
Boston, MA
Investment Sub-Advisers
FMR Co., Inc.
Fidelity Management & Research (U.K.) Inc.
Fidelity Management & Research
(Hong Kong) Limited
Fidelity Management & Research
(Japan) Inc.
Fidelity Research & Analysis Company
FIL Investment Advisors
FIL Investment Advisors (U.K.) Ltd.
Fidelity Investments Japan Limited
General Distributor
Fidelity Distributors Corporation
Boston, MA
Transfer and Service Agents
Fidelity Investments Institutional
Operations Company, Inc.
Boston, MA
Fidelity Service Company, Inc.
Boston, MA
Custodian
JPMorgan Chase Bank
New York, NY
Corporate Headquarters
82 Devonshire Street
Boston, MA 02109
1-800-544-8888
OVE-K-UANN-1208
1.863317.100
Fidelity's
Targeted International Equity
Funds®
Fidelity® Canada Fund
Fidelity China Region Fund
Fidelity Emerging Markets Fund
Fidelity Europe Fund
Fidelity Europe Capital Appreciation Fund
Fidelity Japan Fund
Fidelity Japan Smaller Companies Fund
Fidelity Latin America Fund
Fidelity Nordic Fund
Fidelity Pacific Basin Fund
Fidelity Southeast Asia Fund
Annual Report
October 31, 2008
(2_fidelity_logos) (Registered_Trademark)
Contents
To view a fund's proxy voting guidelines and proxy voting record for the 12-month period ended June 30, visit http://www.fidelity.com (search for "proxy voting guidelines") or visit the Securities and Exchange Commission's (SEC) web site at http://www.sec.gov. You may also call 1-800-544-8544 to request a free copy of the proxy voting guidelines.
Standard & Poor's, S&P and S&P 500 are registered service marks of The McGraw-Hill Companies, Inc. and have been licensed for use by Fidelity Distributors Corporation.
Other third party marks appearing herein are the property of their respective owners.
All other marks appearing herein are registered or unregistered trademarks or service marks of FMR LLC or an affiliated company.
This report and the financial statements contained herein are submitted for the general information of the shareholders of the funds. This report is not authorized for distribution to prospective investors in the funds unless preceded or accompanied by an effective prospectus.
A fund files its complete schedule of portfolio holdings with the SEC for the first and third quarters of each fiscal year on Form N-Q. Forms N-Q are available on the SEC's web site at http://www.sec.gov. A fund's Forms N-Q may be reviewed and copied at the SEC's Public Reference Room in Washington, DC. Information regarding the operation of the SEC's Public Reference Room may be obtained by calling 1-800-SEC-0330. For a complete list of a fund's portfolio holdings, view each fund's most recent holdings listing, semiannual report, or annual report on Fidelity's web site at http://www.fidelity.com or http://www.advisor.fidelity.com, as applicable.
NOT FDIC INSURED · MAY LOSE VALUE · NO BANK GUARANTEE
Neither the funds nor Fidelity Distributors Corporation is a bank.
Annual Report
(photo_of_Edward_C_Johnson_3d)
Dear Shareholder:
Turmoil has been the watchword for the world's securities markets in 2008, with domestic and international stocks down sharply amid the global credit squeeze. A flight to quality boosted returns for U.S. Treasuries, one of the few asset classes with positive results heading into the latter stages of the year. Financial markets are always unpredictable, but there are a number of time-tested principles that can put the historical odds in your favor.
One of the basic tenets is to invest for the long term. Over time, riding out the markets' inevitable ups and downs has proven much more effective than selling into panic or chasing the hottest trend. Even missing only a few of the markets' best days can significantly diminish investor returns. Patience also affords the benefits of compounding - of earning interest on additional income or reinvested dividends and capital gains. There are tax advantages and cost benefits to consider as well. The more you sell, the more taxes you pay, and the more you trade, the higher the costs. While staying the course doesn't eliminate risk, it can considerably lessen the effect of short-term declines.
You can further manage your investing risk through diversification. And today, more than ever, geographic diversification should be taken into account. Studies indicate that asset allocation is the single most important determinant of a portfolio's long-term success. The right mix of stocks, bonds and cash - aligned to your particular risk tolerance and investment objective - is very important. Age-appropriate rebalancing is also an essential aspect of asset allocation. For younger investors, an emphasis on equities - which historically have been the best-performing asset class over time - is encouraged. As investors near their specific goal, such as retirement or sending a child to college, consideration may be given to replacing volatile assets (e.g. common stocks) with more-stable fixed investments (bonds or savings plans).
A third investment principle - investing regularly - can help lower the average cost of your purchases. Investing a certain amount of money each month or quarter helps ensure you won't pay for all your shares at market highs. This strategy - known as dollar cost averaging - also reduces unconstructive "emotion" from investing, helping shareholders avoid selling weak performers just prior to an upswing, or chasing a hot performer just before a correction.
We invite you to contact us via the Internet, through our Investor Centers or over the phone. It is our privilege to provide you the information you need to make the investments that are right for you.
Sincerely,
/s/Edward C. Johnson 3d
Edward C. Johnson 3d
Annual Report
Canada
Shareholder Expense Example
As a shareholder of the Fund, you incur two types of costs: (1) transaction costs, including sales charges (loads) on purchase payments or redemption proceeds and redemption fees, and (2) ongoing costs, including management fees, distribution and/or service (12b-1) fees and other Fund expenses. This Example is intended to help you understand your ongoing costs (in dollars) of investing in the Fund and to compare these costs with the ongoing costs of investing in other mutual funds.
The Example is based on an investment of $1,000 invested at the beginning of the period and held for the entire period (May 1, 2008 to October 31, 2008).
Actual Expenses
The first line of the accompanying table for each class of the Fund provides information about actual account values and actual expenses. You may use the information in this line, together with the amount you invested, to estimate the expenses that you paid over the period. Simply divide your account value by $1,000.00 (for example, an $8,600 account value divided by $1,000.00 = 8.6), then multiply the result by the number in the first line for a class of the Fund under the heading entitled "Expenses Paid During Period" to estimate the expenses you paid on your account during this period. A small balance maintenance fee of $12.00 that is charged once a year may apply for certain accounts with a value of less than $2,000. This fee is not included in the table below. If it was, the estimate of expenses you paid during the period would be higher, and your ending account value lower, by this amount. In addition, the Fund, as a shareholder in the underlying Fidelity Central Funds, will indirectly bear its pro rata share of the fees and expenses incurred by the underlying Fidelity Central Funds. These fees and expenses are not included in the Fund's annualized expense ratio used to calculate the expense estimate in the table below.
Hypothetical Example for Comparison Purposes
The second line of the accompanying table for each class of the Fund provides information about hypothetical account values and hypothetical expenses based on a Class' actual expense ratio and an assumed rate of return of 5% per year before expenses, which is not the Class' actual return. The hypothetical account values and expenses may not be used to estimate the actual ending account balance or expenses you paid for the period. You may use this information to compare the ongoing costs of investing in the Fund and other funds. To do so, compare this 5% hypothetical example with the 5% hypothetical examples that appear in the shareholder reports of the other funds. A small balance maintenance fee of $12.00 that is charged once a year may apply for certain accounts with a value of less than $2,000. This fee is not included in the table below. If it was, the estimate of expenses you paid during the period would be higher, and your ending account value lower, by this amount. In addition, the Fund, as a shareholder in the underlying Fidelity Central Funds, will indirectly bear its pro rata share of the fees and expenses incurred by the underlying Fidelity Central Funds. These fees and expenses are not included in the Fund's annualized expense ratio used to calculate the expense estimate in the table below.
Please note that the expenses shown in the table are meant to highlight your ongoing costs only and do not reflect any transaction costs. Therefore, the second line of the table is useful in comparing ongoing costs only, and will not help you determine the relative total costs of owning different funds. In addition, if these transactional costs were included, your costs would have been higher.
| Annualized Expense Ratio | Beginning
Account Value
May 1, 2008 | Ending
Account Value
October 31, 2008 | Expenses Paid
During Period*
May 1, 2008
to October 31, 2008 |
Class A | 1.37% | | | |
Actual | | $ 1,000.00 | $ 628.90 | $ 5.61 |
HypotheticalA | | $ 1,000.00 | $ 1,018.25 | $ 6.95 |
Class T | 1.66% | | | |
Actual | | $ 1,000.00 | $ 628.00 | $ 6.79 |
HypotheticalA | | $ 1,000.00 | $ 1,016.79 | $ 8.42 |
Class B | 2.16% | | | |
Actual | | $ 1,000.00 | $ 626.40 | $ 8.83 |
HypotheticalA | | $ 1,000.00 | $ 1,014.28 | $ 10.94 |
Class C | 2.16% | | | |
Actual | | $ 1,000.00 | $ 626.40 | $ 8.83 |
HypotheticalA | | $ 1,000.00 | $ 1,014.28 | $ 10.94 |
Canada | 1.07% | | | |
Actual | | $ 1,000.00 | $ 629.80 | $ 4.38 |
HypotheticalA | | $ 1,000.00 | $ 1,019.76 | $ 5.43 |
Institutional Class | 1.14% | | | |
Actual | | $ 1,000.00 | $ 629.60 | $ 4.67 |
HypotheticalA | | $ 1,000.00 | $ 1,019.41 | $ 5.79 |
A 5% return per year before expenses
* Expenses are equal to each Class' annualized expense ratio, multiplied by the average account value over the period, multiplied by 184/366 (to reflect the one-half year period).
Annual Report
Canada
Performance: The Bottom Line
Average annual total return reflects the change in the value of an investment, assuming reinvestment of the class' dividend income and capital gains (the profits earned upon the sale of securities that have grown in value, if any) and assuming a constant rate of performance each year. The $10,000 table and the fund's returns do not reflect the deduction of taxes that a shareholder would pay on fund distributions or the redemption of fund shares. During periods of reimbursement by Fidelity, a fund's total returns will be greater than it would be had the reimbursement not occurred. How a fund did yesterday is no guarantee of how it will do tomorrow.
Average Annual Total Returns
Periods ended October 31, 2008 | Past 1
year | Past 5
years | Past 10
years |
Canada | -42.06% | 11.00% | 13.07% |
$10,000 Over 10 Years
Let's say hypothetically that $10,000 was invested in Canada, a class of the fund, on October 31, 1998. The chart shows how the value of your investment would have changed, and also shows how the S&P/TSX Composite Index performed over the same period.
Annual Report
Canada
Management's Discussion of Fund Performance
Comments from Douglas Lober, who became Portfolio Manager of Fidelity® Canada Fund on September 1, 2008
In a dramatic reversal of what had been a multiyear global growth story, international stocks fell long and hard during the 12 months ending October 31, 2008, especially so during the latter stages of the period and mostly as a result of fallout from the financial crisis that emanated from the United States. The viral spread of this financial contagion - which began in the U.S. subprime mortgage market, then seized up the credit markets, hobbled major financial institutions and eventually slowed economic growth worldwide - left virtually no corner of the globe untouched. Developed international equity markets - as gauged by the MSCI® Europe, Australasia, Far East (EAFE®) Index, which monitors established markets outside the U.S. and Canada - fell 46.54%, while the Standard & Poor's 500SM Index, a measure of U.S. stocks, dropped 36.10%. Among countries constituting at least 1% of the EAFE index, Switzerland had the "least worst" showing, falling roughly 32%, followed by Japan, where stocks slid by around 37%. Meanwhile, the weakest overall performance came from Belgium, where stocks slipped by nearly 70%. In the United Kingdom, the largest component of the index, equities were down almost 48%. Emerging markets were the weakest performers among the global economies, declining 56.22% as measured by the MSCI Emerging Markets Index.
For the year ending October 31, 2008, the fund's Retail Class shares fell 42.06%, beating the 46.37% decline of the S&P/TSX Composite Index. Prudent stock selection in the energy and materials sectors supported the fund's return versus the benchmark. Overweighted positions in oil and natural gas pipeline company TransCanada, fertilizer company Potash Corp. of Saskatchewan, Toronto-Dominion Bank and transportation manufacturer Bombardier made these stocks the fund's top contributors. Having virtually no exposure to floundering telecommunications equipment maker and index component Nortel Networks also helped when equipment investment cutbacks by telecom carriers drove down this company's stock. I sold the position. Underweighting Canadian Imperial Bank of Commerce also helped when this stock faltered. Lastly, the fund's cash holdings boosted performance substantially. On the other hand, we missed the strength of pipeline company Enbridge, having chosen to invest in TransCanada instead, and we had disappointing results from our positioning in Bank of Nova Scotia, T-shirt manufacturer Gildan Activewear, and gold mining companies Yamana Gold and Barrick Gold, both of which declined along with other commodities stocks during the period. Currency fluctuations also dampened performance.
Note to shareholders: Fidelity Canada Fund may invest up to 35% of its total assets in any industry that represents more than 20% of the Canadian market. As of October 31, 2008, the fund did not have more than 25% of its total assets invested in any one industry.
The views expressed above reflect those of the portfolio manager(s) only through the end of the period as stated on the cover of this report and do not necessarily represent the views of Fidelity or any other person in the Fidelity organization. Any such views are subject to change at any time based upon market or other conditions and Fidelity disclaims any responsibility to update such views. These views may not be relied on as investment advice and, because investment decisions for a Fidelity fund are based on numerous factors, may not be relied on as an indication of trading intent on behalf of any Fidelity fund.
Annul Report
Canada
Investment Changes (Unaudited)
Geographic Diversification (% of fund's net assets) |
As of October 31, 2008 |
| Canada | 92.8% | |
| United States of America | 7.2% | |

Percentages are adjusted for the effect of futures contracts, if applicable. |
|
As of April 30, 2008 |
| Canada | 92.0% | |
| United States of America | 8.0% | |

Percentages are adjusted for the effect of futures contracts, if applicable. |
Asset Allocation |
| % of fund's
net assets | % of fund's net assets
6 months ago |
Stocks | 98.5 | 91.9 |
Short-Term Investments and Net Other Assets | 1.5 | 8.1 |
Top Ten Stocks as of October 31, 2008 |
| % of fund's
net assets | % of fund's net assets
6 months ago |
Royal Bank of Canada (Commercial Banks) | 6.5 | 3.5 |
Toronto-Dominion Bank (Commercial Banks) | 6.2 | 4.4 |
EnCana Corp. (Oil, Gas & Consumable Fuels) | 6.2 | 5.0 |
Canadian Natural Resources Ltd. (Oil, Gas & Consumable Fuels) | 5.2 | 3.9 |
Canadian National Railway Co. (Road & Rail) | 4.3 | 0.4 |
TransCanada Corp. (Oil, Gas & Consumable Fuels) | 4.3 | 3.3 |
Potash Corp. of Saskatchewan, Inc. (Chemicals) | 3.5 | 5.0 |
Research In Motion Ltd. (Communications Equipment) | 3.4 | 4.4 |
Manulife Financial Corp. (Insurance) | 3.3 | 4.2 |
Rogers Communications, Inc. Class B (non-vtg.) (Wireless Telecommunication Services) | 2.9 | 2.8 |
| 45.8 | |
Market Sectors as of October 31, 2008 |
| % of fund's
net assets | % of fund's net assets
6 months ago |
Energy | 28.8 | 27.9 |
Financials | 27.8 | 21.2 |
Materials | 11.3 | 14.8 |
Industrials | 7.7 | 9.2 |
Telecommunication Services | 7.0 | 4.9 |
Consumer Staples | 5.7 | 3.2 |
Information Technology | 5.3 | 6.9 |
Consumer Discretionary | 3.1 | 3.5 |
Health Care | 1.4 | 0.3 |
Utilities | 0.4 | 0.0 |
Annual Report
Canada
Investments October 31, 2008
Showing Percentage of Net Assets
Common Stocks - 98.5% |
| Shares | | Value |
CONSUMER DISCRETIONARY - 3.1% |
Hotels, Restaurants & Leisure - 0.9% |
McDonald's Corp. | 250,000 | | $ 14,482,500 |
Tim Hortons, Inc. | 500,000 | | 12,585,000 |
| | 27,067,500 |
Media - 1.7% |
Astral Media, Inc. Class A (non-vtg.) | 340,000 | | 7,858,517 |
Corus Entertainment, Inc. Class B (non-vtg.) (d) | 550,000 | | 6,431,415 |
Groupe Aeroplan, Inc. | 490,000 | | 4,254,686 |
Quebecor, Inc. Class B (sub. vtg.) | 900,000 | | 14,681,539 |
Thomson Reuters Corp. (d) | 400,000 | | 9,414,497 |
Yellow Pages Income Fund (d) | 900,000 | | 6,530,934 |
| | 49,171,588 |
Textiles, Apparel & Luxury Goods - 0.5% |
Gildan Activewear, Inc. (a) | 560,000 | | 13,050,257 |
TOTAL CONSUMER DISCRETIONARY | | 89,289,345 |
CONSUMER STAPLES - 5.7% |
Food & Staples Retailing - 3.3% |
Alimentation Couche-Tard, Inc. Class B (sub. vtg.) | 1,210,000 | | 16,306,601 |
George Weston Ltd. | 80,000 | | 4,080,942 |
Metro, Inc. Class A (sub. vtg.) | 940,000 | | 23,659,811 |
Shoppers Drug Mart Corp. | 1,300,000 | | 50,024,880 |
| | 94,072,234 |
Food Products - 1.4% |
Campbell Soup Co. | 460,000 | | 17,457,000 |
General Mills, Inc. | 280,000 | | 18,967,200 |
Viterra, Inc. (a) | 809,300 | | 5,134,471 |
| | 41,558,671 |
Household Products - 1.0% |
Procter & Gamble Co. | 450,000 | | 29,043,000 |
TOTAL CONSUMER STAPLES | | 164,673,905 |
ENERGY - 28.8% |
Energy Equipment & Services - 0.1% |
Flint Energy Services Ltd. (a) | 260,000 | | 1,498,590 |
Precision Drilling Trust (d) | 163,300 | | 1,760,574 |
| | 3,259,164 |
Oil, Gas & Consumable Fuels - 28.7% |
Cameco Corp. | 1,050,000 | | 17,180,710 |
Canadian Natural Resources Ltd. | 2,950,000 | | 148,796,650 |
Canadian Oil Sands Trust | 1,250,000 | | 33,525,460 |
Enbridge, Inc. | 608,900 | | 21,138,293 |
EnCana Corp. | 3,500,000 | | 177,728,479 |
Exxon Mobil Corp. | 400,000 | | 29,648,000 |
Husky Energy, Inc. | 1,500,000 | | 45,032,344 |
|
| Shares | | Value |
Imperial Oil Ltd. | 900,000 | | $ 31,833,637 |
Keyera Facilities Income Fund | 2,050,000 | | 31,044,120 |
Nexen, Inc. | 1,350,000 | | 21,428,927 |
Niko Resources Ltd. | 240,000 | | 10,509,206 |
Petro-Canada | 1,450,000 | | 36,243,987 |
Suncor Energy, Inc. | 2,950,000 | | 70,826,422 |
Talisman Energy, Inc. | 2,700,000 | | 26,668,602 |
TransCanada Corp. | 4,100,000 | | 123,836,457 |
| | 825,441,294 |
TOTAL ENERGY | | 828,700,458 |
FINANCIALS - 27.8% |
Capital Markets - 0.1% |
IGM Financial, Inc. | 100,000 | | 3,022,060 |
Commercial Banks - 18.1% |
Bank of Montreal (d) | 1,609,300 | | 57,415,895 |
Bank of Nova Scotia | 1,500,000 | | 49,995,853 |
Canadian Imperial Bank of Commerce | 784,600 | | 35,566,625 |
National Bank of Canada | 280,000 | | 10,498,258 |
Royal Bank of Canada | 4,840,000 | | 188,012,608 |
Toronto-Dominion Bank | 3,800,000 | | 179,379,665 |
| | 520,868,904 |
Diversified Financial Services - 0.3% |
Onex Corp. (sub. vtg.) | 400,000 | | 6,916,570 |
TMX Group, Inc. | 145,000 | | 3,395,920 |
| | 10,312,490 |
Insurance - 7.7% |
Fairfax Financial Holdings Ltd. | 90,000 | | 24,705,590 |
ING Canada, Inc. | 525,000 | | 14,285,329 |
Manulife Financial Corp. | 4,800,000 | | 96,015,923 |
Power Corp. of Canada (sub. vtg.) | 2,100,000 | | 45,629,458 |
Sun Life Financial, Inc. | 1,700,000 | | 39,969,315 |
| | 220,605,615 |
Real Estate Investment Trusts - 0.1% |
RioCan (REIT) | 250,000 | | 3,485,238 |
Real Estate Management & Development - 1.5% |
Brookfield Asset Management, Inc. Class A (d) | 2,050,000 | | 35,872,450 |
Brookfield Properties Corp. | 650,000 | | 6,558,504 |
| | 42,430,954 |
TOTAL FINANCIALS | | 800,725,261 |
HEALTH CARE - 1.4% |
Health Care Equipment & Supplies - 0.7% |
Baxter International, Inc. | 300,000 | | 18,147,000 |
Noveko International, Inc. (a) | 2,500,000 | | 2,944,103 |
| | 21,091,103 |
Common Stocks - continued |
| Shares | | Value |
HEALTH CARE - continued |
Pharmaceuticals - 0.7% |
Johnson & Johnson | 300,000 | | $ 18,402,000 |
TOTAL HEALTH CARE | | 39,493,103 |
INDUSTRIALS - 7.7% |
Aerospace & Defense - 1.4% |
Bombardier, Inc. Class B (sub. vtg.) | 9,900,000 | | 38,177,973 |
CAE, Inc. | 500,000 | | 2,931,664 |
| | 41,109,637 |
Construction & Engineering - 0.8% |
SNC-Lavalin Group, Inc. | 815,000 | | 21,405,747 |
Road & Rail - 5.2% |
Canadian National Railway Co. | 2,870,000 | | 124,530,105 |
Canadian Pacific Railway Ltd. | 550,000 | | 24,881,821 |
| | 149,411,926 |
Trading Companies & Distributors - 0.3% |
Finning International, Inc. | 705,000 | | 8,565,475 |
TOTAL INDUSTRIALS | | 220,492,785 |
INFORMATION TECHNOLOGY - 5.3% |
Communications Equipment - 3.4% |
Research In Motion Ltd. (a)(d) | 1,910,000 | | 96,321,310 |
Computers & Peripherals - 0.3% |
Hewlett-Packard Co. | 250,000 | | 9,570,000 |
Internet Software & Services - 0.3% |
Open Text Corp. (a) | 350,000 | | 8,870,459 |
IT Services - 1.3% |
CGI Group, Inc. Class A (sub. vtg.) (a) | 4,690,000 | | 37,417,316 |
TOTAL INFORMATION TECHNOLOGY | | 152,179,085 |
MATERIALS - 11.3% |
Chemicals - 4.1% |
Agrium, Inc. | 460,000 | | 17,613,369 |
Potash Corp. of Saskatchewan, Inc. | 1,180,000 | | 100,606,802 |
| | 118,220,171 |
Metals & Mining - 7.2% |
Agnico-Eagle Mines Ltd. | 200,000 | | 5,516,669 |
Barrick Gold Corp. (d) | 3,600,000 | | 82,282,302 |
Goldcorp, Inc. | 3,350,000 | | 62,621,496 |
Kinross Gold Corp. | 2,350,000 | | 24,458,865 |
Orezone Resources, Inc. Class A (a) | 10,000,000 | | 1,617,184 |
Shore Gold, Inc. (a) | 400,000 | | 208,990 |
Teck Cominco Ltd. Class B (sub. vtg.) | 1,900,000 | | 18,908,608 |
Yamana Gold, Inc. | 2,700,000 | | 12,875,270 |
| | 208,489,384 |
TOTAL MATERIALS | | 326,709,555 |
|
| Shares | | Value |
TELECOMMUNICATION SERVICES - 7.0% |
Diversified Telecommunication Services - 4.1% |
BCE, Inc. | 2,750,000 | | $ 79,890,944 |
TELUS Corp. | 1,050,000 | | 37,069,580 |
| | 116,960,524 |
Wireless Telecommunication Services - 2.9% |
Rogers Communications, Inc. Class B (non-vtg.) | 2,900,000 | | 84,152,430 |
TOTAL TELECOMMUNICATION SERVICES | | 201,112,954 |
UTILITIES - 0.4% |
Electric Utilities - 0.3% |
Fortis, Inc. | 400,000 | | 8,724,498 |
Multi-Utilities - 0.1% |
Canadian Utilities Ltd. Class A (non-vtg.) | 100,000 | | 3,516,338 |
TOTAL UTILITIES | | 12,240,836 |
TOTAL COMMON STOCKS (Cost $3,177,288,022) | 2,835,617,287 |
Money Market Funds - 4.2% |
| | | |
Fidelity Cash Central Fund, 1.81% (b) | 44,876,838 | | 44,876,838 |
Fidelity Securities Lending Cash Central Fund, 2.67% (b)(c) | 74,627,890 | | 74,627,890 |
TOTAL MONEY MARKET FUNDS (Cost $119,504,728) | 119,504,728 |
TOTAL INVESTMENT
PORTFOLIO - 102.7% (Cost $3,296,792,750) | | 2,955,122,015 |
NET OTHER ASSETS - (2.7)% | | (76,419,060) |
NET ASSETS - 100% | $ 2,878,702,955 |
Legend |
(a) Non-income producing |
(b) Affiliated fund that is available only to investment companies and other accounts managed by Fidelity Investments. The rate quoted is the annualized seven-day yield of the fund at period end. A complete unaudited listing of the fund's holdings as of its most recent quarter end is available upon request. |
(c) Investment made with cash collateral received from securities on loan. |
(d) Security or a portion of the security is on loan at period end. |
Affiliated Central Funds |
Information regarding fiscal year to date income earned by the Fund from investments in Fidelity Central Funds is as follows: |
Fund | Income earned |
Fidelity Cash Central Fund | $ 7,406,661 |
Fidelity Securities Lending Cash Central Fund | 7,155,677 |
Total | $ 14,562,338 |
Income Tax Information |
At October 31, 2008, the fund had a capital loss carryforward of approximately $109,618,723 all of which will expire on October 31, 2016. |
See accompanying notes which are an integral part of the financial statements.
Annual Report
Canada
Financial Statements
Statement of Assets and Liabilities
| October 31, 2008 |
| | |
Assets | | |
Investment in securities, at value (including securities loaned of $70,624,731) - See accompanying schedule: Unaffiliated issuers
(cost $3,177,288,022) | $ 2,835,617,287 | |
Fidelity Central Funds
(cost $119,504,728) | 119,504,728 | |
Total Investments (cost $3,296,792,750) | | $ 2,955,122,015 |
Cash | | 50,940 |
Foreign currency held at value
(cost $1,751,041) | | 1,751,041 |
Receivable for investments sold | | 37,624,117 |
Receivable for fund shares sold | | 6,126,409 |
Dividends receivable | | 3,564,722 |
Distributions receivable from Fidelity Central Funds | | 930,110 |
Prepaid expenses | | 1,171 |
Other receivables | | 560,878 |
Total assets | | 3,005,731,403 |
| | |
Liabilities | | |
Payable for investments purchased | $ 39,987,092 | |
Payable for fund shares redeemed | 8,966,712 | |
Accrued management fee | 2,327,601 | |
Distribution fees payable | 37,935 | |
Other affiliated payables | 956,398 | |
Other payables and accrued expenses | 124,820 | |
Collateral on securities loaned, at value | 74,627,890 | |
Total liabilities | | 127,028,448 |
| | |
Net Assets | | $ 2,878,702,955 |
Net Assets consist of: | | |
Paid in capital | | $ 3,364,193,370 |
Undistributed net investment income | | 26,382,786 |
Accumulated undistributed net realized gain (loss) on investments and foreign currency transactions | | (170,169,032) |
Net unrealized appreciation (depreciation) on investments and assets and liabilities in foreign currencies | | (341,704,169) |
Net Assets | | $ 2,878,702,955 |
Statement of Assets and Liabilities - continued
| October 31, 2008 |
| | |
Calculation of Maximum Offering Price Class A:
Net Asset Value and redemption
price per share ($56,241,768 ÷ 1,472,410 shares) | | $ 38.20 |
| | |
Maximum offering price per share (100/94.25 of $38.20) | | $ 40.53 |
Class T:
Net Asset Value and redemption
price per share ($14,962,665 ÷ 392,759 shares) | | $ 38.10 |
| | |
Maximum offering price per share (100/96.50 of $38.10) | | $ 39.48 |
Class B:
Net Asset Value and offering
price per share ($5,614,606 ÷ 148,110 shares)A | | $ 37.91 |
| | |
Class C:
Net Asset Value and offering
price per share ($16,715,712 ÷ 441,756 shares)A | | $ 37.84 |
| | |
Canada:
Net Asset Value, offering price and redemption price per share ($2,776,298,056 ÷ 72,354,690 shares) | | $ 38.37 |
| | |
Institutional Class:
Net Asset Value, offering price and redemption price per share ($8,870,148 ÷ 231,554 shares) | | $ 38.31 |
A Redemption price per share is equal to net asset value less any applicable contingent deferred sales charge.
See accompanying notes which are an integral part of the financial statements.
Annual Report
Statement of Operations
| Year ended October 31, 2008 |
Investment Income | | |
Dividends | | $ 88,816,652 |
Interest | | 3,342,141 |
Income from Fidelity Central Funds (including $7,155,677 from security lending) | | 14,562,338 |
| | 106,721,131 |
Less foreign taxes withheld | | (13,248,424) |
Total income | | 93,472,707 |
| | |
Expenses | | |
Management fee
Basic fee | $ 33,096,529 | |
Performance adjustment | 2,474,546 | |
Transfer agent fees | 10,148,036 | |
Distribution fees | 476,058 | |
Accounting and security lending fees | 1,552,365 | |
Custodian fees and expenses | 128,586 | |
Independent trustees' compensation | 20,487 | |
Registration fees | 278,940 | |
Audit | 74,475 | |
Legal | 21,976 | |
Interest | 8,474 | |
Miscellaneous | 540,182 | |
Total expenses before reductions | 48,820,654 | |
Expense reductions | (1,414,672) | 47,405,982 |
Net investment income (loss) | | 46,066,725 |
Realized and Unrealized Gain (Loss) Net realized gain (loss) on: | | |
Investment securities: | | |
Unaffiliated issuers | (171,748,787) | |
Foreign currency transactions | (3,938,430) | |
Total net realized gain (loss) | | (175,687,217) |
Change in net unrealized appreciation (depreciation) on: Investment securities | (2,180,802,820) | |
Assets and liabilities in foreign currencies | (200,050) | |
Total change in net unrealized appreciation (depreciation) | | (2,181,002,870) |
Net gain (loss) | | (2,356,690,087) |
Net increase (decrease) in net assets resulting from operations | | $ (2,310,623,362) |
Statement of Changes in Net Assets
| Year ended
October 31,
2008 | Year ended
October 31,
2007 |
Increase (Decrease) in Net Assets | | |
Operations | | |
Net investment income (loss) | $ 46,066,725 | $ 33,178,201 |
Net realized gain (loss) | (175,687,217) | 272,277,024 |
Change in net unrealized appreciation (depreciation) | (2,181,002,870) | 1,120,719,255 |
Net increase (decrease) in net assets resulting from operations | (2,310,623,362) | 1,426,174,480 |
Distributions to shareholders from net investment income | (28,915,979) | (22,989,617) |
Distributions to shareholders from net realized gain | (235,022,630) | (65,775,827) |
Total distributions | (263,938,609) | (88,765,444) |
Share transactions - net increase (decrease) | 507,012,286 | 467,056,549 |
Redemption fees | 3,308,433 | 1,551,369 |
Total increase (decrease) in net assets | (2,064,241,252) | 1,806,016,954 |
| | |
Net Assets | | |
Beginning of period | 4,942,944,207 | 3,136,927,253 |
End of period (including undistributed net investment income of $26,382,786 and undistributed net investment income of $26,450,845, respectively) | $ 2,878,702,955 | $ 4,942,944,207 |
See accompanying notes which are an integral part of the financial statements.
Annual Report
Financial Highlights - Class A
Years ended October 31, | 2008 | 2007 H |
Selected Per-Share Data | | |
Net asset value, beginning of period | $ 70.16 | $ 54.00 |
Income from Investment Operations | | |
Net investment income (loss) E | .39 | .19 |
Net realized and unrealized gain (loss) | (28.71) | 15.96 |
Total from investment operations | (28.32) | 16.15 |
Distributions from net investment income | (.41) | - |
Distributions from net realized gain | (3.27) | - |
Total distributions | (3.68) | - |
Redemption fees added to paid in capital E | .04 | .01 |
Net asset value, end of period | $ 38.20 | $ 70.16 |
Total Return B, C, D | (42.23)% | 29.93% |
Ratios to Average Net Assets F, I | | |
Expenses before reductions | 1.34% | 1.23% A |
Expenses net of fee waivers, if any | 1.34% | 1.23% A |
Expenses net of all reductions | 1.31% | 1.22% A |
Net investment income (loss) | .69% | .63% A |
Supplemental Data | | |
Net assets, end of period (000 omitted) | $ 56,242 | $ 20,912 |
Portfolio turnover rate G | 63% | 42% |
A Annualized B Total returns for periods of less than one year are not annualized. C Total returns would have been lower had certain expenses not been reduced during the periods shown. D Total returns do not include the effect of the sales charges. E Calculated based on average shares outstanding during the period. F Fees and expenses of the underlying Fidelity Central Funds are not included in the Fund's expense ratio. The Fund indirectly bears its proportionate share of the expenses of any underlying Fidelity Central Funds. G Amount does not include the portfolio activity of any underlying Fidelity Central Funds. H For the period May 2, 2007 (commencement of sale of shares) to October 31, 2007. I Expense ratios reflect operating expenses of the class. Expenses before reductions do not reflect amounts reimbursed by the investment adviser or reductions from brokerage service arrangements or other expense offset arrangements and do not represent the amount paid by the class during periods when reimbursements or reductions occur. Expense ratios before reductions for start-up periods may not be representative of longer-term operating periods. Expenses net of fee waivers reflect expenses after reimbursement by the investment adviser but prior to reductions from brokerage service arrangements or other expense offset arrangements. Expenses net of all reductions represent the net expenses paid by the class. |
Financial Highlights - Class T
Years ended October 31, | 2008 | 2007 H |
Selected Per-Share Data | | |
Net asset value, beginning of period | $ 70.09 | $ 54.00 |
Income from Investment Operations | | |
Net investment income (loss) E | .23 | .09 |
Net realized and unrealized gain (loss) | (28.66) | 15.99 |
Total from investment operations | (28.43) | 16.08 |
Distributions from net investment income | (.33) | - |
Distributions from net realized gain | (3.27) | - |
Total distributions | (3.60) | - |
Redemption fees added to paid in capital E | .04 | .01 |
Net asset value, end of period | $ 38.10 | $ 70.09 |
Total ReturnB, C, D | (42.40)% | 29.80% |
Ratios to Average Net AssetsF, I | | |
Expenses before reductions | 1.63% | 1.48% A |
Expenses net of fee waivers, if any | 1.63% | 1.48% A |
Expenses net of all reductions | 1.60% | 1.47% A |
Net investment income (loss) | .40% | .30% A |
Supplemental Data | | |
Net assets, end of period (000 omitted) | $ 14,963 | $ 14,522 |
Portfolio turnover rateG | 63% | 42% |
A Annualized B Total returns for periods of less than one year are not annualized. C Total returns would have been lower had certain expenses not been reduced during the periods shown. D Total returns do not include the effect of the sales charges. E Calculated based on average shares outstanding during the period. F Fees and expenses of the underlying Fidelity Central Funds are not included in the Fund's expense ratio. The Fund indirectly bears its proportionate share of the expenses of any underlying Fidelity Central Funds. G Amount does not include the portfolio activity of any underlying Fidelity Central Funds. H For the period May 2, 2007 (commencement of sale of shares) to October 31, 2007. I Expense ratios reflect operating expenses of the class. Expenses before reductions do not reflect amounts reimbursed by the investment adviser or reductions from brokerage service arrangements or other expense offset arrangements and do not represent the amount paid by the class during periods when reimbursements or reductions occur. Expense ratios before reductions for start-up periods may not be representative of longer-term operating periods. Expenses net of fee waivers reflect expenses after reimbursement by the investment adviser but prior to reductions from brokerage service arrangements or other expense offset arrangements. Expenses net of all reductions represent the net expenses paid by the class. |
See accompanying notes which are an integral part of the financial statements.
Annual Report
Financial Highlights - Class B
Years ended October 31, | 2008 | 2007 H |
Selected Per-Share Data | | |
Net asset value, beginning of period | $ 69.88 | $ 54.00 |
Income from Investment Operations | | |
Net investment income (loss) E | (.06) | (.06) |
Net realized and unrealized gain (loss) | (28.54) | 15.93 |
Total from investment operations | (28.60) | 15.87 |
Distributions from net investment income | (.14) | - |
Distributions from net realized gain | (3.27) | - |
Total distributions | (3.41) | - |
Redemption fees added to paid in capital E | .04 | .01 |
Net asset value, end of period | $ 37.91 | $ 69.88 |
Total ReturnB, C, D | (42.68)% | 29.41% |
Ratios to Average Net AssetsF, I | | |
Expenses before reductions | 2.13% | 2.00% A |
Expenses net of fee waivers, if any | 2.13% | 2.00%A |
Expenses net of all reductions | 2.10% | 1.99%A |
Net investment income (loss) | (.10)% | (.21)%A |
Supplemental Data | | |
Net assets, end of period (000 omitted) | $ 5,615 | $ 4,078 |
Portfolio turnover rate G | 63% | 42% |
A Annualized B Total returns for periods of less than one year are not annualized. C Total returns would have been lower had certain expenses not been reduced during the periods shown. D Total returns do not include the effect of the contingent deferred sales charge. E Calculated based on average shares outstanding during the period. F Fees and expenses of the underlying Fidelity Central Funds are not included in the Fund's expense ratio. The Fund indirectly bears its proportionate share of the expenses of any underlying Fidelity Central Funds. G Amount does not include the portfolio activity of any underlying Fidelity Central Funds. H For the period May 2, 2007 (commencement of sale of shares) to October 31, 2007. I Expense ratios reflect operating expenses of the class. Expenses before reductions do not reflect amounts reimbursed by the investment adviser or reductions from brokerage service arrangements or other expense offset arrangements and do not represent the amount paid by the class during periods when reimbursements or reductions occur. Expense ratios before reductions for start-up periods may not be representative of longer-term operating periods. Expenses net of fee waivers reflect expenses after reimbursement by the investment adviser but prior to reductions from brokerage service arrangements or other expense offset arrangements. Expenses net of all reductions represent the net expenses paid by the class. |
Financial Highlights - Class C
Years ended October 31, | 2008 | 2007 H |
Selected Per-Share Data | | |
Net asset value, beginning of period | $ 69.91 | $ 54.00 |
Income from Investment Operations | | |
Net investment income (loss) E | (.05) | (.04) |
Net realized and unrealized gain (loss) | (28.52) | 15.94 |
Total from investment operations | (28.57) | 15.90 |
Distributions from net investment income | (.27) | - |
Distributions from net realized gain | (3.27) | - |
Total distributions | (3.54) | - |
Redemption fees added to paid in capitalE | .04 | .01 |
Net asset value, end of period | $ 37.84 | $ 69.91 |
Total ReturnB, C, D | (42.69)% | 29.46% |
Ratios to Average Net AssetsF, I | | |
Expenses before reductions | 2.13% | 1.99% A |
Expenses net of fee waivers, if any | 2.13% | 1.99%A |
Expenses net of all reductions | 2.10% | 1.97%A |
Net investment income (loss) | (.10)% | (.15)%A |
Supplemental Data | | |
Net assets, end of period (000 omitted) | $ 16,716 | $ 8,752 |
Portfolio turnover rate G | 63% | 42% |
A Annualized B Total returns for periods of less than one year are not annualized. C Total returns would have been lower had certain expenses not been reduced during the periods shown. D Total returns do not include the effect of the contingent deferred sales charge. E Calculated based on average shares outstanding during the period. F Fees and expenses of the underlying Fidelity Central Funds are not included in the Fund's expense ratio. The Fund indirectly bears its proportionate share of the expenses of any underlying Fidelity Central Funds. G Amount does not include the portfolio activity of any underlying Fidelity Central Funds. H For the period May 2, 2007 (commencement of sale of shares) to October 31, 2007. I Expense ratios reflect operating expenses of the class. Expenses before reductions do not reflect amounts reimbursed by the investment adviser or reductions from brokerage service arrangements or other expense offset arrangements and do not represent the amount paid by the class during periods when reimbursements or reductions occur. Expense ratios before reductions for start-up periods may not be representative of longer-term operating periods. Expenses net of fee waivers reflect expenses after reimbursement by the investment adviser but prior to reductions from brokerage service arrangements or other expense offset arrangements. Expenses net of all reductions represent the net expenses paid by the class. |
See accompanying notes which are an integral part of the financial statements.
Annual Report
Financial Highlights - Canada
Years ended October 31, | 2008 | 2007 | 2006 | 2005 | 2004 |
Selected Per-Share Data | | | | | |
Net asset value, beginning of period | $ 70.25 | $ 49.48 | $ 39.14 | $ 31.87 | $ 25.13 |
Income from Investment Operations | | | | | |
Net investment income (loss) B | .58 | .52 | .34 | .20 | .10 |
Net realized and unrealized gain (loss) | (28.83) | 21.62 | 10.15 | 7.12 | 6.74 |
Total from investment operations | (28.25) | 22.14 | 10.49 | 7.32 | 6.84 |
Distributions from net investment income | (.40) | (.36) | (.16) | (.08) | (.13) |
Distributions from net realized gain | (3.27) | (1.03) | (.01) | - | - |
Total distributions | (3.67) | (1.39) | (.17) | (.08) | (.13) |
Redemption fees added to paid in capitalB | .04 | .02 | .02 | .03 | .03 |
Net asset value, end of period | $ 38.37 | $ 70.25 | $ 49.48 | $ 39.14 | $ 31.87 |
Total ReturnA | (42.06)% | 46.03% | 26.93% | 23.11% | 27.45% |
Ratios to Average Net AssetsC, E | | | | | |
Expenses before reductions | 1.03% | .96% | 1.00% | 1.08% | 1.20% |
Expenses net of fee waivers, if any | 1.03% | .96% | 1.00% | 1.08% | 1.20% |
Expenses net of all reductions | 1.00% | .94% | .97% | 1.04% | 1.15% |
Net investment income (loss) | 1.00% | .94% | .74% | .55% | .34% |
Supplemental Data | | | | | |
Net assets, end of period (000 omitted) | $ 2,776,298 | $ 4,890,617 | $ 3,136,927 | $ 1,722,516 | $ 413,319 |
Portfolio turnover rateD | 63% | 42% | 50% | 24% | 47% |
A Total returns would have been lower had certain expenses not been reduced during the periods shown. B Calculated based on average shares outstanding during the period. C Fees and expenses of the underlying Fidelity Central Funds are not included in the Fund's expense ratio. The Fund indirectly bears its proportionate share of the expenses of any underlying Fidelity Central Funds. D Amount does not include the portfolio activity of any underlying Fidelity Central Funds. E Expense ratios reflect operating expenses of the class. Expenses before reductions do not reflect amounts reimbursed by the investment adviser or reductions from brokerage service arrangements or other expense offset arrangements and do not represent the amount paid by the class during periods when reimbursements or reductions occur. Expenses net of fee waivers reflect expenses after reimbursement by the investment adviser but prior to reductions from brokerage service arrangements or other expense offset arrangements. Expenses net of all reductions represent the net expenses paid by the class. |
Financial Highlights - Institutional Class
Years ended October 31, | 2008 | 2007 G |
Selected Per-Share Data | | |
Net asset value, beginning of period | $ 70.25 | $ 54.00 |
Income from Investment Operations | | |
Net investment income (loss) D | .52 | .25 |
Net realized and unrealized gain (loss) | (28.78) | 15.99 |
Total from investment operations | (28.26) | 16.24 |
Distributions from net investment income | (.45) | - |
Distributions from net realized gain | (3.27) | - |
Total distributions | (3.72) | - |
Redemption fees added to paid in capitalD | .04 | .01 |
Net asset value, end of period | $ 38.31 | $ 70.25 |
Total ReturnB, C | (42.11)% | 30.09% |
Ratios to Average Net AssetsE, H | | |
Expenses before reductions | 1.11% | 1.01%A |
Expenses net of fee waivers, if any | 1.11% | 1.01%A |
Expenses net of all reductions | 1.08% | .99%A |
Net investment income (loss) | .92% | .83%A |
Supplemental Data | | |
Net assets, end of period (000 omitted) | $ 8,870 | $ 4,064 |
Portfolio turnover rateF | 63% | 42% |
A Annualized B Total returns for periods of less than one year are not annualized. C Total returns would have been lower had certain expenses not been reduced during the periods shown. D Calculated based on average shares outstanding during the period. E Fees and expenses of the underlying Fidelity Central Funds are not included in the Fund's expense ratio. The Fund indirectly bears its proportionate share of the expenses of any underlying Fidelity Central Funds. F Amount does not include the portfolio activity of any underlying Fidelity Central Funds. G For the period May 2, 2007 (commencement of sale of shares) to October 31, 2007. H Expense ratios reflect operating expenses of the class. Expenses before reductions do not reflect amounts reimbursed by the investment adviser or reductions from brokerage service arrangements or other expense offset arrangements and do not represent the amount paid by the class during periods when reimbursements or reductions occur. Expense ratios before reductions for start-up periods may not be representative of longer-term operating periods. Expenses net of fee waivers reflect expenses after reimbursement by the investment adviser but prior to reductions from brokerage service arrangements or other expense offset arrangements. Expenses net of all reductions represent the net expenses paid by the class. |
See accompanying notes which are an integral part of the financial statements.
Annual Report
Canada
Notes to Financial Statements
For the period ended October 31, 2008
1. Organization.
Fidelity Canada Fund (the Fund) is a fund of Fidelity Investment Trust (the trust) and is authorized to issue an unlimited number of shares. The trust is registered under the Investment Company Act of 1940, as amended (the 1940 Act), as an open-end management investment company organized as a Massachusetts business trust. The Fund offers Class A, Class T, Class B, Class C, Canada, and Institutional Class shares, each of which has equal rights as to assets and voting privileges. Each class has exclusive voting rights with respect to matters that affect that class. Class B shares will automatically convert to Class A shares after a holding period of seven years from the initial date of purchase. Investment income, realized and unrealized capital gains and losses, the common expenses of the Fund, and certain fund-level expense reductions, if any, are allocated on a pro rata basis to each class based on the relative net assets of each class to the total net assets of the Fund. Each class differs with respect to transfer agent and distribution and service plan fees incurred. Certain expense reductions also differ by class.
2. Investments in Fidelity Central Funds.
The Fund may invest in Fidelity Central Funds, which are open-end investment companies available only to other investment companies and accounts managed by Fidelity Management & Research Company (FMR) and its affiliates. The Fund's Schedule of Investments lists each of the Fidelity Central Funds held as of period end, if any, as an investment of the Fund, but does not include the underlying holdings of each Fidelity Central Fund. As an Investing Fund, the Fund indirectly bears its proportionate share of the expenses of the underlying Fidelity Central Funds.
The Money Market Central Funds seek preservation of capital and current income and are managed by Fidelity Investments Money Management, Inc. (FIMM), an affiliate of FMR.
A complete unaudited list of holdings for each Fidelity Central Fund is available upon request or at the SEC's web site at www.sec.gov. In addition, the financial statements of the Fidelity Central Funds, which are not covered by the Fund's Report of Independent Registered Public Accounting Firm, are available on the SEC's web site or upon request.
3. Significant Accounting Policies.
The financial statements have been prepared in conformity with accounting principles generally accepted in the United States of America, which require management to make certain estimates and assumptions at the date of the financial statements. Actual results could differ from those estimates. The following summarizes the significant accounting policies of the Fund:
Security Valuation. Investments are valued as of 4:00 p.m. Eastern time on the last calendar day of the period. Wherever possible, the Fund uses independent pricing services approved by the Board of Trustees to value its investments.
Equity securities, including restricted securities, for which market quotations are readily available, are valued at the last reported sale price or official closing price as reported by an independent pricing service on the primary market or exchange on which they are traded. In the event there were no sales during the day or closing prices are not available, securities are valued at the last quoted bid price. Investments in open-end mutual funds, including the Fidelity Central Funds, are valued at their closing net asset value each business day. Short-term securities with remaining maturities of sixty days or less for which quotations are not readily available are valued at amortized cost, which approximates value.
When current market prices or quotations are not readily available or reliable, valuations may be determined in good faith in accordance with procedures adopted by the Board of Trustees. Factors used in determining value may include significant market or security specific events, changes in interest rates and credit quality, and developments in foreign markets which are monitored by evaluating the performance of ADRs, futures contracts and exchange-traded funds. The frequency with which these procedures are used cannot be predicted and may be utilized to a significant extent. The value of securities used for net asset value (NAV) calculation under these procedures may differ from published prices for the same securities.
Foreign Currency. The Fund uses foreign currency contracts to facilitate transactions in foreign-denominated securities. Losses from these transactions may arise from changes in the value of the foreign currency or if the counterparties do not perform under the contracts' terms.
Foreign-denominated assets, including investment securities, and liabilities are translated into U.S. dollars at the exchange rate at period end. Purchases and sales of investment securities, income and dividends received and expenses denominated in foreign currencies are translated into U.S. dollars at the exchange rate in effect on the transaction date.
The effects of exchange rate fluctuations on investments are included with the net realized and unrealized gain (loss) on investment securities. Other foreign currency transactions resulting in realized and unrealized gain (loss) are disclosed separately.
Investment Transactions and Income. For financial reporting purposes, the Fund's investment holdings and NAV include trades executed through the end of the last business day of the period. The NAV per share for processing shareholder transactions is calculated as of the close of business of the New York Stock Exchange (NYSE), normally 4:00 p.m. Eastern time and includes trades executed through the end of the prior business day. Gains and losses on securities sold are determined on the basis of identified cost and may include proceeds received from litigation. Dividend income is recorded
Annual Report
Canada
Notes to Financial Statements - continued
3. Significant Accounting Policies - continued
Investment Transactions and Income - continued
on the ex-dividend date, except for certain dividends from foreign securities where the ex-dividend date may have passed, which are recorded as soon as the Fund is informed of the ex-dividend date. Non-cash dividends included in dividend income, if any, are recorded at the fair market value of the securities received. Distributions received on securities that represent a return of capital or capital gain are recorded as a reduction of cost of investments and/or as a realized gain. The Fund estimates the components of distributions received that may be considered return of capital distributions or capital gain distributions. Interest income and distributions from the Fidelity Central Funds are accrued as earned. Interest income includes coupon interest and amortization of premium and accretion of discount on debt securities. Investment income is recorded net of foreign taxes withheld where recovery of such taxes is uncertain.
Expenses. Most expenses of the trust can be directly attributed to a fund. Expenses which cannot be directly attributed are apportioned among each Fund in the trust. Expense estimates are accrued in the period to which they relate and adjustments are made when actual amounts are known.
Income Tax Information and Distributions to Shareholders. Each year, the Fund intends to qualify as a regulated investment company by distributing substantially all of its taxable income and realized gains under Subchapter M of the Internal Revenue Code and filing its U.S. federal tax return. As a result, no provision for income taxes is required. The Fund is subject to the provisions of FASB Interpretation No. 48, Accounting for Uncertainties in Income Taxes (FIN 48). FIN 48 sets forth a minimum threshold for financial statement recognition of the benefit of a tax position taken or expected to be taken in a tax return. The implementation of FIN 48 did not result in any unrecognized tax benefits in the accompanying financial statements. Each of the Fund's federal tax returns for the prior three fiscal years remains subject to examination by the Internal Revenue Service (IRS). Foreign taxes are provided for based on the Fund's understanding of the tax rules and rates that exist in the foreign markets in which it invests.
Distributions are recorded on the ex-dividend date. Income dividends and capital gain distributions are declared separately for each class. Income and capital gain distributions are determined in accordance with income tax regulations, which may differ from generally accepted accounting principles. In addition, the Fund will claim a portion of the payment made to redeeming shareholders as a distribution for income tax purposes.
Capital accounts within the financial statements are adjusted for permanent book-tax differences. These adjustments have no impact on net assets or the results of operations. Temporary book-tax differences will reverse in a subsequent period.
Book-tax differences are primarily due to foreign currency transactions, market discount, partnerships, deferred trustees compensation, capital loss carryforwards and losses deferred due to wash sales.
The tax-basis components of distributable earnings and the federal tax cost as of period end were as follows:
Unrealized appreciation | $ 324,549,848 |
Unrealized depreciation | (726,804,328) |
Net unrealized appreciation (depreciation) | (402,254,480) |
Undistributed ordinary income | 2,358,954 |
Capital loss carryforward | (109,618,723) |
| |
Cost for federal income tax purposes | $ 3,357,376,495 |
The tax character of distributions paid was as follows:
| October 31, 2008 | October 31, 2007 |
Ordinary Income | $ 73,476,845 | $ 44,702,026 |
Long-term Capital Gains | 190,461,764 | 44,063,418 |
Total | $ 263,938,609 | $ 88,765,444 |
Short-Term Trading (Redemption) Fees. Shares held in the Fund less than 90 days are subject to a redemption fee equal to 1.50% of the proceeds of the redeemed shares. All redemption fees, including any estimated redemption fees paid by FMR, are retained by the Fund and accounted for as an addition to paid in capital.
New Accounting Pronouncement. In September 2006, Statement of Financial Accounting Standards No. 157, Fair Value Measurements (SFAS 157), was issued and is effective for fiscal years beginning after November 15, 2007. SFAS 157 defines fair value, establishes a framework for measuring fair value and results in expanded disclosures about fair value measurements.
Annual Report
4. Operating Policies.
Repurchase Agreements. FMR has received an Exemptive Order from the Securities and Exchange Commission (the SEC) which permits the Fund and other affiliated entities of FMR to transfer uninvested cash balances into joint trading accounts which are then invested in repurchase agreements. The Fund may also invest directly with institutions in repurchase agreements. Repurchase agreements are collateralized by government or non-government securities. Upon settlement date, collateral is held in segregated accounts with custodian banks and may be obtained in the event of a default of the counterparty. The Fund monitors, on a daily basis, the value of the collateral to ensure it is at least equal to the principal amount of the repurchase agreement (including accrued interest). In the event of a default by the counterparty, realization of the collateral proceeds could be delayed, during which time the value of the collateral may decline.
5. Purchases and Sales of Investments.
Purchases and sales of securities, other than short-term securities, aggregated $3,167,394,306 and $2,747,790,024, respectively.
6. Fees and Other Transactions with Affiliates.
Management Fee. FMR and its affiliates provide the Fund with investment management related services for which the Fund pays a monthly management fee. The management fee is the sum of an individual fund fee rate that is based on an annual rate of .45% of the Fund's average net assets and a group fee rate that averaged .26% during the period. The group fee rate is based upon the average net assets of all the mutual funds advised by FMR. The group fee rate decreases as assets under management increase and increases as assets under management decrease. In addition, the management fee is subject to a performance adjustment(up to a maximum of +/- .20% of the Fund's average net assets over a 36 month performance period). The upward or downward adjustment to the management fee is based on the relative investment performance of the retail class of the Fund, Canada as compared to an appropriate benchmark index. For the period, the total annual management fee rate, including the performance adjustment, was .76% of the Fund's average net assets.
Distribution and Service Plan. In accordance with Rule 12b-1 of the 1940 Act, the Fund has adopted separate Distribution and Service Plans for each class of shares. Certain classes pay Fidelity Distributors Corporation (FDC), an affiliate of FMR, separate Distribution and Service Fees, each of which is based on an annual percentage of each class' average net assets. In addition, FDC may pay financial intermediaries for selling shares of the Fund and providing shareholder support services. For the period, the Distribution and Service Fee rates and the total amounts paid to and retained by FDC were as follows:
| Distribution
Fee | Service
Fee | Paid to
FDC | Retained
by FDC |
Class A | 0% | .25% | $ 134,706 | $ 11,780 |
Class T | .25% | .25% | 94,298 | 591 |
Class B | .75% | .25% | 59,556 | 44,734 |
Class C | .75% | .25% | 187,498 | 129,911 |
| | | $ 476,058 | $ 187,016 |
Sales Load. FDC receives a front-end sales charge of up to 5.75% for selling Class A shares, and 3.50% for selling Class T shares, some of which is paid to financial intermediaries for selling shares of the Fund. FDC receives the proceeds of contingent deferred sales charges levied on Class A, Class T, Class B, and Class C redemptions. These charges depend on the holding period. The deferred sales charges range from 5% to 1% for Class B, 1% for Class C, 1.00% to .50% for certain purchases of Class A shares and .25% for certain purchases of Class T shares.
For the period, sales charge amounts retained by FDC were as follows:
| Retained
by FDC |
Class A | $ 153,357 |
Class T | 23,474 |
Class B* | 42,730 |
Class C* | 13,585 |
| $ 233,146 |
* When Class B and Class C shares are initially sold, FDC pays commissions from its own resources to financial intermediaries through which the sales are made.
Annual Report
Canada
Notes to Financial Statements - continued
6. Fees and Other Transactions with Affiliates - continued
Transfer Agent Fees. Fidelity Investments Institutional Operations Company, Inc. (FIIOC), an affiliate of FMR, is the transfer, dividend disbursing and shareholder servicing agent for each class of the Fund. FIIOC receives account fees and asset-based fees that vary according to the account size and type of account of the shareholders of the respective classes of the Fund. FIIOC pays for typesetting, printing and mailing of shareholder reports, except proxy statements. Prior to January 1, 2008, Fidelity Service Company, Inc. (FSC), also an affiliate of FMR, was the transfer agent for Canada. For the period, each class paid the following transfer agent fees:
| Amount | % of
Average
Net Assets |
Class A | $ 147,254 | .27 |
Class T | 58,242 | .31 |
Class B | 18,975 | .32 |
Class C | 58,666 | .31 |
Canada | 9,834,578 | .22 |
Institutional Class | 30,321 | .30 |
| $ 10,148,036 | |
Accounting and Security Lending Fees. FSC maintains the Fund's accounting records. The accounting fee is based on the level of average net assets for the month. Under a separate contract, FSC administers the security lending program. The security lending fee is based on the number and duration of lending transactions.
Brokerage Commissions. The Fund placed a portion of its portfolio transactions with brokerage firms which are affiliates of the investment adviser. The commissions paid to these affiliated firms were $774 for the period.
Interfund Lending Program. Pursuant to an Exemptive Order issued by the SEC, the Fund, along with other registered investment companies having management contracts with FMR, may participate in an interfund lending program. This program provides an alternative credit facility allowing the funds to borrow from, or lend money to, other participating affiliated funds. At period end, there were no interfund loans outstanding. The Fund's activity in this program during the period for which loans were outstanding was as follows:
Borrower or Lender | Average Daily
Loan Balance | Weighted Average Interest Rate | Interest
Expense |
Borrower | $ 36,021,500 | 4.23% | $ 8,474 |
7. Committed Line of Credit.
The Fund participates with other funds managed by FMR in a $4.2 billion credit facility (the "line of credit") to be utilized for temporary or emergency purposes to fund shareholder redemptions or for other short-term liquidity purposes. The Fund has agreed to pay commitment fees on its pro rata portion of the line of credit, which amounted to $9,367 and is reflected in Miscellaneous Expense on the Statement of Operations. During the period, there were no borrowings on this line of credit.
8. Security Lending.
The Fund lends portfolio securities from time to time in order to earn additional income. On the settlement date of the loan, the Fund receives collateral (in the form of U.S. Treasury obligations, letters of credit and/or cash) against the loaned securities and maintains collateral in an amount not less than 100% of the market value of the loaned securities during the period of the loan. The market value of the loaned securities is determined at the close of business of the Fund and any additional required collateral is delivered to the Fund on the next business day. If the borrower defaults on its obligation to return the securities loaned because of insolvency or other reasons, a fund could experience delays and costs in recovering the securities loaned or in gaining access to the collateral. Any cash collateral received is invested in the Fidelity Securities Lending Cash Central Fund. The value of loaned securities and cash collateral at period end are disclosed on the Fund's Statement of Assets and Liabilities. Security lending income represents the income earned on investing cash collateral, less fees and expenses associated with the loan, plus any premium payments that may be received on the loan of certain types of securities. Security lending income is presented in the Statement of Operations as a component of income from Fidelity Central Funds.
Annual Report
9. Expense Reductions.
FMR voluntarily agreed to reimburse a portion of Canada's operating expenses. During the period, this reimbursement reduced the class' expenses by $48,320.
Many of the brokers with whom FMR places trades on behalf of the Fund provided services to the Fund in addition to trade execution. These services included payments of certain expenses on behalf of the Fund totaling $1,316,221 for the period. In addition, through arrangements with the Fund's custodian and each class' transfer agent, credits realized as a result of uninvested cash balances were used to reduce the Fund's expenses. During the period, these credits reduced the Fund's custody expenses by $10,680. During the period, credits reduced each class' transfer agent expense as noted in the table below.
| Transfer Agent
expense reduction |
Canada | $ 39,451 |
10. Other.
The Fund's organizational documents provide former and current trustees and officers with a limited indemnification against liabilities arising in connection with the performance of their duties to the Fund. In the normal course of business, the Fund may also enter into contracts that provide general indemnifications. The Fund's maximum exposure under these arrangements is unknown as this would be dependent on future claims that may be made against the Fund. The risk of material loss from such claims is considered remote.
In December 2006, the Independent Trustees, with the assistance of independent counsel, completed an investigation regarding gifts, gratuities and business entertainment provided by certain brokers to certain individuals who were employed on FMR's domestic equity trading desk during the period 2002 to 2004. The Independent Trustees and FMR agreed that, despite the absence of proof that the Fidelity mutual funds experienced diminished execution quality as a result of the improper receipt of gifts and business entertainment, the conduct at issue was serious and was worthy of redress. Accordingly, the Independent Trustees requested, and FMR agreed to make, a payment of $42 million plus accrued interest, which equaled approximately $7.3 million, to certain Fidelity mutual funds.
In March 2008, the Trustees approved a method for allocating this payment among the funds and, in total, FMR paid the fund $1,279, which is recorded in the accompanying Statement of Operations.
In a related administrative order dated March 5, 2008, the U.S. Securities and Exchange Commission ("SEC") announced a settlement with FMR and FMR Co., Inc. (an affiliate of FMR) involving the SEC's regulatory rules for investment advisers and the improper receipt of gifts, gratuities and business entertainment. Without admitting or denying the SEC's findings, FMR agreed to pay an $8 million civil penalty to the United States Treasury.
11. Distributions to Shareholders.
Distributions to shareholders of each class were as follows:
Years ended October 31, | 2008 | 2007 |
From net investment income | | |
Class A | $ 171,586 | $ - |
Class T | 73,859 | - |
Class B | 8,835 | - |
Class C | 45,389 | - |
Canada | 28,579,259 | 22,989,617 |
Institutional Class | 37,051 | - |
Total | $ 28,915,979 | $ 22,989,617 |
From net realized gain | | |
Class A | $ 1,361,853 | $ - |
Class T | 736,334 | - |
Class B | 209,359 | - |
Class C | 549,710 | - |
Canada | 231,896,136 | 65,775,827 |
Institutional Class | 269,238 | - |
Total | $ 235,022,630 | $ 65,775,827 |
Annual Report
Canada
Notes to Financial Statements - continued
12. Share Transactions.
Transactions for each class of shares were as follows:
| Shares | Dollars |
Years ended October 31, | 2008 | 2007 A | 2008 | 2007 A |
Class A | | | | |
Shares sold | 1,623,645 | 308,956 | $ 96,358,055 | $ 19,422,841 |
Reinvestment of distributions | 24,107 | - | 1,454,159 | - |
Shares redeemed | (473,393) | (10,905) | (24,545,534) | (645,019) |
Net increase (decrease) | 1,174,359 | 298,051 | $ 73,266,680 | $ 18,777,822 |
Class T | | | | |
Shares sold | 281,102 | 208,648 | $ 16,813,582 | $ 12,838,431 |
Reinvestment of distributions | 13,222 | - | 797,422 | - |
Shares redeemed | (108,759) | (1,454) | (5,550,777) | (89,047) |
Net increase (decrease) | 185,565 | 207,194 | $ 12,060,227 | $ 12,749,384 |
Class B | | | | |
Shares sold | 143,582 | 110,050 | $ 8,590,562 | $ 6,654,427 |
Reinvestment of distributions | 2,917 | - | 175,839 | - |
Shares redeemed | (56,743) | (51,696) | (3,089,676) | (3,069,986) |
Net increase (decrease) | 89,756 | 58,354 | $ 5,676,725 | $ 3,584,441 |
Class C | | | | |
Shares sold | 454,502 | 134,518 | $ 27,139,418 | $ 8,317,609 |
Reinvestment of distributions | 8,472 | - | 509,854 | - |
Shares redeemed | (146,400) | (9,336) | (7,449,898) | (570,425) |
Net increase (decrease) | 316,574 | 125,182 | $ 20,199,374 | $ 7,747,184 |
Canada | | | | |
Shares sold | 34,673,241 | 32,853,429 | $ 2,070,491,480 | $ 1,882,759,894 |
Reinvestment of distributions | 3,970,249 | 1,757,370 | 239,922,156 | 85,654,201 |
Shares redeemed | (35,906,020) | (28,386,777) | (1,927,559,508) | (1,547,811,990) |
Net increase (decrease) | 2,737,470 | 6,224,022 | $ 382,854,128 | $ 420,602,105 |
Institutional Class | | | | |
Shares sold | 377,605 | 61,781 | $ 22,481,855 | $ 3,830,515 |
Reinvestment of distributions | 4,721 | - | 285,066 | - |
Shares redeemed | (208,616) | (3,937) | (9,811,769) | (234,902) |
Net increase (decrease) | 173,710 | 57,844 | $ 12,955,152 | $ 3,595,613 |
A Share transactions for Class A, Class T, Class B, Class C and Institutional Class are for the period May 2, 2007 (commencement of sale of shares) to October 31, 2007.
Annual Report
China Region
Shareholder Expense Example
As a shareholder of the Fund, you incur two types of costs: (1) transaction costs, including sales charges (loads) on purchase payments or redemption proceeds and redemption fees, and (2) ongoing costs, including management fees, distribution and/or service (12b-1) fees and other Fund expenses. This Example is intended to help you understand your ongoing costs (in dollars) of investing in the Fund and to compare these costs with the ongoing costs of investing in other mutual funds.
The actual expense Example is based on an investment of $1,000 invested at the beginning of the period and held for the entire period (May 1, 2008 to October 31, 2008) for China Region and for the entire period (May 9, 2008 to October 31, 2008) for Class A, Class T, Class B, Class C and Institutional Class.
The hypothetical expense Example is based on an investment of $1,000 invested for the one-half year period (May 1, 2008 to October 31, 2008).
Actual Expenses
The first line of the accompanying table for each class of the Fund provides information about actual account values and actual expenses. You may use the information in this line, together with the amount you invested, to estimate the expenses that you paid over the period. Simply divide your account value by $1,000.00 (for example, an $8,600 account value divided by $1,000.00 = 8.6), then multiply the result by the number in the first line for a class of the Fund under the heading entitled "Expenses Paid During Period" to estimate the expenses you paid on your account during this period. A small balance maintenance fee of $12.00 that is charged once a year may apply for certain accounts with a value of less than $2,000. This fee is not included in the table below. If it was, the estimate of expenses you paid during the period would be higher, and your ending account value lower, by this amount. In addition, the Fund, as a shareholder in the underlying Fidelity Central Funds, will indirectly bear its pro rata share of the fees and expenses incurred by the underlying Fidelity Central Funds. These fees and expenses are not included in the Fund's annualized expense ratio used to calculate the expense estimate in the table below.
Hypothetical Example for Comparison Purposes
The second line of the accompanying table for each class of the Fund provides information about hypothetical account values and hypothetical expenses based on a Class' actual expense ratio and an assumed rate of return of 5% per year before expenses, which is not the Class' actual return. The hypothetical account values and expenses may not be used to estimate the actual ending account balance or expenses you paid for the period. You may use this information to compare the ongoing costs of investing in the Fund and other funds. To do so, compare this 5% hypothetical example with the 5% hypothetical examples that appear in the shareholder reports of the other funds. A small balance maintenance fee of $12.00 that is charged once a year may apply for certain accounts with a value of less than $2,000. This fee is not included in the table below. If it was, the estimate of expenses you paid during the period would be higher, and your ending account value lower, by this amount. In addition, the Fund, as a shareholder in the underlying Fidelity Central Funds, will indirectly bear its pro rata share of the fees and expenses incurred by the underlying Fidelity Central Funds. These fees and expenses are not included in the Fund's annualized expense ratio used to calculate the expense estimate in the table below.
Please note that the expenses shown in the table are meant to highlight your ongoing costs only and do not reflect any transaction costs. Therefore, the second line of the table is useful in comparing ongoing costs only, and will not help you determine the relative total costs of owning different funds. In addition, if these transactional costs were included, your costs would have been higher.
| Annualized Expense Ratio | Beginning
Account Value | Ending
Account Value
October 31, 2008 | Expenses Paid
During Period |
Class A | 1.44% | | | |
Actual | | $ 1,000.00 | $ 569.30 | $ 5.43 B |
HypotheticalA | | $ 1,000.00 | $ 1,017.90 | $ 7.30 C |
Class T | 1.68% | | | |
Actual | | $ 1,000.00 | $ 568.60 | $ 6.34 B |
HypotheticalA | | $ 1,000.00 | $ 1,016.69 | $ 8.52 C |
Class B | 2.17% | | | |
Actual | | $ 1,000.00 | $ 567.30 | $ 8.18 B |
HypotheticalA | | $ 1,000.00 | $ 1,014.23 | $ 10.99 C |
Class C | 2.13% | | | |
Actual | | $ 1,000.00 | $ 567.30 | $ 8.03 B |
HypotheticalA | | $ 1,000.00 | $ 1,014.43 | $ 10.79 C |
China Region | 1.12% | | | |
Actual | | $ 1,000.00 | $ 569.20 | $ 4.42 B |
HypotheticalA | | $ 1,000.00 | $ 1,019.51 | $ 5.69 C |
Institutional Class | 1.06% | | | |
Actual | | $ 1,000.00 | $ 570.40 | $ 4.00 B |
HypotheticalA | | $ 1,000.00 | $ 1,019.81 | $ 5.38 C |
A 5% return per year before expenses
B Actual expenses are equal to each Class' annualized expense ratio, multiplied by the average account value over the period, multiplied by 184/366 (to reflect the one-half year period) for China Region and multiplied by 176/366 (to reflect the period May 9, 2008 to October 31, 2008) for Class A, Class T, Class B, Class C and Institutional Class.
C Hypothetical expenses are equal to each Class' annualized expense ratio; multiplied by the average account value over the period, multiplied by 184/366 (to reflect the one-half year period).
Annual Report
China Region
Performance: The Bottom Line
Average annual total return reflects the change in the value of an investment, assuming reinvestment of the class' dividend income and capital gains (the profits earned upon the sale of securities that have grown in value, if any) and assuming a constant rate of performance each year. The $10,000 table and the fund's returns do not reflect the deduction of taxes that a shareholder would pay on fund distributions or the redemption of fund shares. During periods of reimbursement by Fidelity, a fund's total returns will be greater than it would be had the reimbursement not occurred. How a fund did yesterday is no guarantee of how it will do tomorrow.
Average Annual Total Returns
Periods ended October 31, 2008 | Past 1
year | Past 5
years | Past 10
years |
China Region | -53.75% | 6.24% | 8.32% |
Prior to September 1, 2000, China Region operated under certain different investment policies. The fund's historical performance may not represent its current investment policies.
$10,000 Over 10 Years
Let's say hypothetically that $10,000 was invested in China Region, a class of the fund, on October 31, 1998. The chart shows how the value of your investment would have changed, and also shows how the MSCI Golden Dragon Index performed over the same period.
Annual Report
China Region
Management's Discussion of Fund Performance
Comments from Wilson Wong, Portfolio Manager of Fidelity® China Region Fund
In a dramatic reversal of what had been a multiyear global growth story, international stocks fell hard during the 12 months ending October 31, 2008, especially so during the latter stages of the period and mostly as a result of fallout from the financial crisis that emanated from the United States. The viral spread of this financial contagion - which began in the U.S. subprime mortgage market, then seized up the credit markets, hobbled major financial institutions and eventually slowed economic growth worldwide - left virtually no corner of the globe untouched. Developed international equity markets - as gauged by the MSCI® Europe, Australasia, Far East (EAFE®) Index, which monitors established markets outside the U.S. and Canada - fell 46.54%, while the Standard & Poor's 500SM Index, a measure of U.S. stocks, dropped 36.10%. Among countries constituting at least 1% of the EAFE index, Switzerland had the "least worst" showing, falling roughly 32%, followed by Japan, where stocks slid by around 37%. The weakest overall performance came from Belgium, where stocks slipped by nearly 70%. In the United Kingdom, the largest component of the index, equities were down almost 48%. Emerging markets were the weakest performers among the global economies, declining 56.22% as measured by the MSCI Emerging Markets Index.
During the past year, the fund's Retail Class shares returned -53.75%, topping the -58.03% return of the MSCI Golden Dragon Index. Favorable stock selection in China and Australia aided the fund's results relative to the index, although the fund had no exposure to Australia at period end. On a sector basis, performance was boosted by stock picking in materials and energy, along with an underweighting in the weak-performing industrials group. A modest cash position also was beneficial. At the stock level, Chunghwa Telecom, Taiwan's largest integrated telecommunication services provider, was the fund's biggest contributor. The firm's large cash surplus and evidence of effective cost controls proved attractive amid the severe volatility in stock prices. Other contributors were Tencent Holdings, a Chinese provider of online instant messaging services; Hang Seng Bank, a domestic bank in Hong Kong; and Taiwan Fertilizer, which I sold. Conversely, underweighting Taiwan detracted due to that country's relatively strong results. Further, stock selection and industry positioning within financials worked against fund performance. Yuanta Financial Holding, a diversified financial company based in Taiwan, eroded returns. Disappointment related to opportunities for the company that were expected to emerge from the potential easing of curbs on investment in China sidetracked the stock. Other detractors included an out-of-index stake in Focus Media Holding, a digital display and advertising firm, and Anhui Conch Cement, both based in China. All three detractors were sold off by period end.
Note to shareholders: Fidelity China Region Fund may invest up to 35% of its total assets in any industry that represents more than 20% of the Hong Kong, Taiwanese and Chinese market. As of October 31, 2008, the fund did not have more than 25% of its total assets invested in any one industry.
The views expressed above reflect those of the portfolio manager(s) only through the end of the period as stated on the cover of this report and do not necessarily represent the views of Fidelity or any other person in the Fidelity organization. Any such views are subject to change at any time based upon market or other conditions and Fidelity disclaims any responsibility to update such views. These views may not be relied on as investment advice and, because investment decisions for a Fidelity fund are based on numerous factors, may not be relied on as an indication of trading intent on behalf of any Fidelity fund.
Annual Report
China Region
Investment Changes (Unaudited)
Geographic Diversification (% of fund's net assets) |
As of October 31, 2008 |
| Hong Kong | 37.0% | |
| Taiwan | 29.4% | |
| China | 24.1% | |
| United States of America | 7.9% | |
| Cayman Islands | 1.4% | |
 | Indonesia | 0.2% | |
| Bermuda | 0.0% | |

Percentages are adjusted for the effect of futures contracts, if applicable. |
|
As of April 30, 2008 |
| Hong Kong | 31.9% | |
| Taiwan | 26.8% | |
| China | 21.2% | |
| Australia | 6.5% | |
| United States of America | 5.3% | |
| Indonesia | 3.0% | |
| Cayman Islands | 3.1% | |
| Bermuda | 1.3% | |
| Papua New Guinea | 0.4% | |
| Other | 0.5% | |

Percentages are adjusted for the effect of futures contracts, if applicable. |
Asset Allocation |
| % of fund's
net assets | % of fund's net assets
6 months ago |
Stocks | 92.1 | 95.1 |
Short-Term Investments and Net Other Assets | 7.9 | 4.9 |
Top Ten Stocks as of October 31, 2008 |
| % of fund's
net assets | % of fund's net assets
6 months ago |
Taiwan Semiconductor Manufacturing Co. Ltd. (Semiconductors & Semiconductor Equipment) | 9.8 | 0.0 |
China Mobile (Hong Kong) Ltd. (Wireless Telecommunication Services) | 8.6 | 9.9 |
Chunghwa Telecom Co. Ltd. (Diversified Telecommunication Services) | 7.1 | 3.5 |
Industrial & Commercial Bank of China (Commercial Banks) | 5.0 | 1.1 |
CLP Holdings Ltd. (Electric Utilities) | 4.6 | 1.7 |
China Life Insurance Co. Ltd. (H Shares) (Insurance) | 3.5 | 2.2 |
Cheung Kong Holdings Ltd. (Real Estate Management & Development) | 3.2 | 1.5 |
PetroChina Co. Ltd. (H Shares) (Oil, Gas & Consumable Fuels) | 2.9 | 1.2 |
Hutchison Whampoa Ltd. (Industrial Conglomerates) | 2.9 | 1.4 |
China Construction Bank Corp. (H Shares) (Commercial Banks) | 2.6 | 0.9 |
| 50.2 | |
Market Sectors as of October 31, 2008 |
| % of fund's
net assets | % of fund's net assets
6 months ago |
Financials | 27.7 | 23.1 |
Information Technology | 21.1 | 7.9 |
Telecommunication Services | 17.6 | 15.8 |
Energy | 8.5 | 9.8 |
Utilities | 8.0 | 3.0 |
Industrials | 3.6 | 3.0 |
Materials | 2.2 | 18.7 |
Consumer Discretionary | 1.9 | 12.0 |
Consumer Staples | 1.5 | 1.0 |
Annual Report
China Region
Investments October 31, 2008
Showing Percentage of Net Assets
Common Stocks - 92.1% |
| Shares | | Value |
CONSUMER DISCRETIONARY - 1.9% |
Distributors - 0.1% |
Li & Fung Ltd. | 196,000 | | $ 393,373 |
Diversified Consumer Services - 1.4% |
New Oriental Education & Technology Group, Inc. sponsored ADR (a) | 161,100 | | 10,302,345 |
Media - 0.4% |
Television Broadcasts Ltd. | 1,074,000 | | 2,986,824 |
Textiles, Apparel & Luxury Goods - 0.0% |
Ports Design Ltd. | 188,500 | | 219,146 |
TOTAL CONSUMER DISCRETIONARY | | 13,901,688 |
CONSUMER STAPLES - 1.5% |
Beverages - 1.1% |
Yantai Changyu Pioneer Wine Co. (B Shares) | 2,556,463 | | 7,944,154 |
Food & Staples Retailing - 0.4% |
Dairy Farm International Holdings Ltd. | 765,900 | | 3,138,297 |
TOTAL CONSUMER STAPLES | | 11,082,451 |
ENERGY - 8.5% |
Oil, Gas & Consumable Fuels - 8.5% |
China Petroleum & Chemical Corp. (H Shares) | 27,432,000 | | 18,013,552 |
China Shenhua Energy Co. Ltd. (H Shares) | 3,701,000 | | 7,026,601 |
CNOOC Ltd. | 18,229,000 | | 14,967,366 |
PetroChina Co. Ltd. (H Shares) | 28,744,000 | | 21,612,223 |
PT Bumi Resources Tbk | 12,829,500 | | 1,679,722 |
| | 63,299,464 |
FINANCIALS - 27.7% |
Commercial Banks - 9.6% |
China Construction Bank Corp. (H Shares) | 38,621,000 | | 19,158,951 |
China Merchants Bank Co. Ltd. (H Shares) | 1,983,000 | | 3,038,031 |
Hang Seng Bank Ltd. | 872,700 | | 10,889,031 |
Industrial & Commercial Bank of China (d) | 78,601,000 | | 36,983,144 |
Industrial & Commercial Bank of China (Asia) Ltd. | 934,000 | | 984,197 |
| | 71,053,354 |
Diversified Financial Services - 1.8% |
China Everbright Ltd. | 824,000 | | 773,681 |
Hong Kong Exchanges & Clearing Ltd. | 1,200,200 | | 12,170,932 |
| | 12,944,613 |
Insurance - 5.8% |
Cathay Financial Holding Co. Ltd. | 7,622,100 | | 8,145,491 |
|
| Shares | | Value |
China Life Insurance Co. Ltd. (H Shares) | 9,767,000 | | $ 26,101,108 |
Ping An Insurance (Group) Co. of China, Ltd. (H Shares) | 2,071,500 | | 8,859,181 |
| | 43,105,780 |
Real Estate Investment Trusts - 1.7% |
Link (REIT) | 7,225,000 | | 12,918,331 |
Real Estate Management & Development - 8.8% |
Cheung Kong Holdings Ltd. | 2,425,000 | | 23,283,548 |
China Overseas Land & Investment Ltd. | 11,176,000 | | 12,620,615 |
China Resources Land Ltd. | 1,194,000 | | 1,208,613 |
Hang Lung Properties Ltd. | 3,724,000 | | 9,099,513 |
Hopewell Holdings Ltd. | 1,188,000 | | 3,693,568 |
Hysan Development Co. Ltd. | 636,000 | | 997,280 |
Sinyi Realty, Inc. | 4,713,066 | | 5,215,307 |
Sun Hung Kai Properties Ltd. | 1,043,000 | | 9,137,772 |
| | 65,256,216 |
TOTAL FINANCIALS | | 205,278,294 |
INDUSTRIALS - 3.6% |
Construction & Engineering - 0.4% |
China Railway Construction Corp.
(H Shares) | 2,063,500 | | 2,549,104 |
Electrical Equipment - 0.2% |
BYD Co. Ltd. (H Shares) | 609,800 | | 1,036,428 |
Industrial Conglomerates - 2.9% |
Hutchison Whampoa Ltd. | 4,029,000 | | 21,514,860 |
Marine - 0.0% |
China Cosco Holdings Co. Ltd. (H Shares) | 347,500 | | 187,203 |
Transportation Infrastructure - 0.1% |
Cosco Pacific Ltd. | 1,390,000 | | 1,012,217 |
TOTAL INDUSTRIALS | | 26,299,812 |
INFORMATION TECHNOLOGY - 21.1% |
Computers & Peripherals - 2.7% |
Acer, Inc. | 2,966,000 | | 3,862,049 |
HTC Corp. | 944,000 | | 11,261,604 |
Wistron Corp. | 5,800,361 | | 4,633,607 |
| | 19,757,260 |
Electronic Equipment & Components - 3.5% |
AU Optronics Corp. | 11,903,000 | | 8,209,588 |
Hon Hai Precision Industry Co. Ltd. (Foxconn) | 7,297,674 | | 17,699,376 |
| | 25,908,964 |
Internet Software & Services - 3.0% |
Baidu.com, Inc. sponsored ADR (a)(d) | 18,400 | | 3,790,400 |
Tencent Holdings Ltd. | 2,520,600 | | 18,349,744 |
| | 22,140,144 |
Common Stocks - continued |
| Shares | | Value |
INFORMATION TECHNOLOGY - continued |
Semiconductors & Semiconductor Equipment - 11.9% |
Advanced Semiconductor Engineering, Inc. | 5,268,000 | | $ 2,243,008 |
ASM Pacific Technology Ltd. | 403,800 | | 1,349,061 |
MediaTek, Inc. | 1,057,000 | | 9,485,281 |
Siliconware Precision Industries Co. Ltd. | 2,553,000 | | 2,623,820 |
Taiwan Semiconductor Manufacturing Co. Ltd. | 49,955,443 | | 72,695,507 |
| | 88,396,677 |
TOTAL INFORMATION TECHNOLOGY | | 156,203,045 |
MATERIALS - 2.2% |
Chemicals - 2.2% |
Formosa Plastics Corp. | 4,867,000 | | 8,203,887 |
Nan Ya Plastics Corp. | 5,925,000 | | 8,262,847 |
| | 16,466,734 |
TELECOMMUNICATION SERVICES - 17.6% |
Diversified Telecommunication Services - 8.6% |
China Unicom (Hong Kong) Ltd. | 6,776,000 | | 9,674,060 |
Chunghwa Telecom Co. Ltd. | 29,533,680 | | 48,707,965 |
Chunghwa Telecom Co. Ltd. ADR | 229,203 | | 3,772,681 |
PCCW Ltd. | 4,537,000 | | 1,697,694 |
| | 63,852,400 |
Wireless Telecommunication Services - 9.0% |
China Mobile (Hong Kong) Ltd. | 7,257,000 | | 63,885,256 |
Taiwan Mobile Co. Ltd. | 2,102,000 | | 2,912,275 |
| | 66,797,531 |
TOTAL TELECOMMUNICATION SERVICES | | 130,649,931 |
UTILITIES - 8.0% |
Electric Utilities - 6.8% |
CLP Holdings Ltd. | 5,060,000 | | 34,124,265 |
Hong Kong Electric Holdings Ltd. | 3,022,000 | | 16,288,126 |
| | 50,412,391 |
|
| Shares | | Value |
Independent Power Producers & Energy Traders - 1.2% |
China Resources Power Holdings Co. Ltd. | 3,686,000 | | $ 7,203,713 |
Datang International Power Generation Co. Ltd. | 4,136,000 | | 1,557,700 |
| | 8,761,413 |
TOTAL UTILITIES | | 59,173,804 |
TOTAL COMMON STOCKS (Cost $955,883,902) | 682,355,223 |
Money Market Funds - 9.9% |
| | | |
Fidelity Cash Central Fund, 1.81% (b) | 58,337,954 | | 58,337,954 |
Fidelity Securities Lending Cash Central Fund, 2.67% (b)(c) | 15,487,600 | | 15,487,600 |
TOTAL MONEY MARKET FUNDS (Cost $73,825,554) | 73,825,554 |
TOTAL INVESTMENT
PORTFOLIO - 102.0% (Cost $1,029,709,456) | | 756,180,777 |
NET OTHER ASSETS - (2.0)% | | (14,997,555) |
NET ASSETS - 100% | $ 741,183,222 |
Legend |
(a) Non-income producing |
(b) Affiliated fund that is available only to investment companies and other accounts managed by Fidelity Investments. The rate quoted is the annualized seven-day yield of the fund at period end. A complete unaudited listing of the fund's holdings as of its most recent quarter end is available upon request. |
(c) Investment made with cash collateral received from securities on loan. |
(d) Security or a portion of the security is on loan at period end. |
Affiliated Central Funds |
Information regarding fiscal year to date income earned by the Fund from investments in Fidelity Central Funds is as follows: |
Fund | Income earned |
Fidelity Cash Central Fund | $ 1,865,355 |
Fidelity Securities Lending Cash Central Fund | 268,379 |
Total | $ 2,133,734 |
Income Tax Information |
At October 31, 2008, the fund had a capital loss carryforward of approximately $148,402,224 all of which will expire on October 31, 2016. |
See accompanying notes which are an integral part of the financial statements.
Annual Report
China Region
Financial Statements
Statement of Assets and Liabilities
| October 31, 2008 |
| | |
Assets | | |
Investment in securities, at value (including securities loaned of $14,710,225) -
See accompanying schedule: Unaffiliated issuers
(cost $955,883,902) | $ 682,355,223 | |
Fidelity Central Funds
(cost $73,825,554) | 73,825,554 | |
Total Investments
(cost $1,029,709,456) | | $ 756,180,777 |
Foreign currency held at value
(cost $5,191) | | 5,191 |
Receivable for investments sold | | 3,216,321 |
Receivable for fund shares sold | | 1,570,428 |
Dividends receivable | | 2,916,194 |
Distributions receivable from Fidelity Central Funds | | 90,277 |
Prepaid expenses | | 463 |
Other receivables | | 393,529 |
Total assets | | 764,373,180 |
| | |
Liabilities | | |
Payable for investments purchased | $ 6,096,956 | |
Payable for fund shares redeemed | 623,679 | |
Accrued management fee | 460,443 | |
Distribution fees payable | 429 | |
Other affiliated payables | 279,944 | |
Other payables and accrued expenses | 240,907 | |
Collateral on securities loaned, at value | 15,487,600 | |
Total liabilities | | 23,189,958 |
| | |
Net Assets | | $ 741,183,222 |
Net Assets consist of: | | |
Paid in capital | | $ 1,162,196,359 |
Undistributed net investment income | | 6,027,366 |
Accumulated undistributed net realized gain (loss) on investments and foreign currency transactions | | (153,478,093) |
Net unrealized appreciation (depreciation) on investments and assets and liabilities in foreign currencies | | (273,562,410) |
Net Assets | | $ 741,183,222 |
Statement of Assets and Liabilities - continued
| October 31, 2008 |
| | |
Calculation of Maximum Offering Price Class A:
Net Asset Value and redemption
price per share ($340,222 ÷ 20,412 shares) | | $ 16.67 |
| | |
Maximum offering price per share (100/94.25 of $16.67) | | $ 17.69 |
Class T:
Net Asset Value and redemption
price per share ($107,102 ÷ 6,433 shares) | | $ 16.65 |
| | |
Maximum offering price per share (100/96.50 of $16.65) | | $ 17.25 |
Class B:
Net Asset Value and offering
price per share ($154,625 ÷ 9,310 shares)A | | $ 16.61 |
| | |
Class C:
Net Asset Value and offering
price per share ($232,824 ÷ 14,016 shares)A | | $ 16.61 |
| | |
China Region:
Net Asset Value, offering
price and redemption price per share ($740,288,870 ÷ 44,356,661 shares) | | $ 16.69 |
| | |
Institutional Class:
Net Asset Value, offering price and redemption price per share ($59,579 ÷ 3,568 shares) | | $ 16.70 |
A Redemption price per share is equal to net asset value less any applicable contingent deferred sales charge.
See accompanying notes which are an integral part of the financial statements.
Annual Report
Statement of Operations
| Year ended October 31, 2008 |
| | |
Investment Income | | |
Dividends | | $ 34,759,063 |
Interest | | 4,164 |
Income from Fidelity Central Funds (including $268,379 from security lending) | | 2,133,734 |
| | 36,896,961 |
Less foreign taxes withheld | | (3,209,864) |
Total income | | 33,687,097 |
| | |
Expenses | | |
Management fee | $ 9,927,896 | |
Transfer agent fees | 3,515,043 | |
Distribution fees | 1,942 | |
Accounting and security lending fees | 641,000 | |
Custodian fees and expenses | 985,602 | |
Independent trustees' compensation | 6,327 | |
Registration fees | 159,248 | |
Audit | 65,400 | |
Legal | 7,178 | |
Interest | 8,739 | |
Miscellaneous | 204,566 | |
Total expenses before reductions | 15,522,941 | |
Expense reductions | (2,068,258) | 13,454,683 |
Net investment income (loss) | | 20,232,414 |
Realized and Unrealized Gain (Loss) Net realized gain (loss) on: | | |
Investment securities: | | |
Unaffiliated issuers | (149,991,373) | |
Foreign currency transactions | (1,835,509) | |
Total net realized gain (loss) | | (151,826,882) |
Change in net unrealized appreciation (depreciation) on: Investment securities | (900,514,910) | |
Assets and liabilities in foreign currencies | (52,493) | |
Total change in net unrealized appreciation (depreciation) | | (900,567,403) |
Net gain (loss) | | (1,052,394,285) |
Net increase (decrease) in net assets resulting from operations | | $ (1,032,161,871) |
Statement of Changes in Net Assets
| Year ended
October 31,
2008 | Year ended
October 31,
2007 |
Increase (Decrease) in Net Assets | | |
Operations | | |
Net investment income (loss) | $ 20,232,414 | $ 17,487,006 |
Net realized gain (loss) | (151,826,882) | 248,422,709 |
Change in net unrealized appreciation (depreciation) | (900,567,403) | 471,226,907 |
Net increase (decrease) in net assets resulting from operations | (1,032,161,871) | 737,136,622 |
Distributions to shareholders from net investment income | (15,794,709) | (9,931,797) |
Distributions to shareholders from net realized gain | (223,593,729) | (6,849,518) |
Total distributions | (239,388,438) | (16,781,315) |
Share transactions - net increase (decrease) | (34,409,565) | 588,174,307 |
Redemption fees | 2,616,118 | 1,203,951 |
Total increase (decrease) in net assets | (1,303,343,756) | 1,309,733,565 |
| | |
Net Assets | | |
Beginning of period | 2,044,526,978 | 734,793,413 |
End of period (including undistributed net investment income of $6,027,366 and undistributed net investment income of $16,429,698, respectively) | $ 741,183,222 | $ 2,044,526,978 |
See accompanying notes which are an integral part of the financial statements.
Annual Report
Financial Highlights - Class A
Year ended October 31, | 2008 H |
Selected Per-Share Data | |
Net asset value, beginning of period | $ 29.28 |
Income from Investment Operations | |
Net investment income (loss)E | .28 |
Net realized and unrealized gain (loss) | (12.91) |
Total from investment operations | (12.63) |
Redemption fees added to paid in capitalE | .02 |
Net asset value, end of period | $ 16.67 |
Total ReturnB, C, D | (43.07)% |
Ratios to Average Net AssetsF, I | |
Expenses before reductions | 1.44%A |
Expenses net of fee waivers, if any | 1.44%A |
Expenses net of all reductions | 1.30%A |
Net investment income (loss) | 2.63%A |
Supplemental Data | |
Net assets, end of period (000 omitted) | $ 340 |
Portfolio turnover rateG | 133% |
A Annualized B Total returns for periods of less than one year are not annualized. C Total returns would have been lower had certain expenses not been reduced during the periods shown. D Total returns do not include the effect of the sales charges. E Calculated based on average shares outstanding during the period. F Fees and expenses of the underlying Fidelity Central Funds are not included in the Fund's expense ratio. The Fund indirectly bears its proportionate share of the expenses of any underlying Fidelity Central Funds. G Amount does not include the portfolio activity of any underlying Fidelity Central Funds. H For the period May 9, 2008 (commencement of sale of shares) to October 31, 2008. I Expense ratios reflect operating expenses of the class. Expenses before reductions do not reflect amounts reimbursed by the investment adviser or reductions from brokerage service arrangements or other expense offset arrangements and do not represent the amount paid by the class during periods when reimbursements or reductions occur. Expense ratios before reductions for start-up periods may not be representative of longer-term operating periods. Expenses net of fee waivers reflect expenses after reimbursement by the investment adviser but prior to reductions from brokerage service arrangements or other expense offset arrangements. Expenses net of all reductions represent the net expenses paid by the class. |
Financial Highlights - Class T
Year ended October 31, | 2008 H |
Selected Per-Share Data | |
Net asset value, beginning of period | $ 29.28 |
Income from Investment Operations | |
Net investment income (loss)E | .26 |
Net realized and unrealized gain (loss) | (12.91) |
Total from investment operations | (12.65) |
Redemption fees added to paid in capital E | .02 |
Net asset value, end of period | $ 16.65 |
Total ReturnB, C, D | (43.14)% |
Ratios to Average Net AssetsF, I | |
Expenses before reductions | 1.68%A |
Expenses net of fee waivers, if any | 1.68%A |
Expenses net of all reductions | 1.53%A |
Net investment income (loss) | 2.40%A |
Supplemental Data | |
Net assets, end of period (000 omitted) | $ 107 |
Portfolio turnover rateG | 133% |
A Annualized B Total returns for periods of less than one year are not annualized. C Total returns would have been lower had certain expenses not been reduced during the periods shown. D Total returns do not include the effect of the sales charges. E Calculated based on average shares outstanding during the period. F Fees and expenses of the underlying Fidelity Central Funds are not included in the Fund's expense ratio. The Fund indirectly bears its proportionate share of the expenses of any underlying Fidelity Central Funds. G Amount does not include the portfolio activity of any underlying Fidelity Central Funds. H For the period May 9, 2008 (commencement of sale of shares) to October 31, 2008. I Expense ratios reflect operating expenses of the class. Expenses before reductions do not reflect amounts reimbursed by the investment adviser or reductions from brokerage service arrangements or other expense offset arrangements and do not represent the amount paid by the class during periods when reimbursements or reductions occur. Expense ratios before reductions for start-up periods may not be representative of longer-term operating periods. Expenses net of fee waivers reflect expenses after reimbursement by the investment adviser but prior to reductions from brokerage service arrangements or other expense offset arrangements. Expenses net of all reductions represent the net expenses paid by the class. |
See accompanying notes which are an integral part of the financial statements.
Annual Report
Financial Highlights - Class B
Year ended October 31, | 2008 H |
Selected Per-Share Data | |
Net asset value, beginning of period | $ 29.28 |
Income from Investment Operations | |
Net investment income (loss)E | .20 |
Net realized and unrealized gain (loss) | (12.89) |
Total from investment operations | (12.69) |
Redemption fees added to paid in capitalE | .02 |
Net asset value, end of period | $ 16.61 |
Total ReturnB, C, D | (43.27)% |
Ratios to Average Net AssetsF, I | |
Expenses before reductions | 2.17% A |
Expenses net of fee waivers, if any | 2.17% A |
Expenses net of all reductions | 2.02% A |
Net investment income (loss) | 1.91% A |
Supplemental Data | |
Net assets, end of period (000 omitted) | $ 155 |
Portfolio turnover rate G | 133% |
A Annualized B Total returns for periods of less than one year are not annualized. C Total returns would have been lower had certain expenses not been reduced during the periods shown. D Total returns do not include the effect of the contingent deferred sales charge. E Calculated based on average shares outstanding during the period. F Fees and expenses of the underlying Fidelity Central Funds are not included in the Fund's expense ratio. The Fund indirectly bears its proportionate share of the expenses of any underlying Fidelity Central Funds. G Amount does not include the portfolio activity of any underlying Fidelity Central Funds. H For the period May 9, 2008 (commencement of sale of shares) to October 31, 2008. I Expense ratios reflect operating expenses of the class. Expenses before reductions do not reflect amounts reimbursed by the investment adviser or reductions from brokerage service arrangements or other expense offset arrangements and do not represent the amount paid by the class during periods when reimbursements or reductions occur. Expense ratios before reductions for start-up periods may not be representative of longer-term operating periods. Expenses net of fee waivers reflect expenses after reimbursement by the investment adviser but prior to reductions from brokerage service arrangements or other expense offset arrangements. Expenses net of all reductions represent the net expenses paid by the class. |
Financial Highlights - Class C
Year ended October 31, | 2008 H |
Selected Per-Share Data | |
Net asset value, beginning of period | $ 29.28 |
Income from Investment Operations | |
Net investment income (loss) E | .20 |
Net realized and unrealized gain (loss) | (12.89) |
Total from investment operations | (12.69) |
Redemption fees added to paid in capital E | .02 |
Net asset value, end of period | $ 16.61 |
Total ReturnB, C, D | (43.27)% |
Ratios to Average Net AssetsF, I | |
Expenses before reductions | 2.13%A |
Expenses net of fee waivers, if any | 2.13%A |
Expenses net of all reductions | 1.98%A |
Net investment income (loss) | 1.95%A |
Supplemental Data | |
Net assets, end of period (000 omitted) | $ 233 |
Portfolio turnover rateG | 133% |
A Annualized B Total returns for periods of less than one year are not annualized. C Total returns would have been lower had certain expenses not been reduced during the periods shown. D Total returns do not include the effect of the contingent deferred sales charge. E Calculated based on average shares outstanding during the period. F Fees and expenses of the underlying Fidelity Central Funds are not included in the Fund's expense ratio. The Fund indirectly bears its proportionate share of the expenses of any underlying Fidelity Central Funds. G Amount does not include the portfolio activity of any underlying Fidelity Central Funds. H For the period May 9, 2008 (commencement of sale of shares) to October 31, 2008. I Expense ratios reflect operating expenses of the class. Expenses before reductions do not reflect amounts reimbursed by the investment adviser or reductions from brokerage service arrangements or other expense offset arrangements and do not represent the amount paid by the class during periods when reimbursements or reductions occur. Expense ratios before reductions for start-up periods may not be representative of longer-term operating periods. Expenses net of fee waivers reflect expenses after reimbursement by the investment adviser but prior to reductions from brokerage service arrangements or other expense offset arrangements. Expenses net of all reductions represent the net expenses paid by the class. |
See accompanying notes which are an integral part of the financial statements.
Annual Report
Financial Highlights - China Region
Years ended October 31, | 2008 | 2007 | 2006 | 2005 | 2004 |
Selected Per-Share Data | | | | | |
Net asset value, beginning of period | $ 41.52 | $ 22.94 | $ 17.74 | $ 15.88 | $ 15.14 |
Income from Investment Operations | | | | | |
Net investment income (loss) B | .39 | .46 | .42 | .36 | .25 |
Net realized and unrealized gain (loss) | (20.42) | 18.58 | 4.99 | 1.75 | .73 |
Total from investment operations | (20.03) | 19.04 | 5.41 | 2.11 | .98 |
Distributions from net investment income | (.32) | (.29) | (.22) | (.26) | (.26) |
Distributions from net realized gain | (4.53) | (.20) | - | - | - |
Total distributions | (4.85) | (.49) | (.22) | (.26) | (.26) |
Redemption fees added to paid in capitalB | .05 | .03 | .01 | .01 | .02 |
Net asset value, end of period | $ 16.69 | $ 41.52 | $ 22.94 | $ 17.74 | $ 15.88 |
Total ReturnA | (53.75)% | 84.73% | 30.83% | 13.44% | 6.71% |
Ratios to Average Net AssetsC, E | | | | | |
Expenses before reductions | 1.11% | 1.08% | 1.14% | 1.16% | 1.22% |
Expenses net of fee waivers, if any | 1.11% | 1.08% | 1.14% | 1.16% | 1.22% |
Expenses net of all reductions | .96% | .92% | 1.08% | 1.12% | 1.22% |
Net investment income (loss) | 1.45% | 1.64% | 1.99% | 2.04% | 1.64% |
Supplemental Data | | | | | |
Net assets, end of period (000 omitted) | $ 740,289 | $ 2,044,527 | $ 734,793 | $ 396,905 | $ 296,004 |
Portfolio turnover rateD | 133% | 173% | 36% | 44% | 101% |
A Total returns would have been lower had certain expenses not been reduced during the periods shown. B Calculated based on average shares outstanding during the period. C Fees and expenses of the underlying Fidelity Central Funds are not included in the Fund's expense ratio. The Fund indirectly bears its proportionate share of the expenses of any underlying Fidelity Central Funds. D Amount does not include the portfolio activity of any underlying Fidelity Central Funds. E Expense ratios reflect operating expenses of the class. Expenses before reductions do not reflect amounts reimbursed by the investment adviser or reductions from brokerage service arrangements or other expense offset arrangements and do not represent the amount paid by the class during periods when reimbursements or reductions occur. Expenses net of fee waivers reflect expenses after reimbursement by the investment adviser but prior to reductions from brokerage service arrangements or other expense offset arrangements. Expenses net of all reductions represent the net expenses paid by the class. |
Financial Highlights - Institutional Class
Year ended October 31, | 2008 G |
Selected Per-Share Data | |
Net asset value, beginning of period | $ 29.28 |
Income from Investment Operations | |
Net investment income (loss)D | .34 |
Net realized and unrealized gain (loss) | (12.94) |
Total from investment operations | (12.60) |
Redemption fees added to paid in capitalD | .02 |
Net asset value, end of period | $ 16.70 |
Total ReturnB, C | (42.96)% |
Ratios to Average Net AssetsE, H | |
Expenses before reductions | 1.05%A |
Expenses net of fee waivers, if any | 1.05%A |
Expenses net of all reductions | .91%A |
Net investment income (loss) | 3.02%A |
Supplemental Data | |
Net assets, end of period (000 omitted) | $ 60 |
Portfolio turnover rateF | 133% |
A Annualized B Total returns for periods of less than one year are not annualized. C Total returns would have been lower had certain expenses not been reduced during the periods shown. D Calculated based on average shares outstanding during the period. E Fees and expenses of the underlying Fidelity Central Funds are not included in the Fund's expense ratio. The Fund indirectly bears its proportionate share of the expenses of any underlying Fidelity Central Funds. F Amount does not include the portfolio activity of any underlying Fidelity Central Funds. G For the period May 9, 2008 (commencement of sale of shares) to October 31, 2008. H Expense ratios reflect operating expenses of the class. Expenses before reductions do not reflect amounts reimbursed by the investment adviser or reductions from brokerage service arrangements or other expense offset arrangements and do not represent the amount paid by the class during periods when reimbursements or reductions occur. Expense ratios before reductions for start-up periods may not be representative of longer-term operating periods. Expenses net of fee waivers reflect expenses after reimbursement by the investment adviser but prior to reductions from brokerage service arrangements or other expense offset arrangements. Expenses net of all reductions represent the net expenses paid by the class. |
See accompanying notes which are an integral part of the financial statements.
Annual Report
China Region
Notes to Financial Statements
For the period ended October 31, 2008
1. Organization.
Fidelity China Region Fund (the Fund) is a fund of Fidelity Investment Trust (the trust) and is authorized to issue an unlimited number of shares. The trust is registered under the Investment Company Act of 1940, as amended (the 1940 Act), as an open-end management investment company organized as a Massachusetts business trust. The Fund commenced sale of Class A, Class T, Class B, Class C, and Institutional Class shares and the existing class was designated China Region on May 9, 2008. Class B shares will automatically convert to Class A shares after a holding period of seven years from the initial date of purchase. Investment income, realized and unrealized capital gains and losses, the common expenses of the Fund, and certain fund-level expense reductions, if any, are allocated on a pro rata basis to each class based on the relative net assets of each class to the total net assets of the Fund. Each class differs with respect to transfer agent and distribution and service plan fees incurred. Certain expense reductions also differ by class. The Fund's investments in emerging markets can be subject to social, economic, regulatory, and political uncertainties and can be extremely volatile.
2. Investments in Fidelity Central Funds.
The Fund may invest in Fidelity Central Funds, which are open-end investment companies available only to other investment companies and accounts managed by Fidelity Management & Research Company (FMR) and its affiliates. The Fund's Schedule of Investments lists each of the Fidelity Central Funds held as of period end, if any, as an investment of the Fund, but does not include the underlying holdings of each Fidelity Central Fund. As an Investing Fund, the Fund indirectly bears its proportionate share of the expenses of the underlying Fidelity Central Funds.
The Money Market Central Funds seek preservation of capital and current income and are managed by Fidelity Investments Money Management, Inc. (FIMM), an affiliate of FMR.
A complete unaudited list of holdings for each Fidelity Central Fund is available upon request or at the SEC's web site at www.sec.gov. In addition, the financial statements of the Fidelity Central Funds, which are not covered by the Fund's Report of Independent Registered Public Accounting Firm, are available on the SEC's web site or upon request.
3. Significant Accounting Policies.
The financial statements have been prepared in conformity with accounting principles generally accepted in the United States of America, which require management to make certain estimates and assumptions at the date of the financial statements. Actual results could differ from those estimates. The following summarizes the significant accounting policies of the Fund:
Security Valuation. Investments are valued as of 4:00 p.m. Eastern time on the last calendar day of the period. Wherever possible, the Fund uses independent pricing services approved by the Board of Trustees to value its investments.
Equity securities, including restricted securities, for which market quotations are readily available, are valued at the last reported sale price or official closing price as reported by an independent pricing service on the primary market or exchange on which they are traded. In the event there were no sales during the day or closing prices are not available, securities are valued at the last quoted bid price. Investments in open-end mutual funds, including the Fidelity Central Funds, are valued at their closing net asset value each business day. Short-term securities with remaining maturities of sixty days or less for which quotations are not readily available are valued at amortized cost, which approximates value.
When current market prices or quotations are not readily available or reliable, valuations may be determined in good faith in accordance with procedures adopted by the Board of Trustees. Factors used in determining value may include significant market or security specific events, changes in interest rates and credit quality, and developments in foreign markets which are monitored by evaluating the performance of ADRs, futures contracts and exchange-traded funds. The frequency with which these procedures are used cannot be predicted and may be utilized to a significant extent. The value of securities used for net asset value (NAV) calculation under these procedures may differ from published prices for the same securities.
Foreign Currency. The Fund uses foreign currency contracts to facilitate transactions in foreign-denominated securities. Losses from these transactions may arise from changes in the value of the foreign currency or if the counterparties do not perform under the contracts' terms.
Foreign-denominated assets, including investment securities, and liabilities are translated into U.S. dollars at the exchange rate at period end. Purchases and sales of investment securities, income and dividends received and expenses denominated in foreign currencies are translated into U.S. dollars at the exchange rate in effect on the transaction date.
The effects of exchange rate fluctuations on investments are included with the net realized and unrealized gain (loss) on investment securities. Other foreign currency transactions resulting in realized and unrealized gain (loss) are disclosed separately.
Annual Report
3. Significant Accounting Policies - continued
Investment Transactions and Income. For financial reporting purposes, the Fund's investment holdings and NAV include trades executed through the end of the last business day of the period. The NAV per share for processing shareholder transactions is calculated as of the close of business of the New York Stock Exchange (NYSE), normally 4:00 p.m. Eastern time and includes trades executed through the end of the prior business day. Gains and losses on securities sold are determined on the basis of identified cost. Dividend income is recorded on the ex-dividend date, except for certain dividends from foreign securities where the ex-dividend date may have passed, which are recorded as soon as the Fund is informed of the ex-dividend date. Non-cash dividends included in dividend income, if any, are recorded at the fair market value of the securities received. Interest income and distributions from the Fidelity Central Funds are accrued as earned. Interest income includes coupon interest and amortization of premium and accretion of discount on debt securities. Investment income is recorded net of foreign taxes withheld where recovery of such taxes is uncertain.
Expenses. Most expenses of the trust can be directly attributed to a fund. Expenses which cannot be directly attributed are apportioned among each Fund in the trust. Expense estimates are accrued in the period to which they relate and adjustments are made when actual amounts are known.
Income Tax Information and Distributions to Shareholders. Each year, the Fund intends to qualify as a regulated investment company by distributing substantially all of its taxable income and realized gains under Subchapter M of the Internal Revenue Code and filing its U.S. federal tax return. As a result, no provision for income taxes is required. The Fund is subject to the provisions of FASB Interpretation No. 48, Accounting for Uncertainties in Income Taxes (FIN 48). FIN 48 sets forth a minimum threshold for financial statement recognition of the benefit of a tax position taken or expected to be taken in a tax return. The implementation of FIN 48 did not result in any unrecognized tax benefits in the accompanying financial statements. Each of the Fund's federal tax returns for the prior three fiscal years remains subject to examination by the Internal Revenue Service (IRS). Foreign taxes are provided for based on the Fund's understanding of the tax rules and rates that exist in the foreign markets in which it invests.
Distributions are recorded on the ex-dividend date. Income dividends and capital gain distributions are declared separately for each class. Income and capital gain distributions are determined in accordance with income tax regulations, which may differ from generally accepted accounting principles. In addition, the Fund will claim a portion of the payment made to redeeming shareholders as a distribution for income tax purposes.
Capital accounts within the financial statements are adjusted for permanent book-tax differences. These adjustments have no impact on net assets or the results of operations. Temporary book-tax differences will reverse in a subsequent period.
Book-tax differences are primarily due to foreign currency transactions, passive foreign investment companies (PFIC), market discount, deferred trustees compensation and losses deferred due to wash sales.
The tax-basis components of distributable earnings and the federal tax cost as of period end were as follows:
Unrealized appreciation | $ 21,321,361 |
Unrealized depreciation | (299,959,636) |
Net unrealized appreciation (depreciation) | (278,638,275) |
Undistributed ordinary income | 5,975,924 |
Capital loss carryforward | (148,402,224) |
| |
Cost for federal income tax purposes | $ 1,034,819,052 |
The tax character of distributions paid was as follows:
| October 31, 2008 | October 31, 2007 |
Ordinary Income | $ 49,852,032 | $ 9,931,797 |
Long-term Capital Gains | 189,536,406 | 6,849,518 |
Total | $ 239,388,438 | $ 16,781,315 |
Short-Term Trading (Redemption) Fees. Shares held in the Fund less than 90 days are subject to a redemption fee equal to 1.50% of the proceeds of the redeemed shares. All redemption fees, including any estimated redemption fees paid by FMR, are retained by the Fund and accounted for as an addition to paid in capital.
New Accounting Pronouncement. In September 2006, Statement of Financial Accounting Standards No. 157, Fair Value Measurements (SFAS 157), was issued and is effective for fiscal years beginning after November 15, 2007. SFAS 157 defines fair value, establishes a framework for measuring fair value and results in expanded disclosures about fair value measurements.
Annual Report
China Region
Notes to Financial Statements - continued
4. Operating Policies.
Repurchase Agreements. FMR has received an Exemptive Order from the Securities and Exchange Commission (the SEC) which permits the Fund and other affiliated entities of FMR to transfer uninvested cash balances into joint trading accounts which are then invested in repurchase agreements. The Fund may also invest directly with institutions in repurchase agreements. Repurchase agreements are collateralized by government or non-government securities. Upon settlement date, collateral is held in segregated accounts with custodian banks and may be obtained in the event of a default of the counterparty. The Fund monitors, on a daily basis, the value of the collateral to ensure it is at least equal to the principal amount of the repurchase agreement (including accrued interest). In the event of a default by the counterparty, realization of the collateral proceeds could be delayed, during which time the value of the collateral may decline.
5. Purchases and Sales of Investments.
Purchases and sales of securities, other than short-term securities, aggregated $1,807,459,093 and $2,036,363,750, respectively.
6. Fees and Other Transactions with Affiliates.
Management Fee. FMR and its affiliates provide the Fund with investment management related services for which the Fund pays a monthly management fee. The management fee is the sum of an individual fund fee rate that is based on an annual rate of .45% of the Fund's average net assets and a group fee rate that averaged .26% during the period. The group fee rate is based upon the average net assets of all the mutual funds advised by FMR. The group fee rate decreases as assets under management increase and increases as assets under management decrease. For the period, the total annual management fee rate was .71% of the Fund's average net assets.
Distribution and Service Plan. In accordance with Rule 12b-1 of the 1940 Act, the Fund has adopted separate Distribution and Service Plans for each class of shares. Certain classes pay Fidelity Distributors Corporation (FDC), an affiliate of FMR, separate Distribution and Service Fees, each of which is based on an annual percentage of each class' average net assets. In addition, FDC may pay financial intermediaries for selling shares of the Fund and providing shareholder support services. For the period, the Distribution and Service Fee rates and the total amounts paid to and retained by FDC were as follows:
| Distribution
Fee | Service
Fee | Paid to
FDC | Retained
by FDC |
Class A | 0% | .25% | $ 396 | $ 184 |
Class T | .25% | .25% | 254 | 194 |
Class B | .75% | .25% | 626 | 565 |
Class C | .75% | .25% | 666 | 573 |
| | | $ 1,942 | $ 1,516 |
Sales Load. FDC receives a front-end sales charge of up to 5.75% for selling Class A shares, and 3.50% for selling Class T shares, some of which is paid to financial intermediaries for selling shares of the Fund. FDC receives the proceeds of contingent deferred sales charges levied on Class A, Class T, Class B, and Class C redemptions. These charges depend on the holding period. The deferred sales charges range from 5% to 1% for Class B, 1% for Class C, 1.00% to .50% for certain purchases of Class A shares and .25% for certain purchases of Class T shares.
For the period, sales charge amounts retained by FDC were as follows:
| Retained
by FDC |
Class A | $ 2,552 |
Class T | 96 |
Class B* | - |
Class C* | 19 |
| $ 2,667 |
* When Class B and Class C shares are initially sold, FDC pays commissions from its own resources to financial intermediaries through which the sales are made.
Annual Report
6. Fees and Other Transactions with Affiliates - continued
Transfer Agent Fees. Fidelity Investments Institutional Operations Company, Inc. (FIIOC), an affiliate of FMR, is the transfer, dividend disbursing and shareholder servicing agent for each class of the Fund. FIIOC receives account fees and asset-based fees that vary according to the account size and type of account of the shareholders of the respective classes of the Fund. FIIOC pays for typesetting, printing and mailing of shareholder reports, except proxy statements. Prior to January 1, 2008, Fidelity Service Company, Inc. (FSC), also an affiliate of FMR, was the transfer agent for China Region shares. For the period, each class paid the following transfer agent fees:
| Amount | % of
Average
Net Assets |
Class A | $ 498 | .31* |
Class T | 152 | .30* |
Class B | 183 | .29* |
Class C | 174 | .26* |
China Region | 3,513,962 | .25 |
Institutional Class | 74 | .18* |
| $ 3,515,043 | |
* Annualized
Accounting and Security Lending Fees. FSC maintains the Fund's accounting records. The accounting fee is based on the level of average net assets for the month. Under a separate contract, FSC administers the security lending program. The security lending fee is based on the number and duration of lending transactions.
Brokerage Commissions. The Fund placed a portion of its portfolio transactions with brokerage firms which are affiliates of the investment adviser. The commissions paid to these affiliated firms were $37 for the period.
Interfund Lending Program. Pursuant to an Exemptive Order issued by the SEC, the Fund, along with other registered investment companies having management contracts with FMR, may participate in an interfund lending program. This program provides an alternative credit facility allowing the funds to borrow from, or lend money to, other participating affiliated funds. At period end, there were no interfund loans outstanding. The Fund's activity in this program during the period for which loans were outstanding was as follows:
Borrower or Lender | Average Daily
Loan Balance | Weighted Average Interest Rate | Interest
Expense |
Borrower | $ 18,672,333 | 2.81% | $ 8,739 |
7. Committed Line of Credit.
The Fund participates with other funds managed by FMR in a $4.2 billion credit facility (the "line of credit") to be utilized for temporary or emergency purposes to fund shareholder redemptions or for other short-term liquidity purposes. The Fund has agreed to pay commitment fees on its pro rata portion of the line of credit, which amounted to $2,898 and is reflected in Miscellaneous Expense on the Statement of Operations. During the period, there were no borrowings on this line of credit.
8. Security Lending.
The Fund lends portfolio securities from time to time in order to earn additional income. On the settlement date of the loan, the Fund receives collateral (in the form of U.S. Treasury obligations, letters of credit and/or cash) against the loaned securities and maintains collateral in an amount not less than 100% of the market value of the loaned securities during the period of the loan. The market value of the loaned securities is determined at the close of business of the Fund and any additional required collateral is delivered to the Fund on the next business day. If the borrower defaults on its obligation to return the securities loaned because of insolvency or other reasons, a fund could experience delays and costs in recovering the securities loaned or in gaining access to the collateral. Any cash collateral received is invested in the Fidelity Securities Lending Cash Central Fund. The value of loaned securities and cash collateral at period end are disclosed on the Fund's Statement of Assets and Liabilities. Security lending income represents the income earned on investing cash collateral, less fees and expenses associated with the loan, plus any premium payments that may be received on the loan of certain types of securities. Security lending income is presented in the Statement of Operations as a component of income from Fidelity Central Funds.
Annual Report
China Region
Notes to Financial Statements - continued
9. Expense Reductions.
FMR voluntarily agreed to reimburse a portion of China Region's operating expenses. During the period, this reimbursement reduced the class' expenses by $56,475.
Many of the brokers with whom FMR places trades on behalf of the Fund provided services to the Fund in addition to trade execution. These services included payments of certain expenses on behalf of the Fund totaling $1,973,232 for the period. In addition, through arrangements with the Fund's custodian and each class' transfer agent, credits realized as a result of uninvested cash balances were used to reduce the Fund's expenses. During the period, these credits reduced the Fund's custody expenses by $20,941. During the period, credits reduced each class' transfer agent expense as noted in the table below.
| Transfer Agent
expense reduction |
China Region | $ 17,610 |
10. Other.
The Fund's organizational documents provide former and current trustees and officers with a limited indemnification against liabilities arising in connection with the performance of their duties to the Fund. In the normal course of business, the Fund may also enter into contracts that provide general indemnifications. The Fund's maximum exposure under these arrangements is unknown as this would be dependent on future claims that may be made against the Fund. The risk of material loss from such claims is considered remote.
In December 2006, the Independent Trustees, with the assistance of independent counsel, completed an investigation regarding gifts, gratuities and business entertainment provided by certain brokers to certain individuals who were employed on FMR's domestic equity trading desk during the period 2002 to 2004. The Independent Trustees and FMR agreed that, despite the absence of proof that the Fidelity mutual funds experienced diminished execution quality as a result of the improper receipt of gifts and business entertainment, the conduct at issue was serious and was worthy of redress. Accordingly, the Independent Trustees requested, and FMR agreed to make, a payment of $42 million plus accrued interest, which equaled approximately $7.3 million, to certain Fidelity mutual funds.
In March 2008, the Trustees approved a method for allocating this payment among the funds and, in total, FMR paid the fund $92, which is recorded in the accompanying Statement of Operations.
In a related administrative order dated March 5, 2008, the U.S. Securities and Exchange Commission ("SEC") announced a settlement with FMR and FMR Co., Inc. (an affiliate of FMR) involving the SEC's regulatory rules for investment advisers and the improper receipt of gifts, gratuities and business entertainment. Without admitting or denying the SEC's findings, FMR agreed to pay an $8 million civil penalty to the United States Treasury.
11. Distributions to Shareholders.
Distributions to shareholders of each class were as follows:
Years ended October 31, | 2008 | 2007 |
From net investment income | | |
China Region | $ 15,794,709 | $ 9,931,797 |
From net realized gain | | |
China Region | $ 223,593,729 | $ 6,849,518 |
Annual Report
12. Share Transactions.
Transactions for each class of shares were as follows:
| Shares | Dollars |
Years ended October 31, | 2008 A | 2007 | 2008 A | 2007 |
Class A | | | | |
Shares sold | 30,242 | - | $ 750,104 | $ - |
Shares redeemed | (9,830) | - | (195,417) | - |
Net increase (decrease) | 20,412 | - | $ 554,687 | $ - |
Class T | | | | |
Shares sold | 6,603 | - | $ 171,008 | $ - |
Shares redeemed | (170) | - | (3,942) | - |
Net increase (decrease) | 6,433 | - | $ 167,066 | $ - |
Class B | | | | |
Shares sold | 9,379 | - | $ 239,439 | $ - |
Shares redeemed | (69) | - | (1,147) | - |
Net increase (decrease) | 9,310 | - | $ 238,292 | $ - |
Class C | | | | |
Shares sold | 16,209 | - | $ 359,453 | $ - |
Shares redeemed | (2,193) | - | (34,305) | - |
Net increase (decrease) | 14,016 | - | $ 325,148 | $ - |
China Region | | | | |
Shares sold | 24,232,728 | 38,031,904 | $ 702,714,867 | $ 1,145,260,346 |
Reinvestment of distributions | 7,102,996 | 675,406 | 228,787,494 | 16,027,386 |
Shares redeemed | (36,222,341) | (21,493,222) | (967,305,455) | (573,113,425) |
Net increase (decrease) | (4,886,617) | 17,214,088 | $ (35,803,094) | $ 588,174,307 |
Institutional Class | | | | |
Shares sold | 5,359 | - | $ 145,686 | $ - |
Shares redeemed | (1,791) | - | (37,350) | - |
Net increase (decrease) | 3,568 | - | $ 108,336 | $ - |
A Share transactions for Class A, Class T, Class B, Class C, and Institutional Class are for the period May 9, 2008 (commencement of sale of shares) to October 31, 2008.
Annual Report
Emerging Markets
Shareholder Expense Example
As a shareholder of the Fund, you incur two types of costs: (1) transaction costs and redemption fees, and (2) ongoing costs, including management fees and other Fund expenses. This Example is intended to help you understand your ongoing costs (in dollars) of investing in the Fund and to compare these costs with the ongoing costs of investing in other mutual funds.
The actual expense Example is based on an investment of $1,000 invested at the beginning of the period and held for the entire period (May 1, 2008 to October 31, 2008) for Emerging Markets and for the entire period (May 9, 2008 to October 31, 2008) for Class K.
The hypothetical expense Example is based on an investment of $1,000 invested for the one-half year period (May 1, 2008 to October 31, 2008).
Actual Expenses
The first line of the accompanying table for each class of the Fund provides information about actual account values and actual expenses. You may use the information in this line, together with the amount you invested, to estimate the expenses that you paid over the period. Simply divide your account value by $1,000.00 (for example, an $8,600 account value divided by $1,000.00 = 8.6), then multiply the result by the number in the first line for a class of the Fund under the heading entitled "Expenses Paid During Period" to estimate the expenses you paid on your account during this period. A small balance maintenance fee of $12.00 that is charged once a year may apply for certain accounts with a value of less than $2,000. This fee is not included in the table below. If it was, the estimate of expenses you paid during the period would be higher, and your ending account value lower, by this amount. In addition, the Fund, as a shareholder in the underlying Fidelity Central Funds, will indirectly bear its pro rata share of the fees and expenses incurred by the underlying Fidelity Central Funds. These fees and expenses are not included in the Fund's annualized expense ratio used to calculate the expense estimate in the table below.
Hypothetical Example for Comparison Purposes
The second line of the accompanying table for each class of the Fund provides information about hypothetical account values and hypothetical expenses based on a Class' actual expense ratio and an assumed rate of return of 5% per year before expenses, which is not the Class' actual return. The hypothetical account values and expenses may not be used to estimate the actual ending account balance or expenses you paid for the period. You may use this information to compare the ongoing costs of investing in the Fund and other funds. To do so, compare this 5% hypothetical example with the 5% hypothetical examples that appear in the shareholder reports of the other funds. A small balance maintenance fee of $12.00 that is charged once a year may apply for certain accounts with a value of less than $2,000. This fee is not included in the table below. If it was, the estimate of expenses you paid during the period would be higher, and your ending account value lower, by this amount. In addition, the Fund, as a shareholder in the underlying Fidelity Central Funds, will indirectly bear its pro rata share of the fees and expenses incurred by the underlying Fidelity Central Funds. These fees and expenses are not included in the Fund's annualized expense ratio used to calculate the expense estimate in the table below.
Please note that the expenses shown in the table are meant to highlight your ongoing costs only and do not reflect any transaction costs. Therefore, the second line of the table is useful in comparing ongoing costs only, and will not help you determine the relative total costs of owning different funds. In addition, if these transactional costs were included, your costs would have been higher.
| Annualized Expense Ratio | Beginning
Account Value | Ending
Account Value
October 31, 2008 | Expenses Paid
During Period |
Emerging Markets | 1.09% | | | |
Actual | | $ 1,000.00 | $ 431.10 | $ 3.92 B |
Hypothetical A | | $ 1,000.00 | $ 1,019.66 | $ 5.53 C |
Class K | .92% | | | |
Actual | | $ 1,000.00 | $ 428.90 | $ 3.16 B |
Hypothetical A | | $ 1,000.00 | $ 1,020.51 | $ 4.67 C |
A 5% return per year before expenses
B Actual expenses are equal to each Class' annualized expense ratio, multiplied by the average account value over the period, multiplied by 184/366 (to reflect the one-half year period) for Emerging Markets and multiplied by 176/366 (to reflect the period May 9, 2008 to October 31, 2008) for Class K.
C Hypothetical expenses are equal to each Class' annualized expense ratio; multiplied by the average account value over the period, multiplied by 184/366 (to reflect the one-half year period).
Annual Report
Emerging Markets
Performance: The Bottom Line
Average annual total return reflects the change in the value of an investment, assuming reinvestment of the class' dividend income and capital gains (the profits earned upon the sale of securities that have grown in value, if any) and assuming a constant rate of performance each year. The $10,000 table and the fund's returns do not reflect the deduction of taxes that a shareholder would pay on fund distributions or the redemption of fund shares. During periods of reimbursement by Fidelity, a fund's total returns will be greater than it would be had the reimbursement not occurred. How a fund did yesterday is no guarantee of how it will do tomorrow.
Average Annual Total Returns
Periods ended October 31, 2008 | Past 1
year | Past 5
years | Past 10
years |
Emerging Markets | -61.84% | 8.74% | 8.42% |
$10,000 Over 10 Years
Let's say hypothetically that $10,000 was invested in Emerging Markets, a class of the fund, on October 31, 1998. The chart shows how the value of your investment would have changed, and also shows how the MSCI Emerging Markets Index performed over the same period.
Annual Report
Emerging Markets
Management's Discussion of Fund Performance
Comments from Robert von Rekowsky, Portfolio Manager of Fidelity® Emerging Markets Fund
Stocks across the emerging-markets universe suffered steep losses during the 12 months ending October 31, 2008. In that time, the MSCI® Emerging Markets Index fell 56.22%. All three of the benchmark's primary regions - Europe/Middle East/Africa (EMEA), Latin America, and Asia ex Australia and New Zealand - declined by more than 50%. In EMEA, major benchmark component Russia saw its market tumble by more than 62%, while Brazil - representing the benchmark's largest weighting during the period, on average, at almost 15% - finished with a setback of more than 53%. In both cases, falling commodity prices triggered by slowing global economies had a negative impact on share prices. Meanwhile, South Korea, the second-largest benchmark component, experienced a nearly 60% drop. Chinese stocks also were hard-hit, down roughly 67%. Asian emerging markets suffered in part due to concerns about slowing exports in the wake of decelerating economic growth in the United States and Europe, as the U.S. credit crisis continued to worsen and expand its reach abroad.
During the past year, the fund's Retail Class shares returned -61.84%, trailing the MSCI Emerging Markets Index. Stock selection detracted, particularly in Taiwan, South Korea, Brazil and Mexico. On a sector basis, the most damage was done through stock picking in consumer discretionary, materials, financials, telecommunication services and energy. Underweighting Israel's Teva Pharmaceutical Industries, a benchmark component, detracted from the fund's results. An industry leader in a defensive sector, Teva was more resistant to the selling pressure than most other stocks. Similar comments apply to Taiwan Semiconductor Manufacturing. Other detractors included Brazilian steel producer Siderurgica Nacional; Taiwan's Chunghwa Telecom, a benchmark constituent the fund didn't own that actually posted a small gain; wireless carrier China Mobile; and Russian natural gas producer and distributor Gazprom. Conversely, a modest cash position was beneficial, given the extreme weakness in stocks. Although fertilizer holding Israel Chemicals posted a loss, it managed to significantly outperform the benchmark. Another fertilizer stock, Russia-based Uralkali, also helped, as did underweighting and ultimately selling weak-performing benchmark component PetroChina. Egypt-based Orascom Construction, an out-of-benchmark holding, contributed as well. Many of the stocks I've mentioned were sold by period end.
The views expressed above reflect those of the portfolio manager(s) only through the end of the period as stated on the cover of this report and do not necessarily represent the views of Fidelity or any other person in the Fidelity organization. Any such views are subject to change at any time based upon market or other conditions and Fidelity disclaims any responsibility to update such views. These views may not be relied on as investment advice and, because investment decisions for a Fidelity fund are based on numerous factors, may not be relied on as an indication of trading intent on behalf of any Fidelity fund.
Annual Report
Emerging Markets
Investment Changes (Unaudited)
Geographic Diversification (% of fund's net assets) |
As of October 31, 2008 |
| Brazil | 15.0% | |
| South Africa | 9.3% | |
| Russia | 8.9% | |
| Korea (South) | 8.5% | |
| China | 6.6% | |
| India | 6.5% | |
| United States of America | 5.7% | |
| Taiwan | 5.5% | |
| Hong Kong | 4.9% | |
| Other | 29.1% | |

Percentages are adjusted for the effect of futures contracts, if applicable. |
|
As of April 30, 2008 |
| Brazil | 14.1% | |
| Russia | 12.5% | |
| Korea (South) | 11.8% | |
| South Africa | 6.6% | |
| Taiwan | 6.0% | |
| Hong Kong | 5.7% | |
| India | 5.6% | |
| China | 5.3% | |
| Mexico | 4.0% | |
| Other | 28.4% | |

Percentages are adjusted for the effect of futures contracts, if applicable. |
Asset Allocation |
| % of fund's
net assets | % of fund's net assets
6 months ago |
Stocks and Investment Companies | 95.1 | 98.1 |
Short-Term Investments and Net Other Assets | 4.9 | 1.9 |
Top Ten Stocks as of October 31, 2008 |
| % of fund's
net assets | % of fund's net assets
6 months ago |
Petroleo Brasileiro SA - Petrobras (PN) (non-vtg.) (Brazil, Oil, Gas & Consumable Fuels) | 3.6 | 1.9 |
OAO Gazprom sponsored ADR (Russia, Oil, Gas & Consumable Fuels) | 3.2 | 4.0 |
Companhia Vale do Rio Doce (PN-A) sponsored ADR (Brazil, Metals & Mining) | 2.7 | 3.5 |
Samsung Electronics Co. Ltd. (Korea (South), Semiconductors & Semiconductor Equipment) | 2.7 | 2.9 |
China Mobile (Hong Kong) Ltd. (Hong Kong, Wireless Telecommunication Services) | 2.2 | 3.5 |
America Movil SAB de CV Series L sponsored ADR (Mexico, Wireless Telecommunication Services) | 1.9 | 2.1 |
Industrial & Commercial Bank of China (China, Commercial Banks) | 1.9 | 1.0 |
MTN Group Ltd. (South Africa, Wireless Telecommunication Services) | 1.8 | 1.1 |
Banco Bradesco SA (PN) (Brazil, Commercial Banks) | 1.8 | 1.2 |
China Construction Bank Corp. (H Shares) (China, Commercial Banks) | 1.8 | 1.4 |
| 23.6 | |
Market Sectors as of October 31, 2008 |
| % of fund's
net assets | % of fund's net assets
6 months ago |
Financials | 24.9 | 21.1 |
Energy | 15.7 | 19.1 |
Materials | 11.2 | 17.9 |
Telecommunication Services | 10.3 | 9.4 |
Information Technology | 10.0 | 8.1 |
Industrials | 5.9 | 10.7 |
Consumer Staples | 6.0 | 3.3 |
Consumer Discretionary | 4.9 | 6.1 |
Utilities | 4.8 | 2.1 |
Health Care | 1.4 | 0.1 |
Annual Report
Emerging Markets
Investments October 31, 2008
Showing Percentage of Net Assets
Common Stocks - 95.0% |
| Shares | | Value |
Australia - 0.1% |
Sino Gold Mining Ltd. (a) | 772,602 | | $ 1,778,599 |
Austria - 0.3% |
Erste Bank AG | 120,100 | | 3,201,864 |
Raiffeisen International Bank-Holding AG (e) | 93,500 | | 2,942,200 |
TOTAL AUSTRIA | | 6,144,064 |
Bahrain - 0.4% |
Gulf Finance House BSC: | | | |
(Reg. S) unit | 103,000 | | 1,751,000 |
GDR (f) | 442,090 | | 7,515,530 |
TOTAL BAHRAIN | | 9,266,530 |
Bermuda - 1.3% |
Aquarius Platinum Ltd. (Australia) | 1,471,059 | | 2,907,395 |
Central European Media Enterprises Ltd. Class A (a) | 114,600 | | 3,060,966 |
Credicorp Ltd. (NY Shares) | 284,500 | | 11,172,315 |
Dufry South America Ltd. unit | 472,943 | | 2,906,451 |
Ports Design Ltd. | 4,436,500 | | 5,157,774 |
West Siberian Resources Ltd. SDR (a) | 7,038,735 | | 2,846,230 |
TOTAL BERMUDA | | 28,051,131 |
Brazil - 14.9% |
America Latina Logistica SA unit | 1,128,200 | | 5,202,586 |
Anhanguera Educacional Participacoes SA unit | 410,059 | | 3,031,579 |
Banco Bradesco SA: | | | |
(PN) | 3,165,600 | | 36,348,378 |
(PN) sponsored ADR | 257,000 | | 3,006,900 |
Banco Daycoval SA (PN) | 1,030,400 | | 2,571,001 |
Banco do Brasil SA | 2,057,900 | | 13,597,620 |
Companhia de Saneamento de Minas Gerais | 12,700 | | 80,395 |
Companhia Energetica de Minas Gerais (CEMIG) (PN) sponsored ADR (non-vtg.) | 971,900 | | 14,782,599 |
Companhia Siderurgica Nacional SA (CSN) sponsored ADR (e) | 1,301,000 | | 17,693,600 |
Companhia Vale do Rio Doce (PN-A) sponsored ADR | 5,068,300 | | 59,349,793 |
GVT Holding SA (a) | 699,900 | | 7,616,045 |
Localiza Rent a Car SA | 2,233,800 | | 8,670,141 |
MRV Engenharia e Participacoes SA | 685,000 | | 3,548,124 |
Multiplan Empreendimentos Imobiliarios SA (a) | 396,900 | | 1,997,154 |
Net Servicos de Comunicacao SA sponsored ADR (e) | 2,153,766 | | 14,085,630 |
Petroleo Brasileiro SA - Petrobras: | | | |
(PN) (non-vtg.) | 3,175,400 | | 34,245,373 |
(PN) sponsored ADR (non-vtg.) | 1,985,100 | | 43,811,157 |
sponsored ADR | 334,900 | | 9,005,461 |
Redecard SA | 1,083,700 | | 11,772,381 |
SLC Agricola SA | 1,000 | | 5,175 |
|
| Shares | | Value |
Uniao de Bancos Brasileiros SA (Unibanco): | | | |
unit | 1,579,300 | | $ 9,778,496 |
GDR | 218,900 | | 13,808,212 |
Votorantim Celulose e Papel SA sponsored ADR (non-vtg.) (e) | 964,100 | | 9,727,769 |
TOTAL BRAZIL | | 323,735,569 |
British Virgin Islands - 0.0% |
Thunderbird Resorts, Inc. (a)(f) | 331,900 | | 1,161,650 |
Titanium Resources Group Ltd. (a) | 279,100 | | 37,726 |
TOTAL BRITISH VIRGIN ISLANDS | | 1,199,376 |
Canada - 0.2% |
Addax Petroleum, Inc. | 63,900 | | 953,890 |
Addax Petroleum, Inc. (f) | 20,700 | | 309,006 |
SouthGobi Energy Resources Ltd. (a) | 336,400 | | 2,343,473 |
TOTAL CANADA | | 3,606,369 |
Cayman Islands - 1.2% |
Chaoda Modern Agriculture (Holdings) Ltd. | 18,713,063 | | 13,183,766 |
China Aoyuan Property Group Ltd. | 596,000 | | 54,857 |
China Dongxiang Group Co. Ltd. | 16,516,000 | | 4,858,875 |
Suntech Power Holdings Co. Ltd. sponsored ADR (a) | 153,200 | | 2,681,000 |
The United Laboratories International Holdings Ltd. | 7,120,000 | | 1,690,137 |
Yingli Green Energy Holding Co. Ltd. ADR (a)(e) | 583,400 | | 3,074,518 |
TOTAL CAYMAN ISLANDS | | 25,543,153 |
China - 6.6% |
China Coal Energy Co. Ltd. (H Shares) | 12,160,700 | | 7,375,477 |
China Construction Bank Corp. (H Shares) (e) | 76,860,000 | | 38,128,401 |
China Gas Holdings Ltd. (e) | 19,410,000 | | 1,597,724 |
China Merchants Bank Co. Ltd. (H Shares) | 11,671,000 | | 17,880,415 |
China South Locomotive & Rolling Stock Corp. Ltd. (H Shares) | 15,635,000 | | 5,660,321 |
China Yurun Food Group Ltd. | 3,935,000 | | 4,676,975 |
Golden Eagle Retail Group Ltd. (H Shares) (e) | 8,449,000 | | 4,417,337 |
Industrial & Commercial Bank of China | 86,899,000 | | 40,887,498 |
Ping An Insurance (Group) Co. of China, Ltd. (H Shares) | 3,175,000 | | 13,578,518 |
Yantai Changyu Pioneer Wine Co. (B Shares) | 1,408,650 | | 4,377,350 |
ZTE Corp. (H Shares) | 1,854,400 | | 4,193,147 |
TOTAL CHINA | | 142,773,163 |
Cyprus - 0.1% |
Mirland Development Corp. PLC (a) | 932,005 | | 1,202,465 |
XXI Century Investments Public Ltd. (a) | 468,000 | | 243,761 |
TOTAL CYPRUS | | 1,446,226 |
Common Stocks - continued |
| Shares | | Value |
Czech Republic - 2.5% |
Ceske Energeticke Zavody AS | 712,200 | | $ 30,819,532 |
Komercni Banka AS | 105,000 | | 15,746,790 |
Philip Morris CR AS | 30,350 | | 8,430,332 |
TOTAL CZECH REPUBLIC | | 54,996,654 |
Egypt - 1.3% |
Commercial International Bank Ltd. sponsored GDR (e) | 2,018,726 | | 8,983,331 |
Eastern Tobacco Co. | 183,045 | | 7,081,741 |
Orascom Construction Industries SAE GDR | 132,012 | | 8,844,804 |
Telecom Egypt SAE | 1,501,400 | | 3,631,443 |
TOTAL EGYPT | | 28,541,319 |
Georgia - 0.1% |
Bank of Georgia unit (a) | 225,200 | | 1,565,140 |
Hong Kong - 4.9% |
China Mobile (Hong Kong) Ltd. | 5,392,400 | | 47,470,698 |
China Resources Power Holdings Co. Ltd. | 8,701,500 | | 17,005,727 |
CNOOC Ltd. | 28,941,000 | | 23,762,715 |
CNOOC Ltd. sponsored ADR (e) | 47,000 | | 3,839,430 |
CNPC (Hong Kong) Ltd. | 43,276,000 | | 13,268,622 |
REXCAPITAL Financial Holdings Ltd. (a) | 69,720,000 | | 1,288,336 |
TOTAL HONG KONG | | 106,635,528 |
India - 6.5% |
Axis Bank Ltd. | 383,781 | | 4,457,572 |
Axis Bank Ltd. GDR (Reg. S) | 481,200 | | 5,774,400 |
Bank of India | 1,492,779 | | 7,422,377 |
Bharti Airtel Ltd. (a) | 732,978 | | 9,924,663 |
Educomp Solutions Ltd. | 96,188 | | 4,500,027 |
Housing Development Finance Corp. Ltd. | 611,449 | | 22,255,918 |
Indian Overseas Bank | 3,790,657 | | 5,820,784 |
Infosys Technologies Ltd. sponsored ADR (e) | 910,000 | | 26,681,200 |
ITC Ltd. | 1,500 | | 4,789 |
Larsen & Toubro Ltd. | 757,236 | | 12,657,311 |
Reliance Industries Ltd. | 274,567 | | 7,804,584 |
Rolta India Ltd. | 2,170,765 | | 8,323,803 |
Satyam Computer Services Ltd. | 1,597,781 | | 10,101,600 |
Sintex Industries Ltd. | 1,483,223 | | 4,512,324 |
Tata Power Co. Ltd. | 853,306 | | 12,178,900 |
TOTAL INDIA | | 142,420,252 |
Indonesia - 2.4% |
PT Bayan Resources Group Tbk | 13,528,500 | | 2,089,261 |
PT Astra International Tbk | 9,794,500 | | 8,228,486 |
PT Bank Mandiri Persero Tbk | 16,170,000 | | 2,340,966 |
PT Bank Rakyat Indonesia Tbk | 39,267,000 | | 12,125,658 |
PT Bumi Resources Tbk | 77,031,500 | | 10,085,465 |
PT Perusahaan Gas Negara Tbk
Series B | 108,029,100 | | 13,730,188 |
|
| Shares | | Value |
PT Telkomunikasi Indonesia Tbk: | | | |
Series B | 2,533,000 | | $ 1,278,966 |
sponsored ADR (e) | 87,400 | | 1,751,496 |
TOTAL INDONESIA | | 51,630,486 |
Ireland - 0.1% |
Dragon Oil PLC (a) | 1,064,000 | | 2,752,626 |
Israel - 2.9% |
Cellcom Israel Ltd. | 355,200 | | 10,464,192 |
Check Point Software Technologies Ltd. (a) | 617,700 | | 12,489,894 |
Israel Chemicals Ltd. | 2,758,200 | | 26,736,475 |
Orpak Systems Ltd. | 631,800 | | 1,035,546 |
Teva Pharmaceutical Industries Ltd. sponsored ADR | 273,300 | | 11,719,104 |
TOTAL ISRAEL | | 62,445,211 |
Kazakhstan - 0.6% |
JSC Halyk Bank of Kazakhstan unit | 857,000 | | 3,642,250 |
KazMunaiGas Exploration & Production JSC (Reg. S) GDR | 615,859 | | 8,622,026 |
TOTAL KAZAKHSTAN | | 12,264,276 |
Korea (South) - 8.5% |
CJ CheilJedang Corp. (a) | 51,965 | | 6,069,219 |
Doosan Co. Ltd. (a) | 186,370 | | 13,559,690 |
KB Financial Group, Inc. (a) | 188,243 | | 4,727,285 |
Korea Gas Corp. | 320,898 | | 12,121,545 |
KT&G Corp. | 277,590 | | 17,871,433 |
LG Household & Health Care Ltd. | 70,560 | | 10,110,908 |
LIG Non-Life Insurance Co. Ltd. | 202,240 | | 2,362,256 |
MegaStudy Co. Ltd. | 87,151 | | 9,826,936 |
Meritz Fire & Marine Insurance Co. Ltd. | 2,387,760 | | 8,792,862 |
NHN Corp. (a) | 127,426 | | 13,602,872 |
Samsung Electronics Co. Ltd. | 138,466 | | 58,556,960 |
Shinhan Financial Group Co. Ltd. | 681,340 | | 16,627,078 |
Taewoong Co. Ltd. | 234,549 | | 11,457,105 |
TOTAL KOREA (SOUTH) | | 185,686,149 |
Lebanon - 0.3% |
Solidere GDR | 333,800 | | 7,093,250 |
Luxembourg - 0.7% |
Evraz Group SA GDR | 295,200 | | 4,546,080 |
MHP SA: | | | |
GDR (a)(f) | 584,500 | | 2,338,000 |
GDR (Reg. S) | 30,000 | | 120,000 |
Millicom International Cellular SA | 184,900 | | 7,396,000 |
TOTAL LUXEMBOURG | | 14,400,080 |
Malaysia - 1.3% |
DiGi.com Bhd | 2,484,000 | | 12,923,908 |
KNM Group Bhd | 32,098,500 | | 5,442,824 |
Common Stocks - continued |
| Shares | | Value |
Malaysia - continued |
Parkson Holdings Bhd | 10,410 | | $ 9,873 |
Public Bank Bhd | 4,442,200 | | 10,556,191 |
TOTAL MALAYSIA | | 28,932,796 |
Mexico - 3.5% |
America Movil SAB de CV Series L sponsored ADR | 1,352,200 | | 41,837,068 |
Banco Compartamos SA de CV | 1,766,500 | | 3,000,856 |
Cemex SA de CV sponsored ADR (e) | 1,294,900 | | 9,789,444 |
Fomento Economico Mexicano SA de CV sponsored ADR | 84,400 | | 2,134,476 |
Grupo Financiero Banorte SA de CV Series O | 7,566,200 | | 13,857,660 |
Urbi, Desarrollos Urbanos, SA de CV (a) | 4,021,800 | | 6,026,455 |
TOTAL MEXICO | | 76,645,959 |
Netherlands - 0.1% |
New World Resources BV | 267,400 | | 1,325,732 |
Nigeria - 0.3% |
Guaranty Trust Bank PLC: | | | |
(Reg. S) unit | 626,181 | | 3,443,996 |
sponsored GDR (f) | 480,872 | | 2,644,796 |
TOTAL NIGERIA | | 6,088,792 |
Oman - 0.4% |
BankMuscat SAOG sponsored GDR | 886,000 | | 8,151,200 |
Panama - 0.3% |
Intergroup Financial Services Corp. | 285,840 | | 3,144,240 |
Intergroup Financial Services Corp. (a)(f) | 222,096 | | 2,443,056 |
TOTAL PANAMA | | 5,587,296 |
Papua New Guinea - 0.3% |
Oil Search Ltd. | 2,093,978 | | 6,340,571 |
Peru - 0.4% |
Compania de Minas Buenaventura SA sponsored ADR | 681,600 | | 8,615,424 |
Philippines - 0.5% |
Ayala Corp. | 812,160 | | 3,875,746 |
Megaworld Corp. | 33,834,000 | | 540,512 |
Security Bank Corp. | 2,584,300 | | 2,064,264 |
SM Investments Corp. | 1,302,957 | | 5,283,881 |
TOTAL PHILIPPINES | | 11,764,403 |
Poland - 0.8% |
Kopex SA (a) | 9,870 | | 42,840 |
Powszechna Kasa Oszczednosci
Bank SA | 1,363,500 | | 15,288,639 |
Trakcja Polska SA | 930,950 | | 1,562,415 |
TOTAL POLAND | | 16,893,894 |
Romania - 0.1% |
Banca Transilvania SA (a) | 1,650,048 | | 1,501,424 |
|
| Shares | | Value |
Russia - 8.9% |
Bank St. Petersburg OJSC | 2,635,369 | | $ 3,294,211 |
Comstar United TeleSystems OJSC GDR (Reg. S) | 554,415 | | 1,546,818 |
LSR Group OJSC (a) | 124,500 | | 1,120,500 |
Lukoil Oil Co. sponsored ADR | 607,059 | | 23,553,889 |
Magnit OJSC GDR (Reg. S) (a) | 371,000 | | 1,669,500 |
Mobile TeleSystems OJSC sponsored ADR | 360,000 | | 14,094,000 |
OAO Gazprom sponsored ADR | 3,349,381 | | 68,494,837 |
OAO NOVATEK GDR | 223,202 | | 8,816,479 |
OAO Raspadskaya | 1,580,000 | | 3,318,000 |
OAO TMK | 752,400 | | 1,504,800 |
OJSC Rosneft unit | 1,197,100 | | 5,506,660 |
Pharmstandard OJSC unit (a) | 213,230 | | 3,411,680 |
Rosinter Restaurants Holding (a) | 108,200 | | 3,029,600 |
Sberbank (Savings Bank of the Russian Federation) | 9,855,100 | | 10,249,304 |
Sberbank (Savings Bank of the Russian Federation) GDR | 26,800 | | 4,915,546 |
Uralkali JSC | 1,542,600 | | 7,095,960 |
Uralkali JSC GDR (Reg. S) | 250,500 | | 5,232,945 |
Vimpel Communications sponsored
ADR | 1,165,300 | | 16,896,850 |
VSMPO-Avisma Corp. | 16,600 | | 913,000 |
Wimm-Bill-Dann Foods OJSC sponsored ADR (a)(e) | 200,375 | | 8,804,478 |
TOTAL RUSSIA | | 193,469,057 |
Singapore - 0.2% |
Straits Asia Resources Ltd. | 6,756,000 | | 4,501,054 |
Slovenia - 0.1% |
Nova Kreditna banka Maribor d.d. | 105,899 | | 1,899,832 |
South Africa - 9.3% |
African Bank Investments Ltd. | 4,412,426 | | 12,013,360 |
African Rainbow Minerals Ltd. | 830,551 | | 8,416,023 |
Aspen Pharmacare Holdings Ltd. | 3,834,820 | | 13,345,331 |
Aveng Ltd. | 2,269,600 | | 11,148,219 |
Bell Equipment Ltd. | 713,316 | | 1,022,152 |
Exxaro Resources Ltd. | 1,813,112 | | 11,951,322 |
FirstRand Ltd. | 10,389,456 | | 14,877,020 |
Harmony Gold Mining Co. Ltd. sponsored ADR (a) | 1,185,800 | | 8,668,198 |
Illovo Sugar Ltd. | 2,577,194 | | 5,697,788 |
Impala Platinum Holdings Ltd. | 1,263,928 | | 13,053,258 |
Mr. Price Group Ltd. | 5,031,447 | | 12,359,747 |
MTN Group Ltd. | 3,566,300 | | 39,787,789 |
Murray & Roberts Holdings Ltd. | 2,149,500 | | 14,516,275 |
Northam Platinum Ltd. | 994,250 | | 3,103,851 |
Raubex Group Ltd. | 4,143,363 | | 10,708,282 |
Sasol Ltd. sponsored ADR | 441,000 | | 12,758,130 |
Shoprite Holdings Ltd. | 1,661,135 | | 8,756,239 |
TOTAL SOUTH AFRICA | | 202,182,984 |
Common Stocks - continued |
| Shares | | Value |
Switzerland - 0.2% |
Orascom Development Holding AG | 150,334 | | $ 4,321,267 |
Taiwan - 5.5% |
Acer, Inc. | 5,742,000 | | 7,476,699 |
Asia Cement Corp. | 7,273,720 | | 4,278,010 |
China Steel Corp. | 19,765,038 | | 14,411,071 |
First Financial Holding Co. Ltd. | 35,018,588 | | 16,508,687 |
Fubon Financial Holding Co. Ltd. | 21,655,000 | | 13,130,211 |
Hon Hai Precision Industry Co. Ltd. (Foxconn) | 10,335,302 | | 25,066,672 |
HTC Corp. | 1,958,300 | | 23,361,863 |
Siliconware Precision Industries
Co. Ltd. | 15,752,633 | | 16,189,609 |
TOTAL TAIWAN | | 120,422,822 |
Thailand - 1.9% |
Mermaid Maritime PLC | 434,000 | | 93,837 |
Minor International PCL (For. Reg.) | 37,157,274 | | 8,139,987 |
PTT Exploration & Production PCL (For. Reg.) | 4,729,100 | | 11,800,757 |
Siam Commercial Bank PCL
(For. Reg.) | 11,232,800 | | 17,437,119 |
Total Access Communication PCL: | | | |
unit | 1,696,944 | | 1,212,837 |
(For. Reg.) | 4,265,656 | | 3,032,388 |
TOTAL THAILAND | | 41,716,925 |
Turkey - 3.5% |
Anadolu Efes Biracilik ve Malt Sanyii AS | 2,560,665 | | 21,566,289 |
Asya Katilim Bankasi AS | 10,605,468 | | 9,275,619 |
Bagfas Bandirma Gubre
Fabrikalari AS | 94,000 | | 4,506,495 |
Enka Insaat ve Sanayi AS | 2,550,963 | | 9,502,794 |
Tupras-Turkiye Petrol Rafinerileri AS | 1,303,400 | | 16,466,133 |
Turkiye Garanti Bankasi AS (a) | 8,888,895 | | 14,512,012 |
TOTAL TURKEY | | 75,829,342 |
United Arab Emirates - 0.0% |
Depa Ltd. GDR (a)(f) | 234,100 | | 749,120 |
United Kingdom - 0.7% |
Eurasian Natural Resources Corp. PLC | 715,102 | | 3,576,085 |
Prosperity Mineral Holdings Ltd. | 581,300 | | 206,879 |
Randgold Resources Ltd. sponsored ADR | 257,700 | | 7,991,277 |
Sibir Energy PLC (a) | 995,544 | | 3,960,983 |
TOTAL UNITED KINGDOM | | 15,735,224 |
United States of America - 0.8% |
Central European Distribution Corp. (a)(e) | 225,400 | | 6,489,266 |
|
| Shares | | Value |
CTC Media, Inc. (a) | 967,817 | | $ 7,161,846 |
Freeport-McMoRan Copper & Gold, Inc. Class B | 154,100 | | 4,484,310 |
TOTAL UNITED STATES OF AMERICA | | 18,135,422 |
TOTAL COMMON STOCKS (Cost $2,985,236,639) | 2,064,785,691 |
Nonconvertible Preferred Stocks - 0.1% |
| | | |
Brazil - 0.1% |
Usinas Siderurgicas de Minas Gerais SA - Usiminas (PN-A) (non-vtg.)
(Cost $9,734,995) | 235,400 | | $ 3,012,929 |
Convertible Bonds - 0.0% |
| Principal Amount (d) | | |
Brazil - 0.0% |
Companhia de Saneamento de Minas Gerais 8.55% 6/1/13 (g)(h)
(Cost $308,511) | BRL | 4,841 | | 122,580 |
Money Market Funds - 6.2% |
| Shares | | |
Fidelity Cash Central Fund, 1.81% (b) | 71,241,239 | | 71,241,239 |
Fidelity Securities Lending Cash Central Fund, 2.67% (b)(c) | 62,546,778 | | 62,546,778 |
TOTAL MONEY MARKET FUNDS (Cost $133,788,017) | 133,788,017 |
TOTAL INVESTMENT
PORTFOLIO - 101.3% (Cost $3,129,068,162) | | 2,201,709,217 |
NET OTHER ASSETS - (1.3)% | | (28,085,536) |
NET ASSETS - 100% | $ 2,173,623,681 |
Currency Abbreviation |
BRL | - | Brazilian real |
Legend |
(a) Non-income producing |
(b) Affiliated fund that is available only to investment companies and other accounts managed by Fidelity Investments. The rate quoted is the annualized seven-day yield of the fund at period end. A complete unaudited listing of the fund's holdings as of its most recent quarter end is available upon request. |
(c) Investment made with cash collateral received from securities on loan. |
(d) Principal amount is stated in United States dollars unless otherwise noted. |
(e) Security or a portion of the security is on loan at period end. |
(f) Security exempt from registration under Rule 144A of the Securities Act of 1933. These securities may be resold in transactions exempt from registration, normally to qualified institutional buyers. At the end of the period, the value of these securities amounted to $17,161,158 or 0.8% of net assets. |
(g) The coupon rate shown on floating or adjustable rate securities represents the rate at period end. |
(h) Restricted securities - Investment in securities not registered under the Securities Act of 1933 (excluding 144A issues). At the end of the period, the value of restricted securities (excluding 144A issues) amounted to $122,580 or 0.0% of net assets. |
Additional information on each holding is as follows: |
Security | Acquisition Date | Acquisition Cost |
Companhia de Saneamento de Minas Gerais 8.55% 6/1/13 | 8/22/07 | $ 308,511 |
Affiliated Central Funds |
Information regarding fiscal year to date income earned by the Fund from investments in Fidelity Central Funds is as follows: |
Fund | Income earned |
Fidelity Cash Central Fund | $ 3,390,485 |
Fidelity Securities Lending Cash Central Fund | 830,027 |
Total | $ 4,220,512 |
Income Tax Information |
At October 31, 2008, the fund had a capital loss carryforward of approximately $515,443,831 all of which will expire on October 31, 2016. |
See accompanying notes which are an integral part of the financial statements.
Annual Report
Emerging Markets
Financial Statements
Statement of Assets and Liabilities
| October 31, 2008 |
| | |
Assets | | |
Investment in securities, at value (including securities loaned of $60,505,367) -
See accompanying schedule: Unaffiliated issuers
(cost $2,995,280,145) | $ 2,067,921,200 | |
Fidelity Central Funds
(cost $133,788,017) | 133,788,017 | |
Total Investments
(cost $3,129,068,162) | | $ 2,201,709,217 |
Cash | | 798,812 |
Foreign currency held at value
(cost $377,043) | | 371,411 |
Receivable for investments sold | | 21,135,254 |
Receivable for fund shares sold | | 7,515,316 |
Dividends receivable | | 9,835,504 |
Interest receivable | | 73 |
Distributions receivable from Fidelity Central Funds | | 153,331 |
Prepaid expenses | | 1,550 |
Other receivables | | 2,025,675 |
Total assets | | 2,243,546,143 |
| | |
Liabilities | | |
Payable for investments purchased | $ 1,214,674 | |
Payable for fund shares redeemed | 2,779,848 | |
Accrued management fee | 1,392,020 | |
Other affiliated payables | 914,510 | |
Other payables and accrued expenses | 1,074,632 | |
Collateral on securities loaned, at value | 62,546,778 | |
Total liabilities | | 69,922,462 |
| | |
Net Assets | | $ 2,173,623,681 |
Net Assets consist of: | | |
Paid in capital | | $ 3,607,387,257 |
Undistributed net investment income | | 43,729,580 |
Accumulated undistributed net realized gain (loss) on investments and foreign currency transactions | | (550,119,889) |
Net unrealized appreciation (depreciation) on investments and assets and liabilities in foreign currencies | | (927,373,267) |
Net Assets | | $ 2,173,623,681 |
Statement of Assets and Liabilities - continued
| October 31, 2008 |
| | |
Emerging Markets:
Net Asset Value, offering price and redemption price per share ($2,086,196,235 ÷ 152,164,731 shares) | | $ 13.71 |
| | |
Class K:
Net Asset Value, offering price and redemption price per share ($87,427,446 ÷ 6,370,238 shares) | | $ 13.72 |
See accompanying notes which are an integral part of the financial statements.
Annual Report
Statement of Operations
| Year ended October 31, 2008 |
| | |
Investment Income | | |
Dividends | | $ 125,836,277 |
Special dividends | | 16,131,115 |
Interest | | 94,334 |
Income from Fidelity Central Funds (including $830,027 from security lending) | | 4,220,512 |
| | 146,282,238 |
Less foreign taxes withheld | | (13,018,239) |
Total income | | 133,263,999 |
| | |
Expenses | | |
Management fee | $ 38,002,889 | |
Transfer agent fees | 11,879,816 | |
Accounting and security lending fees | 1,560,904 | |
Custodian fees and expenses | 4,909,985 | |
Independent trustees' compensation | 23,456 | |
Registration fees | 255,657 | |
Audit | 137,844 | |
Legal | 27,329 | |
Interest | 1,754 | |
Miscellaneous | 598,603 | |
Total expenses before reductions | 57,398,237 | |
Expense reductions | (2,735,376) | 54,662,861 |
Net investment income (loss) | | 78,601,138 |
Realized and Unrealized Gain (Loss) Net realized gain (loss) on: | | |
Investment securities: | | |
Unaffiliated issuers (net of foreign taxes of $2,740,177) | (540,020,009) | |
Foreign currency transactions | (5,265,584) | |
Total net realized gain (loss) | | (545,285,593) |
Change in net unrealized appreciation (depreciation) on: Investment securities (net of decrease in deferred foreign taxes of $11,693,088) | (3,580,625,871) | |
Assets and liabilities in foreign currencies | (1,146,382) | |
Total change in net unrealized appreciation (depreciation) | | (3,581,772,253) |
Net gain (loss) | | (4,127,057,846) |
Net increase (decrease) in net assets resulting from operations | | $ (4,048,456,708) |
Statement of Changes in Net Assets
| Year ended
October 31,
2008 | Year ended
October 31,
2007 |
Increase (Decrease) in Net Assets | | |
Operations | | |
Net investment income (loss) | $ 78,601,138 | $ 36,797,945 |
Net realized gain (loss) | (545,285,593) | 281,676,020 |
Change in net unrealized appreciation (depreciation) | (3,581,772,253) | 2,077,424,629 |
Net increase (decrease) in net assets resulting from operations | (4,048,456,708) | 2,395,898,594 |
Distributions to shareholders from net investment income | (34,024,353) | (28,224,601) |
Distributions to shareholders from net realized gain | (245,333,468) | - |
Total distributions | (279,357,821) | (28,224,601) |
Share transactions - net increase (decrease) | (112,421,513) | 1,233,682,324 |
Redemption fees | 4,815,140 | 2,543,001 |
Total increase (decrease) in net assets | (4,435,420,902) | 3,603,899,318 |
| | |
Net Assets | | |
Beginning of period | 6,609,044,583 | 3,005,145,265 |
End of period (including undistributed net investment income of $43,729,580 and undistributed net investment income of $25,569,936, respectively) | $ 2,173,623,681 | $ 6,609,044,583 |
See accompanying notes which are an integral part of the financial statements.
Annual Report
Financial Highlights - Emerging Markets
Years ended October 31, | 2008 | 2007 | 2006 | 2005 | 2004 |
Selected Per-Share Data | | | | | |
Net asset value, beginning of period | $ 37.55 | $ 22.04 | $ 15.71 | $ 11.30 | $ 9.81 |
Income from Investment Operations | | | | | |
Net investment income (loss) B | .42E | .25 | .21 | .21 | .14 |
Net realized and unrealized gain (loss) | (22.73) | 15.44 | 6.31 | 4.30 | 1.46 |
Total from investment operations | (22.31) | 15.69 | 6.52 | 4.51 | 1.60 |
Distributions from net investment income | (.19) | (.20) | (.21) | (.11) | (.12) |
Distributions from net realized gain | (1.37) | - | - | - | - |
Total distributions | (1.56) | (.20) | (.21) | (.11) | (.12) |
Redemption fees added to paid in capitalB | .03 | .02 | .02 | .01 | .01 |
Net asset value, end of period | $ 13.71 | $ 37.55 | $ 22.04 | $ 15.71 | $ 11.30 |
Total ReturnA | (61.84)% | 71.81% | 41.96% | 40.25% | 16.48% |
Ratios to Average Net AssetsC, F | | | | | |
Expenses before reductions | 1.07% | 1.05% | 1.11% | 1.16% | 1.23% |
Expenses net of fee waivers, if any | 1.07% | 1.05% | 1.11% | 1.16% | 1.23% |
Expenses net of all reductions | 1.02% | .99% | 1.01% | 1.07% | 1.18% |
Net investment income (loss) | 1.47%E | .89% | 1.04% | 1.53% | 1.27% |
Supplemental Data | | | | | |
Net assets, end of period (000 omitted) | $ 2,086,196 | $ 6,609,045 | $ 3,005,145 | $ 1,392,223 | $ 604,550 |
Portfolio turnover rateD | 63% | 52% | 66% | 68% | 112% |
A Total returns would have been lower had certain expenses not been reduced during the periods shown. B Calculated based on average shares outstanding during the period. C Fees and expenses of the underlying Fidelity Central Funds are not included in the Fund's expense ratio. The Fund indirectly bears its proportionate share of the expenses of any underlying Fidelity Central Funds. D Amount does not include the portfolio activity of any underlying Fidelity Central Funds. E Investment income per share reflects a special dividend which amounted to $.09 per share. Excluding the special dividend, the ratio of net investment income (loss) to average net assets would have been 1.17%. F Expense ratios reflect operating expenses of the class. Expenses before reductions do not reflect amounts reimbursed by the investment adviser or reductions from brokerage service arrangements or other expense offset arrangements and do not represent the amount paid by the class during periods when reimbursements or reductions occur. Expenses net of fee waivers reflect expenses after reimbursement by the investment adviser but prior to reductions from brokerage service arrangements or other expense offset arrangements. Expenses net of all reductions represent the net expenses paid by the class. |
Financial Highlights - Class K
Year ended October 31, | 2008 H |
Selected Per-Share Data | |
Net asset value, beginning of period | $ 31.99 |
Income from Investment Operations | |
Net investment income (loss) D | .15 G |
Net realized and unrealized gain (loss) | (18.43) |
Total from investment operations | (18.28) |
Redemption fees added to paid in capital D | .01 |
Net asset value, end of period | $ 13.72 |
Total Return B, C | (57.11)% |
Ratios to Average Net Assets E, I | |
Expenses before reductions | .92% A |
Expenses net of fee waivers, if any | .92% A |
Expenses net of all reductions | .87% A |
Net investment income (loss) | 2.02% A, G |
Supplemental Data | |
Net assets, end of period (000 omitted) | $ 87,427 |
Portfolio turnover rate F | 63% |
A Annualized B Total returns for periods of less than one year are not annualized. C Total returns would have been lower had certain expenses not been reduced during the periods shown. D Calculated based on average shares outstanding during the period. E Fees and expenses of the underlying Fidelity Central Funds are not included in the Fund's expense ratio. The Fund indirectly bears its proportionate share of the expenses of any underlying Fidelity Central Funds. F Amount does not include the portfolio activity of any underlying Fidelity Central Funds. G Investment income per share reflects a special dividend which amounted to $.02 per share. Excluding the special dividend, the ratio of net investment income (loss) to average net assets would have been 1.71%. H For the period May 9, 2008 (commencement of sale of shares) to October 31, 2008. I Expense ratios reflect operating expenses of the class. Expenses before reductions do not reflect amounts reimbursed by the investment adviser or reductions from brokerage service arrangements or other expense offset arrangements and do not represent the amount paid by the class during periods when reimbursements or reductions occur. Expense ratios before reductions for start-up periods may not be representative of longer-term operating periods. Expenses net of fee waivers reflect expenses after reimbursement by the investment adviser but prior to reductions from brokerage service arrangements or other expense offset arrangements. Expenses net of all reductions represent the net expenses paid by the class. |
See accompanying notes which are an integral part of the financial statements.
Annual Report
Emerging Markets
Notes to Financial Statements
For the period ended October 31, 2008
1. Organization.
Fidelity Emerging Markets Fund (the Fund) is a fund of Fidelity Investment Trust (the trust) and is authorized to issue an unlimited number of shares. The trust is registered under the Investment Company Act of 1940, as amended (the 1940 Act), as an open-end management investment company organized as a Massachusetts business trust. On January 17, 2008, the Board of Trustees approved the creation of an additional class of shares. The Fund commenced sale of Class K shares and the existing class was designated Emerging Markets on May 9, 2008. The Fund offers Emerging Markets and Class K shares, each of which has equal rights as to assets and voting privileges. Each class has exclusive voting rights with respect to matters that affect that class. Investment income, realized and unrealized capital gains and losses, the common expenses of the Fund, and certain fund-level expense reductions, if any, are allocated on a pro rata basis to each class based on the relative net assets of each class to the total net assets of the Fund. Each class differs with respect to transfer agent fees incurred. Certain expense reductions also differ by class. The Fund's investments in emerging markets can be subject to social, economic, regulatory, and political uncertainties and can be extremely volatile.
2. Investments in Fidelity Central Funds.
The Fund may invest in Fidelity Central Funds, which are open-end investment companies available only to other investment companies and accounts managed by Fidelity Management & Research Company (FMR) and its affiliates. The Fund's Schedule of Investments lists each of the Fidelity Central Funds held as of period end, if any, as an investment of the Fund, but does not include the underlying holdings of each Fidelity Central Fund. As an Investing Fund, the Fund indirectly bears its proportionate share of the expenses of the underlying Fidelity Central Funds.
The Money Market Central Funds seek preservation of capital and current income and are managed by Fidelity Investments Money Management, Inc. (FIMM), an affiliate of FMR.
A complete unaudited list of holdings for each Fidelity Central Fund is available upon request or at the SEC's web site at www.sec.gov. In addition, the financial statements of the Fidelity Central Funds are available on the SEC's web site or upon request.
3. Significant Accounting Policies.
The financial statements have been prepared in conformity with accounting principles generally accepted in the United States of America, which require management to make certain estimates and assumptions at the date of the financial statements. Actual results could differ from those estimates. The following summarizes the significant accounting policies of the Fund:
Security Valuation. Investments are valued as of 4:00 p.m. Eastern time on the last calendar day of the period. Wherever possible, the Fund uses independent pricing services approved by the Board of Trustees to value its investments.
Equity securities, including restricted securities, for which market quotations are readily available, are valued at the last reported sale price or official closing price as reported by an independent pricing service on the primary market or exchange on which they are traded. In the event there were no sales during the day or closing prices are not available, securities are valued at the last quoted bid price. Debt securities, including restricted securities, are valued by independent pricing services or by dealers who make markets in such securities. Pricing services consider yield or price of bonds of comparable quality, coupon, maturity and type as well as dealer supplied prices. Investments in open-end mutual funds, including the Fidelity Central Funds, are valued at their closing net asset value each business day. Short-term securities with remaining maturities of sixty days or less for which quotations are not readily available are valued at amortized cost, which approximates value.
When current market prices or quotations are not readily available or reliable, valuations may be determined in good faith in accordance with procedures adopted by the Board of Trustees. Factors used in determining value may include significant market or security specific events, changes in interest rates and credit quality, and developments in foreign markets which are monitored by evaluating the performance of ADRs, futures contracts and exchange-traded funds. The frequency with which these procedures are used cannot be predicted and may be utilized to a significant extent. The value of securities used for net asset value (NAV) calculation under these procedures may differ from published prices for the same securities.
Foreign Currency. The Fund uses foreign currency contracts to facilitate transactions in foreign-denominated securities. Losses from these transactions may arise from changes in the value of the foreign currency or if the counterparties do not perform under the contracts' terms.
Foreign-denominated assets, including investment securities, and liabilities are translated into U.S. dollars at the exchange rate at period end. Purchases and sales of investment securities, income and dividends received and expenses denominated in foreign currencies are translated into U.S. dollars at the exchange rate in effect on the transaction date.
The effects of exchange rate fluctuations on investments are included with the net realized and unrealized gain (loss) on investment securities. Other foreign currency transactions resulting in realized and unrealized gain (loss) are disclosed separately.
Annual Report
Emerging Markets
Notes to Financial Statements - continued
3. Significant Accounting Policies - continued
Investment Transactions and Income. For financial reporting purposes, the Fund's investment holdings and NAV include trades executed through the end of the last business day of the period. The NAV per share for processing shareholder transactions is calculated as of the close of business of the New York Stock Exchange (NYSE), normally 4:00 p.m. Eastern time and includes trades executed through the end of the prior business day. Gains and losses on securities sold are determined on the basis of identified cost and may include proceeds received from litigation. Dividend income is recorded on the ex-dividend date, except for certain dividends from foreign securities where the ex-dividend date may have passed, which are recorded as soon as the Fund is informed of the ex-dividend date. Non-cash dividends included in dividend income, if any, are recorded at the fair market value of the securities received. Distributions received on securities that represent a return of capital or capital gain are recorded as a reduction of cost of investments and/or as a realized gain. The Fund estimates the components of distributions received that may be considered return of capital distributions or capital gain distributions. Large, non-recurring dividends recognized by the Fund are presented separately on the Statement of Operations as "Special Dividends" and the impact of these dividends is presented in the Financial Highlights. Interest income and distributions from the Fidelity Central Funds are accrued as earned. Interest income includes coupon interest and amortization of premium and accretion of discount on debt securities. Investment income is recorded net of foreign taxes withheld where recovery of such taxes is uncertain.
Expenses. Most expenses of the trust can be directly attributed to a fund. Expenses which cannot be directly attributed are apportioned among each Fund in the trust. Expense estimates are accrued in the period to which they relate and adjustments are made when actual amounts are known.
Income Tax Information and Distributions to Shareholders. Each year, the Fund intends to qualify as a regulated investment company by distributing substantially all of its taxable income and realized gains under Subchapter M of the Internal Revenue Code and filing its U.S. federal tax return. As a result, no provision for income taxes is required. The Fund is subject to the provisions of FASB Interpretation No. 48, Accounting for Uncertainties in Income Taxes (FIN 48). FIN 48 sets forth a minimum threshold for financial statement recognition of the benefit of a tax position taken or expected to be taken in a tax return. The implementation of FIN 48 did not result in any unrecognized tax benefits in the accompanying financial statements. Each of the Fund's federal tax returns for the prior three fiscal years remains subject to examination by the Internal Revenue Service (IRS). Foreign taxes are provided for based on the Fund's understanding of the tax rules and rates that exist in the foreign markets in which it invests.
Distributions are recorded on the ex-dividend date. Income dividends and capital gain distributions are declared separately for each class. Income and capital gain distributions are determined in accordance with income tax regulations, which may differ from generally accepted accounting principles. In addition, the Fund will claim a portion of the payment made to redeeming shareholders as a distribution for income tax purposes.
Capital accounts within the financial statements are adjusted for permanent book-tax differences. These adjustments have no impact on net assets or the results of operations. Temporary book-tax differences will reverse in a subsequent period.
Book-tax differences are primarily due to foreign currency transactions, certain foreign taxes, passive foreign investment companies (PFIC), deferred trustees compensation, capital loss carryforwards and losses deferred due to wash sales.
The tax-basis components of distributable earnings and the federal tax cost as of period end were as follows:
Unrealized appreciation | $ 211,332,000 |
Unrealized depreciation | (1,173,383,176) |
Net unrealized appreciation (depreciation) | (962,051,176) |
Undistributed ordinary income | 31,514,547 |
Capital loss carryforward | (515,443,831) |
| |
Cost for federal income tax purposes | $ 3,163,760,393 |
The tax character of distributions paid was as follows:
| October 31, 2008 | October 31, 2007 |
Ordinary Income | $ 41,187,374 | $ 28,224,601 |
Long-term Capital Gains | 238,170,447 | - |
Total | $ 279,357,821 | $ 28,224,601 |
Short-Term Trading (Redemption) Fees. Shares held in the Fund less than 90 days are subject to a redemption fee equal to 1.50% of the proceeds of the redeemed shares. All redemption fees, including any estimated redemption fees paid by FMR, are retained by the Fund and accounted for as an addition to paid in capital.
New Accounting Pronouncement. In September 2006, Statement of Financial Accounting Standards No. 157, Fair Value Measurements (SFAS 157), was issued and is effective for fiscal years beginning after November 15, 2007. SFAS 157 defines fair value, establishes a framework for measuring fair value and results in expanded disclosures about fair value measurements.
Annual Report
4. Operating Policies.
Repurchase Agreements. FMR has received an Exemptive Order from the Securities and Exchange Commission (the SEC) which permits the Fund and other affiliated entities of FMR to transfer uninvested cash balances into joint trading accounts which are then invested in repurchase agreements. The Fund may also invest directly with institutions in repurchase agreements. Repurchase agreements are collateralized by government or non-government securities. Upon settlement date, collateral is held in segregated accounts with custodian banks and may be obtained in the event of a default of the counterparty. The Fund monitors, on a daily basis, the value of the collateral to ensure it is at least equal to the principal amount of the repurchase agreement (including accrued interest). In the event of a default by the counterparty, realization of the collateral proceeds could be delayed, during which time the value of the collateral may decline.
Restricted Securities. The Fund may invest in securities that are subject to legal or contractual restrictions on resale. These securities generally may be resold in transactions exempt from registration or to the public if the securities are registered. Disposal of these securities may involve time-consuming negotiations and expense, and prompt sale at an acceptable price may be difficult. Information regarding restricted securities is included at the end of the Fund's Schedule of Investments.
5. Purchases and Sales of Investments.
Purchases and sales of securities, other than short-term securities, aggregated $3,288,862,920 and $3,596,737,360, respectively.
6. Fees and Other Transactions with Affiliates.
Management Fee. FMR and its affiliates provide the Fund with investment management related services for which the Fund pays a monthly management fee. The management fee is the sum of an individual fund fee rate that is based on an annual rate of .45% of the Fund's average net assets and a group fee rate that averaged .26% during the period. The group fee rate is based upon the average net assets of all the mutual funds advised by FMR. The group fee rate decreases as assets under management increase and increases as assets under management decrease. For the period, the total annual management fee rate was .71% of the Fund's average net assets.
Transfer Agent Fees. Fidelity Investments Institutional Operations Company, Inc. (FIIOC), an affiliate of FMR, is the transfer, dividend disbursing and shareholder servicing agent for each class of the Fund. FIIOC receives account fees and asset-based fees that vary according to the account size and type of account of the shareholders of Emerging Markets and asset-based fees of .05% of average net assets for Class K. FIIOC pays for typesetting, printing and mailing of shareholder reports, except proxy statements. For the period, the transfer agent fees for Emerging Markets were equivalent to an annualized rate of .22% of average net assets. Prior to January 1, 2008, Fidelity Service Company, Inc. (FSC), also an affiliate of FMR, was the transfer agent for Emerging Markets. For the period, each class paid the following transfer agent fees:
| Amount |
Emerging Markets | $ 11,874,974 |
Class K | 4,842 |
Total | $ 11,879,816 |
Accounting and Security Lending Fees. FSC maintains the Fund's accounting records. The accounting fee is based on the level of average net assets for the month. Under a separate contract, FSC administers the security lending program. The security lending fee is based on the number and duration of lending transactions.
Brokerage Commissions. The Fund placed a portion of its portfolio transactions with brokerage firms which are affiliates of the investment adviser. The commissions paid to these affiliated firms were $485 for the period.
Interfund Lending Program. Pursuant to an Exemptive Order issued by the SEC, the Fund, along with other registered investment companies having management contracts with FMR, may participate in an interfund lending program. This program provides an alternative credit facility allowing the funds to borrow from, or lend money to, other participating affiliated funds. At period end, there were no interfund loans outstanding. The Fund's activity in this program during the period for which loans were outstanding was as follows:
Borrower or Lender | Average Daily
Loan Balance | Weighted Average Interest Rate | Interest
Expense |
Borrower | $ 4,222,000 | 4.77% | $ 1,119 |
7. Committed Line of Credit.
The Fund participates with other funds managed by FMR in a $4.2 billion credit facility (the "line of credit") to be utilized for temporary or emergency purposes to fund shareholder redemptions or for other short-term liquidity purposes. The Fund has agreed to pay commitment fees on its pro rata portion of the line of credit, which amounted to $11,091 and is reflected in Miscellaneous Expense on the Statement of Operations. During the period, there were no borrowings on this line of credit.
Annual Report
Emerging Markets
Notes to Financial Statements - continued
8. Security Lending.
The Fund lends portfolio securities from time to time in order to earn additional income. On the settlement date of the loan, the Fund receives collateral (in the form of U.S. Treasury obligations, letters of credit and/or cash) against the loaned securities and maintains collateral in an amount not less than 100% of the market value of the loaned securities during the period of the loan. The market value of the loaned securities is determined at the close of business of the Fund and any additional required collateral is delivered to the Fund on the next business day. If the reasons, a fund could experience delays and costs in recovering the securities loaned or in gaining access to the collateral. Any cash collateral received is invested in the Fidelity Securities Lending Cash Central Fund. The value of loaned securities and cash collateral at period end are disclosed on the Fund's Statement of Assets and Liabilities. Security lending income represents the income earned on investing cash collateral, less fees and expenses associated with the loan, plus any premium payments that may be received on the loan of certain types of securities. Security lending income is presented in the Statement of Operations as a component of income from Fidelity Central Funds.
9. Bank Borrowings.
The Fund is permitted to have bank borrowings for temporary or emergency purposes to fund shareholder redemptions. The Fund has established borrowing arrangements with certain banks. The interest rate on the borrowings is the bank's base rate, as revised from time to time. The average daily loan balance during the period for which loans were outstanding amounted to $5,081,000. The weighted average interest rate was 4.50%. The interest expense amounted to $635 under the bank borrowing program. At period end, there were no bank borrowings outstanding.
10. Expense Reductions.
FMR voluntarily agreed to reimburse a portion of Emerging Market's operating expenses. During the period, this reimbursement reduced the class' expenses by $12,763.
Many of the brokers with whom FMR places trades on behalf of the Fund provided services to the Fund in addition to trade execution. These services included payments of certain expenses on behalf of the Fund totaling $2,603,656 for the period. In addition, through arrangements with the Fund's custodian and each class' transfer agent, credits realized as a result of uninvested cash balances were used to reduce the Fund's expenses. During the period, these credits reduced the Fund's custody expenses by $2,580. During the period, credits reduced each class' transfer agent expense as noted in the table below.
| Transfer Agent
expense reduction |
Emerging Markets | $ 116,365 |
Class K | 12 |
| $ 116,377 |
11. Other.
The Fund's organizational documents provide former and current trustees and officers with a limited indemnification against liabilities arising in connection with the performance of their duties to the Fund. In the normal course of business, the Fund may also enter into contracts that provide general indemnifications. The Fund's maximum exposure under these arrangements is unknown as this would be dependent on future claims that may be made against the Fund. The risk of material loss from such claims is considered remote.
In December 2006, the Independent Trustees, with the assistance of independent counsel, completed an investigation regarding gifts, gratuities and business entertainment provided by certain brokers to certain individuals who were employed on FMR's domestic equity trading desk during the period 2002 to 2004. The Independent Trustees and FMR agreed that, despite the absence of proof that the Fidelity mutual funds experienced diminished execution quality as a result of the improper receipt of gifts and business entertainment, the conduct at issue was serious and was worthy of redress. Accordingly, the Independent Trustees requested, and FMR agreed to make, a payment of $42 million plus accrued interest, which equaled approximately $7.3 million, to certain Fidelity mutual funds.
In March 2008, the Trustees approved a method for allocating this payment among the funds and, in total, FMR paid the fund $477, which is recorded in the accompanying Statement of Operations.
In a related administrative order dated March 5, 2008, the U.S. Securities and Exchange Commission ("SEC") announced a settlement with FMR and FMR Co., Inc. (an affiliate of FMR) involving the SEC's regulatory rules for investment advisers and the improper receipt of gifts, gratuities and business entertainment. Without admitting or denying the SEC's findings, FMR agreed to pay an $8 million civil penalty to the United States Treasury.
Annual Report
12. Distributions to Shareholders.
Distributions to shareholders of each class were as follows:
Years ended October 31, | 2008 | 2007 |
From net investment income | | |
Emerging Markets | $ 34,024,353 | $ 28,224,601 |
From net realized gain | | |
Emerging Markets | $ 245,333,468 | $ - |
13. Share Transactions.
Transactions for each class of shares were as follows:
| Shares | Dollars |
Years ended October 31, | 2008 A | 2007 | 2008 A | 2007 |
Emerging Markets | | | | |
Shares sold | 88,151,350 | 96,979,878 | $ 2,616,256,871 | $ 2,766,036,681 |
Conversion to Class K | (6,470,724) | - | (122,161,593) | - |
Reinvestment of distributions | 7,825,864 | 1,154,965 | 270,227,076 | 27,314,929 |
Shares redeemed | (113,371,134) | (58,453,895) | (2,997,083,479) | (1,559,669,286) |
Net increase (decrease) | (23,864,644) | 39,680,948 | $ (232,761,125) | $ 1,233,682,324 |
Class K | | | | |
Shares sold | 379,643 | - | $ 5,848,087 | $ - |
Conversion to Class K | 6,466,184 | - | 122,161,593 | - |
Shares redeemed | (475,589) | - | (7,670,068) | - |
Net increase (decrease) | 6,370,238 | - | $ 120,339,612 | $ - |
A Share transactions for Class K are for the period May 9, 2008 (commencement of sale of shares) to October 31, 2008.
Annual Report
As a shareholder of a Fund, you incur two types of costs: (1) transaction costs, including redemption fees, and (2) ongoing costs, including management fees and other Fund expenses. This Example is intended to help you understand your ongoing costs (in dollars) of investing in the Funds and to compare these costs with the ongoing costs of investing in other mutual funds.
The Example is based on an investment of $1,000 invested at the beginning of the period and held for the entire period (May 1, 2008 to October 31, 2008).
Actual Expenses
The first line of the accompanying table for each fund provides information about actual account values and actual expenses. You may use the information in this line, together with the amount you invested, to estimate the expenses that you paid over the period. Simply divide your account value by $1,000.00 (for example, an $8,600 account value divided by $1,000.00 = 8.6), then multiply the result by the number in the first line for a fund under the heading entitled "Expenses Paid During Period" to estimate the expenses you paid on your account during this period. A small balance maintenance fee of $12.00 that is charged once a year may apply for certain accounts with a value of less than $2,000. This fee is not included in the table below. If it was, the estimate of expenses you paid during the period would be higher, and your ending account value lower, by this amount. In addition, each Fund, as a shareholder in the underlying Fidelity Central Funds, will indirectly bear its pro rata share of the fees and expenses incurred by the underlying Fidelity Central Funds. These fees and expenses are not included in the Fund's annualized expense ratio used to calculate the expense estimate in the table below.
Hypothetical Example for Comparison Purposes
The second line of the accompanying table for each fund provides information about hypothetical account values and hypothetical expenses based on a fund's actual expense ratio and an assumed rate of return of 5% per year before expenses, which is not the Fund's actual return. The hypothetical account values and expenses may not be used to estimate the actual ending account balance or expenses you paid for the period. You may use this information to compare the ongoing costs of investing in the Fund and other funds. To do so, compare this 5% hypothetical example with the 5% hypothetical examples that appear in the shareholder reports of the other funds. A small balance maintenance fee of $12.00 that is charged once a year may apply for certain accounts with a value of less than $2,000. This fee is not included in the table below. If it was, the estimate of expenses you paid during the period would be higher, and your ending account value lower, by this amount. In addition, each Fund, as a shareholder in the underlying Fidelity Central Funds, will indirectly bear its pro rata share of the fees and expenses incurred by the underlying Fidelity Central Funds. These fees and expenses are not included in the Fund's annualized expense ratio used to calculate the expense estimate in the table below.
Please note that the expenses shown in the table are meant to highlight your ongoing costs only and do not reflect any transaction costs. Therefore, the second line of the table is useful in comparing ongoing costs only, and will not help you determine the relative total costs of owning different funds. In addition, if these transactional costs were included, your costs would have been higher.
| Annualized Expense Ratio | Beginning
Account Value
May 1, 2008 | Ending
Account Value
October 31, 2008 | Expenses Paid
During Period*
May 1, 2008
to October 31, 2008 |
Europe | .99% | | | |
Actual | | $ 1,000.00 | $ 594.30 | $ 3.97 |
Hypothetical A | | $ 1,000.00 | $ 1,020.16 | $ 5.03 |
Europe Capital Appreciation | 1.15% | | | |
Actual | | $ 1,000.00 | $ 572.20 | $ 4.54 |
Hypothetical A | | $ 1,000.00 | $ 1,019.36 | $ 5.84 |
Japan | 1.06% | | | |
Actual | | $ 1,000.00 | $ 634.60 | $ 4.36 |
Hypothetical A | | $ 1,000.00 | $ 1,019.81 | $ 5.38 |
Japan Smaller Companies | 1.05% | | | |
Actual | | $ 1,000.00 | $ 686.60 | $ 4.45 |
Hypothetical A | | $ 1,000.00 | $ 1,019.86 | $ 5.33 |
Latin America | 1.03% | | | |
Actual | | $ 1,000.00 | $ 433.40 | $ 3.71 |
Hypothetical A | | $ 1,000.00 | $ 1,019.96 | $ 5.23 |
Nordic | 1.10% | | | |
Actual | | $ 1,000.00 | $ 483.50 | $ 4.10 |
Hypothetical A | | $ 1,000.00 | $ 1,019.61 | $ 5.58 |
Pacific Basin | 1.14% | | | |
Actual | | $ 1,000.00 | $ 482.00 | $ 4.25 |
Hypothetical A | | $ 1,000.00 | $ 1,019.41 | $ 5.79 |
Southeast Asia | 1.25% | | | |
Actual | | $ 1,000.00 | $ 539.70 | $ 4.84 |
Hypothetical A | | $ 1,000.00 | $ 1,018.85 | $ 6.34 |
A 5% return per year before expenses
* Expenses are equal to each Fund's annualized expense ratio, multiplied by the average account value over the period, multiplied by 184/366 (to reflect the one-half year period).
Annual Report
Europe
Performance: The Bottom Line
Average annual total return reflects the change in the value of an investment, assuming reinvestment of the fund's dividend income and capital gains (the profits earned upon the sale of securities that have grown in value, if any) and assuming a constant rate of performance each year. The $10,000 table and the fund's returns do not reflect the deduction of taxes that a shareholder would pay on fund distributions or the redemption of fund shares. During periods of reimbursement by Fidelity, a fund's total returns will be greater than it would be had the reimbursement not occurred. How a fund did yesterday is no guarantee of how it will do tomorrow.
Average Annual Total Returns
Periods ended October 31, 2008 | Past 1
year | Past 5
years | Past 10
years |
Fidelity Europe Fund | -46.03% | 6.51% | 3.09% |
$10,000 Over 10 Years
Let's say hypothetically that $10,000 was invested in Fidelity Europe Fund on October 31, 1998. The chart shows how the value of your investment would have changed, and also shows how the MSCI Europe Index performed over the same period.
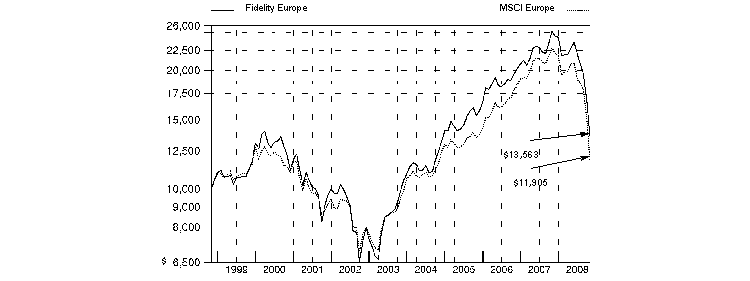
Annual Report
Europe
Management's Discussion of Fund Performance
Comments from Melissa Reilly, who became Portfolio Manager of Fidelity® Europe Fund on November 18, 2008, after the period covered in this report
In a dramatic reversal of what had been a multiyear global growth story, international stocks fell long and hard during the 12 months ending October 31, 2008, especially so during the latter stages of the period and mostly as a result of fallout from the financial crisis that emanated from the United States. The viral spread of this financial contagion - which began in the U.S. subprime mortgage market, then seized up the credit markets, hobbled major financial institutions and eventually slowed economic growth worldwide - left virtually no corner of the globe untouched. Developed international equity markets - as gauged by the MSCI® Europe, Australasia, Far East (EAFE®) Index, which monitors established markets outside the U.S. and Canada - fell 46.54%, while the Standard & Poor's 500SM Index, a measure of U.S. stocks, dropped 36.10%. Among countries constituting at least 1% of the EAFE index, Switzerland had the "least worst" showing, falling roughly 32%, followed by Japan, where stocks slid by around 37%. Meanwhile, the weakest overall performance came from Belgium, where stocks slipped by nearly 70%. In the United Kingdom, the largest component of the index, equities were down almost 48%. Emerging markets were the weakest performers among the global economies, declining 56.22% as measured by the MSCI Emerging Markets Index.
For the 12 months ending October 31, 2008, the fund was down 46.03%, outperforming the MSCI Europe Index, which fell 47.89%. Stock selection and an underweighted positioning in financials helped. Stock picking in materials and health care also was beneficial, as was a modest cash position. On the downside, stock and market selection in telecommunication services and consumer staples hurt, as did our stock picks in utilities. Not owning Fortis, a multinational Belgian bank in the index caught by the liquidity crunch, turned out to be a good decision. Syngenta, a Swiss agricultural science firm, supported results as its stock withstood the market turmoil better than the index. Bayer AG, the German materials and pharmaceutical corporation, also helped the fund's relative return. During a time when the stable earnings of health care companies proved attractive, pharmaceutical giant Roche Holding in Switzerland and Denmark's Novo Nordisk, which specializes in diabetes treatments, both supported results. Not owning benchmark constituent Volkswagen, the German automaker whose share price rose for technical market reasons, hurt the most. Telenor, a Norwegian telecom firm, and Raiffeisen International Bank-Holding of Austria both underperformed because of concerns about their exposures to emerging markets. Elsewhere, Hexagon, a Swedish engineering company, performed poorly because of deteriorating prospects in the automotive industry, a prime customer for Hexagon's precision measurement instruments.
The views expressed above reflect those of the portfolio manager(s) only through the end of the period as stated on the cover of this report and do not necessarily represent the views of Fidelity or any other person in the Fidelity organization. Any such views are subject to change at any time based upon market or other conditions and Fidelity disclaims any responsibility to update such views. These views may not be relied on as investment advice and, because investment decisions for a Fidelity fund are based on numerous factors, may not be relied on as an indication of trading intent on behalf of any Fidelity fund.
Annual Report
Europe
Investment Changes (Unaudited)
Geographic Diversification (% of fund's net assets) |
As of October 31, 2008 |
| Switzerland | 29.6% | |
| United Kingdom | 23.8% | |
| France | 11.6% | |
| Germany | 11.0% | |
| Sweden | 6.8% | |
| Spain | 4.3% | |
| Denmark | 3.6% | |
| Italy | 2.4% | |
| United States of America | 2.4% | |
| Other | 4.5% | |

Percentages are adjusted for the effect of futures contracts, if applicable. |
|
As of April 30, 2008 |
| United Kingdom | 24.4% | |
| Switzerland | 19.0% | |
| Germany | 16.6% | |
| France | 9.3% | |
| Sweden | 5.9% | |
| Spain | 4.9% | |
| Norway | 3.2% | |
| Russia | 3.1% | |
| United States of America | 2.4% | |
| Other | 11.2% | |

Percentages are adjusted for the effect of futures contracts, if applicable. |
Asset Allocation |
| % of fund's
net assets | % of fund's net assets
6 months ago |
Stocks | 97.6 | 97.6 |
Short-Term Investments and Net Other Assets | 2.4 | 2.4 |
Top Ten Stocks as of October 31, 2008 |
| % of fund's
net assets | % of fund's net assets
6 months ago |
Roche Holding AG (participation certificate) (Switzerland, Pharmaceuticals) | 5.5 | 2.3 |
Nestle SA (Reg.) (Switzerland, Food Products) | 5.3 | 1.8 |
Novartis AG (Reg.) (Switzerland, Pharmaceuticals) | 4.8 | 0.0 |
Tesco PLC (United Kingdom, Food & Staples Retailing) | 4.0 | 4.4 |
H&M Hennes & Mauritz AB (B Shares) (Sweden, Specialty Retail) | 3.5 | 2.8 |
Novo Nordisk AS Series B (Denmark, Pharmaceuticals) | 3.2 | 0.0 |
E.ON AG (Germany, Electric Utilities) | 3.1 | 2.6 |
Essilor International SA (France, Health Care Equipment & Supplies) | 3.0 | 1.5 |
Linde AG (Germany, Chemicals) | 2.9 | 3.8 |
Vodafone Group PLC (United Kingdom, Wireless Telecommunication Services) | 2.8 | 1.7 |
| 38.1 | |
Market Sectors as of October 31, 2008 |
| % of fund's net assets | % of fund's net assets 6 months ago |
Health Care | 20.0 | 6.1 |
Financials | 14.5 | 12.0 |
Consumer Staples | 12.0 | 11.8 |
Industrials | 11.6 | 14.6 |
Energy | 11.2 | 14.2 |
Utilities | 7.2 | 7.7 |
Materials | 6.7 | 16.8 |
Telecommunication Services | 6.0 | 6.7 |
Consumer Discretionary | 5.4 | 4.6 |
Information Technology | 3.0 | 3.1 |
Annual Report
Europe
Investments October 31, 2008
Showing Percentage of Net Assets
Common Stocks - 97.6% |
| Shares | | Value |
Austria - 0.2% |
Raiffeisen International Bank-Holding AG (d) | 179,700 | | $ 5,654,687 |
Czech Republic - 0.4% |
Ceske Energeticke Zavody AS | 288,300 | | 12,475,809 |
Denmark - 3.6% |
Novo Nordisk AS Series B | 1,643,100 | | 88,074,620 |
Vestas Wind Systems AS (a) | 295,800 | | 12,115,883 |
TOTAL DENMARK | | 100,190,503 |
Finland - 1.0% |
Nokia Corp. | 1,775,150 | | 27,192,089 |
France - 11.6% |
AXA SA | 1,179,800 | | 22,538,948 |
BNP Paribas SA | 459,100 | | 33,147,616 |
Electricite de France | 292,100 | | 17,550,393 |
Essilor International SA | 1,838,600 | | 82,475,639 |
GDF Suez | 1,118,200 | | 49,983,053 |
L'Air Liquide SA | 572,620 | | 49,414,289 |
Societe Generale Series A | 332,100 | | 18,101,112 |
Total SA Series B | 631,300 | | 34,729,981 |
Veolia Environnement | 443,700 | | 10,995,602 |
TOTAL FRANCE | | 318,936,633 |
Germany - 11.0% |
Allianz AG (Reg.) | 274,800 | | 20,565,148 |
Bayer AG | 261,000 | | 14,529,790 |
Deutsche Boerse AG | 116,400 | | 9,307,049 |
E.ON AG | 2,239,700 | | 85,683,734 |
Linde AG | 955,100 | | 80,211,000 |
Muenchener Rueckversicherungs-Gesellschaft AG (Reg.) | 100,700 | | 13,365,408 |
RWE AG | 307,600 | | 25,705,834 |
Wincor Nixdorf AG | 1,233,000 | | 53,945,635 |
TOTAL GERMANY | | 303,313,598 |
Italy - 2.4% |
ENI SpA | 1,377,800 | | 32,885,531 |
Tod's SpA | 668,300 | | 27,925,113 |
UniCredit SpA | 2,079,300 | | 5,087,474 |
TOTAL ITALY | | 65,898,118 |
Norway - 1.7% |
StatoilHydro ASA | 842,800 | | 16,951,758 |
Telenor ASA | 5,061,700 | | 30,203,133 |
TOTAL NORWAY | | 47,154,891 |
Russia - 1.2% |
OAO Gazprom sponsored ADR | 1,560,200 | | 31,906,090 |
|
| Shares | | Value |
Spain - 4.3% |
Banco Bilbao Vizcaya Argentaria SA | 2,011,300 | | $ 23,343,785 |
Banco Santander SA | 3,411,100 | | 36,891,585 |
Telefonica SA | 3,082,000 | | 57,063,035 |
TOTAL SPAIN | | 117,298,405 |
Sweden - 6.8% |
Elekta AB (B Shares) (d) | 3,421,800 | | 43,264,255 |
H&M Hennes & Mauritz AB (B Shares) (d) | 2,655,000 | | 95,188,354 |
Hexagon AB (B Shares) | 4,326,475 | | 28,333,740 |
HEXPOL AB (B Shares) | 291,621 | | 1,170,117 |
Modern Times Group MTG AB (B Shares) | 275,000 | | 5,899,796 |
Nordea Bank AB | 1,501,300 | | 12,030,797 |
TOTAL SWEDEN | | 185,887,059 |
Switzerland - 29.6% |
ABB Ltd. (Reg.) | 3,870,547 | | 50,774,916 |
Compagnie Financiere Richemont Series A | 938,961 | | 19,972,043 |
Credit Suisse Group (Reg.) | 988,876 | | 36,969,932 |
EFG International | 752,160 | | 16,188,722 |
Geberit AG (Reg.) | 387,690 | | 40,270,147 |
Julius Baer Holding AG | 1,140,934 | | 44,612,577 |
Nestle SA (Reg.) | 3,761,846 | | 146,255,348 |
Novartis AG (Reg.) | 2,617,110 | | 132,810,678 |
Roche Holding AG (participation certificate) | 992,952 | | 151,816,295 |
Schindler Holding AG (participation certificate) | 1,112,846 | | 48,166,665 |
SGS Societe Generale de Surveillance Holding SA (Reg.) | 56,293 | | 55,410,695 |
Syngenta AG (Switzerland) | 299,683 | | 56,008,651 |
Zurich Financial Services AG (Reg.) | 73,313 | | 14,870,363 |
TOTAL SWITZERLAND | | 814,127,032 |
United Kingdom - 23.8% |
AstraZeneca PLC (United Kingdom) | 906,900 | | 38,428,311 |
BG Group PLC | 2,687,500 | | 39,511,988 |
BP PLC | 9,128,600 | | 74,402,441 |
British American Tobacco PLC (United Kingdom) | 1,046,400 | | 28,698,482 |
Capita Group PLC | 3,916,116 | | 40,460,163 |
HSBC Holdings PLC (United Kingdom) (Reg.) | 6,446,200 | | 76,340,764 |
Imperial Tobacco Group PLC | 1,034,100 | | 27,712,034 |
Royal Dutch Shell PLC Class A (Netherlands) | 2,725,100 | | 75,531,453 |
Serco Group PLC | 6,516,000 | | 38,853,853 |
Standard Chartered PLC (United Kingdom) | 456,900 | | 7,550,268 |
Tesco PLC | 20,286,973 | | 111,140,869 |
Common Stocks - continued |
| Shares | | Value |
United Kingdom - continued |
Unilever PLC | 881,600 | | $ 19,803,434 |
Vodafone Group PLC | 40,479,600 | | 77,861,645 |
TOTAL UNITED KINGDOM | | 656,295,705 |
TOTAL COMMON STOCKS (Cost $3,537,732,582) | 2,686,330,619 |
Money Market Funds - 4.7% |
| | | |
Fidelity Cash Central Fund, 1.81% (b) | 82,162,995 | | 82,162,995 |
Fidelity Securities Lending Cash Central Fund, 2.67% (b)(c) | 45,373,050 | | 45,373,050 |
TOTAL MONEY MARKET FUNDS (Cost $127,536,045) | 127,536,045 |
TOTAL INVESTMENT
PORTFOLIO - 102.3% (Cost $3,665,268,627) | 2,813,866,664 |
NET OTHER ASSETS - (2.3)% | | (62,094,724) |
NET ASSETS - 100% | $ 2,751,771,940 |
Legend |
(a) Non-income producing |
(b) Affiliated fund that is available only to investment companies and other accounts managed by Fidelity Investments. The rate quoted is the annualized seven-day yield of the fund at period end. A complete unaudited listing of the fund's holdings as of its most recent quarter end is available upon request. |
(c) Investment made with cash collateral received from securities on loan. |
(d) Security or a portion of the security is on loan at period end. |
Affiliated Central Funds |
Information regarding fiscal year to date income earned by the Fund from investments in Fidelity Central Funds is as follows: |
Fund | Income earned |
Fidelity Cash Central Fund | $ 4,168,648 |
Fidelity Securities Lending Cash Central Fund | 5,565,334 |
Total | $ 9,733,982 |
Income Tax Information |
At October 31, 2008, the fund had a capital loss carryforward of approximately $413,142,102 all of which will expire on October 31, 2016. |
See accompanying notes which are an integral part of the financial statements.
Annual Report
Europe
Financial Statements
Statement of Assets and Liabilities
| October 31, 2008 |
| | |
Assets | | |
Investment in securities, at value (including securities loaned of $43,521,924) -
See accompanying schedule: Unaffiliated issuers
(cost $3,537,732,582) | $ 2,686,330,619 | |
Fidelity Central Funds
(cost $127,536,045) | 127,536,045 | |
Total Investments
(cost $3,665,268,627) | | $ 2,813,866,664 |
Receivable for investments sold | | 19,061,488 |
Receivable for fund shares sold | | 582,265 |
Dividends receivable | | 4,744,613 |
Distributions receivable from Fidelity Central Funds | | 263,127 |
Prepaid expenses | | 1,366 |
Other receivables | | 662,477 |
Total assets | | 2,839,182,000 |
| | |
Liabilities | | |
Payable to custodian bank | $ 9,796,601 | |
Payable for investments purchased | 27,629,125 | |
Payable for fund shares redeemed | 1,757,353 | |
Accrued management fee | 1,715,232 | |
Other affiliated payables | 842,546 | |
Other payables and accrued expenses | 296,153 | |
Collateral on securities loaned, at value | 45,373,050 | |
Total liabilities | | 87,410,060 |
| | |
Net Assets | | $ 2,751,771,940 |
Net Assets consist of: | | |
Paid in capital | | $ 3,971,263,163 |
Undistributed net investment income | | 79,011,426 |
Accumulated undistributed net realized gain (loss) on investments and foreign currency transactions | | (446,811,591) |
Net unrealized appreciation (depreciation) on investments and assets and liabilities in foreign currencies | | (851,691,058) |
Net Assets, for 116,745,503 shares outstanding | | $ 2,751,771,940 |
Net Asset Value, offering price and redemption price per share ($2,751,771,940 ÷ 116,745,503 shares) | | $ 23.57 |
Statement of Operations
| Year ended October 31, 2008 |
| | |
Investment Income | | |
Dividends | | $ 130,634,470 |
Interest | | 159,967 |
Income from Fidelity Central Funds (including $5,565,334 from security lending) | | 9,733,982 |
| | 140,528,419 |
Less foreign taxes withheld | | (13,845,171) |
Total income | | 126,683,248 |
| | |
Expenses | | |
Management fee
Basic fee | $ 32,384,301 | |
Performance adjustment | 287,283 | |
Transfer agent fees | 10,482,644 | |
Accounting and security lending fees | 1,545,194 | |
Custodian fees and expenses | 735,302 | |
Independent trustees' compensation | 19,577 | |
Registration fees | 58,110 | |
Audit | 80,099 | |
Legal | 24,249 | |
Interest | 4,042 | |
Miscellaneous | 197,766 | |
Total expenses before reductions | 45,818,567 | |
Expense reductions | (2,353,773) | 43,464,794 |
Net investment income (loss) | | 83,218,454 |
Realized and Unrealized Gain (Loss) Net realized gain (loss) on: | | |
Investment securities: | | |
Unaffiliated issuers | (440,998,719) | |
Foreign currency transactions | (1,007,635) | |
Total net realized gain (loss) | | (442,006,354) |
Change in net unrealized appreciation (depreciation) on: Investment securities | (2,075,914,854) | |
Assets and liabilities in foreign currencies | (464,062) | |
Total change in net unrealized appreciation (depreciation) | | (2,076,378,916) |
Net gain (loss) | | (2,518,385,270) |
Net increase (decrease) in net assets resulting from operations | | $ (2,435,166,816) |
See accompanying notes which are an integral part of the financial statements.
Annual Report
Europe
Financial Statements - continued
Statement of Changes in Net Assets
| Year ended
October 31,
2008 | Year ended
October 31,
2007 |
Increase (Decrease) in Net Assets | | |
Operations | | |
Net investment income (loss) | $ 83,218,454 | $ 78,249,764 |
Net realized gain (loss) | (442,006,354) | 390,312,328 |
Change in net unrealized appreciation (depreciation) | (2,076,378,916) | 726,840,862 |
Net increase (decrease) in net assets resulting from operations | (2,435,166,816) | 1,195,402,954 |
Distributions to shareholders from net investment income | (75,717,658) | (44,655,948) |
Distributions to shareholders from net realized gain | (358,785,158) | (492,200,801) |
Total distributions | (434,502,816) | (536,856,749) |
Share transactions
Proceeds from sales of shares | 375,372,349 | 914,445,282 |
Reinvestment of distributions | 429,703,172 | 530,000,847 |
Cost of shares redeemed | (648,311,121) | (671,683,034) |
Net increase (decrease) in net assets resulting from share transactions | 156,764,400 | 772,763,095 |
Redemption fees | 54,655 | 50,173 |
Total increase (decrease) in net assets | (2,712,850,577) | 1,431,359,473 |
| | |
Net Assets | | |
Beginning of period | 5,464,622,517 | 4,033,263,044 |
End of period (including undistributed net investment income of $79,011,426 and undistributed net investment income of $77,915,917, respectively) | $ 2,751,771,940 | $ 5,464,622,517 |
Other Information Shares | | |
Sold | 9,585,310 | 22,065,177 |
Issued in reinvestment of distributions | 10,002,402 | 13,802,106 |
Redeemed | (17,978,503) | (16,050,210) |
Net increase (decrease) | 1,609,209 | 19,817,073 |
Financial Highlights
Years ended October 31, | 2008 | 2007 | 2006 | 2005 | 2004 |
Selected Per-Share Data | | | | | |
Net asset value, beginning of period | $ 47.46 | $ 42.31 | $ 37.26 | $ 30.42 | $ 24.37 |
Income from Investment Operations | | | | | |
Net investment income (loss) C | .68 | .69 | .58 | .33 | .09 |
Net realized and unrealized gain (loss) | (20.84) | 9.99 | 8.74 | 6.68 | 6.25 |
Total from investment operations | (20.16) | 10.68 | 9.32 | 7.01 | 6.34 |
Distributions from net investment income | (.65) | (.46) | (.30) | (.09) | (.29) |
Distributions from net realized gain | (3.08) | (5.07) | (3.97) | (.08) | - |
Total distributions | (3.73) | (5.53) | (4.27) | (.17) | (.29) |
Redemption fees added to paid in capitalC, G | - | - | - | - | - |
Net asset value, end of period | $ 23.57 | $ 47.46 | $ 42.31 | $ 37.26 | $ 30.42 |
Total ReturnA, B | (46.03)% | 28.33% | 27.40% | 23.12% | 26.20% |
Ratios to Average Net AssetsD, F | | | | | |
Expenses before reductions | 1.00% | 1.06% | 1.16% | 1.15% | 1.11% |
Expenses net of fee waivers, if any | 1.00% | 1.06% | 1.16% | 1.15% | 1.11% |
Expenses net of all reductions | .95% | 1.01% | 1.05% | 1.07% | 1.05% |
Net investment income (loss) | 1.82% | 1.65% | 1.48% | .95% | .32% |
Supplemental Data | | | | | |
Net assets, end of period (000 omitted) | $ 2,751,772 | $ 5,464,623 | $ 4,033,263 | $ 2,547,812 | $ 1,845,440 |
Portfolio turnover rateE | 100% | 100% | 127% | 99% | 106% |
A Total returns would have been lower had certain expenses not been reduced during the periods shown. B Total returns do not include the effect of the former contingent deferred sales charge. C Calculated based on average shares outstanding during the period. D Fees and expenses of the underlying Fidelity Central Funds are not included in the Fund's expense ratio. The Fund indirectly bears its proportionate share of the expenses of any underlying Fidelity Central Funds. E Amount does not include the portfolio activity of any underlying Fidelity Central Funds. F Expense ratios reflect operating expenses of the Fund. Expenses before reductions do not reflect amounts reimbursed by the investment adviser or reductions from brokerage service arrangements or other expense offset arrangements and do not represent the amount paid by the Fund during periods when reimbursements or reductions occur. Expenses net of fee waivers reflect expenses after reimbursement by the investment adviser but prior to reductions from brokerage service arrangements or other expense offset arrangements. Expenses net of all reductions represent the net expenses paid by the Fund. G Amount represents less than $.01 per share. |
See accompanying notes which are an integral part of the financial statements.
Annual Report
Europe Capital Appreciation
Performance: The Bottom Line
Average annual total return reflects the change in the value of an investment, assuming reinvestment of the fund's dividend income and capital gains (the profits earned upon the sale of securities that have grown in value, if any) and assuming a constant rate of performance each year. The $10,000 table and the fund's returns do not reflect the deduction of taxes that a shareholder would pay on fund distributions or the redemption of fund shares. During periods of reimbursement by Fidelity, a fund's total returns will be greater than it would be had the reimbursement not occurred. How a fund did yesterday is no guarantee of how it will do tomorrow.
Average Annual Total Returns
Periods ended October 31, 2008 | Past 1
year | Past 5
years | Past 10
years |
Fidelity Europe Capital Appreciation Fund | -48.58% | 4.34% | 3.84% |
$10,000 Over 10 Years
Let's say hypothetically that $10,000 was invested in Fidelity Europe Capital Appreciation Fund on October 31, 1998. The chart shows how the value of your investment would have changed, and also shows how the MSCI Europe Index performed over the same period.
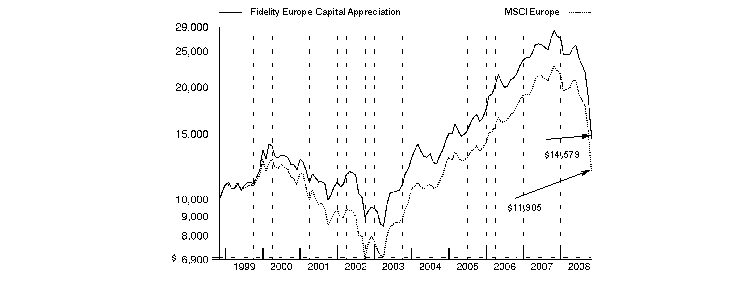
Annual Report
Europe Capital Appreciation
Management's Discussion of Fund Performance
Comments from Melissa Reilly, Portfolio Manager of Fidelity® Europe Capital Appreciation Fund
In a dramatic reversal of what had been a multiyear global growth story, international stocks fell long and hard during the 12 months ending October 31, 2008, especially so during the latter stages of the period and mostly as a result of fallout from the financial crisis that emanated from the United States. The viral spread of this financial contagion - which began in the U.S. subprime mortgage market, then seized up the credit markets, hobbled major financial institutions and eventually slowed economic growth worldwide - left virtually no corner of the globe untouched. Developed international equity markets - as gauged by the MSCI® Europe, Australasia, Far East (EAFE®) Index, which monitors established markets outside the U.S. and Canada - fell 46.54%, while the Standard & Poor's 500SM Index, a measure of U.S. stocks, dropped 36.10%. Among countries constituting at least 1% of the EAFE index, Switzerland had the "least worst" showing, falling roughly 32%, followed by Japan, where stocks slid by around 37%. Meanwhile, the weakest overall performance came from Belgium, where stocks slipped by nearly 70%. In the United Kingdom, the largest component of the index, equities were down almost 48%. Emerging markets were the weakest performers among the global economies, declining 56.22% as measured by the MSCI Emerging Markets Index.
During the year, the fund fell 48.58%, lagging the 47.89% decline of the MSCI Europe Index. Stock and market selection in consumer discretionary, energy, utilities and materials hurt the most relative to the index. Avoiding German car manufacturer Volkswagen, a component of the index, was the biggest individual detractor. Underweighting British oil company BP hurt, while U.K. mining company Rio Tinto fell when energy prices began to slide. Underweighting pharmaceutical giants Novartis in Switzerland and U.K.-based GlaxoSmithKline - the latter of which I sold - detracted. Not owning another pharmaceutical heavyweight, AstraZeneca, also in the U.K., proved detrimental as well. On the upside, the fund benefited from strong stock selection in financials and, to a lesser extent, telecommunication services. Underweighting Royal Bank of Scotland, which I sold, gave the fund its biggest boost. Not owning global insurance company and index component ING, based in the Netherlands, also was a positive. Three Swiss stocks - food and beverage manufacturer Nestle, pharmaceutical company Roche Holding and diversified mining firm Xstrata, the latter of which I sold by period end - benefited performance. Lastly, a modest position in cash helped as well.
The views expressed above reflect those of the portfolio manager(s) only through the end of the period as stated on the cover of this report and do not necessarily represent the views of Fidelity or any other person in the Fidelity organization. Any such views are subject to change at any time based upon market or other conditions and Fidelity disclaims any responsibility to update such views. These views may not be relied on as investment advice and, because investment decisions for a Fidelity fund are based on numerous factors, may not be relied on as an indication of trading intent on behalf of any Fidelity fund.
Annual Report
Europe Capital Appreciation
Investment Changes (Unaudited)
Geographic Diversification (% of fund's net assets) |
As of October 31, 2008 |
| United Kingdom | 27.9% | |
| Switzerland | 17.8% | |
| Germany | 14.2% | |
| France | 11.7% | |
| United States of America | 6.7% | |
| Italy | 4.5% | |
| Netherlands | 4.0% | |
| Spain | 3.6% | |
| Canada | 1.4% | |
| Other | 8.2% | |

Percentages are adjusted for the effect of futures contracts, if applicable. |
|
As of April 30, 2008 |
| United Kingdom | 25.9% | |
| Germany | 14.4% | |
| Switzerland | 13.3% | |
| France | 12.3% | |
| Italy | 6.9% | |
| Spain | 5.9% | |
| United States of America | 3.4% | |
| Norway | 2.3% | |
| Sweden | 2.2% | |
| Other | 13.4% | |

Percentages are adjusted for the effect of futures contracts, if applicable. |
Asset Allocation |
| % of fund's
net assets | % of fund's net assets
6 months ago |
Stocks and Investment Companies | 95.3 | 97.1 |
Short-Term Investments and Net Other Assets | 4.7 | 2.9 |
Top Ten Stocks as of October 31, 2008 |
| % of fund's
net assets | % of fund's net assets
6 months ago |
Nestle SA (Reg.) (Switzerland, Food Products) | 4.8 | 3.1 |
Total SA sponsored ADR (France, Oil, Gas & Consumable Fuels) | 3.3 | 2.3 |
Roche Holding AG (participation certificate) (Switzerland, Pharmaceuticals) | 2.9 | 1.3 |
Telefonica SA sponsored ADR (Spain, Diversified Telecommunication Services) | 2.6 | 2.5 |
E.ON AG (Germany, Electric Utilities) | 2.6 | 2.5 |
HSBC Holdings PLC sponsored ADR (United Kingdom, Commercial Banks) | 2.5 | 2.9 |
Royal Dutch Shell PLC Class A (United Kingdom) (United Kingdom, Oil, Gas & Consumable Fuels) | 2.3 | 3.5 |
Novartis AG (Reg.) (Switzerland, Pharmaceuticals) | 2.2 | 1.2 |
ENI SpA sponsored ADR (Italy, Oil, Gas & Consumable Fuels) | 2.2 | 1.7 |
Vodafone Group PLC (United Kingdom, Wireless, Telecommunication Services) | 2.1 | 2.1 |
| 27.5 | |
Market Sectors as of October 31, 2008 |
| % of fund's
net assets | % of fund's net assets
6 months ago |
Financials | 21.1 | 22.6 |
Health Care | 16.3 | 6.3 |
Consumer Staples | 13.5 | 12.2 |
Energy | 10.8 | 14.8 |
Consumer Discretionary | 9.3 | 8.2 |
Telecommunication Services | 6.5 | 7.3 |
Utilities | 6.1 | 7.7 |
Materials | 4.8 | 10.9 |
Industrials | 4.3 | 5.7 |
Information Technology | 2.6 | 1.4 |
Annual Report
Europe Capital Appreciation
Investments October 31, 2008
Showing Percentage of Net Assets
Common Stocks - 95.3% |
| Shares | | Value |
Australia - 0.9% |
CSL Ltd. | 190,533 | | $ 4,631,284 |
Belgium - 1.2% |
InBev SA (d) | 64,800 | | 2,613,587 |
KBC Groupe SA | 25,200 | | 1,083,405 |
Umicore SA | 128,200 | | 2,292,641 |
TOTAL BELGIUM | | 5,989,633 |
Canada - 1.4% |
Canadian Natural Resources Ltd. | 34,100 | | 1,719,988 |
EnCana Corp. | 47,100 | | 2,391,718 |
Petrobank Energy & Resources Ltd. (a) | 79,700 | | 1,520,236 |
Silver Wheaton Corp. (a) | 326,600 | | 1,137,602 |
TOTAL CANADA | | 6,769,544 |
Denmark - 1.3% |
Genmab AS (a) | 39,000 | | 1,761,354 |
Novo Nordisk AS Series B | 86,500 | | 4,636,635 |
TOTAL DENMARK | | 6,397,989 |
Finland - 0.6% |
Fortum Oyj | 1,000 | | 24,576 |
Nokia Corp. sponsored ADR | 178,850 | | 2,714,943 |
TOTAL FINLAND | | 2,739,519 |
France - 11.7% |
AXA SA | 274,800 | | 5,249,791 |
BNP Paribas SA | 111,700 | | 8,064,885 |
Cap Gemini SA | 104,400 | | 3,363,740 |
Credit Agricole SA | 138,900 | | 2,009,468 |
Essilor International SA | 30,000 | | 1,345,735 |
Pernod Ricard SA | 50,400 | | 3,281,982 |
Pinault Printemps-Redoute SA | 77,500 | | 4,939,109 |
Sanofi-Aventis | 109,700 | | 6,950,275 |
Societe Generale Series A | 42,150 | | 2,297,386 |
Suez Environnement SA (a) | 22,100 | | 427,583 |
Total SA sponsored ADR | 295,900 | | 16,404,696 |
Unibail-Rodamco | 23,100 | | 3,476,127 |
TOTAL FRANCE | | 57,810,777 |
Germany - 14.2% |
Adidas-Salomon AG | 123,000 | | 4,367,659 |
Bayer AG | 120,300 | | 6,697,064 |
Bayerische Motoren Werke AG (BMW) | 190,500 | | 4,942,565 |
Commerzbank AG | 69,500 | | 755,701 |
E.ON AG | 329,900 | | 12,620,915 |
ESCADA AG (a)(d) | 50,800 | | 260,131 |
Fresenius AG | 92,900 | | 5,512,022 |
GEA Group AG | 104,300 | | 1,524,234 |
Linde AG | 68,200 | | 5,727,558 |
Muenchener Rueckversicherungs-Gesellschaft AG (Reg.) | 62,900 | | 8,348,403 |
RWE AG | 110,200 | | 9,209,307 |
|
| Shares | | Value |
SAP AG | 88,800 | | $ 3,161,827 |
SAP AG sponsored ADR | 28,200 | | 996,306 |
Siemens AG (Reg.) | 54,900 | | 3,289,947 |
Symrise AG | 192,300 | | 2,388,597 |
TOTAL GERMANY | | 69,802,236 |
Hong Kong - 1.0% |
Esprit Holdings Ltd. | 859,300 | | 4,882,595 |
Ireland - 1.3% |
Allied Irish Banks PLC | 159,900 | | 851,730 |
CRH PLC | 171,900 | | 3,810,295 |
Ryanair Holdings PLC sponsored ADR (a) | 81,300 | | 1,810,551 |
TOTAL IRELAND | | 6,472,576 |
Italy - 4.5% |
ENI SpA sponsored ADR (d) | 225,100 | | 10,816,055 |
Fiat SpA | 227,500 | | 1,808,114 |
IFIL Finanziaria di Partecipazioni SpA | 138,000 | | 427,839 |
Intesa Sanpaolo SpA | 1,489,200 | | 5,447,434 |
Prysmian SpA | 44,800 | | 543,471 |
UniCredit SpA | 1,243,100 | | 3,041,523 |
TOTAL ITALY | | 22,084,436 |
Luxembourg - 0.2% |
ArcelorMittal SA (France) | 39,200 | | 1,019,568 |
Netherlands - 4.0% |
ASML Holding NV (Netherlands) | 55,900 | | 978,604 |
Koninklijke KPN NV | 643,000 | | 9,055,492 |
Unilever NV (Certificaten Van Aandelen) | 408,100 | | 9,834,996 |
TOTAL NETHERLANDS | | 19,869,092 |
Norway - 0.6% |
Pronova BioPharma ASA | 1,200,324 | | 3,118,324 |
Papua New Guinea - 0.4% |
Lihir Gold Ltd. (a) | 1,717,806 | | 2,142,311 |
Russia - 0.2% |
OAO Gazprom sponsored ADR | 53,300 | | 1,089,985 |
Spain - 3.6% |
Banco Santander SA | 336,200 | | 3,636,056 |
Inditex SA | 32,100 | | 1,085,059 |
Telefonica SA sponsored ADR | 231,100 | | 12,828,361 |
TOTAL SPAIN | | 17,549,476 |
Sweden - 0.5% |
H&M Hennes & Mauritz AB (B Shares) | 70,900 | | 2,541,941 |
Switzerland - 17.8% |
Actelion Ltd. (Reg.) (a) | 99,801 | | 5,271,136 |
Credit Suisse Group (Reg.) | 199,392 | | 7,454,432 |
EFG International | 120,180 | | 2,586,631 |
Julius Baer Holding AG | 74,926 | | 2,929,742 |
Lindt & Spruengli AG | 77 | | 1,867,611 |
Lonza Group AG | 15,666 | | 1,299,885 |
Nestle SA (Reg.) | 605,363 | | 23,535,668 |
Common Stocks - continued |
| Shares | | Value |
Switzerland - continued |
Nobel Biocare Holding AG (Switzerland) | 57,936 | | $ 995,050 |
Novartis AG (Reg.) | 220,065 | | 11,167,655 |
Roche Holding AG (participation certificate) | 94,387 | | 14,431,195 |
Sonova Holding AG | 46,569 | | 1,934,551 |
UBS AG: | | | |
(For. Reg.) | 239,788 | | 4,067,672 |
(NY Shares) | 136,975 | | 2,314,878 |
Zurich Financial Services AG (Reg.) | 38,922 | | 7,894,702 |
TOTAL SWITZERLAND | | 87,750,808 |
United Kingdom - 27.9% |
Aegis Group PLC | 1,055,000 | | 1,111,719 |
Anglo American PLC (United Kingdom) | 57,900 | | 1,452,605 |
Autonomy Corp. PLC (a) | 100,400 | | 1,591,712 |
Barclays PLC | 494,100 | | 1,416,204 |
Bellway PLC | 426,600 | | 3,715,985 |
BG Group PLC | 215,200 | | 3,163,899 |
Bovis Homes Group PLC (d) | 661,700 | | 3,616,528 |
BP PLC | 613,700 | | 5,001,948 |
British American Tobacco PLC (United Kingdom) | 268,400 | | 7,361,117 |
Capita Group PLC | 399,100 | | 4,123,384 |
Centrica PLC | 904,100 | | 4,442,037 |
easyJet PLC (a) | 670,100 | | 3,342,436 |
Experian PLC | 1,208,100 | | 6,661,817 |
Hammerson PLC | 181,000 | | 2,085,862 |
HBOS PLC | 765,900 | | 1,253,951 |
HSBC Holdings PLC sponsored ADR (d) | 211,200 | | 12,460,800 |
Informa PLC | 714,200 | | 2,419,389 |
Kesa Electricals PLC | 1,921,700 | | 2,467,409 |
Kingfisher PLC | 1,453,300 | | 2,682,091 |
Lloyds TSB Group PLC | 706,100 | | 2,281,909 |
Man Group PLC | 557,087 | | 3,215,934 |
National Grid PLC | 321,200 | | 3,617,909 |
Persimmon PLC (d) | 387,300 | | 1,874,775 |
Prudential PLC | 787,800 | | 3,956,898 |
Reckitt Benckiser Group PLC | 235,100 | | 9,943,457 |
Redrow PLC (d) | 539,600 | | 1,804,498 |
Rio Tinto PLC (Reg.) | 70,300 | | 3,283,459 |
Royal Dutch Shell PLC Class A (United Kingdom) | 414,300 | | 11,381,383 |
|
| Shares | | Value |
SSL International PLC | 577,100 | | $ 3,897,170 |
Standard Chartered PLC (United Kingdom) | 318,300 | | 5,259,904 |
Tesco PLC | 1,201,100 | | 6,580,149 |
Vodafone Group PLC | 2,897,200 | | 5,572,702 |
Vodafone Group PLC sponsored ADR | 250,450 | | 4,826,172 |
TOTAL UNITED KINGDOM | | 137,867,212 |
United States of America - 2.0% |
Anheuser-Busch Companies, Inc. | 19,300 | | 1,197,179 |
Genentech, Inc. (a) | 60,900 | | 5,051,046 |
Synthes, Inc. | 16,313 | | 2,104,616 |
Virgin Media, Inc. (d) | 248,300 | | 1,430,208 |
TOTAL UNITED STATES OF AMERICA | | 9,783,049 |
TOTAL COMMON STOCKS (Cost $667,564,188) | 470,312,355 |
Money Market Funds - 8.5% |
| | | |
Fidelity Cash Central Fund, 1.81% (b) | 20,830,945 | | 20,830,945 |
Fidelity Securities Lending Cash Central Fund, 2.67% (b)(c) | 21,039,590 | | 21,039,590 |
TOTAL MONEY MARKET FUNDS (Cost $41,870,535) | 41,870,535 |
TOTAL INVESTMENT
PORTFOLIO - 103.8% (Cost $709,434,723) | | 512,182,890 |
NET OTHER ASSETS - (3.8)% | | (18,528,786) |
NET ASSETS - 100% | $ 493,654,104 |
Legend |
(a) Non-income producing |
(b) Affiliated fund that is available only to investment companies and other accounts managed by Fidelity Investments. The rate quoted is the annualized seven-day yield of the fund at period end. A complete unaudited listing of the fund's holdings as of its most recent quarter end is available upon request. |
(c) Investment made with cash collateral received from securities on loan. |
(d) Security or a portion of the security is on loan at period end. |
Affiliated Central Funds |
Information regarding fiscal year to date income earned by the Fund from investments in Fidelity Central Funds is as follows: |
Fund | Income earned |
Fidelity Cash Central Fund | $ 881,931 |
Fidelity Securities Lending Cash Central Fund | 1,519,138 |
Total | $ 2,401,069 |
Income Tax Information |
At October 31, 2008, the fund had a capital loss carryforward of approximately $193,924,656 all of which will expire on October 31, 2016. |
See accompanying notes which are an integral part of the financial statements.
Annual Report
Europe Capital Appreciation
Financial Statements
Statement of Assets and Liabilities
| October 31, 2008 |
| | |
Assets | | |
Investment in securities, at value (including securities loaned of $20,390,176) -
See accompanying schedule: Unaffiliated issuers
(cost $667,564,188) | $ 470,312,355 | |
Fidelity Central Funds
(cost $41,870,535) | 41,870,535 | |
Total Investments
(cost $709,434,723) | | $ 512,182,890 |
Foreign currency held at value
(cost $975,567) | | 975,561 |
Receivable for investments sold | | 8,704,313 |
Receivable for fund shares sold | | 351,219 |
Dividends receivable | | 1,614,159 |
Distributions receivable from Fidelity Central Funds | | 78,800 |
Prepaid expenses | | 341 |
Other receivables | | 110,472 |
Total assets | | 524,017,755 |
| | |
Liabilities | | |
Payable for investments purchased | $ 8,219,416 | |
Payable for fund shares redeemed | 498,972 | |
Accrued management fee | 354,638 | |
Other affiliated payables | 175,449 | |
Other payables and accrued expenses | 75,586 | |
Collateral on securities loaned, at value | 21,039,590 | |
Total liabilities | | 30,363,651 |
| | |
Net Assets | | $ 493,654,104 |
Net Assets consist of: | | |
Paid in capital | | $ 876,429,965 |
Undistributed net investment income | | 17,579,785 |
Accumulated undistributed net realized gain (loss) on investments and foreign currency transactions | | (203,034,574) |
Net unrealized appreciation (depreciation) on investments and assets and liabilities in foreign currencies | | (197,321,072) |
Net Assets, for 34,583,352 shares outstanding | | $ 493,654,104 |
Net Asset Value, offering price and redemption price per share ($493,654,104 ÷ 34,583,352 shares) | | $ 14.27 |
Statement of Operations
| Year ended October 31, 2008 |
| | |
Investment Income | | |
Dividends | | $ 32,429,419 |
Interest | | 5,772 |
Income from Fidelity Central Funds (including $1,519,138 from security lending) | | 2,401,069 |
| | 34,836,260 |
Less foreign taxes withheld | | (3,286,068) |
Total income | | 31,550,192 |
| | |
Expenses | | |
Management fee
Basic fee | $ 6,960,236 | |
Performance adjustment | 1,289,033 | |
Transfer agent fees | 2,220,847 | |
Accounting and security lending fees | 472,881 | |
Custodian fees and expenses | 154,918 | |
Independent trustees' compensation | 4,425 | |
Registration fees | 37,680 | |
Audit | 55,107 | |
Legal | 5,909 | |
Miscellaneous | 157,443 | |
Total expenses before reductions | 11,358,479 | |
Expense reductions | (440,753) | 10,917,726 |
Net investment income (loss) | | 20,632,466 |
Realized and Unrealized Gain (Loss) Net realized gain (loss) on: | | |
Investment securities: | | |
Unaffiliated issuers | (201,631,398) | |
Foreign currency transactions | (786,854) | |
Total net realized gain (loss) | | (202,418,252) |
Change in net unrealized appreciation (depreciation) on: Investment securities | (360,829,435) | |
Assets and liabilities in foreign currencies | (108,029) | |
Total change in net unrealized appreciation (depreciation) | | (360,937,464) |
Net gain (loss) | | (563,355,716) |
Net increase (decrease) in net assets resulting from operations | | $ (542,723,250) |
See accompanying notes which are an integral part of the financial statements.
Annual Report
Statement of Changes in Net Assets
| Year ended
October 31,
2008 | Year ended
October 31,
2007 |
Increase (Decrease) in Net Assets | | |
Operations | | |
Net investment income (loss) | $ 20,632,466 | $ 29,618,721 |
Net realized gain (loss) | (202,418,252) | 241,091,061 |
Change in net unrealized appreciation (depreciation) | (360,937,464) | 70,513,581 |
Net increase (decrease) in net assets resulting from operations | (542,723,250) | 341,223,363 |
Distributions to shareholders from net investment income | (22,837,060) | (9,391,804) |
Distributions to shareholders from net realized gain | (172,118,248) | (96,052,488) |
Total distributions | (194,955,308) | (105,444,292) |
Share transactions
Proceeds from sales of shares | 94,959,353 | 712,149,877 |
Reinvestment of distributions | 184,197,685 | 99,678,932 |
Cost of shares redeemed | (413,295,649) | (752,725,822) |
Net increase (decrease) in net assets resulting from share transactions | (134,138,611) | 59,102,987 |
Redemption fees | 21,939 | 102,889 |
Total increase (decrease) in net assets | (871,795,230) | 294,984,947 |
| | |
Net Assets | | |
Beginning of period | 1,365,449,334 | 1,070,464,387 |
End of period (including undistributed net investment income of $17,579,785 and undistributed net investment income of $28,948,128, respectively) | $ 493,654,104 | $ 1,365,449,334 |
Other Information Shares | | |
Sold | 3,880,339 | 25,057,625 |
Issued in reinvestment of distributions | 6,817,087 | 3,751,559 |
Redeemed | (17,925,334) | (25,963,364) |
Net increase (decrease) | (7,227,908) | 2,845,820 |
Financial Highlights
Years ended October 31, | 2008 | 2007 | 2006 | 2005 | 2004 |
Selected Per-Share Data | | | | | |
Net asset value, beginning of period | $ 32.66 | $ 27.47 | $ 23.15 | $ 19.63 | $ 17.26 |
Income from Investment Operations | | | | | |
Net investment income (loss) B | .50 | .62 | .38 E | .37 | .13 F |
Net realized and unrealized gain (loss) | (14.11) | 7.04 | 6.85 | 3.38 | 2.46 |
Total from investment operations | (13.61) | 7.66 | 7.23 | 3.75 | 2.59 |
Distributions from net investment income | (.56) | (.22) | (.30) | (.17) | (.22) |
Distributions from net realized gain | (4.22) | (2.25) | (2.62) | (.06) | - |
Total distributions | (4.78) | (2.47) | (2.92) | (.23) | (.22) |
Redemption fees added to paid in capital B | - H | -H | .01 | -H | -H |
Net asset value, end of period | $ 14.27 | $ 32.66 | $ 27.47 | $ 23.15 | $ 19.63 |
Total Return A | (48.58)% | 29.95% | 34.81% | 19.24% | 15.13% |
Ratios to Average Net Assets C, G | | | | | |
Expenses before reductions | 1.16% | 1.05% | 1.09% | .95% | 1.22% |
Expenses net of fee waivers, if any | 1.16% | 1.05% | 1.09% | .95% | 1.22% |
Expenses net of all reductions | 1.12% | 1.01% | .99% | .84% | 1.15% |
Net investment income (loss) | 2.11% | 2.15% | 1.51%E | 1.66% | .69%F |
Supplemental Data | | | | | |
Net assets, end of period (000 omitted) | $ 493,654 | $ 1,365,449 | $ 1,070,464 | $ 492,788 | $ 407,362 |
Portfolio turnover rate D | 112% | 161% | 143% | 133% | 119% |
A Total returns would have been lower had certain expenses not been reduced during the periods shown. B Calculated based on average shares outstanding during the period. C Fees and expenses of the underlying Fidelity Central Funds are not included in the Fund's expense ratio. The Fund indirectly bears its proportionate share of the expenses of any underlying Fidelity Central Funds. D Amount does not include the portfolio activity of any underlying Fidelity Central Funds. E Investment income per share reflects a special dividend which amounted to $.11 per share. Excluding the special dividend, the ratio of net investment income (loss) to average net assets would have been 1.06%. F Net investment income per share includes approximately $.01 per share received as a result of a reorganization of an issuer that was in bankruptcy. Excluding this non-recurring amount, the ratio of net investment income (loss) to average net assets would have been .65%. G Expense ratios reflect operating expenses of the Fund. Expenses before reductions do not reflect amounts reimbursed by the investment adviser or reductions from brokerage service arrangements or other expense offset arrangements and do not represent the amount paid by the Fund during periods when reimbursements or reductions occur. Expenses net of fee waivers reflect expenses after reimbursement by the investment adviser but prior to reductions from brokerage service arrangements or other expense offset arrangements. Expenses net of all reductions represent the net expenses paid by the Fund. H Amount represents less than $.01 per share. |
See accompanying notes which are an integral part of the financial statements.
Annual Report
Japan
Performance: The Bottom Line
Average annual total return reflects the change in the value of an investment, assuming reinvestment of the fund's dividend income and capital gains (the profits earned upon the sale of securities that have grown in value, if any) and assuming a constant rate of performance each year. The $10,000 table and the fund's returns do not reflect the deduction of taxes that a shareholder would pay on fund distributions or the redemption of fund shares. During periods of reimbursement by Fidelity, a fund's total returns will be greater than it would be had the reimbursement not occurred. How a fund did yesterday is no guarantee of how it will do tomorrow.
Average Annual Total Returns
Periods ended October 31, 2008 | Past 1
year | Past 5
years | Past 10
years |
Fidelity Japan Fund | -41.88% | -1.00% | 3.11% |
$10,000 Over 10 Years
Let's say hypothetically that $10,000 was invested in Fidelity Japan Fund on October 31, 1998. The chart shows how the value of your investment would have changed, and also shows how the TOPIX performed over the same period.
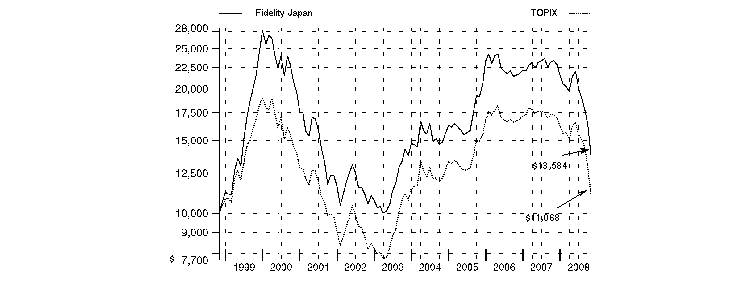
Annual Report
Japan
Management's Discussion of Fund Performance
Comments from Robert Rowland, Portfolio Manager of Fidelity® Japan Fund
Japanese stocks got walloped during the 12-month period ending October 31, 2008, a fate shared by most other stock markets globally. As measured by the Tokyo Stock Exchange Stock Price Index (TOPIX), Japanese share prices fell 36.04%, almost dead-even with the 36.10% setback sustained by the Standard & Poor's 500SM Index, a widely followed benchmark of U.S. stocks. By comparison, the MSCI® Europe, Australasia, Far East (EAFE®) Index - - a gauge of developed stock markets outside the United States and Canada - recorded a loss of 46.54%. An intensifying U.S. credit crisis was partly to blame, as a number of well-known firms in the U.S. financials sector declared bankruptcy, required government assistance or arranged to be purchased by a stronger competitor. The deteriorating economies of Japan's trading partners hurt the revenues and earnings of Japanese exporters. An appreciating yen aided the returns earned by U.S. investors but undermined exporters' ability to compete successfully with non-Japanese rivals. Meanwhile, economic growth in Japan continued to be disappointing, with gross domestic product (GDP) there contracting during the second quarter of 2008.
During the past year, the fund returned -41.88%, trailing the TOPIX. An overweighting and poor stock selection in industrials - specifically, the capital goods industry - partially explains the performance shortfall. Underweighting defensive sectors, such as utilities - where we had no exposure at all - and consumer staples, also hurt, as did overweighting information technology. Unrewarding picks in financials further detracted. Yaskawa Electric, a global maker of industrial control and automation products, was hurt by lower earnings expectations driven by yen appreciation and a slowdown in order growth from China. Other detractors included Dainippon Screen Manufacturing, a maker of semiconductor capital equipment; Yamaha Motor, the world's second-largest motorcycle maker; and image equipment maker Konica Minolta. Not owning benchmark component Tokyo Electric Power, a defensive holding that outperformed, had a negative impact as well. Conversely, stock picking in materials and a modest cash position helped curb our losses. The fund's top contributor was also its largest holding at period end: automaker Toyota Motor. Further contributing were Canon, a maker of imaging equipment and digital cameras, Sekisui House, a leading house builder in Japan, and Shin-Etsu Chemical, the world's largest manufacturer of semiconductor wafers and PVC (polyvinyl chloride).
The views expressed above reflect those of the portfolio manager(s) only through the end of the period as stated on the cover of this report and do not necessarily represent the views of Fidelity or any other person in the Fidelity organization. Any such views are subject to change at any time based upon market or other conditions and Fidelity disclaims any responsibility to update such views. These views may not be relied on as investment advice and, because investment decisions for a Fidelity fund are based on numerous factors, may not be relied on as an indication of trading intent on behalf of any Fidelity fund.
Annual Report
Japan
Investment Changes (Unaudited)
Geographic Diversification (% of fund's net assets) |
As of October 31, 2008 |
| Japan | 95.5% | |
| United States of America | 4.5% | |

Percentages are adjusted for the effect of futures contracts, if applicable. |
|
As of April 30, 2008 |
| Japan | 96.7% | |
| United States of America | 3.3% | |

Percentages are adjusted for the effect of futures contracts, if applicable. |
Asset Allocation |
| % of fund's
net assets | % of fund's net assets
6 months ago |
Stocks | 95.5 | 96.7 |
Short-Term Investments and Net Other Assets | 4.5 | 3.3 |
Top Ten Stocks as of October 31, 2008 |
| % of fund's
net assets | % of fund's net assets
6 months ago |
Toyota Motor Corp. (Automobiles) | 8.5 | 9.2 |
Canon, Inc. (Office Electronics) | 7.9 | 5.5 |
Yamaha Motor Co. Ltd. (Automobiles) | 4.1 | 1.3 |
Honda Motor Co. Ltd. (Automobiles) | 4.1 | 3.4 |
Mitsubishi UFJ Financial Group, Inc. (Commercial Banks) | 3.7 | 4.0 |
Sekisui House Ltd. (Household Durables) | 2.1 | 0.9 |
Sumitomo Electric Industries Ltd. (Electrical Equipment) | 2.1 | 1.8 |
Tokyo Electron Ltd. (Semiconductors & Semiconductor Equipment) | 2.0 | 1.6 |
Sumitomo Trust & Banking Co. Ltd. (Commercial Banks) | 1.9 | 2.3 |
Shin-Etsu Chemical Co. Ltd. (Chemicals) | 1.9 | 1.4 |
| 38.3 | |
Market Sectors as of October 31, 2008 |
| % of fund's
net assets | % of fund's net assets
6 months ago |
Consumer Discretionary | 27.4 | 23.1 |
Information Technology | 20.5 | 19.4 |
Financials | 19.2 | 23.0 |
Industrials | 19.0 | 20.9 |
Materials | 6.3 | 5.7 |
Telecommunication Services | 1.5 | 1.4 |
Consumer Staples | 1.1 | 1.4 |
Health Care | 0.5 | 1.8 |
Annual Report
Japan
Investments October 31, 2008
Showing Percentage of Net Assets
Common Stocks - 95.5% |
| Shares | | Value |
CONSUMER DISCRETIONARY - 27.4% |
Auto Components - 4.0% |
Denso Corp. | 617,200 | | $ 12,028,977 |
NOK Corp. | 508,600 | | 4,842,133 |
Stanley Electric Co. Ltd. | 1,312,700 | | 16,503,018 |
Toyoda Gosei Co. Ltd. | 554,500 | | 7,784,574 |
| | 41,158,702 |
Automobiles - 16.7% |
Honda Motor Co. Ltd. | 1,667,300 | | 41,455,969 |
Toyota Motor Corp. | 2,239,000 | | 87,430,561 |
Yamaha Motor Co. Ltd. | 3,785,000 | | 41,844,650 |
| | 170,731,180 |
Household Durables - 2.3% |
Haseko Corp. | 2,719,000 | | 2,460,381 |
Sekisui House Ltd. | 2,120,000 | | 21,257,314 |
| | 23,717,695 |
Leisure Equipment & Products - 0.7% |
Nikon Corp. (c) | 512,000 | | 7,215,322 |
Media - 1.2% |
Fuji Media Holdings, Inc. | 10,541 | | 12,619,925 |
Multiline Retail - 2.2% |
Isetan Mitsukoshi Holdings Ltd. | 362,440 | | 3,413,809 |
J Front Retailing Co. Ltd. | 552,000 | | 2,461,409 |
Marui Group Co. Ltd. | 1,115,100 | | 6,816,054 |
Takashimaya Co. Ltd. (c) | 1,345,000 | | 10,365,427 |
| | 23,056,699 |
Specialty Retail - 0.3% |
Yamada Denki Co. Ltd. | 50,330 | | 2,739,329 |
TOTAL CONSUMER DISCRETIONARY | | 281,238,852 |
CONSUMER STAPLES - 1.1% |
Food & Staples Retailing - 0.7% |
Aeon Co. Ltd. | 681,900 | | 6,538,454 |
Food Products - 0.4% |
Nissin Food Holdings Co. Ltd. | 153,100 | | 4,376,064 |
TOTAL CONSUMER STAPLES | | 10,914,518 |
FINANCIALS - 19.2% |
Capital Markets - 2.5% |
Daiwa Securities Group, Inc. | 1,238,000 | | 6,998,709 |
Matsui Securities Co. Ltd. (c) | 751,800 | | 4,874,564 |
Nomura Holdings, Inc. | 1,481,200 | | 14,032,673 |
| | 25,905,946 |
Commercial Banks - 9.5% |
Chiba Bank Ltd. | 1,098,000 | | 5,426,743 |
Mitsubishi UFJ Financial Group, Inc. | 6,088,800 | | 38,261,127 |
Mizuho Financial Group, Inc. | 6,794 | | 16,588,758 |
|
| Shares | | Value |
Sumitomo Mitsui Financial Group, Inc. | 4,459 | | $ 17,874,622 |
Sumitomo Trust & Banking Co. Ltd. | 4,236,000 | | 19,616,253 |
| | 97,767,503 |
Consumer Finance - 0.8% |
Credit Saison Co. Ltd. | 331,300 | | 3,515,741 |
Promise Co. Ltd. | 266,050 | | 4,775,133 |
| | 8,290,874 |
Insurance - 3.0% |
Sompo Japan Insurance, Inc. | 2,187,000 | | 15,328,244 |
T&D Holdings, Inc. | 387,450 | | 14,800,349 |
| | 30,128,593 |
Real Estate Investment Trusts - 1.0% |
Japan Real Estate Investment Corp. | 723 | | 6,401,912 |
Kenedix Realty Investment Corp. | 323 | | 468,121 |
Nomura Real Estate Office Fund, Inc. | 610 | | 3,467,808 |
| | 10,337,841 |
Real Estate Management & Development - 2.4% |
Mitsubishi Estate Co. Ltd. | 685,000 | | 12,235,773 |
Mitsui Fudosan Co. Ltd. | 321,000 | | 5,599,005 |
Tokyo Tatemono Co. Ltd. (c) | 878,000 | | 3,616,483 |
Tokyu Land Corp. | 906,000 | | 2,563,883 |
| | 24,015,144 |
TOTAL FINANCIALS | | 196,445,901 |
HEALTH CARE - 0.5% |
Pharmaceuticals - 0.5% |
Daiichi Sankyo Co. Ltd. | 250,800 | | 5,142,373 |
INDUSTRIALS - 19.0% |
Building Products - 2.6% |
Asahi Glass Co. Ltd. (c) | 2,754,000 | | 17,304,636 |
Daikin Industries Ltd. | 431,200 | | 9,698,254 |
| | 27,002,890 |
Commercial Services & Supplies - 0.2% |
Dai Nippon Printing Co. Ltd. | 127,000 | | 1,500,447 |
Secom Co. Ltd. | 8,100 | | 308,938 |
| | 1,809,385 |
Construction & Engineering - 0.6% |
JGC Corp. | 591,000 | | 6,335,163 |
Electrical Equipment - 3.5% |
Mitsubishi Electric Corp. | 2,313,000 | | 14,338,310 |
Sumitomo Electric Industries Ltd. | 2,623,900 | | 21,243,448 |
| | 35,581,758 |
Machinery - 5.3% |
Daifuku Co. Ltd. | 701,000 | | 3,771,089 |
Fanuc Ltd. | 47,500 | | 3,164,701 |
Kubota Corp. | 3,378,000 | | 16,954,514 |
NGK Insulators Ltd. | 839,000 | | 8,713,968 |
NSK Ltd. | 1,882,000 | | 7,680,829 |
Common Stocks - continued |
| Shares | | Value |
INDUSTRIALS - continued |
Machinery - continued |
THK Co. Ltd. | 841,500 | | $ 11,523,139 |
Toshiba Machine Co. Ltd. | 926,000 | | 2,656,267 |
| | 54,464,507 |
Road & Rail - 1.2% |
East Japan Railway Co. | 1,680 | | 11,954,277 |
Trading Companies & Distributors - 4.0% |
Mitsubishi Corp. | 735,800 | | 12,332,744 |
Mitsui & Co. Ltd. | 1,618,000 | | 15,676,827 |
Sumitomo Corp. | 1,520,100 | | 13,373,224 |
| | 41,382,795 |
Transportation Infrastructure - 1.6% |
The Sumitomo Warehouse Co. Ltd. (c) | 4,148,000 | | 16,802,238 |
TOTAL INDUSTRIALS | | 195,333,013 |
INFORMATION TECHNOLOGY - 20.5% |
Electronic Equipment & Components - 8.0% |
Dainippon Screen Manufacturing Co. Ltd. (c) | 3,601,000 | | 7,677,292 |
Fujifilm Holdings Corp. | 158,700 | | 3,653,147 |
Horiba Ltd. | 300,400 | | 4,447,913 |
Ibiden Co. Ltd. | 706,000 | | 13,206,113 |
Kyocera Corp. | 87,300 | | 5,127,601 |
Nidec Sankyo Corp. (c) | 1,112,000 | | 5,190,885 |
Nippon Electric Glass Co. Ltd. | 1,490,000 | | 8,961,877 |
Omron Corp. | 286,400 | | 4,088,773 |
Topcon Corp. (c) | 889,600 | | 5,006,850 |
Yamatake Corp. | 267,500 | | 5,103,260 |
Yaskawa Electric Corp. | 2,709,000 | | 11,887,568 |
Yokogawa Electric Corp. | 1,561,200 | | 7,229,118 |
| | 81,580,397 |
Office Electronics - 9.4% |
Canon, Inc. (c) | 2,303,600 | | 80,602,651 |
Konica Minolta Holdings, Inc. | 2,405,500 | | 15,796,852 |
| | 96,399,503 |
Semiconductors & Semiconductor Equipment - 3.1% |
Advantest Corp. (c) | 218,900 | | 3,145,037 |
Disco Corp. (c) | 180,000 | | 4,313,813 |
Rohm Co. Ltd. | 73,800 | | 3,555,924 |
Tokyo Electron Ltd. | 628,300 | | 20,948,880 |
| | 31,963,654 |
TOTAL INFORMATION TECHNOLOGY | | 209,943,554 |
|
| Shares | | Value |
MATERIALS - 6.3% |
Chemicals - 4.4% |
JSR Corp. | 1,183,700 | | $ 13,351,296 |
Nissan Chemical Industries Co. Ltd. | 534,000 | | 4,317,519 |
Nitto Denko Corp. | 334,400 | | 7,405,614 |
Shin-Etsu Chemical Co. Ltd. | 367,300 | | 19,523,004 |
| | 44,597,433 |
Metals & Mining - 1.9% |
Hitachi Metals Ltd. | 521,000 | | 3,917,256 |
Sumitomo Metal Industries Ltd. | 6,079,000 | | 15,634,023 |
| | 19,551,279 |
TOTAL MATERIALS | | 64,148,712 |
TELECOMMUNICATION SERVICES - 1.5% |
Wireless Telecommunication Services - 1.5% |
KDDI Corp. | 1,377 | | 8,249,927 |
NTT DoCoMo, Inc. | 4,443 | | 7,046,013 |
Softbank Corp. | 50,400 | | 496,286 |
| | 15,792,226 |
TOTAL COMMON STOCKS (Cost $1,487,864,715) | 978,959,149 |
Money Market Funds - 10.4% |
| | | |
Fidelity Cash Central Fund, 1.81% (a) | 57,353,412 | | 57,353,412 |
Fidelity Securities Lending Cash Central Fund, 2.67% (a)(b) | 49,598,626 | | 49,598,626 |
TOTAL MONEY MARKET FUNDS (Cost $106,952,038) | 106,952,038 |
TOTAL INVESTMENT
PORTFOLIO - 105.9% (Cost $1,594,816,753) | 1,085,911,187 |
NET OTHER ASSETS - (5.9)% | | (60,576,793) |
NET ASSETS - 100% | $ 1,025,334,394 |
Legend |
(a) Affiliated fund that is available only to investment companies and other accounts managed by Fidelity Investments. The rate quoted is the annualized seven-day yield of the fund at period end. A complete unaudited listing of the fund's holdings as of its most recent quarter end is available upon request. |
(b) Investment made with cash collateral received from securities on loan. |
(c) Security or a portion of the security is on loan at period end. |
Affiliated Central Funds |
Information regarding fiscal year to date income earned by the Fund from investments in Fidelity Central Funds is as follows: |
Fund | Income earned |
Fidelity Cash Central Fund | $ 1,669,219 |
Fidelity Securities Lending Cash Central Fund | 724,095 |
Total | $ 2,393,314 |
Income Tax Information |
At October 31, 2008, the fund had a capital loss carryforward of approximately $151,185,501 all of which will expire on October 31, 2016. |
See accompanying notes which are an integral part of the financial statements.
Annual Report
Japan
Financial Statements
Statement of Assets and Liabilities
| October 31, 2008 |
| | |
Assets | | |
Investment in securities, at value (including securities loaned of $46,957,045) -
See accompanying schedule: Unaffiliated issuers
(cost $1,487,864,715) | $ 978,959,149 | |
Fidelity Central Funds
(cost $106,952,038) | 106,952,038 | |
Total Investments
(cost $1,594,816,753) | | $ 1,085,911,187 |
Receivable for investments sold | | 41,948,168 |
Receivable for fund shares sold | | 506,852 |
Dividends receivable | | 9,213,957 |
Distributions receivable from Fidelity Central Funds | | 161,138 |
Prepaid expenses | | 450 |
Other receivables | | 32,076 |
Total assets | | 1,137,773,828 |
| | |
Liabilities | | |
Payable for investments purchased | $ 60,683,850 | |
Payable for fund shares redeemed | 1,338,833 | |
Accrued management fee | 401,000 | |
Other affiliated payables | 305,449 | |
Other payables and accrued expenses | 111,676 | |
Collateral on securities loaned, at value | 49,598,626 | |
Total liabilities | | 112,439,434 |
| | |
Net Assets | | $ 1,025,334,394 |
Net Assets consist of: | | |
Paid in capital | | $ 1,699,929,039 |
Undistributed net investment income | | 10,323,711 |
Accumulated undistributed net realized gain (loss) on investments and foreign currency transactions | | (176,568,511) |
Net unrealized appreciation (depreciation) on investments and assets and liabilities in foreign currencies | | (508,349,845) |
Net Assets, for 113,520,320 shares outstanding | | $ 1,025,334,394 |
Net Asset Value, offering price and redemption price per share ($1,025,334,394 ÷ 113,520,320 shares) | | $ 9.03 |
Statement of Operations
| Year ended October 31, 2008 |
| | |
Investment Income | | |
Dividends | | $ 27,191,904 |
Interest | | 10 |
Income from Fidelity Central Funds (including $724,095 from security lending) | | 2,393,314 |
| | 29,585,228 |
Less foreign taxes withheld | | (1,903,470) |
Total income | | 27,681,758 |
| | |
Expenses | | |
Management fee
Basic fee | $ 10,762,241 | |
Performance adjustment | 1,482,287 | |
Transfer agent fees | 3,581,289 | |
Accounting and security lending fees | 699,931 | |
Custodian fees and expenses | 243,420 | |
Independent trustees' compensation | 6,632 | |
Registration fees | 41,451 | |
Audit | 67,131 | |
Legal | 8,115 | |
Miscellaneous | 104,620 | |
Total expenses before reductions | 16,997,117 | |
Expense reductions | (271,734) | 16,725,383 |
Net investment income (loss) | | 10,956,375 |
Realized and Unrealized Gain (Loss) Net realized gain (loss) on: | | |
Investment securities: | | |
Unaffiliated issuers | (163,624,033) | |
Foreign currency transactions | (104,464) | |
Total net realized gain (loss) | | (163,728,497) |
Change in net unrealized appreciation (depreciation) on: Investment securities | (601,564,175) | |
Assets and liabilities in foreign currencies | 598,313 | |
Total change in net unrealized appreciation (depreciation) | | (600,965,862) |
Net gain (loss) | | (764,694,359) |
Net increase (decrease) in net assets resulting from operations | | $ (753,737,984) |
See accompanying notes which are an integral part of the financial statements.
Annual Report
Statement of Changes in Net Assets
| Year ended
October 31,
2008 | Year ended
October 31,
2007 |
Increase (Decrease) in Net Assets | | |
Operations | | |
Net investment income (loss) | $ 10,956,375 | $ 4,256,897 |
Net realized gain (loss) | (163,728,497) | 259,224,909 |
Change in net unrealized appreciation (depreciation) | (600,965,862) | (123,161,437) |
Net increase (decrease) in net assets resulting from operations | (753,737,984) | 140,320,369 |
Distributions to shareholders from net investment income | (3,964,749) | (1,030,851) |
Distributions to shareholders from net realized gain | (236,930,224) | (23,709,588) |
Total distributions | (240,894,973) | (24,740,439) |
Share transactions
Proceeds from sales of shares | 356,021,629 | 480,536,650 |
Reinvestment of distributions | 222,101,843 | 22,903,100 |
Cost of shares redeemed | (337,905,099) | (603,458,144) |
Net increase (decrease) in net assets resulting from share transactions | 240,218,373 | (100,018,394) |
Redemption fees | 298,104 | 502,211 |
Total increase (decrease) in net assets | (754,116,480) | 16,063,747 |
| | |
Net Assets | | |
Beginning of period | 1,779,450,874 | 1,763,387,127 |
End of period (including undistributed net investment income of $10,323,711 and undistributed net investment income of $3,817,643, respectively) | $ 1,025,334,394 | $ 1,779,450,874 |
Other Information Shares | | |
Sold | 26,690,591 | 27,723,445 |
Issued in reinvestment of distributions | 14,488,052 | 1,371,443 |
Redeemed | (26,534,675) | (34,840,570) |
Net increase (decrease) | 14,643,968 | (5,745,682) |
Financial Highlights
Years ended October 31, | 2008 | 2007 | 2006 | 2005 | 2004 |
Selected Per-Share Data | | | | | |
Net asset value, beginning of period | $ 18.00 | $ 16.85 | $ 15.00 | $ 11.63 | $ 11.19 |
Income from Investment Operations | | | | | |
Net investment income (loss) B | .10 | .04 | .01 | .03 | (.01) |
Net realized and unrealized gain (loss) | (6.64) | 1.35 | 1.85 | 3.34 | .45 |
Total from investment operations | (6.54) | 1.39 | 1.86 | 3.37 | .44 |
Distributions from net investment income | (.04) | (.01) | (.02) | - | (.01) |
Distributions from net realized gain | (2.39) | (.23) | (.01) | - | - |
Total distributions | (2.43) | (.24) | (.03) | - | (.01) |
Redemption fees added to paid in capital B | - F | - F | .02 | - F | .01 |
Net asset value, end of period | $ 9.03 | $ 18.00 | $ 16.85 | $ 15.00 | $ 11.63 |
Total Return A | (41.88)% | 8.36% | 12.54% | 28.98% | 4.03% |
Ratios to Average Net Assets C, E | | | | | |
Expenses before reductions | 1.12% | 1.08% | 1.08% | 1.03% | 1.04% |
Expenses net of fee waivers, if any | 1.12% | 1.08% | 1.08% | 1.03% | 1.04% |
Expenses net of all reductions | 1.10% | 1.06% | 1.05% | 1.02% | 1.04% |
Net investment income (loss) | .72% | .24% | .08% | .20% | (.04)% |
Supplemental Data | | | | | |
Net assets, end of period (000 omitted) | $ 1,025,334 | $ 1,779,451 | $ 1,763,387 | $ 1,075,145 | $ 647,453 |
Portfolio turnover rate D | 78% | 158% | 78% | 74% | 99% |
A Total returns would have been lower had certain expenses not been reduced during the periods shown. B Calculated based on average shares outstanding during the period. C Fees and expenses of the underlying Fidelity Central Funds are not included in the Fund's expense ratio. The Fund indirectly bears its proportionate share of the expenses of any underlying Fidelity Central Funds. D Amount does not include the portfolio activity of any underlying Fidelity Central Funds. E Expense ratios reflect operating expenses of the Fund. Expenses before reductions do not reflect amounts reimbursed by the investment adviser or reductions from brokerage service arrangements or other expense offset arrangements and do not represent the amount paid by the Fund during periods when reimbursements or reductions occur. Expenses net of fee waivers reflect expenses after reimbursement by the investment adviser but prior to reductions from brokerage service arrangements or other expense offset arrangements. Expenses net of all reductions represent the net expenses paid by the Fund. F Amount represents less than $.01 per share. |
See accompanying notes which are an integral part of the financial statements.
Annual Report
Japan Smaller Companies
Performance: The Bottom Line
Average annual total return reflects the change in the value of an investment, assuming reinvestment of the fund's dividend income and capital gains (the profits earned upon the sale of securities that have grown in value, if any) and assuming a constant rate of performance each year. The $10,000 table and the fund's returns do not reflect the deduction of taxes that a shareholder would pay on fund distributions or the redemption of fund shares. During periods of reimbursement by Fidelity, a fund's total returns will be greater than it would be had the reimbursement not occurred. How a fund did yesterday is no guarantee of how it will do tomorrow.
Average Annual Total Returns
Periods ended October 31, 2008 | Past 1
year | Past 5
years | Past 10 years |
Fidelity Japan Smaller Companies Fund | -43.58% | -5.49% | 7.06% |
$10,000 Over 10 years
Let's say hypothetically that $10,000 was invested in Fidelity Japan Smaller Companies Fund on October 31, 1998. The chart shows how the value of your investment would have changed, and also shows how the Russell/Nomura Small Cap Index performed over the same period.
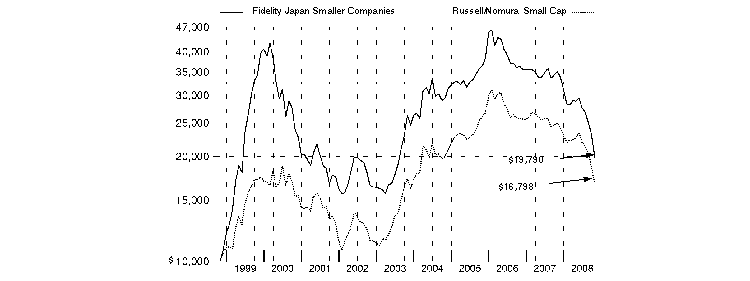
Annual Report
Japan Smaller Companies
Management's Discussion of Fund Performance
Comments from Kenichi Mizushita and Nicholas Price, Co-Portfolio Managers of Fidelity® Japan Smaller Companies Fund. Nicholas Price became Co-Manager on October 21, 2008.
Japanese stocks got walloped during the 12-month period ending October 31, 2008, a fate shared by most other stock markets globally. As measured by the Tokyo Stock Exchange Stock Price Index (TOPIX), Japanese share prices fell 36.04%, almost dead-even with the 36.10% setback sustained by the Standard & Poor's 500SM Index, a widely followed benchmark of U.S. stocks. By comparison, the MSCI® Europe, Australasia, Far East (EAFE®) Index - - a gauge of developed stock markets outside the United States and Canada - recorded a loss of 46.54%. An intensifying U.S. credit crisis was partly to blame, as a number of well-known firms in the U.S. financials sector declared bankruptcy, required government assistance or arranged to be purchased by a stronger competitor. The deteriorating economies of Japan's trading partners hurt the revenues and earnings of Japanese exporters. An appreciating yen aided the returns earned by U.S. investors but undermined exporters' ability to compete successfully with non-Japanese rivals. Meanwhile, economic growth in Japan continued to be disappointing, with gross domestic product (GDP) there contracting during the second quarter of 2008.
For the 12 months ending October 31, 2008, the fund declined 43.58%, trailing the Russell/Nomura Small CapTM Index, which fell 32.60%. The fund underperformed primarily due to its exposure to cyclical stocks in the capital goods industry. Major detractors here included construction machinery manufacturers susceptible to capital spending cycles in Asia, as well as automotive and machine parts manufacturers. Elsewhere, the fund's holdings in the banking industry hurt its relative return, as renewed concerns about earnings downgrades weighed on their stock prices. Our exposure to exporters in the technology hardware and equipment industry also detracted. A sudden and sharp appreciation in the yen and slowing demand for PCs, handsets and flat panels hurt results in this segment. Nippon Seiki, a manufacturer of instrument panels for motorcycles and automobiles, was felled by worries about the yen's appreciation and a global economic slowdown. United Technology, the holding company of a semiconductor manufacturing outsourcing service provider and marketer of used semiconductor manufacturing equipment, saw its stock price decline due to concerns about its stake in temporary staffing agency Radia Holdings, which put a strain on its balance sheet. On the upside, medical equipment maker Hogy Medical fared relatively well, reflecting a positive earnings outlook that boosted its stock performance. Sushi restaurant chain Kappa Create's solid earnings growth helped its stock price climb.
Note to shareholders: Fidelity is making several important changes to the fund effective on or about December 31, 2008. First, in response to changing market dynamics, the fund's investment focus will be broadened to include more exposure to mid-cap companies, and its primary benchmark will change to the Russell/Nomura Mid-Small Cap Index from the Russell/Nomura Small Cap Index to better reflect the fund's expanded investment universe. Also, Co-Manager Nick Price will take over sole management responsibilities in advance of Kenichi Mizushita's planned retirement from Fidelity in 2009. Lastly, the fund will reopen to new accounts.
The views expressed above reflect those of the portfolio manager(s) only through the end of the period as stated on the cover of this report and do not necessarily represent the views of Fidelity or any other person in the Fidelity organization. Any such views are subject to change at any time based upon market or other conditions and Fidelity disclaims any responsibility to update such views. These views may not be relied on as investment advice and, because investment decisions for a Fidelity fund are based on numerous factors, may not be relied on as an indication of trading intent on behalf of any Fidelity fund.
Annual Report
Japan Smaller Companies
Investment Changes (Unaudited)
Geographic Diversification (% of fund's net assets) |
As of October 31, 2008 |
| Japan | 95.9% | |
| United States of America | 4.0% | |
| Cayman Islands | 0.1% | |

Percentages are adjusted for the effect of futures contracts, if applicable. |
|
As of April 30, 2008 |
| Japan | 96.9% | |
| United States of America | 2.3% | |
| Cayman Islands | 0.5% | |
| Bermuda | 0.3% | |

Percentages are adjusted for the effect of futures contracts, if applicable. |
Asset Allocation |
| % of fund's
net assets | % of fund's net assets
6 months ago |
Stocks | 96.0 | 97.7 |
Short-Term Investments and Net Other Assets | 4.0 | 2.3 |
Top Ten Stocks as of October 31, 2008 |
| % of fund's
net assets | % of fund's net assets
6 months ago |
Rakuten, Inc. (Internet & Catalog Retail) | 4.0 | 3.2 |
Kappa Create Co. Ltd. (Hotels, Restaurants & Leisure) | 3.9 | 1.7 |
Toyo Suisan Kaisha Ltd. (Food Products) | 3.6 | 1.0 |
Hogy Medical Co. (Health Care Equipment & Supplies) | 3.2 | 2.6 |
Mitsubishi Tanabe Pharma Corp. (Pharmaceuticals) | 2.5 | 1.8 |
Nichi-iko Pharmaceutical Co. Ltd. (Pharmaceuticals) | 2.3 | 1.8 |
C. Uyemura & Co. Ltd. (Chemicals) | 2.3 | 2.0 |
Culture Convenience Club Co. Ltd. (Specialty Retail) | 2.2 | 0.7 |
FamilyMart Co. Ltd. (Food & Staples Retailing) | 2.2 | 1.1 |
Namco Bandai Holdings, Inc. (Leisure Equipment & Products) | 2.1 | 2.0 |
| 28.3 | |
Market Sectors as of October 31, 2008 |
| % of fund's
net assets | % of fund's net assets
6 months ago |
Consumer Discretionary | 23.6 | 23.3 |
Health Care | 17.1 | 11.7 |
Information Technology | 15.1 | 17.7 |
Consumer Staples | 13.3 | 7.4 |
Financials | 9.7 | 11.5 |
Industrials | 8.2 | 16.6 |
Utilities | 4.1 | 0.9 |
Materials | 4.0 | 6.9 |
Telecommunication Services | 0.9 | 0.0 |
Energy | 0.0 | 1.7 |
Annual Report
Japan Smaller Companies
Investments October 31, 2008
Showing Percentage of Net Assets
Common Stocks - 96.0% |
| Shares | | Value |
CONSUMER DISCRETIONARY - 23.6% |
Auto Components - 2.6% |
F-Tech, Inc. | 176,600 | | $ 1,422,022 |
H-One Co. Ltd. | 316,500 | | 1,493,281 |
Nippon Seiki Co. Ltd. | 824,000 | | 5,455,874 |
Nissin Kogyo Co. Ltd. | 123,300 | | 1,129,464 |
T Rad Co. Ltd. | 283,000 | | 518,976 |
Yutaka Giken Co. Ltd. | 10,400 | | 108,741 |
| | 10,128,358 |
Automobiles - 0.9% |
Mazda Motor Corp. | 984,000 | | 2,182,221 |
Yachiyo Industry Co. Ltd. | 190,600 | | 1,398,376 |
| | 3,580,597 |
Diversified Consumer Services - 0.6% |
Best Bridal, Inc. | 1,558 | | 2,451,390 |
Hotels, Restaurants & Leisure - 3.9% |
Kappa Create Co. Ltd. (d) | 633,550 | | 15,188,643 |
Household Durables - 0.8% |
Token Corp. | 137,370 | | 3,326,759 |
Internet & Catalog Retail - 4.1% |
Rakuten, Inc. (d) | 31,482 | | 15,606,040 |
Start Today Co. Ltd. (d) | 255 | | 498,684 |
| | 16,104,724 |
Leisure Equipment & Products - 3.5% |
Combi Corp. | 81,000 | | 398,556 |
Namco Bandai Holdings, Inc. | 797,700 | | 8,202,651 |
Nikon Corp. (d) | 379,000 | | 5,341,029 |
| | 13,942,236 |
Media - 1.2% |
CyberAgent, Inc. (d) | 4,315 | | 3,852,105 |
Tohokushinsha Film Corp. | 152,300 | | 798,300 |
| | 4,650,405 |
Multiline Retail - 0.7% |
Don Quijote Co. Ltd. (d) | 158,700 | | 2,877,656 |
Specialty Retail - 4.4% |
Chiyoda Co. Ltd. (d) | 146,800 | | 1,949,527 |
Culture Convenience Club Co. Ltd. (d) | 1,325,400 | | 8,779,589 |
Fast Retailing Co. Ltd. | 55,100 | | 5,873,807 |
United Arrows Ltd. (d) | 22,100 | | 158,979 |
Village Vanguard Co. Ltd. | 264 | | 674,027 |
| | 17,435,929 |
Textiles, Apparel & Luxury Goods - 0.9% |
Seiren Co. Ltd. | 620,000 | | 3,455,445 |
TOTAL CONSUMER DISCRETIONARY | | 93,142,142 |
CONSUMER STAPLES - 13.3% |
Beverages - 1.7% |
Asahi Breweries Ltd. | 165,100 | | 2,725,038 |
Coca-Cola West Japan Co. Ltd. | 74,000 | | 1,484,065 |
|
| Shares | | Value |
Ito En Ltd. (d) | 21,400 | | $ 340,828 |
Kirin Holdings Co. Ltd. | 192,000 | | 2,123,451 |
| | 6,673,382 |
Food & Staples Retailing - 2.7% |
Ain Pharmaciez, Inc. | 118,200 | | 2,264,760 |
FamilyMart Co. Ltd. | 218,800 | | 8,668,223 |
| | 10,932,983 |
Food Products - 8.9% |
Ajinomoto Co., Inc. | 447,000 | | 3,859,377 |
Dydo Drinco, Inc. | 31,200 | | 748,845 |
Frente Co. Ltd. | 176,600 | | 2,863,202 |
Hokuto Corp. | 234,600 | | 6,213,026 |
House Foods Corp. | 367,100 | | 5,966,770 |
Nissin Food Holdings Co. Ltd. | 42,800 | | 1,223,354 |
Toyo Suisan Kaisha Ltd. | 548,000 | | 14,128,694 |
| | 35,003,268 |
TOTAL CONSUMER STAPLES | | 52,609,633 |
FINANCIALS - 9.7% |
Commercial Banks - 5.0% |
Bank of Yokohama Ltd. | 918,000 | | 4,452,516 |
Chiba Bank Ltd. | 881,000 | | 4,354,244 |
Resona Holdings, Inc. (d) | 2,738 | | 2,871,001 |
Seven Bank Ltd. | 1,700 | | 4,896,158 |
Sumitomo Trust & Banking Co. Ltd. | 630,000 | | 2,917,431 |
| | 19,491,350 |
Consumer Finance - 0.7% |
ACOM Co. Ltd. | 1,150 | | 43,927 |
Aeon Credit Service Co. Ltd. | 257,300 | | 2,740,769 |
| | 2,784,696 |
Diversified Financial Services - 1.0% |
Mitsubishi UFJ Lease & Finance Co. Ltd. | 161,170 | | 3,859,590 |
Insurance - 1.1% |
Sony Financial Holdings, Inc. | 1,374 | | 4,468,405 |
Real Estate Investment Trusts - 0.3% |
Japan Real Estate Investment Corp. | 42 | | 371,895 |
Nippon Building Fund, Inc. | 83 | | 797,506 |
| | 1,169,401 |
Real Estate Management & Development - 1.6% |
Mitsui Fudosan Co. Ltd. | 365,000 | | 6,366,470 |
TOTAL FINANCIALS | | 38,139,912 |
HEALTH CARE - 17.1% |
Health Care Equipment & Supplies - 6.0% |
Hogy Medical Co. | 227,300 | | 12,553,926 |
Nakanishi, Inc. | 23,200 | | 1,662,520 |
Nihon Kohden Corp. | 95,500 | | 1,613,200 |
Sysmex Corp. | 253,000 | | 7,859,154 |
| | 23,688,800 |
Common Stocks - continued |
| Shares | | Value |
HEALTH CARE - continued |
Health Care Providers & Services - 0.2% |
Tsukui Corp. | 64,300 | | $ 596,472 |
Life Sciences Tools & Services - 0.9% |
Shin Nippon Biomedical Laboratories Ltd. (d) | 264,900 | | 3,399,581 |
Pharmaceuticals - 10.0% |
Fuji Pharma Co. Ltd. | 262,400 | | 3,394,576 |
JCR Pharmaceuticals Co. Ltd. | 471,000 | | 1,642,629 |
Kissei Pharmaceutical Co. Ltd. | 198,000 | | 4,515,084 |
Mitsubishi Tanabe Pharma Corp. | 937,000 | | 9,861,106 |
Nichi-iko Pharmaceutical Co. Ltd. (d) | 432,600 | | 9,142,354 |
Sawai Pharmaceutical Co. Ltd. (d) | 96,300 | | 3,705,255 |
Towa Pharmaceutical Co. Ltd. | 67,500 | | 2,007,358 |
Tsumura & Co. | 208,100 | | 5,325,466 |
| | 39,593,828 |
TOTAL HEALTH CARE | | 67,278,681 |
INDUSTRIALS - 8.2% |
Building Products - 0.9% |
Comany, Inc. | 194,300 | | 1,487,719 |
Daikin Industries Ltd. | 82,600 | | 1,857,782 |
| | 3,345,501 |
Commercial Services & Supplies - 1.0% |
Certo Corp. | 1,300 | | 15,497 |
Nissha Printing Co. Ltd. (d) | 29,000 | | 1,612,602 |
Sanix, Inc. (a)(d) | 1,832,000 | | 2,485,466 |
| | 4,113,565 |
Construction & Engineering - 1.3% |
SHO-BOND Holdings Co. Ltd. | 109,900 | | 1,963,297 |
Toshiba Plant Systems & Services Corp. (d) | 397,000 | | 3,269,842 |
| | 5,233,139 |
Electrical Equipment - 0.2% |
Daihen Corp. | 271,000 | | 631,770 |
Machinery - 1.1% |
China Boqi Environmental Solutions Technology (Holding) Co. Ltd. | 2,196 | | 546,357 |
Hisaka Works Ltd. (d) | 73,000 | | 841,769 |
Nittoku Engineering Co. Ltd. | 15,600 | | 73,121 |
Taiho Kogyo Co. Ltd. | 446,900 | | 2,964,243 |
| | 4,425,490 |
Road & Rail - 0.8% |
Hamakyorex Co. Ltd. | 172,600 | | 3,183,574 |
Trading Companies & Distributors - 2.9% |
Itochu Corp. | 959,000 | | 5,067,819 |
|
| Shares | | Value |
JFE Shoji Holdings, Inc. | 456,000 | | $ 1,439,262 |
Marubeni Corp. | 1,273,000 | | 4,945,413 |
| | 11,452,494 |
TOTAL INDUSTRIALS | | 32,385,533 |
INFORMATION TECHNOLOGY - 15.1% |
Computers & Peripherals - 1.7% |
Megachips Corp. (d) | 388,100 | | 4,469,448 |
Melco Holdings, Inc. (d) | 180,000 | | 2,241,154 |
Mimaki Engineering Co., Ltd. (d) | 570 | | 225,973 |
| | 6,936,575 |
Electronic Equipment & Components - 5.1% |
Furuno Electric Co. Ltd. | 228,400 | | 1,354,783 |
Hamamatsu Photonics KK | 309,700 | | 6,873,452 |
Meiko Electronics Co. Ltd. (d) | 353,100 | | 3,996,363 |
Nidec Corp. | 41,800 | | 2,248,033 |
Nippon Electric Glass Co. Ltd. | 425,000 | | 2,556,240 |
Shibaura Electronics Co. Ltd. (d) | 57,000 | | 391,210 |
Sunx Ltd. (d) | 860,600 | | 2,721,657 |
| | 20,141,738 |
Internet Software & Services - 1.5% |
Kakaku.com, Inc. (d) | 489 | | 1,438,378 |
Yahoo! Japan Corp. | 12,042 | | 3,984,363 |
Zappallas, Inc. (d) | 215 | | 513,353 |
| | 5,936,094 |
IT Services - 1.5% |
Otsuka Corp. | 112,000 | | 5,633,130 |
VarioSecure Networks, Inc. | 289 | | 187,027 |
| | 5,820,157 |
Office Electronics - 0.2% |
Konica Minolta Holdings, Inc. | 116,000 | | 761,769 |
Semiconductors & Semiconductor Equipment - 0.8% |
Ferrotec Corp. | 182,200 | | 2,015,886 |
Ishii Hyoki Co. Ltd. | 12,500 | | 196,325 |
United Technology Holdings Co. Ltd. | 6,545 | | 979,478 |
| | 3,191,689 |
Software - 4.3% |
Capcom Co. Ltd. (d) | 231,100 | | 5,151,818 |
Hudson Soft Co. Ltd. (a) | 52,700 | | 615,117 |
Konami Corp. | 221,000 | | 3,997,877 |
OBIC Business Consultants Ltd. (d) | 22,200 | | 924,212 |
Works Applications Co. Ltd. | 10,151 | | 6,237,198 |
| | 16,926,222 |
TOTAL INFORMATION TECHNOLOGY | | 59,714,244 |
MATERIALS - 4.0% |
Chemicals - 4.0% |
C. Uyemura & Co. Ltd. | 320,700 | | 9,110,530 |
Daicel Chemical Industries Ltd. | 310,000 | | 1,117,679 |
Mitsui Chemicals, Inc. | 620,000 | | 2,164,612 |
Common Stocks - continued |
| Shares | | Value |
MATERIALS - continued |
Chemicals - continued |
Taiyo Kagaku Co. Ltd. | 39,900 | | $ 207,303 |
Tohcello Co. Ltd. | 730,500 | | 3,047,038 |
| | 15,647,162 |
TELECOMMUNICATION SERVICES - 0.9% |
Wireless Telecommunication Services - 0.9% |
Softbank Corp. | 349,000 | | 3,436,581 |
UTILITIES - 4.1% |
Electric Utilities - 0.6% |
Tohoku Electric Power Co., Inc. | 105,500 | | 2,369,586 |
Gas Utilities - 3.5% |
Osaka Gas Co. Ltd. | 1,886,000 | | 6,670,901 |
Tokyo Gas Co. Ltd. | 1,627,000 | | 6,995,669 |
| | 13,666,570 |
TOTAL UTILITIES | | 16,036,156 |
TOTAL COMMON STOCKS (Cost $463,158,766) | 378,390,044 |
Money Market Funds - 18.5% |
| Shares | | Value |
Fidelity Cash Central Fund, 1.81% (b) | 13,202,750 | | $ 13,202,750 |
Fidelity Securities Lending Cash Central Fund, 2.67% (b)(c) | 59,502,053 | | 59,502,053 |
TOTAL MONEY MARKET FUNDS (Cost $72,704,803) | 72,704,803 |
TOTAL INVESTMENT
PORTFOLIO - 114.5% (Cost $535,863,569) | 451,094,847 |
NET OTHER ASSETS - (14.5)% | | (57,160,998) |
NET ASSETS - 100% | $ 393,933,849 |
Legend |
(a) Non-income producing |
(b) Affiliated fund that is available only to investment companies and other accounts managed by Fidelity Investments. The rate quoted is the annualized seven-day yield of the fund at period end. A complete unaudited listing of the fund's holdings as of its most recent quarter end is available upon request. |
(c) Investment made with cash collateral received from securities on loan. |
(d) Security or a portion of the security is on loan at period end. |
Affiliated Central Funds |
Information regarding fiscal year to date income earned by the Fund from investments in Fidelity Central Funds is as follows: |
Fund | Income earned |
Fidelity Cash Central Fund | $ 505,495 |
Fidelity Securities Lending Cash Central Fund | 1,163,698 |
Total | $ 1,669,193 |
Income Tax Information |
At October 31, 2008, the fund had a capital loss carryforward of approximately $58,533,238 all of which will expire on October 31, 2016. |
See accompanying notes which are an integral part of the financial statements.
Annual Report
Japan Smaller Companies
Financial Statements
Statement of Assets and Liabilities
| October 31, 2008 |
| | |
Assets | | |
Investment in securities, at value (including securities loaned of $56,544,761) -
See accompanying schedule: Unaffiliated issuers
(cost $463,158,766) | $ 378,390,044 | |
Fidelity Central Funds
(cost $72,704,803) | 72,704,803 | |
Total Investments
(cost $535,863,569) | | $ 451,094,847 |
Foreign currency held at value
(cost $3,663) | | 3,663 |
Receivable for fund shares sold | | 190,545 |
Dividends receivable | | 2,772,485 |
Distributions receivable from Fidelity Central Funds | | 150,124 |
Prepaid expenses | | 206 |
Other receivables | | 5,524 |
Total assets | | 454,217,394 |
| | |
Liabilities | | |
Payable for fund shares redeemed | $ 343,378 | |
Accrued management fee | 235,095 | |
Other affiliated payables | 113,475 | |
Other payables and accrued expenses | 89,544 | |
Collateral on securities loaned, at value | 59,502,053 | |
Total liabilities | | 60,283,545 |
| | |
Net Assets | | $ 393,933,849 |
Net Assets consist of: | | |
Paid in capital | | $ 538,858,532 |
Undistributed net investment income | | 2,239,289 |
Accumulated undistributed net realized gain (loss) on investments and foreign currency transactions | | (62,590,036) |
Net unrealized appreciation (depreciation) on investments and assets and liabilities in foreign currencies | | (84,573,936) |
Net Assets, for 56,394,407 shares outstanding | | $ 393,933,849 |
Net Asset Value, offering price and redemption price per share ($393,933,849 ÷ 56,394,407 shares) | | $ 6.99 |
Statement of Operations
| Year ended October 31, 2008 |
| | |
Investment Income | | |
Dividends | | $ 7,609,386 |
Interest | | 140 |
Income from Fidelity Central Funds (including $1,163,698 from security lending) | | 1,669,193 |
| | 9,278,719 |
Less foreign taxes withheld | | (531,459) |
Total income | | 8,747,260 |
| | |
Expenses | | |
Management fee | $ 4,232,517 | |
Transfer agent fees | 1,343,887 | |
Accounting and security lending fees | 310,770 | |
Custodian fees and expenses | 181,048 | |
Independent trustees' compensation | 2,700 | |
Registration fees | 17,608 | |
Audit | 53,607 | |
Legal | 3,470 | |
Miscellaneous | 91,710 | |
Total expenses before reductions | 6,237,317 | |
Expense reductions | (87,061) | 6,150,256 |
Net investment income (loss) | | 2,597,004 |
Realized and Unrealized Gain (Loss) Net realized gain (loss) on: | | |
Investment securities: | | |
Unaffiliated issuers | (61,878,482) | |
Foreign currency transactions | (161,238) | |
Total net realized gain (loss) | | (62,039,720) |
Change in net unrealized appreciation (depreciation) on: Investment securities | (271,965,929) | |
Assets and liabilities in foreign currencies | 209,328 | |
Total change in net unrealized appreciation (depreciation) | | (271,756,601) |
Net gain (loss) | | (333,796,321) |
Net increase (decrease) in net assets resulting from operations | | $ (331,199,317) |
See accompanying notes which are an integral part of the financial statements.
Annual Report
Statement of Changes in Net Assets
| Year ended
October 31,
2008 | Year ended
October 31,
2007 |
Increase (Decrease) in Net Assets | | |
Operations | | |
Net investment income (loss) | $ 2,597,004 | $ 2,152,720 |
Net realized gain (loss) | (62,039,720) | 26,682,805 |
Change in net unrealized appreciation (depreciation) | (271,756,601) | (71,642,963) |
Net increase (decrease) in net assets resulting from operations | (331,199,317) | (42,807,438) |
Distributions to shareholders from net investment income | (1,282,366) | (857,665) |
Distributions to shareholders from net realized gain | (13,464,846) | (30,875,932) |
Total distributions | (14,747,212) | (31,733,597) |
Share transactions
Proceeds from sales of shares | 64,044,453 | 82,370,930 |
Reinvestment of distributions | 10,772,639 | 27,705,629 |
Cost of shares redeemed | (146,648,963) | (441,231,069) |
Net increase (decrease) in net assets resulting from share transactions | (71,831,871) | (331,154,510) |
Redemption fees | 59,325 | 109,393 |
Total increase (decrease) in net assets | (417,719,075) | (405,586,152) |
| | |
Net Assets | | |
Beginning of period | 811,652,924 | 1,217,239,076 |
End of period (including undistributed net investment income of $2,239,289 and undistributed net investment income of $1,918,752, respectively) | $ 393,933,849 | $ 811,652,924 |
Other Information Shares | | |
Sold | 6,465,046 | 6,576,733 |
Issued in reinvestment of distributions | 912,936 | 2,141,084 |
Redeemed | (15,250,412) | (35,107,344) |
Net increase (decrease) | (7,872,430) | (26,389,527) |
Financial Highlights
Years ended October 31, | 2008 | 2007 | 2006 | 2005 | 2004 |
Selected Per-Share Data | | | | | |
Net asset value, beginning of period | $ 12.63 | $ 13.43 | $ 14.25 | $ 11.58 | $ 10.35 |
Income from Investment Operations | | | | | |
Net investment income (loss) B | .04 | .03 | .01 | .03 | .01 |
Net realized and unrealized gain (loss) | (5.45) | (.46) | -F | 2.69 | 1.20 |
Total from investment operations | (5.41) | (.43) | .01 | 2.72 | 1.21 |
Distributions from net investment income | (.02) | (.01) | (.02) | (.01) | (.02) |
Distributions from net realized gain | (.21) | (.36) | (.83) | (.05) | - |
Total distributions | (.23) | (.37) | (.85) | (.06) | (.02) |
Redemption fees added to paid in capital B | - F | -F | .02 | .01 | .04 |
Net asset value, end of period | $ 6.99 | $ 12.63 | $ 13.43 | $ 14.25 | $ 11.58 |
Total Return A | (43.58)% | (3.27)% | (.36)% | 23.69% | 12.12% |
Ratios to Average Net Assets C, E | | | | | |
Expenses before reductions | 1.05% | 1.02% | 1.02% | 1.02% | 1.04% |
Expenses net of fee waivers, if any | 1.05% | 1.02% | 1.02% | 1.02% | 1.04% |
Expenses net of all reductions | 1.03% | 1.00% | 1.01% | 1.01% | 1.04% |
Net investment income (loss) | .44% | .23% | .09% | .22% | .11% |
Supplemental Data | | | | | |
Net assets, end of period (000 omitted) | $ 393,934 | $ 811,653 | $ 1,217,239 | $ 1,406,673 | $ 1,279,091 |
Portfolio turnover rate D | 86% | 76% | 98% | 65% | 57% |
A Total returns would have been lower had certain expenses not been reduced during the periods shown. B Calculated based on average shares outstanding during the period. C Fees and expenses of the underlying Fidelity Central Funds are not included in the Fund's expense ratio. The Fund indirectly bears its proportionate share of the expenses of any underlying Fidelity Central Funds. D Amount does not include the portfolio activity of any underlying Fidelity Central Funds. E Expense ratios reflect operating expenses of the Fund. Expenses before reductions do not reflect amounts reimbursed by the investment adviser or reductions from brokerage service arrangements or other expense offset arrangements and do not represent the amount paid by the Fund during periods when reimbursements or reductions occur. Expenses net of fee waivers reflect expenses after reimbursement by the investment adviser but prior to reductions from brokerage service arrangements or other expense offset arrangements. Expenses net of all reductions represent the net expenses paid by the Fund. F Amount represents less than $.01 per share. |
See accompanying notes which are an integral part of the financial statements.
Annual Report
Latin America
Performance: The Bottom Line
Average annual total return reflects the change in the value of an investment, assuming reinvestment of the fund's dividend income and capital gains (the profits earned upon the sale of securities that have grown in value, if any) and assuming a constant rate of performance each year. The $10,000 table and the fund's returns do not reflect the deduction of taxes that a shareholder would pay on fund distributions or the redemption of fund shares. During periods of reimbursement by Fidelity, a fund's total returns will be greater than it would be had the reimbursement not occurred. How a fund did yesterday is no guarantee of how it will do tomorrow.
Average Annual Total Returns
Periods ended October 31, 2008 | Past 1
year | Past 5
years | Past 10
years |
Fidelity Latin America Fund | -56.20% | 19.42% | 12.60% |
$10,000 Over 10 Years
Let's say hypothetically that $10,000 was invested in Fidelity Latin America Fund on October 31, 1998. The chart shows how the value of your investment would have changed, and also shows how the MSCI EM - Latin America Index performed over the same period.
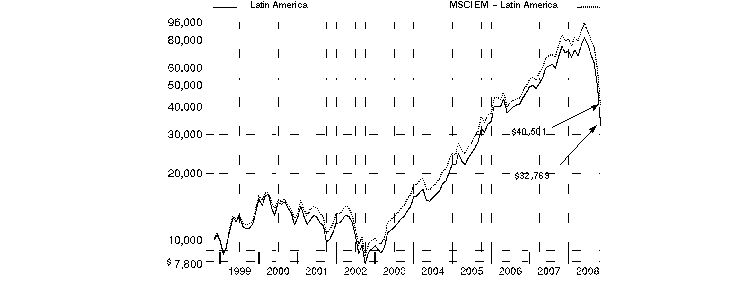
Annual Report
Latin America
Management's Discussion of Fund Performance
Comments from Brent Bottamini, Portfolio Manager of Fidelity® Latin America Fund
Stocks across the emerging-markets universe suffered steep losses for the 12 months ending October 31, 2008. In that time, the MSCI® Emerging Markets Index fell 56.22%. All three of the benchmark's primary regions - Europe/Middle East/Africa (EMEA), Latin America, and Asia ex Australia and New Zealand - declined by more than 50%. In EMEA, major benchmark component Russia saw its market tumble by more than 62%, while Brazil - representing the benchmark's largest weighting during the period, on average, at almost 15% - finished with a setback of more than 53%. In both cases, falling commodity prices triggered by slowing global economies had a negative impact on share prices. Meanwhile, South Korea, the second-largest benchmark component, experienced a nearly 60% drop. Chinese stocks also were hard-hit, down roughly 67%. Asian emerging markets suffered in part due to concerns about slowing exports in the wake of decelerating economic growth in the United States and Europe, as the U.S. credit crisis continued to worsen and expand its reach abroad.
For the year, the fund returned -56.20%, underperforming the -51.77% return of the MSCI Emerging Markets - Latin America Index. Unfavorable security selection in consumer discretionary, telecommunication services, materials and utilities hurt, as did underweightings in consumer staples, utilities and telecom services. Overweighting media stocks helped, as did our positioning within diversified financials and carrying a modest cash position. Geographically, unsuccessful security selection in Mexico and Brazil hurt. Underweighting a U.S. stock included in the index (Southern Copper) and an out-of-benchmark stake in Panama helped. Detractors included not owning two index components, Brazilian electric utility Eletrobras and Mexican telecom firm Telmex. An out-of-benchmark position in Bermuda-listed Dufry South America, which operates duty free shops in Brazilian airports, also hurt. Overweighting Brazilian materials firm Companhia do Rio Doce detracted further. A contribution came from underweighting Brazilian energy firm OGX Petroleo e Gas.
Note to shareholders: Fidelity Latin America Fund may invest up to 35% of its total assets in any industry that represents more than 20% of the Latin American market. As of October 31, 2008, the fund did not have more than 25% of its total assets invested in any one industry.
The views expressed above reflect those of the portfolio manager(s) only through the end of the period as stated on the cover of this report and do not necessarily represent the views of Fidelity or any other person in the Fidelity organization. Any such views are subject to change at any time based upon market or other conditions and Fidelity disclaims any responsibility to update such views. These views may not be relied on as investment advice and, because investment decisions for a Fidelity fund are based on numerous factors, may not be relied on as an indication of trading intent on behalf of any Fidelity fund.
Annual Report
Latin America
Investment Changes (Unaudited)
Geographic Diversification (% of fund's net assets) |
As of October 31, 2008 |
| Brazil | 66.5% | |
| Mexico | 21.6% | |
| United States of America | 4.2% | |
| Bermuda | 2.8% | |
| Chile | 2.6% | |
| Panama | 1.1% | |
| Peru | 0.8% | |
| Luxembourg | 0.3% | |
| Argentina | 0.1% | |

Percentages are adjusted for the effect of futures contracts, if applicable. |
|
As of April 30, 2008 |
| Brazil | 68.2% | |
| Mexico | 19.5% | |
| United States of America | 4.7% | |
| Luxembourg | 2.5% | |
| Chile | 2.0% | |
| Bermuda | 1.7% | |
| Panama | 0.7% | |
| Colombia | 0.4% | |
| Argentina | 0.3% | |

Percentages are adjusted for the effect of futures contracts, if applicable. |
Asset Allocation |
| % of fund's
net assets | % of fund's net assets
6 months ago |
Stocks | 96.0 | 96.2 |
Short-Term Investments and Net Other Assets | 4.0 | 3.8 |
Top Ten Stocks as of October 31, 2008 |
| % of fund's
net assets | % of fund's net assets
6 months ago |
Petroleo Brasileiro SA - Petrobras (PN) (non-vtg.) (Brazil, Oil, Gas & Consumable Fuels) | 10.4 | 10.3 |
Companhia Vale do Rio Doce (PN-A) (Brazil, Metals & Mining) | 7.9 | 8.6 |
America Movil SAB de CV Series L sponsored ADR (Mexico, Wireless Telecommunication Services) | 7.4 | 7.1 |
Petroleo Brasileiro SA - Petrobras (Brazil, Oil, Gas & Consumable Fuels) | 6.2 | 8.3 |
Banco Bradesco SA (PN) (Brazil, Commercial Banks) | 4.1 | 4.1 |
Grupo Televisa SA de CV (CPO) (Mexico, Media) | 3.7 | 2.7 |
Companhia Vale do Rio Doce sponsored ADR (Brazil, Metals & Mining) | 3.7 | 5.5 |
Uniao de Bancos Brasileiros SA (Unibanco) (Brazil, Commercial Banks) | 2.4 | 2.5 |
Wal-Mart de Mexico SA de CV Series V (Mexico, Food & Staples Retailing) | 2.1 | 1.0 |
Companhia de Bebidas das Americans (AmBev) (PN) sponsored ADR (Brazil, Beverages) | 2.0 | 1.6 |
| 49.9 | |
Market Sectors as of October 31, 2008 |
| % of fund's
net assets | % of fund's net assets
6 months ago |
Materials | 20.8 | 29.1 |
Energy | 16.9 | 20.5 |
Financials | 16.8 | 14.9 |
Telecommunication Services | 13.6 | 11.1 |
Consumer Discretionary | 10.3 | 8.4 |
Consumer Staples | 6.3 | 4.9 |
Utilities | 5.9 | 2.5 |
Industrials | 3.3 | 3.8 |
Information Technology | 1.7 | 0.7 |
Health Care | 0.4 | 0.3 |
Annual Report
Latin America
Investments October 31, 2008
Showing Percentage of Net Assets
Common Stocks - 92.2% |
| Shares | | Value |
Argentina - 0.1% |
Grupo Clarin SA GDR (f) | 800,100 | | $ 3,080,385 |
Bermuda - 2.8% |
Credicorp Ltd. (NY Shares) | 935,877 | | 36,751,890 |
Dufry South America Ltd. unit | 2,884,348 | | 17,725,639 |
GP Investments, Ltd. unit | 2,208,539 | | 7,653,656 |
TOTAL BERMUDA | | 62,131,185 |
Brazil - 62.7% |
Acucar Guarani SA (a) | 1,897,700 | | 2,051,852 |
AES Tiete SA (PN) (non-vtg.) | 3,436,100 | | 21,465,702 |
America Latina Logistica SA unit | 2,518,800 | | 11,615,204 |
B2W Companhia Global Do Varejo | 771,700 | | 9,912,790 |
Banco Bradesco SA: | | | |
(PN) | 2,120,712 | | 24,350,658 |
(PN) sponsored ADR (e) | 5,652,600 | | 66,135,420 |
Banco do Brasil SA | 3,961,000 | | 26,172,396 |
Banco do Estado do Rio Grande do Sul SA (f) | 2,794,569 | | 6,469,268 |
Banco Indusval SA | 402,638 | | 893,015 |
Banco Itau Holding Financeira SA sponsored ADR (non-vtg.) | 3,783,150 | | 41,841,639 |
BM&F BOVESPA SA | 6,087,700 | | 16,174,233 |
Brasil Telecom SA (PN) | 1,119,400 | | 6,672,332 |
Companhia Brasileira de Desenvolvimento Imobiliario Turistico (a) | 37,500 | | 7,017,605 |
Companhia de Bebidas das Americas (AmBev): | | | |
(PN) sponsored ADR (e) | 1,065,326 | | 45,276,355 |
sponsored ADR | 66,745 | | 2,408,827 |
Companhia de Saneamento de Minas Gerais | 940,200 | | 5,951,733 |
Companhia Energetica de Minas Gerais (CEMIG) (PN) sponsored ADR (non-vtg.) | 2,345,000 | | 35,667,450 |
Companhia Siderurgica Nacional SA (CSN) sponsored ADR (e) | 1,122,400 | | 15,264,640 |
Companhia Vale do Rio Doce: | | | |
(PN-A) sponsored ADR | 13,741,700 | | 160,915,307 |
sponsored ADR (e) | 6,259,500 | | 82,124,640 |
Cyrela Brazil Realty SA | 1,761,000 | | 8,397,339 |
Eletropaulo Metropolitana SA (PN-B) | 1,423,660 | | 17,498,085 |
Equatorial Energia SA | 1,380,600 | | 7,782,700 |
Gerdau SA sponsored ADR | 4,366,300 | | 27,987,983 |
GVT Holding SA (a) | 3,590,000 | | 39,065,012 |
LLX Logistica SA | 1,411,000 | | 495,499 |
Localiza Rent a Car SA | 2,082,199 | | 8,081,726 |
MPX Mineracao e Energia SA | 35,000 | | 1,892,154 |
MRV Engenharia e Participacoes SA | 1,734,500 | | 8,984,264 |
Multiplan Empreendimentos Imobiliarios SA (a) | 1,382,200 | | 6,955,068 |
Net Servicos de Comunicacao SA: | | | |
sponsored ADR | 167,000 | | 1,092,180 |
(PN) (a) | 5,639,000 | | 35,878,861 |
|
| Shares | | Value |
OGX Petroleo e Gas Participacoes SA | 50,500 | | $ 6,335,484 |
PDG Realty S.A. Empreendimentos e Participacoes | 2,094,800 | | 10,695,657 |
Petroleo Brasileiro SA - Petrobras: | | | |
(ON) | 388,200 | | 5,144,430 |
(PN) (non-vtg.) | 5,810,060 | | 62,659,089 |
(PN) sponsored ADR (non-vtg.) | 7,672,300 | | 169,327,661 |
sponsored ADR (e) | 4,941,720 | | 132,882,851 |
Porto Seguro SA | 940,300 | | 4,670,652 |
Profarma Distribuidora de Produtos Farmaceuticos SA | 1,151,000 | | 5,052,444 |
Redecard SA | 1,055,400 | | 11,464,954 |
Tegma Gestao Logistica | 1,967,200 | | 4,544,866 |
Tele Norte Leste Participacoes SA | 663,100 | | 9,957,837 |
Tele Norte Leste Participacoes SA sponsored ADR (non-vtg.) | 2,974,100 | | 40,388,278 |
Terna Participacoes SA unit | 1,216,800 | | 9,389,409 |
TIM Participacoes SA | 1,633,200 | | 2,331,849 |
TIM Participacoes SA sponsored ADR (non-vtg.) (e) | 751,400 | | 10,865,244 |
Totvs SA | 1,532,400 | | 26,552,537 |
Tractebel Energia SA | 1,952,100 | | 15,333,934 |
Uniao de Bancos Brasileiros SA (Unibanco): | | | |
unit | 422,800 | | 2,617,836 |
GDR | 805,600 | | 50,817,248 |
Usinas Siderurgicas de Minas Gerais SA - Usiminas | 502,375 | | 5,756,815 |
Vivo Participacoes SA: | | | |
(PN) | 135,525 | | 1,476,610 |
sponsored ADR | 2,092,400 | | 22,890,856 |
Votorantim Celulose e Papel SA: | | | |
(PN) (non-vtg.) | 96,565 | | 950,390 |
sponsored ADR (non-vtg.) (e) | 3,066,850 | | 30,944,517 |
TOTAL BRAZIL | | 1,395,543,385 |
Chile - 2.6% |
Banco Santander Chile sponsored ADR | 305,475 | | 10,936,005 |
CAP SA | 2,095,298 | | 25,240,493 |
Empresa Nacional de Electricidad SA sponsored ADR | 359,700 | | 13,380,840 |
Vina Concha y Toro SA sponsored ADR (e) | 313,250 | | 8,598,713 |
TOTAL CHILE | | 58,156,051 |
Luxembourg - 0.3% |
Ternium SA sponsored ADR (e) | 668,700 | | 5,891,247 |
Mexico - 21.6% |
Alsea SAB de CV | 17,488,682 | | 9,463,984 |
America Movil SAB de CV Series L sponsored ADR (e) | 5,303,500 | | 164,090,290 |
Cemex SA de CV sponsored ADR (e) | 2,605,067 | | 19,694,307 |
Controladora Commercial Mexicana
SA unit | 3,705,485 | | 1,021,310 |
Corporacion Geo SA de CV
Series B (a) | 11,698,700 | | 16,212,872 |
Common Stocks - continued |
| Shares | | Value |
Mexico - continued |
Desarrolladora Homex Sab de CV (a) | 1,009,500 | | $ 3,871,056 |
Desarrolladora Homex Sab de CV sponsored ADR (a) | 419,300 | | 9,761,304 |
Empresas ICA Sociedad Controladora SA de CV (a) | 5,255,100 | | 7,548,086 |
Fomento Economico Mexicano SA de CV sponsored ADR | 1,292,695 | | 32,692,257 |
Genomma Lab Internacional SA de CV | 3,332,600 | | 3,363,649 |
Grupo Aeroportuario del Pacifico SA de CV sponsored ADR | 1,094,000 | | 19,987,380 |
Grupo Aeroportuario Norte Sab de CV ADR | 1,056,200 | | 8,946,014 |
Grupo Financiero Banorte SA de CV Series O | 7,550,200 | | 13,828,356 |
Grupo Mexico SA de CV Series B | 29,332,671 | | 22,887,682 |
Grupo Televisa SA de CV | 1,507,400 | | 5,278,241 |
Grupo Televisa SA de CV (CPO) sponsored ADR | 4,426,600 | | 78,173,756 |
Urbi, Desarrollos Urbanos, SA de CV (a) | 10,593,900 | | 15,874,400 |
Wal-Mart de Mexico SA de CV Series V | 17,600,816 | | 47,281,695 |
TOTAL MEXICO | | 479,976,639 |
Panama - 1.1% |
Copa Holdings SA Class A | 389,600 | | 9,884,152 |
Intergroup Financial Services Corp. | 1,060,239 | | 11,662,629 |
Intergroup Financial Services Corp. (f) | 249,320 | | 2,742,520 |
TOTAL PANAMA | | 24,289,301 |
Peru - 0.8% |
Compania de Minas Buenaventura SA sponsored ADR | 1,433,152 | | 18,115,041 |
United States of America - 0.2% |
NII Holdings, Inc. (a) | 185,805 | | 4,786,337 |
TOTAL COMMON STOCKS (Cost $2,497,392,125) | 2,051,969,571 |
Nonconvertible Preferred Stocks - 3.8% |
| | | |
Brazil - 3.8% |
Banco Itau Holding Financeira SA (non-vtg.) | 3,372,050 | | 36,459,648 |
Companhia Vale do Rio Doce (PN-A) | 1,404,500 | | 16,308,606 |
Empresa Nacional de Comercio Redito e Participacoes SA (PN) (a) | 11,465 | | 142,981 |
Usinas Siderurgicas de Minas Gerais SA - Usiminas (PN-A) (non-vtg.) | 2,445,950 | | 31,306,171 |
TOTAL NONCONVERTIBLE PREFERRED STOCKS (Cost $31,874,837) | 84,217,406 |
Convertible Bonds - 0.0% |
| Principal Amount (d) | | Value |
Brazil - 0.0% |
Companhia de Saneamento de Minas Gerais 8.55% 6/1/13 (g)(h)
(Cost $957,155) | BRL | 15,278 | | $ 386,856 |
Money Market Funds - 7.6% |
| Shares | | |
Fidelity Cash Central Fund, 1.81% (b) | 61,853,921 | | 61,853,921 |
Fidelity Securities Lending Cash Central Fund, 2.67% (b)(c) | 106,801,775 | | 106,801,775 |
TOTAL MONEY MARKET FUNDS (Cost $168,655,696) | 168,655,696 |
TOTAL INVESTMENT
PORTFOLIO - 103.6% (Cost $2,698,879,813) | | 2,305,229,529 |
NET OTHER ASSETS - (3.6)% | | (79,623,145) |
NET ASSETS - 100% | $ 2,225,606,384 |
Currency Abbreviation |
BRL | - | Brazilian real |
Legend |
(a) Non-income producing |
(b) Affiliated fund that is available only to investment companies and other accounts managed by Fidelity Investments. The rate quoted is the annualized seven-day yield of the fund at period end. A complete unaudited listing of the fund's holdings as of its most recent quarter end is available upon request. |
(c) Investment made with cash collateral received from securities on loan. |
(d) Principal amount is stated in United States dollars unless otherwise noted. |
(e) Security or a portion of the security is on loan at period end. |
(f) Security exempt from registration under Rule 144A of the Securities Act of 1933. These securities may be resold in transactions exempt from registration, normally to qualified institutional buyers. At the end of the period, the value of these securities amounted to $ 12,292,173 or 0.6% of net assets. |
(g) The coupon rate shown on floating or adjustable rate securities represents the rate at period end. |
(h) Restricted securities - Investment in securities not registered under the Securities Act of 1933 (excluding 144A issues). At the end of the period, the value of restricted securities (excluding 144A issues) amounted to $386,856 or 0.0% of net assets. |
Additional information on each holding is as follows: |
Security | Acquisition Date | Acquisition Cost |
Companhia de Saneamento de Minas Gerais 8.55% 6/1/13 | 8/20/07 | $ 957,155 |
Affiliated Central Funds |
Information regarding fiscal year to date income earned by the Fund from investments in Fidelity Central Funds is as follows: |
Fund | Income earned |
Fidelity Cash Central Fund | $ 4,202,795 |
Fidelity Securities Lending Cash Central Fund | 1,031,560 |
Total | $ 5,234,355 |
Other Affiliated Issuers |
An affiliated company is a company in which the fund has ownership of at least 5% of the voting securities. Fiscal year to date transactions with companies which are or were affiliates are as follows: |
Affiliate | Value, beginning of period | Purchases | Sales
Proceeds | Dividend
Income | Value, end of period |
Totvs SA | $ 47,368,360 | $ 19,718,854 | $ 8,685,207 | $ 828,438 | $ - |
Income Tax Information |
At October 31, 2008, the fund had a capital loss carryforward of approximately $156,435,569 all of which will expire on October 31, 2016. |
See accompanying notes which are an integral part of the financial statements.
Annual Report
Latin America
Financial Statements
Statement of Assets and Liabilities
| October 31, 2008 |
| | |
Assets | | |
Investment in securities, at value (including securities loaned of $102,574,430) -
See accompanying schedule: Unaffiliated issuers
(cost $2,530,224,117) | $ 2,136,573,833 | |
Fidelity Central Funds
(cost $168,655,696) | 168,655,696 | |
Total Investments
(cost $2,698,879,813) | | $ 2,305,229,529 |
Receivable for investments sold | | 36,380,476 |
Receivable for fund shares sold | | 7,355,717 |
Dividends receivable | | 9,982,223 |
Interest receivable | | 231 |
Distributions receivable from Fidelity Central Funds | | 191,127 |
Prepaid expenses | | 2,572 |
Other receivables | | 229,888 |
Total assets | | 2,359,371,763 |
| | |
Liabilities | | |
Payable for investments purchased | $ 21,286,473 | |
Payable for fund shares redeemed | 2,503,466 | |
Accrued management fee | 1,410,958 | |
Other affiliated payables | 884,967 | |
Other payables and accrued expenses | 877,740 | |
Collateral on securities loaned, at value | 106,801,775 | |
Total liabilities | | 133,765,379 |
| | |
Net Assets | | $ 2,225,606,384 |
Net Assets consist of: | | |
Paid in capital | | $ 2,752,594,125 |
Undistributed net investment income | | 53,341,043 |
Accumulated undistributed net realized gain (loss) on investments and foreign currency transactions | | (186,093,903) |
Net unrealized appreciation (depreciation) on investments and assets and liabilities in foreign currencies | | (394,234,881) |
Net Assets, for 77,578,076 shares outstanding | | $ 2,225,606,384 |
Net Asset Value, offering price and redemption price per share ($2,225,606,384 ÷ 77,578,076 shares) | | $ 28.69 |
Statement of Operations
| Year ended October 31, 2008 |
| | |
Investment Income | | |
Dividends (including $828,438 earned from other affiliated issuers) | | $ 135,551,565 |
Interest | | 158,363 |
Income from Fidelity Central Funds (including $1,031,560 from security lending) | | 5,234,355 |
| | 140,944,283 |
Less foreign taxes withheld | | (8,383,087) |
Total income | | 132,561,196 |
| | |
Expenses | | |
Management fee | $ 39,021,632 | |
Transfer agent fees | 11,159,953 | |
Accounting and security lending fees | 1,583,667 | |
Custodian fees and expenses | 3,226,506 | |
Independent trustees' compensation | 24,167 | |
Registration fees | 231,339 | |
Audit | 91,394 | |
Legal | 27,524 | |
Interest | 46,841 | |
Miscellaneous | 543,458 | |
Total expenses before reductions | 55,956,481 | |
Expense reductions | (769,314) | 55,187,167 |
Net investment income (loss) | | 77,374,029 |
Realized and Unrealized Gain (Loss) Net realized gain (loss) on: | | |
Investment securities: | | |
Unaffiliated issuers | (145,325,198) | |
Other affiliated issuers | (2,283,954) | |
Foreign currency transactions | (3,282,305) | |
Total net realized gain (loss) | | (150,891,457) |
Change in net unrealized appreciation (depreciation) on: Investment securities | (3,431,734,200) | |
Assets and liabilities in foreign currencies | (650,944) | |
Total change in net unrealized appreciation (depreciation) | | (3,432,385,144) |
Net gain (loss) | | (3,583,276,601) |
Net increase (decrease) in net assets resulting from operations | | $ (3,505,902,572) |
See accompanying notes which are an integral part of the financial statements.
Annual Report
Statement of Changes in Net Assets
| Year ended
October 31,
2008 | Year ended
October 31,
2007 |
Increase (Decrease) in Net Assets | | |
Operations | | |
Net investment income (loss) | $ 77,374,029 | $ 57,980,662 |
Net realized gain (loss) | (150,891,457) | 186,649,406 |
Change in net unrealized appreciation (depreciation) | (3,432,385,144) | 2,089,353,663 |
Net increase (decrease) in net assets resulting from operations | (3,505,902,572) | 2,333,983,731 |
Distributions to shareholders from net investment income | (58,822,488) | (48,023,908) |
Distributions to shareholders from net realized gain | (155,654,931) | (60,491,350) |
Total distributions | (214,477,419) | (108,515,258) |
Share transactions
Proceeds from sales of shares | 2,650,547,667 | 2,669,988,018 |
Reinvestment of distributions | 207,556,726 | 105,191,757 |
Cost of shares redeemed | (3,137,930,206) | (1,907,140,342) |
Net increase (decrease) in net assets resulting from share transactions | (279,825,813) | 868,039,433 |
Redemption fees | 6,121,898 | 3,709,798 |
Total increase (decrease) in net assets | (3,994,083,906) | 3,097,217,704 |
| | |
Net Assets | | |
Beginning of period | 6,219,690,290 | 3,122,472,586 |
End of period (including undistributed net investment income of $53,341,043 and undistributed net investment income of $45,170,603, respectively) | $ 2,225,606,384 | $ 6,219,690,290 |
Other Information Shares | | |
Sold | 43,462,745 | 51,731,157 |
Issued in reinvestment of distributions | 3,206,995 | 2,427,062 |
Redeemed | (60,698,857) | (38,465,997) |
Net increase (decrease) | (14,029,117) | 15,692,222 |
Financial Highlights
Years ended October 31, | 2008 | 2007 | 2006 | 2005 | 2004 |
Selected Per-Share Data | | | | | |
Net asset value, beginning of period | $ 67.90 | $ 41.13 | $ 29.40 | $ 18.10 | $ 13.38 |
Income from Investment Operations | | | | | |
Net investment income (loss) B | .83 | .68 | .82 | .57 | .40 |
Net realized and unrealized gain (loss) | (37.74) | 27.43 | 11.68 | 10.98 | 4.53 |
Total from investment operations | (36.91) | 28.11 | 12.50 | 11.55 | 4.93 |
Distributions from net investment income | (.65) | (.61) | (.46) | (.30) | (.23) |
Distributions from net realized gain | (1.72) | (.77) | (.38) | - | - |
Total distributions | (2.37) | (1.38) | (.84) | (.30) | (.23) |
Redemption fees added to paid in capital B | .07 | .04 | .07 | .05 | .02 |
Net asset value, end of period | $ 28.69 | $ 67.90 | $ 41.13 | $ 29.40 | $ 18.10 |
Total Return A | (56.20)% | 70.35% | 43.57% | 64.94% | 37.47% |
Ratios to Average Net Assets C, E | | | | | |
Expenses before reductions | 1.02% | 1.00% | 1.05% | 1.10% | 1.19% |
Expenses net of fee waivers, if any | 1.02% | 1.00% | 1.05% | 1.10% | 1.19% |
Expenses net of all reductions | 1.00% | .98% | 1.02% | 1.04% | 1.16% |
Net investment income (loss) | 1.41% | 1.33% | 2.23% | 2.38% | 2.56% |
Supplemental Data | | | | | |
Net assets, end of period (000 omitted) | $ 2,225,606 | $ 6,219,690 | $ 3,122,473 | $ 1,384,083 | $ 357,335 |
Portfolio turnover rate D | 51% | 52% | 60% | 40% | 25% |
A Total returns would have been lower had certain expenses not been reduced during the periods shown. B Calculated based on average shares outstanding during the period. C Fees and expenses of the underlying Fidelity Central Funds are not included in the Fund's expense ratio. The Fund indirectly bears its proportionate share of the expenses of any underlying Fidelity Central Funds. D Amount does not include the portfolio activity of any underlying Fidelity Central Funds. E Expense ratios reflect operating expenses of the Fund. Expenses before reductions do not reflect amounts reimbursed by the investment adviser or reductions from brokerage service arrangements or other expense offset arrangements and do not represent the amount paid by the Fund during periods when reimbursements or reductions occur. Expenses net of fee waivers reflect expenses after reimbursement by the investment adviser but prior to reductions from brokerage service arrangements or other expense offset arrangements. Expenses net of all reductions represent the net expenses paid by the Fund. |
See accompanying notes which are an integral part of the financial statements.
Annual Report
Nordic
Performance: The Bottom Line
Average annual total return reflects the change in the value of an investment, assuming reinvestment of the fund's dividend income and capital gains (the profits earned upon the sale of securities that have grown in value, if any) and assuming a constant rate of performance each year. The $10,000 table and the fund's returns do not reflect the deduction of taxes that a shareholder would pay on fund distributions or the redemption of fund shares. During periods of reimbursement by Fidelity, a fund's total returns will be greater than it would be had the reimbursement not occurred. How a fund did yesterday is no guarantee of how it will do tomorrow.
Average Annual Total Returns
Periods ended October 31, 2008 | Past 1
year | Past 5
years | Past 10
years |
Fidelity Nordic Fund | -57.32% | 5.62% | 5.07% |
$10,000 Over 10 years
Let's say hypothetically that $10,000 was invested in Fidelity Nordic Fund on October 31, 1998. The chart shows how the value of your investment would have changed, and also shows how the FTSE World Nordic Index performed over the same period.
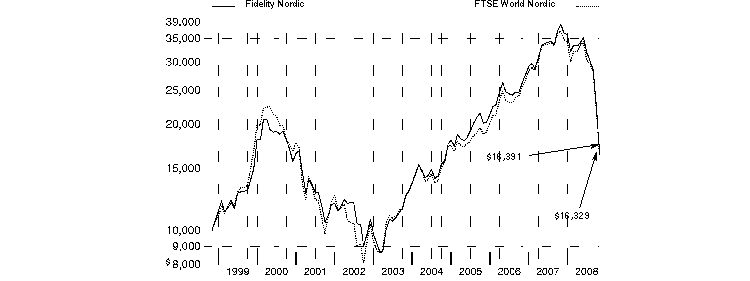
Annual Report
Nordic
Management's Discussion of Fund Performance
Comments from Ronald Port, who became Portfolio Manager of Fidelity® Nordic Fund on November 18, 2008, after the period covered in this report
In a dramatic reversal of what had been a multiyear global growth story, international stocks fell long and hard during the 12 months ending October 31, 2008, especially so during the latter stages of the period and mostly as a result of fallout from the financial crisis that emanated from the United States. The viral spread of this financial contagion - which began in the U.S. subprime mortgage market, then seized up the credit markets, hobbled major financial institutions and eventually slowed economic growth worldwide - left virtually no corner of the globe untouched. Developed international equity markets - as gauged by the MSCI® Europe, Australasia, Far East (EAFE®) Index, which monitors established markets outside the U.S. and Canada - fell 46.54%, while the Standard & Poor's 500SM Index, a measure of U.S. stocks, dropped 36.10%. Among countries constituting at least 1% of the EAFE index, Switzerland had the "least worst" showing, falling roughly 32%, followed by Japan, where stocks slid by around 37%. Meanwhile, the weakest overall performance came from Belgium, where stocks slipped by nearly 70%. In the United Kingdom, the largest component of the index, equities were down almost 48%. Emerging markets were the weakest performers among the global economies, declining 56.22% as measured by the MSCI Emerging Markets Index.
For the 12 months ending October 31, 2008, the fund was down 57.32%, while the Financial Times Stock Exchange (FTSE) World Nordic Index declined 55.47%. The fund underperformed the FTSE index primarily because of poor stock selection in the industrials, consumer discretionary, financials and information technology sectors. However, the overweighting of health care companies and stock selection in materials supported results, as did a small cash position in a down market. Out-of-benchmark holdings in Norwegian Air Shuttle and in RNB Retail and Brands both proved to be significant detractors. Discount carrier Norwegian Air Shuttle was hurt by rising energy costs early in the period, while Swedish retailer and children's clothing producer RNB faltered after a new product line failed to attract customers. Telenor, a Norwegian telecommunications firm, underperformed amid concerns about its operations in emerging markets, while Swedish engineering company Hexagon trailed because of worries about the health of auto companies that are major customers. Sweden's Kinnevik Investment did poorly amid concerns about its holdings in companies with exposure to emerging markets. Hexagon and Kinnevik also were stocks from outside the index. Kinnevik was sold. By contrast, several health care holdings held up relatively well in a tumultuous market. They included Elekta, a Swedish company specializing in products for cancer and brain-injury patients, AstraZeneca, a U.K.-based pharmaceutical company that benefited both from victories in two patent challenges and from demand for the Crestor cholesterol control drug, and Denmark's Novo Nordisk, a global leader in treatments for diabetes. Elekta and AstraZeneca also were out-of-index holdings. The investment in Norwegian fertilizer company Yara International helped as well, as did underweighting Swedish truck manufacturer Volvo AB. Both Yara and Volvo were sold.
Note to shareholders: Fidelity Nordic Fund may invest up to 35% of its total assets in any industry that represents more than 20% of the Nordic market. As of October 31, 2008, the fund did not have more than 20% of its assets in any one industry.
The views expressed above reflect those of the portfolio manager(s) only through the end of the period as stated on the cover of this report and do not necessarily represent the views of Fidelity or any other person in the Fidelity organization. Any such views are subject to change at any time based upon market or other conditions and Fidelity disclaims any responsibility to update such views. These views may not be relied on as investment advice and, because investment decisions for a Fidelity fund are based on numerous factors, may not be relied on as an indication of trading intent on behalf of any Fidelity fund.
Portfolio
Nordic
Investment Changes (Unaudited)
Geographic Diversification (% of fund's net assets) |
As of October 31, 2008 |
| Sweden | 50.0% | |
| Denmark | 17.1% | |
| Finland | 13.0% | |
| Norway | 10.8% | |
| United Kingdom | 5.4% | |
| United States of America | 3.6% | |
| Iceland | 0.1% | |

Percentages are adjusted for the effect of futures contracts, if applicable. |
|
As of April 30, 2008 |
| Sweden | 44.4% | |
| Finland | 20.1% | |
| Norway | 19.2% | |
| Denmark | 11.5% | |
| Bermuda | 2.5% | |
| United States of America | 2.2% | |
| Iceland | 0.1% | |

Percentages are adjusted for the effect of futures contracts, if applicable. |
Asset Allocation |
| % of fund's
net assets | % of fund's net assets
6 months ago |
Stocks | 96.4 | 97.8 |
Short-Term Investments and Net Other Assets | 3.6 | 2.2 |
Top Ten Stocks as of October 31, 2008 |
| % of fund's
net assets | % of fund's net assets
6 months ago |
Novo Nordisk AS Series B (Denmark, Pharmaceuticals) | 9.3 | 4.3 |
Nokia Corp. (Finland, Communications Equipment) | 8.8 | 12.6 |
Elekta AB (B Shares) (Sweden, Health Care Equipment & Supplies) | 7.4 | 4.5 |
AstraZeneca PLC (Sweden) (United Kingdom, Pharmaceuticals) | 5.4 | 0.0 |
H&M Hennes & Mauritz AB (B Shares) (Sweden, Specialty Retail) | 5.1 | 3.9 |
Svenska Handelsbanken AB (A Shares) (Sweden, Commercial Banks) | 4.6 | 0.9 |
Nordea Bank AB (Sweden, Commercial Banks) | 4.3 | 5.3 |
StatoilHydro ASA (Norway, Oil, Gas & Consumable Fuels) | 4.2 | 4.2 |
Telenor ASA (Norway, Diversified Telecommunication Services) | 3.9 | 3.7 |
ABB Ltd. (Sweden) (Sweden, Electrical Equipment) | 3.6 | 3.6 |
| 56.6 | |
Market Sectors as of October 31, 2008 |
| % of fund's
net assets | % of fund's net assets
6 months ago |
Health Care | 23.4 | 9.4 |
Financials | 18.3 | 18.2 |
Industrials | 12.8 | 18.7 |
Information Technology | 11.9 | 13.3 |
Consumer Discretionary | 11.2 | 12.8 |
Telecommunication Services | 9.6 | 8.4 |
Energy | 4.2 | 6.7 |
Materials | 2.4 | 7.8 |
Consumer Staples | 1.4 | 0.0 |
Utilities | 1.2 | 2.5 |
Annual Report
Nordic
Investments October 31, 2008
Showing Percentage of Net Assets
Common Stocks - 96.4% |
| Shares | | Value |
Denmark - 17.1% |
Carlsberg AS Series B | 104,100 | | $ 4,098,230 |
Danske Bank AS (d) | 240,500 | | 3,560,166 |
Novo Nordisk AS Series B | 504,690 | | 27,052,751 |
Novozymes AS Series B (d) | 99,200 | | 7,003,064 |
Rockwool International AS Series B (d) | 28,390 | | 1,908,887 |
Vestas Wind Systems AS (a) | 145,500 | | 5,959,638 |
TOTAL DENMARK | | 49,582,736 |
Finland - 13.0% |
Fortum Oyj | 147,600 | | 3,627,424 |
Nokia Corp. | 1,666,650 | | 25,530,065 |
Nokian Tyres Ltd. (d) | 663,510 | | 8,674,893 |
TOTAL FINLAND | | 37,832,382 |
Iceland - 0.1% |
Ossur hf (a) | 441,370 | | 327,225 |
Norway - 10.8% |
Blom ASA (a)(d) | 499,000 | | 1,627,731 |
Northern Logistic Property ASA | 290,400 | | 771,055 |
Norwegian Air Shuttle AS (a)(d) | 1,245,021 | | 5,446,512 |
StatoilHydro ASA | 607,096 | | 12,210,898 |
Telenor ASA | 1,897,000 | | 11,319,388 |
TOTAL NORWAY | | 31,375,584 |
Sweden - 50.0% |
ABB Ltd. (Sweden) | 818,500 | | 10,457,075 |
East Capital Explorer AB | 97,200 | | 578,006 |
Elekta AB (B Shares) (d) | 1,702,700 | | 21,528,449 |
H&M Hennes & Mauritz AB (B Shares) (d) | 415,540 | | 14,898,143 |
Hexagon AB (B Shares) | 1,396,175 | | 9,143,439 |
Intrum Justitia AB | 403,200 | | 3,982,846 |
Investment AB Kinnevik | 1,028,200 | | 8,056,314 |
Meda AB (A Shares) (d) | 547,200 | | 3,540,163 |
Modern Times Group MTG AB (B Shares) | 387,000 | | 8,302,623 |
NeoNet AB (d) | 2,245,494 | | 4,246,933 |
Nordea Bank AB | 1,554,900 | | 12,460,325 |
|
| Shares | | Value |
Ratos AB (B Shares) (d) | 564,200 | | $ 9,957,042 |
RNB RETAIL AND BRANDS AB (d) | 1,482,450 | | 796,323 |
Svenska Handelsbanken AB (A Shares) | 723,100 | | 13,285,849 |
TELE2 AB (B Shares) | 1,154,800 | | 9,852,209 |
Telefonaktiebolaget LM Ericsson (B Shares) | 1,106,000 | | 7,527,533 |
TeliaSonera AB | 1,502,500 | | 6,609,224 |
TOTAL SWEDEN | | 145,222,496 |
United Kingdom - 5.4% |
AstraZeneca PLC (Sweden) | 366,900 | | 15,494,766 |
TOTAL COMMON STOCKS (Cost $441,568,139) | 279,835,189 |
Money Market Funds - 18.0% |
| | | |
Fidelity Cash Central Fund, 1.81% (b) | 21,120,211 | | 21,120,211 |
Fidelity Securities Lending Cash Central Fund, 2.67% (b)(c) | 31,203,364 | | 31,203,364 |
TOTAL MONEY MARKET FUNDS (Cost $52,323,575) | 52,323,575 |
TOTAL INVESTMENT PORTFOLIO - 114.4% (Cost $493,891,714) | | 332,158,764 |
NET OTHER ASSETS - (14.4)% | | (41,758,046) |
NET ASSETS - 100% | $ 290,400,718 |
Legend |
(a) Non-income producing |
(b) Affiliated fund that is available only to investment companies and other accounts managed by Fidelity Investments. The rate quoted is the annualized seven-day yield of the fund at period end. A complete unaudited listing of the fund's holdings as of its most recent quarter end is available upon request. |
(c) Investment made with cash collateral received from securities on loan. |
(d) Security or a portion of the security is on loan at period end. |
Affiliated Central Funds |
Information regarding fiscal year to date income earned by the Fund from investments in Fidelity Central Funds is as follows: |
Fund | Income earned |
Fidelity Cash Central Fund | $ 335,346 |
Fidelity Securities Lending Cash Central Fund | 1,692,857 |
Total | $ 2,028,203 |
Income Tax Information |
At October 31, 2008, the fund had a capital loss carryforward of approximately $90,962,421 all of which will expire on October 31, 2016. |
See accompanying notes which are an integral part of the financial statements.
Annual Report
Nordic
Financial Statements
Statement of Assets and Liabilities
| October 31, 2008 |
| | |
Assets | | |
Investment in securities, at value (including securities loaned of $29,886,541) -
See accompanying schedule: Unaffiliated issuers
(cost $441,568,139) | $ 279,835,189 | |
Fidelity Central Funds
(cost $52,323,575) | 52,323,575 | |
Total Investments
(cost $493,891,714) | | $ 332,158,764 |
Receivable for investments sold | | 197,364 |
Receivable for fund shares sold | | 274,939 |
Dividends receivable | | 38,190 |
Distributions receivable from Fidelity Central Funds | | 57,800 |
Prepaid expenses | | 242 |
Other receivables | | 29,514 |
Total assets | | 332,756,813 |
| | |
Liabilities | | |
Payable for investments purchased | $ 10,310,208 | |
Payable for fund shares redeemed | 430,372 | |
Accrued management fee | 191,860 | |
Other affiliated payables | 137,026 | |
Other payables and accrued expenses | 83,265 | |
Collateral on securities loaned, at value | 31,203,364 | |
Total liabilities | | 42,356,095 |
| | |
Net Assets | | $ 290,400,718 |
Net Assets consist of: | | |
Paid in capital | | $ 534,621,407 |
Undistributed net investment income | | 14,374,041 |
Accumulated undistributed net realized gain (loss) on investments and foreign currency transactions | | (96,803,460) |
Net unrealized appreciation (depreciation) on investments and assets and liabilities in foreign currencies | | (161,791,270) |
Net Assets, for 13,996,846 shares outstanding | | $ 290,400,718 |
Net Asset Value, offering price and redemption price per share ($290,400,718 ÷ 13,996,846 shares) | | $ 20.75 |
Statement of Operations
| Year ended October 31, 2008 |
| | |
Investment Income | | |
Dividends | | $ 23,661,379 |
Interest | | 23 |
Income from Fidelity Central Funds (including $1,692,857 from security lending) | | 2,028,203 |
| | 25,689,605 |
Less foreign taxes withheld | | (3,242,854) |
Total income | | 22,446,751 |
| | |
Expenses | | |
Management fee | $ 5,038,380 | |
Transfer agent fees | 1,877,244 | |
Accounting and security lending fees | 352,417 | |
Custodian fees and expenses | 202,753 | |
Independent trustees' compensation | 3,252 | |
Registration fees | 52,246 | |
Audit | 53,921 | |
Legal | 3,941 | |
Interest | 3,619 | |
Miscellaneous | 124,151 | |
Total expenses before reductions | 7,711,924 | |
Expense reductions | (169,212) | 7,542,712 |
Net investment income (loss) | | 14,904,039 |
Realized and Unrealized Gain (Loss) Net realized gain (loss) on: | | |
Investment securities: | | |
Unaffiliated issuers | (95,558,718) | |
Foreign currency transactions | (451,521) | |
Total net realized gain (loss) | | (96,010,239) |
Change in net unrealized appreciation (depreciation) on: Investment securities | (396,321,571) | |
Assets and liabilities in foreign currencies | (74,884) | |
Total change in net unrealized appreciation (depreciation) | | (396,396,455) |
Net gain (loss) | | (492,406,694) |
Net increase (decrease) in net assets resulting from operations | | $ (477,502,655) |
See accompanying notes which are an integral part of the financial statements.
Annual Report
Nordic
Financial Statements - continued
Statement of Changes in Net Assets
| Year ended
October 31,
2008 | Year ended
October 31,
2007 |
Increase (Decrease) in Net Assets | | |
Operations | | |
Net investment income (loss) | $ 14,904,039 | $ 36,969,827 |
Net realized gain (loss) | (96,010,239) | 47,686,184 |
Change in net unrealized appreciation (depreciation) | (396,396,455) | 167,114,583 |
Net increase (decrease) in net assets resulting from operations | (477,502,655) | 251,770,594 |
Distributions to shareholders from net investment income | (32,286,083) | (3,011,989) |
Distributions to shareholders from net realized gain | (42,550,440) | (5,296,944) |
Total distributions | (74,836,523) | (8,308,933) |
Share transactions
Proceeds from sales of shares | 227,446,380 | 678,676,171 |
Reinvestment of distributions | 72,112,684 | 8,060,493 |
Cost of shares redeemed | (455,024,025) | (281,558,904) |
Net increase (decrease) in net assets resulting from share transactions | (155,464,961) | 405,177,760 |
Redemption fees | 478,907 | 604,174 |
Total increase (decrease) in net assets | (707,325,232) | 649,243,595 |
| | |
Net Assets | | |
Beginning of period | 997,725,950 | 348,482,355 |
End of period (including undistributed net investment income of $14,374,041 and undistributed net investment income of $36,941,058, respectively) | $ 290,400,718 | $ 997,725,950 |
Other Information Shares | | |
Sold | 5,322,842 | 15,469,184 |
Issued in reinvestment of distributions | 1,552,480 | 210,073 |
Redeemed | (11,772,960) | (6,310,586) |
Net increase (decrease) | (4,897,638) | 9,368,671 |
Financial Highlights
Years ended October 31, | 2008 | 2007 | 2006 | 2005 | 2004 |
Selected Per-Share Data | | | | | |
Net asset value, beginning of period | $ 52.81 | $ 36.58 | $ 30.92 | $ 24.44 | $ 19.49 |
Income from Investment Operations | | | | | |
Net investment income (loss) B | .85 | 2.39 E | .50 | .55 | .26 |
Net realized and unrealized gain (loss) | (28.93) | 14.60 | 7.94 | 6.12 | 4.80 |
Total from investment operations | (28.08) | 16.99 | 8.44 | 6.67 | 5.06 |
Distributions from net investment income | (1.73) | (.29) | (.35) | (.22) | (.15) |
Distributions from net realized gain | (2.28) | (.51) | (2.49) | - | - |
Total distributions | (4.01) | (.80) | (2.84) | (.22) | (.15) |
Redemption fees added to paid in capital B | .03 | .04 | .06 | .03 | .04 |
Net asset value, end of period | $ 20.75 | $ 52.81 | $ 36.58 | $ 30.92 | $ 24.44 |
Total Return A | (57.32)% | 47.38% | 29.68% | 27.56% | 26.31% |
Ratios to Average Net Assets C, F | | | | | |
Expenses before reductions | 1.09% | 1.06% | 1.14% | 1.17% | 1.28% |
Expenses net of fee waivers, if any | 1.09% | 1.06% | 1.14% | 1.17% | 1.28% |
Expenses net of all reductions | 1.07% | 1.03% | 1.10% | 1.13% | 1.24% |
Net investment income (loss) | 2.10% | 5.37% E | 1.49% | 1.89% | 1.16% |
Supplemental Data | | | | | |
Net assets, end of period (000 omitted) | $ 290,401 | $ 997,726 | $ 348,482 | $ 188,011 | $ 116,493 |
Portfolio turnover rate D | 72% | 62% | 67% | 76% | 90% |
A Total returns would have been lower had certain expenses not been reduced during the periods shown. B Calculated based on average shares outstanding during the period. C Fees and expenses of the underlying Fidelity Central Funds are not included in the Fund's expense ratio. The Fund indirectly bears its proportionate share of the expenses of any underlying Fidelity Central Funds. D Amount does not include the portfolio activity of any underlying Fidelity Central Funds. E Investment income per share reflects a special dividend which amounted to $1.62 per share. Excluding the special dividend, the ratio of net investment income (loss) to average net assets would have been 1.72%. F Expense ratios reflect operating expenses of the Fund. Expenses before reductions do not reflect amounts reimbursed by the investment adviser or reductions from brokerage service arrangements or other expense offset arrangements and do not represent the amount paid by the Fund during periods when reimbursements or reductions occur. Expenses net of fee waivers reflect expenses after reimbursement by the investment adviser but prior to reductions from brokerage service arrangements or other expense offset arrangements. Expenses net of all reductions represent the net expenses paid by the Fund. |
See accompanying notes which are an integral part of the financial statements.
Annual Report
Pacific Basin
Performance: The Bottom Line
Average annual total return reflects the change in the value of an investment, assuming reinvestment of the fund's dividend income and capital gains (the profits earned upon the sale of securities that have grown in value, if any) and assuming a constant rate of performance each year. The $10,000 table and the fund's returns do not reflect the deduction of taxes that a shareholder would pay on fund distributions or the redemption of fund shares. During periods of reimbursement by Fidelity, a fund's total returns will be greater than it would be had the reimbursement not occurred. How a fund did yesterday is no guarantee of how it will do tomorrow.
Average Annual Total Returns
Periods ended October 31, 2008 | Past 1
year | Past 5
years | Past 10
years |
Fidelity Pacific Basin Fund | -61.02% | -0.61% | 4.23% |
$10,000 Over 10 Years
Let's say hypothetically that $10,000 was invested in Fidelity Pacific Basin Fund on October 31, 1998. The chart shows how the value of your investment would have changed, and also shows how the MSCI All Country Pacific Index performed over the same period.
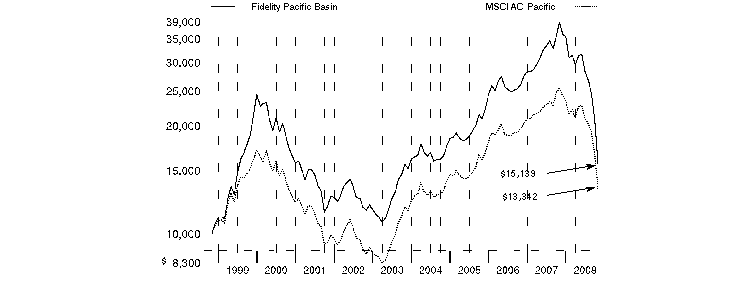
Annual Report
Pacific Basin
Management's Discussion of Fund Performance
Comments from Dale Nicholls, Portfolio Manager of Fidelity® Pacific Basin Fund
In a dramatic reversal of what had been a multiyear growth story, international stocks fell hard during the 12 months ending October 31, 2008, especially so during the latter stages of the period and mostly as a result of fallout from the financial crisis that emanated from the United States. The viral spread of this financial contagion - which began in the U.S. subprime mortgage market, then seized up the credit markets, hobbled major financial institutions and eventually slowed economic growth worldwide - left virtually no corner of the globe untouched. Developed international equity markets - as gauged by the MSCI® Europe, Australasia, Far East (EAFE®) Index, which monitors established markets outside the U.S. and Canada - fell 46.54%, while the Standard & Poor's 500SM Index, a measure of U.S. stocks, dropped 36.10%. Among countries constituting at least 1% of the EAFE index, Switzerland had the "least worst" showing, falling roughly 32%, followed by Japan, where stocks slid by around 37%. The weakest overall performance came from Belgium, where stocks slipped by nearly 70%. In the United Kingdom, the largest component of the index, equities were down almost 48%. Emerging markets were the weakest performers among the global economies, declining 56.22% as measured by the MSCI Emerging Markets Index.
During the past year, the fund fell 61.02%, trailing the -48.01% return of the MSCI All Country Pacific Index. Stock picks in Australia, Japan, South Korea, Singapore, India and Malaysia hindered performance. Further, a large underweighting in Japan hurt amid a sharp rally in the Japanese yen against the U.S. dollar. On a sector basis, my picks in consumer discretionary, information technology, industrials and consumer staples detracted. Peace Mark Holdings, a Hong Kong-based maker of watches that is incorporated in Bermuda, was unable to secure funding for an acquisition, leading to the firm's liquidation in August. Also detracting were Hong Kong's China State Construction International Holdings, incorporated in the Cayman Islands; Infopia, a small Korean maker of blood glucose monitoring kits; and India-based Financial Technologies. Underweighting and ultimately selling Japanese automaker Toyota, which managed to hold up better than most stocks, also hurt. Among these detractors, only Toyota was part of the benchmark. Conversely, stock selection and an underweighting in materials helped a bit, as did my positioning in China and a small cash position. Incitec Pivot, an Australian fertilizer producer, boosted performance, as did two out-of-index Japanese holdings: construction company SHO-BOND Holdings and Torishima Pump Manufacturing. I sold Torishima to nail down profits.
The views expressed above reflect those of the portfolio manager(s) only through the end of the period as stated on the cover of this report and do not necessarily represent the views of Fidelity or any other person in the Fidelity organization. Any such views are subject to change at any time based upon market or other conditions and Fidelity disclaims any responsibility to update such views. These views may not be relied on as investment advice and, because investment decisions for a Fidelity fund are based on numerous factors, may not be relied on as an indication of trading intent on behalf of any Fidelity fund.
Annual Report
Pacific Basin
Investment Changes (Unaudited)
Geographic Diversification (% of fund's net assets) |
As of October 31, 2008 |
| Japan | 35.3% | |
| Australia | 11.1% | |
| Korea (South) | 8.3% | |
| China | 6.6% | |
| Singapore | 6.6% | |
| Hong Kong | 4.8% | |
| Cayman Islands | 4.5% | |
| India | 3.8% | |
| Taiwan | 3.4% | |
| Other | 15.6% | |

Percentages are adjusted for the effect of futures contracts, if applicable. |
|
As of April 30, 2008 |
| Japan | 22.4% | |
| Australia | 12.6% | |
| Korea (South) | 10.8% | |
| Singapore | 7.3% | |
| China | 7.1% | |
| Hong Kong | 6.9% | |
| Cayman Islands | 6.2% | |
| India | 5.4% | |
| Bermuda | 4.2% | |
| Other | 17.1% | |

Percentages are adjusted for the effect of futures contracts, if applicable. |
Asset Allocation |
| % of fund's
net assets | % of fund's net assets
6 months ago |
Stocks | 98.0 | 98.8 |
Short-Term Investments and Net Other Assets | 2.0 | 1.2 |
Top Ten Stocks as of October 31, 2008 |
| % of fund's
net assets | % of fund's net assets
6 months ago |
Goodpack Ltd. (Singapore, Air Freight & Logistics) | 2.5 | 1.7 |
NHN Corp. (Korea (South), Internet Software & Services) | 2.2 | 1.5 |
Oil Search Ltd. (Papua New Guinea, Oil, Gas & Consumable Fuels) | 1.9 | 1.1 |
Mitsubishi UFJ Financial Group, Inc. (Japan, Commercial Banks) | 1.8 | 0.0 |
CSL Ltd. (Australia, Biotechnology) | 1.6 | 1.2 |
Sega Sammy Holdings, Inc. (Japan, Leisure Equipment & Products) | 1.5 | 0.0 |
Digital Garage, Inc. (Japan, IT Services) | 1.4 | 0.9 |
Mitsubishi Corp. (Japan, Trading Companies & Distributors) | 1.4 | 1.6 |
New Oriental Education & Technology Group, Inc. sponsored ADR (Cayman Islands, Diversified Consumer Services) | 1.4 | 0.8 |
Canon, Inc. (Japan, Office Electronics) | 1.3 | 0.8 |
| 17.0 | |
Market Sectors as of October 31, 2008 |
| % of fund's
net assets | % of fund's net assets
6 months ago |
Industrials | 21.9 | 23.2 |
Information Technology | 19.6 | 18.6 |
Consumer Discretionary | 19.7 | 17.9 |
Financials | 13.6 | 11.7 |
Materials | 7.8 | 7.5 |
Consumer Staples | 5.0 | 5.9 |
Energy | 4.3 | 5.5 |
Health Care | 3.4 | 5.0 |
Telecommunication Services | 1.9 | 2.2 |
Utilities | 0.8 | 1.3 |
Annual Report
Pacific Basin
Investments October 31, 2008
Showing Percentage of Net Assets
Common Stocks - 98.0% |
| Shares | | Value |
Australia - 11.1% |
Ausenco Ltd. | 441,601 | | $ 1,280,971 |
Austal Ltd. | 1,048,278 | | 1,231,156 |
BHP Billiton Ltd. | 128,600 | | 2,469,265 |
Bradken Ltd. | 312,341 | | 1,029,562 |
Brambles Ltd. | 361,960 | | 1,929,699 |
CSL Ltd. | 265,537 | | 6,454,406 |
Goodman Group unit | 1,226,523 | | 774,653 |
Gunns Ltd. | 2,617,955 | | 2,081,176 |
Incitec Pivot Ltd. | 456,988 | | 1,224,553 |
Macquarie Airports unit | 1,978,578 | | 2,812,406 |
Mineral Resources Ltd. | 46,239 | | 76,517 |
Navitas Ltd. | 1,047,144 | | 1,477,001 |
Origin Energy Ltd. | 241,047 | | 2,526,599 |
QBE Insurance Group Ltd. | 158,821 | | 2,708,220 |
Rio Tinto Ltd. | 82,729 | | 4,277,554 |
Seek Ltd. (d) | 804,568 | | 1,778,506 |
Sunland Group Ltd. | 988,571 | | 653,262 |
United Group Ltd. (d) | 469,591 | | 2,978,246 |
Wesfarmers Ltd. | 79,660 | | 1,144,237 |
WorleyParsons Ltd. | 184,225 | | 1,849,823 |
Wotif.com Holdings Ltd. (d) | 1,196,060 | | 2,753,871 |
TOTAL AUSTRALIA | | 43,511,683 |
Bermuda - 2.8% |
DVN Holdings Ltd. | 3,396,000 | | 62,199 |
Huabao International Holdings Ltd. | 5,530,000 | | 3,568,638 |
Mingyuan Medicare Development Co. Ltd. | 17,200,000 | | 1,267,881 |
Noble Group Ltd. | 5,818,400 | | 4,235,448 |
Paradise Entertainment Ltd. (a) | 102,582,000 | | 321,096 |
Peace Mark Holdings Ltd. | 18,955,750 | | 24 |
Ports Design Ltd. | 927,000 | | 1,077,709 |
TPV Technology Ltd. | 2,864,000 | | 568,616 |
TOTAL BERMUDA | | 11,101,611 |
Cayman Islands - 4.5% |
China Dongxiang Group Co. Ltd. | 6,527,000 | | 1,920,191 |
China State Construction International Holdings Ltd. warrants 2/27/09 (a) | 1,318,384 | | 1,742 |
Ctrip.com International Ltd. sponsored ADR | 49,210 | | 1,504,842 |
Hembly International Holdings Ltd. | 4,612,000 | | 237,309 |
Kingboard Chemical Holdings Ltd. | 638,400 | | 1,274,371 |
Kingdee International Software Group Co. Ltd. | 25,848,928 | | 3,846,259 |
New Oriental Education & Technology Group, Inc. sponsored ADR (a) | 86,500 | | 5,531,675 |
Perfect World Co. Ltd. sponsored ADR Class B (a) | 76,819 | | 1,431,138 |
Regent Pacific Group Ltd. (a) | 34,954,000 | | 587,818 |
|
| Shares | | Value |
SinoCom Software Group Ltd. | 10,750,000 | | $ 777,508 |
Suntech Power Holdings Co. Ltd. sponsored ADR (a) | 23,300 | | 407,750 |
TOTAL CAYMAN ISLANDS | | 17,520,603 |
China - 6.6% |
51job, Inc. sponsored ADR (a) | 138,400 | | 1,013,088 |
AMVIG Holdings Ltd. | 5,510,000 | | 3,239,512 |
Baidu.com, Inc. sponsored ADR (a)(d) | 9,696 | | 1,997,376 |
China Mengniu Dairy Co. Ltd. | 979,000 | | 941,216 |
China Shenhua Energy Co. Ltd. (H Shares) | 816,500 | | 1,550,181 |
China Yurun Food Group Ltd. | 581,000 | | 690,552 |
Focus Media Holding Ltd. ADR (a)(d) | 208,600 | | 3,865,358 |
Global Bio-Chem Technology Group Co. Ltd. | 8,374,000 | | 1,167,066 |
Jiangsu Expressway Co. Ltd. (H Shares) | 2,442,013 | | 1,708,066 |
Li Ning Co. Ltd. | 910,500 | | 1,126,781 |
Lianhua Supermarket Holdings Co. (H Shares) | 1,020,000 | | 1,198,171 |
Minth Group Ltd. | 1,784,000 | | 623,427 |
People's Food Holdings Ltd. | 264,000 | | 72,225 |
Ping An Insurance (Group) Co. of China, Ltd. (H Shares) | 464,000 | | 1,984,388 |
Royale Furniture Holdings Ltd. | 8,165,308 | | 322,188 |
Tencent Holdings Ltd. | 408,800 | | 2,976,028 |
Yantai Changyu Pioneer Wine Co. (B Shares) | 443,100 | | 1,376,924 |
TOTAL CHINA | | 25,852,547 |
Hong Kong - 4.8% |
Bank of East Asia Ltd. | 707,164 | | 1,426,474 |
China Insurance International Holdings Co. Ltd. | 958,000 | | 2,233,405 |
China State Construction International Holdings Ltd. | 32,380,752 | | 3,593,806 |
China Unicom (Hong Kong) Ltd. | 2,212,000 | | 3,158,061 |
Golden Meditech Co. Ltd. (a) | 4,128,000 | | 594,086 |
Hang Lung Properties Ltd. | 1,320,000 | | 3,225,391 |
IPE Group Ltd. | 20,275,000 | | 875,776 |
PYI Corp. Ltd. | 9,494,539 | | 306,742 |
PYI Corp. Ltd. warrants 9/25/09 (a) | 1,582,423 | | 4,182 |
REXCAPITAL Financial Holdings Ltd. (a) | 30,736,967 | | 567,980 |
Tian An China Investments Co. Ltd. | 3,969,800 | | 1,094,217 |
Tian An China Investments Co. Ltd. warrants 1/2/10 (a) | 396,800 | | 682 |
Tingyi (Cayman Island) Holding Corp. | 1,568,742 | | 1,661,699 |
TOTAL HONG KONG | | 18,742,501 |
India - 3.8% |
Educomp Solutions Ltd. | 55,242 | | 2,584,423 |
Financial Technologies India Ltd. | 146,363 | | 1,565,492 |
Gateway Distriparks Ltd. | 665,650 | | 1,038,446 |
Geodesic Ltd. | 560,116 | | 1,121,036 |
INFO Edge India Ltd. | 93,884 | | 825,259 |
Common Stocks - continued |
| Shares | | Value |
India - continued |
Jain Irrigation Systems Ltd. | 230,063 | | $ 1,440,347 |
NIIT Ltd. | 1,940,580 | | 1,290,314 |
Pantaloon Retail India Ltd. | 417,805 | | 2,015,980 |
Rallis India Ltd. | 116,392 | | 868,439 |
Shopper's Stop Ltd. | 203,437 | | 752,640 |
United Spirits Ltd. | 85,079 | | 1,569,705 |
TOTAL INDIA | | 15,072,081 |
Indonesia - 1.4% |
PT Bumi Resources Tbk | 7,072,500 | | 925,978 |
PT Indosat Tbk | 3,240,500 | | 1,568,701 |
PT Perusahaan Gas Negara Tbk
Series B | 23,836,740 | | 3,029,581 |
TOTAL INDONESIA | | 5,524,260 |
Japan - 35.3% |
Aeon Co. Ltd. | 24,800 | | 237,797 |
Ai Holdings Corp. (d) | 1,086,200 | | 3,265,184 |
ARRK Corp. (a) | 391,500 | | 267,388 |
Canon Marketing Japan, Inc. | 144,200 | | 2,412,222 |
Canon, Inc. | 146,300 | | 5,119,017 |
Denso Corp. | 71,600 | | 1,395,455 |
Digital Garage, Inc. (a)(d) | 8,410 | | 5,574,729 |
eAccess Ltd. (d) | 4,280 | | 1,990,565 |
Fujifilm Holdings Corp. | 119,500 | | 2,750,794 |
Furuno Electric Co. Ltd. | 276,100 | | 1,637,721 |
H.I.S. Co. Ltd. (d) | 277,000 | | 4,009,428 |
Hamakyorex Co. Ltd. | 155,200 | | 2,862,635 |
Haseko Corp. | 1,456,500 | | 1,317,964 |
Hikari Tsushin, Inc. | 84,700 | | 1,263,967 |
Ibiden Co. Ltd. | 68,300 | | 1,277,589 |
Internet Initiative Japan, Inc. | 1,193 | | 997,503 |
ISE Chemical Corp. (d) | 421,000 | | 1,691,633 |
Ishihara Sangyo Kaisha Ltd. (a) | 1,412,000 | | 1,134,087 |
Itochu Corp. | 334,000 | | 1,765,017 |
Japan Excellent, Inc. | 126 | | 422,801 |
Kato Works Co. Ltd. | 771,000 | | 1,878,316 |
Kenedix Realty Investment Corp. | 587 | | 850,734 |
Konica Minolta Holdings, Inc. | 220,000 | | 1,444,734 |
Kubota Corp. | 247,000 | | 1,239,717 |
Leopalace21 Corp. | 228,900 | | 1,703,665 |
Matsumotokiyoshi Holdings Co. Ltd. | 100,800 | | 1,975,896 |
Micronics Japan Co. Ltd. | 328,100 | | 2,663,660 |
Mitsubishi Corp. | 331,200 | | 5,551,243 |
Mitsubishi Electric Corp. | 525,000 | | 3,254,480 |
Mitsubishi UFJ Financial Group, Inc. | 1,137,800 | | 7,149,768 |
Mitsui Sumitomo Insurance Group Holdings, Inc. | 111,300 | | 3,092,691 |
Namco Bandai Holdings, Inc. | 205,200 | | 2,110,046 |
New City Residence Investment Corp. | 1,766 | | 178,272 |
Nikon Corp. | 109,000 | | 1,536,074 |
Nippon Building Fund, Inc. | 185 | | 1,777,573 |
Nippon Electric Glass Co. Ltd. | 217,000 | | 1,305,186 |
|
| Shares | | Value |
Nippon Parkerizing Co. Ltd. | 173,000 | | $ 2,039,960 |
Nippon Seiki Co. Ltd. | 478,000 | | 3,164,936 |
Nitta Corp. | 210,400 | | 2,350,819 |
Nittoku Engineering Co. Ltd. | 506,800 | | 2,375,484 |
Nomura Holdings, Inc. | 365,200 | | 3,459,852 |
Obic Co. Ltd. | 15,310 | | 1,873,888 |
ORIX Corp. | 32,310 | | 3,319,461 |
Point, Inc. | 67,350 | | 3,307,655 |
Promise Co. Ltd. (d) | 224,900 | | 4,036,563 |
Rakuten, Inc. (d) | 4,330 | | 2,146,436 |
Sankyo Seiko Co. Ltd. | 425,800 | | 688,984 |
Sega Sammy Holdings, Inc. (d) | 769,400 | | 5,816,226 |
SHO-BOND Holdings Co. Ltd. (d) | 257,000 | | 4,591,149 |
Softbank Corp. | 172,800 | | 1,701,551 |
Sony Corp. | 113,100 | | 2,680,374 |
Stanley Electric Co. Ltd. | 148,400 | | 1,865,657 |
Sumitomo Electric Industries Ltd. | 203,600 | | 1,648,373 |
Sumitomo Mitsui Financial Group, Inc. | 442 | | 1,771,828 |
Take & Give Needs Co. Ltd. (a)(d) | 14,787 | | 624,677 |
The Sumitomo Warehouse Co. Ltd. | 401,000 | | 1,624,324 |
Tohcello Co. Ltd. | 634,500 | | 2,646,606 |
Tokuyama Corp. | 197,000 | | 997,590 |
Tokyo Ohka Kogyo Co. Ltd. | 69,400 | | 952,689 |
Toyoda Gosei Co. Ltd. | 99,600 | | 1,398,275 |
Tsutsumi Jewelry Co. Ltd. | 58,700 | | 1,143,536 |
Wacom Co. Ltd. (d) | 1,470 | | 1,297,869 |
TOTAL JAPAN | | 138,630,313 |
Korea (South) - 8.3% |
CDNetworks Co. Ltd. (a) | 120,643 | | 618,193 |
Daewoo International Corp. | 72,640 | | 807,847 |
Duzon Digital Ware Co. Ltd. | 205,677 | | 1,147,991 |
eSang Networks Co. Ltd. | 146,774 | | 745,738 |
Hana Tour Service, Inc. | 58,346 | | 907,700 |
Hyunjin Materials Co. Ltd. | 47,529 | | 587,290 |
Infopia Co. Ltd. | 161,717 | | 1,209,763 |
Jinsung T.E.C. Co. Ltd. | 378,322 | | 2,367,479 |
Kyeryong Construction Industrial Co. Ltd. | 76,000 | | 696,897 |
MegaStudy Co. Ltd. | 12,242 | | 1,380,378 |
Meritz Fire & Marine Insurance Co. Ltd. | 228,570 | | 841,703 |
NHN Corp. (a) | 79,495 | | 8,486,183 |
Plantynet Co. Ltd. | 292,104 | | 771,514 |
SFA Engineering Corp. | 95,419 | | 1,907,260 |
Shinhan Financial Group Co. Ltd. | 121,104 | | 2,955,361 |
TK Corp. | 197,721 | | 3,215,294 |
Woongjin Coway Co. Ltd. | 68,230 | | 1,408,278 |
Yuhan Corp. | 18,298 | | 2,669,886 |
TOTAL KOREA (SOUTH) | | 32,724,755 |
Malaysia - 3.0% |
IJM Corp. Bhd | 1,169,700 | | 849,097 |
IJM Land Bhd warrants 9/11/13 (a) | 116,970 | | 5,863 |
JobStreet Corp. Bhd | 6,606,750 | | 2,617,953 |
Common Stocks - continued |
| Shares | | Value |
Malaysia - continued |
KNM Group Bhd | 10,267,500 | | $ 1,741,022 |
MMC Corp. Bhd | 4,286,154 | | 2,405,046 |
Muhibbah Engineering (M) Bhd | 2,956,900 | | 651,721 |
Parkson Holdings Bhd | 748,213 | | 709,625 |
Public Bank Bhd (For. Reg.) | 1,197,800 | | 2,836,498 |
TOTAL MALAYSIA | | 11,816,825 |
Papua New Guinea - 2.8% |
Lihir Gold Ltd. (a) | 2,942,730 | | 3,669,939 |
Oil Search Ltd. | 2,415,309 | | 7,313,562 |
TOTAL PAPUA NEW GUINEA | | 10,983,501 |
Philippines - 1.6% |
Aboitiz Equity Ventures, Inc. | 13,425,000 | | 1,512,289 |
Alliance Global Group, Inc. (a) | 82,734,542 | | 3,389,024 |
DMCI Holdings, Inc. | 25,616,500 | | 1,390,348 |
TOTAL PHILIPPINES | | 6,291,661 |
Singapore - 6.6% |
CSE Global Ltd. | 7,480,500 | | 3,364,147 |
GigaMedia Ltd. (a) | 122,400 | | 733,176 |
Goodpack Ltd. | 11,983,000 | | 10,015,584 |
Goodpack Ltd. warrants 7/16/09 (a) | 1,143,125 | | 246,662 |
Mirach Energy Ltd. (a) | 8,793,000 | | 183,473 |
Olam International Ltd. | 4,844,625 | | 4,264,568 |
Pertama Holdings Ltd. | 10,644,000 | | 1,471,355 |
Raffles Education Corp. Ltd. | 10,850,000 | | 4,190,020 |
SIA Engineering Co. Ltd. | 930,000 | | 1,225,656 |
Tat Hong Holdings Ltd. warrants 8/2/13 (a) | 125,700 | | 3,017 |
TOTAL SINGAPORE | | 25,697,658 |
Taiwan - 3.4% |
104 Corp. | 479,000 | | 1,002,001 |
Advanced Semiconductor Engineering, Inc. | 3,009,618 | | 1,281,435 |
Apex Biotechnology Corp. | 808,000 | | 1,109,668 |
D-Link Corp. | 1,515,883 | | 1,029,431 |
Hon Hai Precision Industry Co. Ltd. (Foxconn) | 1,952,081 | | 4,734,470 |
MediaTek, Inc. | 218,000 | | 1,956,283 |
|
| Shares | | Value |
Powertech Technology, Inc. | 654,300 | | $ 921,396 |
Tsann Kuen Enterprise Co. Ltd. | 3,740,900 | | 1,145,463 |
TOTAL TAIWAN | | 13,180,147 |
Thailand - 1.9% |
Siam Commercial Bank PCL (For. Reg.) | 2,025,452 | | 3,144,189 |
Thai Stanley Electric PCL | 656,390 | | 1,399,852 |
Ticon Industrial Connection PCL (For. Reg.) | 6,418,200 | | 1,471,205 |
Total Access Communication PCL | 2,117,180 | | 1,280,028 |
Total Access Communication PCL (For. Reg.) | 215,000 | | 152,840 |
TOTAL THAILAND | | 7,448,114 |
Vietnam - 0.1% |
Luks Group (Vietnam Holdings) Co. Ltd. | 2,080,000 | | 477,674 |
TOTAL COMMON STOCKS (Cost $655,764,398) | 384,575,934 |
Money Market Funds - 8.0% |
| | | |
Fidelity Cash Central Fund, 1.81% (b) | 12,864,669 | | 12,864,669 |
Fidelity Securities Lending Cash Central Fund, 2.67% (b)(c) | 18,573,419 | | 18,573,419 |
TOTAL MONEY MARKET FUNDS (Cost $31,438,088) | 31,438,088 |
TOTAL INVESTMENT PORTFOLIO - 106.0% (Cost $687,202,486) | | 416,014,022 |
NET OTHER ASSETS - (6.0)% | | (23,620,821) |
NET ASSETS - 100% | $ 392,393,201 |
Legend |
(a) Non-income producing |
(b) Affiliated fund that is available only to investment companies and other accounts managed by Fidelity Investments. The rate quoted is the annualized seven-day yield of the fund at period end. A complete unaudited listing of the fund's holdings as of its most recent quarter end is available upon request. |
(c) Investment made with cash collateral received from securities on loan. |
(d) Security or a portion of the security is on loan at period end. |
Affiliated Central Funds |
Information regarding fiscal year to date income earned by the Fund from investments in Fidelity Central Funds is as follows: |
Fund | Income earned |
Fidelity Cash Central Fund | $ 212,729 |
Fidelity Securities Lending Cash Central Fund | 772,727 |
Total | $ 985,456 |
Income Tax Information |
At October 31, 2008, the fund had a capital loss carryforward of approximately $161,686 all of which will expire on October 31, 2016. |
See accompanying notes which are an integral part of the financial statements.
Annual Report
Pacific Basin
Financial Statements
Statement of Assets and Liabilities
| October 31, 2008 |
| | |
Assets | | |
Investment in securities, at value (including securities loaned of $17,604,876) -
See accompanying schedule: Unaffiliated issuers
(cost $655,764,398) | $ 384,575,934 | |
Fidelity Central Funds
(cost $31,438,088) | 31,438,088 | |
Total Investments
(cost $687,202,486) | | $ 416,014,022 |
Foreign currency held at value
(cost $76,419) | | 76,339 |
Receivable for investments sold | | 2,404,889 |
Receivable for fund shares sold | | 421,373 |
Dividends receivable | | 1,751,899 |
Distributions receivable from Fidelity Central Funds | | 51,528 |
Prepaid expenses | | 305 |
Other receivables | | 110,899 |
Total assets | | 420,831,254 |
| | |
Liabilities | | |
Payable for investments purchased | $ 9,063,750 | |
Payable for fund shares redeemed | 375,451 | |
Accrued management fee | 84,550 | |
Other affiliated payables | 166,828 | |
Other payables and accrued expenses | 174,055 | |
Collateral on securities loaned, at value | 18,573,419 | |
Total liabilities | | 28,438,053 |
| | |
Net Assets | | $ 392,393,201 |
Net Assets consist of: | | |
Paid in capital | | $ 672,810,599 |
Undistributed net investment income | | 197,805 |
Accumulated undistributed net realized gain (loss) on investments and foreign currency transactions | | (9,516,192) |
Net unrealized appreciation (depreciation) on investments and assets and liabilities in foreign currencies | | (271,099,011) |
Net Assets, for 30,566,357 shares outstanding | | $ 392,393,201 |
Net Asset Value, offering price and redemption price per share ($392,393,201 ÷ 30,566,357 shares) | | $ 12.84 |
Statement of Operations
| Year ended October 31, 2008 |
| | |
Investment Income | | |
Dividends | | $ 18,013,514 |
Interest | | 710 |
Income from Fidelity Central Funds (including $772,727 from security lending) | | 985,456 |
| | 18,999,680 |
Less foreign taxes withheld | | (1,096,530) |
Total income | | 17,903,150 |
| | |
Expenses | | |
Management fee
Basic fee | $ 6,187,590 | |
Performance adjustment | 961,827 | |
Transfer agent fees | 2,163,498 | |
Accounting and security lending fees | 421,979 | |
Custodian fees and expenses | 578,576 | |
Independent trustees' compensation | 3,387 | |
Registration fees | 36,179 | |
Audit | 103,791 | |
Legal | 5,162 | |
Interest | 1,432 | |
Miscellaneous | 149,366 | |
Total expenses before reductions | 10,612,787 | |
Expense reductions | (473,000) | 10,139,787 |
Net investment income (loss) | | 7,763,363 |
Realized and Unrealized Gain (Loss) Net realized gain (loss) on: | | |
Investment securities: | | |
Unaffiliated issuers (net of foreign taxes of $49,919) | (6,323,873) | |
Foreign currency transactions | (380,074) | |
Total net realized gain (loss) | | (6,703,947) |
Change in net unrealized appreciation (depreciation) on: Investment securities (net of decrease in deferred foreign taxes of $1,390,725) | (697,845,629) | |
Assets and liabilities in foreign currencies | 96,282 | |
Total change in net unrealized appreciation (depreciation) | | (697,749,347) |
Net gain (loss) | | (704,453,294) |
Net increase (decrease) in net assets resulting from operations | | $ (696,689,931) |
See accompanying notes which are an integral part of the financial statements.
Annual Report
Statement of Changes in Net Assets
| Year ended
October 31,
2008 | Year ended
October 31,
2007 |
Increase (Decrease) in Net Assets | | |
Operations | | |
Net investment income (loss) | $ 7,763,363 | $ 7,778,057 |
Net realized gain (loss) | (6,703,947) | 165,831,466 |
Change in net unrealized appreciation (depreciation) | (697,749,347) | 264,139,051 |
Net increase (decrease) in net assets resulting from operations | (696,689,931) | 437,748,574 |
Distributions to shareholders from net investment income | (7,436,752) | (5,493,694) |
Distributions to shareholders from net realized gain | (131,157,223) | (78,016,295) |
Total distributions | (138,593,975) | (83,509,989) |
Share transactions
Proceeds from sales of shares | 164,409,234 | 356,516,330 |
Reinvestment of distributions | 127,229,315 | 78,904,207 |
Cost of shares redeemed | (330,830,316) | (496,318,818) |
Net increase (decrease) in net assets resulting from share transactions | (39,191,767) | (60,898,281) |
Redemption fees | 355,373 | 368,023 |
Total increase (decrease) in net assets | (874,120,300) | 293,708,327 |
| | |
Net Assets | | |
Beginning of period | 1,266,513,501 | 972,805,174 |
End of period (including undistributed net investment income of $197,805 and undistributed net investment income of $7,712,722, respectively) | $ 392,393,201 | $ 1,266,513,501 |
Other Information Shares | | |
Sold | 6,162,028 | 11,592,776 |
Issued in reinvestment of distributions | 4,129,481 | 2,961,664 |
Redeemed | (13,662,317) | (16,176,357) |
Net increase (decrease) | (3,370,808) | (1,621,917) |
Financial Highlights
Years ended October 31, | 2008 | 2007 | 2006 | 2005 | 2004 |
Selected Per-Share Data | | | | | |
Net asset value, beginning of period | $ 37.32 | $ 27.36 | $ 22.42 | $ 17.91 | $ 17.06 |
Income from Investment Operations | | | | | |
Net investment income (loss) C | .22 | .22 | .16 | .22 F | .07 |
Net realized and unrealized gain (loss) | (20.61) | 12.16 | 5.26 | 4.49 | .92 |
Total from investment operations | (20.39) | 12.38 | 5.42 | 4.71 | .99 |
Distributions from net investment income | (.22) | (.16) | (.18) | (.08) | (.16) |
Distributions from net realized gain | (3.88) | (2.27) | (.32) | (.13) | - |
Total distributions | (4.10) | (2.43) | (.50) | (.21) | (.16) |
Redemption fees added to paid in capital C | .01 | .01 | .02 | .01 | .02 |
Net asset value, end of period | $ 12.84 | $ 37.32 | $ 27.36 | $ 22.42 | $ 17.91 |
Total Return A, B | (61.02)% | 48.86% | 24.55% | 26.62% | 5.98% |
Ratios to Average Net Assets D, G | | | | | |
Expenses before reductions | 1.22% | 1.19% | 1.14% | 1.10% | 1.20% |
Expenses net of fee waivers, if any | 1.22% | 1.19% | 1.14% | 1.10% | 1.20% |
Expenses net of all reductions | 1.17% | 1.13% | 1.08% | 1.05% | 1.19% |
Net investment income (loss) | .89% | .71% | .60% | 1.09% F | .42% |
Supplemental Data | | | | | |
Net assets, end of period (000 omitted) | $ 392,393 | $ 1,266,514 | $ 972,805 | $ 648,850 | $ 445,127 |
Portfolio turnover rate E | 73% | 91% | 75% | 78% | 145% |
A Total returns would have been lower had certain expenses not been reduced during the periods shown. B Total returns do not include the effect of the former contingent deferred sales charge. C Calculated based on average shares outstanding during the period. D Fees and expenses of the underlying Fidelity Central Funds are not included in the Fund's expense ratio. The Fund indirectly bears its proportionate share of the expenses of any underlying Fidelity Central Funds. E Amount does not include the portfolio activity of any underlying Fidelity Central Funds. F Investment income per share reflects a special dividend which amounted to $.05 per share. Excluding the special dividend, the ratio of net investment income (loss) to average net assets would have been .84%. G Expense ratios reflect operating expenses of the Fund. Expenses before reductions do not reflect amounts reimbursed by the investment adviser or reductions from brokerage service arrangements or other expense offset arrangements and do not represent the amount paid by the Fund during periods when reimbursements or reductions occur. Expenses net of fee waivers reflect expenses after reimbursement by the investment adviser but prior to reductions from brokerage service arrangements or other expense offset arrangements. Expenses net of all reductions represent the net expenses paid by the Fund. |
See accompanying notes which are an integral part of the financial statements.
Annual Report
Southeast Asia
Performance: The Bottom Line
Average annual total return reflects the change in the value of an investment, assuming reinvestment of the fund's dividend income and capital gains (the profits earned upon the sale of securities that have grown in value, if any) and assuming a constant rate of performance each year. The $10,000 table and the fund's returns do not reflect the deduction of taxes that a shareholder would pay on fund distributions or the redemption of fund shares. During periods of reimbursement by Fidelity, a fund's total returns will be greater than it would be had the reimbursement not occurred. How a fund did yesterday is no guarantee of how it will do tomorrow.
Average Annual Total Returns
Periods ended October 31, 2008 | Past 1
year | Past 5
years | Past 10
years |
Fidelity Southeast Asia Fund | -59.64% | 10.11% | 10.72% |
$10,000 Over 10 Years
Let's say hypothetically that $10,000 was invested in Fidelity Southeast Asia Fund on October 31, 1998. The chart shows how the value of your investment would have changed, and also shows how the MSCI AC Far East ex Japan Index performed over the same period.
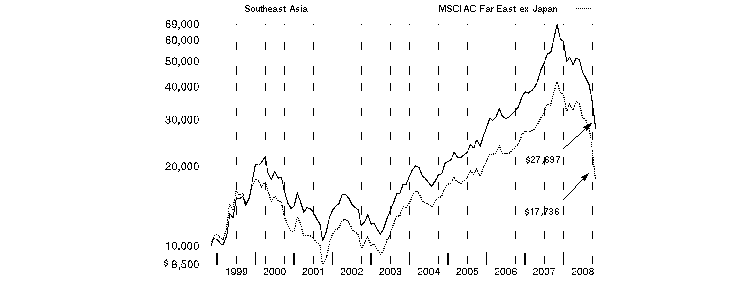
Annual Report
Southeast Asia
Management's Discussion of Fund Performance
Comments from Jessica Tan, Portfolio Manager of Fidelity® Southeast Asia Fund
In a dramatic reversal of what had been a multiyear global growth story, international stocks fell long and hard during the 12 months ending October 31, 2008, especially so during the latter stages of the period and mostly as a result of fallout from the financial crisis that emanated from the United States. The viral spread of this financial contagion - which began in the U.S. subprime mortgage market, then seized up the credit markets, hobbled major financial institutions and eventually slowed economic growth worldwide - left virtually no corner of the globe untouched. Developed international equity markets - as gauged by the MSCI® Europe, Australasia, Far East (EAFE®) Index, which monitors established markets outside the U.S. and Canada - fell 46.54%, while the Standard & Poor's 500SM Index, a measure of U.S. stocks, dropped 36.10%. Among countries constituting at least 1% of the EAFE index, Switzerland had the "least worst" showing, falling roughly 32%, followed by Japan, where stocks slid by around 37%. Meanwhile, the weakest overall performance came from Belgium, where stocks slipped by nearly 70%. In the United Kingdom, the largest component of the index, equities were down almost 48%. Emerging markets were the weakest performers among the global economies, declining 56.22% as measured by the MSCI Emerging Markets Index.
During the year, the fund returned -59.64%, trailing the -57.53% return of the MSCI All Country Far East ex Japan Index. Versus the index, stock selection in South Korea and Singapore hurt performance. On a sector basis, stock picking in financials, consumer discretionary, industrials and energy was detrimental. One detractor was COSCO Corporation, a Singapore-listed owner of Chinese shipyards. The company was hindered by expectations of a slowdown in new orders and a cancellation of existing orders, among other factors, and I sold it. Underweighting and ultimately selling Korea-based Samsung Electronics also proved counterproductive, as did KNM Group, a Malaysia-based manufacturer of process equipment for the energy, petrochemical and mining industries, and Bumi Resources, an Indonesia-based coal miner. Conversely, stock picks in the Cayman Islands, where many Asian companies are incorporated for tax purposes, were beneficial. Among sectors, favorable stock selection in telecommunication services - together with an overweighting in that outperforming group - aided our results. A modest cash position also helped. Chunghwa Telecom, Taiwan's incumbent telecom services provider, saw its stock outperform due to the company's defensive characteristics. Other contributors were power supplier Hong Kong Electric Holdings and China's Jiangsu Expressway, owner of high-quality expressway assets in China's Jiangsu province.
The views expressed above reflect those of the portfolio manager(s) only through the end of the period as stated on the cover of this report and do not necessarily represent the views of Fidelity or any other person in the Fidelity organization. Any such views are subject to change at any time based upon market or other conditions and Fidelity disclaims any responsibility to update such views. These views may not be relied on as investment advice and, because investment decisions for a Fidelity fund are based on numerous factors, may not be relied on as an indication of trading intent on behalf of any Fidelity fund.
Annual Report
Southeast Asia
Investment Changes (Unaudited)
Geographic Diversification (% of fund's net assets) |
As of October 31, 2008 |
| Hong Kong | 22.3% | |
| China | 17.6% | |
| Korea (South) | 16.2% | |
| Taiwan | 15.0% | |
| United States of America | 8.4% | |
| Thailand | 6.9% | |
| Singapore | 4.8% | |
| Cayman Islands | 2.9% | |
| Australia | 2.6% | |
| Other | 3.3% | |

Percentages are adjusted for the effect of futures contracts, if applicable. |
|
As of April 30, 2008 |
| Korea (South) | 21.2% | |
| Hong Kong | 19.1% | |
| Taiwan | 18.9% | |
| China | 11.2% | |
| United States of America | 9.8% | |
| Thailand | 6.0% | |
| Malaysia | 5.7% | |
| Singapore | 4.2% | |
| Cayman Islands | 1.2% | |
| Other | 2.7% | |

Percentages are adjusted for the effect of futures contracts, if applicable. |
Asset Allocation |
| % of fund's
net assets | % of fund's net assets
6 months ago |
Stocks | 91.6 | 95.3 |
Short-Term Investments and Net Other Assets | 8.4 | 4.7 |
Top Ten Stocks as of October 31, 2008 |
| % of fund's
net assets | % of fund's net assets
6 months ago |
Chunghwa Telecom Co. Ltd. (Taiwan, Diversified Telecommunication Services) | 6.0 | 1.8 |
Hong Kong Electric Holdings Ltd. (Hong Kong, Electric Utilities) | 4.6 | 1.4 |
China Petroleum & Chemical Corp. (H Shares) (China, Oil, Gas & Consumable Fuels) | 3.3 | 0.0 |
Hutchison Whampoa Ltd. (Hong Kong, Industrial Conglomerates) | 3.1 | 2.2 |
NHN Corp. (Korea (South), Internet Software & Services) | 3.0 | 2.0 |
PetroChina Co. Ltd. (H Shares) (China, Oil, Gas & Consumable Fuels) | 3.0 | 1.9 |
China Unicom (Hong Kong) Ltd. (Hong Kong, Diversified Telecommunication Services) | 2.9 | 0.7 |
Hutchison Telecommunications International Ltd. (Cayman Islands, Wireless Telecommunication Services) | 2.8 | 0.7 |
China Life Insurance Co. Ltd. (H Shares) (China, Insurance) | 2.8 | 0.0 |
SK Telecom Co. Ltd. (Korea (South), Wireless Telecommunication Services) | 2.8 | 1.2 |
| 34.3 | |
Market Sectors as of October 31, 2008 |
| % of fund's
net assets | % of fund's net assets
6 months ago |
Telecommunication Services | 27.4 | 17.9 |
Financials | 23.0 | 30.1 |
Utilities | 8.4 | 3.7 |
Energy | 8.0 | 8.8 |
Industrials | 7.6 | 6.7 |
Consumer Discretionary | 6.6 | 7.4 |
Information Technology | 3.9 | 14.7 |
Consumer Staples | 3.8 | 1.8 |
Materials | 2.2 | 3.2 |
Health Care | 0.7 | 1.0 |
Annual Report
Southeast Asia
Investments October 31, 2008
Showing Percentage of Net Assets
Common Stocks - 91.6% |
| Shares | | Value |
Australia - 2.6% |
Telstra Corp. Ltd. | 15,024,948 | | $ 41,335,939 |
Bermuda - 0.4% |
Huabao International Holdings Ltd. | 11,120,000 | | 7,175,996 |
Cayman Islands - 2.9% |
Hutchison Telecommunications International Ltd. (a) | 42,126,000 | | 45,510,534 |
New Oriental Education & Technology Group, Inc. sponsored ADR (a) | 22,000 | | 1,406,900 |
TOTAL CAYMAN ISLANDS | | 46,917,434 |
China - 17.6% |
China Life Insurance Co. Ltd. (H Shares) | 16,916,000 | | 45,205,932 |
China Petroleum & Chemical Corp. (H Shares) | 81,792,000 | | 53,709,698 |
China Telecom Corp. Ltd. (H Shares) | 113,812,000 | | 40,505,723 |
Focus Media Holding Ltd. ADR (a)(d) | 1,341,719 | | 24,862,053 |
Industrial & Commercial Bank of China | 66,432,000 | | 31,257,417 |
Jiangsu Expressway Co. Ltd. (H Shares) | 51,408,000 | | 35,957,330 |
PetroChina Co. Ltd. (H Shares) | 62,970,000 | | 47,346,287 |
Zijin Mining Group Co. Ltd. (H Shares) | 12,238,000 | | 3,698,682 |
TOTAL CHINA | | 282,543,122 |
Hong Kong - 22.3% |
BYD Electronic International Co. Ltd. | 978,500 | | 299,861 |
Cafe de Coral Holdings Ltd. | 2,880,000 | | 4,525,091 |
Cheung Kong Holdings Ltd. | 2,336,000 | | 22,429,018 |
China Mobile (Hong Kong) Ltd. | 3,998,800 | | 35,202,475 |
China Resources Power Holdings Co. Ltd. | 10,618,000 | | 20,751,227 |
China State Construction International Holdings Ltd. | 21,602,000 | | 2,397,516 |
China Unicom (Hong Kong) Ltd. | 32,540,000 | | 46,457,191 |
CLP Holdings Ltd. | 3,774,000 | | 25,451,576 |
Hang Seng Bank Ltd. | 1,291,700 | | 16,117,064 |
Hong Kong Electric Holdings Ltd. | 13,592,500 | | 73,261,532 |
Hutchison Whampoa Ltd. | 9,267,000 | | 49,485,780 |
PCCW Ltd. | 80,360,000 | | 30,069,805 |
Sa Sa International Holdings Ltd. | 28,486,000 | | 4,350,655 |
Sinotruk Hong Kong Ltd. | 12,290,000 | | 5,061,764 |
Sun Hung Kai Properties Ltd. | 618,000 | | 5,414,327 |
Television Broadcasts Ltd. | 4,197,000 | | 11,671,976 |
Wharf Holdings Ltd. | 2,259,000 | | 4,507,174 |
TOTAL HONG KONG | | 357,454,032 |
Indonesia - 0.6% |
PT Bumi Resources Tbk | 71,543,000 | | 9,366,875 |
PT Indosat Tbk | 54,500 | | 26,383 |
PT Jakarta International Hotel & Development Tbk (a) | 39,829,000 | | 1,012,657 |
TOTAL INDONESIA | | 10,405,915 |
Korea (South) - 16.2% |
Hanmi Pharm Co. Ltd. | 179,085 | | 10,821,279 |
|
| Shares | | Value |
Hyundai Engineering & Construction Co. Ltd. | 130,528 | | $ 5,375,876 |
Korea Exchange Bank | 1,334,400 | | 7,445,384 |
Korea Gas Corp. | 375,618 | | 14,188,529 |
KT&G Corp. | 676,155 | | 43,531,319 |
LG Household & Health Care Ltd. | 118,213 | | 16,939,352 |
MegaStudy Co. Ltd. | 171,502 | | 19,338,152 |
MSCI Daily TR Net Emerging Markets Korea Local warrants (UBS Warrant Programme) 9/10/10 (a) | 73,072,824 | | 16,149,284 |
NHN Corp. (a) | 458,681 | | 48,964,724 |
Samsung Fire & Marine Insurance Co. Ltd. | 57,373 | | 7,622,097 |
Shinhan Financial Group Co. Ltd. | 1,016,576 | | 24,808,008 |
SK Telecom Co. Ltd. | 281,296 | | 44,784,036 |
TOTAL KOREA (SOUTH) | | 259,968,040 |
Malaysia - 2.1% |
KNM Group Bhd | 105,452,825 | | 17,881,244 |
TM International Sdn Bhd (a) | 12,243,700 | | 15,669,435 |
Wah Seong Corp. Bhd | 656,100 | | 209,537 |
TOTAL MALAYSIA | | 33,760,216 |
Philippines - 0.2% |
Philippine Long Distance Telephone Co. | 76,940 | | 3,143,785 |
Singapore - 4.8% |
City Developments Ltd. | 1,845,000 | | 8,158,709 |
SIA Engineering Co. Ltd. | 4,304,000 | | 5,672,281 |
Singapore Press Holdings Ltd. | 2,545,000 | | 5,559,439 |
SMRT Corp. Ltd. | 12,149,000 | | 12,796,818 |
Starhub Ltd. | 7,206,000 | | 11,698,991 |
United Engineers Ltd. | 3,255,000 | | 2,700,451 |
United Overseas Bank Ltd. | 3,361,000 | | 30,385,979 |
TOTAL SINGAPORE | | 76,972,668 |
Taiwan - 15.0% |
104 Corp. | 1,562,000 | | 3,267,485 |
Ambassador Hotel | 13,543,000 | | 9,751,289 |
Chong Hong Construction Co. Ltd. | 2,643,406 | | 1,630,842 |
Chunghwa Telecom Co. Ltd. | 58,929,510 | | 97,188,579 |
Far EasTone Telecommunications Co. Ltd. | 22,371,000 | | 23,466,321 |
First Financial Holding Co. Ltd. | 66,872,960 | | 31,525,680 |
Goldsun Development & Construction Co. Ltd. | 30,575,000 | | 5,839,700 |
Huaku Development Co. Ltd. | 5,418,500 | | 5,084,207 |
Hung Poo Real Estate Development Co. Ltd. | 5,827,447 | | 3,065,218 |
Taiwan Fertilizer Co. Ltd. | 15,972,000 | | 19,707,758 |
Taiwan Semiconductor Manufacturing Co. Ltd. | 10,596,105 | | 15,419,525 |
Yuanta Financial Holding Co. Ltd. | 65,817,000 | | 25,540,628 |
TOTAL TAIWAN | | 241,487,232 |
Common Stocks - continued |
| Shares | | Value |
Thailand - 6.9% |
Asian Property Development PCL: | | | |
(For. Reg.) | 35,848,700 | | $ 3,078,917 |
NVDR | 23,093,200 | | 2,003,617 |
Bangkok Bank Ltd. PCL (For. Reg.) | 10,880,600 | | 21,982,149 |
BEC World PCL (For. Reg.) | 13,747,700 | | 6,621,724 |
Big C Supercenter PCL unit | 7,246,944 | | 6,368,012 |
Land & House PCL (For. Reg.) | 35,051,600 | | 3,773,360 |
Major Cineplex Group PCL (For. Reg.) | 67,848,000 | | 11,811,940 |
Quality Houses PCL | 279,843,445 | | 7,307,866 |
Quality Houses PCL NVDR | 84,039,199 | | 2,200,440 |
Siam City Bank PCL: | | | |
NVDR (a) | 19,689,100 | | 3,842,311 |
(For. Reg.) (a) | 14,764,300 | | 2,870,256 |
Siam Commercial Bank PCL (For. Reg.) | 19,766,700 | | 30,684,629 |
Tisco Bank PCL: | | | |
(For. Reg.) | 4,186,360 | | 1,075,011 |
NVDR | 11,487,600 | | 2,965,315 |
Total Access Communication PCL | 2,938,400 | | 1,776,530 |
Total Access Communication PCL (For. Reg.) | 3,217,600 | | 2,287,342 |
TOTAL THAILAND | | 110,649,419 |
TOTAL COMMON STOCKS (Cost $2,260,161,299) | 1,471,813,798 |
Money Market Funds - 8.3% |
| Shares | | Value |
Fidelity Cash Central Fund, 1.81% (b) | 114,015,446 | | $ 114,015,446 |
Fidelity Securities Lending Cash Central Fund, 2.67% (b)(c) | 18,767,191 | | 18,767,191 |
TOTAL MONEY MARKET FUNDS (Cost $132,782,637) | 132,782,637 |
TOTAL INVESTMENT
PORTFOLIO - 99.9% (Cost $2,392,943,936) | | 1,604,596,435 |
NET OTHER ASSETS - 0.1% | | 1,035,742 |
NET ASSETS - 100% | $ 1,605,632,177 |
Legend |
(a) Non-income producing |
(b) Affiliated fund that is available only to investment companies and other accounts managed by Fidelity Investments. The rate quoted is the annualized seven-day yield of the fund at period end. A complete unaudited listing of the fund's holdings as of its most recent quarter end is available upon request. |
(c) Investment made with cash collateral received from securities on loan. |
(d) Security or a portion of the security is on loan at period end. |
Affiliated Central Funds |
Information regarding fiscal year to date income earned by the Fund from investments in Fidelity Central Funds is as follows: |
Fund | Income earned |
Fidelity Cash Central Fund | $ 4,003,802 |
Fidelity Securities Lending Cash Central Fund | 465,207 |
Total | $ 4,469,009 |
See accompanying notes which are an integral part of the financial statements.
Annual Report
Southeast Asia
Financial Statements
Statement of Assets and Liabilities
| October 31, 2008 |
| | |
Assets | | |
Investment in securities, at value (including securities loaned of $18,065,249) -
See accompanying schedule: Unaffiliated issuers
(cost $2,260,161,299) | $ 1,471,813,798 | |
Fidelity Central Funds
(cost $132,782,637) | 132,782,637 | |
Total Investments
(cost $2,392,943,936) | | $ 1,604,596,435 |
Foreign currency held at value
(cost $12,494) | | 12,494 |
Receivable for investments sold | | 37,044,893 |
Receivable for fund shares sold | | 2,828,147 |
Dividends receivable | | 4,912,499 |
Distributions receivable from Fidelity Central Funds | | 215,696 |
Prepaid expenses | | 1,485 |
Other receivables | | 1,590,057 |
Total assets | | 1,651,201,706 |
| | |
Liabilities | | |
Payable for investments purchased | $ 22,428,099 | |
Payable for fund shares redeemed | 1,907,257 | |
Accrued management fee | 1,474,762 | |
Other affiliated payables | 586,223 | |
Other payables and accrued expenses | 405,997 | |
Collateral on securities loaned, at value | 18,767,191 | |
Total liabilities | | 45,569,529 |
| | |
Net Assets | | $ 1,605,632,177 |
Net Assets consist of: | | |
Paid in capital | | $ 2,437,555,972 |
Undistributed net investment income | | 22,071,165 |
Accumulated undistributed net realized gain (loss) on investments and foreign currency transactions | | (65,567,036) |
Net unrealized appreciation (depreciation) on investments and assets and liabilities in foreign currencies | | (788,427,924) |
Net Assets, for 86,810,432 shares outstanding | | $ 1,605,632,177 |
Net Asset Value, offering price and redemption price per share ($1,605,632,177 ÷ 86,810,432 shares) | | $ 18.50 |
Statement of Operations
| Year ended October 31, 2008 |
| | |
Investment Income | | |
Dividends | | $ 94,952,118 |
Interest | | 60,633 |
Income from Fidelity Central Funds (including $465,207 from security lending) | | 4,469,009 |
| | 99,481,760 |
Less foreign taxes withheld | | (11,021,514) |
Total income | | 88,460,246 |
| | |
Expenses | | |
Management fee
Basic fee | $ 26,531,282 | |
Performance adjustment | 4,627,357 | |
Transfer agent fees | 8,463,869 | |
Accounting and security lending fees | 1,392,494 | |
Custodian fees and expenses | 2,152,027 | |
Independent trustees' compensation | 16,622 | |
Registration fees | 188,553 | |
Audit | 90,803 | |
Legal | 20,689 | |
Interest | 23,582 | |
Miscellaneous | 448,345 | |
Total expenses before reductions | 43,955,623 | |
Expense reductions | (5,215,709) | 38,739,914 |
Net investment income (loss) | | 49,720,332 |
Realized and Unrealized Gain (Loss) Net realized gain (loss) on: | | |
Investment securities: | | |
Unaffiliated issuers | (45,575,129) | |
Foreign currency transactions | (9,150,417) | |
Futures contracts | 5,594,921 | |
Total net realized gain (loss) | | (49,130,625) |
Change in net unrealized appreciation (depreciation) on: Investment securities | (3,186,929,128) | |
Assets and liabilities in foreign currencies | 88,275 | |
Total change in net unrealized appreciation (depreciation) | | (3,186,840,853) |
Net gain (loss) | | (3,235,971,478) |
Net increase (decrease) in net assets resulting from operations | | $ (3,186,251,146) |
See accompanying notes which are an integral part of the financial statements.
Annual Report
Southeast Asia
Financial Statements - continued
Statement of Changes in Net Assets
| Year ended
October 31,
2008 | Year ended
October 31,
2007 |
Increase (Decrease) in Net Assets | | |
Operations | | |
Net investment income (loss) | $ 49,720,332 | $ 29,263,280 |
Net realized gain (loss) | (49,130,625) | 389,303,249 |
Change in net unrealized appreciation (depreciation) | (3,186,840,853) | 2,027,808,797 |
Net increase (decrease) in net assets resulting from operations | (3,186,251,146) | 2,446,375,326 |
Distributions to shareholders from net investment income | (35,424,593) | (15,348,089) |
Distributions to shareholders from net realized gain | (365,645,497) | (86,082,743) |
Total distributions | (401,070,090) | (101,430,832) |
Share transactions
Proceeds from sales of shares | 1,476,163,760 | 3,409,321,043 |
Reinvestment of distributions | 382,538,765 | 97,580,587 |
Cost of shares redeemed | (2,965,607,006) | (1,154,364,384) |
Net increase (decrease) in net assets resulting from share transactions | (1,106,904,481) | 2,352,537,246 |
Redemption fees | 5,921,400 | 3,507,067 |
Total increase (decrease) in net assets | (4,688,304,317) | 4,700,988,807 |
| | |
Net Assets | | |
Beginning of period | 6,293,936,494 | 1,592,947,687 |
End of period (including undistributed net investment income of $22,071,165 and undistributed net investment income of $27,443,001, respectively) | $ 1,605,632,177 | $ 6,293,936,494 |
Other Information Shares | | |
Sold | 40,747,607 | 94,400,629 |
Issued in reinvestment of distributions | 9,350,739 | 3,728,720 |
Redeemed | (90,730,727) | (32,941,955) |
Net increase (decrease) | (40,632,381) | 65,187,394 |
Financial Highlights
Years ended October 31, | 2008 | 2007 | 2006 | 2005 | 2004 |
Selected Per-Share Data | | | | | |
Net asset value, beginning of period | $ 49.39 | $ 25.59 | $ 18.70 | $ 14.87 | $ 13.72 |
Income from Investment Operations | | | | | |
Net investment income (loss) B | .44 | .33 | .33 | .30 | .16 |
Net realized and unrealized gain (loss) | (28.21) | 24.95 | 7.23 | 3.66 | 1.10 |
Total from investment operations | (27.77) | 25.28 | 7.56 | 3.96 | 1.26 |
Distributions from net investment income | (.28) | (.23) | (.26) | (.14) | (.13) |
Distributions from net realized gain | (2.89) | (1.29) | (.43) | - | - |
Total distributions | (3.17) | (1.52) | (.69) | (.14) | (.13) |
Redemption fees added to paid in capital B | .05 | .04 | .02 | .01 | .02 |
Net asset value, end of period | $ 18.50 | $ 49.39 | $ 25.59 | $ 18.70 | $ 14.87 |
Total Return A | (59.64)% | 104.22% | 41.50% | 26.84% | 9.39% |
Ratios to Average Net Assets C, E | | | | | |
Expenses before reductions | 1.18% | 1.08% | 1.21% | 1.20% | 1.21% |
Expenses net of fee waivers, if any | 1.18% | 1.08% | 1.21% | 1.20% | 1.21% |
Expenses net of all reductions | 1.04% | .98% | 1.04% | 1.09% | 1.20% |
Net investment income (loss) | 1.34% | .96% | 1.44% | 1.71% | 1.11% |
Supplemental Data | | | | | |
Net assets, end of period (000 omitted) | $ 1,605,632 | $ 6,293,936 | $ 1,592,948 | $ 783,765 | $ 464,874 |
Portfolio turnover rate D | 147% | 72% | 100% | 109% | 131% |
A Total returns would have been lower had certain expenses not been reduced during the periods shown. B Calculated based on average shares outstanding during the period. C Fees and expenses of the underlying Fidelity Central Funds are not included in the Fund's expense ratio. The Fund indirectly bears its proportionate share of the expenses of any underlying Fidelity Central Funds. D Amount does not include the portfolio activity of any underlying Fidelity Central Funds. E Expense ratios reflect operating expenses of the Fund. Expenses before reductions do not reflect amounts reimbursed by the investment adviser or reductions from brokerage service arrangements or other expense offset arrangements and do not represent the amount paid by the Fund during periods when reimbursements or reductions occur. Expenses net of fee waivers reflect expenses after reimbursement by the investment adviser but prior to reductions from brokerage service arrangements or other expense offset arrangements. Expenses net of all reductions represent the net expenses paid by the Fund. |
See accompanying notes which are an integral part of the financial statements.
Annual Report
Notes to Financial Statements
For the period ended October 31, 2008
1. Organization.
Fidelity Europe Fund, Fidelity Europe Capital Appreciation Fund, Fidelity Japan Fund, Fidelity Japan Smaller Companies Fund, Fidelity Latin American Fund, Fidelity Nordic Fund, Fidelity Pacific Basin Fund and Fidelity Southeast Asia Fund (the Funds) are funds of Fidelity Investment Trust (the trust). The trust is registered under the Investment Company Act of 1940, as amended (the 1940 Act), as an open-end management investment company organized as a Massachusetts business trust. The Funds are diversified with the exception of Fidelity Latin America Fund. Each Fund is authorized to issue an unlimited number of shares. The Fidelity Japan Smaller Companies Fund is currently closed to most new accounts and will reopen on or about December 31, 2008. Certain Funds' investments in emerging markets can be subject to social, economic, regulatory, and political uncertainties and can be extremely volatile.
2. Investments in Fidelity Central Funds.
The Funds may invest in Fidelity Central Funds, which are open-end investment companies available only to other investment companies and accounts managed by Fidelity Management & Research Company (FMR) and its affiliates. The Funds' Schedules of Investments list each of the Fidelity Central Funds held as of period end, if any, as an investment of each Fund, but does not include the underlying holdings of each Fidelity Central Fund. As an Investing Fund, the Funds indirectly bear their proportionate share of the expenses of the underlying Fidelity Central Funds.
The Money Market Central Funds seek preservation of capital and current income and are managed by Fidelity Investments Money Management, Inc. (FIMM), an affiliate of FMR.
A complete unaudited list of holdings for each Fidelity Central Fund is available upon request or at the SEC's web site at www.sec.gov. In addition, the financial statements of the Fidelity Central Funds, which are not covered by the Funds' Report of Independent Registered Public Accounting Firm, are available on the SEC's web site or upon request.
3. Significant Accounting Policies.
The financial statements have been prepared in conformity with accounting principles generally accepted in the United States of America, which require management to make certain estimates and assumptions at the date of the financial statements. Actual results could differ from those estimates. The following summarizes the significant accounting policies of the Funds:
Security Valuation. Investments are valued as of 4:00 p.m. Eastern time on the last calendar day of the period. Wherever possible, each Fund uses independent pricing services approved by the Board of Trustees to value their investments.
Equity securities, including restricted securities, for which market quotations are readily available, are valued at the last reported sale price or official closing price as reported by an independent pricing service on the primary market or exchange on which they are traded. In the event there were no sales during the day or closing prices are not available, securities are valued at the last quoted bid price. Debt securities, including restricted securities, are valued by independent pricing services or by dealers who make markets in such securities. Pricing services consider yield or price of bonds of comparable quality, coupon, maturity and type as well as dealer supplied prices. Futures contracts are valued at the settlement price established each day by the board of trade or exchange on which they are traded. Investments in open-end mutual funds, including the Fidelity Central Funds, are valued at their closing net asset value each business day. Short-term securities with remaining maturities of sixty days or less for which quotations are not readily available are valued at amortized cost, which approximates value.
When current market prices or quotations are not readily available or reliable, valuations may be determined in good faith in accordance with procedures adopted by the Board of Trustees. Factors used in determining value may include significant market or security specific events, changes in interest rates and credit quality, and developments in foreign markets which are monitored by evaluating the performance of ADRs, futures contracts and exchange-traded funds. The frequency with which these procedures are used cannot be predicted and may be utilized to a significant extent. The value of securities used for net asset value (NAV) calculation under these procedures may differ from published prices for the same securities.
Foreign Currency. Certain Funds may use foreign currency contracts to facilitate transactions in foreign-denominated securities. Losses from these transactions may arise from changes in the value of the foreign currency or if the counterparties do not perform under the contracts' terms.
Foreign-denominated assets, including investment securities, and liabilities are translated into U.S. dollars at the exchange rate at period end. Purchases and sales of investment securities, income and dividends received and expenses denominated in foreign currencies are translated into U.S. dollars at the exchange rate in effect on the transaction date.
The effects of exchange rate fluctuations on investments are included with the net realized and unrealized gain (loss) on investment securities. Other foreign currency transactions resulting in realized and unrealized gain (loss) are disclosed separately.
Investment Transactions and Income. For financial reporting purposes, the Funds' investment holdings and NAV include trades executed through the end of the last business day of the period. The NAV per share for processing shareholder transactions is calculated as of the close of business of the New York Stock Exchange (NYSE), normally 4:00 p.m. Eastern time and includes trades executed through the end of the prior business day. Gains and
Annual Report
3. Significant Accounting Policies - continued
Investment Transactions and Income - continued
losses on securities sold are determined on the basis of identified cost and may include proceeds received from litigation. Dividend income is recorded on the ex-dividend date, except for certain dividends from foreign securities where the ex-dividend date may have passed, which are recorded as soon as the Funds are informed of the ex-dividend date. Non-cash dividends included in dividend income, if any, are recorded at the fair market value of the securities received. Distributions received on securities that represent a return of capital or capital gain are recorded as a reduction of cost of investments and/or as a realized gain. The Funds estimate the components of distributions received that may be considered return of capital distributions or capital gain distributions. Interest income and distributions from the Fidelity Central Funds are accrued as earned. Interest income includes coupon interest and amortization of premium and accretion of discount on debt securities. Investment income is recorded net of foreign taxes withheld where recovery of such taxes is uncertain.
Expenses. Most expenses of the trust can be directly attributed to a fund. Expenses which cannot be directly attributed are apportioned among each Fund in the trust. Expense estimates are accrued in the period to which they relate and adjustments are made when actual amounts are known.
Income Tax Information and Distributions to Shareholders. Each year, each Fund intends to qualify as a regulated investment company by distributing substantially all of its taxable income and realized gains under Subchapter M of the Internal Revenue Code and filing its U.S. federal tax return. As a result, no provision for income taxes is required. Each Fund is subject to the provisions of FASB Interpretation No. 48, Accounting for Uncertainties in Income Taxes (FIN 48). FIN 48 sets forth a minimum threshold for financial statement recognition of the benefit of a tax position taken or expected to be taken in a tax return. The implementation of FIN 48 did not result in any unrecognized tax benefits in the accompanying financial statements. Each of the Funds' federal tax returns for the prior three fiscal years remains subject to examination by the Internal Revenue Service (IRS). Foreign taxes are provided for based on each Fund's understanding of the tax rules and rates that exist in the foreign markets in which it invests.
Distributions are recorded on the ex-dividend date. Income and capital gain distributions are determined in accordance with income tax regulations, which may differ from generally accepted accounting principles. In addition, certain Funds will claim a portion of the payment made to redeeming shareholders as a distribution for income tax purposes.
Capital accounts within the financial statements are adjusted for permanent book-tax differences. These adjustments have no impact on net assets or the results of operations. Temporary book-tax differences will reverse in a subsequent period.
Book-tax differences are primarily due to futures transactions, foreign currency transactions, certain foreign taxes, passive foreign investment companies (PFIC), market discount, deferred trustees compensation, capital loss carryforwards, and losses deferred due to wash sales.
The tax-basis components of distributable earnings and the federal tax cost as of period end were as follows for each Fund:
| Cost for Federal
Income Tax
Purposes | Unrealized
Appreciation | Unrealized
Depreciation | Net Unrealized
Appreciation/
(Depreciation) |
Europe | $ 3,699,227,211 | $ 82,862,400 | $ (968,222,947) | $ (885,360,547) |
Europe Capital Appreciation | 718,614,290 | 7,561,100 | (213,992,500) | (206,431,400) |
Japan | 1,620,316,417 | 12,612,277 | (547,017,507) | (534,405,230) |
Japan Smaller Companies | 540,519,334 | 32,364,233 | (121,788,720) | (89,424,487) |
Latin America | 2,729,122,745 | 506,146,428 | (930,039,644) | (423,893,216) |
Nordic | 499,791,073 | 8,142,793 | (175,775,102) | (167,632,309) |
Pacific Basin | 696,467,540 | 23,237,652 | (303,691,170) | (280,453,518) |
Southeast Asia | 2,473,006,716 | 27,892,477 | (896,302,758) | (868,410,281) |
| Undistributed
Ordinary Income | Capital Loss
Carryforward |
Europe | $ 76,188,611 | $ (413,142,102) |
Europe Capital Appreciation | 17,546,287 | (193,924,656) |
Japan | 10,938,553 | (151,185,501) |
Japan Smaller Companies | 2,683,240 | (58,533,238) |
Latin America | 20,066,693 | (156,435,569) |
Nordic | 14,374,046 | (90,962,421) |
Pacific Basin | - | (161,686) |
Annual Report
Notes to Financial Statements - continued
3. Significant Accounting Policies - continued
Income Tax Information and Distributions to Shareholders - continued
The tax character of distributions paid was as follows:
October 31, 2008 | Ordinary Income | Long-term
Capital Gains | Total |
Europe | $ 146,775,758 | $ 287,727,058 | $ 434,502,816 |
Europe Capital Appreciation | 75,043,543 | 119,911,765 | 194,955,308 |
Japan | 3,964,749 | 236,930,224 | 240,894,973 |
Japan Smaller Companies | 1,282,366 | 13,464,846 | 14,747,212 |
Latin America | 58,822,488 | 155,654,931 | 214,477,419 |
Nordic | 43,670,192 | 31,166,331 | 74,836,523 |
Pacific Basin | 7,436,752 | 131,157,223 | 138,593,975 |
Southeast Asia | 237,858,086 | 163,212,004 | 401,070,090 |
October 31, 2007 | Ordinary Income | Long-term
Capital Gains | Total |
Europe | $ 118,437,528 | $ 418,419,221 | $ 536,856,749 |
Europe Capital Appreciation | 20,918,102 | 84,526,190 | 105,444,292 |
Japan | 1,030,851 | 23,709,588 | 24,740,439 |
Japan Smaller Companies | 857,665 | 30,875,932 | 31,733,597 |
Latin America | 48,023,908 | 60,491,350 | 108,515,258 |
Nordic | 3,011,989 | 5,296,944 | 8,308,933 |
Pacific Basin | 16,899,819 | 66,610,170 | 83,509,989 |
Southeast Asia | 37,369,256 | 64,061,576 | 101,430,832 |
Short-Term Trading (Redemption) Fees. Shares held in Japan, Japan Smaller Companies, Latin America, Nordic, Pacific Basin and Southeast Asia less than 90 days are subject to a redemption fee equal to 1.50% of the proceeds of the redeemed shares. Shares held in Europe and Europe Capital Appreciation less than 30 days are subject to a redemption fee equal to 1.00% of the proceeds of the redeemed shares. All redemption fees, including any estimated redemption fees paid by FMR, are retained by the Funds and accounted for as an addition to paid in capital.
New Accounting Pronouncements. In September 2006, Statement of Financial Accounting Standards No. 157, Fair Value Measurements (SFAS 157), was issued and is effective for fiscal years beginning after November 15, 2007. SFAS 157 defines fair value, establishes a framework for measuring fair value and results in expanded disclosures about fair value measurements.
In addition, in March 2008, Statement of Financial Accounting Standards No. 161, Disclosures about Derivative Instruments and Hedging Activities (SFAS 161), was issued and is effective for reporting periods beginning after November 15, 2008. SFAS 161 requires enhanced disclosures to provide information about the reasons the Funds invest in derivative instruments, the accounting treatment and the effect derivatives have on financial performance.
4. Operating Policies.
Repurchase Agreements. FMR has received an Exemptive Order from the Securities and Exchange Commission (the SEC) which permits certain Funds and other affiliated entities of FMR to transfer uninvested cash balances into joint trading accounts which are then invested in repurchase agreements. Certain Funds may also invest directly with institutions in repurchase agreements. Repurchase agreements are collateralized by government or non-government securities. Upon settlement date, collateral is held in segregated accounts with custodian banks and may be obtained in the event of a default of the counterparty. Each applicable Fund monitors, on a daily basis, the value of the collateral to ensure it is at least equal to the principal amount of the repurchase agreement (including accrued interest). In the event of a default by the counterparty, realization of the collateral proceeds could be delayed, during which time the value of the collateral may decline.
Futures Contracts. Certain Funds may use futures contracts to manage their exposure to the stock market. Buying futures tends to increase a fund's exposure to the underlying instrument, while selling futures tends to decrease a fund's exposure to the underlying instrument or hedge other fund investments. Upon entering into a futures contract, a fund is required to deposit with a clearing broker, no later than the following business day, an amount ("initial margin") equal to a certain percentage of the face value of the contract. The initial margin may be in the form of cash or securities and is transferred to a segregated account on settlement date. Subsequent payments ("variation margin") are made or received by a fund depending on the daily fluctuations in the value of the futures contract and are accounted for as unrealized gains or losses. Realized gains (losses) are recorded upon the expiration or closing of the futures contract. Securities deposited to meet margin requirements are identified in each applicable fund's Schedule of Investments. Losses may arise from changes in the value of the underlying instruments or if the counterparties do not perform under the contract's terms.
Annual Report
4. Operating Policies - continued
Restricted Securities. Certain Funds may invest in securities that are subject to legal or contractual restrictions on resale. These securities generally may be resold in transactions exempt from registration or to the public if the securities are registered. Disposal of these securities may involve time-consuming negotiations and expense, and prompt sale at an acceptable price may be difficult. Information regarding restricted securities is included at the end of each applicable Fund's Schedule of Investments.
5. Purchases and Sales of Investments.
Purchases and sales of securities, other than short-term securities, are noted in the table below.
| Purchases ($) | Sales ($) |
Europe | 4,469,000,352 | 4,710,953,171 |
Europe Capital Appreciation | 1,075,641,867 | 1,395,908,072 |
Japan | 1,152,221,837 | 1,155,863,310 |
Japan Smaller Companies | 508,021,087 | 580,113,189 |
Latin America | 2,769,792,244 | 3,160,431,435 |
Nordic | 506,118,715 | 726,672,016 |
Pacific Basin | 642,759,832 | 802,511,740 |
Southeast Asia | 5,360,953,774 | 6,815,633,874 |
6. Fees and Other Transactions with Affiliates.
Management Fee. FMR and its affiliates provide the Funds with investment management related services for which the Funds pay a monthly management fee. The management fee is the sum of an individual fund fee rate and a group fee rate. The individual fund fee rate is applied to each Fund's average net assets. The group fee rate is based upon the average net assets of all the mutual funds advised by FMR. The group fee rate decreases as assets under management increase and increases as assets under management decrease. In addition, the management fee for Europe, Europe Capital Appreciation, Japan, Pacific Basin and Southeast Asia is subject to a performance adjustment (up to a maximum ± .20% of each applicable Fund's average net assets over a 36 month performance period). The upward or downward adjustment to the management fee is based on each Fund's relative investment performance as compared to an appropriate benchmark index. For the period, each Fund's annual management fee rate expressed as a percentage of each Fund's average net assets, including the performance adjustment, if applicable was as follows:
| Individual Rate | Group Rate | Total |
Europe | .45% | .26% | .72% |
Europe Capital Appreciation | .45% | .26% | .84% |
Japan | .45% | .26% | .81% |
Japan Smaller Companies | .45% | .26% | .71% |
Latin America | .45% | .26% | .71% |
Nordic | .45% | .26% | .71% |
Pacific Basin | .45% | .26% | .82% |
Southeast Asia | .45% | .26% | .84% |
Transfer Agent Fees. Fidelity Investments Institutional Operations Company, Inc. (FIIOC), an affiliate of FMR, is the Funds' transfer, dividend disbursing and shareholder servicing agent. FIIOC receives account fees and asset-based fees that vary according to account size and type of account. FIIOC pays for typesetting, printing and mailing of shareholder reports, except proxy statements. Prior to January 1, 2008, Fidelity Service Company, Inc. (FSC), also an affiliate of FMR, was the Funds' transfer agent. For the period, the transfer agent fees were equivalent to the following annual rates expressed as a percentage of average net assets:
Europe | .23% |
Europe Capital Appreciation | .23% |
Japan | .24% |
Japan Smaller Companies | .23% |
Latin America | .20% |
Nordic | .27% |
Pacific Basin | .25% |
Southeast Asia | .23% |
Accounting and Security Lending Fees. FSC maintains each Fund's accounting records. The accounting fee is based on the level of average net assets for the month. Under a separate contract, FSC administers the security lending program. The security lending fee is based on the number and duration of lending transactions.
Annual Report
Notes to Financial Statements - continued
6. Fees and Other Transactions with Affiliates - continued
Brokerage Commissions. Certain Funds placed a portion of their portfolio transactions with brokerage firms which are affiliates of the investment adviser. The commissions paid to these affiliated firms were as follows:
| Amount |
Europe Capital Appreciation | $ 712 |
Latin America | 3,429 |
Pacific Basin | 9 |
Southeast Asia | 468 |
Interfund Lending Program. Pursuant to an Exemptive Order issued by the SEC, the Funds, along with other registered investment companies having management contracts with FMR, may participate in an interfund lending program. This program provides an alternative credit facility allowing the funds to borrow from, or lend money to, other participating affiliated funds. At period end, there were no interfund loans outstanding. Each applicable fund's activity in this program during the period for which loans were outstanding was as follows:
| Borrower or
Lender | Average
Daily Loan
Balance | Weighted
Average
Interest Rate | Interest
Expense |
Europe | Borrower | $ 10,300,000 | 4.71% | $ 4,042 |
Latin America | Borrower | 44,676,778 | 4.19 | 46,841 |
Nordic | Borrower | 5,172,250 | 3.15 | 3,619 |
Pacific Basin | Borrower | 5,736,667 | 3.00 | 1,432 |
Southeast Asia | Borrower | 29,831,000 | 4.36 | 21,669 |
7. Committed Line of Credit.
Certain Funds participate with other funds managed by FMR in a $4.2 billion credit facility (the "line of credit") to be utilized for temporary or emergency purposes to fund shareholder redemptions or for other short-term liquidity purposes. The participating funds have agreed to pay commitment fees on their pro rata portion of the line of credit, which is reflected in Miscellaneous Expense on the Statement of Operations, and is as follows:
Europe | $ 9,324 |
Europe Capital Appreciation | 2,047 |
Japan | 3,086 |
Japan Smaller Companies | 1,230 |
Latin America | 11,314 |
Nordic | 1,488 |
Pacific Basin | 1,832 |
Southeast Asia | 7,967 |
During the period, there were no borrowings on this line of credit.
8. Security Lending.
Certain Funds lend portfolio securities from time to time in order to earn additional income. On the settlement date of the loan, each applicable Fund receives collateral (in the form of U.S. Treasury obligations, letters of credit and/or cash) against the loaned securities and maintains collateral in an amount not less than 100% of the market value of the loaned securities during the period of the loan. The market value of the loaned securities is determined at the close of business of the Funds and any additional required collateral is delivered to the Funds on the next business day. If the borrower defaults on its obligation to return the securities loaned because of insolvency or other reasons, a fund could experience delays and costs in recovering the securities loaned or in gaining access to the collateral. Any cash collateral received is invested in the Fidelity Securities Lending Cash Central Fund. The value of loaned securities and cash collateral at period end are disclosed on each applicable Fund's Statement of Assets and Liabilities. Security lending income represents the income earned on investing cash collateral, less fees and expenses associated with the loan, plus any premium payments that may be received on the loan of certain types of securities. Security lending income is presented on each applicable Fund's Statement of Operations as a component of income from Fidelity Central Funds.
Annual Report
9. Bank Borrowings.
Each Fund is permitted to have bank borrowings for temporary or emergency purposes to fund shareholder redemptions. Each Fund has established borrowing arrangements with certain banks. The interest rate on the borrowings is the bank's base rate, as revised from time to time. At period end, there were no bank borrowings outstanding. Each applicable Fund's activity in this program during the period for which loans were outstanding was as follows:
| Average Daily Loan Balance | Weighted Average Interest Rate | Interest Expense |
Southeast Asia | $ 10,480,000 | 3.29% | $ 1,913 |
10. Expense Reductions.
Many of the brokers with whom FMR places trades on behalf of certain Funds provided services to these Funds in addition to trade execution. These services included payments of expenses on behalf of each applicable Fund. In addition, through arrangements with each applicable Fund's custodian and transfer agent, credits realized as a result of uninvested cash balances were used to reduce each applicable Fund's expenses. All of the applicable expense reductions are noted in the table below.
| Brokerage Service Arrangements | Custody
expense
reduction | Transfer
Agent
expense
reduction |
Europe | $ 2,101,989 | $ 6,893 | $ 244,891 |
Europe Capital Appreciation | 430,501 | - | 10,252 |
Japan | 205,650 | 188 | 65,896 |
Japan Smaller Companies | 76,815 | - | 10,246 |
Latin America | 694,825 | 9,090 | 65,399 |
Nordic | 149,164 | 11,518 | 8,530 |
Pacific Basin | 459,326 | - | 13,674 |
Southeast Asia | 5,142,110 | 4,237 | 69,362 |
11. Other.
The Funds' organizational documents provide former and current trustees and officers with a limited indemnification against liabilities arising in connection with the performance of their duties to the Funds. In the normal course of business, the Funds may also enter into contracts that provide general indemnifications. The Funds' maximum exposure under these arrangements is unknown as this would be dependent on future claims that may be made against the Funds. The risk of material loss from such claims is considered remote.
During the period, Lehman Brothers Holdings, Inc. and certain of its affiliates (LBHI) sought protection under the insolvency laws of their jurisdictions of organization, including the United States, the United Kingdom and Japan. At the time LBHI's insolvency proceedings were instituted, Europe Capital Appreciation and Pacific Basin had outstanding securities trades with counterparties affiliated with LBHI. As a result of the insolvency proceedings, LBHI is unable to fulfill its commitments and, in certain cases, Europe Capital Appreciation and Pacific Basin may have terminated its trades and related agreements with the relevant entities and, where appropriate, is in the process of initiating claims for damages. FMR believes that the financial impact to Europe Capital Appreciation and Pacific Basin relating to the terminated trades and agreements is immaterial.
At the end of the period, FMR or its affiliates were the owners of record of approximately 24% of the total outstanding shares of Japan Smaller Companies. Fidelity Freedom Fund 2020 was the owner of record of approximately 18% and 15% of the total outstanding shares of Europe and Japan, respectively. Fidelity Freedom Fund 2030 was the owner of record of approximately 16% and 13% of the total outstanding shares of Europe and Japan, respectively. The Fidelity Freedom Funds were the owners of record, in the aggregate, of approximately 73% and 60% of the total outstanding shares of Europe and Japan, respectively.
In December 2006, the Independent Trustees, with the assistance of independent counsel, completed an investigation regarding gifts, gratuities and business entertainment provided by certain brokers to certain individuals who were employed on FMR's domestic equity trading desk during the period 2002 to 2004. The Independent Trustees and FMR agreed that, despite the absence of proof that the Fidelity mutual funds experienced diminished execution quality as a result of the improper receipt of gifts and business entertainment, the conduct at issue was serious and was worthy of redress. Accordingly, the Independent Trustees requested, and FMR agreed to make, a payment of $42 million plus accrued interest, which equaled approximately $7.3 million, to certain Fidelity mutual funds.
In March 2008, the Trustees approved a method for allocating this payment among the funds and, in total, FMR paid each fund the following amounts, which is recorded in each applicable Fund's accompanying Statement of Operations:
Europe | $ 693 |
Europe Capital Appreciation | 2,019 |
Latin America | 380 |
Annual Report
Notes to Financial Statements - continued
11. Other - continued
In a related administrative order dated March 5, 2008, the U.S. Securities and Exchange Commission ("SEC") announced a settlement with FMR and FMR Co., Inc. (an affiliate of FMR) involving the SEC's regulatory rules for investment advisers and the improper receipt of gifts, gratuities and business entertainment. Without admitting or denying the SEC's findings, FMR agreed to pay an $8 million civil penalty to the United States Treasury.
Annual Report
Report of Independent Registered Public Accounting Firm
To the Trustees of Fidelity Investment Trust and the Shareholders of:
Fidelity Canada Fund,
Fidelity China Region Fund,
Fidelity Emerging Markets Fund,
Fidelity Europe Fund,
Fidelity Japan Fund,
Fidelity Japan Smaller Companies Fund,
Fidelity Latin America Fund,
Fidelity Nordic Fund,
Fidelity Pacific Basin Fund,
Fidelity Southeast Asia Fund
In our opinion, the accompanying statements of assets and liabilities, including the schedules of investments, and the related statements of operations and of changes in net and the financial highlights present fairly, in all material respects, the financial position of Fidelity Canada Fund, Fidelity China Region Fund, Fidelity Emerging Markets Fund, Fidelity Europe Fund, Fidelity Japan Fund, Fidelity Japan Smaller Companies Fund, Fidelity Latin America Fund, Fidelity Nordic Fund, Fidelity Pacific Basin Fund and Fidelity Southeast Asia Fund (funds of Fidelity Investment Trust) at October 31, 2008, the results of each of their operations for the year then ended, the changes in their net assets for each of the two years in the period then ended and the financial highlights for each of the periods indicated, in conformity with accounting principles generally accepted in the United States of America. These financial statements and financial highlights (hereafter referred to as "financial statements") are the responsibility of the Fidelity Investment Trust's management. Our responsibility is to express an opinion on these financial statements based on our audits. We conducted our audits of these financial statements in accordance with the standards of the Public Company Accounting Oversight Board (United States). Those standards require that we plan and perform the audit to obtain reasonable assurance about whether the financial statements are free of material misstatement. An audit includes examining, on a test basis, evidence supporting the amounts and disclosures in the financial statements, assessing the accounting principles used and significant estimates made by management, and evaluating the overall financial statement presentation. We believe that our audits, which included confirmation of securities at October 31, 2008 by correspondence with the custodian and brokers, provide a reasonable basis for our opinion.
/s/ PricewaterhouseCoopers LLP
PricewaterhouseCoopers LLP
Boston, Massachusetts
December 23, 2008
Annual Report
Report of Independent Registered Public Accounting Firm
To the Trustees of Fidelity Investment Trust and Shareholders of Fidelity Europe Capital Appreciation Fund:
We have audited the accompanying statement of assets and liabilities of Fidelity Europe Capital Appreciation Fund (the Fund), a fund of Fidelity Investment Trust (the Trust) including the schedule of investments, as of October 31, 2008, and the related statement of operations for the year then ended, the statement of changes in net assets for each of the two years in the period then ended, and the financial highlights for each of the five years in the period then ended. These financial statements and financial highlights are the responsibility of the Fund's management. Our responsibility is to express an opinion on these financial statements and financial highlights based on our audits.
We conducted our audits in accordance with standards of the Public Company Accounting Oversight Board (United States). Those standards require that we plan and perform the audit to obtain reasonable assurance about whether the financial statements and financial highlights are free of material misstatement. The Fund is not required to have, nor were we engaged to perform, an audit of its internal control over financial reporting. Our audits included consideration of internal control over financial reporting as a basis for designing audit procedures that are appropriate in the circumstances, but not for the purpose of expressing an opinion on the effectiveness of the Fund's internal control over financial reporting. Accordingly, we express no such opinion. An audit also includes examining, on a test basis, evidence supporting the amounts and disclosures in the financial statements, assessing the accounting principles used and significant estimates made by management, as well as evaluating the overall financial statement presentation. Our procedures included confirmation of securities owned as of October 31, 2008, by correspondence with the custodians and brokers; where replies were not received from brokers, we performed other auditing procedures. We believe that our audits provide a reasonable basis for our opinion.
In our opinion, the financial statements and financial highlights referred to above present fairly, in all material respects, the financial position of Fidelity Europe Capital Appreciation Fund as of October 31, 2008, the results of its operations for the year then ended, the changes in its net assets for each of the two years in the period then ended, and its financial highlights for each of the five years in the period then ended, in conformity with accounting principles generally accepted in the United States of America.
/s/ Deloitte & Touche LLP
DELOITTE & TOUCHE LLP
Boston, Massachusetts
December 23, 2008
Annual Report
The Trustees, Member of the Advisory Board, and executive officers of the trust and funds, as applicable, are listed below. The Board of Trustees governs each fund and is responsible for protecting the interests of shareholders. The Trustees are experienced executives who meet periodically throughout the year to oversee each fund's activities, review contractual arrangements with companies that provide services to each fund, and review each fund's performance. Except for Edward C. Johnson 3d and James C. Curvey, each of the Trustees oversees 220 funds advised by FMR or an affiliate. Messrs. Johnson and Curvey oversee 379 funds advised by FMR or an affiliate.
The Trustees hold office without limit in time except that (a) any Trustee may resign; (b) any Trustee may be removed by written instrument, signed by at least two-thirds of the number of Trustees prior to such removal; (c) any Trustee who requests to be retired or who has become incapacitated by illness or injury may be retired by written instrument signed by a majority of the other Trustees; and (d) any Trustee may be removed at any special meeting of shareholders by a two-thirds vote of the outstanding voting securities of the trust. Each Trustee who is not an interested person (as defined in the 1940 Act) (Independent Trustee), shall retire not later than the last day of the calendar year in which his or her 72nd birthday occurs. The Independent Trustees may waive this mandatory retirement age policy with respect to individual Trustees. The executive officers and Advisory Board Member hold office without limit in time, except that any officer and Advisory Board Member may resign or may be removed by a vote of a majority of the Trustees at any regular meeting or any special meeting of the Trustees. Except as indicated, each individual has held the office shown or other offices in the same company for the past five years.
Each fund's Statement of Additional Information (SAI) includes more information about the Trustees. To request a free copy, call Fidelity at 1-800-544-8544.
Interested Trustees*:
Correspondence intended for each Trustee who is an interested person may be sent to Fidelity Investments, 82 Devonshire Street, Boston, Massachusetts 02109.
Name, Age; Principal Occupation |
Edward C. Johnson 3d (78) |
| Year of Election or Appointment: 1984 Mr. Johnson is Chairman of the Board of Trustees. Mr. Johnson serves as Chief Executive Officer, Chairman, and a Director of FMR LLC; Chairman and a Director of FMR; Chairman and a Director of Fidelity Research & Analysis Company (FRAC); Chairman and a Director of Fidelity Investments Money Management, Inc.; and Chairman and a Director of FMR Co., Inc. In addition, Mr. Johnson serves as Chairman and Director of FIL Limited. Previously, Mr. Johnson served as President of FMR LLC (2006-2007). |
James C. Curvey (73) |
| Year of Election or Appointment: 2007 Mr. Curvey also serves as Trustee (2007-present) of other investment companies advised by FMR. Mr. Curvey is a Director of FMR and FMR Co., Inc. (2007-present). Mr. Curvey is also Vice Chairman (2006-present) and Director of FMR LLC. In addition, Mr. Curvey serves as an Overseer for the Boston Symphony Orchestra and a member of the Trustees of Villanova University. |
* Trustees have been determined to be "Interested Trustees" by virtue of, among other things, their affiliation with the trust or various entities under common control with FMR. FMR Corp. merged with and into FMR LLC on October 1, 2007. Any references to FMR LLC for prior periods are deemed to be references to the prior entity.
Independent Trustees:
Correspondence intended for each Independent Trustee (that is, the Trustees other than the Interested Trustees) may be sent to Fidelity Investments, P.O. Box 55235, Boston, Massachusetts 02205-5235.
Name, Age; Principal Occupation |
Dennis J. Dirks (60) |
| Year of Election or Appointment: 2005 Prior to his retirement in May 2003, Mr. Dirks was Chief Operating Officer and a member of the Board of The Depository Trust & Clearing Corporation (DTCC) (1999-2003). He also served as President, Chief Operating Officer, and Board member of The Depository Trust Company (DTC) (1999-2003) and President and Board member of the National Securities Clearing Corporation (NSCC) (1999-2003). In addition, Mr. Dirks served as a Trustee and a member of the Finance Committee of Manhattan College (2005-2008), and as Chief Executive Officer and Board member of the Government Securities Clearing Corporation (2001-2003) and Chief Executive Officer and Board member of the Mortgage-Backed Securities Clearing Corporation (2001-2003). Mr. Dirks also serves as a Trustee and a member of the Finance Committee of AHRC of Nassau County (2006-present). |
Alan J. Lacy (55) |
| Year of Election or Appointment: 2008 Mr. Lacy serves as Senior Adviser (2007-present) of Oak Hill Capital Partners, L.P. (a private equity firm). Mr. Lacy also served as Chief Executive Officer (2000-2005) and Vice Chairman (2005-2006) of Sears Holdings Corporation and Sears, Roebuck and Co. (retail). In addition, Mr. Lacy serves as a member of the Board of Directors of The Western Union Company (global money transfer, 2006-present) and Bristol-Myers Squibb (global pharmaceuticals, 2007-present). Mr. Lacy is a Trustee of the National Parks Conservation Association and The Field Museum of Natural History. |
Ned C. Lautenbach (64) |
| Year of Election or Appointment: 2000 Mr. Lautenbach is Chairman of the Independent Trustees (2006-present). Mr. Lautenbach is an Advisory Partner of Clayton, Dubilier & Rice, Inc. (private equity investment firm). Previously, Mr. Lautenbach was with the International Business Machines Corporation (IBM) from 1968 until his retirement in 1998. Mr. Lautenbach serves as a Director of Eaton Corporation (diversified industrial) as well as the Philharmonic Center for the Arts in Naples, Florida. He also is a member of the Board of Trustees of Fairfield University (2005-present), as well as a member of the Council on Foreign Relations. Previously, Mr. Lautenbach served as a Director of Sony Corporation (2006-2007). |
Joseph Mauriello (64) |
| Year of Election or Appointment: 2008 Prior to his retirement in January 2006, Mr. Mauriello served in numerous senior management positions including Deputy Chairman and Chief Operating Officer (2004-2005), and Vice Chairman of Financial Services (2002-2004) of KPMG LLP US (professional services firm, 1965-2005). Mr. Mauriello currently serves as a member of the Board of Directors of XL Capital Ltd. (global insurance and re-insurance company, 2006-present) and of Arcadia Resources Inc. (health care services and products, 2007-present). He also served as a Director of the Hamilton Funds of the Bank of New York (2006-2007). |
Cornelia M. Small (64) |
| Year of Election or Appointment: 2005 Ms. Small is a member of the Investment Committee, and Chair (2008-present) and a member of the Board of Trustees of Smith College. Ms. Small also serves on the Investment Committee of the Berkshire Taconic Community Foundation (2008-present). Previously, Ms. Small served as Chairperson of the Investment Committee (2002-2008) of Smith College and as Co-Chair (2000-2003) of the Annual Fund for the Fletcher School of Law and Diplomacy. In addition, she served as Chief Investment Officer, Director of Global Equity Investments, and a member of the Board of Directors of Scudder, Stevens & Clark and Scudder Kemper Investments. |
William S. Stavropoulos (69) |
| Year of Election or Appointment: 2001 Mr. Stavropoulos is Chairman Emeritus of the Board of Directors of The Dow Chemical Company, where he previously served in numerous senior management positions, including President (1993-2000; 2002-2003), CEO (1995-2000; 2002-2004), Chairman of the Executive Committee (2000-2006), and as a member of the Board of Directors (1990-2006). Currently, he is a Director of Teradata Corporation (data warehousing and technology solutions, 2008-present), Chemical Financial Corporation, Maersk Inc. (industrial conglomerate), Tyco International, Inc. (multinational manufacturing and services, 2007-present), and a member of the Advisory Board for Metalmark Capital (private equity investment firm, 2005-present). He is a special advisor to Clayton, Dubilier & Rice, Inc. (private equity investment). In addition, Mr. Stavropoulos is a member of the University of Notre Dame Advisory Council for the College of Science. |
David M. Thomas (59) |
| Year of Election or Appointment: 2008 Previously, Mr. Thomas served as Executive Chairman (2005-2006) and Chairman and Chief Executive Officer (2000-2005) of IMS Health, Inc. (pharmaceutical and healthcare information solutions). In addition, Mr. Thomas serves as a member of the Board of Directors of Fortune Brands, Inc. (consumer products holding company), and Interpublic Group of Companies, Inc. (marketing communication, 2004-present). |
Michael E. Wiley (58) |
| Year of Election or Appointment: 2008 Mr. Wiley also serves as a member of the Board of Trustees of the University of Tulsa (2000-2006; 2007-present). He serves as a Director of Tesoro Corporation (independent oil refiner and marketer, 2005-present), and a Director of Bill Barrett Corporation (exploration and production company, 2005-present). In addition, he also serves as a Director of Post Oak Bank (privately-held bank, 2004-present). Previously, Mr. Wiley served as a Sr. Energy Advisor of Katzenbach Partners, LLC (consulting firm, 2006-2007), as an Advisory Director of Riverstone Holdings (private investment firm), Chairman, President, and CEO of Baker Hughes, Inc. (oilfield services company, 2000-2004), and as Director of Spinnaker Exploration Company (exploration and production company, 2001-2005). |
Annual Report
Advisory Board Member and Executive Officers**:
Correspondence intended for each executive officer and Mr. Lynch may be sent to Fidelity Investments, 82 Devonshire Street, Boston, Massachusetts 02109.
Name, Age; Principal Occupation |
Peter S. Lynch (64) |
| Year of Election or Appointment: 2003 Member of the Advisory Board of Fidelity's Equity and High Income Funds. Mr. Lynch is Vice Chairman and a Director of FMR, and Vice Chairman (2001-present) and a Director of FMR Co., Inc. Previously, Mr. Lynch served as a Trustee of the Fidelity funds (1990-2003). In addition, he serves as a Trustee of Boston College and as the Chairman of the Inner-City Scholarship Fund. Previously, Mr. Lynch served on the Special Olympics International Board of Directors (1997-2006). |
Kenneth B. Robins (39) |
| Year of Election or Appointment: 2008 President and Treasurer of Fidelity's Equity and High Income Funds. Mr. Robins is an employee of Fidelity Investments (2004-present). Before joining Fidelity Investments, Mr. Robins worked at KPMG LLP, where he was a partner in KPMG's department of professional practice (2002-2004). |
Walter C. Donovan (46) |
| Year of Election or Appointment: 2007 Vice President of Fidelity's Equity Funds. Mr. Donovan also serves as President of FMR and FMR Co., Inc., and Executive Vice President of Fidelity Investments Money Management, Inc. (2007-present). Previously, Mr. Donovan served as Executive Vice President of FMR and FMR Co., Inc. (2005-2007) and Senior Vice President of FMR (2003-2005) and FMR Co., Inc. (2004-2005). |
Eric M. Wetlaufer (46) |
| Year of Election or Appointment: 2006 Vice President of Fidelity's International Equity Funds. Mr. Wetlaufer also serves as Group Chief Investment Officer of FMR. Mr. Wetlaufer is Chairman, Chief Executive Officer, and President of Fidelity Management & Research (Hong Kong) Limited (2008-present); Chairman, Chief Executive Officer, President, and a Director of Fidelity Management & Research (Japan) Inc. (2008-present); Chairman and Chief Executive Officer (2007-present) and President and a Director (2006-present) of Fidelity Management & Research (U.K.) Inc. and President and a Director of Fidelity Research & Analysis Company (2006-present). Before joining Fidelity Investments in 2005, Mr. Wetlaufer was a partner in Oxhead Capital Management (2004-2005) and a Chief Investment Officer of Putnam Investments (1997-2003). |
Scott C. Goebel (40) |
| Year of Election or Appointment: 2008 Secretary and Chief Legal Officer (CLO) of the Fidelity funds. Mr. Goebel also serves as General Counsel, Secretary, and Senior Vice President of FMR (2008-present); Deputy General Counsel of FMR LLC; Chief Legal Secretary of Fidelity Management & Research (Hong Kong) Limited (2008-present) and Assistant Secretary of Fidelity Management & Research (Japan) Inc. (2008-present). Previously, Mr. Goebel served as Assistant Secretary of the Funds (2007-2008) and as Vice President and Secretary of Fidelity Distributors Corporation (FDC) (2005-2007). |
John B. McGinty, Jr. (46) |
| Year of Election or Appointment: 2008 Assistant Secretary of Fidelity's Equity and High Income Funds. Mr. McGinty is an employee of Fidelity Investments (2004-present). Mr. McGinty also serves as Senior Vice President, Secretary, and Chief Legal Officer of FDC (2007-present). Before joining Fidelity Investments, Mr. McGinty practiced law at Ropes & Gray, LLP. |
Holly C. Laurent (54) |
| Year of Election or Appointment: 2008 Anti-Money Laundering (AML) Officer of the Fidelity funds. Ms. Laurent is an employee of Fidelity Investments. Previously, Ms. Laurent was Senior Vice President and Head of Legal for Fidelity Business Services India Pvt. Ltd. (2006-2008), Senior Vice President, Deputy General Counsel and Group Head for FMR LLC (2005-2006). |
Christine Reynolds (50) |
| Year of Election or Appointment: 2008 Chief Financial Officer of the Fidelity funds. Ms. Reynolds became President of Fidelity Pricing and Cash Management Services (FPCMS) in August 2008. She served as Chief Operating Officer of FPCMS from 2007 through July 2008. Previously, Ms. Reynolds served as President, Treasurer, and Anti-Money Laundering officer of the Fidelity funds (2004-2007). Before joining Fidelity Investments, Ms. Reynolds worked at PricewaterhouseCoopers LLP (PwC) (1980-2002), where she was an audit partner with PwC's investment management practice. |
Kenneth A. Rathgeber (61) |
| Year of Election or Appointment: 2004 Chief Compliance Officer of Fidelity's Equity and High Income Funds. Mr. Rathgeber is Chief Compliance Officer of Fidelity Management & Research (Hong Kong) Limited (2008-present), Fidelity Management & Research (Japan) Inc. (2008-present), FMR (2005-present), FMR Co., Inc. (2005-present), Fidelity Management & Research (U.K.) Inc. (2005-present), Fidelity Research & Analysis Company (2005-present), Fidelity Investments Money Management, Inc. (2005-present), and Strategic Advisers, Inc. (2005-present). |
Bryan A. Mehrmann (47) |
| Year of Election or Appointment: 2005 Deputy Treasurer of the Fidelity funds. Mr. Mehrmann is an employee of Fidelity Investments. Previously, Mr. Mehrmann served as Vice President of Fidelity Investments Institutional Services Group (FIIS)/Fidelity Investments Institutional Operations Corporation, Inc. (FIIOC) Client Services (1998-2004). |
Adrien E. Deberghes (41) |
| Year of Election or Appointment: 2008 Deputy Treasurer of Fidelity's Equity and High Income Funds. Mr. Deberghes is an employee of Fidelity Investments (2008-present). Previously, Mr. Deberghes served as Senior Vice President of Mutual Fund Administration at State Street Corporation (2007-2008), Senior Director of Mutual Fund Administration at Investors Bank & Trust (2005-2007), and Director of Finance for Dunkin' Brands (2000-2005). |
Robert G. Byrnes (41) |
| Year of Election or Appointment: 2005 Assistant Treasurer of the Fidelity funds. Mr. Byrnes is an employee of Fidelity Investments (2005-present). Previously, Mr. Byrnes served as Vice President of Fidelity Pricing and Cash Management Services (FPCMS) (2003-2005). Before joining Fidelity Investments, Mr. Byrnes worked at Deutsche Asset Management where he served as Vice President of the Investment Operations Group (2000-2003). |
Peter L. Lydecker (54) |
| Year of Election or Appointment: 2004 Assistant Treasurer of the Fidelity funds. Mr. Lydecker is an employee of Fidelity Investments. |
Paul M. Murphy (61) |
| Year of Election or Appointment: 2007 Assistant Treasurer of the Fidelity funds. Mr. Murphy is an employee of Fidelity Investments (2007-present). Previously, Mr. Murphy served as Chief Financial Officer of the Fidelity Funds (2005-2006), Vice President and Associate General Counsel of FMR (2007), and Senior Vice President of Fidelity Pricing and Cash Management Services (FPCMS) (1994-2007). |
Gary W. Ryan (50) |
| Year of Election or Appointment: 2005 Assistant Treasurer of the Fidelity funds. Mr. Ryan is an employee of Fidelity Investments. Previously, Mr. Ryan served as Vice President of Fund Reporting in Fidelity Pricing and Cash Management Services (FPCMS) (1999-2005). |
** FMR Corp. merged with and into FMR LLC on October 1, 2007. Any references to FMR LLC for prior periods are deemed to be references to the prior entity.
Annual Report
The Board of Trustees of each fund voted to pay to shareholders of record at the opening of business on record date, the following distributions per share derived from capital gains realized from sales of portfolio securities, and dividends derived from net investment income:
| Pay Date | Record Date | Dividends | Capital Gains |
Fidelity Canada Fund | 12/08/08 | 12/05/08 | $ 0.128 | $ 0.00 |
Fidelity China Region Fund | 12/08/08 | 12/05/08 | $ 0.171 | $ 0.00 |
Fidelity Emerging Markets Fund | 12/08/08 | 12/05/08 | $ 0.240 | $ 0.00 |
Fidelity Europe Fund | 12/08/08 | 12/05/08 | $ 0.730 | $ 0.00 |
Fidelity Europe Capital Appreciation Fund | 12/08/08 | 12/05/08 | $ 0.560 | $ 0.00 |
Fidelity Japan Fund | 12/08/08 | 12/05/08 | $ 0.110 | $ 0.01 |
Fidelity Japan Smaller Companies Fund | 12/08/08 | 12/05/08 | $ 0.040 | $ 0.01 |
Fidelity Latin America Fund | 12/08/08 | 12/05/08 | $ 0.350 | $ 0.00 |
Fidelity Nordic Fund | 12/08/08 | 12/05/08 | $ 1.060 | $ 0.00 |
Fidelity Pacific Basin Fund | 12/08/08 | 12/05/08 | $ 0.070 | $ 0.00 |
Fidelity Southeast Asia Fund | 12/08/08 | 12/05/08 | $ 0.180 | $ 0.00 |
The funds hereby designate as capital gain dividend the amounts noted below for the taxable year ended October 31,2008, or, if subsequently determined to be different, the net capital gain of such year.
Fidelity Southeast Asia Fund | $14,415,321 |
A percentage of the dividends distributed during the fiscal year for the following funds may be taken into account as a dividend for purposes of the maximum rate under section 1(h)(11) of the Internal Revenue Code.
Fidelity Canada Fund | 18% |
Fidelity China Region Fund | 8% |
Fidelity Emerging Markets Fund | 100% |
Fidelity Europe Fund | 59% |
Fidelity Europe Capital Appreciation Fund | 33% |
Fidelity Japan Fund | 100% |
Fidelity Japan Smaller Companies Fund | 100% |
Fidelity Latin America Fund | 98% |
Fidelity Nordic Fund | 83% |
Fidelity Pacific Basin Fund | 99% |
Fidelity Southeast Asia Fund | 11% |
The amounts per share which represent income derived from sources within, and taxes paid to, foreign countries or possessions of the United States are as follows:
| Pay Date | Income | Taxes |
Fidelity Canada Fund | 12/10/07 | $0.750 | $0.1060 |
Fidelity China Region Fund | 12/10/07 | $0.461 | $0.0444 |
Fidelity Emerging Markets Fund | 12/10/07 | $0.276 | $0.0455 |
Fidelity Europe Fund | 12/10/07 | $0.599 | $0.1166 |
Fidelity Europe Capital Appreciation Fund | 12/10/07 | $0.650 | $0.0837 |
Fidelity Japan Fund | 12/10/07 | $0.056 | $0.0163 |
Fidelity Japan Smaller Companies Fund | 12/10/07 | $0.030 | $0.0104 |
Fidelity Latin America Fund | 12/10/07 | $0.588 | $0.1195 |
Fidelity Nordic Fund | 12/10/07 | $1.089 | $0.1409 |
Fidelity Pacific Basin Fund | 12/10/07 | $0.255 | $0.0354 |
Fidelity Southeast Asia Fund | 12/10/07 | $0.359 | $0.0444 |
The fund will notify shareholders in January 2009 of amounts for use in preparing 2008 income tax returns.
Annual Report
A special meeting of each fund's shareholders was held on December 13, 2007. The results of votes taken among shareholders on the proposals before them are reported below. Each vote reported represents one dollar of net asset value held on the record date for the meeting.
PROPOSAL 1 |
To amend the Declaration of Trust to reduce the required quorum for shareholder meetings.A |
| # of
Votes | % of
Votes |
Affirmative | 45,014,793,255.82 | 80.372 |
Against | 6,871,112,667.08 | 12.268 |
Abstain | 2,163,456,438.02 | 3.863 |
Broker Non-Votes | 1,958,633,563.89 | 3.497 |
TOTAL | 56,007,995,924.81 | 100.000 |
PROPOSAL 2 |
To elect the nominees specified below as Trustees.A |
| # of
Votes | % of
Votes |
James C. Curvey |
Affirmative | 53,384,952,361.03 | 95.317 |
Withheld | 2,623,043,563.78 | 4.683 |
TOTAL | 56,007,995,924.81 | 100.000 |
Dennis J. Dirks |
Affirmative | 53,595,104,608.67 | 95.692 |
Withheld | 2,412,891,316.14 | 4.308 |
TOTAL | 56,007,995,924.81 | 100.000 |
Albert R. Gamper, Jr. |
Affirmative | 53,570,235,221.69 | 95.647 |
Withheld | 2,437,760,703.12 | 4.353 |
TOTAL | 56,007,995,924.81 | 100.000 |
George H. Heilmeier |
Affirmative | 53,166,350,588.50 | 94.926 |
Withheld | 2,841,645,336.31 | 5.074 |
TOTAL | 56,007,995,924.81 | 100.000 |
Edward C. Johnson 3d |
Affirmative | 53,230,508,654.93 | 95.041 |
Withheld | 2,777,487,269.88 | 4.959 |
TOTAL | 56,007,995,924.81 | 100.000 |
James H. Keyes |
Affirmative | 53,549,161,456.52 | 95.610 |
Withheld | 2,458,834,468.29 | 4.390 |
TOTAL | 56,007,995,924.81 | 100.000 |
Marie L. Knowles |
Affirmative | 53,543,925,066.86 | 95.601 |
Withheld | 2,464,070,857.95 | 4.399 |
TOTAL | 56,007,995,924.81 | 100.000 |
Ned C. Lautenbach |
Affirmative | 53,547,116,322.50 | 95.606 |
Withheld | 2,460,879,602.31 | 4.394 |
TOTAL | 56,007,995,924.81 | 100.000 |
| # of
Votes | % of
Votes |
Cornelia M. Small |
Affirmative | 53,564,793,514.25 | 95.638 |
Withheld | 2,443,202,410.56 | 4.362 |
TOTAL | 56,007,995,924.81 | 100.000 |
William S. Stavropoulos |
Affirmative | 53,426,544,502.76 | 95.391 |
Withheld | 2,581,451,422.05 | 4.609 |
TOTAL | 56,007,995,924.81 | 100.000 |
Kenneth L. Wolfe |
Affirmative | 53,229,881,790.63 | 95.040 |
Withheld | 2,778,114,134.18 | 4.960 |
TOTAL | 56,007,995,924.81 | 100.000 |
A Denotes trust-wide proposal and voting results.
Annual Report
Proxy Voting Results
A special meeting of each fund's shareholders was held on April 16, 2008. The results of votes taken among shareholders on the proposals before them are reported below. Each vote reported represents one dollar of net asset value held on the record date for the meeting.
PROPOSAL 1 |
To elect a Board of Trustees.A |
| # of
Votes | % of
Votes |
James C. Curvey |
Affirmative | 44,485,656,811.55 | 94.702 |
Withheld | 2,488,551,854.62 | 5.298 |
TOTAL | 46,974,208,666.17 | 100.000 |
Dennis J. Dirks |
Affirmative | 44,706,671,638.31 | 95.173 |
Withheld | 2,267,537,027.86 | 4.827 |
TOTAL | 46,974,208,666.17 | 100.000 |
Edward C. Johnson 3d |
Affirmative | 44,294,881,638.16 | 94.296 |
Withheld | 2,679,327,028.01 | 5.704 |
TOTAL | 46,974,208,666.17 | 100.000 |
Alan J. Lacy |
Affirmative | 44,685,373,413.16 | 95.127 |
Withheld | 2,288,835,253.01 | 4.873 |
TOTAL | 46,974,208,666.17 | 100.000 |
Ned C. Lautenbach |
Affirmative | 44,634,541,379.41 | 95.019 |
Withheld | 2,339,667,286.76 | 4.981 |
TOTAL | 46,974,208,666.17 | 100.000 |
Joseph Mauriello |
Affirmative | 44,683,962,099.80 | 95.124 |
Withheld | 2,290,246,566.37 | 4.876 |
TOTAL | 46,974,208,666.17 | 100.000 |
Cornelia M. Small |
Affirmative | 44,671,688,375.36 | 95.098 |
Withheld | 2,302,520,290.81 | 4.902 |
TOTAL | 46,974,208,666.17 | 100.000 |
William S. Stavropoulos |
Affirmative | 44,465,262,087.61 | 94.659 |
Withheld | 2,508,946,578.56 | 5.341 |
TOTAL | 46,974,208,666.17 | 100.000 |
David M. Thomas |
Affirmative | 44,694,340,813.87 | 95.147 |
Withheld | 2,279,867,852.30 | 4.853 |
TOTAL | 46,974,208,666.17 | 100.000 |
Michael E. Wiley |
Affirmative | 44,686,513,174.78 | 95.130 |
Withheld | 2,287,695,491.39 | 4.870 |
TOTAL | 46,974,208,666.17 | 100.000 |
PROPOSAL 5 |
Shareholder proposal for Fidelity Canada Fund concerning "oversight procedures to screen out investments in companies that, in the judgement of the Board, substantially contribute to genocide, patterns of extraordinary and egregious violations of human rights, or crimes against humanity." |
| # of
Votes | % of
Votes |
Affirmative | 545,276,762.04 | 23.721 |
Against | 1,445,066,492.42 | 62.863 |
Abstain | 112,739,966.65 | 4.905 |
Broker Non-Votes | 195,653,438.02 | 8.511 |
TOTAL | 2,298,736,659.13 | 100.000 |
A Denotes trust-wide proposal and voting results.
Annual Report
Board Approval of Investment Advisory Contracts and Management Fees
Targeted International Equity Funds
Each year, typically in July, the Board of Trustees, including the Independent Trustees (together, the Board), votes on the renewal of the management contract and sub-advisory agreements (together, the Advisory Contracts) for each fund. The Board, assisted by the advice of fund counsel and Independent Trustees' counsel, requests and considers a broad range of information throughout the year.
The Board meets regularly and, acting directly and through its separate committees, requests and receives information concerning, and considers at each of its meetings factors that are relevant to, its annual consideration of the renewal of each fund's Advisory Contracts, including the services and support provided to each fund and its shareholders. At the time of the renewal, the Board had 12 standing committees, each composed of Independent Trustees with varying backgrounds, to which the Board has assigned specific subject matter responsibilities in order to enhance effective decision-making by the Board. Each committee has a written charter outlining the structure and purposes of the committee. The Board also meets as needed to consider matters specifically related to the Board's annual consideration of the renewal of Advisory Contracts.
At its July 2008 meeting, the Board of Trustees, including the Independent Trustees, unanimously determined to renew each fund's Advisory Contracts. In reaching its determination, the Board considered all factors it believed relevant, including (i) the nature, extent, and quality of the services to be provided to each fund and its shareholders (including the investment performance of each fund); (ii) the competitiveness of each fund's management fee and total expenses of; (iii) the total costs of the services to be provided by and the profits to be realized by Fidelity from its relationship with each fund; (iv) the extent to which economies of scale would be realized as each fund grows; and (v) whether fee levels reflect these economies of scale, if any, for the benefit of fund shareholders. The Board also approved agreements with foreign sub-advisers Fidelity Management & Research (Japan) Inc. and Fidelity Management & Research (Hong Kong) Limited, as well as amendments to each fund's agreement with Fidelity Management & Research (U.K.) Inc.
In considering whether to renew the Advisory Contracts for each fund, the Board ultimately reached a determination, with the assistance of fund counsel and Independent Trustees' counsel and through the exercise of its business judgment, that the renewal of the Advisory Contracts and the compensation to be received by Fidelity under the management contracts is consistent with Fidelity's fiduciary duty under applicable law. The Board's decision to renew the Advisory Contracts was not based on any single factor noted above, but rather was based on a comprehensive consideration of all the information provided to the Board at its meetings throughout the year. The Board, in reaching its determination to renew the Advisory Contracts, is aware that shareholders in each fund have a broad range of investment choices available to them, including a wide choice among mutual funds offered by competitors to Fidelity, and that each fund's shareholders, with the opportunity to review and weigh the disclosure provided by the fund in its prospectus and other public disclosures, have chosen to invest in that fund, managed by Fidelity.
Nature, Extent, and Quality of Services Provided. The Board considered staffing within the investment adviser, FMR, and the sub-advisers (together, the Investment Advisers), including the backgrounds of the funds' investment personnel and the funds' investment objectives and disciplines. The Independent Trustees also had discussions with senior management of Fidelity's investment operations and investment groups. The Board considered the structure of the portfolio manager compensation program and whether this structure provides appropriate incentives.
Resources Dedicated to Investment Management and Support Services. The Board reviewed the size, education, and experience of the Investment Advisers' investment staff, their use of technology, and the Investment Advisers' approach to recruiting, training, and retaining portfolio managers and other research, advisory, and management personnel. The Board noted that Fidelity's analysts have access to a variety of technological tools that enable them to perform both fundamental and quantitative analysis and to specialize in various disciplines. The Board considered Fidelity's extensive global research capabilities that enable the Investment Advisers to aggregate data from various sources in an effort to produce positive investment results. The Board also considered that Fidelity's portfolio managers and analysts have access to daily portfolio attribution that allows for monitoring of a fund's portfolio, as well as an electronic communication system that provides immediate real-time access to research concerning issuers and credit enhancers.
Shareholder and Administrative Services. The Board considered (i) the nature, extent, quality, and cost of advisory, administrative, distribution, and shareholder services performed by the Investment Advisers and their affiliates under the Advisory Contracts and under separate agreements covering transfer agency, pricing and bookkeeping, and securities lending services for each fund; (ii) the nature and extent of the Investment Advisers' supervision of third party service providers, principally custodians and subcustodians; and (iii) the resources devoted to, and the record of compliance with, each fund's compliance policies and procedures. The Board also reviewed the allocation of fund brokerage, including allocations to brokers affiliated with the Investment Advisers, the use of brokerage commissions to pay fund expenses, and the use of "soft" commission dollars to pay for research services. The Board further considered that Fidelity voluntarily pays for market data out of its own resources.
The Board noted that the growth of fund assets across the complex allows Fidelity to reinvest in the development of services designed to enhance the value or convenience of the Fidelity funds as investment vehicles. These services include 24-hour access to account information and market information through phone representatives and over the Internet, and investor education materials and asset allocation tools.
Investment in a Large Fund Family. The Board considered the benefits to shareholders of investing in a Fidelity fund, including the benefits of investing in a fund that is part of a large family of funds offering a variety of investment disciplines and providing for a large variety of mutual fund investor services. For example, fund shareholders are offered the privilege of exchanging shares of a fund for shares of other Fidelity funds, as set forth in the fund's prospectus, without paying a sales charge. The Board noted that Fidelity has taken a number of actions over the previous year that benefited particular funds, including (i) dedicating additional resources to investment research and to restructure the investment research teams; (ii) contractually agreeing to reduce the management fees on Fidelity's Institutional Money Market Funds and launching Class IV and Institutional Class of certain of these funds; (iii) reducing the transfer agent fees for the Fidelity Select Portfolios and Investor Class of the VIP funds; and (iv) launching Class K of 29 equity funds as a lower-fee class available to certain employer-sponsored retirement plans.
Annual Report
Board Approval of Investment Advisory Contracts and Management Fees - continued
Investment Performance (except Emerging Markets Fund, Europe Capital Appreciation Fund, Europe Fund and Japan Fund). The Board considered whether each fund has operated within its investment objective, as well as its record of compliance with its investment restrictions. It also reviewed each fund's absolute investment performance (for retail class, in the case of Canada Fund), as well as each fund's relative investment performance (for retail class, in the case of Canada Fund) measured against a broad-based securities market index over multiple periods. The Board noted that FMR does not believe that a meaningful peer group exists against which to compare any of the funds' performance. For each fund, the following charts considered by the Board show, over the one-, three-, and five-year periods ended December 31, 2007, the fund's cumulative total returns and the cumulative total returns of a broad-based securities market index ("benchmark"). (The Advisor classes of Canada Fund had less than one year of performance as of December 31, 2007. China Region Fund did not offer Advisor classes as of December 31, 2007.)
Fidelity Canada Fund
The Board stated that the investment performance of Fidelity Canada (retail class) of the fund compared favorably to its benchmark for all the periods shown.
Annual Report
Fidelity China Region Fund

The Board stated that the investment performance of the fund compared favorably to its benchmark for all the periods shown.
Fidelity Japan Smaller Companies Fund
The Board stated that the investment performance of the fund was lower than its benchmark for all the periods shown. The Board discussed with FMR actions that will be taken by FMR to attempt to improve the fund's below-benchmark performance. The Board will continue to closely monitor the performance of the fund in the coming year.
Annual Report
Board Approval of Investment Advisory Contracts and Management Fees - continued
Fidelity Latin America Fund
The Board stated that the investment performance of the fund was lower than its benchmark for all the periods shown. The Board discussed with FMR actions that will be taken to attempt to improve the fund's below-benchmark performance. The Board will continue to closely monitor the performance of the fund in the coming year.
Fidelity Nordic Fund
The Board stated that the investment performance of the fund compared favorably to its benchmark for all the periods shown.
Annual Report
Fidelity Pacific Basin Fund
The Board stated that the investment performance of the fund compared favorably to its benchmark for all the periods shown.
Fidelity Southeast Asia Fund
The Board stated that the investment performance of the fund compared favorably to its benchmark for all the periods shown.
The Board also considered that each of Canada Fund's, Pacific Basin Fund's, and Southeast Asia Fund's management fee is subject to upward or downward adjustment depending upon whether, and to what extent, the fund's investment performance for the performance period exceeds, or is exceeded by, the record (over the same period) of a Board-approved performance adjustment index. The Board realizes that the performance adjustment provides FMR with a strong economic incentive to seek to achieve superior performance for each fund's shareholders and helps to more closely align the interests of FMR and each fund's shareholders.
The Board considered that FMR has taken steps to refocus and strengthen equity research, equity portfolio management, and compliance.
Based on its review, and giving particular weight to the nature and quality of the resources dedicated by the Investment Advisers to maintain and improve relative performance, the Board concluded that the nature, extent, and quality of the services provided to each fund will benefit each fund's shareholders, particularly in light of the Board's view that each fund's shareholders benefit from investing in a fund that is part of a large family of funds offering a variety of investment disciplines and services.
Annual Report
Board Approval of Investment Advisory Contracts and Management Fees - continued
Investment Performance (Emerging Markets Fund and Europe Capital Appreciation Fund). The Board considered whether each fund has operated within its investment objective, as well as its record of compliance with its investment restrictions. It also reviewed each fund's absolute investment performance, as well as each fund's relative investment performance measured against (i) a broad-based securities market index, and (ii) a peer group of mutual funds deemed appropriate by the Board over multiple periods. For each fund, the following charts considered by the Board show, over the one-, three-, and five-year periods ended December 31, 2007, the fund's cumulative total returns, the cumulative total returns of a broad-based securities market index ("benchmark"), and a range of cumulative total returns of a peer group of mutual funds identified by Morningstar, Inc. as having an investment style similar to that of the fund based on underlying portfolio holdings. (Emerging Markets Fund did not offer Class K as of December 31, 2007.) The box within each chart shows the 25th percentile return (bottom of box) and the 75th percentile return (top of box) of the peer group. Returns shown above the box are in the first quartile and returns shown below the box are in the fourth quartile. The percentage beaten number noted below each chart corresponds to the percentile box and represents the percentage of funds in the peer group whose performance was equal to or lower than that of the fund.
Fidelity Emerging Markets Fund
The Board reviewed the fund's relative investment performance against its peer group and stated that the performance of the fund was in the first quartile for all the periods shown. The Board also stated that the investment performance of the fund compared favorably to its benchmark for all the periods shown.
Fidelity Europe Capital Appreciation Fund
Annual Report
The Board reviewed the fund's relative investment performance against its peer group and stated that the performance of the fund was in the first quartile for the one- and three-year periods and the second quartile for the five-year period. The Board also stated that the investment performance of the fund compared favorably to its benchmark for all the periods shown.
The Board also considered that Europe Capital Appreciation Fund's management fee is subject to upward or downward adjustment depending upon whether, and to what extent, the fund's investment performance for the performance period exceeds, or is exceeded by, the record (over the same period) of a Board-approved performance adjustment index. The Board realizes that the performance adjustment provides FMR with a strong economic incentive to seek to achieve superior performance for the fund's shareholders and helps to more closely align the interests of FMR and the fund's shareholders.
The Board considered that FMR has taken steps to refocus and strengthen equity research, equity portfolio management, and compliance.
Based on its review, and giving particular weight to the nature and quality of the resources dedicated by the Investment Advisers to maintain and improve relative performance, the Board concluded that the nature, extent, and quality of the services provided to each fund will benefit each fund's shareholders, particularly in light of the Board's view that each fund's shareholders benefit from investing in a fund that is part of a large family of funds offering a variety of investment disciplines and services.
Investment Performance (Europe Fund and Japan Fund). The Board considered whether each fund has operated within its investment objective, as well as its record of compliance with its investment restrictions. It also reviewed each fund's absolute investment performance, as well as each fund's relative investment performance measured against (i) a broad-based securities market index, and (ii) a peer group of mutual funds deemed appropriate by the Board over multiple periods. For each fund, the following charts considered by the Board show, over the one-, three-, and five-year periods ended December 31, 2007, the fund's cumulative total returns, the cumulative total returns of a broad-based securities market index ("benchmark"), and a range of cumulative total returns of a peer group of mutual funds identified by Lipper Inc. as having an investment objective similar to that of the fund. The box within each chart shows the 25th percentile return (bottom of box) and the 75th percentile return (top of box) of the peer group. Returns shown above the box are in the first quartile and returns shown below the box are in the fourth quartile. The percentage beaten number noted below each chart corresponds to the percentile box and represents the percentage of funds in the peer group whose performance was equal to or lower than that of the fund.
Fidelity Europe Fund
The Board reviewed the fund's relative investment performance against its peer group and stated that the performance of the fund was in the first quartile for the one-year period and the second quartile for the three- and five-year periods. The Board also stated that the investment performance of the fund compared favorably to its benchmark for all the periods shown.
Annual Report
Board Approval of Investment Advisory Contracts and Management Fees - continued
Fidelity Japan Fund
The Board reviewed the fund's relative investment performance against its peer group and stated that the performance of the fund was in the first quartile for all the periods shown. The Board also stated that the investment performance of the fund compared favorably to its benchmark for all the periods shown.
The Board also considered that each fund's management fee is subject to upward or downward adjustment depending upon whether, and to what extent, the fund's investment performance for the performance period exceeds, or is exceeded by, the record (over the same period) of a Board-approved performance adjustment index. The Board realizes that the performance adjustment provides FMR with a strong economic incentive to seek to achieve superior performance for each fund's shareholders and helps to more closely align the interests of FMR and each fund's shareholders.
The Board considered that FMR has taken steps to refocus and strengthen equity research, equity portfolio management, and compliance.
Based on its review, and giving particular weight to the nature and quality of the resources dedicated by the Investment Advisers to maintain and improve relative performance, the Board concluded that the nature, extent, and quality of the services provided to each fund will benefit each fund's shareholders, particularly in light of the Board's view that each fund's shareholders benefit from investing in a fund that is part of a large family of funds offering a variety of investment disciplines and services.
Competitiveness of Management Fee and Total Fund Expenses. The Board considered each fund's management fee and total expenses compared to "mapped groups" of competitive funds and classes. Fidelity creates "mapped groups" by combining similar Lipper investment objective categories that have comparable management fee characteristics. Combining Lipper investment objective categories aids the Board's management fee and total expense comparisons by broadening the competitive group used for comparison and by reducing the number of universes to which various Fidelity funds are compared. The Board also considered supplemental information about how each fund's management fee and total expenses ranked relative to groups based on Lipper classifications, which take into account a fund's market capitalization and style.
The Board considered two proprietary management fee comparisons for the 12-month periods shown in the charts below. The group of Lipper funds used by the Board for management fee comparisons is referred to below as the "Total Mapped Group" (and, for each of Europe Fund and Japan Fund, for the reasons explained above, is broader than the Lipper peer group used by the Board for performance comparisons). The Total Mapped Group comparison focuses on a fund's standing relative to the total universe of comparable funds available to investors, in terms of gross management fees before expense reimbursements or caps, and without giving effect to a fund's performance adjustment (if applicable). "TMG %" represents the percentage of funds in the Total Mapped Group that had management fees that were lower than a fund's. For example, a TMG % of 14% would mean that 86% of the funds in the Total Mapped Group had higher management fees than a fund. The "Asset-Size Peer Group" (ASPG) comparison focuses on a fund's standing relative to non-Fidelity funds similar in size to the fund within the Total Mapped Group. The ASPG represents at least 15% of the funds in the Total Mapped Group with comparable asset size and management fee characteristics, subject to a minimum of 50 funds (or all funds in the Total Mapped Group if fewer than 50). Additional information, such as the ASPG quartile in which a fund's management fee ranked and the impact of a fund's performance adjustment (if applicable), is also included in the charts and considered by the Board.
Annual Report
Fidelity Canada Fund
The Board noted that the fund's management fee ranked below the median of its Total Mapped Group and below the median of its ASPG for 2007. The Board also noted the effect of the fund's negative performance adjustment on the fund's management fee ranking. The Board noted that the performance adjustment for each year represents calculations for performance periods that differ from the periods shown in the performance charts above.
Based on its review, the Board concluded that the fund's management fee was fair and reasonable in light of the services that the fund receives and the other factors considered.
In its review of the fund's total expenses, the Board considered the fund's management fee as well as other fund expenses, such as transfer agent fees, pricing and bookkeeping fees, fund-paid 12b-1 fees, and custodial, legal, and audit fees. The Board also noted the effects of any waivers and reimbursements on fees and expenses, as well as the impact of the fund's performance adjustment. As part of its review, the Board also considered current and historical total expenses of the fund compared to competitive fund median expenses. The fund is compared to those funds and classes in the Total Mapped Group (used by the Board for management fee comparisons) that have a similar sales load structure.
The Board noted that the total expenses of each of Class A, Class B, Class C, Institutional Class, and Canada (retail class) ranked below its competitive median for the period, and the total expenses of Class T ranked above its competitive median for the period. The Board considered that the total expenses for Class T were above the median primarily because 12b-1 fee is higher than the typical front-end load class. The Board noted that the fund offers multiple classes, each of which has a different sales load and 12b-1 fee structure, and that the multiple structures are intended to offer a range of pricing options for the intermediary market. The Board also noted that the total expenses of the classes vary primarily by the level of their 12b-1 fees, although differences in transfer agent fees may also cause expenses to vary from class to class.
In its review of total expenses for the fund, the Board also considered Fidelity fee structures and other information on clients that FMR and its affiliates service in other competitive markets, such as other mutual funds advised or subadvised by FMR or its affiliates, pension plan clients, and other institutional clients.
Based on its review, the Board concluded that the total expenses of each class of the fund were reasonable, although in one case above the median of the universe presented for comparison, in light of the services that the fund and its shareholders receive and the other factors considered.
Annual Report
Board Approval of Investment Advisory Contracts and Management Fees - continued
Fidelity China Region Fund

The Board noted that the fund's management fee ranked below the median of its Total Mapped Group and below the median of its ASPG for 2007.
Fidelity Japan Smaller Companies Fund
The Board noted that the fund's management fee ranked below the median of its Total Mapped Group and below the median of its ASPG for 2007.
Annual Report
Fidelity Latin America Fund
The Board noted that the fund's management fee ranked below the median of its Total Mapped Group and below the median of its ASPG for 2007.
Fidelity Nordic Fund
The Board noted that the fund's management fee ranked below the median of its Total Mapped Group and below the median of its ASPG for 2007.
Annual Report
Board Approval of Investment Advisory Contracts and Management Fees - continued
Fidelity Pacific Basin Fund
The Board noted that the fund's management fee ranked below the median of its Total Mapped Group and below the median of its ASPG for 2007. The Board also noted the effect of the fund's positive performance adjustment on the fund's management fee ranking. The Board noted that the performance adjustment for each year represents calculations for performance periods that differ from the periods shown in the performance charts above.
Furthermore, the Board considered that shareholders of Pacific Basin Fund approved a prospective change in the index used to calculate the fund's performance adjustment, beginning April 1, 2001. The Board also considered that, because the performance adjustment is based on a rolling 36-month measurement period, during a transition period the fund's performance is compared to a blended index return that reflects the performance of the former index for the portion of the measurement period prior to April 1, 2001 and the performance of the current index for the remainder of the measurement period. The Board noted that the fund's performance adjustments for 2003 and 2004 shown in the chart above reflect the effect of using the blended index return to calculate the fund's performance adjustment.
Fidelity Southeast Asia Fund
The Board noted that the fund's management fee ranked below the median of its Total Mapped Group and below the median of its ASPG for 2007. The Board also noted the effect of the fund's positive performance adjustment on the fund's management fee ranking. The Board noted that the performance adjustment for each year represents calculations for performance periods that differ from the periods shown in the performance charts above.
Annual Report
Fidelity Emerging Markets Fund

The Board noted that the fund's management fee ranked below the median of its Total Mapped Group and below the median of its ASPG for 2007.
Fidelity Europe Capital Appreciation Fund
The Board noted that the fund's management fee ranked below the median of its Total Mapped Group and below the median of its ASPG for 2007. The Board also noted the effect of the fund's positive performance adjustment on the fund's management fee ranking. The Board noted that the performance adjustment for each year represents calculations for performance periods that differ from the periods shown in the performance charts above.
Annual Report
Board Approval of Investment Advisory Contracts and Management Fees - continued
Fidelity Europe Fund
The Board noted that the fund's management fee ranked below the median of its Total Mapped Group and below the median of its ASPG for 2007. The Board also noted the effect of the fund's positive performance adjustment on the fund's management fee ranking. The Board noted that the performance adjustment for each year represents calculations for performance periods that differ from the periods shown in the performance charts above.
Fidelity Japan Fund
The Board noted that the fund's management fee ranked below the median of its Total Mapped Group and below the median of its ASPG for 2007. The Board also noted the effect of the fund's positive performance adjustment on the fund's management fee ranking. The Board noted that the performance adjustment for each year represents calculations for performance periods that differ from the periods shown in the performance charts above.
Based on its review, the Board concluded that each fund's management fee was fair and reasonable in light of the services that the fund receives and the other factors considered.
In its review of each fund's total expenses (except Canada Fund), the Board considered the fund's management fee as well as other fund expenses, such as transfer agent fees, pricing and bookkeeping fees, and custodial, legal, and audit fees. The Board also noted the effects of any waivers and reimbursements on fees and expenses, as well as the impact of Europe Fund's, Europe Capital Appreciation Fund's, Japan Fund's, Pacific Basin Fund's and Southeast Asia Fund's performance adjustment. As part of its review, the Board also considered current and historical total expenses of each fund compared to competitive fund median expenses. Each fund is compared to those funds and classes in the Total Mapped Group (used by the Board for management fee comparisons) that have a similar sales load structure.
Annual Report
The Board noted that each fund's total expenses ranked below its competitive median for 2007.
In its review of total expenses, the Board also considered Fidelity fee structures and other information on clients that FMR and its affiliates service in other competitive markets, such as other mutual funds advised or subadvised by FMR or its affiliates, pension plan clients, and other institutional clients.
Based on its review, the Board concluded that each fund's total expenses were reasonable in light of the services that the fund and its shareholders receive and the other factors considered.
Costs of the Services and Profitability. The Board considered the revenues earned and the expenses incurred by Fidelity in conducting the business of developing, marketing, distributing, managing, administering and servicing each fund and its shareholders. The Board also considered the level of Fidelity's profits in respect of all the Fidelity funds.
On an annual basis, FMR presents to the Board Fidelity's profitability for each fund. Fidelity calculates the profitability for each fund, as well as aggregate profitability for groups of Fidelity funds and all Fidelity funds, using a series of detailed revenue and cost allocation methodologies which originate with the audited books and records of Fidelity. The Audit Committee of the Board reviews any significant changes from the prior year's methodologies. PricewaterhouseCoopers LLP (PwC), independent registered public accounting firm and auditor to Fidelity and certain Fidelity funds, has been engaged annually by the Board as part of the Board's assessment of the results of Fidelity's profitability analysis. PwC's engagement includes the review and assessment of Fidelity's methodologies used in determining the revenues and expenses attributable to Fidelity's mutual fund business, and completion of agreed-upon procedures surrounding the mathematical accuracy of fund profitability and its conformity to allocation methodologies. After considering PwC's reports issued under the engagement and information provided by Fidelity, the Board believes that while other allocation methods may also be reasonable, Fidelity's profitability methodologies are reasonable in all material respects.
The Board has also reviewed Fidelity's non-fund businesses and any fall-out benefits related to the mutual fund business as well as cases where Fidelity's affiliates may benefit from or be related to the funds' business.
The Board considered the costs of the services provided by and the profits realized by Fidelity in connection with the operation of each fund and determined that the amount of profit is a fair entrepreneurial profit for the management of each fund.
Economies of Scale. The Board considered whether there have been economies of scale in respect of the management of the Fidelity funds, whether the Fidelity funds (including each fund) have appropriately benefited from any such economies of scale, and whether there is potential for realization of any further economies of scale. The Board considered the extent to which each fund will benefit from economies of scale through increased services to the fund, through waivers or reimbursements, or through fee or expense reductions.
The Board recognized that each fund's management contract incorporates a "group fee" structure, which provides for lower group fee rates as total fund assets under FMR's management increase, and for higher group fee rates as total fund assets under FMR's management decrease. FMR determines the group fee rates based on a tiered asset "breakpoint" schedule. The Board considered that the group fee is designed to deliver the benefits of economies of scale to fund shareholders when total fund assets increase, even if assets of any particular fund are unchanged or have declined, because some portion of Fidelity's costs are attributable to services provided to all Fidelity funds, and all funds benefit if those costs can be allocated among more assets. The Board also considered that although Japan Smaller Companies Fund is partially closed to new investors, it continues to incur investment management expenses, and marketing and distribution expenses related to the retention of existing shareholders and assets. The Board further noted that Japan Smaller Companies Fund may continue to realize benefits from the group fee structure, even though assets may not be expected to grow significantly at the fund level. The Board concluded that, given the group fee structure, fund shareholders will achieve a certain level of economies of scale as assets under FMR's management increase at the fund complex level, regardless of whether Fidelity achieves any such economies of scale.
The Board further concluded that any potential economies of scale are being shared between fund shareholders and Fidelity in an appropriate manner.
Additional Information Requested by the Board. In order to develop fully the factual basis for consideration of the Fidelity funds' Advisory Contracts, the Board requested and received additional information on certain topics, including (i) fund performance trends and actions to be taken by FMR to improve certain funds' overall performance; (ii) portfolio manager changes that have occurred during the past year; (iii) Fidelity's fund profitability methodology, the profitability of certain fund service providers, and profitability trends for certain funds; (iv) Fidelity's compensation structure for portfolio managers and key personnel, including its effects on fund profitability and the extent to which portfolio manager compensation is linked to fund performance; (v) Fidelity's fee structures and rationale for recommending different fees among categories of funds; and (vi) Fidelity's rationale for recommending which funds should have a performance adjustment component as part of their management fees.
Based on its evaluation of all of the conclusions noted above, and after considering all material factors, the Board ultimately concluded that the advisory fee structures are fair and reasonable, and that each fund's Advisory Contracts should be renewed.
Annual Report
Investment Adviser
Fidelity Management & Research Company
Boston, MA
Investment Sub-Advisers
FMR Co., Inc.
Fidelity Management & Research
(U.K.) Inc.
Fidelity Management & Research
(Hong Kong) Limited
Fidelity Management & Research
(Japan) Inc.
Fidelity Research & Analysis Company
Fidelity Investments Japan Limited
FIL Investment Advisors
FIL Investment Advisors
(U.K.) Ltd.
General Distributor
Fidelity Distributors Corporation
Boston, MA
Transfer and Service Agents
Fidelity Investments Institutional
Operations Company, Inc.
Boston, MA
Fidelity Service Company, Inc.
Boston, MA
Custodians
JPMorgan Chase Bank
New York, NY
Emerging Markets Fund, Japan Fund, Pacific Basin Fund
Brown Brothers Harriman & Co.
Boston, MA
China Region Fund, Latin America Fund, Nordic Fund
Mellon Bank, N.A.
Pittsburgh, PA
Canada Fund, Europe Fund
The Northern Trust Company
Chicago, IL
Europe Capital Appreciation Fund, Japan Smaller Companies Fund, Southeast Asia Fund
Fidelity's International Equity Funds
Canada Fund
China Region Fund
Diversified International Fund
Emerging Europe, Middle East, Africa (EMEA) Fund
Emerging Markets Fund
Europe Fund
Europe Capital Appreciation Fund
Global Balanced Fund
International Capital Appreciation
International Discovery Fund
International Growth Fund
International Small Cap Fund
International Small Cap Opportunities Fund
International Value Fund
Japan Fund
Japan Smaller Companies Fund
Latin America Fund
Nordic Fund
Overseas Fund
Pacific Basin Fund
Southeast Asia Fund
Total International Equity
Worldwide Fund
Corporate Headquarters
82 Devonshire Street
Boston, MA 02109
www.fidelity.com
The Fidelity Telephone Connection
Mutual Fund 24-Hour Service
Exchanges/Redemptions
and Account Assistance 1-800-544-6666
Product Information 1-800-544-6666
Retirement Accounts 1-800-544-4774
(8 a.m. - 9 p.m.)
TDD Service 1-800-544-0118
for the deaf and hearing impaired
(9 a.m. - 9 p.m. Eastern time)
Fidelity Automated Service
Telephone (FAST®) 1-800-544-5555
Automated line for quickest service
TIF-UANN-1208
1.888176.100
Fidelity Advisor
Canada Fund
Class A, Class T, Class B, and Class C
Annual Report
October 31, 2008
Class A, Class T, Class B, and Class C are
classes of Fidelity® Canada Fund
(2_fidelity_logos) (Registered_Trademark)
Contents
Chairman's Message | <Click Here> | Ned Johnson's message to shareholders. |
Performance | <Click Here> | How the fund has done over time. |
Management's Discussion | <Click Here> | The manager's review of fund performance, strategy and outlook. |
Shareholder Expense Example | <Click Here> | An example of shareholder expenses. |
Investment Changes | <Click Here> | A summary of major shifts in the fund's investments over the past six months. |
Investments | <Click Here> | A complete list of the fund's investments with their market values. |
Financial Statements | <Click Here> | Statements of assets and liabilities, operations, and changes in net assets, as well as financial highlights. |
Notes | <Click Here> | Notes to the financial statements. |
Report of Independent Registered Public Accounting Firm | <Click Here> | |
Trustees and Officers | <Click Here> | |
Distributions | <Click Here> | |
Proxy Voting Results | <Click Here> | |
Board Approval of Investment Advisory Contracts and Management Fees | <Click Here> | |
To view a fund's proxy voting guidelines and proxy voting record for the 12-month period ended June 30, visit http://www.fidelity.com (search for "proxy voting guidelines") or visit the Securities and Exchange Commission's (SEC) web site at http://www.sec.gov. You may also call 1-877-208-0098 to request a free copy of the proxy voting guidelines.
Standard & Poor's, S&P and S&P 500 are registered service marks of The McGraw-Hill Companies, Inc. and have been licensed for use by Fidelity Distributors Corporation.
Other third party marks appearing herein are the property of their respective owners.
All other marks appearing herein are registered or unregistered trademarks or service marks of FMR LLC or an affiliated company.
This report and the financial statements contained herein are submitted for the general information of the shareholders of the fund. This report is not authorized for distribution to prospective investors in the fund unless preceded or accompanied by an effective prospectus.
A fund files its complete schedule of portfolio holdings with the SEC for the first and third quarters of each fiscal year on Form N-Q. Forms N-Q are available on the SEC's web site at http://www.sec.gov. A fund's Forms N-Q may be reviewed and copied at the SEC's Public Reference Room in Washington, DC. Information regarding the operation of the SEC's Public Reference Room may be obtained by calling 1-800-SEC-0330. For a complete list of a fund's portfolio holdings, view the most recent holdings listing, semiannual report, or annual report on Fidelity's web site at http://www.fidelity.com or http://www.advisor.fidelity.com, as applicable.
NOT FDIC INSURED · MAY LOSE VALUE · NO BANK GUARANTEE
Neither the fund nor Fidelity Distributors Corporation is a bank.
Annual Report
(photo_of_Edward_C_Johnson_3d)
Dear Shareholder:
Turmoil has been the watchword for the world's securities markets in 2008, with domestic and international stocks down sharply amid the global credit squeeze. A flight to quality boosted returns for U.S. Treasuries, one of the few asset classes with positive results heading into the latter stages of the year. Financial markets are always unpredictable, but there are a number of time-tested principles that can put the historical odds in your favor.
One of the basic tenets is to invest for the long term. Over time, riding out the markets' inevitable ups and downs has proven much more effective than selling into panic or chasing the hottest trend. Even missing only a few of the markets' best days can significantly diminish investor returns. Patience also affords the benefits of compounding - of earning interest on additional income or reinvested dividends and capital gains. There are tax advantages and cost benefits to consider as well. The more you sell, the more taxes you pay, and the more you trade, the higher the costs. While staying the course doesn't eliminate risk, it can considerably lessen the effect of short-term declines.
You can further manage your investing risk through diversification. And today, more than ever, geographic diversification should be taken into account. Studies indicate that asset allocation is the single most important determinant of a portfolio's long-term success. The right mix of stocks, bonds and cash - aligned to your particular risk tolerance and investment objective - is very important. Age-appropriate rebalancing is also an essential aspect of asset allocation. For younger investors, an emphasis on equities - which historically have been the best-performing asset class over time - is encouraged. As investors near their specific goal, such as retirement or sending a child to college, consideration may be given to replacing volatile assets (e.g. common stocks) with more-stable fixed investments (bonds or savings plans).
A third investment principle - investing regularly - can help lower the average cost of your purchases. Investing a certain amount of money each month or quarter helps ensure you won't pay for all your shares at market highs. This strategy - known as dollar cost averaging - also reduces unconstructive "emotion" from investing, helping shareholders avoid selling weak performers just prior to an upswing, or chasing a hot performer just before a correction.
We invite you to contact us via the Internet, through our Investor Centers or over the phone. It is our privilege to provide you the information you need to make the investments that are right for you.
Sincerely,
/s/Edward C. Johnson 3d
Edward C. Johnson 3d
Annual Report
Average annual total return reflects the change in the value of an investment, assuming reinvestment of the class' dividend income and capital gains (the profits earned upon the sale of securities that have grown in value, if any) and assuming a constant rate of performance each year. The $10,000 table and the fund's returns do not reflect the deduction of taxes that a shareholder would pay on fund distributions or the redemption of fund shares. During periods of reimbursement by Fidelity, a fund's total returns will be greater than it would be had the reimbursement not occurred. How a fund did yesterday is no guarantee of how it will do tomorrow.
Average Annual Total Returns
Periods ended October 31, 2008 | Past 1
year | Past 5
years | Past 10
years |
Class A (incl. 5.75% sales charge)A | -45.55% | 9.60% | 12.35% |
Class T (incl. 3.50% sales charge) B | -44.41% | 10.03% | 12.58% |
Class B (incl. contingent deferred sales charge) C | -45.40% | 10.37% | 12.89% |
Class C (incl. contingent deferred sales charge) D | -43.23% | 10.65% | 12.89% |
A Class A shares bear a 0.25% 12b-1 fee. The initial offering of Class A shares took place on May 2, 2007. Returns prior to May 2, 2007 are those of Canada, the original retail class of the fund, which has no 12b-1 fee. Had Class A shares' 12b-1 fee been reflected, returns prior to May 2, 2007 would have been lower.
B Class T shares bear a 0.50% 12b-1 fee. The initial offering of Class T shares took place on May 2, 2007. Returns prior to May 2, 2007 are those of Canada, the original retail class of the fund, which has no 12b-1 fee. Had Class T shares' 12b-1 fee been reflected, returns prior to May 2, 2007 would have been lower.
C Class B shares bear a 1.00% 12b-1 fee. The initial offering of Class B shares took place on May 2, 2007. Returns prior to May 2, 2007 are those of Canada, the original retail class of the fund, which has no 12b-1 fee. Had Class B shares' 12b-1 fee been reflected, returns prior to May 2, 2007 would have been lower. Class B shares' contingent deferred sales charge included in the past one year, past five years, and past 10 years total return figures are 5%, 2%, and 0% respectively.
D Class C shares bear a 1.00% 12b-1 fee. The initial offering of Class C shares took place on May 2, 2007. Returns prior to May 2, 2007 are those of Canada, the original retail class of the fund, which has no 12b-1 fee. Had Class C shares' 12b-1 fee been reflected, returns prior to May 2, 2007 would have been lower. Class C shares' contingent deferred sales charge included in the past one year, past five years, and past 10 years total return figures are 1%, 0%, and 0%, respectively.
$10,000 Over 10 Years
Let's say hypothetically that $10,000 was invested in Fidelity Advisor Canada Fund - Class A on October 31, 1998, and the current 5.75% sales charge was paid. The chart shows how the value of your investment would have changed, and also shows how the S&P/TSX Composite Index performed over the same period. The initial offering of Class A took place on May 2, 2007. See above for additional information regarding the performance of Class A.
Annual Report
Comments from Douglas Lober, who became Portfolio Manager of Fidelity Advisor Canada Fund on September 1, 2008
In a dramatic reversal of what had been a multiyear global growth story, international stocks fell long and hard during the 12 months ending October 31, 2008, especially so during the latter stages of the period and mostly as a result of fallout from the financial crisis that emanated from the United States. The viral spread of this financial contagion - which began in the U.S. subprime mortgage market, then seized up the credit markets, hobbled major financial institutions and eventually slowed economic growth worldwide - left virtually no corner of the globe untouched. Developed international equity markets - as gauged by the MSCI® Europe, Australasia, Far East (EAFE®) Index, which monitors established markets outside the U.S. and Canada - fell 46.54%, while the Standard & Poor's 500SM Index, a measure of U.S. stocks, dropped 36.10%. Among countries constituting at least 1% of the EAFE index, Switzerland had the "least worst" showing, falling roughly 32%, followed by Japan, where stocks slid by around 37%. Meanwhile, the weakest overall performance came from Belgium, where stocks slipped by nearly 70%. In the United Kingdom, the largest component of the index, equities were down almost 48%. Emerging markets were the weakest performers among the global economies, declining 56.22% as measured by the MSCI Emerging Markets Index.
For the year ending October 31, 2008, the fund's Class A, Class T, Class B and Class C shares declined 42.23%, 42.40%, 42.68% and 42.69%, respectively (excluding sales charges), beating the 46.37% decline of the S&P/TSX Composite Index. Prudent stock selection in the energy and materials sectors supported the fund's return versus the benchmark. Overweighted positions in oil and natural gas pipeline company TransCanada, fertilizer company Potash Corp. of Saskatchewan, Toronto-Dominion Bank and transportation manufacturer Bombardier made these stocks the fund's top contributors. Having virtually no exposure to floundering telecommunications equipment maker and index component Nortel Networks also helped when equipment investment cutbacks by telecom carriers drove down this company's stock. Underweighting Canadian Imperial Bank of Commerce also helped when this stock faltered. Lastly, the fund's cash holdings boosted performance substantially. On the other hand, we missed the strength of pipeline company Enbridge, having chosen to invest in TransCanada instead, and we had disappointing results from our positioning in Bank of Nova Scotia, T-shirt manufacturer Gildan Activewear, and gold mining companies Yamana Gold and Barrick Gold, both of which declined along with other commodities stocks during the period. Currency fluctuations also dampened performance.
Note to shareholders: Fidelity Advisor Canada Fund may invest up to 35% of its total assets in any industry that represents more than 20% of the Canadian market. As of October 31, 2008, the fund did not have more than 25% of its total assets invested in any one industry.
The views expressed above reflect those of the portfolio manager(s) only through the end of the period as stated on the cover of this report and do not necessarily represent the views of Fidelity or any other person in the Fidelity organization. Any such views are subject to change at any time based upon market or other conditions and Fidelity disclaims any responsibility to update such views. These views may not be relied on as investment advice and, because investment decisions for a Fidelity fund are based on numerous factors, may not be relied on as an indication of trading intent on behalf of any Fidelity fund.
Annual Report
Canada
Shareholder Expense Example
As a shareholder of the Fund, you incur two types of costs: (1) transaction costs, including sales charges (loads) on purchase payments or redemption proceeds and redemption fees, and (2) ongoing costs, including management fees, distribution and/or service (12b-1) fees and other Fund expenses. This Example is intended to help you understand your ongoing costs (in dollars) of investing in the Fund and to compare these costs with the ongoing costs of investing in other mutual funds.
The Example is based on an investment of $1,000 invested at the beginning of the period and held for the entire period (May 1, 2008 to October 31, 2008).
Actual Expenses
The first line of the accompanying table for each class of the Fund provides information about actual account values and actual expenses. You may use the information in this line, together with the amount you invested, to estimate the expenses that you paid over the period. Simply divide your account value by $1,000.00 (for example, an $8,600 account value divided by $1,000.00 = 8.6), then multiply the result by the number in the first line for a class of the Fund under the heading entitled "Expenses Paid During Period" to estimate the expenses you paid on your account during this period. A small balance maintenance fee of $12.00 that is charged once a year may apply for certain accounts with a value of less than $2,000. This fee is not included in the table below. If it was, the estimate of expenses you paid during the period would be higher, and your ending account value lower, by this amount. In addition, the Fund, as a shareholder in the underlying Fidelity Central Funds, will indirectly bear its pro rata share of the fees and expenses incurred by the underlying Fidelity Central Funds. These fees and expenses are not included in the Fund's annualized expense ratio used to calculate the expense estimate in the table below.
Hypothetical Example for Comparison Purposes
The second line of the accompanying table for each class of the Fund provides information about hypothetical account values and hypothetical expenses based on a Class' actual expense ratio and an assumed rate of return of 5% per year before expenses, which is not the Class' actual return. The hypothetical account values and expenses may not be used to estimate the actual ending account balance or expenses you paid for the period. You may use this information to compare the ongoing costs of investing in the Fund and other funds. To do so, compare this 5% hypothetical example with the 5% hypothetical examples that appear in the shareholder reports of the other funds. A small balance maintenance fee of $12.00 that is charged once a year may apply for certain accounts with a value of less than $2,000. This fee is not included in the table below. If it was, the estimate of expenses you paid during the period would be higher, and your ending account value lower, by this amount. In addition, the Fund, as a shareholder in the underlying Fidelity Central Funds, will indirectly bear its pro rata share of the fees and expenses incurred by the underlying Fidelity Central Funds. These fees and expenses are not included in the Fund's annualized expense ratio used to calculate the expense estimate in the table below.
Please note that the expenses shown in the table are meant to highlight your ongoing costs only and do not reflect any transaction costs. Therefore, the second line of the table is useful in comparing ongoing costs only, and will not help you determine the relative total costs of owning different funds. In addition, if these transactional costs were included, your costs would have been higher.
| Annualized Expense Ratio | Beginning
Account Value
May 1, 2008 | Ending
Account Value
October 31, 2008 | Expenses Paid
During Period*
May 1, 2008
to October 31, 2008 |
Class A | 1.37% | | | |
Actual | | $ 1,000.00 | $ 628.90 | $ 5.61 |
HypotheticalA | | $ 1,000.00 | $ 1,018.25 | $ 6.95 |
Class T | 1.66% | | | |
Actual | | $ 1,000.00 | $ 628.00 | $ 6.79 |
HypotheticalA | | $ 1,000.00 | $ 1,016.79 | $ 8.42 |
Class B | 2.16% | | | |
Actual | | $ 1,000.00 | $ 626.40 | $ 8.83 |
HypotheticalA | | $ 1,000.00 | $ 1,014.28 | $ 10.94 |
Class C | 2.16% | | | |
Actual | | $ 1,000.00 | $ 626.40 | $ 8.83 |
HypotheticalA | | $ 1,000.00 | $ 1,014.28 | $ 10.94 |
Canada | 1.07% | | | |
Actual | | $ 1,000.00 | $ 629.80 | $ 4.38 |
HypotheticalA | | $ 1,000.00 | $ 1,019.76 | $ 5.43 |
Institutional Class | 1.14% | | | |
Actual | | $ 1,000.00 | $ 629.60 | $ 4.67 |
HypotheticalA | | $ 1,000.00 | $ 1,019.41 | $ 5.79 |
A 5% return per year before expenses
* Expenses are equal to each Class' annualized expense ratio, multiplied by the average account value over the period, multiplied by 184/366 (to reflect the one-half year period).
Annual Report
Canada
Investment Changes (Unaudited)
Geographic Diversification (% of fund's net assets) |
As of October 31, 2008 |
| Canada | 92.8% | |
| United States of America | 7.2% | |

Percentages are adjusted for the effect of futures contracts, if applicable. |
|
As of April 30, 2008 |
| Canada | 92.0% | |
| United States of America | 8.0% | |

Percentages are adjusted for the effect of futures contracts, if applicable. |
Asset Allocation |
| % of fund's
net assets | % of fund's net assets
6 months ago |
Stocks | 98.5 | 91.9 |
Short-Term Investments and Net Other Assets | 1.5 | 8.1 |
Top Ten Stocks as of October 31, 2008 |
| % of fund's
net assets | % of fund's net assets
6 months ago |
Royal Bank of Canada (Commercial Banks) | 6.5 | 3.5 |
Toronto-Dominion Bank (Commercial Banks) | 6.2 | 4.4 |
EnCana Corp. (Oil, Gas & Consumable Fuels) | 6.2 | 5.0 |
Canadian Natural Resources Ltd. (Oil, Gas & Consumable Fuels) | 5.2 | 3.9 |
Canadian National Railway Co. (Road & Rail) | 4.3 | 0.4 |
TransCanada Corp. (Oil, Gas & Consumable Fuels) | 4.3 | 3.3 |
Potash Corp. of Saskatchewan, Inc. (Chemicals) | 3.5 | 5.0 |
Research In Motion Ltd. (Communications Equipment) | 3.4 | 4.4 |
Manulife Financial Corp. (Insurance) | 3.3 | 4.2 |
Rogers Communications, Inc. Class B (non-vtg.) (Wireless Telecommunication Services) | 2.9 | 2.8 |
| 45.8 | |
Market Sectors as of October 31, 2008 |
| % of fund's
net assets | % of fund's net assets
6 months ago |
Energy | 28.8 | 27.9 |
Financials | 27.8 | 21.2 |
Materials | 11.3 | 14.8 |
Industrials | 7.7 | 9.2 |
Telecommunication Services | 7.0 | 4.9 |
Consumer Staples | 5.7 | 3.2 |
Information Technology | 5.3 | 6.9 |
Consumer Discretionary | 3.1 | 3.5 |
Health Care | 1.4 | 0.3 |
Utilities | 0.4 | 0.0 |
Annual Report
Canada
Investments October 31, 2008
Showing Percentage of Net Assets
Common Stocks - 98.5% |
| Shares | | Value |
CONSUMER DISCRETIONARY - 3.1% |
Hotels, Restaurants & Leisure - 0.9% |
McDonald's Corp. | 250,000 | | $ 14,482,500 |
Tim Hortons, Inc. | 500,000 | | 12,585,000 |
| | 27,067,500 |
Media - 1.7% |
Astral Media, Inc. Class A (non-vtg.) | 340,000 | | 7,858,517 |
Corus Entertainment, Inc. Class B (non-vtg.) (d) | 550,000 | | 6,431,415 |
Groupe Aeroplan, Inc. | 490,000 | | 4,254,686 |
Quebecor, Inc. Class B (sub. vtg.) | 900,000 | | 14,681,539 |
Thomson Reuters Corp. (d) | 400,000 | | 9,414,497 |
Yellow Pages Income Fund (d) | 900,000 | | 6,530,934 |
| | 49,171,588 |
Textiles, Apparel & Luxury Goods - 0.5% |
Gildan Activewear, Inc. (a) | 560,000 | | 13,050,257 |
TOTAL CONSUMER DISCRETIONARY | | 89,289,345 |
CONSUMER STAPLES - 5.7% |
Food & Staples Retailing - 3.3% |
Alimentation Couche-Tard, Inc. Class B (sub. vtg.) | 1,210,000 | | 16,306,601 |
George Weston Ltd. | 80,000 | | 4,080,942 |
Metro, Inc. Class A (sub. vtg.) | 940,000 | | 23,659,811 |
Shoppers Drug Mart Corp. | 1,300,000 | | 50,024,880 |
| | 94,072,234 |
Food Products - 1.4% |
Campbell Soup Co. | 460,000 | | 17,457,000 |
General Mills, Inc. | 280,000 | | 18,967,200 |
Viterra, Inc. (a) | 809,300 | | 5,134,471 |
| | 41,558,671 |
Household Products - 1.0% |
Procter & Gamble Co. | 450,000 | | 29,043,000 |
TOTAL CONSUMER STAPLES | | 164,673,905 |
ENERGY - 28.8% |
Energy Equipment & Services - 0.1% |
Flint Energy Services Ltd. (a) | 260,000 | | 1,498,590 |
Precision Drilling Trust (d) | 163,300 | | 1,760,574 |
| | 3,259,164 |
Oil, Gas & Consumable Fuels - 28.7% |
Cameco Corp. | 1,050,000 | | 17,180,710 |
Canadian Natural Resources Ltd. | 2,950,000 | | 148,796,650 |
Canadian Oil Sands Trust | 1,250,000 | | 33,525,460 |
Enbridge, Inc. | 608,900 | | 21,138,293 |
EnCana Corp. | 3,500,000 | | 177,728,479 |
Exxon Mobil Corp. | 400,000 | | 29,648,000 |
Husky Energy, Inc. | 1,500,000 | | 45,032,344 |
|
| Shares | | Value |
Imperial Oil Ltd. | 900,000 | | $ 31,833,637 |
Keyera Facilities Income Fund | 2,050,000 | | 31,044,120 |
Nexen, Inc. | 1,350,000 | | 21,428,927 |
Niko Resources Ltd. | 240,000 | | 10,509,206 |
Petro-Canada | 1,450,000 | | 36,243,987 |
Suncor Energy, Inc. | 2,950,000 | | 70,826,422 |
Talisman Energy, Inc. | 2,700,000 | | 26,668,602 |
TransCanada Corp. | 4,100,000 | | 123,836,457 |
| | 825,441,294 |
TOTAL ENERGY | | 828,700,458 |
FINANCIALS - 27.8% |
Capital Markets - 0.1% |
IGM Financial, Inc. | 100,000 | | 3,022,060 |
Commercial Banks - 18.1% |
Bank of Montreal (d) | 1,609,300 | | 57,415,895 |
Bank of Nova Scotia | 1,500,000 | | 49,995,853 |
Canadian Imperial Bank of Commerce | 784,600 | | 35,566,625 |
National Bank of Canada | 280,000 | | 10,498,258 |
Royal Bank of Canada | 4,840,000 | | 188,012,608 |
Toronto-Dominion Bank | 3,800,000 | | 179,379,665 |
| | 520,868,904 |
Diversified Financial Services - 0.3% |
Onex Corp. (sub. vtg.) | 400,000 | | 6,916,570 |
TMX Group, Inc. | 145,000 | | 3,395,920 |
| | 10,312,490 |
Insurance - 7.7% |
Fairfax Financial Holdings Ltd. | 90,000 | | 24,705,590 |
ING Canada, Inc. | 525,000 | | 14,285,329 |
Manulife Financial Corp. | 4,800,000 | | 96,015,923 |
Power Corp. of Canada (sub. vtg.) | 2,100,000 | | 45,629,458 |
Sun Life Financial, Inc. | 1,700,000 | | 39,969,315 |
| | 220,605,615 |
Real Estate Investment Trusts - 0.1% |
RioCan (REIT) | 250,000 | | 3,485,238 |
Real Estate Management & Development - 1.5% |
Brookfield Asset Management, Inc. Class A (d) | 2,050,000 | | 35,872,450 |
Brookfield Properties Corp. | 650,000 | | 6,558,504 |
| | 42,430,954 |
TOTAL FINANCIALS | | 800,725,261 |
HEALTH CARE - 1.4% |
Health Care Equipment & Supplies - 0.7% |
Baxter International, Inc. | 300,000 | | 18,147,000 |
Noveko International, Inc. (a) | 2,500,000 | | 2,944,103 |
| | 21,091,103 |
Common Stocks - continued |
| Shares | | Value |
HEALTH CARE - continued |
Pharmaceuticals - 0.7% |
Johnson & Johnson | 300,000 | | $ 18,402,000 |
TOTAL HEALTH CARE | | 39,493,103 |
INDUSTRIALS - 7.7% |
Aerospace & Defense - 1.4% |
Bombardier, Inc. Class B (sub. vtg.) | 9,900,000 | | 38,177,973 |
CAE, Inc. | 500,000 | | 2,931,664 |
| | 41,109,637 |
Construction & Engineering - 0.8% |
SNC-Lavalin Group, Inc. | 815,000 | | 21,405,747 |
Road & Rail - 5.2% |
Canadian National Railway Co. | 2,870,000 | | 124,530,105 |
Canadian Pacific Railway Ltd. | 550,000 | | 24,881,821 |
| | 149,411,926 |
Trading Companies & Distributors - 0.3% |
Finning International, Inc. | 705,000 | | 8,565,475 |
TOTAL INDUSTRIALS | | 220,492,785 |
INFORMATION TECHNOLOGY - 5.3% |
Communications Equipment - 3.4% |
Research In Motion Ltd. (a)(d) | 1,910,000 | | 96,321,310 |
Computers & Peripherals - 0.3% |
Hewlett-Packard Co. | 250,000 | | 9,570,000 |
Internet Software & Services - 0.3% |
Open Text Corp. (a) | 350,000 | | 8,870,459 |
IT Services - 1.3% |
CGI Group, Inc. Class A (sub. vtg.) (a) | 4,690,000 | | 37,417,316 |
TOTAL INFORMATION TECHNOLOGY | | 152,179,085 |
MATERIALS - 11.3% |
Chemicals - 4.1% |
Agrium, Inc. | 460,000 | | 17,613,369 |
Potash Corp. of Saskatchewan, Inc. | 1,180,000 | | 100,606,802 |
| | 118,220,171 |
Metals & Mining - 7.2% |
Agnico-Eagle Mines Ltd. | 200,000 | | 5,516,669 |
Barrick Gold Corp. (d) | 3,600,000 | | 82,282,302 |
Goldcorp, Inc. | 3,350,000 | | 62,621,496 |
Kinross Gold Corp. | 2,350,000 | | 24,458,865 |
Orezone Resources, Inc. Class A (a) | 10,000,000 | | 1,617,184 |
Shore Gold, Inc. (a) | 400,000 | | 208,990 |
Teck Cominco Ltd. Class B (sub. vtg.) | 1,900,000 | | 18,908,608 |
Yamana Gold, Inc. | 2,700,000 | | 12,875,270 |
| | 208,489,384 |
TOTAL MATERIALS | | 326,709,555 |
|
| Shares | | Value |
TELECOMMUNICATION SERVICES - 7.0% |
Diversified Telecommunication Services - 4.1% |
BCE, Inc. | 2,750,000 | | $ 79,890,944 |
TELUS Corp. | 1,050,000 | | 37,069,580 |
| | 116,960,524 |
Wireless Telecommunication Services - 2.9% |
Rogers Communications, Inc. Class B (non-vtg.) | 2,900,000 | | 84,152,430 |
TOTAL TELECOMMUNICATION SERVICES | | 201,112,954 |
UTILITIES - 0.4% |
Electric Utilities - 0.3% |
Fortis, Inc. | 400,000 | | 8,724,498 |
Multi-Utilities - 0.1% |
Canadian Utilities Ltd. Class A (non-vtg.) | 100,000 | | 3,516,338 |
TOTAL UTILITIES | | 12,240,836 |
TOTAL COMMON STOCKS (Cost $3,177,288,022) | 2,835,617,287 |
Money Market Funds - 4.2% |
| | | |
Fidelity Cash Central Fund, 1.81% (b) | 44,876,838 | | 44,876,838 |
Fidelity Securities Lending Cash Central Fund, 2.67% (b)(c) | 74,627,890 | | 74,627,890 |
TOTAL MONEY MARKET FUNDS (Cost $119,504,728) | 119,504,728 |
TOTAL INVESTMENT
PORTFOLIO - 102.7% (Cost $3,296,792,750) | | 2,955,122,015 |
NET OTHER ASSETS - (2.7)% | | (76,419,060) |
NET ASSETS - 100% | $ 2,878,702,955 |
Legend |
(a) Non-income producing |
(b) Affiliated fund that is available only to investment companies and other accounts managed by Fidelity Investments. The rate quoted is the annualized seven-day yield of the fund at period end. A complete unaudited listing of the fund's holdings as of its most recent quarter end is available upon request. |
(c) Investment made with cash collateral received from securities on loan. |
(d) Security or a portion of the security is on loan at period end. |
Affiliated Central Funds |
Information regarding fiscal year to date income earned by the Fund from investments in Fidelity Central Funds is as follows: |
Fund | Income earned |
Fidelity Cash Central Fund | $ 7,406,661 |
Fidelity Securities Lending Cash Central Fund | 7,155,677 |
Total | $ 14,562,338 |
Income Tax Information |
At October 31, 2008, the fund had a capital loss carryforward of approximately $109,618,723 all of which will expire on October 31, 2016. |
See accompanying notes which are an integral part of the financial statements.
Annual Report
Canada
Financial Statements
Statement of Assets and Liabilities
| October 31, 2008 |
| | |
Assets | | |
Investment in securities, at value (including securities loaned of $70,624,731) - See accompanying schedule: Unaffiliated issuers
(cost $3,177,288,022) | $ 2,835,617,287 | |
Fidelity Central Funds
(cost $119,504,728) | 119,504,728 | |
Total Investments (cost $3,296,792,750) | | $ 2,955,122,015 |
Cash | | 50,940 |
Foreign currency held at value
(cost $1,751,041) | | 1,751,041 |
Receivable for investments sold | | 37,624,117 |
Receivable for fund shares sold | | 6,126,409 |
Dividends receivable | | 3,564,722 |
Distributions receivable from Fidelity Central Funds | | 930,110 |
Prepaid expenses | | 1,171 |
Other receivables | | 560,878 |
Total assets | | 3,005,731,403 |
| | |
Liabilities | | |
Payable for investments purchased | $ 39,987,092 | |
Payable for fund shares redeemed | 8,966,712 | |
Accrued management fee | 2,327,601 | |
Distribution fees payable | 37,935 | |
Other affiliated payables | 956,398 | |
Other payables and accrued expenses | 124,820 | |
Collateral on securities loaned, at value | 74,627,890 | |
Total liabilities | | 127,028,448 |
| | |
Net Assets | | $ 2,878,702,955 |
Net Assets consist of: | | |
Paid in capital | | $ 3,364,193,370 |
Undistributed net investment income | | 26,382,786 |
Accumulated undistributed net realized gain (loss) on investments and foreign currency transactions | | (170,169,032) |
Net unrealized appreciation (depreciation) on investments and assets and liabilities in foreign currencies | | (341,704,169) |
Net Assets | | $ 2,878,702,955 |
Statement of Assets and Liabilities - continued
| October 31, 2008 |
| | |
Calculation of Maximum Offering Price Class A:
Net Asset Value and redemption
price per share ($56,241,768 ÷ 1,472,410 shares) | | $ 38.20 |
| | |
Maximum offering price per share (100/94.25 of $38.20) | | $ 40.53 |
Class T:
Net Asset Value and redemption
price per share ($14,962,665 ÷ 392,759 shares) | | $ 38.10 |
| | |
Maximum offering price per share (100/96.50 of $38.10) | | $ 39.48 |
Class B:
Net Asset Value and offering
price per share ($5,614,606 ÷ 148,110 shares)A | | $ 37.91 |
| | |
Class C:
Net Asset Value and offering
price per share ($16,715,712 ÷ 441,756 shares)A | | $ 37.84 |
| | |
Canada:
Net Asset Value, offering price and redemption price per share ($2,776,298,056 ÷ 72,354,690 shares) | | $ 38.37 |
| | |
Institutional Class:
Net Asset Value, offering price and redemption price per share ($8,870,148 ÷ 231,554 shares) | | $ 38.31 |
A Redemption price per share is equal to net asset value less any applicable contingent deferred sales charge.
See accompanying notes which are an integral part of the financial statements.
Annual Report
Canada
Financial Statements - continued
Statement of Operations
| Year ended October 31, 2008 |
Investment Income | | |
Dividends | | $ 88,816,652 |
Interest | | 3,342,141 |
Income from Fidelity Central Funds (including $7,155,677 from security lending) | | 14,562,338 |
| | 106,721,131 |
Less foreign taxes withheld | | (13,248,424) |
Total income | | 93,472,707 |
| | |
Expenses | | |
Management fee
Basic fee | $ 33,096,529 | |
Performance adjustment | 2,474,546 | |
Transfer agent fees | 10,148,036 | |
Distribution fees | 476,058 | |
Accounting and security lending fees | 1,552,365 | |
Custodian fees and expenses | 128,586 | |
Independent trustees' compensation | 20,487 | |
Registration fees | 278,940 | |
Audit | 74,475 | |
Legal | 21,976 | |
Interest | 8,474 | |
Miscellaneous | 540,182 | |
Total expenses before reductions | 48,820,654 | |
Expense reductions | (1,414,672) | 47,405,982 |
Net investment income (loss) | | 46,066,725 |
Realized and Unrealized Gain (Loss) Net realized gain (loss) on: | | |
Investment securities: | | |
Unaffiliated issuers | (171,748,787) | |
Foreign currency transactions | (3,938,430) | |
Total net realized gain (loss) | | (175,687,217) |
Change in net unrealized appreciation (depreciation) on: Investment securities | (2,180,802,820) | |
Assets and liabilities in foreign currencies | (200,050) | |
Total change in net unrealized appreciation (depreciation) | | (2,181,002,870) |
Net gain (loss) | | (2,356,690,087) |
Net increase (decrease) in net assets resulting from operations | | $ (2,310,623,362) |
Statement of Changes in Net Assets
| Year ended
October 31,
2008 | Year ended
October 31,
2007 |
Increase (Decrease) in Net Assets | | |
Operations | | |
Net investment income (loss) | $ 46,066,725 | $ 33,178,201 |
Net realized gain (loss) | (175,687,217) | 272,277,024 |
Change in net unrealized appreciation (depreciation) | (2,181,002,870) | 1,120,719,255 |
Net increase (decrease) in net assets resulting from operations | (2,310,623,362) | 1,426,174,480 |
Distributions to shareholders from net investment income | (28,915,979) | (22,989,617) |
Distributions to shareholders from net realized gain | (235,022,630) | (65,775,827) |
Total distributions | (263,938,609) | (88,765,444) |
Share transactions - net increase (decrease) | 507,012,286 | 467,056,549 |
Redemption fees | 3,308,433 | 1,551,369 |
Total increase (decrease) in net assets | (2,064,241,252) | 1,806,016,954 |
| | |
Net Assets | | |
Beginning of period | 4,942,944,207 | 3,136,927,253 |
End of period (including undistributed net investment income of $26,382,786 and undistributed net investment income of $26,450,845, respectively) | $ 2,878,702,955 | $ 4,942,944,207 |
See accompanying notes which are an integral part of the financial statements.
Annual Report
Financial Highlights - Class A
Years ended October 31, | 2008 | 2007 H |
Selected Per-Share Data | | |
Net asset value, beginning of period | $ 70.16 | $ 54.00 |
Income from Investment Operations | | |
Net investment income (loss) E | .39 | .19 |
Net realized and unrealized gain (loss) | (28.71) | 15.96 |
Total from investment operations | (28.32) | 16.15 |
Distributions from net investment income | (.41) | - |
Distributions from net realized gain | (3.27) | - |
Total distributions | (3.68) | - |
Redemption fees added to paid in capital E | .04 | .01 |
Net asset value, end of period | $ 38.20 | $ 70.16 |
Total Return B, C, D | (42.23)% | 29.93% |
Ratios to Average Net Assets F, I | | |
Expenses before reductions | 1.34% | 1.23% A |
Expenses net of fee waivers, if any | 1.34% | 1.23% A |
Expenses net of all reductions | 1.31% | 1.22% A |
Net investment income (loss) | .69% | .63% A |
Supplemental Data | | |
Net assets, end of period (000 omitted) | $ 56,242 | $ 20,912 |
Portfolio turnover rate G | 63% | 42% |
A Annualized B Total returns for periods of less than one year are not annualized. C Total returns would have been lower had certain expenses not been reduced during the periods shown. D Total returns do not include the effect of the sales charges. E Calculated based on average shares outstanding during the period. F Fees and expenses of the underlying Fidelity Central Funds are not included in the Fund's expense ratio. The Fund indirectly bears its proportionate share of the expenses of any underlying Fidelity Central Funds. G Amount does not include the portfolio activity of any underlying Fidelity Central Funds. H For the period May 2, 2007 (commencement of sale of shares) to October 31, 2007. I Expense ratios reflect operating expenses of the class. Expenses before reductions do not reflect amounts reimbursed by the investment adviser or reductions from brokerage service arrangements or other expense offset arrangements and do not represent the amount paid by the class during periods when reimbursements or reductions occur. Expense ratios before reductions for start-up periods may not be representative of longer-term operating periods. Expenses net of fee waivers reflect expenses after reimbursement by the investment adviser but prior to reductions from brokerage service arrangements or other expense offset arrangements. Expenses net of all reductions represent the net expenses paid by the class. |
Financial Highlights - Class T
Years ended October 31, | 2008 | 2007 H |
Selected Per-Share Data | | |
Net asset value, beginning of period | $ 70.09 | $ 54.00 |
Income from Investment Operations | | |
Net investment income (loss) E | .23 | .09 |
Net realized and unrealized gain (loss) | (28.66) | 15.99 |
Total from investment operations | (28.43) | 16.08 |
Distributions from net investment income | (.33) | - |
Distributions from net realized gain | (3.27) | - |
Total distributions | (3.60) | - |
Redemption fees added to paid in capital E | .04 | .01 |
Net asset value, end of period | $ 38.10 | $ 70.09 |
Total ReturnB, C, D | (42.40)% | 29.80% |
Ratios to Average Net AssetsF, I | | |
Expenses before reductions | 1.63% | 1.48% A |
Expenses net of fee waivers, if any | 1.63% | 1.48% A |
Expenses net of all reductions | 1.60% | 1.47% A |
Net investment income (loss) | .40% | .30% A |
Supplemental Data | | |
Net assets, end of period (000 omitted) | $ 14,963 | $ 14,522 |
Portfolio turnover rateG | 63% | 42% |
A Annualized B Total returns for periods of less than one year are not annualized. C Total returns would have been lower had certain expenses not been reduced during the periods shown. D Total returns do not include the effect of the sales charges. E Calculated based on average shares outstanding during the period. F Fees and expenses of the underlying Fidelity Central Funds are not included in the Fund's expense ratio. The Fund indirectly bears its proportionate share of the expenses of any underlying Fidelity Central Funds. G Amount does not include the portfolio activity of any underlying Fidelity Central Funds. H For the period May 2, 2007 (commencement of sale of shares) to October 31, 2007. I Expense ratios reflect operating expenses of the class. Expenses before reductions do not reflect amounts reimbursed by the investment adviser or reductions from brokerage service arrangements or other expense offset arrangements and do not represent the amount paid by the class during periods when reimbursements or reductions occur. Expense ratios before reductions for start-up periods may not be representative of longer-term operating periods. Expenses net of fee waivers reflect expenses after reimbursement by the investment adviser but prior to reductions from brokerage service arrangements or other expense offset arrangements. Expenses net of all reductions represent the net expenses paid by the class. |
See accompanying notes which are an integral part of the financial statements.
Annual Report
Financial Highlights - Class B
Years ended October 31, | 2008 | 2007 H |
Selected Per-Share Data | | |
Net asset value, beginning of period | $ 69.88 | $ 54.00 |
Income from Investment Operations | | |
Net investment income (loss) E | (.06) | (.06) |
Net realized and unrealized gain (loss) | (28.54) | 15.93 |
Total from investment operations | (28.60) | 15.87 |
Distributions from net investment income | (.14) | - |
Distributions from net realized gain | (3.27) | - |
Total distributions | (3.41) | - |
Redemption fees added to paid in capital E | .04 | .01 |
Net asset value, end of period | $ 37.91 | $ 69.88 |
Total ReturnB, C, D | (42.68)% | 29.41% |
Ratios to Average Net AssetsF, I | | |
Expenses before reductions | 2.13% | 2.00% A |
Expenses net of fee waivers, if any | 2.13% | 2.00%A |
Expenses net of all reductions | 2.10% | 1.99%A |
Net investment income (loss) | (.10)% | (.21)%A |
Supplemental Data | | |
Net assets, end of period (000 omitted) | $ 5,615 | $ 4,078 |
Portfolio turnover rate G | 63% | 42% |
A Annualized B Total returns for periods of less than one year are not annualized. C Total returns would have been lower had certain expenses not been reduced during the periods shown. D Total returns do not include the effect of the contingent deferred sales charge. E Calculated based on average shares outstanding during the period. F Fees and expenses of the underlying Fidelity Central Funds are not included in the Fund's expense ratio. The Fund indirectly bears its proportionate share of the expenses of any underlying Fidelity Central Funds. G Amount does not include the portfolio activity of any underlying Fidelity Central Funds. H For the period May 2, 2007 (commencement of sale of shares) to October 31, 2007. I Expense ratios reflect operating expenses of the class. Expenses before reductions do not reflect amounts reimbursed by the investment adviser or reductions from brokerage service arrangements or other expense offset arrangements and do not represent the amount paid by the class during periods when reimbursements or reductions occur. Expense ratios before reductions for start-up periods may not be representative of longer-term operating periods. Expenses net of fee waivers reflect expenses after reimbursement by the investment adviser but prior to reductions from brokerage service arrangements or other expense offset arrangements. Expenses net of all reductions represent the net expenses paid by the class. |
Financial Highlights - Class C
Years ended October 31, | 2008 | 2007 H |
Selected Per-Share Data | | |
Net asset value, beginning of period | $ 69.91 | $ 54.00 |
Income from Investment Operations | | |
Net investment income (loss) E | (.05) | (.04) |
Net realized and unrealized gain (loss) | (28.52) | 15.94 |
Total from investment operations | (28.57) | 15.90 |
Distributions from net investment income | (.27) | - |
Distributions from net realized gain | (3.27) | - |
Total distributions | (3.54) | - |
Redemption fees added to paid in capitalE | .04 | .01 |
Net asset value, end of period | $ 37.84 | $ 69.91 |
Total ReturnB, C, D | (42.69)% | 29.46% |
Ratios to Average Net AssetsF, I | | |
Expenses before reductions | 2.13% | 1.99% A |
Expenses net of fee waivers, if any | 2.13% | 1.99%A |
Expenses net of all reductions | 2.10% | 1.97%A |
Net investment income (loss) | (.10)% | (.15)%A |
Supplemental Data | | |
Net assets, end of period (000 omitted) | $ 16,716 | $ 8,752 |
Portfolio turnover rate G | 63% | 42% |
A Annualized B Total returns for periods of less than one year are not annualized. C Total returns would have been lower had certain expenses not been reduced during the periods shown. D Total returns do not include the effect of the contingent deferred sales charge. E Calculated based on average shares outstanding during the period. F Fees and expenses of the underlying Fidelity Central Funds are not included in the Fund's expense ratio. The Fund indirectly bears its proportionate share of the expenses of any underlying Fidelity Central Funds. G Amount does not include the portfolio activity of any underlying Fidelity Central Funds. H For the period May 2, 2007 (commencement of sale of shares) to October 31, 2007. I Expense ratios reflect operating expenses of the class. Expenses before reductions do not reflect amounts reimbursed by the investment adviser or reductions from brokerage service arrangements or other expense offset arrangements and do not represent the amount paid by the class during periods when reimbursements or reductions occur. Expense ratios before reductions for start-up periods may not be representative of longer-term operating periods. Expenses net of fee waivers reflect expenses after reimbursement by the investment adviser but prior to reductions from brokerage service arrangements or other expense offset arrangements. Expenses net of all reductions represent the net expenses paid by the class. |
See accompanying notes which are an integral part of the financial statements.
Annual Report
Financial Highlights - Canada
Years ended October 31, | 2008 | 2007 | 2006 | 2005 | 2004 |
Selected Per-Share Data | | | | | |
Net asset value, beginning of period | $ 70.25 | $ 49.48 | $ 39.14 | $ 31.87 | $ 25.13 |
Income from Investment Operations | | | | | |
Net investment income (loss) B | .58 | .52 | .34 | .20 | .10 |
Net realized and unrealized gain (loss) | (28.83) | 21.62 | 10.15 | 7.12 | 6.74 |
Total from investment operations | (28.25) | 22.14 | 10.49 | 7.32 | 6.84 |
Distributions from net investment income | (.40) | (.36) | (.16) | (.08) | (.13) |
Distributions from net realized gain | (3.27) | (1.03) | (.01) | - | - |
Total distributions | (3.67) | (1.39) | (.17) | (.08) | (.13) |
Redemption fees added to paid in capitalB | .04 | .02 | .02 | .03 | .03 |
Net asset value, end of period | $ 38.37 | $ 70.25 | $ 49.48 | $ 39.14 | $ 31.87 |
Total ReturnA | (42.06)% | 46.03% | 26.93% | 23.11% | 27.45% |
Ratios to Average Net AssetsC, E | | | | | |
Expenses before reductions | 1.03% | .96% | 1.00% | 1.08% | 1.20% |
Expenses net of fee waivers, if any | 1.03% | .96% | 1.00% | 1.08% | 1.20% |
Expenses net of all reductions | 1.00% | .94% | .97% | 1.04% | 1.15% |
Net investment income (loss) | 1.00% | .94% | .74% | .55% | .34% |
Supplemental Data | | | | | |
Net assets, end of period (000 omitted) | $ 2,776,298 | $ 4,890,617 | $ 3,136,927 | $ 1,722,516 | $ 413,319 |
Portfolio turnover rateD | 63% | 42% | 50% | 24% | 47% |
A Total returns would have been lower had certain expenses not been reduced during the periods shown. B Calculated based on average shares outstanding during the period. C Fees and expenses of the underlying Fidelity Central Funds are not included in the Fund's expense ratio. The Fund indirectly bears its proportionate share of the expenses of any underlying Fidelity Central Funds. D Amount does not include the portfolio activity of any underlying Fidelity Central Funds. E Expense ratios reflect operating expenses of the class. Expenses before reductions do not reflect amounts reimbursed by the investment adviser or reductions from brokerage service arrangements or other expense offset arrangements and do not represent the amount paid by the class during periods when reimbursements or reductions occur. Expenses net of fee waivers reflect expenses after reimbursement by the investment adviser but prior to reductions from brokerage service arrangements or other expense offset arrangements. Expenses net of all reductions represent the net expenses paid by the class. |
Financial Highlights - Institutional Class
Years ended October 31, | 2008 | 2007 G |
Selected Per-Share Data | | |
Net asset value, beginning of period | $ 70.25 | $ 54.00 |
Income from Investment Operations | | |
Net investment income (loss) D | .52 | .25 |
Net realized and unrealized gain (loss) | (28.78) | 15.99 |
Total from investment operations | (28.26) | 16.24 |
Distributions from net investment income | (.45) | - |
Distributions from net realized gain | (3.27) | - |
Total distributions | (3.72) | - |
Redemption fees added to paid in capitalD | .04 | .01 |
Net asset value, end of period | $ 38.31 | $ 70.25 |
Total ReturnB, C | (42.11)% | 30.09% |
Ratios to Average Net AssetsE, H | | |
Expenses before reductions | 1.11% | 1.01%A |
Expenses net of fee waivers, if any | 1.11% | 1.01%A |
Expenses net of all reductions | 1.08% | .99%A |
Net investment income (loss) | .92% | .83%A |
Supplemental Data | | |
Net assets, end of period (000 omitted) | $ 8,870 | $ 4,064 |
Portfolio turnover rateF | 63% | 42% |
A Annualized B Total returns for periods of less than one year are not annualized. C Total returns would have been lower had certain expenses not been reduced during the periods shown. D Calculated based on average shares outstanding during the period. E Fees and expenses of the underlying Fidelity Central Funds are not included in the Fund's expense ratio. The Fund indirectly bears its proportionate share of the expenses of any underlying Fidelity Central Funds. F Amount does not include the portfolio activity of any underlying Fidelity Central Funds. G For the period May 2, 2007 (commencement of sale of shares) to October 31, 2007. H Expense ratios reflect operating expenses of the class. Expenses before reductions do not reflect amounts reimbursed by the investment adviser or reductions from brokerage service arrangements or other expense offset arrangements and do not represent the amount paid by the class during periods when reimbursements or reductions occur. Expense ratios before reductions for start-up periods may not be representative of longer-term operating periods. Expenses net of fee waivers reflect expenses after reimbursement by the investment adviser but prior to reductions from brokerage service arrangements or other expense offset arrangements. Expenses net of all reductions represent the net expenses paid by the class. |
See accompanying notes which are an integral part of the financial statements.
Annual Report
Canada
Notes to Financial Statements
For the period ended October 31, 2008
1. Organization.
Fidelity Canada Fund (the Fund) is a fund of Fidelity Investment Trust (the trust) and is authorized to issue an unlimited number of shares. The trust is registered under the Investment Company Act of 1940, as amended (the 1940 Act), as an open-end management investment company organized as a Massachusetts business trust. The Fund offers Class A, Class T, Class B, Class C, Canada, and Institutional Class shares, each of which has equal rights as to assets and voting privileges. Each class has exclusive voting rights with respect to matters that affect that class. Class B shares will automatically convert to Class A shares after a holding period of seven years from the initial date of purchase. Investment income, realized and unrealized capital gains and losses, the common expenses of the Fund, and certain fund-level expense reductions, if any, are allocated on a pro rata basis to each class based on the relative net assets of each class to the total net assets of the Fund. Each class differs with respect to transfer agent and distribution and service plan fees incurred. Certain expense reductions also differ by class.
2. Investments in Fidelity Central Funds.
The Fund may invest in Fidelity Central Funds, which are open-end investment companies available only to other investment companies and accounts managed by Fidelity Management & Research Company (FMR) and its affiliates. The Fund's Schedule of Investments lists each of the Fidelity Central Funds held as of period end, if any, as an investment of the Fund, but does not include the underlying holdings of each Fidelity Central Fund. As an Investing Fund, the Fund indirectly bears its proportionate share of the expenses of the underlying Fidelity Central Funds.
The Money Market Central Funds seek preservation of capital and current income and are managed by Fidelity Investments Money Management, Inc. (FIMM), an affiliate of FMR.
A complete unaudited list of holdings for each Fidelity Central Fund is available upon request or at the SEC's web site at www.sec.gov. In addition, the financial statements of the Fidelity Central Funds, which are not covered by the Fund's Report of Independent Registered Public Accounting Firm, are available on the SEC's web site or upon request.
3. Significant Accounting Policies.
The financial statements have been prepared in conformity with accounting principles generally accepted in the United States of America, which require management to make certain estimates and assumptions at the date of the financial statements. Actual results could differ from those estimates. The following summarizes the significant accounting policies of the Fund:
Security Valuation. Investments are valued as of 4:00 p.m. Eastern time on the last calendar day of the period. Wherever possible, the Fund uses independent pricing services approved by the Board of Trustees to value its investments.
Equity securities, including restricted securities, for which market quotations are readily available, are valued at the last reported sale price or official closing price as reported by an independent pricing service on the primary market or exchange on which they are traded. In the event there were no sales during the day or closing prices are not available, securities are valued at the last quoted bid price. Investments in open-end mutual funds, including the Fidelity Central Funds, are valued at their closing net asset value each business day. Short-term securities with remaining maturities of sixty days or less for which quotations are not readily available are valued at amortized cost, which approximates value.
When current market prices or quotations are not readily available or reliable, valuations may be determined in good faith in accordance with procedures adopted by the Board of Trustees. Factors used in determining value may include significant market or security specific events, changes in interest rates and credit quality, and developments in foreign markets which are monitored by evaluating the performance of ADRs, futures contracts and exchange-traded funds. The frequency with which these procedures are used cannot be predicted and may be utilized to a significant extent. The value of securities used for net asset value (NAV) calculation under these procedures may differ from published prices for the same securities.
Foreign Currency. The Fund uses foreign currency contracts to facilitate transactions in foreign-denominated securities. Losses from these transactions may arise from changes in the value of the foreign currency or if the counterparties do not perform under the contracts' terms.
Foreign-denominated assets, including investment securities, and liabilities are translated into U.S. dollars at the exchange rate at period end. Purchases and sales of investment securities, income and dividends received and expenses denominated in foreign currencies are translated into U.S. dollars at the exchange rate in effect on the transaction date.
The effects of exchange rate fluctuations on investments are included with the net realized and unrealized gain (loss) on investment securities. Other foreign currency transactions resulting in realized and unrealized gain (loss) are disclosed separately.
Investment Transactions and Income. For financial reporting purposes, the Fund's investment holdings and NAV include trades executed through the end of the last business day of the period. The NAV per share for processing shareholder transactions is calculated as of the close of business of the New York Stock Exchange (NYSE), normally 4:00 p.m. Eastern time and includes trades executed through the end of the prior business day. Gains and losses on securities sold are determined on the basis of identified cost and may include proceeds received from litigation. Dividend income is recorded
Annual Report
3. Significant Accounting Policies - continued
Investment Transactions and Income - continued
on the ex-dividend date, except for certain dividends from foreign securities where the ex-dividend date may have passed, which are recorded as soon as the Fund is informed of the ex-dividend date. Non-cash dividends included in dividend income, if any, are recorded at the fair market value of the securities received. Distributions received on securities that represent a return of capital or capital gain are recorded as a reduction of cost of investments and/or as a realized gain. The Fund estimates the components of distributions received that may be considered return of capital distributions or capital gain distributions. Interest income and distributions from the Fidelity Central Funds are accrued as earned. Interest income includes coupon interest and amortization of premium and accretion of discount on debt securities. Investment income is recorded net of foreign taxes withheld where recovery of such taxes is uncertain.
Expenses. Most expenses of the trust can be directly attributed to a fund. Expenses which cannot be directly attributed are apportioned among each Fund in the trust. Expense estimates are accrued in the period to which they relate and adjustments are made when actual amounts are known.
Income Tax Information and Distributions to Shareholders. Each year, the Fund intends to qualify as a regulated investment company by distributing substantially all of its taxable income and realized gains under Subchapter M of the Internal Revenue Code and filing its U.S. federal tax return. As a result, no provision for income taxes is required. The Fund is subject to the provisions of FASB Interpretation No. 48, Accounting for Uncertainties in Income Taxes (FIN 48). FIN 48 sets forth a minimum threshold for financial statement recognition of the benefit of a tax position taken or expected to be taken in a tax return. The implementation of FIN 48 did not result in any unrecognized tax benefits in the accompanying financial statements. Each of the Fund's federal tax returns for the prior three fiscal years remains subject to examination by the Internal Revenue Service (IRS). Foreign taxes are provided for based on the Fund's understanding of the tax rules and rates that exist in the foreign markets in which it invests.
Distributions are recorded on the ex-dividend date. Income dividends and capital gain distributions are declared separately for each class. Income and capital gain distributions are determined in accordance with income tax regulations, which may differ from generally accepted accounting principles. In addition, the Fund will claim a portion of the payment made to redeeming shareholders as a distribution for income tax purposes.
Capital accounts within the financial statements are adjusted for permanent book-tax differences. These adjustments have no impact on net assets or the results of operations. Temporary book-tax differences will reverse in a subsequent period.
Book-tax differences are primarily due to foreign currency transactions, market discount, partnerships, deferred trustees compensation, capital loss carryforwards and losses deferred due to wash sales.
The tax-basis components of distributable earnings and the federal tax cost as of period end were as follows:
Unrealized appreciation | $ 324,549,848 |
Unrealized depreciation | (726,804,328) |
Net unrealized appreciation (depreciation) | (402,254,480) |
Undistributed ordinary income | 2,358,954 |
Capital loss carryforward | (109,618,723) |
| |
Cost for federal income tax purposes | $ 3,357,376,495 |
The tax character of distributions paid was as follows:
| October 31, 2008 | October 31, 2007 |
Ordinary Income | $ 73,476,845 | $ 44,702,026 |
Long-term Capital Gains | 190,461,764 | 44,063,418 |
Total | $ 263,938,609 | $ 88,765,444 |
Short-Term Trading (Redemption) Fees. Shares held in the Fund less than 90 days are subject to a redemption fee equal to 1.50% of the proceeds of the redeemed shares. All redemption fees, including any estimated redemption fees paid by FMR, are retained by the Fund and accounted for as an addition to paid in capital.
New Accounting Pronouncement. In September 2006, Statement of Financial Accounting Standards No. 157, Fair Value Measurements (SFAS 157), was issued and is effective for fiscal years beginning after November 15, 2007. SFAS 157 defines fair value, establishes a framework for measuring fair value and results in expanded disclosures about fair value measurements.
Annual Report
Canada
Notes to Financial Statements - continued
4. Operating Policies.
Repurchase Agreements. FMR has received an Exemptive Order from the Securities and Exchange Commission (the SEC) which permits the Fund and other affiliated entities of FMR to transfer uninvested cash balances into joint trading accounts which are then invested in repurchase agreements. The Fund may also invest directly with institutions in repurchase agreements. Repurchase agreements are collateralized by government or non-government securities. Upon settlement date, collateral is held in segregated accounts with custodian banks and may be obtained in the event of a default of the counterparty. The Fund monitors, on a daily basis, the value of the collateral to ensure it is at least equal to the principal amount of the repurchase agreement (including accrued interest). In the event of a default by the counterparty, realization of the collateral proceeds could be delayed, during which time the value of the collateral may decline.
5. Purchases and Sales of Investments.
Purchases and sales of securities, other than short-term securities, aggregated $3,167,394,306 and $2,747,790,024, respectively.
6. Fees and Other Transactions with Affiliates.
Management Fee. FMR and its affiliates provide the Fund with investment management related services for which the Fund pays a monthly management fee. The management fee is the sum of an individual fund fee rate that is based on an annual rate of .45% of the Fund's average net assets and a group fee rate that averaged .26% during the period. The group fee rate is based upon the average net assets of all the mutual funds advised by FMR. The group fee rate decreases as assets under management increase and increases as assets under management decrease. In addition, the management fee is subject to a performance adjustment(up to a maximum of +/- .20% of the Fund's average net assets over a 36 month performance period). The upward or downward adjustment to the management fee is based on the relative investment performance of the retail class of the Fund, Canada as compared to an appropriate benchmark index. For the period, the total annual management fee rate, including the performance adjustment, was .76% of the Fund's average net assets.
Distribution and Service Plan. In accordance with Rule 12b-1 of the 1940 Act, the Fund has adopted separate Distribution and Service Plans for each class of shares. Certain classes pay Fidelity Distributors Corporation (FDC), an affiliate of FMR, separate Distribution and Service Fees, each of which is based on an annual percentage of each class' average net assets. In addition, FDC may pay financial intermediaries for selling shares of the Fund and providing shareholder support services. For the period, the Distribution and Service Fee rates and the total amounts paid to and retained by FDC were as follows:
| Distribution
Fee | Service
Fee | Paid to
FDC | Retained
by FDC |
Class A | 0% | .25% | $ 134,706 | $ 11,780 |
Class T | .25% | .25% | 94,298 | 591 |
Class B | .75% | .25% | 59,556 | 44,734 |
Class C | .75% | .25% | 187,498 | 129,911 |
| | | $ 476,058 | $ 187,016 |
Sales Load. FDC receives a front-end sales charge of up to 5.75% for selling Class A shares, and 3.50% for selling Class T shares, some of which is paid to financial intermediaries for selling shares of the Fund. FDC receives the proceeds of contingent deferred sales charges levied on Class A, Class T, Class B, and Class C redemptions. These charges depend on the holding period. The deferred sales charges range from 5% to 1% for Class B, 1% for Class C, 1.00% to .50% for certain purchases of Class A shares and .25% for certain purchases of Class T shares.
For the period, sales charge amounts retained by FDC were as follows:
| Retained
by FDC |
Class A | $ 153,357 |
Class T | 23,474 |
Class B* | 42,730 |
Class C* | 13,585 |
| $ 233,146 |
* When Class B and Class C shares are initially sold, FDC pays commissions from its own resources to financial intermediaries through which the sales are made.
Annual Report
6. Fees and Other Transactions with Affiliates - continued
Transfer Agent Fees. Fidelity Investments Institutional Operations Company, Inc. (FIIOC), an affiliate of FMR, is the transfer, dividend disbursing and shareholder servicing agent for each class of the Fund. FIIOC receives account fees and asset-based fees that vary according to the account size and type of account of the shareholders of the respective classes of the Fund. FIIOC pays for typesetting, printing and mailing of shareholder reports, except proxy statements. Prior to January 1, 2008, Fidelity Service Company, Inc. (FSC), also an affiliate of FMR, was the transfer agent for Canada. For the period, each class paid the following transfer agent fees:
| Amount | % of
Average
Net Assets |
Class A | $ 147,254 | .27 |
Class T | 58,242 | .31 |
Class B | 18,975 | .32 |
Class C | 58,666 | .31 |
Canada | 9,834,578 | .22 |
Institutional Class | 30,321 | .30 |
| $ 10,148,036 | |
Accounting and Security Lending Fees. FSC maintains the Fund's accounting records. The accounting fee is based on the level of average net assets for the month. Under a separate contract, FSC administers the security lending program. The security lending fee is based on the number and duration of lending transactions.
Brokerage Commissions. The Fund placed a portion of its portfolio transactions with brokerage firms which are affiliates of the investment adviser. The commissions paid to these affiliated firms were $774 for the period.
Interfund Lending Program. Pursuant to an Exemptive Order issued by the SEC, the Fund, along with other registered investment companies having management contracts with FMR, may participate in an interfund lending program. This program provides an alternative credit facility allowing the funds to borrow from, or lend money to, other participating affiliated funds. At period end, there were no interfund loans outstanding. The Fund's activity in this program during the period for which loans were outstanding was as follows:
Borrower or Lender | Average Daily
Loan Balance | Weighted Average Interest Rate | Interest
Expense |
Borrower | $ 36,021,500 | 4.23% | $ 8,474 |
7. Committed Line of Credit.
The Fund participates with other funds managed by FMR in a $4.2 billion credit facility (the "line of credit") to be utilized for temporary or emergency purposes to fund shareholder redemptions or for other short-term liquidity purposes. The Fund has agreed to pay commitment fees on its pro rata portion of the line of credit, which amounted to $9,367 and is reflected in Miscellaneous Expense on the Statement of Operations. During the period, there were no borrowings on this line of credit.
8. Security Lending.
The Fund lends portfolio securities from time to time in order to earn additional income. On the settlement date of the loan, the Fund receives collateral (in the form of U.S. Treasury obligations, letters of credit and/or cash) against the loaned securities and maintains collateral in an amount not less than 100% of the market value of the loaned securities during the period of the loan. The market value of the loaned securities is determined at the close of business of the Fund and any additional required collateral is delivered to the Fund on the next business day. If the borrower defaults on its obligation to return the securities loaned because of insolvency or other reasons, a fund could experience delays and costs in recovering the securities loaned or in gaining access to the collateral. Any cash collateral received is invested in the Fidelity Securities Lending Cash Central Fund. The value of loaned securities and cash collateral at period end are disclosed on the Fund's Statement of Assets and Liabilities. Security lending income represents the income earned on investing cash collateral, less fees and expenses associated with the loan, plus any premium payments that may be received on the loan of certain types of securities. Security lending income is presented in the Statement of Operations as a component of income from Fidelity Central Funds.
Annual Report
Canada
Notes to Financial Statements - continued
9. Expense Reductions.
FMR voluntarily agreed to reimburse a portion of Canada's operating expenses. During the period, this reimbursement reduced the class' expenses by $48,320.
Many of the brokers with whom FMR places trades on behalf of the Fund provided services to the Fund in addition to trade execution. These services included payments of certain expenses on behalf of the Fund totaling $1,316,221 for the period. In addition, through arrangements with the Fund's custodian and each class' transfer agent, credits realized as a result of uninvested cash balances were used to reduce the Fund's expenses. During the period, these credits reduced the Fund's custody expenses by $10,680. During the period, credits reduced each class' transfer agent expense as noted in the table below.
| Transfer Agent
expense reduction |
Canada | $ 39,451 |
10. Other.
The Fund's organizational documents provide former and current trustees and officers with a limited indemnification against liabilities arising in connection with the performance of their duties to the Fund. In the normal course of business, the Fund may also enter into contracts that provide general indemnifications. The Fund's maximum exposure under these arrangements is unknown as this would be dependent on future claims that may be made against the Fund. The risk of material loss from such claims is considered remote.
In December 2006, the Independent Trustees, with the assistance of independent counsel, completed an investigation regarding gifts, gratuities and business entertainment provided by certain brokers to certain individuals who were employed on FMR's domestic equity trading desk during the period 2002 to 2004. The Independent Trustees and FMR agreed that, despite the absence of proof that the Fidelity mutual funds experienced diminished execution quality as a result of the improper receipt of gifts and business entertainment, the conduct at issue was serious and was worthy of redress. Accordingly, the Independent Trustees requested, and FMR agreed to make, a payment of $42 million plus accrued interest, which equaled approximately $7.3 million, to certain Fidelity mutual funds.
In March 2008, the Trustees approved a method for allocating this payment among the funds and, in total, FMR paid the fund $1,279, which is recorded in the accompanying Statement of Operations.
In a related administrative order dated March 5, 2008, the U.S. Securities and Exchange Commission ("SEC") announced a settlement with FMR and FMR Co., Inc. (an affiliate of FMR) involving the SEC's regulatory rules for investment advisers and the improper receipt of gifts, gratuities and business entertainment. Without admitting or denying the SEC's findings, FMR agreed to pay an $8 million civil penalty to the United States Treasury.
11. Distributions to Shareholders.
Distributions to shareholders of each class were as follows:
Years ended October 31, | 2008 | 2007 |
From net investment income | | |
Class A | $ 171,586 | $ - |
Class T | 73,859 | - |
Class B | 8,835 | - |
Class C | 45,389 | - |
Canada | 28,579,259 | 22,989,617 |
Institutional Class | 37,051 | - |
Total | $ 28,915,979 | $ 22,989,617 |
From net realized gain | | |
Class A | $ 1,361,853 | $ - |
Class T | 736,334 | - |
Class B | 209,359 | - |
Class C | 549,710 | - |
Canada | 231,896,136 | 65,775,827 |
Institutional Class | 269,238 | - |
Total | $ 235,022,630 | $ 65,775,827 |
Annual Report
12. Share Transactions.
Transactions for each class of shares were as follows:
| Shares | Dollars |
Years ended October 31, | 2008 | 2007 A | 2008 | 2007 A |
Class A | | | | |
Shares sold | 1,623,645 | 308,956 | $ 96,358,055 | $ 19,422,841 |
Reinvestment of distributions | 24,107 | - | 1,454,159 | - |
Shares redeemed | (473,393) | (10,905) | (24,545,534) | (645,019) |
Net increase (decrease) | 1,174,359 | 298,051 | $ 73,266,680 | $ 18,777,822 |
Class T | | | | |
Shares sold | 281,102 | 208,648 | $ 16,813,582 | $ 12,838,431 |
Reinvestment of distributions | 13,222 | - | 797,422 | - |
Shares redeemed | (108,759) | (1,454) | (5,550,777) | (89,047) |
Net increase (decrease) | 185,565 | 207,194 | $ 12,060,227 | $ 12,749,384 |
Class B | | | | |
Shares sold | 143,582 | 110,050 | $ 8,590,562 | $ 6,654,427 |
Reinvestment of distributions | 2,917 | - | 175,839 | - |
Shares redeemed | (56,743) | (51,696) | (3,089,676) | (3,069,986) |
Net increase (decrease) | 89,756 | 58,354 | $ 5,676,725 | $ 3,584,441 |
Class C | | | | |
Shares sold | 454,502 | 134,518 | $ 27,139,418 | $ 8,317,609 |
Reinvestment of distributions | 8,472 | - | 509,854 | - |
Shares redeemed | (146,400) | (9,336) | (7,449,898) | (570,425) |
Net increase (decrease) | 316,574 | 125,182 | $ 20,199,374 | $ 7,747,184 |
Canada | | | | |
Shares sold | 34,673,241 | 32,853,429 | $ 2,070,491,480 | $ 1,882,759,894 |
Reinvestment of distributions | 3,970,249 | 1,757,370 | 239,922,156 | 85,654,201 |
Shares redeemed | (35,906,020) | (28,386,777) | (1,927,559,508) | (1,547,811,990) |
Net increase (decrease) | 2,737,470 | 6,224,022 | $ 382,854,128 | $ 420,602,105 |
Institutional Class | | | | |
Shares sold | 377,605 | 61,781 | $ 22,481,855 | $ 3,830,515 |
Reinvestment of distributions | 4,721 | - | 285,066 | - |
Shares redeemed | (208,616) | (3,937) | (9,811,769) | (234,902) |
Net increase (decrease) | 173,710 | 57,844 | $ 12,955,152 | $ 3,595,613 |
A Share transactions for Class A, Class T, Class B, Class C and Institutional Class are for the period May 2, 2007 (commencement of sale of shares) to October 31, 2007.
Annual Report
Report of Independent Registered Public Accounting Firm
To the Trustees of Fidelity Investment Trust and the Shareholders of Fidelity Canada Fund:
In our opinion, the accompanying statement of assets and liabilities, including the schedule of investments, and the related statements of operations and of changes in net assets and the financial highlights present fairly, in all material respects, the financial position of Fidelity Canada Fund (a fund of Fidelity Investment Trust) at October 31, 2008, the results of its operations for the year then ended, the changes in its net assets for each of the two years in the period then ended and the financial highlights for each of the periods indicated, in conformity with accounting principles generally accepted in the United States of America. These financial statements and financial highlights (hereafter referred to as "financial statements") are the responsibility of the Fidelity Canada Fund's management. Our responsibility is to express an opinion on these financial statements based on our audits. We conducted our audits of these financial statements in accordance with the standards of the Public Company Accounting Oversight Board (United States). Those standards require that we plan and perform the audit to obtain reasonable assurance about whether the financial statements are free of material misstatement. An audit includes examining, on a test basis, evidence supporting the amounts and disclosures in the financial statements, assessing the accounting principles used and significant estimates made by management, and evaluating the overall financial statement presentation. We believe that our audits, which included confirmation of securities at October 31, 2008 by correspondence with the custodian and brokers, provide a reasonable basis for our opinion.
/s/ PricewaterhouseCoopers LLP
PricewaterhouseCoopers LLP
Boston, Massachusetts
December 23, 2008
Annual Report
The Trustees, Member of the Advisory Board, and executive officers of the trust and fund, as applicable, are listed below. The Board of Trustees governs the fund and is responsible for protecting the interests of shareholders. The Trustees are experienced executives who meet periodically throughout the year to oversee the fund's activities, review contractual arrangements with companies that provide services to the fund, and review the fund's performance. Except for Edward C. Johnson 3d and James C. Curvey, each of the Trustees oversees 220 funds advised by FMR or an affiliate. Messrs. Johnson and Curvey oversee 379 funds advised by FMR or an affiliate.
The Trustees hold office without limit in time except that (a) any Trustee may resign; (b) any Trustee may be removed by written instrument, signed by at least two-thirds of the number of Trustees prior to such removal; (c) any Trustee who requests to be retired or who has become incapacitated by illness or injury may be retired by written instrument signed by a majority of the other Trustees; and (d) any Trustee may be removed at any special meeting of shareholders by a two-thirds vote of the outstanding voting securities of the trust. Each Trustee who is not an interested person (as defined in the 1940 Act) (Independent Trustee), shall retire not later than the last day of the calendar year in which his or her 72nd birthday occurs. The Independent Trustees may waive this mandatory retirement age policy with respect to individual Trustees. The executive officers and Advisory Board Member hold office without limit in time, except that any officer and Advisory Board Member may resign or may be removed by a vote of a majority of the Trustees at any regular meeting or any special meeting of the Trustees. Except as indicated, each individual has held the office shown or other offices in the same company for the past five years.
The fund's Statement of Additional Information (SAI) includes more information about the Trustees. To request a free copy call Fidelity at 1-877-208-0098.
Interested Trustees*:
Correspondence intended for each Trustee who is an interested person may be sent to Fidelity Investments, 82 Devonshire Street, Boston, Massachusetts 02109.
Name, Age; Principal Occupation |
Edward C. Johnson 3d (78) |
| Year of Election or Appointment: 1984 Mr. Johnson is Chairman of the Board of Trustees. Mr. Johnson serves as Chief Executive Officer, Chairman, and a Director of FMR LLC; Chairman and a Director of FMR; Chairman and a Director of Fidelity Research & Analysis Company (FRAC); Chairman and a Director of Fidelity Investments Money Management, Inc.; and Chairman and a Director of FMR Co., Inc. In addition, Mr. Johnson serves as Chairman and Director of FIL Limited. Previously, Mr. Johnson served as President of FMR LLC (2006-2007). |
James C. Curvey (73) |
| Year of Election or Appointment: 2007 Mr. Curvey also serves as Trustee (2007-present) of other investment companies advised by FMR. Mr. Curvey is a Director of FMR and FMR Co., Inc. (2007-present). Mr. Curvey is also Vice Chairman (2006-present) and Director of FMR LLC. In addition, Mr. Curvey serves as an Overseer for the Boston Symphony Orchestra and a member of the Trustees of Villanova University. |
* Trustees have been determined to be "Interested Trustees" by virtue of, among other things, their affiliation with the trust or various entities under common control with FMR. FMR Corp. merged with and into FMR LLC on October 1, 2007. Any references to FMR LLC for prior periods are deemed to be references to the prior entity.
Independent Trustees:
Correspondence intended for each Independent Trustee (that is, the Trustees other than the Interested Trustees) may be sent to Fidelity Investments, P.O. Box 55235, Boston, Massachusetts 02205-5235.
Name, Age; Principal Occupation |
Dennis J. Dirks (60) |
| Year of Election or Appointment: 2005 Prior to his retirement in May 2003, Mr. Dirks was Chief Operating Officer and a member of the Board of The Depository Trust & Clearing Corporation (DTCC) (1999-2003). He also served as President, Chief Operating Officer, and Board member of The Depository Trust Company (DTC) (1999-2003) and President and Board member of the National Securities Clearing Corporation (NSCC) (1999-2003). In addition, Mr. Dirks served as a Trustee and a member of the Finance Committee of Manhattan College (2005-2008), and as Chief Executive Officer and Board member of the Government Securities Clearing Corporation (2001-2003) and Chief Executive Officer and Board member of the Mortgage-Backed Securities Clearing Corporation (2001-2003). Mr. Dirks also serves as a Trustee and a member of the Finance Committee of AHRC of Nassau County (2006-present). |
Alan J. Lacy (55) |
| Year of Election or Appointment: 2008 Mr. Lacy serves as Senior Adviser (2007-present) of Oak Hill Capital Partners, L.P. (a private equity firm). Mr. Lacy also served as Chief Executive Officer (2000-2005) and Vice Chairman (2005-2006) of Sears Holdings Corporation and Sears, Roebuck and Co. (retail). In addition, Mr. Lacy serves as a member of the Board of Directors of The Western Union Company (global money transfer, 2006-present) and Bristol-Myers Squibb (global pharmaceuticals, 2007-present). Mr. Lacy is a Trustee of the National Parks Conservation Association and The Field Museum of Natural History. |
Ned C. Lautenbach (64) |
| Year of Election or Appointment: 2000 Mr. Lautenbach is Chairman of the Independent Trustees (2006-present). Mr. Lautenbach is an Advisory Partner of Clayton, Dubilier & Rice, Inc. (private equity investment firm). Previously, Mr. Lautenbach was with the International Business Machines Corporation (IBM) from 1968 until his retirement in 1998. Mr. Lautenbach serves as a Director of Eaton Corporation (diversified industrial) as well as the Philharmonic Center for the Arts in Naples, Florida. He also is a member of the Board of Trustees of Fairfield University (2005-present), as well as a member of the Council on Foreign Relations. Previously, Mr. Lautenbach served as a Director of Sony Corporation (2006-2007). |
Joseph Mauriello (64) |
| Year of Election or Appointment: 2008 Prior to his retirement in January 2006, Mr. Mauriello served in numerous senior management positions including Deputy Chairman and Chief Operating Officer (2004-2005), and Vice Chairman of Financial Services (2002-2004) of KPMG LLP US (professional services firm, 1965-2005). Mr. Mauriello currently serves as a member of the Board of Directors of XL Capital Ltd. (global insurance and re-insurance company, 2006-present) and of Arcadia Resources Inc. (health care services and products, 2007-
present). He also served as a Director of the Hamilton Funds of the Bank of New York (2006-2007). |
Cornelia M. Small (64) |
| Year of Election or Appointment: 2005 Ms. Small is a member of the Investment Committee, and Chair (2008-present) and a member of the Board of Trustees of Smith College. Ms. Small also serves on the Investment Committee of the Berkshire Taconic Community Foundation (2008-present). Previously, Ms. Small served as Chairperson of the Investment Committee (2002-2008) of Smith College and as Co-Chair (2000-
2003) of the Annual Fund for the Fletcher School of Law and Diplomacy. In addition, she served as Chief Investment Officer, Director of Global Equity Investments, and a member of the Board of Directors of Scudder, Stevens & Clark and Scudder Kemper Investments. |
William S. Stavropoulos (69) |
| Year of Election or Appointment: 2001 Mr. Stavropoulos is Chairman Emeritus of the Board of Directors of The Dow Chemical Company, where he previously served in numerous senior management positions, including President (1993-2000; 2002-2003), CEO (1995-2000; 2002-2004), Chairman of the Executive Committee (2000-2006), and as a member of the Board of Directors (1990-2006). Currently, he is a Director of Teradata Corporation (data warehousing and technology solutions, 2008-present), Chemical Financial Corporation, Maersk Inc. (industrial conglomerate), Tyco International, Inc. (multinational manufacturing and services, 2007-present), and a member of the Advisory Board for Metalmark Capital (private equity investment firm, 2005-present). He is a special advisor to Clayton, Dubilier & Rice, Inc. (private equity investment). In addition, Mr. Stavropoulos is a member of the University of Notre Dame Advisory Council for the College of Science. |
David M. Thomas (59) |
| Year of Election or Appointment: 2008 Previously, Mr. Thomas served as Executive Chairman (2005-2006) and Chairman and Chief Executive Officer (2000-2005) of IMS Health, Inc. (pharmaceutical and healthcare information solutions). In addition, Mr. Thomas serves as a member of the Board of Directors of Fortune Brands, Inc. (consumer products holding company), and Interpublic Group of Companies, Inc. (marketing communication, 2004-present). |
Michael E. Wiley (58) |
| Year of Election or Appointment: 2008 Mr. Wiley also serves as a member of the Board of Trustees of the University of Tulsa (2000-2006; 2007-present). He serves as a Director of Tesoro Corporation (independent oil refiner and marketer, 2005-present), and a Director of Bill Barrett Corporation (exploration and production company, 2005-present). In addition, he also serves as a Director of Post Oak Bank (privately-held bank, 2004-present). Previously, Mr. Wiley served as a Sr. Energy Advisor of Katzenbach Partners, LLC (consulting firm, 2006-2007), as an Advisory Director of Riverstone Holdings (private investment firm), Chairman, President, and CEO of Baker Hughes, Inc. (oilfield services company, 2000-2004), and as Director of Spinnaker Exploration Company (exploration and production company, 2001-2005). |
Annual Report
Trustees and Officers - continued
Advisory Board Member and Executive Officers**:
Correspondence intended for each executive officer and Mr. Lynch may be sent to Fidelity Investments, 82 Devonshire Street, Boston, Massachusetts 02109.
Name, Age; Principal Occupation |
Peter S. Lynch (64) |
| Year of Election or Appointment: 2003 Member of the Advisory Board of Fidelity's Equity and High Income Funds. Mr. Lynch is Vice Chairman and a Director of FMR, and Vice Chairman (2001-present) and a Director of FMR Co., Inc. Previously, Mr. Lynch served as a Trustee of the Fidelity funds (1990-2003). In addition, he serves as a Trustee of Boston College and as the Chairman of the Inner-City Scholarship Fund. Previously, Mr. Lynch served on the Special Olympics International Board of Directors (1997-2006). |
Kenneth B. Robins (39) |
| Year of Election or Appointment: 2008 President and Treasurer of Fidelity's Equity and High Income Funds. Mr. Robins is an employee of Fidelity Investments (2004-
present). Before joining Fidelity Investments, Mr. Robins worked at KPMG LLP, where he was a partner in KPMG's department of professional practice (2002-2004). |
Walter C. Donovan (46) |
| Year of Election or Appointment: 2007 Vice President of Fidelity's Equity Funds. Mr. Donovan also serves as President of FMR and FMR Co., Inc., and Executive Vice President of Fidelity Investments Money Management, Inc. (2007-present). Previously, Mr. Donovan served as Executive Vice President of FMR and FMR Co., Inc. (2005-2007) and Senior Vice President of FMR (2003-2005) and FMR Co., Inc. (2004-2005). |
Eric M. Wetlaufer (46) |
| Year of Election or Appointment: 2006 Vice President of Fidelity's International Equity Funds. Mr. Wetlaufer also serves as Group Chief Investment Officer of FMR. Mr. Wetlaufer is Chairman, Chief Executive Officer, and President of Fidelity Management & Research (Hong Kong) Limited (2008-present); Chairman, Chief Executive Officer, President, and a Director of Fidelity Management & Research (Japan) Inc. (2008-present); Chairman and Chief Executive Officer (2007-present) and President and a Director (2006-present) of Fidelity Management & Research (U.K.) Inc. and President and a Director of Fidelity Research & Analysis Company (2006-present). Before joining Fidelity Investments in 2005, Mr. Wetlaufer was a partner in Oxhead Capital Management (2004-2005) and a Chief Investment Officer of Putnam Investments (1997-2003). |
Scott C. Goebel (40) |
| Year of Election or Appointment: 2008 Secretary and Chief Legal Officer (CLO) of the Fidelity funds. Mr. Goebel also serves as General Counsel, Secretary, and Senior Vice President of FMR (2008-present); Deputy General Counsel of FMR LLC; Chief Legal Secretary of Fidelity Management & Research (Hong Kong) Limited (2008-present) and Assistant Secretary of Fidelity Management & Research (Japan) Inc. (2008-
present). Previously, Mr. Goebel served as Assistant Secretary of the Funds (2007-2008) and as Vice President and Secretary of Fidelity Distributors Corporation (FDC) (2005-2007). |
John B. McGinty, Jr. (46) |
| Year of Election or Appointment: 2008 Assistant Secretary of Fidelity's Equity and High Income Funds. Mr. McGinty is an employee of Fidelity Investments (2004-present). Mr. McGinty also serves as Senior Vice President, Secretary, and Chief Legal Officer of [Fidelity Distributors Corporation (FDC)/FDC] (2007-present). Before joining Fidelity Investments, Mr. McGinty practiced law at Ropes & Gray, LLP. |
Holly C. Laurent (54) |
| Year of Election or Appointment: 2008 Anti-Money Laundering (AML) Officer of the Fidelity funds. Ms. Laurent is an employee of Fidelity Investments. Previously, Ms. Laurent was Senior Vice President and Head of Legal for Fidelity Business Services India Pvt. Ltd. (2006-2008), Senior Vice President, Deputy General Counsel and Group Head for FMR LLC (2005-2006). |
Christine Reynolds (50) |
| Year of Election or Appointment: 2008 Chief Financial Officer of the Fidelity funds. Ms. Reynolds became President of Fidelity Pricing and Cash Management Services (FPCMS) in August 2008. She served as Chief Operating Officer of FPCMS from 2007 through July 2008. Previously, Ms. Reynolds served as President, Treasurer, and Anti-Money Laundering officer of the Fidelity funds (2004-2007). Before joining Fidelity Investments, Ms. Reynolds worked at PricewaterhouseCoopers LLP (PwC) (1980-2002), where she was an audit partner with PwC's investment management practice. |
Kenneth A. Rathgeber (61) |
| Year of Election or Appointment: 2004 Chief Compliance Officer of Fidelity's Equity and High Income Funds. Mr. Rathgeber is Chief Compliance Officer of Fidelity Management & Research (Hong Kong) Limited (2008-present), Fidelity Management & Research (Japan) Inc. (2008-present), FMR (2005-present), FMR Co., Inc. (2005-present), Fidelity Management & Research (U.K.) Inc. (2005-present), Fidelity Research & Analysis Company (2005-present), Fidelity Investments Money Management, Inc. (2005-present), and Strategic Advisers, Inc. (2005-present). |
Bryan A. Mehrmann (47) |
| Year of Election or Appointment: 2005 Deputy Treasurer of the Fidelity funds. Mr. Mehrmann is an employee of Fidelity Investments. Previously, Mr. Mehrmann served as Vice President of Fidelity Investments Institutional Services Group (FIIS)/Fidelity Investments Institutional Operations Corporation, Inc. (FIIOC) Client Services (1998-2004). |
Adrien E. Deberghes (41) |
| Year of Election or Appointment: 2008 Deputy Treasurer of Fidelity's Equity and High Income Funds. Mr. Deberghes is an employee of Fidelity Investments (2008-present). Previously, Mr. Deberghes served as Senior Vice President of Mutual Fund Administration at State Street Corporation (2007-2008), Senior Director of Mutual Fund Administration at Investors Bank & Trust (2005-2007), and Director of Finance for Dunkin' Brands (2000-2005). |
Robert G. Byrnes (41) |
| Year of Election or Appointment: 2005 Assistant Treasurer of the Fidelity funds. Mr. Byrnes is an employee of Fidelity Investments (2005-present). Previously, Mr. Byrnes served as Vice President of Fidelity Pricing and Cash Management Services (FPCMS) (2003-2005). Before joining Fidelity Investments, Mr. Byrnes worked at Deutsche Asset Management where he served as Vice President of the Investment Operations Group (2000-2003). |
Peter L. Lydecker (54) |
| Year of Election or Appointment: 2004 Assistant Treasurer of the Fidelity funds. Mr. Lydecker is an employee of Fidelity Investments. |
Paul M. Murphy (61) |
| Year of Election or Appointment: 2007 Assistant Treasurer of the Fidelity funds. Mr. Murphy is an employee of Fidelity Investments (2007-present). Previously, Mr. Murphy served as Chief Financial Officer of the Fidelity Funds (2005-2006), Vice President and Associate General Counsel of FMR (2007), and Senior Vice President of Fidelity Pricing and Cash Management Services (FPCMS) (1994-2007). |
Gary W. Ryan (50) |
| Year of Election or Appointment: 2005 Assistant Treasurer of the Fidelity funds. Mr. Ryan is an employee of Fidelity Investments. Previously, Mr. Ryan served as Vice President of Fund Reporting in Fidelity Pricing and Cash Management Services (FPCMS) (1999-2005). |
** FMR Corp. merged with and into FMR LLC on October 1, 2007. Any references to FMR LLC for prior periods are deemed to be references to the prior entity.
Annual Report
Class A designates 18%, Class T designates 20%, Class B designates 24% and Class C designates 21% of the dividends distributed during the fiscal year as amounts which may be taken into account as a dividend for purposes of the maximum rate under section 1(h)(11) of the Internal Revenue Code.
The amounts per share which represent income derived from sources within, and taxes paid to, foreign countries or possessions of the United States are as follows:
| Pay Date | Income | Taxes |
Class A | 12/10/07 | $.756 | $.106 |
Class T | 12/10/07 | $.70 | $.106 |
Class B | 12/10/07 | $.574 | $.106 |
Class C | 12/10/07 | $.661 | $.106 |
The fund will notify shareholders in January 2009 of amounts for use in preparing 2008 income tax returns.
Annual Report
A special meeting of the fund's shareholders was held on December 13, 2007. The results of votes taken among shareholders on the proposals before them are reported below. Each vote reported represents one dollar of net asset value held on the record date for the meeting.
PROPOSAL 1 |
To amend the Declaration of Trust to reduce the required quorum for shareholder meetings.A |
| # of
Votes | % of
Votes |
Affirmative | 45,014,793,255.82 | 80.372 |
Against | 6,871,112,667.08 | 12.268 |
Abstain | 2,163,456,438.02 | 3.863 |
Broker Non-Votes | 1,958,633,563.89 | 3.497 |
TOTAL | 56,007,995,924.81 | 100.000 |
PROPOSAL 2 |
To elect the nominees specified below as Trustees.A |
| # of
Votes | % of
Votes |
James C. Curvey |
Affirmative | 53,384,952,361.03 | 95.317 |
Withheld | 2,623,043,563.78 | 4.683 |
TOTAL | 56,007,995,924.81 | 100.000 |
Dennis J. Dirks |
Affirmative | 53,595,104,608.67 | 95.692 |
Withheld | 2,412,891,316.14 | 4.308 |
TOTAL | 56,007,995,924.81 | 100.000 |
Albert R. Gamper, Jr. |
Affirmative | 53,570,235,221.69 | 95.647 |
Withheld | 2,437,760,703.12 | 4.353 |
TOTAL | 56,007,995,924.81 | 100.000 |
George H. Heilmeier |
Affirmative | 53,166,350,588.50 | 94.926 |
Withheld | 2,841,645,336.31 | 5.074 |
TOTAL | 56,007,995,924.81 | 100.000 |
Edward C. Johnson 3d |
Affirmative | 53,230,508,654.93 | 95.041 |
Withheld | 2,777,487,269.88 | 4.959 |
TOTAL | 56,007,995,924.81 | 100.000 |
James H. Keyes |
Affirmative | 53,549,161,456.52 | 95.610 |
Withheld | 2,458,834,468.29 | 4.390 |
TOTAL | 56,007,995,924.81 | 100.000 |
Marie L. Knowles |
Affirmative | 53,543,925,066.86 | 95.601 |
Withheld | 2,464,070,857.95 | 4.399 |
TOTAL | 56,007,995,924.81 | 100.000 |
Ned C. Lautenbach |
Affirmative | 53,547,116,322.50 | 95.606 |
Withheld | 2,460,879,602.31 | 4.394 |
TOTAL | 56,007,995,924.81 | 100.000 |
| # of
Votes | % of
Votes |
Cornelia M. Small |
Affirmative | 53,564,793,514.25 | 95.638 |
Withheld | 2,443,202,410.56 | 4.362 |
TOTAL | 56,007,995,924.81 | 100.000 |
William S. Stavropoulos |
Affirmative | 53,426,544,502.76 | 95.391 |
Withheld | 2,581,451,422.05 | 4.609 |
TOTAL | 56,007,995,924.81 | 100.000 |
Kenneth L. Wolfe |
Affirmative | 53,229,881,790.63 | 95.040 |
Withheld | 2,778,114,134.18 | 4.960 |
TOTAL | 56,007,995,924.81 | 100.000 |
A Denotes trust-wide proposal and voting results.
Semiannual Report
Proxy Voting Results
A special meeting of the fund's shareholders was held on April 16, 2008. The results of votes taken among shareholders on the proposals before them are reported below. Each vote reported represents one dollar of net asset value held on the record date for the meeting.
PROPOSAL 1 |
To elect a Board of Trustees.A |
| # of
Votes | % of
Votes |
James C. Curvey |
Affirmative | 44,485,656,811.55 | 94.702 |
Withheld | 2,488,551,854.62 | 5.298 |
TOTAL | 46,974,208,666.17 | 100.000 |
Dennis J. Dirks |
Affirmative | 44,706,671,638.31 | 95.173 |
Withheld | 2,267,537,027.86 | 4.827 |
TOTAL | 46,974,208,666.17 | 100.000 |
Edward C. Johnson 3d |
Affirmative | 44,294,881,638.16 | 94.296 |
Withheld | 2,679,327,028.01 | 5.704 |
TOTAL | 46,974,208,666.17 | 100.000 |
Alan J. Lacy |
Affirmative | 44,685,373,413.16 | 95.127 |
Withheld | 2,288,835,253.01 | 4.873 |
TOTAL | 46,974,208,666.17 | 100.000 |
Ned C. Lautenbach |
Affirmative | 44,634,541,379.41 | 95.019 |
Withheld | 2,339,667,286.76 | 4.981 |
TOTAL | 46,974,208,666.17 | 100.000 |
Joseph Mauriello |
Affirmative | 44,683,962,099.80 | 95.124 |
Withheld | 2,290,246,566.37 | 4.876 |
TOTAL | 46,974,208,666.17 | 100.000 |
Cornelia M. Small |
Affirmative | 44,671,688,375.36 | 95.098 |
Withheld | 2,302,520,290.81 | 4.902 |
TOTAL | 46,974,208,666.17 | 100.000 |
William S. Stavropoulos |
Affirmative | 44,465,262,087.61 | 94.659 |
Withheld | 2,508,946,578.56 | 5.341 |
TOTAL | 46,974,208,666.17 | 100.000 |
David M. Thomas |
Affirmative | 44,694,340,813.87 | 95.147 |
Withheld | 2,279,867,852.30 | 4.853 |
TOTAL | 46,974,208,666.17 | 100.000 |
Michael E. Wiley |
Affirmative | 44,686,513,174.78 | 95.130 |
Withheld | 2,287,695,491.39 | 4.870 |
TOTAL | 46,974,208,666.17 | 100.000 |
PROPOSAL 5 |
Shareholder proposal for Fidelity Canada Fund concerning "oversight procedures to screen out investments in companies that, in the judgement of the Board, substantially contribute to genocide, patterns of extraordinary and egregious violations of human rights, or crimes against humanity." |
| # of
Votes | % of
Votes |
Affirmative | 545,276,762.04 | 23.721 |
Against | 1,445,066,492.42 | 62.863 |
Abstain | 112,739,966.65 | 4.905 |
Broker Non-Votes | 195,653,438.02 | 8.511 |
TOTAL | 2,298,736,659.13 | 100.000 |
A Denotes trust-wide proposal and voting results.
Annual Report
Board Approval of Investment Advisory Contracts and Management Fees
Fidelity Canada Fund
Each year, typically in July, the Board of Trustees, including the Independent Trustees (together, the Board), votes on the renewal of the management contract and sub-advisory agreements (together, the Advisory Contracts) for the fund. The Board, assisted by the advice of fund counsel and Independent Trustees' counsel, requests and considers a broad range of information throughout the year.
The Board meets regularly and, acting directly and through its separate committees, requests and receives information concerning, and considers at each of its meetings factors that are relevant to, its annual consideration of the renewal of the fund's Advisory Contracts, including the services and support provided to the fund and its shareholders. At the time of the renewal, the Board had 12 standing committees, each composed of Independent Trustees with varying backgrounds, to which the Board has assigned specific subject matter responsibilities in order to enhance effective decision-making by the Board. Each committee has a written charter outlining the structure and purposes of the committee. The Board also meets as needed to consider matters specifically related to the Board's annual consideration of the renewal of Advisory Contracts.
At its July 2008 meeting, the Board of Trustees, including the Independent Trustees, unanimously determined to renew each fund's Advisory Contracts. In reaching its determination, the Board considered all factors it believed relevant, including (i) the nature, extent, and quality of the services to be provided to the fund and its shareholders (including the investment performance of the fund); (ii) the competitiveness of each fund's management fee and total expenses; (iii) the total costs of the services to be provided by and the profits to be realized by Fidelity from its relationship with the fund; (iv) the extent to which economies of scale would be realized as the fund grows; and (v) whether fee levels reflect these economies of scale, if any, for the benefit of fund shareholders. The Board also approved agreements with foreign sub-advisers Fidelity Management & Research (Japan) Inc. and Fidelity Management & Research (Hong Kong) Limited, as well as amendments to the fund's agreement with Fidelity Management & Research (U.K.) Inc.
In considering whether to renew the Advisory Contracts for the fund, the Board ultimately reached a determination, with the assistance of fund counsel and Independent Trustees' counsel and through the exercise of its business judgment, that the renewal of the Advisory Contracts and the compensation to be received by Fidelity under the management contract is consistent with Fidelity's fiduciary duty under applicable law. The Board's decision to renew the Advisory Contracts was not based on any single factor noted above, but rather was based on a comprehensive consideration of all the information provided to the Board at its meetings throughout the year. The Board, in reaching its determination to renew the Advisory Contracts, is aware that shareholders in the fund have a broad range of investment choices available to them, including a wide choice among mutual funds offered by competitors to Fidelity, and that the fund's shareholders, with the opportunity to review and weigh the disclosure provided by the fund in its prospectus and other public disclosures, have chosen to invest in this fund, managed by Fidelity.
Nature, Extent, and Quality of Services Provided. The Board considered staffing within the investment adviser, FMR, and the sub-advisers (together, the Investment Advisers), including the backgrounds of the fund's investment personnel and the fund's investment objective and discipline. The Independent Trustees also had discussions with senior management of Fidelity's investment operations and investment groups. The Board considered the structure of the portfolio manager compensation program and whether this structure provides appropriate incentives.
Resources Dedicated to Investment Management and Support Services. The Board reviewed the size, education, and experience of the Investment Advisers' investment staff, their use of technology, and the Investment Advisers' approach to recruiting, training, and retaining portfolio managers and other research, advisory, and management personnel. The Board noted that Fidelity's analysts have access to a variety of technological tools that enable them to perform both fundamental and quantitative analysis and to specialize in various disciplines. The Board considered Fidelity's extensive global research capabilities that enable the Investment Advisers to aggregate data from various sources in an effort to produce positive investment results. The Board also considered that Fidelity's portfolio managers and analysts have access to daily portfolio attribution that allows for monitoring of a fund's portfolio, as well as an electronic communication system that provides immediate real-time access to research concerning issuers and credit enhancers.
Shareholder and Administrative Services. The Board considered (i) the nature, extent, quality, and cost of advisory, administrative, distribution, and shareholder services performed by the Investment Advisers and their affiliates under the Advisory Contracts and under separate agreements covering transfer agency, pricing and bookkeeping, and securities lending services for the fund; (ii) the nature and extent of the Investment Advisers' supervision of third party service providers, principally custodians and subcustodians; and (iii) the resources devoted to, and the record of compliance with, the fund's compliance policies and procedures. The Board also reviewed the allocation of fund brokerage, including allocations to brokers affiliated with the Investment Advisers, the use of brokerage commissions to pay fund expenses, and the use of "soft" commission dollars to pay for research services. The Board further considered that Fidelity voluntarily pays for market data out of its own resources.
The Board noted that the growth of fund assets across the complex allows Fidelity to reinvest in the development of services designed to enhance the value or convenience of the Fidelity funds as investment vehicles. These services include 24 hour access to account information and market information through phone representatives and over the Internet, and investor education materials and asset allocation tools.
Investment in a Large Fund Family. The Board considered the benefits to shareholders of investing in a Fidelity fund, including the benefits of investing in a fund that is part of a large family of funds offering a variety of investment disciplines and providing for a large variety of mutual fund investor services. For example, fund shareholders are offered the privilege of exchanging shares of the fund for shares of other Fidelity funds, as set forth in the fund's prospectus, without paying a sales charge. The Board noted that Fidelity has taken a number of actions over the previous year that benefited particular funds, including (i) dedicating additional resources to investment research and to restructure the investment research teams; (ii) contractually agreeing to reduce the management fees on Fidelity's Institutional Money Market Funds and launching Class IV and Institutional Class of certain of these funds; (iii) reducing the transfer agent fees for the Fidelity Select Portfolios and Investor Class of the VIP funds; and (iv) launching Class K of 29 equity funds as a lower-fee class available to certain employer-sponsored retirement plans.
Annual Report
Board Approval of Investment Advisory Contracts and Management Fees - continued
Investment Performance. The Board considered whether the fund has operated within its investment objective, as well as its record of compliance with its investment restrictions. It also reviewed the fund's absolute investment performance for Fidelity Canada (retail class), as well as the fund's relative investment performance for Fidelity Canada (retail class) measured against a broad-based securities market index over multiple periods. The Board noted that FMR does not believe that a meaningful peer group exists against which to compare the fund's performance. The following charts considered by the Board show, over the one-, three-, and five-year periods ended December 31, 2007, the cumulative total returns of Fidelity Canada (retail class) of the fund and the cumulative total returns of a broad-based securities market index ("benchmark"). (The Advisor classes of the fund had less than one year of performance as of December 31, 2007.)
Fidelity Canada Fund

The Board stated that the investment performance of Fidelity Canada (retail class) of the fund compared favorably to its benchmark for all the periods shown.
The Board also considered that the fund's management fee is subject to upward or downward adjustment depending upon whether, and to what extent, the fund's investment performance for the performance period exceeds, or is exceeded by, the record (over the same period) of a Board-approved performance adjustment index. The Board realizes that the performance adjustment provides FMR with a strong economic incentive to seek to achieve superior performance for the fund's shareholders and helps to more closely align the interests of FMR and the fund's shareholders.
The Board considered that FMR has taken steps to refocus and strengthen equity research, equity portfolio management, and compliance.
Based on its review, and giving particular weight to the nature and quality of the resources dedicated by the Investment Advisers to maintain and improve relative performance, the Board concluded that the nature, extent, and quality of the services provided to the fund will benefit the fund's shareholders, particularly in light of the Board's view that the fund's shareholders benefit from investing in a fund that is part of a large family of funds offering a variety of investment disciplines and services.
Competitiveness of Management Fee and Total Fund Expenses. The Board considered the fund's management fee and total expenses compared to "mapped groups" of competitive funds and classes. Fidelity creates "mapped groups" by combining similar Lipper investment objective categories that have comparable management fee characteristics. Combining Lipper investment objective categories aids the Board's management fee and total expense comparisons by broadening the competitive group used for comparison and by reducing the number of universes to which various Fidelity funds are compared. The Board also considered supplemental information about how the fund's management fee and total expenses ranked relative to groups based on Lipper classifications, which take into account a fund's market capitalization and style.
Annual Report
The Board considered two proprietary management fee comparisons for the 12-month periods shown in the chart below. The group of Lipper funds used by the Board for management fee comparisons is referred to below as the "Total Mapped Group." The Total Mapped Group comparison focuses on a fund's standing relative to the total universe of comparable funds available to investors, in terms of gross management fees before expense reimbursements or caps, and without giving effect to the fund's performance adjustment. "TMG %" represents the percentage of funds in the Total Mapped Group that had management fees that were lower than the fund's. For example, a TMG % of 14% means that 86% of the funds in the Total Mapped Group had higher management fees than the fund. The "Asset-Size Peer Group" (ASPG) comparison focuses on a fund's standing relative to non-Fidelity funds similar in size to the fund within the Total Mapped Group. The ASPG represents at least 15% of the funds in the Total Mapped Group with comparable asset size and management fee characteristics, subject to a minimum of 50 funds (or all funds in the Total Mapped Group if fewer than 50). Additional information, such as the ASPG quartile in which the fund's management fee ranked and the impact of the fund's performance adjustment, is also included in the chart and considered by the Board.
Fidelity Canada Fund

The Board noted that the fund's management fee ranked below the median of its Total Mapped Group and below the median of its ASPG for 2007. The Board also noted the effect of the fund's negative performance adjustment on the fund's management fee ranking. The Board noted that the performance adjustment for each year represents calculations for performance periods that differ from the periods shown in the performance charts above.
Based on its review, the Board concluded that the fund's management fee was fair and reasonable in light of the services that the fund receives and the other factors considered.
In its review of the each class's total expenses, the Board considered the fund's management fee as well as other fund or class expenses, as applicable, such as transfer agent fees, pricing and bookkeeping fees, fund-paid 12b-1 fees, and custodial, legal, and audit fees. The Board also noted the effects of any waivers and reimbursements on fees and expenses, as well as the impact of the fund's performance adjustment. As part of its review, the Board also considered current and historical total expenses of the fund compared to competitive fund median expenses. The fund is compared to those funds and classes in the Total Mapped Group (used by the Board for management fee comparisons) that have a similar sales load structure.
The Board noted that the total expenses of each of Class A, Class B, Class C, Institutional Class, and Fidelity Canada (retail class) ranked below its competitive median for 2007, and the total expenses of Class T ranked above its competitive median for 2007. The Board considered that the total expenses for Class T were above the median primarily because 12b-1 fee is higher than the typical front-end load class. The Board noted that the fund offers multiple classes, each of which has a different sales load and 12b-1 fee structure, and that the multiple structures are intended to offer a range of pricing options for the intermediary market. The Board also noted that the total expenses of the classes vary primarily by the level of their 12b-1 fees, although differences in transfer agent fees may also cause expenses to vary from class to class.
In its review of total expenses, the Board also considered Fidelity fee structures and other information on clients that FMR and its affiliates service in other competitive markets, such as other mutual funds advised or subadvised by FMR or its affiliates, pension plan clients, and other institutional clients.
Based on its review, the Board concluded that the total expenses of each class of the fund were reasonable, although in one case above the median of the universe presented for comparison, in light of the services that the fund and its shareholders receive and the other factors considered.
Annual Report
Board Approval of Investment Advisory Contracts and Management Fees - continued
Costs of the Services and Profitability. The Board considered the revenues earned and the expenses incurred by Fidelity in conducting the business of developing, marketing, distributing, managing, administering and servicing the fund and its shareholders. The Board also considered the level of Fidelity's profits in respect of all the Fidelity funds.
On an annual basis, FMR presents to the Board Fidelity's profitability for the fund. Fidelity calculates the profitability for each fund, as well as aggregate profitability for groups of Fidelity funds and all Fidelity funds, using a series of detailed revenue and cost allocation methodologies which originate with the audited books and records of Fidelity. The Audit Committee of the Board reviews any significant changes from the prior year's methodologies.
PricewaterhouseCoopers LLP (PwC), independent registered public accounting firm and auditor to Fidelity and certain Fidelity funds, has been engaged annually by the Board as part of the Board's assessment of the results of Fidelity's profitability analysis. PwC's engagement includes the review and assessment of Fidelity's methodologies used in determining the revenues and expenses attributable to Fidelity's mutual fund business, and completion of agreed-upon procedures surrounding the mathematical accuracy of fund profitability and its conformity to allocation methodologies. After considering PwC's reports issued under the engagement and information provided by Fidelity, the Board believes that while other allocation methods may also be reasonable, Fidelity's profitability methodologies are reasonable in all material respects.
The Board has also reviewed Fidelity's non-fund businesses and any fall-out benefits related to the mutual fund business as well as cases where Fidelity's affiliates may benefit from or be related to the fund's business.
The Board considered the costs of the services provided by and the profits realized by Fidelity in connection with the operation of the fund and determined that the amount of profit is a fair entrepreneurial profit for the management of the fund.
Economies of Scale. The Board considered whether there have been economies of scale in respect of the management of the Fidelity funds, whether the Fidelity funds (including the fund) have appropriately benefited from any such economies of scale, and whether there is potential for realization of any further economies of scale. The Board considered the extent to which the fund will benefit from economies of scale through increased services to the fund, through waivers or reimbursements, or through fee or expense reductions.
The Board recognized that the fund's management contract incorporates a "group fee" structure, which provides for lower group fee rates as total fund assets under FMR's management increase, and for higher group fee rates as total fund assets under FMR's management decrease. FMR determines the group fee rates based on a tiered asset "breakpoint" schedule. The Board considered that the group fee is designed to deliver the benefits of economies of scale to fund shareholders when total fund assets increase, even if assets of any particular fund are unchanged or have declined, because some portion of Fidelity's costs are attributable to services provided to all Fidelity funds, and all funds benefit if those costs can be allocated among more assets. The Board concluded that, given the group fee structure, fund shareholders will achieve a certain level of economies of scale as assets under FMR's management increase at the fund complex level, regardless of whether Fidelity achieves any such economies of scale.
The Board further concluded that any potential economies of scale are being shared between fund shareholders and Fidelity in an appropriate manner.
Additional Information Requested by the Board. In order to develop fully the factual basis for consideration of the Fidelity funds' Advisory Contracts, the Board requested and received additional information on certain topics, including (i) fund performance trends and actions to be taken by FMR to improve certain funds' overall performance; (ii) portfolio manager changes that have occurred during the past year; (iii) Fidelity's fund profitability methodology, the profitability of certain fund service providers, and profitability trends for certain funds; (iv) Fidelity's compensation structure for portfolio managers and key personnel, including its effects on fund profitability and the extent to which portfolio manager compensation is linked to fund performance; (v) Fidelity's fee structures and rationale for recommending different fees among categories of funds; and (vi) Fidelity's rationale for recommending which funds should have a performance adjustment component as part of their management fees.
Based on its evaluation of all of the conclusions noted above, and after considering all material factors, the Board ultimately concluded that the advisory fee structures are fair and reasonable, and that the fund's Advisory Contracts should be renewed.
Annual Report
Investment Adviser
Fidelity Management & Research Company
Boston, MA
Investment Sub-Advisers
FMR Co., Inc.
Fidelity Management & Research
(U.K.) Inc.
Fidelity Research & Analysis Company
Fidelity Investment Japan Limited
FIL Investment Advisors
FIL Investment Advisors
(U.K.) Ltd.
Fidelity Management & Research
(Hong Kong) Limited
Fidelity Management & Research
(Japan) Inc.
General Distributor
Fidelity Distributors Corporation
Boston, MA
Transfer and Service Agents
Fidelity Investments Institutional
Operations Company, Inc.
Boston, MA
Fidelity Service Company, Inc.
Boston, MA
Custodian
Mellon Bank, N.A.
Pittsburgh, PA
ACAN-UANN-1208
1.843164.101
Fidelity Advisor
Canada Fund
Institutional Class
Annual Report
October 31, 2008
Institutional Class is a class of
Fidelity® Canada Fund
(2_fidelity_logos) (Registered_Trademark)
Contents
Chairman's Message | <Click Here> | Ned Johnson's message to shareholders. |
Performance | <Click Here> | How the fund has done over time. |
Management's Discussion | <Click Here> | The manager's review of fund performance, strategy and outlook. |
Shareholder Expense Example | <Click Here> | An example of shareholder expenses. |
Investment Changes | <Click Here> | A summary of major shifts in the fund's investments over the past six months. |
Investments | <Click Here> | A complete list of the fund's investments with their market values. |
Financial Statements | <Click Here> | Statements of assets and liabilities, operations, and changes in net assets, as well as financial highlights. |
Notes | <Click Here> | Notes to the financial statements. |
Report of Independent Registered Public Accounting Firm | <Click Here> | |
Trustees and Officers | <Click Here> | |
Distributions | <Click Here> | |
Proxy Voting Results | <Click Here> | |
Board Approval of Investment Advisory Contracts and Management Fees | <Click Here> | |
To view a fund's proxy voting guidelines and proxy voting record for the 12-month period ended June 30, visit http://www.fidelity.com (search for "proxy voting guidelines") or visit the Securities and Exchange Commission's (SEC) web site at http://www.sec.gov. You may also call 1-877-208-0098 to request a free copy of the proxy voting guidelines.
Standard & Poor's, S&P and S&P 500 are registered service marks of The McGraw-Hill Companies, Inc. and have been licensed for use by Fidelity Distributors Corporation.
Other third party marks appearing herein are the property of their respective owners.
All other marks appearing herein are registered or unregistered trademarks or service marks of FMR LLC or an affiliated company.
This report and the financial statements contained herein are submitted for the general information of the shareholders of the fund. This report is not authorized for distribution to prospective investors in the fund unless preceded or accompanied by an effective prospectus.
A fund files its complete schedule of portfolio holdings with the SEC for the first and third quarters of each fiscal year on Form N-Q. Forms N-Q are available on the SEC's web site at http://www.sec.gov. A fund's Forms N-Q may be reviewed and copied at the SEC's Public Reference Room in Washington, DC. Information regarding the operation of the SEC's Public Reference Room may be obtained by calling 1-800-SEC-0330. For a complete list of a fund's portfolio holdings, view the most recent holdings listing, semiannual report, or annual report on Fidelity's web site at http://www.fidelity.com or http://www.advisor.fidelity.com, as applicable.
NOT FDIC INSURED · MAY LOSE VALUE · NO BANK GUARANTEE
Neither the fund nor Fidelity Distributors Corporation is a bank.
Annual Report
(photo_of_Edward_C_Johnson_3d)
Dear Shareholder:
Turmoil has been the watchword for the world's securities markets in 2008, with domestic and international stocks down sharply amid the global credit squeeze. A flight to quality boosted returns for U.S. Treasuries, one of the few asset classes with positive results heading into the latter stages of the year. Financial markets are always unpredictable, but there are a number of time-tested principles that can put the historical odds in your favor.
One of the basic tenets is to invest for the long term. Over time, riding out the markets' inevitable ups and downs has proven much more effective than selling into panic or chasing the hottest trend. Even missing only a few of the markets' best days can significantly diminish investor returns. Patience also affords the benefits of compounding - of earning interest on additional income or reinvested dividends and capital gains. There are tax advantages and cost benefits to consider as well. The more you sell, the more taxes you pay, and the more you trade, the higher the costs. While staying the course doesn't eliminate risk, it can considerably lessen the effect of short-term declines.
You can further manage your investing risk through diversification. And today, more than ever, geographic diversification should be taken into account. Studies indicate that asset allocation is the single most important determinant of a portfolio's long-term success. The right mix of stocks, bonds and cash - aligned to your particular risk tolerance and investment objective - is very important. Age-appropriate rebalancing is also an essential aspect of asset allocation. For younger investors, an emphasis on equities - which historically have been the best-performing asset class over time - is encouraged. As investors near their specific goal, such as retirement or sending a child to college, consideration may be given to replacing volatile assets (e.g. common stocks) with more-stable fixed investments (bonds or savings plans).
A third investment principle - investing regularly - can help lower the average cost of your purchases. Investing a certain amount of money each month or quarter helps ensure you won't pay for all your shares at market highs. This strategy - known as dollar cost averaging - also reduces unconstructive "emotion" from investing, helping shareholders avoid selling weak performers just prior to an upswing, or chasing a hot performer just before a correction.
We invite you to contact us via the Internet, through our Investor Centers or over the phone. It is our privilege to provide you the information you need to make the investments that are right for you.
Sincerely,
/s/Edward C. Johnson 3d
Edward C. Johnson 3d
Annual Report
Average annual total return reflects the change in the value of an investment, assuming reinvestment of the class' dividend income and capital gains (the profits earned upon the sale of securities that have grown in value, if any) and assuming a constant rate of performance each year. The $10,000 table and the fund's returns do not reflect the deduction of taxes that a shareholder would pay on fund distributions or the redemption of fund shares. During periods of reimbursement by Fidelity, a fund's total returns will be greater than it would be had the reimbursement not occurred. How a fund did yesterday is no guarantee of how it will do tomorrow.
Average Annual Total Returns
Periods ended October 31, 2008 | Past 1
year | Past 5
years | Past 10
years |
Institutional ClassA | -42.11% | 10.98% | 13.06% |
A The initial offering of Institutional Class shares took place on May 2, 2007. Returns prior to May 2, 2007 are those of Canada, the original retail class of the fund.
$10,000 Over 10 Years
Let's say hypothetically that $10,000 was invested in Fidelity Advisor Canada Fund - Institutional Class on October 31, 1998. The chart shows how the value of your investment would have changed, and also shows how the S&P/TSX Composite Index performed over the same period. The inital offering of Institutional Class took place on May 2, 2007. See above for additional information regarding the performance of Institutional Class.
Annual Report
Comments from Douglas Lober, who became Portfolio Manager of Fidelity Advisor Canada Fund on September 1, 2008
In a dramatic reversal of what had been a multiyear global growth story, international stocks fell long and hard during the 12 months ending October 31, 2008, especially so during the latter stages of the period and mostly as a result of fallout from the financial crisis that emanated from the United States. The viral spread of this financial contagion - which began in the U.S. subprime mortgage market, then seized up the credit markets, hobbled major financial institutions and eventually slowed economic growth worldwide - left virtually no corner of the globe untouched. Developed international equity markets - as gauged by the MSCI® Europe, Australasia, Far East (EAFE®) Index, which monitors established markets outside the U.S. and Canada - fell 46.54%, while the Standard & Poor's 500SM Index, a measure of U.S. stocks, dropped 36.10%. Among countries constituting at least 1% of the EAFE index, Switzerland had the "least worst" showing, falling roughly 32%, followed by Japan, where stocks slid by around 37%. Meanwhile, the weakest overall performance came from Belgium, where stocks slipped by nearly 70%. In the United Kingdom, the largest component of the index, equities were down almost 48%. Emerging markets were the weakest performers among the global economies, declining 56.22% as measured by the MSCI Emerging Markets Index.
For the year ending October 31, 2008, the fund's Institutional Class shares declined 42.11%, beating the 46.37% decline of the S&P/TSX Composite Index. Prudent stock selection in the energy and materials sectors supported the fund's return versus the benchmark. Overweighted positions in oil and natural gas pipeline company TransCanada, fertilizer company Potash Corp. of Saskatchewan, Toronto-Dominion Bank and transportation manufacturer Bombardier made these stocks the fund's top contributors. Having virtually no exposure to floundering telecommunications equipment maker and index component Nortel Networks also helped when equipment investment cutbacks by telecom carriers drove down this company's stock. I sold the position. Underweighting Canadian Imperial Bank of Commerce also helped when this stock faltered. Lastly, the fund's cash holdings boosted performance substantially. On the other hand, we missed the strength of pipeline company Enbridge, having chosen to invest in TransCanada instead, and we had disappointing results from our positioning in Bank of Nova Scotia, T-shirt manufacturer Gildan Activewear, and gold mining companies Yamana Gold and Barrick Gold, both of which declined along with other commodities stocks during the period. Currency fluctuations also dampened performance.
Note to shareholders: Fidelity Advisor Canada Fund may invest up to 35% of its total assets in any industry that represents more than 20% of the Canadian market. As of October 31, 2008, the fund did not have more than 25% of its total assets invested in any one industry.
The views expressed above reflect those of the portfolio manager(s) only through the end of the period as stated on the cover of this report and do not necessarily represent the views of Fidelity or any other person in the Fidelity organization. Any such views are subject to change at any time based upon market or other conditions and Fidelity disclaims any responsibility to update such views. These views may not be relied on as investment advice and, because investment decisions for a Fidelity fund are based on numerous factors, may not be relied on as an indication of trading intent on behalf of any Fidelity fund.
Annual Report
Canada
Shareholder Expense Example
As a shareholder of the Fund, you incur two types of costs: (1) transaction costs, including sales charges (loads) on purchase payments or redemption proceeds and redemption fees, and (2) ongoing costs, including management fees, distribution and/or service (12b-1) fees and other Fund expenses. This Example is intended to help you understand your ongoing costs (in dollars) of investing in the Fund and to compare these costs with the ongoing costs of investing in other mutual funds.
The Example is based on an investment of $1,000 invested at the beginning of the period and held for the entire period (May 1, 2008 to October 31, 2008).
Actual Expenses
The first line of the accompanying table for each class of the Fund provides information about actual account values and actual expenses. You may use the information in this line, together with the amount you invested, to estimate the expenses that you paid over the period. Simply divide your account value by $1,000.00 (for example, an $8,600 account value divided by $1,000.00 = 8.6), then multiply the result by the number in the first line for a class of the Fund under the heading entitled "Expenses Paid During Period" to estimate the expenses you paid on your account during this period. A small balance maintenance fee of $12.00 that is charged once a year may apply for certain accounts with a value of less than $2,000. This fee is not included in the table below. If it was, the estimate of expenses you paid during the period would be higher, and your ending account value lower, by this amount. In addition, the Fund, as a shareholder in the underlying Fidelity Central Funds, will indirectly bear its pro rata share of the fees and expenses incurred by the underlying Fidelity Central Funds. These fees and expenses are not included in the Fund's annualized expense ratio used to calculate the expense estimate in the table below.
Hypothetical Example for Comparison Purposes
The second line of the accompanying table for each class of the Fund provides information about hypothetical account values and hypothetical expenses based on a Class' actual expense ratio and an assumed rate of return of 5% per year before expenses, which is not the Class' actual return. The hypothetical account values and expenses may not be used to estimate the actual ending account balance or expenses you paid for the period. You may use this information to compare the ongoing costs of investing in the Fund and other funds. To do so, compare this 5% hypothetical example with the 5% hypothetical examples that appear in the shareholder reports of the other funds. A small balance maintenance fee of $12.00 that is charged once a year may apply for certain accounts with a value of less than $2,000. This fee is not included in the table below. If it was, the estimate of expenses you paid during the period would be higher, and your ending account value lower, by this amount. In addition, the Fund, as a shareholder in the underlying Fidelity Central Funds, will indirectly bear its pro rata share of the fees and expenses incurred by the underlying Fidelity Central Funds. These fees and expenses are not included in the Fund's annualized expense ratio used to calculate the expense estimate in the table below.
Please note that the expenses shown in the table are meant to highlight your ongoing costs only and do not reflect any transaction costs. Therefore, the second line of the table is useful in comparing ongoing costs only, and will not help you determine the relative total costs of owning different funds. In addition, if these transactional costs were included, your costs would have been higher.
| Annualized Expense Ratio | Beginning
Account Value
May 1, 2008 | Ending
Account Value
October 31, 2008 | Expenses Paid
During Period*
May 1, 2008
to October 31, 2008 |
Class A | 1.37% | | | |
Actual | | $ 1,000.00 | $ 628.90 | $ 5.61 |
HypotheticalA | | $ 1,000.00 | $ 1,018.25 | $ 6.95 |
Class T | 1.66% | | | |
Actual | | $ 1,000.00 | $ 628.00 | $ 6.79 |
HypotheticalA | | $ 1,000.00 | $ 1,016.79 | $ 8.42 |
Class B | 2.16% | | | |
Actual | | $ 1,000.00 | $ 626.40 | $ 8.83 |
HypotheticalA | | $ 1,000.00 | $ 1,014.28 | $ 10.94 |
Class C | 2.16% | | | |
Actual | | $ 1,000.00 | $ 626.40 | $ 8.83 |
HypotheticalA | | $ 1,000.00 | $ 1,014.28 | $ 10.94 |
Canada | 1.07% | | | |
Actual | | $ 1,000.00 | $ 629.80 | $ 4.38 |
HypotheticalA | | $ 1,000.00 | $ 1,019.76 | $ 5.43 |
Institutional Class | 1.14% | | | |
Actual | | $ 1,000.00 | $ 629.60 | $ 4.67 |
HypotheticalA | | $ 1,000.00 | $ 1,019.41 | $ 5.79 |
A 5% return per year before expenses
* Expenses are equal to each Class' annualized expense ratio, multiplied by the average account value over the period, multiplied by 184/366 (to reflect the one-half year period).
Annual Report
Canada
Investment Changes (Unaudited)
Geographic Diversification (% of fund's net assets) |
As of October 31, 2008 |
| Canada | 92.8% | |
| United States of America | 7.2% | |

Percentages are adjusted for the effect of futures contracts, if applicable. |
|
As of April 30, 2008 |
| Canada | 92.0% | |
| United States of America | 8.0% | |

Percentages are adjusted for the effect of futures contracts, if applicable. |
Asset Allocation |
| % of fund's
net assets | % of fund's net assets
6 months ago |
Stocks | 98.5 | 91.9 |
Short-Term Investments and Net Other Assets | 1.5 | 8.1 |
Top Ten Stocks as of October 31, 2008 |
| % of fund's
net assets | % of fund's net assets
6 months ago |
Royal Bank of Canada (Commercial Banks) | 6.5 | 3.5 |
Toronto-Dominion Bank (Commercial Banks) | 6.2 | 4.4 |
EnCana Corp. (Oil, Gas & Consumable Fuels) | 6.2 | 5.0 |
Canadian Natural Resources Ltd. (Oil, Gas & Consumable Fuels) | 5.2 | 3.9 |
Canadian National Railway Co. (Road & Rail) | 4.3 | 0.4 |
TransCanada Corp. (Oil, Gas & Consumable Fuels) | 4.3 | 3.3 |
Potash Corp. of Saskatchewan, Inc. (Chemicals) | 3.5 | 5.0 |
Research In Motion Ltd. (Communications Equipment) | 3.4 | 4.4 |
Manulife Financial Corp. (Insurance) | 3.3 | 4.2 |
Rogers Communications, Inc. Class B (non-vtg.) (Wireless Telecommunication Services) | 2.9 | 2.8 |
| 45.8 | |
Market Sectors as of October 31, 2008 |
| % of fund's
net assets | % of fund's net assets
6 months ago |
Energy | 28.8 | 27.9 |
Financials | 27.8 | 21.2 |
Materials | 11.3 | 14.8 |
Industrials | 7.7 | 9.2 |
Telecommunication Services | 7.0 | 4.9 |
Consumer Staples | 5.7 | 3.2 |
Information Technology | 5.3 | 6.9 |
Consumer Discretionary | 3.1 | 3.5 |
Health Care | 1.4 | 0.3 |
Utilities | 0.4 | 0.0 |
Annual Report
Canada
Investments October 31, 2008
Showing Percentage of Net Assets
Common Stocks - 98.5% |
| Shares | | Value |
CONSUMER DISCRETIONARY - 3.1% |
Hotels, Restaurants & Leisure - 0.9% |
McDonald's Corp. | 250,000 | | $ 14,482,500 |
Tim Hortons, Inc. | 500,000 | | 12,585,000 |
| | 27,067,500 |
Media - 1.7% |
Astral Media, Inc. Class A (non-vtg.) | 340,000 | | 7,858,517 |
Corus Entertainment, Inc. Class B (non-vtg.) (d) | 550,000 | | 6,431,415 |
Groupe Aeroplan, Inc. | 490,000 | | 4,254,686 |
Quebecor, Inc. Class B (sub. vtg.) | 900,000 | | 14,681,539 |
Thomson Reuters Corp. (d) | 400,000 | | 9,414,497 |
Yellow Pages Income Fund (d) | 900,000 | | 6,530,934 |
| | 49,171,588 |
Textiles, Apparel & Luxury Goods - 0.5% |
Gildan Activewear, Inc. (a) | 560,000 | | 13,050,257 |
TOTAL CONSUMER DISCRETIONARY | | 89,289,345 |
CONSUMER STAPLES - 5.7% |
Food & Staples Retailing - 3.3% |
Alimentation Couche-Tard, Inc. Class B (sub. vtg.) | 1,210,000 | | 16,306,601 |
George Weston Ltd. | 80,000 | | 4,080,942 |
Metro, Inc. Class A (sub. vtg.) | 940,000 | | 23,659,811 |
Shoppers Drug Mart Corp. | 1,300,000 | | 50,024,880 |
| | 94,072,234 |
Food Products - 1.4% |
Campbell Soup Co. | 460,000 | | 17,457,000 |
General Mills, Inc. | 280,000 | | 18,967,200 |
Viterra, Inc. (a) | 809,300 | | 5,134,471 |
| | 41,558,671 |
Household Products - 1.0% |
Procter & Gamble Co. | 450,000 | | 29,043,000 |
TOTAL CONSUMER STAPLES | | 164,673,905 |
ENERGY - 28.8% |
Energy Equipment & Services - 0.1% |
Flint Energy Services Ltd. (a) | 260,000 | | 1,498,590 |
Precision Drilling Trust (d) | 163,300 | | 1,760,574 |
| | 3,259,164 |
Oil, Gas & Consumable Fuels - 28.7% |
Cameco Corp. | 1,050,000 | | 17,180,710 |
Canadian Natural Resources Ltd. | 2,950,000 | | 148,796,650 |
Canadian Oil Sands Trust | 1,250,000 | | 33,525,460 |
Enbridge, Inc. | 608,900 | | 21,138,293 |
EnCana Corp. | 3,500,000 | | 177,728,479 |
Exxon Mobil Corp. | 400,000 | | 29,648,000 |
Husky Energy, Inc. | 1,500,000 | | 45,032,344 |
|
| Shares | | Value |
Imperial Oil Ltd. | 900,000 | | $ 31,833,637 |
Keyera Facilities Income Fund | 2,050,000 | | 31,044,120 |
Nexen, Inc. | 1,350,000 | | 21,428,927 |
Niko Resources Ltd. | 240,000 | | 10,509,206 |
Petro-Canada | 1,450,000 | | 36,243,987 |
Suncor Energy, Inc. | 2,950,000 | | 70,826,422 |
Talisman Energy, Inc. | 2,700,000 | | 26,668,602 |
TransCanada Corp. | 4,100,000 | | 123,836,457 |
| | 825,441,294 |
TOTAL ENERGY | | 828,700,458 |
FINANCIALS - 27.8% |
Capital Markets - 0.1% |
IGM Financial, Inc. | 100,000 | | 3,022,060 |
Commercial Banks - 18.1% |
Bank of Montreal (d) | 1,609,300 | | 57,415,895 |
Bank of Nova Scotia | 1,500,000 | | 49,995,853 |
Canadian Imperial Bank of Commerce | 784,600 | | 35,566,625 |
National Bank of Canada | 280,000 | | 10,498,258 |
Royal Bank of Canada | 4,840,000 | | 188,012,608 |
Toronto-Dominion Bank | 3,800,000 | | 179,379,665 |
| | 520,868,904 |
Diversified Financial Services - 0.3% |
Onex Corp. (sub. vtg.) | 400,000 | | 6,916,570 |
TMX Group, Inc. | 145,000 | | 3,395,920 |
| | 10,312,490 |
Insurance - 7.7% |
Fairfax Financial Holdings Ltd. | 90,000 | | 24,705,590 |
ING Canada, Inc. | 525,000 | | 14,285,329 |
Manulife Financial Corp. | 4,800,000 | | 96,015,923 |
Power Corp. of Canada (sub. vtg.) | 2,100,000 | | 45,629,458 |
Sun Life Financial, Inc. | 1,700,000 | | 39,969,315 |
| | 220,605,615 |
Real Estate Investment Trusts - 0.1% |
RioCan (REIT) | 250,000 | | 3,485,238 |
Real Estate Management & Development - 1.5% |
Brookfield Asset Management, Inc. Class A (d) | 2,050,000 | | 35,872,450 |
Brookfield Properties Corp. | 650,000 | | 6,558,504 |
| | 42,430,954 |
TOTAL FINANCIALS | | 800,725,261 |
HEALTH CARE - 1.4% |
Health Care Equipment & Supplies - 0.7% |
Baxter International, Inc. | 300,000 | | 18,147,000 |
Noveko International, Inc. (a) | 2,500,000 | | 2,944,103 |
| | 21,091,103 |
Common Stocks - continued |
| Shares | | Value |
HEALTH CARE - continued |
Pharmaceuticals - 0.7% |
Johnson & Johnson | 300,000 | | $ 18,402,000 |
TOTAL HEALTH CARE | | 39,493,103 |
INDUSTRIALS - 7.7% |
Aerospace & Defense - 1.4% |
Bombardier, Inc. Class B (sub. vtg.) | 9,900,000 | | 38,177,973 |
CAE, Inc. | 500,000 | | 2,931,664 |
| | 41,109,637 |
Construction & Engineering - 0.8% |
SNC-Lavalin Group, Inc. | 815,000 | | 21,405,747 |
Road & Rail - 5.2% |
Canadian National Railway Co. | 2,870,000 | | 124,530,105 |
Canadian Pacific Railway Ltd. | 550,000 | | 24,881,821 |
| | 149,411,926 |
Trading Companies & Distributors - 0.3% |
Finning International, Inc. | 705,000 | | 8,565,475 |
TOTAL INDUSTRIALS | | 220,492,785 |
INFORMATION TECHNOLOGY - 5.3% |
Communications Equipment - 3.4% |
Research In Motion Ltd. (a)(d) | 1,910,000 | | 96,321,310 |
Computers & Peripherals - 0.3% |
Hewlett-Packard Co. | 250,000 | | 9,570,000 |
Internet Software & Services - 0.3% |
Open Text Corp. (a) | 350,000 | | 8,870,459 |
IT Services - 1.3% |
CGI Group, Inc. Class A (sub. vtg.) (a) | 4,690,000 | | 37,417,316 |
TOTAL INFORMATION TECHNOLOGY | | 152,179,085 |
MATERIALS - 11.3% |
Chemicals - 4.1% |
Agrium, Inc. | 460,000 | | 17,613,369 |
Potash Corp. of Saskatchewan, Inc. | 1,180,000 | | 100,606,802 |
| | 118,220,171 |
Metals & Mining - 7.2% |
Agnico-Eagle Mines Ltd. | 200,000 | | 5,516,669 |
Barrick Gold Corp. (d) | 3,600,000 | | 82,282,302 |
Goldcorp, Inc. | 3,350,000 | | 62,621,496 |
Kinross Gold Corp. | 2,350,000 | | 24,458,865 |
Orezone Resources, Inc. Class A (a) | 10,000,000 | | 1,617,184 |
Shore Gold, Inc. (a) | 400,000 | | 208,990 |
Teck Cominco Ltd. Class B (sub. vtg.) | 1,900,000 | | 18,908,608 |
Yamana Gold, Inc. | 2,700,000 | | 12,875,270 |
| | 208,489,384 |
TOTAL MATERIALS | | 326,709,555 |
|
| Shares | | Value |
TELECOMMUNICATION SERVICES - 7.0% |
Diversified Telecommunication Services - 4.1% |
BCE, Inc. | 2,750,000 | | $ 79,890,944 |
TELUS Corp. | 1,050,000 | | 37,069,580 |
| | 116,960,524 |
Wireless Telecommunication Services - 2.9% |
Rogers Communications, Inc. Class B (non-vtg.) | 2,900,000 | | 84,152,430 |
TOTAL TELECOMMUNICATION SERVICES | | 201,112,954 |
UTILITIES - 0.4% |
Electric Utilities - 0.3% |
Fortis, Inc. | 400,000 | | 8,724,498 |
Multi-Utilities - 0.1% |
Canadian Utilities Ltd. Class A (non-vtg.) | 100,000 | | 3,516,338 |
TOTAL UTILITIES | | 12,240,836 |
TOTAL COMMON STOCKS (Cost $3,177,288,022) | 2,835,617,287 |
Money Market Funds - 4.2% |
| | | |
Fidelity Cash Central Fund, 1.81% (b) | 44,876,838 | | 44,876,838 |
Fidelity Securities Lending Cash Central Fund, 2.67% (b)(c) | 74,627,890 | | 74,627,890 |
TOTAL MONEY MARKET FUNDS (Cost $119,504,728) | 119,504,728 |
TOTAL INVESTMENT
PORTFOLIO - 102.7% (Cost $3,296,792,750) | | 2,955,122,015 |
NET OTHER ASSETS - (2.7)% | | (76,419,060) |
NET ASSETS - 100% | $ 2,878,702,955 |
Legend |
(a) Non-income producing |
(b) Affiliated fund that is available only to investment companies and other accounts managed by Fidelity Investments. The rate quoted is the annualized seven-day yield of the fund at period end. A complete unaudited listing of the fund's holdings as of its most recent quarter end is available upon request. |
(c) Investment made with cash collateral received from securities on loan. |
(d) Security or a portion of the security is on loan at period end. |
Affiliated Central Funds |
Information regarding fiscal year to date income earned by the Fund from investments in Fidelity Central Funds is as follows: |
Fund | Income earned |
Fidelity Cash Central Fund | $ 7,406,661 |
Fidelity Securities Lending Cash Central Fund | 7,155,677 |
Total | $ 14,562,338 |
Income Tax Information |
At October 31, 2008, the fund had a capital loss carryforward of approximately $109,618,723 all of which will expire on October 31, 2016. |
See accompanying notes which are an integral part of the financial statements.
Annual Report
Canada
Financial Statements
Statement of Assets and Liabilities
| October 31, 2008 |
| | |
Assets | | |
Investment in securities, at value (including securities loaned of $70,624,731) - See accompanying schedule: Unaffiliated issuers
(cost $3,177,288,022) | $ 2,835,617,287 | |
Fidelity Central Funds
(cost $119,504,728) | 119,504,728 | |
Total Investments (cost $3,296,792,750) | | $ 2,955,122,015 |
Cash | | 50,940 |
Foreign currency held at value
(cost $1,751,041) | | 1,751,041 |
Receivable for investments sold | | 37,624,117 |
Receivable for fund shares sold | | 6,126,409 |
Dividends receivable | | 3,564,722 |
Distributions receivable from Fidelity Central Funds | | 930,110 |
Prepaid expenses | | 1,171 |
Other receivables | | 560,878 |
Total assets | | 3,005,731,403 |
| | |
Liabilities | | |
Payable for investments purchased | $ 39,987,092 | |
Payable for fund shares redeemed | 8,966,712 | |
Accrued management fee | 2,327,601 | |
Distribution fees payable | 37,935 | |
Other affiliated payables | 956,398 | |
Other payables and accrued expenses | 124,820 | |
Collateral on securities loaned, at value | 74,627,890 | |
Total liabilities | | 127,028,448 |
| | |
Net Assets | | $ 2,878,702,955 |
Net Assets consist of: | | |
Paid in capital | | $ 3,364,193,370 |
Undistributed net investment income | | 26,382,786 |
Accumulated undistributed net realized gain (loss) on investments and foreign currency transactions | | (170,169,032) |
Net unrealized appreciation (depreciation) on investments and assets and liabilities in foreign currencies | | (341,704,169) |
Net Assets | | $ 2,878,702,955 |
Statement of Assets and Liabilities - continued
| October 31, 2008 |
| | |
Calculation of Maximum Offering Price Class A:
Net Asset Value and redemption
price per share ($56,241,768 ÷ 1,472,410 shares) | | $ 38.20 |
| | |
Maximum offering price per share (100/94.25 of $38.20) | | $ 40.53 |
Class T:
Net Asset Value and redemption
price per share ($14,962,665 ÷ 392,759 shares) | | $ 38.10 |
| | |
Maximum offering price per share (100/96.50 of $38.10) | | $ 39.48 |
Class B:
Net Asset Value and offering
price per share ($5,614,606 ÷ 148,110 shares)A | | $ 37.91 |
| | |
Class C:
Net Asset Value and offering
price per share ($16,715,712 ÷ 441,756 shares)A | | $ 37.84 |
| | |
Canada:
Net Asset Value, offering price and redemption price per share ($2,776,298,056 ÷ 72,354,690 shares) | | $ 38.37 |
| | |
Institutional Class:
Net Asset Value, offering price and redemption price per share ($8,870,148 ÷ 231,554 shares) | | $ 38.31 |
A Redemption price per share is equal to net asset value less any applicable contingent deferred sales charge.
See accompanying notes which are an integral part of the financial statements.
Annual Report
Canada
Financial Statements - continued
Statement of Operations
| Year ended October 31, 2008 |
Investment Income | | |
Dividends | | $ 88,816,652 |
Interest | | 3,342,141 |
Income from Fidelity Central Funds (including $7,155,677 from security lending) | | 14,562,338 |
| | 106,721,131 |
Less foreign taxes withheld | | (13,248,424) |
Total income | | 93,472,707 |
| | |
Expenses | | |
Management fee
Basic fee | $ 33,096,529 | |
Performance adjustment | 2,474,546 | |
Transfer agent fees | 10,148,036 | |
Distribution fees | 476,058 | |
Accounting and security lending fees | 1,552,365 | |
Custodian fees and expenses | 128,586 | |
Independent trustees' compensation | 20,487 | |
Registration fees | 278,940 | |
Audit | 74,475 | |
Legal | 21,976 | |
Interest | 8,474 | |
Miscellaneous | 540,182 | |
Total expenses before reductions | 48,820,654 | |
Expense reductions | (1,414,672) | 47,405,982 |
Net investment income (loss) | | 46,066,725 |
Realized and Unrealized Gain (Loss) Net realized gain (loss) on: | | |
Investment securities: | | |
Unaffiliated issuers | (171,748,787) | |
Foreign currency transactions | (3,938,430) | |
Total net realized gain (loss) | | (175,687,217) |
Change in net unrealized appreciation (depreciation) on: Investment securities | (2,180,802,820) | |
Assets and liabilities in foreign currencies | (200,050) | |
Total change in net unrealized appreciation (depreciation) | | (2,181,002,870) |
Net gain (loss) | | (2,356,690,087) |
Net increase (decrease) in net assets resulting from operations | | $ (2,310,623,362) |
Statement of Changes in Net Assets
| Year ended
October 31,
2008 | Year ended
October 31,
2007 |
Increase (Decrease) in Net Assets | | |
Operations | | |
Net investment income (loss) | $ 46,066,725 | $ 33,178,201 |
Net realized gain (loss) | (175,687,217) | 272,277,024 |
Change in net unrealized appreciation (depreciation) | (2,181,002,870) | 1,120,719,255 |
Net increase (decrease) in net assets resulting from operations | (2,310,623,362) | 1,426,174,480 |
Distributions to shareholders from net investment income | (28,915,979) | (22,989,617) |
Distributions to shareholders from net realized gain | (235,022,630) | (65,775,827) |
Total distributions | (263,938,609) | (88,765,444) |
Share transactions - net increase (decrease) | 507,012,286 | 467,056,549 |
Redemption fees | 3,308,433 | 1,551,369 |
Total increase (decrease) in net assets | (2,064,241,252) | 1,806,016,954 |
| | |
Net Assets | | |
Beginning of period | 4,942,944,207 | 3,136,927,253 |
End of period (including undistributed net investment income of $26,382,786 and undistributed net investment income of $26,450,845, respectively) | $ 2,878,702,955 | $ 4,942,944,207 |
See accompanying notes which are an integral part of the financial statements.
Annual Report
Financial Highlights - Class A
Years ended October 31, | 2008 | 2007 H |
Selected Per-Share Data | | |
Net asset value, beginning of period | $ 70.16 | $ 54.00 |
Income from Investment Operations | | |
Net investment income (loss) E | .39 | .19 |
Net realized and unrealized gain (loss) | (28.71) | 15.96 |
Total from investment operations | (28.32) | 16.15 |
Distributions from net investment income | (.41) | - |
Distributions from net realized gain | (3.27) | - |
Total distributions | (3.68) | - |
Redemption fees added to paid in capital E | .04 | .01 |
Net asset value, end of period | $ 38.20 | $ 70.16 |
Total Return B, C, D | (42.23)% | 29.93% |
Ratios to Average Net Assets F, I | | |
Expenses before reductions | 1.34% | 1.23% A |
Expenses net of fee waivers, if any | 1.34% | 1.23% A |
Expenses net of all reductions | 1.31% | 1.22% A |
Net investment income (loss) | .69% | .63% A |
Supplemental Data | | |
Net assets, end of period (000 omitted) | $ 56,242 | $ 20,912 |
Portfolio turnover rate G | 63% | 42% |
A Annualized B Total returns for periods of less than one year are not annualized. C Total returns would have been lower had certain expenses not been reduced during the periods shown. D Total returns do not include the effect of the sales charges. E Calculated based on average shares outstanding during the period. F Fees and expenses of the underlying Fidelity Central Funds are not included in the Fund's expense ratio. The Fund indirectly bears its proportionate share of the expenses of any underlying Fidelity Central Funds. G Amount does not include the portfolio activity of any underlying Fidelity Central Funds. H For the period May 2, 2007 (commencement of sale of shares) to October 31, 2007. I Expense ratios reflect operating expenses of the class. Expenses before reductions do not reflect amounts reimbursed by the investment adviser or reductions from brokerage service arrangements or other expense offset arrangements and do not represent the amount paid by the class during periods when reimbursements or reductions occur. Expense ratios before reductions for start-up periods may not be representative of longer-term operating periods. Expenses net of fee waivers reflect expenses after reimbursement by the investment adviser but prior to reductions from brokerage service arrangements or other expense offset arrangements. Expenses net of all reductions represent the net expenses paid by the class. |
Financial Highlights - Class T
Years ended October 31, | 2008 | 2007 H |
Selected Per-Share Data | | |
Net asset value, beginning of period | $ 70.09 | $ 54.00 |
Income from Investment Operations | | |
Net investment income (loss) E | .23 | .09 |
Net realized and unrealized gain (loss) | (28.66) | 15.99 |
Total from investment operations | (28.43) | 16.08 |
Distributions from net investment income | (.33) | - |
Distributions from net realized gain | (3.27) | - |
Total distributions | (3.60) | - |
Redemption fees added to paid in capital E | .04 | .01 |
Net asset value, end of period | $ 38.10 | $ 70.09 |
Total ReturnB, C, D | (42.40)% | 29.80% |
Ratios to Average Net AssetsF, I | | |
Expenses before reductions | 1.63% | 1.48% A |
Expenses net of fee waivers, if any | 1.63% | 1.48% A |
Expenses net of all reductions | 1.60% | 1.47% A |
Net investment income (loss) | .40% | .30% A |
Supplemental Data | | |
Net assets, end of period (000 omitted) | $ 14,963 | $ 14,522 |
Portfolio turnover rateG | 63% | 42% |
A Annualized B Total returns for periods of less than one year are not annualized. C Total returns would have been lower had certain expenses not been reduced during the periods shown. D Total returns do not include the effect of the sales charges. E Calculated based on average shares outstanding during the period. F Fees and expenses of the underlying Fidelity Central Funds are not included in the Fund's expense ratio. The Fund indirectly bears its proportionate share of the expenses of any underlying Fidelity Central Funds. G Amount does not include the portfolio activity of any underlying Fidelity Central Funds. H For the period May 2, 2007 (commencement of sale of shares) to October 31, 2007. I Expense ratios reflect operating expenses of the class. Expenses before reductions do not reflect amounts reimbursed by the investment adviser or reductions from brokerage service arrangements or other expense offset arrangements and do not represent the amount paid by the class during periods when reimbursements or reductions occur. Expense ratios before reductions for start-up periods may not be representative of longer-term operating periods. Expenses net of fee waivers reflect expenses after reimbursement by the investment adviser but prior to reductions from brokerage service arrangements or other expense offset arrangements. Expenses net of all reductions represent the net expenses paid by the class. |
See accompanying notes which are an integral part of the financial statements.
Annual Report
Financial Highlights - Class B
Years ended October 31, | 2008 | 2007 H |
Selected Per-Share Data | | |
Net asset value, beginning of period | $ 69.88 | $ 54.00 |
Income from Investment Operations | | |
Net investment income (loss) E | (.06) | (.06) |
Net realized and unrealized gain (loss) | (28.54) | 15.93 |
Total from investment operations | (28.60) | 15.87 |
Distributions from net investment income | (.14) | - |
Distributions from net realized gain | (3.27) | - |
Total distributions | (3.41) | - |
Redemption fees added to paid in capital E | .04 | .01 |
Net asset value, end of period | $ 37.91 | $ 69.88 |
Total ReturnB, C, D | (42.68)% | 29.41% |
Ratios to Average Net AssetsF, I | | |
Expenses before reductions | 2.13% | 2.00% A |
Expenses net of fee waivers, if any | 2.13% | 2.00%A |
Expenses net of all reductions | 2.10% | 1.99%A |
Net investment income (loss) | (.10)% | (.21)%A |
Supplemental Data | | |
Net assets, end of period (000 omitted) | $ 5,615 | $ 4,078 |
Portfolio turnover rate G | 63% | 42% |
A Annualized B Total returns for periods of less than one year are not annualized. C Total returns would have been lower had certain expenses not been reduced during the periods shown. D Total returns do not include the effect of the contingent deferred sales charge. E Calculated based on average shares outstanding during the period. F Fees and expenses of the underlying Fidelity Central Funds are not included in the Fund's expense ratio. The Fund indirectly bears its proportionate share of the expenses of any underlying Fidelity Central Funds. G Amount does not include the portfolio activity of any underlying Fidelity Central Funds. H For the period May 2, 2007 (commencement of sale of shares) to October 31, 2007. I Expense ratios reflect operating expenses of the class. Expenses before reductions do not reflect amounts reimbursed by the investment adviser or reductions from brokerage service arrangements or other expense offset arrangements and do not represent the amount paid by the class during periods when reimbursements or reductions occur. Expense ratios before reductions for start-up periods may not be representative of longer-term operating periods. Expenses net of fee waivers reflect expenses after reimbursement by the investment adviser but prior to reductions from brokerage service arrangements or other expense offset arrangements. Expenses net of all reductions represent the net expenses paid by the class. |
Financial Highlights - Class C
Years ended October 31, | 2008 | 2007 H |
Selected Per-Share Data | | |
Net asset value, beginning of period | $ 69.91 | $ 54.00 |
Income from Investment Operations | | |
Net investment income (loss) E | (.05) | (.04) |
Net realized and unrealized gain (loss) | (28.52) | 15.94 |
Total from investment operations | (28.57) | 15.90 |
Distributions from net investment income | (.27) | - |
Distributions from net realized gain | (3.27) | - |
Total distributions | (3.54) | - |
Redemption fees added to paid in capitalE | .04 | .01 |
Net asset value, end of period | $ 37.84 | $ 69.91 |
Total ReturnB, C, D | (42.69)% | 29.46% |
Ratios to Average Net AssetsF, I | | |
Expenses before reductions | 2.13% | 1.99% A |
Expenses net of fee waivers, if any | 2.13% | 1.99%A |
Expenses net of all reductions | 2.10% | 1.97%A |
Net investment income (loss) | (.10)% | (.15)%A |
Supplemental Data | | |
Net assets, end of period (000 omitted) | $ 16,716 | $ 8,752 |
Portfolio turnover rate G | 63% | 42% |
A Annualized B Total returns for periods of less than one year are not annualized. C Total returns would have been lower had certain expenses not been reduced during the periods shown. D Total returns do not include the effect of the contingent deferred sales charge. E Calculated based on average shares outstanding during the period. F Fees and expenses of the underlying Fidelity Central Funds are not included in the Fund's expense ratio. The Fund indirectly bears its proportionate share of the expenses of any underlying Fidelity Central Funds. G Amount does not include the portfolio activity of any underlying Fidelity Central Funds. H For the period May 2, 2007 (commencement of sale of shares) to October 31, 2007. I Expense ratios reflect operating expenses of the class. Expenses before reductions do not reflect amounts reimbursed by the investment adviser or reductions from brokerage service arrangements or other expense offset arrangements and do not represent the amount paid by the class during periods when reimbursements or reductions occur. Expense ratios before reductions for start-up periods may not be representative of longer-term operating periods. Expenses net of fee waivers reflect expenses after reimbursement by the investment adviser but prior to reductions from brokerage service arrangements or other expense offset arrangements. Expenses net of all reductions represent the net expenses paid by the class. |
See accompanying notes which are an integral part of the financial statements.
Annual Report
Financial Highlights - Canada
Years ended October 31, | 2008 | 2007 | 2006 | 2005 | 2004 |
Selected Per-Share Data | | | | | |
Net asset value, beginning of period | $ 70.25 | $ 49.48 | $ 39.14 | $ 31.87 | $ 25.13 |
Income from Investment Operations | | | | | |
Net investment income (loss) B | .58 | .52 | .34 | .20 | .10 |
Net realized and unrealized gain (loss) | (28.83) | 21.62 | 10.15 | 7.12 | 6.74 |
Total from investment operations | (28.25) | 22.14 | 10.49 | 7.32 | 6.84 |
Distributions from net investment income | (.40) | (.36) | (.16) | (.08) | (.13) |
Distributions from net realized gain | (3.27) | (1.03) | (.01) | - | - |
Total distributions | (3.67) | (1.39) | (.17) | (.08) | (.13) |
Redemption fees added to paid in capitalB | .04 | .02 | .02 | .03 | .03 |
Net asset value, end of period | $ 38.37 | $ 70.25 | $ 49.48 | $ 39.14 | $ 31.87 |
Total ReturnA | (42.06)% | 46.03% | 26.93% | 23.11% | 27.45% |
Ratios to Average Net AssetsC, E | | | | | |
Expenses before reductions | 1.03% | .96% | 1.00% | 1.08% | 1.20% |
Expenses net of fee waivers, if any | 1.03% | .96% | 1.00% | 1.08% | 1.20% |
Expenses net of all reductions | 1.00% | .94% | .97% | 1.04% | 1.15% |
Net investment income (loss) | 1.00% | .94% | .74% | .55% | .34% |
Supplemental Data | | | | | |
Net assets, end of period (000 omitted) | $ 2,776,298 | $ 4,890,617 | $ 3,136,927 | $ 1,722,516 | $ 413,319 |
Portfolio turnover rateD | 63% | 42% | 50% | 24% | 47% |
A Total returns would have been lower had certain expenses not been reduced during the periods shown. B Calculated based on average shares outstanding during the period. C Fees and expenses of the underlying Fidelity Central Funds are not included in the Fund's expense ratio. The Fund indirectly bears its proportionate share of the expenses of any underlying Fidelity Central Funds. D Amount does not include the portfolio activity of any underlying Fidelity Central Funds. E Expense ratios reflect operating expenses of the class. Expenses before reductions do not reflect amounts reimbursed by the investment adviser or reductions from brokerage service arrangements or other expense offset arrangements and do not represent the amount paid by the class during periods when reimbursements or reductions occur. Expenses net of fee waivers reflect expenses after reimbursement by the investment adviser but prior to reductions from brokerage service arrangements or other expense offset arrangements. Expenses net of all reductions represent the net expenses paid by the class. |
Financial Highlights - Institutional Class
Years ended October 31, | 2008 | 2007 G |
Selected Per-Share Data | | |
Net asset value, beginning of period | $ 70.25 | $ 54.00 |
Income from Investment Operations | | |
Net investment income (loss) D | .52 | .25 |
Net realized and unrealized gain (loss) | (28.78) | 15.99 |
Total from investment operations | (28.26) | 16.24 |
Distributions from net investment income | (.45) | - |
Distributions from net realized gain | (3.27) | - |
Total distributions | (3.72) | - |
Redemption fees added to paid in capitalD | .04 | .01 |
Net asset value, end of period | $ 38.31 | $ 70.25 |
Total ReturnB, C | (42.11)% | 30.09% |
Ratios to Average Net AssetsE, H | | |
Expenses before reductions | 1.11% | 1.01%A |
Expenses net of fee waivers, if any | 1.11% | 1.01%A |
Expenses net of all reductions | 1.08% | .99%A |
Net investment income (loss) | .92% | .83%A |
Supplemental Data | | |
Net assets, end of period (000 omitted) | $ 8,870 | $ 4,064 |
Portfolio turnover rateF | 63% | 42% |
A Annualized B Total returns for periods of less than one year are not annualized. C Total returns would have been lower had certain expenses not been reduced during the periods shown. D Calculated based on average shares outstanding during the period. E Fees and expenses of the underlying Fidelity Central Funds are not included in the Fund's expense ratio. The Fund indirectly bears its proportionate share of the expenses of any underlying Fidelity Central Funds. F Amount does not include the portfolio activity of any underlying Fidelity Central Funds. G For the period May 2, 2007 (commencement of sale of shares) to October 31, 2007. H Expense ratios reflect operating expenses of the class. Expenses before reductions do not reflect amounts reimbursed by the investment adviser or reductions from brokerage service arrangements or other expense offset arrangements and do not represent the amount paid by the class during periods when reimbursements or reductions occur. Expense ratios before reductions for start-up periods may not be representative of longer-term operating periods. Expenses net of fee waivers reflect expenses after reimbursement by the investment adviser but prior to reductions from brokerage service arrangements or other expense offset arrangements. Expenses net of all reductions represent the net expenses paid by the class. |
See accompanying notes which are an integral part of the financial statements.
Annual Report
Canada
Notes to Financial Statements
For the period ended October 31, 2008
1. Organization.
Fidelity Canada Fund (the Fund) is a fund of Fidelity Investment Trust (the trust) and is authorized to issue an unlimited number of shares. The trust is registered under the Investment Company Act of 1940, as amended (the 1940 Act), as an open-end management investment company organized as a Massachusetts business trust. The Fund offers Class A, Class T, Class B, Class C, Canada, and Institutional Class shares, each of which has equal rights as to assets and voting privileges. Each class has exclusive voting rights with respect to matters that affect that class. Class B shares will automatically convert to Class A shares after a holding period of seven years from the initial date of purchase. Investment income, realized and unrealized capital gains and losses, the common expenses of the Fund, and certain fund-level expense reductions, if any, are allocated on a pro rata basis to each class based on the relative net assets of each class to the total net assets of the Fund. Each class differs with respect to transfer agent and distribution and service plan fees incurred. Certain expense reductions also differ by class.
2. Investments in Fidelity Central Funds.
The Fund may invest in Fidelity Central Funds, which are open-end investment companies available only to other investment companies and accounts managed by Fidelity Management & Research Company (FMR) and its affiliates. The Fund's Schedule of Investments lists each of the Fidelity Central Funds held as of period end, if any, as an investment of the Fund, but does not include the underlying holdings of each Fidelity Central Fund. As an Investing Fund, the Fund indirectly bears its proportionate share of the expenses of the underlying Fidelity Central Funds.
The Money Market Central Funds seek preservation of capital and current income and are managed by Fidelity Investments Money Management, Inc. (FIMM), an affiliate of FMR.
A complete unaudited list of holdings for each Fidelity Central Fund is available upon request or at the SEC's web site at www.sec.gov. In addition, the financial statements of the Fidelity Central Funds, which are not covered by the Fund's Report of Independent Registered Public Accounting Firm, are available on the SEC's web site or upon request.
3. Significant Accounting Policies.
The financial statements have been prepared in conformity with accounting principles generally accepted in the United States of America, which require management to make certain estimates and assumptions at the date of the financial statements. Actual results could differ from those estimates. The following summarizes the significant accounting policies of the Fund:
Security Valuation. Investments are valued as of 4:00 p.m. Eastern time on the last calendar day of the period. Wherever possible, the Fund uses independent pricing services approved by the Board of Trustees to value its investments.
Equity securities, including restricted securities, for which market quotations are readily available, are valued at the last reported sale price or official closing price as reported by an independent pricing service on the primary market or exchange on which they are traded. In the event there were no sales during the day or closing prices are not available, securities are valued at the last quoted bid price. Investments in open-end mutual funds, including the Fidelity Central Funds, are valued at their closing net asset value each business day. Short-term securities with remaining maturities of sixty days or less for which quotations are not readily available are valued at amortized cost, which approximates value.
When current market prices or quotations are not readily available or reliable, valuations may be determined in good faith in accordance with procedures adopted by the Board of Trustees. Factors used in determining value may include significant market or security specific events, changes in interest rates and credit quality, and developments in foreign markets which are monitored by evaluating the performance of ADRs, futures contracts and exchange-traded funds. The frequency with which these procedures are used cannot be predicted and may be utilized to a significant extent. The value of securities used for net asset value (NAV) calculation under these procedures may differ from published prices for the same securities.
Foreign Currency. The Fund uses foreign currency contracts to facilitate transactions in foreign-denominated securities. Losses from these transactions may arise from changes in the value of the foreign currency or if the counterparties do not perform under the contracts' terms.
Foreign-denominated assets, including investment securities, and liabilities are translated into U.S. dollars at the exchange rate at period end. Purchases and sales of investment securities, income and dividends received and expenses denominated in foreign currencies are translated into U.S. dollars at the exchange rate in effect on the transaction date.
The effects of exchange rate fluctuations on investments are included with the net realized and unrealized gain (loss) on investment securities. Other foreign currency transactions resulting in realized and unrealized gain (loss) are disclosed separately.
Investment Transactions and Income. For financial reporting purposes, the Fund's investment holdings and NAV include trades executed through the end of the last business day of the period. The NAV per share for processing shareholder transactions is calculated as of the close of business of the New York Stock Exchange (NYSE), normally 4:00 p.m. Eastern time and includes trades executed through the end of the prior business day. Gains and losses on securities sold are determined on the basis of identified cost and may include proceeds received from litigation. Dividend income is recorded
Annual Report
3. Significant Accounting Policies - continued
Investment Transactions and Income - continued
on the ex-dividend date, except for certain dividends from foreign securities where the ex-dividend date may have passed, which are recorded as soon as the Fund is informed of the ex-dividend date. Non-cash dividends included in dividend income, if any, are recorded at the fair market value of the securities received. Distributions received on securities that represent a return of capital or capital gain are recorded as a reduction of cost of investments and/or as a realized gain. The Fund estimates the components of distributions received that may be considered return of capital distributions or capital gain distributions. Interest income and distributions from the Fidelity Central Funds are accrued as earned. Interest income includes coupon interest and amortization of premium and accretion of discount on debt securities. Investment income is recorded net of foreign taxes withheld where recovery of such taxes is uncertain.
Expenses. Most expenses of the trust can be directly attributed to a fund. Expenses which cannot be directly attributed are apportioned among each Fund in the trust. Expense estimates are accrued in the period to which they relate and adjustments are made when actual amounts are known.
Income Tax Information and Distributions to Shareholders. Each year, the Fund intends to qualify as a regulated investment company by distributing substantially all of its taxable income and realized gains under Subchapter M of the Internal Revenue Code and filing its U.S. federal tax return. As a result, no provision for income taxes is required. The Fund is subject to the provisions of FASB Interpretation No. 48, Accounting for Uncertainties in Income Taxes (FIN 48). FIN 48 sets forth a minimum threshold for financial statement recognition of the benefit of a tax position taken or expected to be taken in a tax return. The implementation of FIN 48 did not result in any unrecognized tax benefits in the accompanying financial statements. Each of the Fund's federal tax returns for the prior three fiscal years remains subject to examination by the Internal Revenue Service (IRS). Foreign taxes are provided for based on the Fund's understanding of the tax rules and rates that exist in the foreign markets in which it invests.
Distributions are recorded on the ex-dividend date. Income dividends and capital gain distributions are declared separately for each class. Income and capital gain distributions are determined in accordance with income tax regulations, which may differ from generally accepted accounting principles. In addition, the Fund will claim a portion of the payment made to redeeming shareholders as a distribution for income tax purposes.
Capital accounts within the financial statements are adjusted for permanent book-tax differences. These adjustments have no impact on net assets or the results of operations. Temporary book-tax differences will reverse in a subsequent period.
Book-tax differences are primarily due to foreign currency transactions, market discount, partnerships, deferred trustees compensation, capital loss carryforwards and losses deferred due to wash sales.
The tax-basis components of distributable earnings and the federal tax cost as of period end were as follows:
Unrealized appreciation | $ 324,549,848 |
Unrealized depreciation | (726,804,328) |
Net unrealized appreciation (depreciation) | (402,254,480) |
Undistributed ordinary income | 2,358,954 |
Capital loss carryforward | (109,618,723) |
| |
Cost for federal income tax purposes | $ 3,357,376,495 |
The tax character of distributions paid was as follows:
| October 31, 2008 | October 31, 2007 |
Ordinary Income | $ 73,476,845 | $ 44,702,026 |
Long-term Capital Gains | 190,461,764 | 44,063,418 |
Total | $ 263,938,609 | $ 88,765,444 |
Short-Term Trading (Redemption) Fees. Shares held in the Fund less than 90 days are subject to a redemption fee equal to 1.50% of the proceeds of the redeemed shares. All redemption fees, including any estimated redemption fees paid by FMR, are retained by the Fund and accounted for as an addition to paid in capital.
New Accounting Pronouncement. In September 2006, Statement of Financial Accounting Standards No. 157, Fair Value Measurements (SFAS 157), was issued and is effective for fiscal years beginning after November 15, 2007. SFAS 157 defines fair value, establishes a framework for measuring fair value and results in expanded disclosures about fair value measurements.
Annual Report
Canada
Notes to Financial Statements - continued
4. Operating Policies.
Repurchase Agreements. FMR has received an Exemptive Order from the Securities and Exchange Commission (the SEC) which permits the Fund and other affiliated entities of FMR to transfer uninvested cash balances into joint trading accounts which are then invested in repurchase agreements. The Fund may also invest directly with institutions in repurchase agreements. Repurchase agreements are collateralized by government or non-government securities. Upon settlement date, collateral is held in segregated accounts with custodian banks and may be obtained in the event of a default of the counterparty. The Fund monitors, on a daily basis, the value of the collateral to ensure it is at least equal to the principal amount of the repurchase agreement (including accrued interest). In the event of a default by the counterparty, realization of the collateral proceeds could be delayed, during which time the value of the collateral may decline.
5. Purchases and Sales of Investments.
Purchases and sales of securities, other than short-term securities, aggregated $3,167,394,306 and $2,747,790,024, respectively.
6. Fees and Other Transactions with Affiliates.
Management Fee. FMR and its affiliates provide the Fund with investment management related services for which the Fund pays a monthly management fee. The management fee is the sum of an individual fund fee rate that is based on an annual rate of .45% of the Fund's average net assets and a group fee rate that averaged .26% during the period. The group fee rate is based upon the average net assets of all the mutual funds advised by FMR. The group fee rate decreases as assets under management increase and increases as assets under management decrease. In addition, the management fee is subject to a performance adjustment(up to a maximum of +/- .20% of the Fund's average net assets over a 36 month performance period). The upward or downward adjustment to the management fee is based on the relative investment performance of the retail class of the Fund, Canada as compared to an appropriate benchmark index. For the period, the total annual management fee rate, including the performance adjustment, was .76% of the Fund's average net assets.
Distribution and Service Plan. In accordance with Rule 12b-1 of the 1940 Act, the Fund has adopted separate Distribution and Service Plans for each class of shares. Certain classes pay Fidelity Distributors Corporation (FDC), an affiliate of FMR, separate Distribution and Service Fees, each of which is based on an annual percentage of each class' average net assets. In addition, FDC may pay financial intermediaries for selling shares of the Fund and providing shareholder support services. For the period, the Distribution and Service Fee rates and the total amounts paid to and retained by FDC were as follows:
| Distribution
Fee | Service
Fee | Paid to
FDC | Retained
by FDC |
Class A | 0% | .25% | $ 134,706 | $ 11,780 |
Class T | .25% | .25% | 94,298 | 591 |
Class B | .75% | .25% | 59,556 | 44,734 |
Class C | .75% | .25% | 187,498 | 129,911 |
| | | $ 476,058 | $ 187,016 |
Sales Load. FDC receives a front-end sales charge of up to 5.75% for selling Class A shares, and 3.50% for selling Class T shares, some of which is paid to financial intermediaries for selling shares of the Fund. FDC receives the proceeds of contingent deferred sales charges levied on Class A, Class T, Class B, and Class C redemptions. These charges depend on the holding period. The deferred sales charges range from 5% to 1% for Class B, 1% for Class C, 1.00% to .50% for certain purchases of Class A shares and .25% for certain purchases of Class T shares.
For the period, sales charge amounts retained by FDC were as follows:
| Retained
by FDC |
Class A | $ 153,357 |
Class T | 23,474 |
Class B* | 42,730 |
Class C* | 13,585 |
| $ 233,146 |
* When Class B and Class C shares are initially sold, FDC pays commissions from its own resources to financial intermediaries through which the sales are made.
Annual Report
6. Fees and Other Transactions with Affiliates - continued
Transfer Agent Fees. Fidelity Investments Institutional Operations Company, Inc. (FIIOC), an affiliate of FMR, is the transfer, dividend disbursing and shareholder servicing agent for each class of the Fund. FIIOC receives account fees and asset-based fees that vary according to the account size and type of account of the shareholders of the respective classes of the Fund. FIIOC pays for typesetting, printing and mailing of shareholder reports, except proxy statements. Prior to January 1, 2008, Fidelity Service Company, Inc. (FSC), also an affiliate of FMR, was the transfer agent for Canada. For the period, each class paid the following transfer agent fees:
| Amount | % of
Average
Net Assets |
Class A | $ 147,254 | .27 |
Class T | 58,242 | .31 |
Class B | 18,975 | .32 |
Class C | 58,666 | .31 |
Canada | 9,834,578 | .22 |
Institutional Class | 30,321 | .30 |
| $ 10,148,036 | |
Accounting and Security Lending Fees. FSC maintains the Fund's accounting records. The accounting fee is based on the level of average net assets for the month. Under a separate contract, FSC administers the security lending program. The security lending fee is based on the number and duration of lending transactions.
Brokerage Commissions. The Fund placed a portion of its portfolio transactions with brokerage firms which are affiliates of the investment adviser. The commissions paid to these affiliated firms were $774 for the period.
Interfund Lending Program. Pursuant to an Exemptive Order issued by the SEC, the Fund, along with other registered investment companies having management contracts with FMR, may participate in an interfund lending program. This program provides an alternative credit facility allowing the funds to borrow from, or lend money to, other participating affiliated funds. At period end, there were no interfund loans outstanding. The Fund's activity in this program during the period for which loans were outstanding was as follows:
Borrower or Lender | Average Daily
Loan Balance | Weighted Average Interest Rate | Interest
Expense |
Borrower | $ 36,021,500 | 4.23% | $ 8,474 |
7. Committed Line of Credit.
The Fund participates with other funds managed by FMR in a $4.2 billion credit facility (the "line of credit") to be utilized for temporary or emergency purposes to fund shareholder redemptions or for other short-term liquidity purposes. The Fund has agreed to pay commitment fees on its pro rata portion of the line of credit, which amounted to $9,367 and is reflected in Miscellaneous Expense on the Statement of Operations. During the period, there were no borrowings on this line of credit.
8. Security Lending.
The Fund lends portfolio securities from time to time in order to earn additional income. On the settlement date of the loan, the Fund receives collateral (in the form of U.S. Treasury obligations, letters of credit and/or cash) against the loaned securities and maintains collateral in an amount not less than 100% of the market value of the loaned securities during the period of the loan. The market value of the loaned securities is determined at the close of business of the Fund and any additional required collateral is delivered to the Fund on the next business day. If the borrower defaults on its obligation to return the securities loaned because of insolvency or other reasons, a fund could experience delays and costs in recovering the securities loaned or in gaining access to the collateral. Any cash collateral received is invested in the Fidelity Securities Lending Cash Central Fund. The value of loaned securities and cash collateral at period end are disclosed on the Fund's Statement of Assets and Liabilities. Security lending income represents the income earned on investing cash collateral, less fees and expenses associated with the loan, plus any premium payments that may be received on the loan of certain types of securities. Security lending income is presented in the Statement of Operations as a component of income from Fidelity Central Funds.
Annual Report
Canada
Notes to Financial Statements - continued
9. Expense Reductions.
FMR voluntarily agreed to reimburse a portion of Canada's operating expenses. During the period, this reimbursement reduced the class' expenses by $48,320.
Many of the brokers with whom FMR places trades on behalf of the Fund provided services to the Fund in addition to trade execution. These services included payments of certain expenses on behalf of the Fund totaling $1,316,221 for the period. In addition, through arrangements with the Fund's custodian and each class' transfer agent, credits realized as a result of uninvested cash balances were used to reduce the Fund's expenses. During the period, these credits reduced the Fund's custody expenses by $10,680. During the period, credits reduced each class' transfer agent expense as noted in the table below.
| Transfer Agent
expense reduction |
Canada | $ 39,451 |
10. Other.
The Fund's organizational documents provide former and current trustees and officers with a limited indemnification against liabilities arising in connection with the performance of their duties to the Fund. In the normal course of business, the Fund may also enter into contracts that provide general indemnifications. The Fund's maximum exposure under these arrangements is unknown as this would be dependent on future claims that may be made against the Fund. The risk of material loss from such claims is considered remote.
In December 2006, the Independent Trustees, with the assistance of independent counsel, completed an investigation regarding gifts, gratuities and business entertainment provided by certain brokers to certain individuals who were employed on FMR's domestic equity trading desk during the period 2002 to 2004. The Independent Trustees and FMR agreed that, despite the absence of proof that the Fidelity mutual funds experienced diminished execution quality as a result of the improper receipt of gifts and business entertainment, the conduct at issue was serious and was worthy of redress. Accordingly, the Independent Trustees requested, and FMR agreed to make, a payment of $42 million plus accrued interest, which equaled approximately $7.3 million, to certain Fidelity mutual funds.
In March 2008, the Trustees approved a method for allocating this payment among the funds and, in total, FMR paid the fund $1,279, which is recorded in the accompanying Statement of Operations.
In a related administrative order dated March 5, 2008, the U.S. Securities and Exchange Commission ("SEC") announced a settlement with FMR and FMR Co., Inc. (an affiliate of FMR) involving the SEC's regulatory rules for investment advisers and the improper receipt of gifts, gratuities and business entertainment. Without admitting or denying the SEC's findings, FMR agreed to pay an $8 million civil penalty to the United States Treasury.
11. Distributions to Shareholders.
Distributions to shareholders of each class were as follows:
Years ended October 31, | 2008 | 2007 |
From net investment income | | |
Class A | $ 171,586 | $ - |
Class T | 73,859 | - |
Class B | 8,835 | - |
Class C | 45,389 | - |
Canada | 28,579,259 | 22,989,617 |
Institutional Class | 37,051 | - |
Total | $ 28,915,979 | $ 22,989,617 |
From net realized gain | | |
Class A | $ 1,361,853 | $ - |
Class T | 736,334 | - |
Class B | 209,359 | - |
Class C | 549,710 | - |
Canada | 231,896,136 | 65,775,827 |
Institutional Class | 269,238 | - |
Total | $ 235,022,630 | $ 65,775,827 |
Annual Report
12. Share Transactions.
Transactions for each class of shares were as follows:
| Shares | Dollars |
Years ended October 31, | 2008 | 2007 A | 2008 | 2007 A |
Class A | | | | |
Shares sold | 1,623,645 | 308,956 | $ 96,358,055 | $ 19,422,841 |
Reinvestment of distributions | 24,107 | - | 1,454,159 | - |
Shares redeemed | (473,393) | (10,905) | (24,545,534) | (645,019) |
Net increase (decrease) | 1,174,359 | 298,051 | $ 73,266,680 | $ 18,777,822 |
Class T | | | | |
Shares sold | 281,102 | 208,648 | $ 16,813,582 | $ 12,838,431 |
Reinvestment of distributions | 13,222 | - | 797,422 | - |
Shares redeemed | (108,759) | (1,454) | (5,550,777) | (89,047) |
Net increase (decrease) | 185,565 | 207,194 | $ 12,060,227 | $ 12,749,384 |
Class B | | | | |
Shares sold | 143,582 | 110,050 | $ 8,590,562 | $ 6,654,427 |
Reinvestment of distributions | 2,917 | - | 175,839 | - |
Shares redeemed | (56,743) | (51,696) | (3,089,676) | (3,069,986) |
Net increase (decrease) | 89,756 | 58,354 | $ 5,676,725 | $ 3,584,441 |
Class C | | | | |
Shares sold | 454,502 | 134,518 | $ 27,139,418 | $ 8,317,609 |
Reinvestment of distributions | 8,472 | - | 509,854 | - |
Shares redeemed | (146,400) | (9,336) | (7,449,898) | (570,425) |
Net increase (decrease) | 316,574 | 125,182 | $ 20,199,374 | $ 7,747,184 |
Canada | | | | |
Shares sold | 34,673,241 | 32,853,429 | $ 2,070,491,480 | $ 1,882,759,894 |
Reinvestment of distributions | 3,970,249 | 1,757,370 | 239,922,156 | 85,654,201 |
Shares redeemed | (35,906,020) | (28,386,777) | (1,927,559,508) | (1,547,811,990) |
Net increase (decrease) | 2,737,470 | 6,224,022 | $ 382,854,128 | $ 420,602,105 |
Institutional Class | | | | |
Shares sold | 377,605 | 61,781 | $ 22,481,855 | $ 3,830,515 |
Reinvestment of distributions | 4,721 | - | 285,066 | - |
Shares redeemed | (208,616) | (3,937) | (9,811,769) | (234,902) |
Net increase (decrease) | 173,710 | 57,844 | $ 12,955,152 | $ 3,595,613 |
A Share transactions for Class A, Class T, Class B, Class C and Institutional Class are for the period May 2, 2007 (commencement of sale of shares) to October 31, 2007.
Annual Report
Report of Independent Registered Public Accounting Firm
To the Trustees of Fidelity Investment Trust and the Shareholders of Fidelity Canada Fund:
In our opinion, the accompanying statement of assets and liabilities, including the schedule of investments, and the related statements of operations and of changes in net assets and the financial highlights present fairly, in all material respects, the financial position of Fidelity Canada Fund (a fund of Fidelity Investment Trust) at October 31, 2008, the results of its operations for the year then ended, the changes in its net assets for each of the two years in the period then ended and the financial highlights for each of the periods indicated, in conformity with accounting principles generally accepted in the United States of America. These financial statements and financial highlights (hereafter referred to as "financial statements") are the responsibility of the Fidelity Canada Fund's management. Our responsibility is to express an opinion on these financial statements based on our audits. We conducted our audits of these financial statements in accordance with the standards of the Public Company Accounting Oversight Board (United States). Those standards require that we plan and perform the audit to obtain reasonable assurance about whether the financial statements are free of material misstatement. An audit includes examining, on a test basis, evidence supporting the amounts and disclosures in the financial statements, assessing the accounting principles used and significant estimates made by management, and evaluating the overall financial statement presentation. We believe that our audits, which included confirmation of securities at October 31, 2008 by correspondence with the custodian and brokers, provide a reasonable basis for our opinion.
/s/ PricewaterhouseCoopers LLP
PricewaterhouseCoopers LLP
Boston, Massachusetts
December 23, 2008
Annual Report
The Trustees, Member of the Advisory Board, and executive officers of the trust and fund, as applicable, are listed below. The Board of Trustees governs the fund and is responsible for protecting the interests of shareholders. The Trustees are experienced executives who meet periodically throughout the year to oversee the fund's activities, review contractual arrangements with companies that provide services to the fund, and review the fund's performance. Except for Edward C. Johnson 3d and James C. Curvey, each of the Trustees oversees 220 funds advised by FMR or an affiliate. Messrs. Johnson and Curvey oversee 379 funds advised by FMR or an affiliate.
The Trustees hold office without limit in time except that (a) any Trustee may resign; (b) any Trustee may be removed by written instrument, signed by at least two-thirds of the number of Trustees prior to such removal; (c) any Trustee who requests to be retired or who has become incapacitated by illness or injury may be retired by written instrument signed by a majority of the other Trustees; and (d) any Trustee may be removed at any special meeting of shareholders by a two-thirds vote of the outstanding voting securities of the trust. Each Trustee who is not an interested person (as defined in the 1940 Act) (Independent Trustee), shall retire not later than the last day of the calendar year in which his or her 72nd birthday occurs. The Independent Trustees may waive this mandatory retirement age policy with respect to individual Trustees. The executive officers and Advisory Board Member hold office without limit in time, except that any officer and Advisory Board Member may resign or may be removed by a vote of a majority of the Trustees at any regular meeting or any special meeting of the Trustees. Except as indicated, each individual has held the office shown or other offices in the same company for the past five years.
The fund's Statement of Additional Information (SAI) includes more information about the Trustees. To request a free copy call Fidelity at 1-877-208-0098.
Interested Trustees*:
Correspondence intended for each Trustee who is an interested person may be sent to Fidelity Investments, 82 Devonshire Street, Boston, Massachusetts 02109.
Name, Age; Principal Occupation |
Edward C. Johnson 3d (78) |
| Year of Election or Appointment: 1984 Mr. Johnson is Chairman of the Board of Trustees. Mr. Johnson serves as Chief Executive Officer, Chairman, and a Director of FMR LLC; Chairman and a Director of FMR; Chairman and a Director of Fidelity Research & Analysis Company (FRAC); Chairman and a Director of Fidelity Investments Money Management, Inc.; and Chairman and a Director of FMR Co., Inc. In addition, Mr. Johnson serves as Chairman and Director of FIL Limited. Previously, Mr. Johnson served as President of FMR LLC (2006-2007). |
James C. Curvey (73) |
| Year of Election or Appointment: 2007 Mr. Curvey also serves as Trustee (2007-present) of other investment companies advised by FMR. Mr. Curvey is a Director of FMR and FMR Co., Inc. (2007-present). Mr. Curvey is also Vice Chairman (2006-present) and Director of FMR LLC. In addition, Mr. Curvey serves as an Overseer for the Boston Symphony Orchestra and a member of the Trustees of Villanova University. |
* Trustees have been determined to be "Interested Trustees" by virtue of, among other things, their affiliation with the trust or various entities under common control with FMR. FMR Corp. merged with and into FMR LLC on October 1, 2007. Any references to FMR LLC for prior periods are deemed to be references to the prior entity.
Independent Trustees:
Correspondence intended for each Independent Trustee (that is, the Trustees other than the Interested Trustees) may be sent to Fidelity Investments, P.O. Box 55235, Boston, Massachusetts 02205-5235.
Name, Age; Principal Occupation |
Dennis J. Dirks (60) |
| Year of Election or Appointment: 2005 Prior to his retirement in May 2003, Mr. Dirks was Chief Operating Officer and a member of the Board of The Depository Trust & Clearing Corporation (DTCC) (1999-2003). He also served as President, Chief Operating Officer, and Board member of The Depository Trust Company (DTC) (1999-2003) and President and Board member of the National Securities Clearing Corporation (NSCC) (1999-2003). In addition, Mr. Dirks served as a Trustee and a member of the Finance Committee of Manhattan College (2005-2008), and as Chief Executive Officer and Board member of the Government Securities Clearing Corporation (2001-2003) and Chief Executive Officer and Board member of the Mortgage-Backed Securities Clearing Corporation (2001-2003). Mr. Dirks also serves as a Trustee and a member of the Finance Committee of AHRC of Nassau County (2006-present). |
Alan J. Lacy (55) |
| Year of Election or Appointment: 2008 Mr. Lacy serves as Senior Adviser (2007-present) of Oak Hill Capital Partners, L.P. (a private equity firm). Mr. Lacy also served as Chief Executive Officer (2000-2005) and Vice Chairman (2005-2006) of Sears Holdings Corporation and Sears, Roebuck and Co. (retail). In addition, Mr. Lacy serves as a member of the Board of Directors of The Western Union Company (global money transfer, 2006-present) and Bristol-Myers Squibb (global pharmaceuticals, 2007-present). Mr. Lacy is a Trustee of the National Parks Conservation Association and The Field Museum of Natural History. |
Ned C. Lautenbach (64) |
| Year of Election or Appointment: 2000 Mr. Lautenbach is Chairman of the Independent Trustees (2006-present). Mr. Lautenbach is an Advisory Partner of Clayton, Dubilier & Rice, Inc. (private equity investment firm). Previously, Mr. Lautenbach was with the International Business Machines Corporation (IBM) from 1968 until his retirement in 1998. Mr. Lautenbach serves as a Director of Eaton Corporation (diversified industrial) as well as the Philharmonic Center for the Arts in Naples, Florida. He also is a member of the Board of Trustees of Fairfield University (2005-present), as well as a member of the Council on Foreign Relations. Previously, Mr. Lautenbach served as a Director of Sony Corporation (2006-2007). |
Joseph Mauriello (64) |
| Year of Election or Appointment: 2008 Prior to his retirement in January 2006, Mr. Mauriello served in numerous senior management positions including Deputy Chairman and Chief Operating Officer (2004-2005), and Vice Chairman of Financial Services (2002-2004) of KPMG LLP US (professional services firm, 1965-2005). Mr. Mauriello currently serves as a member of the Board of Directors of XL Capital Ltd. (global insurance and re-insurance company, 2006-present) and of Arcadia Resources Inc. (health care services and products, 2007-
present). He also served as a Director of the Hamilton Funds of the Bank of New York (2006-2007). |
Cornelia M. Small (64) |
| Year of Election or Appointment: 2005 Ms. Small is a member of the Investment Committee, and Chair (2008-present) and a member of the Board of Trustees of Smith College. Ms. Small also serves on the Investment Committee of the Berkshire Taconic Community Foundation (2008-present). Previously, Ms. Small served as Chairperson of the Investment Committee (2002-2008) of Smith College and as Co-Chair (2000-
2003) of the Annual Fund for the Fletcher School of Law and Diplomacy. In addition, she served as Chief Investment Officer, Director of Global Equity Investments, and a member of the Board of Directors of Scudder, Stevens & Clark and Scudder Kemper Investments. |
William S. Stavropoulos (69) |
| Year of Election or Appointment: 2001 Mr. Stavropoulos is Chairman Emeritus of the Board of Directors of The Dow Chemical Company, where he previously served in numerous senior management positions, including President (1993-2000; 2002-2003), CEO (1995-2000; 2002-2004), Chairman of the Executive Committee (2000-2006), and as a member of the Board of Directors (1990-2006). Currently, he is a Director of Teradata Corporation (data warehousing and technology solutions, 2008-present), Chemical Financial Corporation, Maersk Inc. (industrial conglomerate), Tyco International, Inc. (multinational manufacturing and services, 2007-present), and a member of the Advisory Board for Metalmark Capital (private equity investment firm, 2005-present). He is a special advisor to Clayton, Dubilier & Rice, Inc. (private equity investment). In addition, Mr. Stavropoulos is a member of the University of Notre Dame Advisory Council for the College of Science. |
David M. Thomas (59) |
| Year of Election or Appointment: 2008 Previously, Mr. Thomas served as Executive Chairman (2005-2006) and Chairman and Chief Executive Officer (2000-2005) of IMS Health, Inc. (pharmaceutical and healthcare information solutions). In addition, Mr. Thomas serves as a member of the Board of Directors of Fortune Brands, Inc. (consumer products holding company), and Interpublic Group of Companies, Inc. (marketing communication, 2004-present). |
Michael E. Wiley (58) |
| Year of Election or Appointment: 2008 Mr. Wiley also serves as a member of the Board of Trustees of the University of Tulsa (2000-2006; 2007-present). He serves as a Director of Tesoro Corporation (independent oil refiner and marketer, 2005-present), and a Director of Bill Barrett Corporation (exploration and production company, 2005-present). In addition, he also serves as a Director of Post Oak Bank (privately-held bank, 2004-present). Previously, Mr. Wiley served as a Sr. Energy Advisor of Katzenbach Partners, LLC (consulting firm, 2006-2007), as an Advisory Director of Riverstone Holdings (private investment firm), Chairman, President, and CEO of Baker Hughes, Inc. (oilfield services company, 2000-2004), and as Director of Spinnaker Exploration Company (exploration and production company, 2001-2005). |
Annual Report
Trustees and Officers - continued
Advisory Board Member and Executive Officers**:
Correspondence intended for each executive officer and Mr. Lynch may be sent to Fidelity Investments, 82 Devonshire Street, Boston, Massachusetts 02109.
Name, Age; Principal Occupation |
Peter S. Lynch (64) |
| Year of Election or Appointment: 2003 Member of the Advisory Board of Fidelity's Equity and High Income Funds. Mr. Lynch is Vice Chairman and a Director of FMR, and Vice Chairman (2001-present) and a Director of FMR Co., Inc. Previously, Mr. Lynch served as a Trustee of the Fidelity funds (1990-2003). In addition, he serves as a Trustee of Boston College and as the Chairman of the Inner-City Scholarship Fund. Previously, Mr. Lynch served on the Special Olympics International Board of Directors (1997-2006). |
Kenneth B. Robins (39) |
| Year of Election or Appointment: 2008 President and Treasurer of Fidelity's Equity and High Income Funds. Mr. Robins is an employee of Fidelity Investments (2004-
present). Before joining Fidelity Investments, Mr. Robins worked at KPMG LLP, where he was a partner in KPMG's department of professional practice (2002-2004). |
Walter C. Donovan (46) |
| Year of Election or Appointment: 2007 Vice President of Fidelity's Equity Funds. Mr. Donovan also serves as President of FMR and FMR Co., Inc., and Executive Vice President of Fidelity Investments Money Management, Inc. (2007-present). Previously, Mr. Donovan served as Executive Vice President of FMR and FMR Co., Inc. (2005-2007) and Senior Vice President of FMR (2003-2005) and FMR Co., Inc. (2004-2005). |
Eric M. Wetlaufer (46) |
| Year of Election or Appointment: 2006 Vice President of Fidelity's International Equity Funds. Mr. Wetlaufer also serves as Group Chief Investment Officer of FMR. Mr. Wetlaufer is Chairman, Chief Executive Officer, and President of Fidelity Management & Research (Hong Kong) Limited (2008-present); Chairman, Chief Executive Officer, President, and a Director of Fidelity Management & Research (Japan) Inc. (2008-present); Chairman and Chief Executive Officer (2007-present) and President and a Director (2006-present) of Fidelity Management & Research (U.K.) Inc. and President and a Director of Fidelity Research & Analysis Company (2006-present). Before joining Fidelity Investments in 2005, Mr. Wetlaufer was a partner in Oxhead Capital Management (2004-2005) and a Chief Investment Officer of Putnam Investments (1997-2003). |
Scott C. Goebel (40) |
| Year of Election or Appointment: 2008 Secretary and Chief Legal Officer (CLO) of the Fidelity funds. Mr. Goebel also serves as General Counsel, Secretary, and Senior Vice President of FMR (2008-present); Deputy General Counsel of FMR LLC; Chief Legal Secretary of Fidelity Management & Research (Hong Kong) Limited (2008-present) and Assistant Secretary of Fidelity Management & Research (Japan) Inc. (2008-
present). Previously, Mr. Goebel served as Assistant Secretary of the Funds (2007-2008) and as Vice President and Secretary of Fidelity Distributors Corporation (FDC) (2005-2007). |
John B. McGinty, Jr. (46) |
| Year of Election or Appointment: 2008 Assistant Secretary of Fidelity's Equity and High Income Funds. Mr. McGinty is an employee of Fidelity Investments (2004-present). Mr. McGinty also serves as Senior Vice President, Secretary, and Chief Legal Officer of [Fidelity Distributors Corporation (FDC)/FDC] (2007-present). Before joining Fidelity Investments, Mr. McGinty practiced law at Ropes & Gray, LLP. |
Holly C. Laurent (54) |
| Year of Election or Appointment: 2008 Anti-Money Laundering (AML) Officer of the Fidelity funds. Ms. Laurent is an employee of Fidelity Investments. Previously, Ms. Laurent was Senior Vice President and Head of Legal for Fidelity Business Services India Pvt. Ltd. (2006-2008), Senior Vice President, Deputy General Counsel and Group Head for FMR LLC (2005-2006). |
Christine Reynolds (50) |
| Year of Election or Appointment: 2008 Chief Financial Officer of the Fidelity funds. Ms. Reynolds became President of Fidelity Pricing and Cash Management Services (FPCMS) in August 2008. She served as Chief Operating Officer of FPCMS from 2007 through July 2008. Previously, Ms. Reynolds served as President, Treasurer, and Anti-Money Laundering officer of the Fidelity funds (2004-2007). Before joining Fidelity Investments, Ms. Reynolds worked at PricewaterhouseCoopers LLP (PwC) (1980-2002), where she was an audit partner with PwC's investment management practice. |
Kenneth A. Rathgeber (61) |
| Year of Election or Appointment: 2004 Chief Compliance Officer of Fidelity's Equity and High Income Funds. Mr. Rathgeber is Chief Compliance Officer of Fidelity Management & Research (Hong Kong) Limited (2008-present), Fidelity Management & Research (Japan) Inc. (2008-present), FMR (2005-present), FMR Co., Inc. (2005-present), Fidelity Management & Research (U.K.) Inc. (2005-present), Fidelity Research & Analysis Company (2005-present), Fidelity Investments Money Management, Inc. (2005-present), and Strategic Advisers, Inc. (2005-present). |
Bryan A. Mehrmann (47) |
| Year of Election or Appointment: 2005 Deputy Treasurer of the Fidelity funds. Mr. Mehrmann is an employee of Fidelity Investments. Previously, Mr. Mehrmann served as Vice President of Fidelity Investments Institutional Services Group (FIIS)/Fidelity Investments Institutional Operations Corporation, Inc. (FIIOC) Client Services (1998-2004). |
Adrien E. Deberghes (41) |
| Year of Election or Appointment: 2008 Deputy Treasurer of Fidelity's Equity and High Income Funds. Mr. Deberghes is an employee of Fidelity Investments (2008-present). Previously, Mr. Deberghes served as Senior Vice President of Mutual Fund Administration at State Street Corporation (2007-2008), Senior Director of Mutual Fund Administration at Investors Bank & Trust (2005-2007), and Director of Finance for Dunkin' Brands (2000-2005). |
Robert G. Byrnes (41) |
| Year of Election or Appointment: 2005 Assistant Treasurer of the Fidelity funds. Mr. Byrnes is an employee of Fidelity Investments (2005-present). Previously, Mr. Byrnes served as Vice President of Fidelity Pricing and Cash Management Services (FPCMS) (2003-2005). Before joining Fidelity Investments, Mr. Byrnes worked at Deutsche Asset Management where he served as Vice President of the Investment Operations Group (2000-2003). |
Peter L. Lydecker (54) |
| Year of Election or Appointment: 2004 Assistant Treasurer of the Fidelity funds. Mr. Lydecker is an employee of Fidelity Investments. |
Paul M. Murphy (61) |
| Year of Election or Appointment: 2007 Assistant Treasurer of the Fidelity funds. Mr. Murphy is an employee of Fidelity Investments (2007-present). Previously, Mr. Murphy served as Chief Financial Officer of the Fidelity Funds (2005-2006), Vice President and Associate General Counsel of FMR (2007), and Senior Vice President of Fidelity Pricing and Cash Management Services (FPCMS) (1994-2007). |
Gary W. Ryan (50) |
| Year of Election or Appointment: 2005 Assistant Treasurer of the Fidelity funds. Mr. Ryan is an employee of Fidelity Investments. Previously, Mr. Ryan served as Vice President of Fund Reporting in Fidelity Pricing and Cash Management Services (FPCMS) (1999-2005). |
** FMR Corp. merged with and into FMR LLC on October 1, 2007. Any references to FMR LLC for prior periods are deemed to be references to the prior entity.
Annual Report
The Institutional Class designates 18% of the dividends distributed during the fiscal year as amounts which may be taken into account as a dividend for the purposes of the maximum rate under section 1(h)(11) of the Internal Revenue Code.
The amounts per share which represent income derived from sources within, and taxes paid to, foreign countries or possessions of the United States are as follows:
| Pay Date | Income | Taxes |
Institutional Class | 12/10/07 | $.781 | $.106 |
The fund will notify shareholders in January 2009 of amounts for use in preparing 2008 income tax returns.
Annual Report
A special meeting of the fund's shareholders was held on December 13, 2007. The results of votes taken among shareholders on the proposals before them are reported below. Each vote reported represents one dollar of net asset value held on the record date for the meeting.
PROPOSAL 1 |
To amend the Declaration of Trust to reduce the required quorum for shareholder meetings.A |
| # of
Votes | % of
Votes |
Affirmative | 45,014,793,255.82 | 80.372 |
Against | 6,871,112,667.08 | 12.268 |
Abstain | 2,163,456,438.02 | 3.863 |
Broker Non-Votes | 1,958,633,563.89 | 3.497 |
TOTAL | 56,007,995,924.81 | 100.000 |
PROPOSAL 2 |
To elect the nominees specified below as Trustees.A |
| # of
Votes | % of
Votes |
James C. Curvey |
Affirmative | 53,384,952,361.03 | 95.317 |
Withheld | 2,623,043,563.78 | 4.683 |
TOTAL | 56,007,995,924.81 | 100.000 |
Dennis J. Dirks |
Affirmative | 53,595,104,608.67 | 95.692 |
Withheld | 2,412,891,316.14 | 4.308 |
TOTAL | 56,007,995,924.81 | 100.000 |
Albert R. Gamper, Jr. |
Affirmative | 53,570,235,221.69 | 95.647 |
Withheld | 2,437,760,703.12 | 4.353 |
TOTAL | 56,007,995,924.81 | 100.000 |
George H. Heilmeier |
Affirmative | 53,166,350,588.50 | 94.926 |
Withheld | 2,841,645,336.31 | 5.074 |
TOTAL | 56,007,995,924.81 | 100.000 |
Edward C. Johnson 3d |
Affirmative | 53,230,508,654.93 | 95.041 |
Withheld | 2,777,487,269.88 | 4.959 |
TOTAL | 56,007,995,924.81 | 100.000 |
James H. Keyes |
Affirmative | 53,549,161,456.52 | 95.610 |
Withheld | 2,458,834,468.29 | 4.390 |
TOTAL | 56,007,995,924.81 | 100.000 |
Marie L. Knowles |
Affirmative | 53,543,925,066.86 | 95.601 |
Withheld | 2,464,070,857.95 | 4.399 |
TOTAL | 56,007,995,924.81 | 100.000 |
Ned C. Lautenbach |
Affirmative | 53,547,116,322.50 | 95.606 |
Withheld | 2,460,879,602.31 | 4.394 |
TOTAL | 56,007,995,924.81 | 100.000 |
| # of
Votes | % of
Votes |
Cornelia M. Small |
Affirmative | 53,564,793,514.25 | 95.638 |
Withheld | 2,443,202,410.56 | 4.362 |
TOTAL | 56,007,995,924.81 | 100.000 |
William S. Stavropoulos |
Affirmative | 53,426,544,502.76 | 95.391 |
Withheld | 2,581,451,422.05 | 4.609 |
TOTAL | 56,007,995,924.81 | 100.000 |
Kenneth L. Wolfe |
Affirmative | 53,229,881,790.63 | 95.040 |
Withheld | 2,778,114,134.18 | 4.960 |
TOTAL | 56,007,995,924.81 | 100.000 |
A Denotes trust-wide proposal and voting results.
Semiannual Report
Proxy Voting Results
A special meeting of the fund's shareholders was held on April 16, 2008. The results of votes taken among shareholders on the proposals before them are reported below. Each vote reported represents one dollar of net asset value held on the record date for the meeting.
PROPOSAL 1 |
To elect a Board of Trustees.A |
| # of
Votes | % of
Votes |
James C. Curvey |
Affirmative | 44,485,656,811.55 | 94.702 |
Withheld | 2,488,551,854.62 | 5.298 |
TOTAL | 46,974,208,666.17 | 100.000 |
Dennis J. Dirks |
Affirmative | 44,706,671,638.31 | 95.173 |
Withheld | 2,267,537,027.86 | 4.827 |
TOTAL | 46,974,208,666.17 | 100.000 |
Edward C. Johnson 3d |
Affirmative | 44,294,881,638.16 | 94.296 |
Withheld | 2,679,327,028.01 | 5.704 |
TOTAL | 46,974,208,666.17 | 100.000 |
Alan J. Lacy |
Affirmative | 44,685,373,413.16 | 95.127 |
Withheld | 2,288,835,253.01 | 4.873 |
TOTAL | 46,974,208,666.17 | 100.000 |
Ned C. Lautenbach |
Affirmative | 44,634,541,379.41 | 95.019 |
Withheld | 2,339,667,286.76 | 4.981 |
TOTAL | 46,974,208,666.17 | 100.000 |
Joseph Mauriello |
Affirmative | 44,683,962,099.80 | 95.124 |
Withheld | 2,290,246,566.37 | 4.876 |
TOTAL | 46,974,208,666.17 | 100.000 |
Cornelia M. Small |
Affirmative | 44,671,688,375.36 | 95.098 |
Withheld | 2,302,520,290.81 | 4.902 |
TOTAL | 46,974,208,666.17 | 100.000 |
William S. Stavropoulos |
Affirmative | 44,465,262,087.61 | 94.659 |
Withheld | 2,508,946,578.56 | 5.341 |
TOTAL | 46,974,208,666.17 | 100.000 |
David M. Thomas |
Affirmative | 44,694,340,813.87 | 95.147 |
Withheld | 2,279,867,852.30 | 4.853 |
TOTAL | 46,974,208,666.17 | 100.000 |
Michael E. Wiley |
Affirmative | 44,686,513,174.78 | 95.130 |
Withheld | 2,287,695,491.39 | 4.870 |
TOTAL | 46,974,208,666.17 | 100.000 |
PROPOSAL 5 |
Shareholder proposal for Fidelity Canada Fund concerning "oversight procedures to screen out investments in companies that, in the judgement of the Board, substantially contribute to genocide, patterns of extraordinary and egregious violations of human rights, or crimes against humanity." |
| # of
Votes | % of
Votes |
Affirmative | 545,276,762.04 | 23.721 |
Against | 1,445,066,492.42 | 62.863 |
Abstain | 112,739,966.65 | 4.905 |
Broker Non-Votes | 195,653,438.02 | 8.511 |
TOTAL | 2,298,736,659.13 | 100.000 |
A Denotes trust-wide proposal and voting results.
Annual Report
Board Approval of Investment Advisory Contracts and Management Fees
Fidelity Canada Fund
Each year, typically in July, the Board of Trustees, including the Independent Trustees (together, the Board), votes on the renewal of the management contract and sub-advisory agreements (together, the Advisory Contracts) for the fund. The Board, assisted by the advice of fund counsel and Independent Trustees' counsel, requests and considers a broad range of information throughout the year.
The Board meets regularly and, acting directly and through its separate committees, requests and receives information concerning, and considers at each of its meetings factors that are relevant to, its annual consideration of the renewal of the fund's Advisory Contracts, including the services and support provided to the fund and its shareholders. At the time of the renewal, the Board had 12 standing committees, each composed of Independent Trustees with varying backgrounds, to which the Board has assigned specific subject matter responsibilities in order to enhance effective decision-making by the Board. Each committee has a written charter outlining the structure and purposes of the committee. The Board also meets as needed to consider matters specifically related to the Board's annual consideration of the renewal of Advisory Contracts.
At its July 2008 meeting, the Board of Trustees, including the Independent Trustees, unanimously determined to renew each fund's Advisory Contracts. In reaching its determination, the Board considered all factors it believed relevant, including (i) the nature, extent, and quality of the services to be provided to the fund and its shareholders (including the investment performance of the fund); (ii) the competitiveness of each fund's management fee and total expenses; (iii) the total costs of the services to be provided by and the profits to be realized by Fidelity from its relationship with the fund; (iv) the extent to which economies of scale would be realized as the fund grows; and (v) whether fee levels reflect these economies of scale, if any, for the benefit of fund shareholders. The Board also approved agreements with foreign sub-advisers Fidelity Management & Research (Japan) Inc. and Fidelity Management & Research (Hong Kong) Limited, as well as amendments to the fund's agreement with Fidelity Management & Research (U.K.) Inc.
In considering whether to renew the Advisory Contracts for the fund, the Board ultimately reached a determination, with the assistance of fund counsel and Independent Trustees' counsel and through the exercise of its business judgment, that the renewal of the Advisory Contracts and the compensation to be received by Fidelity under the management contract is consistent with Fidelity's fiduciary duty under applicable law. The Board's decision to renew the Advisory Contracts was not based on any single factor noted above, but rather was based on a comprehensive consideration of all the information provided to the Board at its meetings throughout the year. The Board, in reaching its determination to renew the Advisory Contracts, is aware that shareholders in the fund have a broad range of investment choices available to them, including a wide choice among mutual funds offered by competitors to Fidelity, and that the fund's shareholders, with the opportunity to review and weigh the disclosure provided by the fund in its prospectus and other public disclosures, have chosen to invest in this fund, managed by Fidelity.
Nature, Extent, and Quality of Services Provided. The Board considered staffing within the investment adviser, FMR, and the sub-advisers (together, the Investment Advisers), including the backgrounds of the fund's investment personnel and the fund's investment objective and discipline. The Independent Trustees also had discussions with senior management of Fidelity's investment operations and investment groups. The Board considered the structure of the portfolio manager compensation program and whether this structure provides appropriate incentives.
Resources Dedicated to Investment Management and Support Services. The Board reviewed the size, education, and experience of the Investment Advisers' investment staff, their use of technology, and the Investment Advisers' approach to recruiting, training, and retaining portfolio managers and other research, advisory, and management personnel. The Board noted that Fidelity's analysts have access to a variety of technological tools that enable them to perform both fundamental and quantitative analysis and to specialize in various disciplines. The Board considered Fidelity's extensive global research capabilities that enable the Investment Advisers to aggregate data from various sources in an effort to produce positive investment results. The Board also considered that Fidelity's portfolio managers and analysts have access to daily portfolio attribution that allows for monitoring of a fund's portfolio, as well as an electronic communication system that provides immediate real-time access to research concerning issuers and credit enhancers.
Shareholder and Administrative Services. The Board considered (i) the nature, extent, quality, and cost of advisory, administrative, distribution, and shareholder services performed by the Investment Advisers and their affiliates under the Advisory Contracts and under separate agreements covering transfer agency, pricing and bookkeeping, and securities lending services for the fund; (ii) the nature and extent of the Investment Advisers' supervision of third party service providers, principally custodians and subcustodians; and (iii) the resources devoted to, and the record of compliance with, the fund's compliance policies and procedures. The Board also reviewed the allocation of fund brokerage, including allocations to brokers affiliated with the Investment Advisers, the use of brokerage commissions to pay fund expenses, and the use of "soft" commission dollars to pay for research services. The Board further considered that Fidelity voluntarily pays for market data out of its own resources.
The Board noted that the growth of fund assets across the complex allows Fidelity to reinvest in the development of services designed to enhance the value or convenience of the Fidelity funds as investment vehicles. These services include 24 hour access to account information and market information through phone representatives and over the Internet, and investor education materials and asset allocation tools.
Investment in a Large Fund Family. The Board considered the benefits to shareholders of investing in a Fidelity fund, including the benefits of investing in a fund that is part of a large family of funds offering a variety of investment disciplines and providing for a large variety of mutual fund investor services. For example, fund shareholders are offered the privilege of exchanging shares of the fund for shares of other Fidelity funds, as set forth in the fund's prospectus, without paying a sales charge. The Board noted that Fidelity has taken a number of actions over the previous year that benefited particular funds, including (i) dedicating additional resources to investment research and to restructure the investment research teams; (ii) contractually agreeing to reduce the management fees on Fidelity's Institutional Money Market Funds and launching Class IV and Institutional Class of certain of these funds; (iii) reducing the transfer agent fees for the Fidelity Select Portfolios and Investor Class of the VIP funds; and (iv) launching Class K of 29 equity funds as a lower-fee class available to certain employer-sponsored retirement plans.
Annual Report
Board Approval of Investment Advisory Contracts and Management Fees - continued
Investment Performance. The Board considered whether the fund has operated within its investment objective, as well as its record of compliance with its investment restrictions. It also reviewed the fund's absolute investment performance for Fidelity Canada (retail class), as well as the fund's relative investment performance for Fidelity Canada (retail class) measured against a broad-based securities market index over multiple periods. The Board noted that FMR does not believe that a meaningful peer group exists against which to compare the fund's performance. The following charts considered by the Board show, over the one-, three-, and five-year periods ended December 31, 2007, the cumulative total returns of Fidelity Canada (retail class) of the fund and the cumulative total returns of a broad-based securities market index ("benchmark"). (The Advisor classes of the fund had less than one year of performance as of December 31, 2007.)
Fidelity Canada Fund
The Board stated that the investment performance of Fidelity Canada (retail class) of the fund compared favorably to its benchmark for all the periods shown.
The Board also considered that the fund's management fee is subject to upward or downward adjustment depending upon whether, and to what extent, the fund's investment performance for the performance period exceeds, or is exceeded by, the record (over the same period) of a Board-approved performance adjustment index. The Board realizes that the performance adjustment provides FMR with a strong economic incentive to seek to achieve superior performance for the fund's shareholders and helps to more closely align the interests of FMR and the fund's shareholders.
The Board considered that FMR has taken steps to refocus and strengthen equity research, equity portfolio management, and compliance.
Based on its review, and giving particular weight to the nature and quality of the resources dedicated by the Investment Advisers to maintain and improve relative performance, the Board concluded that the nature, extent, and quality of the services provided to the fund will benefit the fund's shareholders, particularly in light of the Board's view that the fund's shareholders benefit from investing in a fund that is part of a large family of funds offering a variety of investment disciplines and services.
Competitiveness of Management Fee and Total Fund Expenses. The Board considered the fund's management fee and total expenses compared to "mapped groups" of competitive funds and classes. Fidelity creates "mapped groups" by combining similar Lipper investment objective categories that have comparable management fee characteristics. Combining Lipper investment objective categories aids the Board's management fee and total expense comparisons by broadening the competitive group used for comparison and by reducing the number of universes to which various Fidelity funds are compared. The Board also considered supplemental information about how the fund's management fee and total expenses ranked relative to groups based on Lipper classifications, which take into account a fund's market capitalization and style.
Annual Report
The Board considered two proprietary management fee comparisons for the 12-month periods shown in the chart below. The group of Lipper funds used by the Board for management fee comparisons is referred to below as the "Total Mapped Group." The Total Mapped Group comparison focuses on a fund's standing relative to the total universe of comparable funds available to investors, in terms of gross management fees before expense reimbursements or caps, and without giving effect to the fund's performance adjustment. "TMG %" represents the percentage of funds in the Total Mapped Group that had management fees that were lower than the fund's. For example, a TMG % of 14% means that 86% of the funds in the Total Mapped Group had higher management fees than the fund. The "Asset-Size Peer Group" (ASPG) comparison focuses on a fund's standing relative to non-Fidelity funds similar in size to the fund within the Total Mapped Group. The ASPG represents at least 15% of the funds in the Total Mapped Group with comparable asset size and management fee characteristics, subject to a minimum of 50 funds (or all funds in the Total Mapped Group if fewer than 50). Additional information, such as the ASPG quartile in which the fund's management fee ranked and the impact of the fund's performance adjustment, is also included in the chart and considered by the Board.
Fidelity Canada Fund
The Board noted that the fund's management fee ranked below the median of its Total Mapped Group and below the median of its ASPG for 2007. The Board also noted the effect of the fund's negative performance adjustment on the fund's management fee ranking. The Board noted that the performance adjustment for each year represents calculations for performance periods that differ from the periods shown in the performance charts above.
Based on its review, the Board concluded that the fund's management fee was fair and reasonable in light of the services that the fund receives and the other factors considered.
In its review of the each class's total expenses, the Board considered the fund's management fee as well as other fund or class expenses, as applicable, such as transfer agent fees, pricing and bookkeeping fees, fund-paid 12b-1 fees, and custodial, legal, and audit fees. The Board also noted the effects of any waivers and reimbursements on fees and expenses, as well as the impact of the fund's performance adjustment. As part of its review, the Board also considered current and historical total expenses of the fund compared to competitive fund median expenses. The fund is compared to those funds and classes in the Total Mapped Group (used by the Board for management fee comparisons) that have a similar sales load structure.
The Board noted that the total expenses of each of Class A, Class B, Class C, Institutional Class, and Fidelity Canada (retail class) ranked below its competitive median for 2007, and the total expenses of Class T ranked above its competitive median for 2007. The Board considered that the total expenses for Class T were above the median primarily because 12b-1 fee is higher than the typical front-end load class. The Board noted that the fund offers multiple classes, each of which has a different sales load and 12b-1 fee structure, and that the multiple structures are intended to offer a range of pricing options for the intermediary market. The Board also noted that the total expenses of the classes vary primarily by the level of their 12b-1 fees, although differences in transfer agent fees may also cause expenses to vary from class to class.
In its review of total expenses, the Board also considered Fidelity fee structures and other information on clients that FMR and its affiliates service in other competitive markets, such as other mutual funds advised or subadvised by FMR or its affiliates, pension plan clients, and other institutional clients.
Based on its review, the Board concluded that the total expenses of each class of the fund were reasonable, although in one case above the median of the universe presented for comparison, in light of the services that the fund and its shareholders receive and the other factors considered.
Annual Report
Board Approval of Investment Advisory Contracts and Management Fees - continued
Costs of the Services and Profitability. The Board considered the revenues earned and the expenses incurred by Fidelity in conducting the business of developing, marketing, distributing, managing, administering and servicing the fund and its shareholders. The Board also considered the level of Fidelity's profits in respect of all the Fidelity funds.
On an annual basis, FMR presents to the Board Fidelity's profitability for the fund. Fidelity calculates the profitability for each fund, as well as aggregate profitability for groups of Fidelity funds and all Fidelity funds, using a series of detailed revenue and cost allocation methodologies which originate with the audited books and records of Fidelity. The Audit Committee of the Board reviews any significant changes from the prior year's methodologies.
PricewaterhouseCoopers LLP (PwC), independent registered public accounting firm and auditor to Fidelity and certain Fidelity funds, has been engaged annually by the Board as part of the Board's assessment of the results of Fidelity's profitability analysis. PwC's engagement includes the review and assessment of Fidelity's methodologies used in determining the revenues and expenses attributable to Fidelity's mutual fund business, and completion of agreed-upon procedures surrounding the mathematical accuracy of fund profitability and its conformity to allocation methodologies. After considering PwC's reports issued under the engagement and information provided by Fidelity, the Board believes that while other allocation methods may also be reasonable, Fidelity's profitability methodologies are reasonable in all material respects.
The Board has also reviewed Fidelity's non-fund businesses and any fall-out benefits related to the mutual fund business as well as cases where Fidelity's affiliates may benefit from or be related to the fund's business.
The Board considered the costs of the services provided by and the profits realized by Fidelity in connection with the operation of the fund and determined that the amount of profit is a fair entrepreneurial profit for the management of the fund.
Economies of Scale. The Board considered whether there have been economies of scale in respect of the management of the Fidelity funds, whether the Fidelity funds (including the fund) have appropriately benefited from any such economies of scale, and whether there is potential for realization of any further economies of scale. The Board considered the extent to which the fund will benefit from economies of scale through increased services to the fund, through waivers or reimbursements, or through fee or expense reductions.
The Board recognized that the fund's management contract incorporates a "group fee" structure, which provides for lower group fee rates as total fund assets under FMR's management increase, and for higher group fee rates as total fund assets under FMR's management decrease. FMR determines the group fee rates based on a tiered asset "breakpoint" schedule. The Board considered that the group fee is designed to deliver the benefits of economies of scale to fund shareholders when total fund assets increase, even if assets of any particular fund are unchanged or have declined, because some portion of Fidelity's costs are attributable to services provided to all Fidelity funds, and all funds benefit if those costs can be allocated among more assets. The Board concluded that, given the group fee structure, fund shareholders will achieve a certain level of economies of scale as assets under FMR's management increase at the fund complex level, regardless of whether Fidelity achieves any such economies of scale.
The Board further concluded that any potential economies of scale are being shared between fund shareholders and Fidelity in an appropriate manner.
Additional Information Requested by the Board. In order to develop fully the factual basis for consideration of the Fidelity funds' Advisory Contracts, the Board requested and received additional information on certain topics, including (i) fund performance trends and actions to be taken by FMR to improve certain funds' overall performance; (ii) portfolio manager changes that have occurred during the past year; (iii) Fidelity's fund profitability methodology, the profitability of certain fund service providers, and profitability trends for certain funds; (iv) Fidelity's compensation structure for portfolio managers and key personnel, including its effects on fund profitability and the extent to which portfolio manager compensation is linked to fund performance; (v) Fidelity's fee structures and rationale for recommending different fees among categories of funds; and (vi) Fidelity's rationale for recommending which funds should have a performance adjustment component as part of their management fees.
Based on its evaluation of all of the conclusions noted above, and after considering all material factors, the Board ultimately concluded that the advisory fee structures are fair and reasonable, and that the fund's Advisory Contracts should be renewed.
Annual Report
Investment Adviser
Fidelity Management & Research Company
Boston, MA
Investment Sub-Advisers
FMR Co., Inc.
Fidelity Management & Research
(U.K.) Inc.
Fidelity Research & Analysis Company
Fidelity Investments Japan Limited
FIL Investment Advisors
FIL Investment Advisors
(U.K.) Ltd.
Fidelity Management & Research
(Hong Kong) Limited
Fidelity Management & Research
(Japan) Inc.
General Distributor
Fidelity Distributors Corporation
Boston, MA
Transfer and Service Agents
Fidelity Investments Institutional
Operations Company, Inc.
Boston, MA
Fidelity Service Company, Inc.
Boston, MA
Custodian
Mellon Bank, N.A.
Pittsburgh, PA
ACANI-UANN-1208
1.843157.101
Fidelity Advisor
China Region Fund -
Class A, Class T, Class B, and Class C
Annual Report
October 31, 2008
Class A, Class T, Class B, and Class C are
classes of Fidelity® China Region Fund
(2_fidelity_logos) (Registered_Trademark)
Contents
Chairman's Message | <Click Here> | Ned Johnson's message to shareholders. |
Performance | <Click Here> | How the fund has done over time. |
Management's Discussion | <Click Here> | The manager's review of fund performance, strategy and outlook. |
Shareholder Expense Example | <Click Here> | An example of shareholder expenses. |
Investment Changes | <Click Here> | A summary of major shifts in the fund's investments over the past six months. |
Investments | <Click Here> | A complete list of the fund's investments with their market values. |
Financial Statements | <Click Here> | Statements of assets and liabilities, operations, and changes in net assets, as well as financial highlights. |
Notes | <Click Here> | Notes to the financial statements. |
Report of Independent Registered Public Accounting Firm | <Click Here> | |
Trustees and Officers | <Click Here> | |
Proxy Voting Results | <Click Here> | |
Board Approval of Investment Advisory Contracts and Management Fees | <Click Here> | |
To view a fund's proxy voting guidelines and proxy voting record for the 12-month period ended June 30, visit http://www.fidelity.com (search for "proxy voting guidelines") or visit the Securities and Exchange Commission's (SEC) web site at http://www.sec.gov. You may also call 1-877-208-0098 to request a free copy of the proxy voting guidelines.
Standard & Poor's, S&P and S&P 500 are registered service marks of The McGraw-Hill Companies, Inc. and have been licensed for use by Fidelity Distributors Corporation.
Other third party marks appearing herein are the property of their respective owners.
All other marks appearing herein are registered or unregistered trademarks or service marks of FMR LLC or an affiliated company.
This report and the financial statements contained herein are submitted for the general information of the shareholders of the funds. This report is not authorized for distribution to prospective investors in the funds unless preceded or accompanied by an effective prospectus.
A fund files its complete schedule of portfolio holdings with the SEC for the first and third quarters of each fiscal year on Form N-Q. Forms N-Q are available on the SEC's web site at http://www.sec.gov. A fund's Forms N-Q may be reviewed and copied at the SEC's Public Reference Room in Washington, DC. Information regarding the operation of the SEC's Public Reference Room may be obtained by calling 1-800-SEC-0330. For a complete list of a fund's portfolio holdings, view the most recent quarterly holdings listing, semiannual report, or annual report on Fidelity's web site at http://www.fidelity.com or http://www.advisor.fidelity.com, as applicable.
NOT FDIC INSURED · MAY LOSE VALUE · NO BANK GUARANTEE
Neither the funds nor Fidelity Distributors Corporation is a bank.
Annual Report
(photo_of_Edward_C_Johnson_3d)
Dear Shareholder:
Turmoil has been the watchword for the world's securities markets in 2008, with domestic and international stocks down sharply amid the global credit squeeze. A flight to quality boosted returns for U.S. Treasuries, one of the few asset classes with positive results heading into the latter stages of the year. Financial markets are always unpredictable, but there are a number of time-tested principles that can put the historical odds in your favor.
One of the basic tenets is to invest for the long term. Over time, riding out the markets' inevitable ups and downs has proven much more effective than selling into panic or chasing the hottest trend. Even missing only a few of the markets' best days can significantly diminish investor returns. Patience also affords the benefits of compounding - of earning interest on additional income or reinvested dividends and capital gains. There are tax advantages and cost benefits to consider as well. The more you sell, the more taxes you pay, and the more you trade, the higher the costs. While staying the course doesn't eliminate risk, it can considerably lessen the effect of short-term declines.
You can further manage your investing risk through diversification. And today, more than ever, geographic diversification should be taken into account. Studies indicate that asset allocation is the single most important determinant of a portfolio's long-term success. The right mix of stocks, bonds and cash - aligned to your particular risk tolerance and investment objective - is very important. Age-appropriate rebalancing is also an essential aspect of asset allocation. For younger investors, an emphasis on equities - which historically have been the best-performing asset class over time - is encouraged. As investors near their specific goal, such as retirement or sending a child to college, consideration may be given to replacing volatile assets (e.g. common stocks) with more-stable fixed investments (bonds or savings plans).
A third investment principle - investing regularly - can help lower the average cost of your purchases. Investing a certain amount of money each month or quarter helps ensure you won't pay for all your shares at market highs. This strategy - known as dollar cost averaging - also reduces unconstructive "emotion" from investing, helping shareholders avoid selling weak performers just prior to an upswing, or chasing a hot performer just before a correction.
We invite you to contact us via the Internet, through our Investor Centers or over the phone. It is our privilege to provide you the information you need to make the investments that are right for you.
Sincerely,
/s/Edward C. Johnson 3d
Edward C. Johnson 3d
Annual Report
Average annual total return reflects the change in the value of an investment, assuming reinvestment of the class' dividend income and capital gains (the profits earned upon the sale of securities that have grown in value, if any) and assuming a constant rate of performance each year. The $10,000 table and the fund's returns do not reflect the deduction of taxes that a shareholder would pay on fund distributions or the redemption of fund shares. During periods of reimbursement by Fidelity, a fund's total returns will be greater than it would be had the reimbursement not occurred. How a fund did yesterday is no guarantee of how it will do tomorrow.
Average Annual Total Returns
Periods ended October 31, 2008 | Past 1
year | Past 5
years | Past 10
years |
Class A (incl. 5.75% sales charge)A, E | -56.46% | 4.96% | 7.67% |
Class T (incl. 3.50% sales charge) B, E | -55.48% | 5.43% | 7.91% |
Class B (incl. contingent deferred sales charge) C, E | -55.97% | 5.82% | 8.27% |
Class C (incl. contingent deferred sales charge) D, E | -54.37% | 6.13% | 8.27% |
A Class A shares bear a 0.25% 12b-1 fee. The initial offering of Class A shares took place on May 9, 2008. Returns prior to May 9, 2008 are those of China Region, the original retail class of the fund, which has no 12b-1 fee. Had Class A shares' 12b-1 fee been reflected, returns prior to May 9, 2008 would have been lower.
B Class T shares bear a 0.50% 12b-1 fee. The initial offering of Class T shares took place on May 9, 2008. Returns prior to May 9, 2008 are those of China Region, the original retail class of the fund, which has no 12b-1 fee. Had Class T shares' 12b-1 fee been reflected, returns prior to May 9, 2008 would have been lower.
C Class B shares bear a 1.00% 12b-1 fee. The initial offering of Class B shares took place on May 9, 2008. Returns prior to May 9, 2008 are those of China Region, the original retail class of the fund, which has no 12b-1 fee. Had Class B shares' 12b-1 fee been reflected, returns prior to May 9, 2008 would have been lower. Class B shares' contingent deferred sales charge included in the past one year, past five years, and past 10 years total return figures are 5%, 2%, and 0% respectively.
D Class C shares bear a 1.00% 12b-1 fee. The initial offering of Class C shares took place on May 9, 2008. Returns prior to May 9, 2008 are those of China Region, the original retail class of the fund, which has no 12b-1 fee. Had Class C shares' 12b-1 fee been reflected, returns prior to May 9, 2008 would have been lower. Class C shares' contingent deferred sales charge included in the past one year, past five years, and past 10 years total return figures are 1%, 0%, and 0%, respectively.
E Prior to September 1, 2000, the fund operated under certain different investment policies. The fund's historical performance may not represent its current investment policies.
$10,000 Over 10 Years
Let's say hypothetically that $10,000 was invested in Fidelity® China Region Fund - Class A, a class of the fund, on October 31, 1998 and the current 5.75% sales charge was paid. The chart shows how the value of your investment would have changed, and also shows how the MSCI® Golden Dragon Index performed over the same period. The initial offering of Class A took place on May 9, 2008. See above for additional information regarding the performance of Class A.
Annual Report
Comments from Wilson Wong, Portfolio Manager of Fidelity Advisor China Region Fund
In a dramatic reversal of what had been a multiyear global growth story, international stocks fell hard during the 12 months ending October 31, 2008, especially so during the latter stages of the period and mostly as a result of fallout from the financial crisis that emanated from the United States. The viral spread of this financial contagion - which began in the U.S. subprime mortgage market, then seized up the credit markets, hobbled major financial institutions and eventually slowed economic growth worldwide - left virtually no corner of the globe untouched. Developed international equity markets - as gauged by the MSCI® Europe, Australasia, Far East (EAFE®) Index, which monitors established markets outside the U.S. and Canada - fell 46.54%, while the Standard & Poor's 500SM Index, a measure of U.S. stocks, dropped 36.10%. Among countries constituting at least 1% of the EAFE index, Switzerland had the "least worst" showing, falling roughly 32%, followed by Japan, where stocks slid by around 37%. The weakest overall performance came from Belgium, where stocks slipped by nearly 70%. In the United Kingdom, the largest component of the index, equities were down almost 48%. Emerging markets were the weakest performers among the global economies, declining 56.22% as measured by the MSCI Emerging Markets Index.
During the past year, the fund's Advisor Class shares outperformed the -58.03% return of the MSCI Golden Dragon Index. (For specific class-level returns, please see the performance section of this report.) Favorable stock selection in China and Australia aided the fund's results relative to the index, although the fund had no exposure to Australia at period end. On a sector basis, performance was boosted by stock picking in materials and energy, along with an underweighting in the weak-performing industrials group. A modest cash position also was beneficial. At the stock level, Chunghwa Telecom, Taiwan's largest integrated telecommunication services provider, was the fund's biggest contributor. The firm's large cash surplus and evidence of effective cost controls proved attractive amid the severe volatility in stock prices. Other contributors were Tencent Holdings, a Chinese provider of online instant messaging services; Hang Seng Bank, a domestic bank in Hong Kong; and Taiwan Fertilizer, which I sold. Conversely, underweighting Taiwan detracted due to that country's relatively strong results. Further, stock selection and industry positioning within financials worked against fund performance. Yuanta Financial Holding, a diversified financial company based in Taiwan, eroded returns. Disappointment related to opportunities for the company that were expected to emerge from the potential easing of curbs on investment in China sidetracked the stock. Other detractors included an out-of-index stake in Focus Media Holding, a digital display and advertising firm, and Anhui Conch Cement, both based in China. All three detractors were sold off by period end.
Note to shareholders: Fidelity Advisor China Region Fund may invest up to 35% of its total assets in any industry that represents more than 20% of the Hong Kong, Taiwanese and Chinese market. As of October 31, 2008, the fund did not have more than 25% of its total assets invested in any one industry.
The views expressed above reflect those of the portfolio manager(s) only through the end of the period as stated on the cover of this report and do not necessarily represent the views of Fidelity or any other person in the Fidelity organization. Any such views are subject to change at any time based upon market or other conditions and Fidelity disclaims any responsibility to update such views. These views may not be relied on as investment advice and, because investment decisions for a Fidelity fund are based on numerous factors, may not be relied on as an indication of trading intent on behalf of any Fidelity fund.
Annual Report
China Region
As a shareholder of the Fund, you incur two types of costs: (1) transaction costs, including sales charges (loads) on purchase payments or redemption proceeds and redemption fees, and (2) ongoing costs, including management fees, distribution and/or service (12b-1) fees and other Fund expenses. This Example is intended to help you understand your ongoing costs (in dollars) of investing in the Fund and to compare these costs with the ongoing costs of investing in other mutual funds.
The actual expense Example is based on an investment of $1,000 invested at the beginning of the period and held for the entire period (May 1, 2008 to October 31, 2008) for China Region and for the entire period (May 9, 2008 to October 31, 2008) for Class A, Class T, Class B, Class C and Institutional Class.
The hypothetical expense Example is based on an investment of $1,000 invested for the one-half year period (May 1, 2008 to October 31, 2008).
Actual Expenses
The first line of the accompanying table for each class of the Fund provides information about actual account values and actual expenses. You may use the information in this line, together with the amount you invested, to estimate the expenses that you paid over the period. Simply divide your account value by $1,000.00 (for example, an $8,600 account value divided by $1,000.00 = 8.6), then multiply the result by the number in the first line for a class of the Fund under the heading entitled "Expenses Paid During Period" to estimate the expenses you paid on your account during this period. A small balance maintenance fee of $12.00 that is charged once a year may apply for certain accounts with a value of less than $2,000. This fee is not included in the table below. If it was, the estimate of expenses you paid during the period would be higher, and your ending account value lower, by this amount. In addition, the Fund, as a shareholder in the underlying Fidelity Central Funds, will indirectly bear its pro rata share of the fees and expenses incurred by the underlying Fidelity Central Funds. These fees and expenses are not included in the Fund's annualized expense ratio used to calculate the expense estimate in the table below.
Hypothetical Example for Comparison Purposes
The second line of the accompanying table for each class of the Fund provides information about hypothetical account values and hypothetical expenses based on a Class' actual expense ratio and an assumed rate of return of 5% per year before expenses, which is not the Class' actual return. The hypothetical account values and expenses may not be used to estimate the actual ending account balance or expenses you paid for the period. You may use this information to compare the ongoing costs of investing in the Fund and other funds. To do so, compare this 5% hypothetical example with the 5% hypothetical examples that appear in the shareholder reports of the other funds. A small balance maintenance fee of $12.00 that is charged once a year may apply for certain accounts with a value of less than $2,000. This fee is not included in the table below. If it was, the estimate of expenses you paid during the period would be higher, and your ending account value lower, by this amount. In addition, the Fund, as a shareholder in the underlying Fidelity Central Funds, will indirectly bear its pro rata share of the fees and expenses incurred by the underlying Fidelity Central Funds. These fees and expenses are not included in the Fund's annualized expense ratio used to calculate the expense estimate in the table below.
Please note that the expenses shown in the table are meant to highlight your ongoing costs only and do not reflect any transaction costs. Therefore, the second line of the table is useful in comparing ongoing costs only, and will not help you determine the relative total costs of owning different funds. In addition, if these transactional costs were included, your costs would have been higher.
| Annualized Expense Ratio | Beginning
Account Value | Ending
Account Value
October 31, 2008 | Expenses Paid
During Period |
Class A | 1.44% | | | |
Actual | | $ 1,000.00 | $ 569.30 | $ 5.43 B |
HypotheticalA | | $ 1,000.00 | $ 1,017.90 | $ 7.30 C |
Class T | 1.68% | | | |
Actual | | $ 1,000.00 | $ 568.60 | $ 6.34 B |
HypotheticalA | | $ 1,000.00 | $ 1,016.69 | $ 8.52 C |
Class B | 2.17% | | | |
Actual | | $ 1,000.00 | $ 567.30 | $ 8.18 B |
HypotheticalA | | $ 1,000.00 | $ 1,014.23 | $ 10.99 C |
Class C | 2.13% | | | |
Actual | | $ 1,000.00 | $ 567.30 | $ 8.03 B |
HypotheticalA | | $ 1,000.00 | $ 1,014.43 | $ 10.79 C |
China Region | 1.12% | | | |
Actual | | $ 1,000.00 | $ 569.20 | $ 4.42 B |
HypotheticalA | | $ 1,000.00 | $ 1,019.51 | $ 5.69 C |
Institutional Class | 1.06% | | | |
Actual | | $ 1,000.00 | $ 570.40 | $ 4.00 B |
HypotheticalA | | $ 1,000.00 | $ 1,019.81 | $ 5.38 C |
A 5% return per year before expenses
B Actual expenses are equal to each Class' annualized expense ratio, multiplied by the average account value over the period, multiplied by 184/366 (to reflect the one-half year period) for China Region and multiplied by 176/366 (to reflect the period May 9, 2008 to October 31, 2008) for Class A, Class T, Class B, Class C and Institutional Class.
C Hypothetical expenses are equal to each Class' annualized expense ratio; multiplied by the average account value over the period, multiplied by 184/366 (to reflect the one-half year period).
Annual Report
China Region
Investment Changes (Unaudited)
Geographic Diversification (% of fund's net assets) |
As of October 31, 2008 |
 | Hong Kong | 37.0% | |
 | Taiwan | 29.4% | |
 | China | 24.1% | |
 | United States of America | 7.9% | |
 | Cayman Islands | 1.4% | |
 | Indonesia | 0.2% | |
 | Bermuda | 0.0% | |

Percentages are adjusted for the effect of futures contracts, if applicable. |
|
As of April 30, 2008 |
| Hong Kong | 31.9% | |
| Taiwan | 26.8% | |
 | China | 21.2% | |
| Australia | 6.5% | |
 | United States of America | 5.3% | |
| Indonesia | 3.0% | |
 | Cayman Islands | 3.1% | |
| Bermuda | 1.3% | |
 | Papua New Guinea | 0.4% | |
| Other | 0.5% | |

Percentages are adjusted for the effect of futures contracts, if applicable. |
Asset Allocation |
| % of fund's
net assets | % of fund's net assets
6 months ago |
Stocks | 92.1 | 95.1 |
Short-Term Investments and Net Other Assets | 7.9 | 4.9 |
Top Ten Stocks as of October 31, 2008 |
| % of fund's
net assets | % of fund's net assets
6 months ago |
Taiwan Semiconductor Manufacturing Co. Ltd. (Semiconductors & Semiconductor Equipment) | 9.8 | 0.0 |
China Mobile (Hong Kong) Ltd. (Wireless Telecommunication Services) | 8.6 | 9.9 |
Chunghwa Telecom Co. Ltd. (Diversified Telecommunication Services) | 7.1 | 3.5 |
Industrial & Commercial Bank of China (Commercial Banks) | 5.0 | 1.1 |
CLP Holdings Ltd. (Electric Utilities) | 4.6 | 1.7 |
China Life Insurance Co. Ltd. (H Shares) (Insurance) | 3.5 | 2.2 |
Cheung Kong Holdings Ltd. (Real Estate Management & Development) | 3.2 | 1.5 |
PetroChina Co. Ltd. (H Shares) (Oil, Gas & Consumable Fuels) | 2.9 | 1.2 |
Hutchison Whampoa Ltd. (Industrial Conglomerates) | 2.9 | 1.4 |
China Construction Bank Corp. (H Shares) (Commercial Banks) | 2.6 | 0.9 |
| 50.2 | |
Market Sectors as of October 31, 2008 |
| % of fund's
net assets | % of fund's net assets
6 months ago |
Financials | 27.7 | 23.1 |
Information Technology | 21.1 | 7.9 |
Telecommunication Services | 17.6 | 15.8 |
Energy | 8.5 | 9.8 |
Utilities | 8.0 | 3.0 |
Industrials | 3.6 | 3.0 |
Materials | 2.2 | 18.7 |
Consumer Discretionary | 1.9 | 12.0 |
Consumer Staples | 1.5 | 1.0 |
Annual Report
China Region
Investments October 31, 2008
Showing Percentage of Net Assets
Common Stocks - 92.1% |
| Shares | | Value |
CONSUMER DISCRETIONARY - 1.9% |
Distributors - 0.1% |
Li & Fung Ltd. | 196,000 | | $ 393,373 |
Diversified Consumer Services - 1.4% |
New Oriental Education & Technology Group, Inc. sponsored ADR (a) | 161,100 | | 10,302,345 |
Media - 0.4% |
Television Broadcasts Ltd. | 1,074,000 | | 2,986,824 |
Textiles, Apparel & Luxury Goods - 0.0% |
Ports Design Ltd. | 188,500 | | 219,146 |
TOTAL CONSUMER DISCRETIONARY | | 13,901,688 |
CONSUMER STAPLES - 1.5% |
Beverages - 1.1% |
Yantai Changyu Pioneer Wine Co. (B Shares) | 2,556,463 | | 7,944,154 |
Food & Staples Retailing - 0.4% |
Dairy Farm International Holdings Ltd. | 765,900 | | 3,138,297 |
TOTAL CONSUMER STAPLES | | 11,082,451 |
ENERGY - 8.5% |
Oil, Gas & Consumable Fuels - 8.5% |
China Petroleum & Chemical Corp. (H Shares) | 27,432,000 | | 18,013,552 |
China Shenhua Energy Co. Ltd. (H Shares) | 3,701,000 | | 7,026,601 |
CNOOC Ltd. | 18,229,000 | | 14,967,366 |
PetroChina Co. Ltd. (H Shares) | 28,744,000 | | 21,612,223 |
PT Bumi Resources Tbk | 12,829,500 | | 1,679,722 |
| | 63,299,464 |
FINANCIALS - 27.7% |
Commercial Banks - 9.6% |
China Construction Bank Corp. (H Shares) | 38,621,000 | | 19,158,951 |
China Merchants Bank Co. Ltd. (H Shares) | 1,983,000 | | 3,038,031 |
Hang Seng Bank Ltd. | 872,700 | | 10,889,031 |
Industrial & Commercial Bank of China (d) | 78,601,000 | | 36,983,144 |
Industrial & Commercial Bank of China (Asia) Ltd. | 934,000 | | 984,197 |
| | 71,053,354 |
Diversified Financial Services - 1.8% |
China Everbright Ltd. | 824,000 | | 773,681 |
Hong Kong Exchanges & Clearing Ltd. | 1,200,200 | | 12,170,932 |
| | 12,944,613 |
Insurance - 5.8% |
Cathay Financial Holding Co. Ltd. | 7,622,100 | | 8,145,491 |
|
| Shares | | Value |
China Life Insurance Co. Ltd. (H Shares) | 9,767,000 | | $ 26,101,108 |
Ping An Insurance (Group) Co. of China, Ltd. (H Shares) | 2,071,500 | | 8,859,181 |
| | 43,105,780 |
Real Estate Investment Trusts - 1.7% |
Link (REIT) | 7,225,000 | | 12,918,331 |
Real Estate Management & Development - 8.8% |
Cheung Kong Holdings Ltd. | 2,425,000 | | 23,283,548 |
China Overseas Land & Investment Ltd. | 11,176,000 | | 12,620,615 |
China Resources Land Ltd. | 1,194,000 | | 1,208,613 |
Hang Lung Properties Ltd. | 3,724,000 | | 9,099,513 |
Hopewell Holdings Ltd. | 1,188,000 | | 3,693,568 |
Hysan Development Co. Ltd. | 636,000 | | 997,280 |
Sinyi Realty, Inc. | 4,713,066 | | 5,215,307 |
Sun Hung Kai Properties Ltd. | 1,043,000 | | 9,137,772 |
| | 65,256,216 |
TOTAL FINANCIALS | | 205,278,294 |
INDUSTRIALS - 3.6% |
Construction & Engineering - 0.4% |
China Railway Construction Corp.
(H Shares) | 2,063,500 | | 2,549,104 |
Electrical Equipment - 0.2% |
BYD Co. Ltd. (H Shares) | 609,800 | | 1,036,428 |
Industrial Conglomerates - 2.9% |
Hutchison Whampoa Ltd. | 4,029,000 | | 21,514,860 |
Marine - 0.0% |
China Cosco Holdings Co. Ltd. (H Shares) | 347,500 | | 187,203 |
Transportation Infrastructure - 0.1% |
Cosco Pacific Ltd. | 1,390,000 | | 1,012,217 |
TOTAL INDUSTRIALS | | 26,299,812 |
INFORMATION TECHNOLOGY - 21.1% |
Computers & Peripherals - 2.7% |
Acer, Inc. | 2,966,000 | | 3,862,049 |
HTC Corp. | 944,000 | | 11,261,604 |
Wistron Corp. | 5,800,361 | | 4,633,607 |
| | 19,757,260 |
Electronic Equipment & Components - 3.5% |
AU Optronics Corp. | 11,903,000 | | 8,209,588 |
Hon Hai Precision Industry Co. Ltd. (Foxconn) | 7,297,674 | | 17,699,376 |
| | 25,908,964 |
Internet Software & Services - 3.0% |
Baidu.com, Inc. sponsored ADR (a)(d) | 18,400 | | 3,790,400 |
Tencent Holdings Ltd. | 2,520,600 | | 18,349,744 |
| | 22,140,144 |
Common Stocks - continued |
| Shares | | Value |
INFORMATION TECHNOLOGY - continued |
Semiconductors & Semiconductor Equipment - 11.9% |
Advanced Semiconductor Engineering, Inc. | 5,268,000 | | $ 2,243,008 |
ASM Pacific Technology Ltd. | 403,800 | | 1,349,061 |
MediaTek, Inc. | 1,057,000 | | 9,485,281 |
Siliconware Precision Industries Co. Ltd. | 2,553,000 | | 2,623,820 |
Taiwan Semiconductor Manufacturing Co. Ltd. | 49,955,443 | | 72,695,507 |
| | 88,396,677 |
TOTAL INFORMATION TECHNOLOGY | | 156,203,045 |
MATERIALS - 2.2% |
Chemicals - 2.2% |
Formosa Plastics Corp. | 4,867,000 | | 8,203,887 |
Nan Ya Plastics Corp. | 5,925,000 | | 8,262,847 |
| | 16,466,734 |
TELECOMMUNICATION SERVICES - 17.6% |
Diversified Telecommunication Services - 8.6% |
China Unicom (Hong Kong) Ltd. | 6,776,000 | | 9,674,060 |
Chunghwa Telecom Co. Ltd. | 29,533,680 | | 48,707,965 |
Chunghwa Telecom Co. Ltd. ADR | 229,203 | | 3,772,681 |
PCCW Ltd. | 4,537,000 | | 1,697,694 |
| | 63,852,400 |
Wireless Telecommunication Services - 9.0% |
China Mobile (Hong Kong) Ltd. | 7,257,000 | | 63,885,256 |
Taiwan Mobile Co. Ltd. | 2,102,000 | | 2,912,275 |
| | 66,797,531 |
TOTAL TELECOMMUNICATION SERVICES | | 130,649,931 |
UTILITIES - 8.0% |
Electric Utilities - 6.8% |
CLP Holdings Ltd. | 5,060,000 | | 34,124,265 |
Hong Kong Electric Holdings Ltd. | 3,022,000 | | 16,288,126 |
| | 50,412,391 |
|
| Shares | | Value |
Independent Power Producers & Energy Traders - 1.2% |
China Resources Power Holdings Co. Ltd. | 3,686,000 | | $ 7,203,713 |
Datang International Power Generation Co. Ltd. | 4,136,000 | | 1,557,700 |
| | 8,761,413 |
TOTAL UTILITIES | | 59,173,804 |
TOTAL COMMON STOCKS (Cost $955,883,902) | 682,355,223 |
Money Market Funds - 9.9% |
| | | |
Fidelity Cash Central Fund, 1.81% (b) | 58,337,954 | | 58,337,954 |
Fidelity Securities Lending Cash Central Fund, 2.67% (b)(c) | 15,487,600 | | 15,487,600 |
TOTAL MONEY MARKET FUNDS (Cost $73,825,554) | 73,825,554 |
TOTAL INVESTMENT
PORTFOLIO - 102.0% (Cost $1,029,709,456) | | 756,180,777 |
NET OTHER ASSETS - (2.0)% | | (14,997,555) |
NET ASSETS - 100% | $ 741,183,222 |
Legend |
(a) Non-income producing |
(b) Affiliated fund that is available only to investment companies and other accounts managed by Fidelity Investments. The rate quoted is the annualized seven-day yield of the fund at period end. A complete unaudited listing of the fund's holdings as of its most recent quarter end is available upon request. |
(c) Investment made with cash collateral received from securities on loan. |
(d) Security or a portion of the security is on loan at period end. |
Affiliated Central Funds |
Information regarding fiscal year to date income earned by the Fund from investments in Fidelity Central Funds is as follows: |
Fund | Income earned |
Fidelity Cash Central Fund | $ 1,865,355 |
Fidelity Securities Lending Cash Central Fund | 268,379 |
Total | $ 2,133,734 |
Income Tax Information |
At October 31, 2008, the fund had a capital loss carryforward of approximately $148,402,224 all of which will expire on October 31, 2016. |
See accompanying notes which are an integral part of the financial statements.
Annual Report
China Region
Statement of Assets and Liabilities
| October 31, 2008 |
| | |
Assets | | |
Investment in securities, at value (including securities loaned of $14,710,225) -
See accompanying schedule: Unaffiliated issuers
(cost $955,883,902) | $ 682,355,223 | |
Fidelity Central Funds
(cost $73,825,554) | 73,825,554 | |
Total Investments
(cost $1,029,709,456) | | $ 756,180,777 |
Foreign currency held at value
(cost $5,191) | | 5,191 |
Receivable for investments sold | | 3,216,321 |
Receivable for fund shares sold | | 1,570,428 |
Dividends receivable | | 2,916,194 |
Distributions receivable from Fidelity Central Funds | | 90,277 |
Prepaid expenses | | 463 |
Other receivables | | 393,529 |
Total assets | | 764,373,180 |
| | |
Liabilities | | |
Payable for investments purchased | $ 6,096,956 | |
Payable for fund shares redeemed | 623,679 | |
Accrued management fee | 460,443 | |
Distribution fees payable | 429 | |
Other affiliated payables | 279,944 | |
Other payables and accrued expenses | 240,907 | |
Collateral on securities loaned, at value | 15,487,600 | |
Total liabilities | | 23,189,958 |
| | |
Net Assets | | $ 741,183,222 |
Net Assets consist of: | | |
Paid in capital | | $ 1,162,196,359 |
Undistributed net investment income | | 6,027,366 |
Accumulated undistributed net realized gain (loss) on investments and foreign currency transactions | | (153,478,093) |
Net unrealized appreciation (depreciation) on investments and assets and liabilities in foreign currencies | | (273,562,410) |
Net Assets | | $ 741,183,222 |
Statement of Assets and Liabilities - continued
| October 31, 2008 |
| | |
Calculation of Maximum Offering Price Class A:
Net Asset Value and redemption
price per share ($340,222 ÷ 20,412 shares) | | $ 16.67 |
| | |
Maximum offering price per share (100/94.25 of $16.67) | | $ 17.69 |
Class T:
Net Asset Value and redemption
price per share ($107,102 ÷ 6,433 shares) | | $ 16.65 |
| | |
Maximum offering price per share (100/96.50 of $16.65) | | $ 17.25 |
Class B:
Net Asset Value and offering
price per share ($154,625 ÷ 9,310 shares)A | | $ 16.61 |
| | |
Class C:
Net Asset Value and offering
price per share ($232,824 ÷ 14,016 shares)A | | $ 16.61 |
| | |
China Region:
Net Asset Value, offering
price and redemption price per share ($740,288,870 ÷ 44,356,661 shares) | | $ 16.69 |
| | |
Institutional Class:
Net Asset Value, offering price and redemption price per share ($59,579 ÷ 3,568 shares) | | $ 16.70 |
A Redemption price per share is equal to net asset value less any applicable contingent deferred sales charge.
See accompanying notes which are an integral part of the financial statements.
Annual Report
Statement of Operations
| Year ended October 31, 2008 |
| | |
Investment Income | | |
Dividends | | $ 34,759,063 |
Interest | | 4,164 |
Income from Fidelity Central Funds (including $268,379 from security lending) | | 2,133,734 |
| | 36,896,961 |
Less foreign taxes withheld | | (3,209,864) |
Total income | | 33,687,097 |
| | |
Expenses | | |
Management fee | $ 9,927,896 | |
Transfer agent fees | 3,515,043 | |
Distribution fees | 1,942 | |
Accounting and security lending fees | 641,000 | |
Custodian fees and expenses | 985,602 | |
Independent trustees' compensation | 6,327 | |
Registration fees | 159,248 | |
Audit | 65,400 | |
Legal | 7,178 | |
Interest | 8,739 | |
Miscellaneous | 204,566 | |
Total expenses before reductions | 15,522,941 | |
Expense reductions | (2,068,258) | 13,454,683 |
Net investment income (loss) | | 20,232,414 |
Realized and Unrealized Gain (Loss) Net realized gain (loss) on: | | |
Investment securities: | | |
Unaffiliated issuers | (149,991,373) | |
Foreign currency transactions | (1,835,509) | |
Total net realized gain (loss) | | (151,826,882) |
Change in net unrealized appreciation (depreciation) on: Investment securities | (900,514,910) | |
Assets and liabilities in foreign currencies | (52,493) | |
Total change in net unrealized appreciation (depreciation) | | (900,567,403) |
Net gain (loss) | | (1,052,394,285) |
Net increase (decrease) in net assets resulting from operations | | $ (1,032,161,871) |
Statement of Changes in Net Assets
| Year ended
October 31,
2008 | Year ended
October 31,
2007 |
Increase (Decrease) in Net Assets | | |
Operations | | |
Net investment income (loss) | $ 20,232,414 | $ 17,487,006 |
Net realized gain (loss) | (151,826,882) | 248,422,709 |
Change in net unrealized appreciation (depreciation) | (900,567,403) | 471,226,907 |
Net increase (decrease) in net assets resulting from operations | (1,032,161,871) | 737,136,622 |
Distributions to shareholders from net investment income | (15,794,709) | (9,931,797) |
Distributions to shareholders from net realized gain | (223,593,729) | (6,849,518) |
Total distributions | (239,388,438) | (16,781,315) |
Share transactions - net increase (decrease) | (34,409,565) | 588,174,307 |
Redemption fees | 2,616,118 | 1,203,951 |
Total increase (decrease) in net assets | (1,303,343,756) | 1,309,733,565 |
| | |
Net Assets | | |
Beginning of period | 2,044,526,978 | 734,793,413 |
End of period (including undistributed net investment income of $6,027,366 and undistributed net investment income of $16,429,698, respectively) | $ 741,183,222 | $ 2,044,526,978 |
See accompanying notes which are an integral part of the financial statements.
Annual Report
Financial Highlights - Class A
Year ended October 31, | 2008 H |
Selected Per-Share Data | |
Net asset value, beginning of period | $ 29.28 |
Income from Investment Operations | |
Net investment income (loss)E | .28 |
Net realized and unrealized gain (loss) | (12.91) |
Total from investment operations | (12.63) |
Redemption fees added to paid in capitalE | .02 |
Net asset value, end of period | $ 16.67 |
Total ReturnB, C, D | (43.07)% |
Ratios to Average Net AssetsF, I | |
Expenses before reductions | 1.44%A |
Expenses net of fee waivers, if any | 1.44%A |
Expenses net of all reductions | 1.30%A |
Net investment income (loss) | 2.63%A |
Supplemental Data | |
Net assets, end of period (000 omitted) | $ 340 |
Portfolio turnover rateG | 133% |
A Annualized B Total returns for periods of less than one year are not annualized. C Total returns would have been lower had certain expenses not been reduced during the periods shown. D Total returns do not include the effect of the sales charges. E Calculated based on average shares outstanding during the period. F Fees and expenses of the underlying Fidelity Central Funds are not included in the Fund's expense ratio. The Fund indirectly bears its proportionate share of the expenses of any underlying Fidelity Central Funds. G Amount does not include the portfolio activity of any underlying Fidelity Central Funds. H For the period May 9, 2008 (commencement of sale of shares) to October 31, 2008. I Expense ratios reflect operating expenses of the class. Expenses before reductions do not reflect amounts reimbursed by the investment adviser or reductions from brokerage service arrangements or other expense offset arrangements and do not represent the amount paid by the class during periods when reimbursements or reductions occur. Expense ratios before reductions for start-up periods may not be representative of longer-term operating periods. Expenses net of fee waivers reflect expenses after reimbursement by the investment adviser but prior to reductions from brokerage service arrangements or other expense offset arrangements. Expenses net of all reductions represent the net expenses paid by the class. |
Financial Highlights - Class T
Year ended October 31, | 2008 H |
Selected Per-Share Data | |
Net asset value, beginning of period | $ 29.28 |
Income from Investment Operations | |
Net investment income (loss)E | .26 |
Net realized and unrealized gain (loss) | (12.91) |
Total from investment operations | (12.65) |
Redemption fees added to paid in capital E | .02 |
Net asset value, end of period | $ 16.65 |
Total ReturnB, C, D | (43.14)% |
Ratios to Average Net AssetsF, I | |
Expenses before reductions | 1.68%A |
Expenses net of fee waivers, if any | 1.68%A |
Expenses net of all reductions | 1.53%A |
Net investment income (loss) | 2.40%A |
Supplemental Data | |
Net assets, end of period (000 omitted) | $ 107 |
Portfolio turnover rateG | 133% |
A Annualized B Total returns for periods of less than one year are not annualized. C Total returns would have been lower had certain expenses not been reduced during the periods shown. D Total returns do not include the effect of the sales charges. E Calculated based on average shares outstanding during the period. F Fees and expenses of the underlying Fidelity Central Funds are not included in the Fund's expense ratio. The Fund indirectly bears its proportionate share of the expenses of any underlying Fidelity Central Funds. G Amount does not include the portfolio activity of any underlying Fidelity Central Funds. H For the period May 9, 2008 (commencement of sale of shares) to October 31, 2008. I Expense ratios reflect operating expenses of the class. Expenses before reductions do not reflect amounts reimbursed by the investment adviser or reductions from brokerage service arrangements or other expense offset arrangements and do not represent the amount paid by the class during periods when reimbursements or reductions occur. Expense ratios before reductions for start-up periods may not be representative of longer-term operating periods. Expenses net of fee waivers reflect expenses after reimbursement by the investment adviser but prior to reductions from brokerage service arrangements or other expense offset arrangements. Expenses net of all reductions represent the net expenses paid by the class. |
See accompanying notes which are an integral part of the financial statements.
Annual Report
Financial Highlights - Class B
Year ended October 31, | 2008 H |
Selected Per-Share Data | |
Net asset value, beginning of period | $ 29.28 |
Income from Investment Operations | |
Net investment income (loss)E | .20 |
Net realized and unrealized gain (loss) | (12.89) |
Total from investment operations | (12.69) |
Redemption fees added to paid in capitalE | .02 |
Net asset value, end of period | $ 16.61 |
Total ReturnB, C, D | (43.27)% |
Ratios to Average Net AssetsF, I | |
Expenses before reductions | 2.17% A |
Expenses net of fee waivers, if any | 2.17% A |
Expenses net of all reductions | 2.02% A |
Net investment income (loss) | 1.91% A |
Supplemental Data | |
Net assets, end of period (000 omitted) | $ 155 |
Portfolio turnover rate G | 133% |
A Annualized B Total returns for periods of less than one year are not annualized. C Total returns would have been lower had certain expenses not been reduced during the periods shown. D Total returns do not include the effect of the contingent deferred sales charge. E Calculated based on average shares outstanding during the period. F Fees and expenses of the underlying Fidelity Central Funds are not included in the Fund's expense ratio. The Fund indirectly bears its proportionate share of the expenses of any underlying Fidelity Central Funds. G Amount does not include the portfolio activity of any underlying Fidelity Central Funds. H For the period May 9, 2008 (commencement of sale of shares) to October 31, 2008. I Expense ratios reflect operating expenses of the class. Expenses before reductions do not reflect amounts reimbursed by the investment adviser or reductions from brokerage service arrangements or other expense offset arrangements and do not represent the amount paid by the class during periods when reimbursements or reductions occur. Expense ratios before reductions for start-up periods may not be representative of longer-term operating periods. Expenses net of fee waivers reflect expenses after reimbursement by the investment adviser but prior to reductions from brokerage service arrangements or other expense offset arrangements. Expenses net of all reductions represent the net expenses paid by the class. |
Financial Highlights - Class C
Year ended October 31, | 2008 H |
Selected Per-Share Data | |
Net asset value, beginning of period | $ 29.28 |
Income from Investment Operations | |
Net investment income (loss) E | .20 |
Net realized and unrealized gain (loss) | (12.89) |
Total from investment operations | (12.69) |
Redemption fees added to paid in capital E | .02 |
Net asset value, end of period | $ 16.61 |
Total ReturnB, C, D | (43.27)% |
Ratios to Average Net AssetsF, I | |
Expenses before reductions | 2.13%A |
Expenses net of fee waivers, if any | 2.13%A |
Expenses net of all reductions | 1.98%A |
Net investment income (loss) | 1.95%A |
Supplemental Data | |
Net assets, end of period (000 omitted) | $ 233 |
Portfolio turnover rateG | 133% |
A Annualized B Total returns for periods of less than one year are not annualized. C Total returns would have been lower had certain expenses not been reduced during the periods shown. D Total returns do not include the effect of the contingent deferred sales charge. E Calculated based on average shares outstanding during the period. F Fees and expenses of the underlying Fidelity Central Funds are not included in the Fund's expense ratio. The Fund indirectly bears its proportionate share of the expenses of any underlying Fidelity Central Funds. G Amount does not include the portfolio activity of any underlying Fidelity Central Funds. H For the period May 9, 2008 (commencement of sale of shares) to October 31, 2008. I Expense ratios reflect operating expenses of the class. Expenses before reductions do not reflect amounts reimbursed by the investment adviser or reductions from brokerage service arrangements or other expense offset arrangements and do not represent the amount paid by the class during periods when reimbursements or reductions occur. Expense ratios before reductions for start-up periods may not be representative of longer-term operating periods. Expenses net of fee waivers reflect expenses after reimbursement by the investment adviser but prior to reductions from brokerage service arrangements or other expense offset arrangements. Expenses net of all reductions represent the net expenses paid by the class. |
See accompanying notes which are an integral part of the financial statements.
Annual Report
Financial Highlights - China Region
Years ended October 31, | 2008 | 2007 | 2006 | 2005 | 2004 |
Selected Per-Share Data | | | | | |
Net asset value, beginning of period | $ 41.52 | $ 22.94 | $ 17.74 | $ 15.88 | $ 15.14 |
Income from Investment Operations | | | | | |
Net investment income (loss) B | .39 | .46 | .42 | .36 | .25 |
Net realized and unrealized gain (loss) | (20.42) | 18.58 | 4.99 | 1.75 | .73 |
Total from investment operations | (20.03) | 19.04 | 5.41 | 2.11 | .98 |
Distributions from net investment income | (.32) | (.29) | (.22) | (.26) | (.26) |
Distributions from net realized gain | (4.53) | (.20) | - | - | - |
Total distributions | (4.85) | (.49) | (.22) | (.26) | (.26) |
Redemption fees added to paid in capitalB | .05 | .03 | .01 | .01 | .02 |
Net asset value, end of period | $ 16.69 | $ 41.52 | $ 22.94 | $ 17.74 | $ 15.88 |
Total ReturnA | (53.75)% | 84.73% | 30.83% | 13.44% | 6.71% |
Ratios to Average Net AssetsC, E | | | | | |
Expenses before reductions | 1.11% | 1.08% | 1.14% | 1.16% | 1.22% |
Expenses net of fee waivers, if any | 1.11% | 1.08% | 1.14% | 1.16% | 1.22% |
Expenses net of all reductions | .96% | .92% | 1.08% | 1.12% | 1.22% |
Net investment income (loss) | 1.45% | 1.64% | 1.99% | 2.04% | 1.64% |
Supplemental Data | | | | | |
Net assets, end of period (000 omitted) | $ 740,289 | $ 2,044,527 | $ 734,793 | $ 396,905 | $ 296,004 |
Portfolio turnover rateD | 133% | 173% | 36% | 44% | 101% |
A Total returns would have been lower had certain expenses not been reduced during the periods shown. B Calculated based on average shares outstanding during the period. C Fees and expenses of the underlying Fidelity Central Funds are not included in the Fund's expense ratio. The Fund indirectly bears its proportionate share of the expenses of any underlying Fidelity Central Funds. D Amount does not include the portfolio activity of any underlying Fidelity Central Funds. E Expense ratios reflect operating expenses of the class. Expenses before reductions do not reflect amounts reimbursed by the investment adviser or reductions from brokerage service arrangements or other expense offset arrangements and do not represent the amount paid by the class during periods when reimbursements or reductions occur. Expenses net of fee waivers reflect expenses after reimbursement by the investment adviser but prior to reductions from brokerage service arrangements or other expense offset arrangements. Expenses net of all reductions represent the net expenses paid by the class. |
Financial Highlights - Institutional Class
Year ended October 31, | 2008 G |
Selected Per-Share Data | |
Net asset value, beginning of period | $ 29.28 |
Income from Investment Operations | |
Net investment income (loss)D | .34 |
Net realized and unrealized gain (loss) | (12.94) |
Total from investment operations | (12.60) |
Redemption fees added to paid in capitalD | .02 |
Net asset value, end of period | $ 16.70 |
Total ReturnB, C | (42.96)% |
Ratios to Average Net AssetsE, H | |
Expenses before reductions | 1.05%A |
Expenses net of fee waivers, if any | 1.05%A |
Expenses net of all reductions | .91%A |
Net investment income (loss) | 3.02%A |
Supplemental Data | |
Net assets, end of period (000 omitted) | $ 60 |
Portfolio turnover rateF | 133% |
A Annualized B Total returns for periods of less than one year are not annualized. C Total returns would have been lower had certain expenses not been reduced during the periods shown. D Calculated based on average shares outstanding during the period. E Fees and expenses of the underlying Fidelity Central Funds are not included in the Fund's expense ratio. The Fund indirectly bears its proportionate share of the expenses of any underlying Fidelity Central Funds. F Amount does not include the portfolio activity of any underlying Fidelity Central Funds. G For the period May 9, 2008 (commencement of sale of shares) to October 31, 2008. H Expense ratios reflect operating expenses of the class. Expenses before reductions do not reflect amounts reimbursed by the investment adviser or reductions from brokerage service arrangements or other expense offset arrangements and do not represent the amount paid by the class during periods when reimbursements or reductions occur. Expense ratios before reductions for start-up periods may not be representative of longer-term operating periods. Expenses net of fee waivers reflect expenses after reimbursement by the investment adviser but prior to reductions from brokerage service arrangements or other expense offset arrangements. Expenses net of all reductions represent the net expenses paid by the class. |
See accompanying notes which are an integral part of the financial statements.
Annual Report
China Region
Notes to Financial Statements
For the period ended October 31, 2008
1. Organization.
Fidelity China Region Fund (the Fund) is a fund of Fidelity Investment Trust (the trust) and is authorized to issue an unlimited number of shares. The trust is registered under the Investment Company Act of 1940, as amended (the 1940 Act), as an open-end management investment company organized as a Massachusetts business trust. The Fund commenced sale of Class A, Class T, Class B, Class C, and Institutional Class shares and the existing class was designated China Region on May 9, 2008. Class B shares will automatically convert to Class A shares after a holding period of seven years from the initial date of purchase. Investment income, realized and unrealized capital gains and losses, the common expenses of the Fund, and certain fund-level expense reductions, if any, are allocated on a pro rata basis to each class based on the relative net assets of each class to the total net assets of the Fund. Each class differs with respect to transfer agent and distribution and service plan fees incurred. Certain expense reductions also differ by class. The Fund's investments in emerging markets can be subject to social, economic, regulatory, and political uncertainties and can be extremely volatile.
2. Investments in Fidelity Central Funds.
The Fund may invest in Fidelity Central Funds, which are open-end investment companies available only to other investment companies and accounts managed by Fidelity Management & Research Company (FMR) and its affiliates. The Fund's Schedule of Investments lists each of the Fidelity Central Funds held as of period end, if any, as an investment of the Fund, but does not include the underlying holdings of each Fidelity Central Fund. As an Investing Fund, the Fund indirectly bears its proportionate share of the expenses of the underlying Fidelity Central Funds.
The Money Market Central Funds seek preservation of capital and current income and are managed by Fidelity Investments Money Management, Inc. (FIMM), an affiliate of FMR.
A complete unaudited list of holdings for each Fidelity Central Fund is available upon request or at the SEC's web site at www.sec.gov. In addition, the financial statements of the Fidelity Central Funds, which are not covered by the Fund's Report of Independent Registered Public Accounting Firm, are available on the SEC's web site or upon request.
3. Significant Accounting Policies.
The financial statements have been prepared in conformity with accounting principles generally accepted in the United States of America, which require management to make certain estimates and assumptions at the date of the financial statements. Actual results could differ from those estimates. The following summarizes the significant accounting policies of the Fund:
Security Valuation. Investments are valued as of 4:00 p.m. Eastern time on the last calendar day of the period. Wherever possible, the Fund uses independent pricing services approved by the Board of Trustees to value its investments.
Equity securities, including restricted securities, for which market quotations are readily available, are valued at the last reported sale price or official closing price as reported by an independent pricing service on the primary market or exchange on which they are traded. In the event there were no sales during the day or closing prices are not available, securities are valued at the last quoted bid price. Investments in open-end mutual funds, including the Fidelity Central Funds, are valued at their closing net asset value each business day. Short-term securities with remaining maturities of sixty days or less for which quotations are not readily available are valued at amortized cost, which approximates value.
When current market prices or quotations are not readily available or reliable, valuations may be determined in good faith in accordance with procedures adopted by the Board of Trustees. Factors used in determining value may include significant market or security specific events, changes in interest rates and credit quality, and developments in foreign markets which are monitored by evaluating the performance of ADRs, futures contracts and exchange-traded funds. The frequency with which these procedures are used cannot be predicted and may be utilized to a significant extent. The value of securities used for net asset value (NAV) calculation under these procedures may differ from published prices for the same securities.
Foreign Currency. The Fund uses foreign currency contracts to facilitate transactions in foreign-denominated securities. Losses from these transactions may arise from changes in the value of the foreign currency or if the counterparties do not perform under the contracts' terms.
Foreign-denominated assets, including investment securities, and liabilities are translated into U.S. dollars at the exchange rate at period end. Purchases and sales of investment securities, income and dividends received and expenses denominated in foreign currencies are translated into U.S. dollars at the exchange rate in effect on the transaction date.
The effects of exchange rate fluctuations on investments are included with the net realized and unrealized gain (loss) on investment securities. Other foreign currency transactions resulting in realized and unrealized gain (loss) are disclosed separately.
Annual Report
3. Significant Accounting Policies - continued
Investment Transactions and Income. For financial reporting purposes, the Fund's investment holdings and NAV include trades executed through the end of the last business day of the period. The NAV per share for processing shareholder transactions is calculated as of the close of business of the New York Stock Exchange (NYSE), normally 4:00 p.m. Eastern time and includes trades executed through the end of the prior business day. Gains and losses on securities sold are determined on the basis of identified cost. Dividend income is recorded on the ex-dividend date, except for certain dividends from foreign securities where the ex-dividend date may have passed, which are recorded as soon as the Fund is informed of the ex-dividend date. Non-cash dividends included in dividend income, if any, are recorded at the fair market value of the securities received. Interest income and distributions from the Fidelity Central Funds are accrued as earned. Interest income includes coupon interest and amortization of premium and accretion of discount on debt securities. Investment income is recorded net of foreign taxes withheld where recovery of such taxes is uncertain.
Expenses. Most expenses of the trust can be directly attributed to a fund. Expenses which cannot be directly attributed are apportioned among each Fund in the trust. Expense estimates are accrued in the period to which they relate and adjustments are made when actual amounts are known.
Income Tax Information and Distributions to Shareholders. Each year, the Fund intends to qualify as a regulated investment company by distributing substantially all of its taxable income and realized gains under Subchapter M of the Internal Revenue Code and filing its U.S. federal tax return. As a result, no provision for income taxes is required. The Fund is subject to the provisions of FASB Interpretation No. 48, Accounting for Uncertainties in Income Taxes (FIN 48). FIN 48 sets forth a minimum threshold for financial statement recognition of the benefit of a tax position taken or expected to be taken in a tax return. The implementation of FIN 48 did not result in any unrecognized tax benefits in the accompanying financial statements. Each of the Fund's federal tax returns for the prior three fiscal years remains subject to examination by the Internal Revenue Service (IRS). Foreign taxes are provided for based on the Fund's understanding of the tax rules and rates that exist in the foreign markets in which it invests.
Distributions are recorded on the ex-dividend date. Income dividends and capital gain distributions are declared separately for each class. Income and capital gain distributions are determined in accordance with income tax regulations, which may differ from generally accepted accounting principles. In addition, the Fund will claim a portion of the payment made to redeeming shareholders as a distribution for income tax purposes.
Capital accounts within the financial statements are adjusted for permanent book-tax differences. These adjustments have no impact on net assets or the results of operations. Temporary book-tax differences will reverse in a subsequent period.
Book-tax differences are primarily due to foreign currency transactions, passive foreign investment companies (PFIC), market discount, deferred trustees compensation and losses deferred due to wash sales.
The tax-basis components of distributable earnings and the federal tax cost as of period end were as follows:
Unrealized appreciation | $ 21,321,361 |
Unrealized depreciation | (299,959,636) |
Net unrealized appreciation (depreciation) | (278,638,275) |
Undistributed ordinary income | 5,975,924 |
Capital loss carryforward | (148,402,224) |
| |
Cost for federal income tax purposes | $ 1,034,819,052 |
The tax character of distributions paid was as follows:
| October 31, 2008 | October 31, 2007 |
Ordinary Income | $ 49,852,032 | $ 9,931,797 |
Long-term Capital Gains | 189,536,406 | 6,849,518 |
Total | $ 239,388,438 | $ 16,781,315 |
Short-Term Trading (Redemption) Fees. Shares held in the Fund less than 90 days are subject to a redemption fee equal to 1.50% of the proceeds of the redeemed shares. All redemption fees, including any estimated redemption fees paid by FMR, are retained by the Fund and accounted for as an addition to paid in capital.
New Accounting Pronouncement. In September 2006, Statement of Financial Accounting Standards No. 157, Fair Value Measurements (SFAS 157), was issued and is effective for fiscal years beginning after November 15, 2007. SFAS 157 defines fair value, establishes a framework for measuring fair value and results in expanded disclosures about fair value measurements.
Annual Report
China Region
Notes to Financial Statements - continued
4. Operating Policies.
Repurchase Agreements. FMR has received an Exemptive Order from the Securities and Exchange Commission (the SEC) which permits the Fund and other affiliated entities of FMR to transfer uninvested cash balances into joint trading accounts which are then invested in repurchase agreements. The Fund may also invest directly with institutions in repurchase agreements. Repurchase agreements are collateralized by government or non-government securities. Upon settlement date, collateral is held in segregated accounts with custodian banks and may be obtained in the event of a default of the counterparty. The Fund monitors, on a daily basis, the value of the collateral to ensure it is at least equal to the principal amount of the repurchase agreement (including accrued interest). In the event of a default by the counterparty, realization of the collateral proceeds could be delayed, during which time the value of the collateral may decline.
5. Purchases and Sales of Investments.
Purchases and sales of securities, other than short-term securities, aggregated $1,807,459,093 and $2,036,363,750, respectively.
6. Fees and Other Transactions with Affiliates.
Management Fee. FMR and its affiliates provide the Fund with investment management related services for which the Fund pays a monthly management fee. The management fee is the sum of an individual fund fee rate that is based on an annual rate of .45% of the Fund's average net assets and a group fee rate that averaged .26% during the period. The group fee rate is based upon the average net assets of all the mutual funds advised by FMR. The group fee rate decreases as assets under management increase and increases as assets under management decrease. For the period, the total annual management fee rate was .71% of the Fund's average net assets.
Distribution and Service Plan. In accordance with Rule 12b-1 of the 1940 Act, the Fund has adopted separate Distribution and Service Plans for each class of shares. Certain classes pay Fidelity Distributors Corporation (FDC), an affiliate of FMR, separate Distribution and Service Fees, each of which is based on an annual percentage of each class' average net assets. In addition, FDC may pay financial intermediaries for selling shares of the Fund and providing shareholder support services. For the period, the Distribution and Service Fee rates and the total amounts paid to and retained by FDC were as follows:
| Distribution
Fee | Service
Fee | Paid to
FDC | Retained
by FDC |
Class A | 0% | .25% | $ 396 | $ 184 |
Class T | .25% | .25% | 254 | 194 |
Class B | .75% | .25% | 626 | 565 |
Class C | .75% | .25% | 666 | 573 |
| | | $ 1,942 | $ 1,516 |
Sales Load. FDC receives a front-end sales charge of up to 5.75% for selling Class A shares, and 3.50% for selling Class T shares, some of which is paid to financial intermediaries for selling shares of the Fund. FDC receives the proceeds of contingent deferred sales charges levied on Class A, Class T, Class B, and Class C redemptions. These charges depend on the holding period. The deferred sales charges range from 5% to 1% for Class B, 1% for Class C, 1.00% to .50% for certain purchases of Class A shares and .25% for certain purchases of Class T shares.
For the period, sales charge amounts retained by FDC were as follows:
| Retained
by FDC |
Class A | $ 2,552 |
Class T | 96 |
Class B* | - |
Class C* | 19 |
| $ 2,667 |
* When Class B and Class C shares are initially sold, FDC pays commissions from its own resources to financial intermediaries through which the sales are made.
Annual Report
6. Fees and Other Transactions with Affiliates - continued
Transfer Agent Fees. Fidelity Investments Institutional Operations Company, Inc. (FIIOC), an affiliate of FMR, is the transfer, dividend disbursing and shareholder servicing agent for each class of the Fund. FIIOC receives account fees and asset-based fees that vary according to the account size and type of account of the shareholders of the respective classes of the Fund. FIIOC pays for typesetting, printing and mailing of shareholder reports, except proxy statements. Prior to January 1, 2008, Fidelity Service Company, Inc. (FSC), also an affiliate of FMR, was the transfer agent for China Region shares. For the period, each class paid the following transfer agent fees:
| Amount | % of
Average
Net Assets |
Class A | $ 498 | .31* |
Class T | 152 | .30* |
Class B | 183 | .29* |
Class C | 174 | .26* |
China Region | 3,513,962 | .25 |
Institutional Class | 74 | .18* |
| $ 3,515,043 | |
* Annualized
Accounting and Security Lending Fees. FSC maintains the Fund's accounting records. The accounting fee is based on the level of average net assets for the month. Under a separate contract, FSC administers the security lending program. The security lending fee is based on the number and duration of lending transactions.
Brokerage Commissions. The Fund placed a portion of its portfolio transactions with brokerage firms which are affiliates of the investment adviser. The commissions paid to these affiliated firms were $37 for the period.
Interfund Lending Program. Pursuant to an Exemptive Order issued by the SEC, the Fund, along with other registered investment companies having management contracts with FMR, may participate in an interfund lending program. This program provides an alternative credit facility allowing the funds to borrow from, or lend money to, other participating affiliated funds. At period end, there were no interfund loans outstanding. The Fund's activity in this program during the period for which loans were outstanding was as follows:
Borrower or Lender | Average Daily
Loan Balance | Weighted Average Interest Rate | Interest
Expense |
Borrower | $ 18,672,333 | 2.81% | $ 8,739 |
7. Committed Line of Credit.
The Fund participates with other funds managed by FMR in a $4.2 billion credit facility (the "line of credit") to be utilized for temporary or emergency purposes to fund shareholder redemptions or for other short-term liquidity purposes. The Fund has agreed to pay commitment fees on its pro rata portion of the line of credit, which amounted to $2,898 and is reflected in Miscellaneous Expense on the Statement of Operations. During the period, there were no borrowings on this line of credit.
8. Security Lending.
The Fund lends portfolio securities from time to time in order to earn additional income. On the settlement date of the loan, the Fund receives collateral (in the form of U.S. Treasury obligations, letters of credit and/or cash) against the loaned securities and maintains collateral in an amount not less than 100% of the market value of the loaned securities during the period of the loan. The market value of the loaned securities is determined at the close of business of the Fund and any additional required collateral is delivered to the Fund on the next business day. If the borrower defaults on its obligation to return the securities loaned because of insolvency or other reasons, a fund could experience delays and costs in recovering the securities loaned or in gaining access to the collateral. Any cash collateral received is invested in the Fidelity Securities Lending Cash Central Fund. The value of loaned securities and cash collateral at period end are disclosed on the Fund's Statement of Assets and Liabilities. Security lending income represents the income earned on investing cash collateral, less fees and expenses associated with the loan, plus any premium payments that may be received on the loan of certain types of securities. Security lending income is presented in the Statement of Operations as a component of income from Fidelity Central Funds.
Annual Report
China Region
Notes to Financial Statements - continued
9. Expense Reductions.
FMR voluntarily agreed to reimburse a portion of China Region's operating expenses. During the period, this reimbursement reduced the class' expenses by $56,475.
Many of the brokers with whom FMR places trades on behalf of the Fund provided services to the Fund in addition to trade execution. These services included payments of certain expenses on behalf of the Fund totaling $1,973,232 for the period. In addition, through arrangements with the Fund's custodian and each class' transfer agent, credits realized as a result of uninvested cash balances were used to reduce the Fund's expenses. During the period, these credits reduced the Fund's custody expenses by $20,941. During the period, credits reduced each class' transfer agent expense as noted in the table below.
| Transfer Agent
expense reduction |
China Region | $ 17,610 |
10. Other.
The Fund's organizational documents provide former and current trustees and officers with a limited indemnification against liabilities arising in connection with the performance of their duties to the Fund. In the normal course of business, the Fund may also enter into contracts that provide general indemnifications. The Fund's maximum exposure under these arrangements is unknown as this would be dependent on future claims that may be made against the Fund. The risk of material loss from such claims is considered remote.
In December 2006, the Independent Trustees, with the assistance of independent counsel, completed an investigation regarding gifts, gratuities and business entertainment provided by certain brokers to certain individuals who were employed on FMR's domestic equity trading desk during the period 2002 to 2004. The Independent Trustees and FMR agreed that, despite the absence of proof that the Fidelity mutual funds experienced diminished execution quality as a result of the improper receipt of gifts and business entertainment, the conduct at issue was serious and was worthy of redress. Accordingly, the Independent Trustees requested, and FMR agreed to make, a payment of $42 million plus accrued interest, which equaled approximately $7.3 million, to certain Fidelity mutual funds.
In March 2008, the Trustees approved a method for allocating this payment among the funds and, in total, FMR paid the fund $92, which is recorded in the accompanying Statement of Operations.
In a related administrative order dated March 5, 2008, the U.S. Securities and Exchange Commission ("SEC") announced a settlement with FMR and FMR Co., Inc. (an affiliate of FMR) involving the SEC's regulatory rules for investment advisers and the improper receipt of gifts, gratuities and business entertainment. Without admitting or denying the SEC's findings, FMR agreed to pay an $8 million civil penalty to the United States Treasury.
11. Distributions to Shareholders.
Distributions to shareholders of each class were as follows:
Years ended October 31, | 2008 | 2007 |
From net investment income | | |
China Region | $ 15,794,709 | $ 9,931,797 |
From net realized gain | | |
China Region | $ 223,593,729 | $ 6,849,518 |
Annual Report
12. Share Transactions.
Transactions for each class of shares were as follows:
| Shares | Dollars |
Years ended October 31, | 2008 A | 2007 | 2008 A | 2007 |
Class A | | | | |
Shares sold | 30,242 | - | $ 750,104 | $ - |
Shares redeemed | (9,830) | - | (195,417) | - |
Net increase (decrease) | 20,412 | - | $ 554,687 | $ - |
Class T | | | | |
Shares sold | 6,603 | - | $ 171,008 | $ - |
Shares redeemed | (170) | - | (3,942) | - |
Net increase (decrease) | 6,433 | - | $ 167,066 | $ - |
Class B | | | | |
Shares sold | 9,379 | - | $ 239,439 | $ - |
Shares redeemed | (69) | - | (1,147) | - |
Net increase (decrease) | 9,310 | - | $ 238,292 | $ - |
Class C | | | | |
Shares sold | 16,209 | - | $ 359,453 | $ - |
Shares redeemed | (2,193) | - | (34,305) | - |
Net increase (decrease) | 14,016 | - | $ 325,148 | $ - |
China Region | | | | |
Shares sold | 24,232,728 | 38,031,904 | $ 702,714,867 | $ 1,145,260,346 |
Reinvestment of distributions | 7,102,996 | 675,406 | 228,787,494 | 16,027,386 |
Shares redeemed | (36,222,341) | (21,493,222) | (967,305,455) | (573,113,425) |
Net increase (decrease) | (4,886,617) | 17,214,088 | $ (35,803,094) | $ 588,174,307 |
Institutional Class | | | | |
Shares sold | 5,359 | - | $ 145,686 | $ - |
Shares redeemed | (1,791) | - | (37,350) | - |
Net increase (decrease) | 3,568 | - | $ 108,336 | $ - |
A Share transactions for Class A, Class T, Class B, Class C, and Institutional Class are for the period May 9, 2008 (commencement of sale of shares) to October 31, 2008.
Annual Report
Report of Independent Registered Public Accounting Firm
To the Trustees of Fidelity Investment Trust and the Shareholders of Fidelity China Region Fund:
In our opinion, the accompanying statement of assets and liabilities, including the schedule of investments, and the related statements of operations and of changes in net assets and the financial highlights present fairly, in all material respects, the financial position of Fidelity China Region Fund (a fund of Fidelity Investment Trust) at October 31, 2008, the results of its operations for the periods indicated, the changes in its net assets for each of the periods indicated and the financial highlights for each of the periods indicated, in conformity with accounting principles generally accepted in the United States of America. These financial statements and financial highlights (hereafter referred to as "financial statements") are the responsibility of the Fidelity China Region Fund's management. Our responsibility is to express an opinion on these financial statements based on our audits. We conducted our audits of these financial statements in accordance with the standards of the Public Company Accounting Oversight Board (United States). Those standards require that we plan and perform the audit to obtain reasonable assurance about whether the financial statements are free of material misstatement. An audit includes examining, on a test basis, evidence supporting the amounts and disclosures in the financial statements, assessing the accounting principles used and significant estimates made by management, and evaluating the overall financial statement presentation. We believe that our audits, which included confirmation of securities at October 31, 2008 by correspondence with the custodian and brokers, provide a reasonable basis for our opinion.
/s/ PricewaterhouseCoopers LLP
PricewaterhouseCoopers LLP
Boston, Massachusetts
December 23, 2008
Annual Report
The Trustees, Member of the Advisory Board, and executive officers of the trust and fund, as applicable, are listed below. The Board of Trustees governs the fund and is responsible for protecting the interests of shareholders. The Trustees are experienced executives who meet periodically throughout the year to oversee the fund's activities, review contractual arrangements with companies that provide services to the fund, and review the fund's performance. Except for Edward C. Johnson 3d and James C. Curvey, each of the Trustees oversees 220 funds advised by FMR or an affiliate. Messrs. Johnson and Curvey oversee 379 funds advised by FMR or an affiliate.
The Trustees hold office without limit in time except that (a) any Trustee may resign; (b) any Trustee may be removed by written instrument, signed by at least two-thirds of the number of Trustees prior to such removal; (c) any Trustee who requests to be retired or who has become incapacitated by illness or injury may be retired by written instrument signed by a majority of the other Trustees; and (d) any Trustee may be removed at any special meeting of shareholders by a two-thirds vote of the outstanding voting securities of the trust. Each Trustee who is not an interested person (as defined in the 1940 Act) (Independent Trustee), shall retire not later than the last day of the calendar year in which his or her 72nd birthday occurs. The Independent Trustees may waive this mandatory retirement age policy with respect to individual Trustees. The executive officers and Advisory Board Member hold office without limit in time, except that any officer and Advisory Board Member may resign or may be removed by a vote of a majority of the Trustees at any regular meeting or any special meeting of the Trustees. Except as indicated, each individual has held the office shown or other offices in the same company for the past five years.
The fund's Statement of Additional Information (SAI) includes more information about the Trustees. To request a free copy, call Fidelity at 1-877-208-0098.
Interested Trustees*:
Correspondence intended for each Trustee who is an interested person may be sent to Fidelity Investments, 82 Devonshire Street, Boston, Massachusetts 02109.
Name, Age; Principal Occupation |
Edward C. Johnson 3d (78) |
| Year of Election or Appointment: 1984 Mr. Johnson is Chairman of the Board of Trustees. Mr. Johnson serves as Chief Executive Officer, Chairman, and a Director of FMR LLC; Chairman and a Director of FMR; Chairman and a Director of Fidelity Research & Analysis Company (FRAC); Chairman and a Director of Fidelity Investments Money Management, Inc.; and Chairman and a Director of FMR Co., Inc. In addition, Mr. Johnson serves as Chairman and Director of FIL Limited. Previously, Mr. Johnson served as President of FMR LLC (2006-2007). |
James C. Curvey (73) |
| Year of Election or Appointment: 2007 Mr. Curvey also serves as Trustee (2007-present) of other investment companies advised by FMR. Mr. Curvey is a Director of FMR and FMR Co., Inc. (2007-present). Mr. Curvey is also Vice Chairman (2006-present) and Director of FMR LLC. In addition, Mr. Curvey serves as an Overseer for the Boston Symphony Orchestra and a member of the Trustees of Villanova University. |
* Trustees have been determined to be "Interested Trustees" by virtue of, among other things, their affiliation with the trust or various entities under common control with FMR. FMR Corp. merged with and into FMR LLC on October 1, 2007. Any references to FMR LLC for prior periods are deemed to be references to the prior entity.
Independent Trustees:
Correspondence intended for each Independent Trustee (that is, the Trustees other than the Interested Trustees) may be sent to Fidelity Investments, P.O. Box 55235, Boston, Massachusetts 02205-5235.
Name, Age; Principal Occupation |
Dennis J. Dirks (60) |
| Year of Election or Appointment: 2005 Prior to his retirement in May 2003, Mr. Dirks was Chief Operating Officer and a member of the Board of The Depository Trust & Clearing Corporation (DTCC) (1999-2003). He also served as President, Chief Operating Officer, and Board member of The Depository Trust Company (DTC) (1999-2003) and President and Board member of the National Securities Clearing Corporation (NSCC) (1999-2003). In addition, Mr. Dirks served as a Trustee and a member of the Finance Committee of Manhattan College (2005-2008), and as Chief Executive Officer and Board member of the Government Securities Clearing Corporation (2001-2003) and Chief Executive Officer and Board member of the Mortgage-Backed Securities Clearing Corporation (2001-2003). Mr. Dirks also serves as a Trustee and a member of the Finance Committee of AHRC of Nassau County (2006-present). |
Alan J. Lacy (55) |
| Year of Election or Appointment: 2008 Mr. Lacy serves as Senior Adviser (2007-present) of Oak Hill Capital Partners, L.P. (a private equity firm). Mr. Lacy also served as Chief Executive Officer (2000-2005) and Vice Chairman (2005-2006) of Sears Holdings Corporation and Sears, Roebuck and Co. (retail). In addition, Mr. Lacy serves as a member of the Board of Directors of The Western Union Company (global money transfer, 2006-present) and Bristol-Myers Squibb (global pharmaceuticals, 2007-present). Mr. Lacy is a Trustee of the National Parks Conservation Association and The Field Museum of Natural History. |
Ned C. Lautenbach (64) |
| Year of Election or Appointment: 2000 Mr. Lautenbach is Chairman of the Independent Trustees (2006-present). Mr. Lautenbach is an Advisory Partner of Clayton, Dubilier & Rice, Inc. (private equity investment firm). Previously, Mr. Lautenbach was with the International Business Machines Corporation (IBM) from 1968 until his retirement in 1998. Mr. Lautenbach serves as a Director of Eaton Corporation (diversified industrial) as well as the Philharmonic Center for the Arts in Naples, Florida. He also is a member of the Board of Trustees of Fairfield University (2005-present), as well as a member of the Council on Foreign Relations. Previously, Mr. Lautenbach served as a Director of Sony Corporation (2006-2007). |
Joseph Mauriello (64) |
| Year of Election or Appointment: 2008 Prior to his retirement in January 2006, Mr. Mauriello served in numerous senior management positions including Deputy Chairman and Chief Operating Officer (2004-2005), and Vice Chairman of Financial Services (2002-2004) of KPMG LLP US (professional services firm, 1965-2005). Mr. Mauriello currently serves as a member of the Board of Directors of XL Capital Ltd. (global insurance and re-insurance company, 2006-present) and of Arcadia Resources Inc. (health care services and products, 2007-
present). He also served as a Director of the Hamilton Funds of the Bank of New York (2006-2007). |
Cornelia M. Small (64) |
| Year of Election or Appointment: 2005 Ms. Small is a member of the Investment Committee, and Chair (2008-present) and a member of the Board of Trustees of Smith College. Ms. Small also serves on the Investment Committee of the Berkshire Taconic Community Foundation (2008-present). Previously, Ms. Small served as Chairperson of the Investment Committee (2002-2008) of Smith College and as Co-Chair (2000-
2003) of the Annual Fund for the Fletcher School of Law and Diplomacy. In addition, she served as Chief Investment Officer, Director of Global Equity Investments, and a member of the Board of Directors of Scudder, Stevens & Clark and Scudder Kemper Investments. |
William S. Stavropoulos (69) |
| Year of Election or Appointment: 2001 Mr. Stavropoulos is Chairman Emeritus of the Board of Directors of The Dow Chemical Company, where he previously served in numerous senior management positions, including President (1993-2000; 2002-2003), CEO (1995-2000; 2002-2004), Chairman of the Executive Committee (2000-2006), and as a member of the Board of Directors (1990-2006). Currently, he is a Director of Teradata Corporation (data warehousing and technology solutions, 2008-present), Chemical Financial Corporation, Maersk Inc. (industrial conglomerate), Tyco International, Inc. (multinational manufacturing and services, 2007-present), and a member of the Advisory Board for Metalmark Capital (private equity investment firm, 2005-present). He is a special advisor to Clayton, Dubilier & Rice, Inc. (private equity investment). In addition, Mr. Stavropoulos is a member of the University of Notre Dame Advisory Council for the College of Science. |
David M. Thomas (59) |
| Year of Election or Appointment: 2008 Previously, Mr. Thomas served as Executive Chairman (2005-2006) and Chairman and Chief Executive Officer (2000-2005) of IMS Health, Inc. (pharmaceutical and healthcare information solutions). In addition, Mr. Thomas serves as a member of the Board of Directors of Fortune Brands, Inc. (consumer products holding company), and Interpublic Group of Companies, Inc. (marketing communication, 2004-present). |
Michael E. Wiley (58) |
| Year of Election or Appointment: 2008 Mr. Wiley also serves as a member of the Board of Trustees of the University of Tulsa (2000-2006; 2007-present). He serves as a Director of Tesoro Corporation (independent oil refiner and marketer, 2005-present), and a Director of Bill Barrett Corporation (exploration and production company, 2005-present). In addition, he also serves as a Director of Post Oak Bank (privately-held bank, 2004-present). Previously, Mr. Wiley served as a Sr. Energy Advisor of Katzenbach Partners, LLC (consulting firm, 2006-2007), as an Advisory Director of Riverstone Holdings (private investment firm), Chairman, President, and CEO of Baker Hughes, Inc. (oilfield services company, 2000-2004), and as Director of Spinnaker Exploration Company (exploration and production company, 2001-2005). |
Annual Report
Advisory Board Member and Executive Officers**:
Correspondence intended for each executive officer and Mr. Lynch may be sent to Fidelity Investments, 82 Devonshire Street, Boston, Massachusetts 02109.
Name, Age; Principal Occupation |
Peter S. Lynch (64) |
| Year of Election or Appointment: 2003 Member of the Advisory Board of Fidelity's Equity and High Income Funds. Mr. Lynch is Vice Chairman and a Director of FMR, and Vice Chairman (2001-present) and a Director of FMR Co., Inc. Previously, Mr. Lynch served as a Trustee of the Fidelity funds (1990-2003). In addition, he serves as a Trustee of Boston College and as the Chairman of the Inner-City Scholarship Fund. Previously, Mr. Lynch served on the Special Olympics International Board of Directors (1997-2006). |
Kenneth B. Robins (39) |
| Year of Election or Appointment: 2008 President and Treasurer of Fidelity's Equity and High Income Funds. Mr. Robins is an employee of Fidelity Investments (2004-
present). Before joining Fidelity Investments, Mr. Robins worked at KPMG LLP, where he was a partner in KPMG's department of professional practice (2002-2004). |
Walter C. Donovan (46) |
| Year of Election or Appointment: 2007 Vice President of Fidelity's Equity Funds. Mr. Donovan also serves as President of FMR and FMR Co., Inc., and Executive Vice President of Fidelity Investments Money Management, Inc. (2007-present). Previously, Mr. Donovan served as Executive Vice President of FMR and FMR Co., Inc. (2005-2007) and Senior Vice President of FMR (2003-2005) and FMR Co., Inc. (2004-2005). |
Eric M. Wetlaufer (46) |
| Year of Election or Appointment: 2006 Vice President of Fidelity's International Equity Funds. Mr. Wetlaufer also serves as Group Chief Investment Officer of FMR. Mr. Wetlaufer is Chairman, Chief Executive Officer, and President of Fidelity Management & Research (Hong Kong) Limited (2008-present); Chairman, Chief Executive Officer, President, and a Director of Fidelity Management & Research (Japan) Inc. (2008-present); Chairman and Chief Executive Officer (2007-present) and President and a Director (2006-present) of Fidelity Management & Research (U.K.) Inc. and President and a Director of Fidelity Research & Analysis Company (2006-present). Before joining Fidelity Investments in 2005, Mr. Wetlaufer was a partner in Oxhead Capital Management (2004-2005) and a Chief Investment Officer of Putnam Investments (1997-2003). |
Scott C. Goebel (40) |
| Year of Election or Appointment: 2008 Secretary and Chief Legal Officer (CLO) of the Fidelity funds. Mr. Goebel also serves as General Counsel, Secretary, and Senior Vice President of FMR (2008-present); Deputy General Counsel of FMR LLC; Chief Legal Secretary of Fidelity Management & Research (Hong Kong) Limited (2008-present) and Assistant Secretary of Fidelity Management & Research (Japan) Inc. (2008-
present). Previously, Mr. Goebel served as Assistant Secretary of the Funds (2007-2008) and as Vice President and Secretary of Fidelity Distributors Corporation (FDC) (2005-2007). |
John B. McGinty, Jr. (46) |
| Year of Election or Appointment: 2008 Assistant Secretary of Fidelity's Equity and High Income Funds. Mr. McGinty is an employee of Fidelity Investments (2004-present). Mr. McGinty also serves as Senior Vice President, Secretary, and Chief Legal Officer of FDC (2007-present). Before joining Fidelity Investments, Mr. McGinty practiced law at Ropes & Gray, LLP. |
Holly C. Laurent (54) |
| Year of Election or Appointment: 2008 Anti-Money Laundering (AML) Officer of the Fidelity funds. Ms. Laurent is an employee of Fidelity Investments. Previously, Ms. Laurent was Senior Vice President and Head of Legal for Fidelity Business Services India Pvt. Ltd. (2006-2008), Senior Vice President, Deputy General Counsel and Group Head for FMR LLC (2005-2006). |
Christine Reynolds (50) |
| Year of Election or Appointment: 2008 Chief Financial Officer of the Fidelity funds. Ms. Reynolds became President of Fidelity Pricing and Cash Management Services (FPCMS) in August 2008. She served as Chief Operating Officer of FPCMS from 2007 through July 2008. Previously, Ms. Reynolds served as President, Treasurer, and Anti-Money Laundering Officer of the Fidelity funds (2004-2007). Before joining Fidelity Investments, Ms. Reynolds worked at PricewaterhouseCoopers LLP (PwC) (1980-2002), where she was an audit partner with PwC's investment management practice. |
Kenneth A. Rathgeber (61) |
| Year of Election or Appointment: 2004 Chief Compliance Officer of Fidelity's Equity and High Income Funds. Mr. Rathgeber is Chief Compliance Officer of Fidelity Management & Research (Hong Kong) Limited (2008-present), Fidelity Management & Research (Japan) Inc. (2008-present), FMR (2005-present), FMR Co., Inc. (2005-present), Fidelity Management & Research (U.K.) Inc. (2005-present), Fidelity Research & Analysis Company (2005-present), Fidelity Investments Money Management, Inc. (2005-present), and Strategic Advisers, Inc. (2005-present). |
Bryan A. Mehrmann (47) |
| Year of Election or Appointment: 2005 Deputy Treasurer of the Fidelity funds. Mr. Mehrmann is an employee of Fidelity Investments. Previously, Mr. Mehrmann served as Vice President of Fidelity Investments Institutional Services Group (FIIS)/Fidelity Investments Institutional Operations Corporation, Inc. (FIIOC) Client Services (1998-2004). |
Adrien E. Deberghes (41) |
| Year of Election or Appointment: 2008 Deputy Treasurer of Fidelity's Equity and High Income Funds. Mr. Deberghes is an employee of Fidelity Investments (2008-present). Previously, Mr. Deberghes served as Senior Vice President of Mutual Fund Administration at State Street Corporation (2007-2008), Senior Director of Mutual Fund Administration at Investors Bank & Trust (2005-2007), and Director of Finance for Dunkin' Brands (2000-2005). |
Robert G. Byrnes (41) |
| Year of Election or Appointment: 2005 Assistant Treasurer of the Fidelity funds. Mr. Byrnes is an employee of Fidelity Investments (2005-present). Previously, Mr. Byrnes served as Vice President of Fidelity Pricing and Cash Management Services (FPCMS) (2003-2005). Before joining Fidelity Investments, Mr. Byrnes worked at Deutsche Asset Management where he served as Vice President of the Investment Operations Group (2000-2003). |
Peter L. Lydecker (54) |
| Year of Election or Appointment: 2004 Assistant Treasurer of the Fidelity funds. Mr. Lydecker is an employee of Fidelity Investments. |
Paul M. Murphy (61) |
| Year of Election or Appointment: 2007 Assistant Treasurer of the Fidelity funds. Mr. Murphy is an employee of Fidelity Investments (2007-present). Previously, Mr. Murphy served as Chief Financial Officer of the Fidelity Funds (2005-2006), Vice President and Associate General Counsel of FMR (2007), and Senior Vice President of Fidelity Pricing and Cash Management Services (FPCMS) (1994-2007). |
Gary W. Ryan (50) |
| Year of Election or Appointment: 2005 Assistant Treasurer of the Fidelity funds. Mr. Ryan is an employee of Fidelity Investments. Previously, Mr. Ryan served as Vice President of Fund Reporting in Fidelity Pricing and Cash Management Services (FPCMS) (1999-2005). |
** FMR Corp. merged with and into FMR LLC on October 1, 2007. Any references to FMR LLC for prior periods are deemed to be references to the prior entity.
Annual Report
A special meeting of the fund's shareholders was held on December 13, 2007. The results of votes taken among shareholders on the proposals before them are reported below. Each vote reported represents one dollar of net asset value held on the record date for the meeting.
PROPOSAL 1 |
To amend the Declaration of Trust to reduce the required quorum for shareholder meetings.A |
| # of
Votes | % of
Votes |
Affirmative | 45,014,793,255.82 | 80.372 |
Against | 6,871,112,667.08 | 12.268 |
Abstain | 2,163,456,438.02 | 3.863 |
Broker
Non-Votes | 1,958,633,563.89 | 3.497 |
TOTAL | 56,007,995,924.81 | 100.000 |
PROPOSAL 2 |
To elect the nominees specified below as Trustees.A |
| # of
Votes | % of
Votes |
James C. Curvey |
Affirmative | 53,384,952,361.03 | 95.317 |
Withheld | 2,623,043,563.78 | 4.683 |
TOTAL | 56,007,995,924.81 | 100.000 |
Dennis J. Dirks |
Affirmative | 53,595,104,608.67 | 95.692 |
Withheld | 2,412,891,316.14 | 4.308 |
TOTAL | 56,007,995,924.81 | 100.000 |
Albert R. Gamper, Jr. |
Affirmative | 53,570,235,221.69 | 95.647 |
Withheld | 2,437,760,703.12 | 4.353 |
TOTAL | 56,007,995,924.81 | 100.000 |
George H. Heilmeier |
Affirmative | 53,166,350,588.50 | 94.926 |
Withheld | 2,841,645,336.31 | 5.074 |
TOTAL | 56,007,995,924.81 | 100.000 |
Edward C. Johnson 3d |
Affirmative | 53,230,508,654.93 | 95.041 |
Withheld | 2,777,487,269.88 | 4.959 |
TOTAL | 56,007,995,924.81 | 100.000 |
James H. Keyes |
Affirmative | 53,549,161,456.52 | 95.610 |
Withheld | 2,458,834,468.29 | 4.390 |
TOTAL | 56,007,995,924.81 | 100.000 |
Marie L. Knowles |
Affirmative | 53,543,925,066.86 | 95.601 |
Withheld | 2,464,070,857.95 | 4.399 |
TOTAL | 56,007,995,924.81 | 100.000 |
Ned C. Lautenbach |
Affirmative | 53,547,116,322.50 | 95.606 |
Withheld | 2,460,879,602.31 | 4.394 |
TOTAL | 56,007,995,924.81 | 100.000 |
| # of
Votes | % of
Votes |
Cornelia M. Small |
Affirmative | 53,564,793,514.25 | 95.638 |
Withheld | 2,443,202,410.56 | 4.362 |
TOTAL | 56,007,995,924.81 | 100.000 |
William S. Stavropoulos |
Affirmative | 53,426,544,502.76 | 95.391 |
Withheld | 2,581,451,422.05 | 4.609 |
TOTAL | 56,007,995,924.81 | 100.000 |
Kenneth L. Wolfe |
Affirmative | 53,229,881,790.63 | 95.040 |
Withheld | 2,778,114,134.18 | 4.960 |
TOTAL | 56,007,995,924.81 | 100.000 |
A Denotes trust-wide proposal and voting results.
Annual Report
Proxy Voting Results
A special meeting of the fund's shareholders was held on April 16, 2008. The results of votes taken among shareholders on the proposal before them are reported below. Each vote reported represents one dollar of net asset value held on the record date for the meeting.
PROPOSAL 1 |
To elect a Board of Trustees.A |
| # of
Votes | % of
Votes |
James C. Curvey |
Affirmative | 44,485,656,811.55 | 94.702 |
Withheld | 2,488,551,854.62 | 5.298 |
TOTAL | 46,974,208,666.17 | 100.000 |
Dennis J. Dirks |
Affirmative | 44,706,671,638.31 | 95.173 |
Withheld | 2,267,537,027.86 | 4.827 |
TOTAL | 46,974,208,666.17 | 100.000 |
Edward C. Johnson 3d |
Affirmative | 44,294,881,638.16 | 94.296 |
Withheld | 2,679,327,028.01 | 5.704 |
TOTAL | 46,974,208,666.17 | 100.000 |
Alan J. Lacy |
Affirmative | 44,685,373,413.16 | 95.127 |
Withheld | 2,288,835,253.01 | 4.873 |
TOTAL | 46,974,208,666.17 | 100.000 |
Ned C. Lautenbach |
Affirmative | 44,634,541,379.41 | 95.019 |
Withheld | 2,339,667,286.76 | 4.981 |
TOTAL | 46,974,208,666.17 | 100.000 |
Joseph Mauriello |
Affirmative | 44,683,962,099.80 | 95.124 |
Withheld | 2,290,246,566.37 | 4.876 |
TOTAL | 46,974,208,666.17 | 100.000 |
Cornelia M. Small |
Affirmative | 44,671,688,375.36 | 95.098 |
Withheld | 2,302,520,290.81 | 4.902 |
TOTAL | 46,974,208,666.17 | 100.000 |
William S. Stavropoulos |
Affirmative | 44,465,262,087.61 | 94.659 |
Withheld | 2,508,946,578.56 | 5.341 |
TOTAL | 46,974,208,666.17 | 100.000 |
David M. Thomas |
Affirmative | 44,694,340,813.87 | 95.147 |
Withheld | 2,279,867,852.30 | 4.853 |
TOTAL | 46,974,208,666.17 | 100.000 |
Michael E. Wiley |
Affirmative | 44,686,513,174.78 | 95.130 |
Withheld | 2,287,695,491.39 | 4.870 |
TOTAL | 46,974,208,666.17 | 100.000 |
A Denotes trust-wide proposal and voting results.
Annual Report
Board Approval of Investment Advisory Contracts and Management Fees
Fidelity China Region Fund
Each year, typically in July, the Board of Trustees, including the Independent Trustees (together, the Board), votes on the renewal of the management contract and sub-advisory agreements (together, the Advisory Contracts) for the fund. The Board, assisted by the advice of fund counsel and Independent Trustees' counsel, requests and considers a broad range of information throughout the year.
The Board meets regularly and, acting directly and through its separate committees, requests and receives information concerning, and considers at each of its meetings factors that are relevant to, its annual consideration of the renewal of the fund's Advisory Contracts, including the services and support provided to the fund and its shareholders. At the time of the renewal, the Board had 12 standing committees, each composed of Independent Trustees with varying backgrounds, to which the Board has assigned specific subject matter responsibilities in order to enhance effective decision-making by the Board. Each committee has a written charter outlining the structure and purposes of the committee. The Board also meets as needed to consider matters specifically related to the Board's annual consideration of the renewal of Advisory Contracts.
At its July 2008 meeting, the Board of Trustees, including the Independent Trustees, unanimously determined to renew each fund's Advisory Contracts. In reaching its determination, the Board considered all factors it believed relevant, including (i) the nature, extent, and quality of the services to be provided to the fund and its shareholders (including the investment performance of the fund); (ii) the competitiveness of each fund's management fee and total expenses; (iii) the total costs of the services to be provided by and the profits to be realized by Fidelity from its relationship with the fund; (iv) the extent to which economies of scale would be realized as the fund grows; and (v) whether fee levels reflect these economies of scale, if any, for the benefit of fund shareholders. The Board also approved agreements with foreign sub-advisers Fidelity Management & Research (Japan) Inc. and Fidelity Management & Research (Hong Kong) Limited, as well as amendments to the fund's agreement with Fidelity Management & Research (U.K.) Inc.
In considering whether to renew the Advisory Contracts for the fund, the Board ultimately reached a determination, with the assistance of fund counsel and Independent Trustees' counsel and through the exercise of its business judgment, that the renewal of the Advisory Contracts and the compensation to be received by Fidelity under the management contract is consistent with Fidelity's fiduciary duty under applicable law. The Board's decision to renew the Advisory Contracts was not based on any single factor noted above, but rather was based on a comprehensive consideration of all the information provided to the Board at its meetings throughout the year. The Board, in reaching its determination to renew the Advisory Contracts, is aware that shareholders in the fund have a broad range of investment choices available to them, including a wide choice among mutual funds offered by competitors to Fidelity, and that the fund's shareholders, with the opportunity to review and weigh the disclosure provided by the fund in its prospectus and other public disclosures, have chosen to invest in this fund, managed by Fidelity.
Nature, Extent, and Quality of Services Provided. The Board considered staffing within the investment adviser, FMR, and the sub-advisers (together, the Investment Advisers), including the backgrounds of the fund's investment personnel and the fund's investment objective and discipline. The Independent Trustees also had discussions with senior management of Fidelity's investment operations and investment groups. The Board considered the structure of the portfolio manager compensation program and whether this structure provides appropriate incentives.
Resources Dedicated to Investment Management and Support Services. The Board reviewed the size, education, and experience of the Investment Advisers' investment staff, their use of technology, and the Investment Advisers' approach to recruiting, training, and retaining portfolio managers and other research, advisory, and management personnel. The Board noted that Fidelity's analysts have access to a variety of technological tools that enable them to perform both fundamental and quantitative analysis and to specialize in various disciplines. The Board considered Fidelity's extensive global research capabilities that enable the Investment Advisers to aggregate data from various sources in an effort to produce positive investment results. The Board also considered that Fidelity's portfolio managers and analysts have access to daily portfolio attribution that allows for monitoring of a fund's portfolio, as well as an electronic communication system that provides immediate real-time access to research concerning issuers and credit enhancers.
Shareholder and Administrative Services. The Board considered (i) the nature, extent, quality, and cost of advisory, administrative, distribution, and shareholder services performed by the Investment Advisers and their affiliates under the Advisory Contracts and under separate agreements covering transfer agency, pricing and bookkeeping, and securities lending services for the fund; (ii) the nature and extent of the Investment Advisers' supervision of third party service providers, principally custodians and subcustodians; and (iii) the resources devoted to, and the record of compliance with, the fund's compliance policies and procedures. The Board also reviewed the allocation of fund brokerage, including allocations to brokers affiliated with the Investment Advisers, the use of brokerage commissions to pay fund expenses, and the use of "soft" commission dollars to pay for research services. The Board further considered that Fidelity voluntarily pays for market data out of its own resources.
The Board noted that the growth of fund assets across the complex allows Fidelity to reinvest in the development of services designed to enhance the value or convenience of the Fidelity funds as investment vehicles. These services include 24 hour access to account information and market information through phone representatives and over the Internet, and investor education materials and asset allocation tools.
Investment in a Large Fund Family. The Board considered the benefits to shareholders of investing in a Fidelity fund, including the benefits of investing in a fund that is part of a large family of funds offering a variety of investment disciplines and providing for a large variety of mutual fund investor services. For example, fund shareholders are offered the privilege of exchanging shares of the fund for shares of other Fidelity funds, as set forth in the fund's prospectus, without paying a sales charge. The Board noted that Fidelity has taken a number of actions over the previous year that benefited particular funds, including (i) dedicating additional resources to investment research and to restructure the investment research teams; (ii) contractually agreeing to reduce the management fees on Fidelity's Institutional Money Market Funds and launching Class IV and Institutional Class of certain of these funds; (iii) reducing the transfer agent fees for the Fidelity Select Portfolios and Investor Class of the VIP funds; and (iv) launching Class K of 29 equity funds as a lower-fee class available to certain employer-sponsored retirement plans.
Annual Report
Investment Performance. The Board considered whether the fund has operated within its investment objective, as well as its record of compliance with its investment restrictions. It also reviewed the fund's absolute investment performance for Fidelity China Region (retail class), as well as the fund's relative investment performance for Fidelity China Region (retail class) measured against a broad-based securities market index over multiple periods. The Board noted that FMR does not believe that a meaningful peer group exists against which to compare the fund's performance. The following charts considered by the Board show, over the one-, three-, and five-year periods ended December 31, 2007, the cumulative total returns of Fidelity China Region (retail class) of the fund and the cumulative total returns of a broad-based securities market index ("benchmark"). (China Region Fund did not offer Advisor classes as of December 31, 2007.)
Fidelity China Region Fund
The Board stated that the investment performance of Fidelity China Region (retail class) of the fund compared favorably to its benchmark for all the periods shown.
The Board considered that FMR has taken steps to refocus and strengthen equity research, equity portfolio management, and compliance.
Based on its review, and giving particular weight to the nature and quality of the resources dedicated by the Investment Advisers to maintain and improve relative performance, the Board concluded that the nature, extent, and quality of the services provided to the fund will benefit the fund's shareholders, particularly in light of the Board's view that the fund's shareholders benefit from investing in a fund that is part of a large family of funds offering a variety of investment disciplines and services.
Competitiveness of Management Fee and Total Fund Expenses. The Board considered the fund's management fee and total expenses compared to "mapped groups" of competitive funds and classes. Fidelity creates "mapped groups" by combining similar Lipper investment objective categories that have comparable management fee characteristics. Combining Lipper investment objective categories aids the Board's management fee and total expense comparisons by broadening the competitive group used for comparison and by reducing the number of universes to which various Fidelity funds are compared. The Board also considered supplemental information about how the fund's management fee and total expenses ranked relative to groups based on Lipper classifications, which take into account a fund's market capitalization and style.
The Board considered two proprietary management fee comparisons for the 12-month periods shown in the chart below. The group of Lipper funds used by the Board for management fee comparisons is referred to below as the "Total Mapped Group." The Total Mapped Group comparison focuses on a fund's standing relative to the total universe of comparable funds available to investors, in terms of gross management fees before expense reimbursements or caps, and without giving effect to the fund's performance adjustment. "TMG %" represents the percentage of funds in the Total Mapped Group that had management fees that were lower than the fund's. For example, a TMG % of 9% means that 91% of the funds in the Total Mapped Group had higher management fees than the fund. The "Asset-Size Peer Group" (ASPG) comparison focuses on a fund's standing relative to non-Fidelity funds similar in size to the fund within the Total Mapped Group. The ASPG represents at least 15% of the funds in the Total Mapped Group with comparable asset size and management fee characteristics, subject to a minimum of 50 funds (or all funds in the Total Mapped Group if fewer than 50). Additional information, such as the ASPG quartile in which the fund's management fee ranked and the impact of the fund's performance adjustment, is also included in the chart and considered by the Board.
Annual Report
Board Approval of Investment Advisory Contracts and Management Fees - continued
Fidelity China Region Fund
The Board noted that the fund's management fee ranked below the median of its Total Mapped Group and below the median of its ASPG for 2007.
Based on its review, the Board concluded that the fund's management fee was fair and reasonable in light of the services that the fund receives and the other factors considered.
In its review of the fund's total expenses, the Board considered the fund's management fee as well as other fund expenses, such as transfer agent fees, pricing and bookkeeping fees, and custodial, legal, and audit fees. The Board also noted the effects of any waivers and reimbursements on fees and expenses. As part of its review, the Board also considered current and historical total expenses of the fund compared to competitive fund median expenses. The fund is compared to those funds and classes in the Total Mapped Group (used by the Board for management fee comparisons) that have a similar sales load structure.
The Board noted that the fund's total expenses ranked below its competitive median for 2007.
In its review of total expenses, the Board also considered Fidelity fee structures and other information on clients that FMR and its affiliates service in other competitive markets, such as other mutual funds advised or subadvised by FMR or its affiliates, pension plan clients, and other institutional clients.
Based on its review, the Board concluded that the fund's total expenses were reasonable in light of the services that the fund and its shareholders receive and the other factors considered.
Costs of the Services and Profitability. The Board considered the revenues earned and the expenses incurred by Fidelity in conducting the business of developing, marketing, distributing, managing, administering and servicing the fund and its shareholders. The Board also considered the level of Fidelity's profits in respect of all the Fidelity funds.
On an annual basis, FMR presents to the Board Fidelity's profitability for the fund. Fidelity calculates the profitability for each fund, as well as aggregate profitability for groups of Fidelity funds and all Fidelity funds, using a series of detailed revenue and cost allocation methodologies which originate with the audited books and records of Fidelity. The Audit Committee of the Board reviews any significant changes from the prior year's methodologies.
PricewaterhouseCoopers LLP (PwC), independent registered public accounting firm and auditor to Fidelity and certain Fidelity funds, has been engaged annually by the Board as part of the Board's assessment of the results of Fidelity's profitability analysis. PwC's engagement includes the review and assessment of Fidelity's methodologies used in determining the revenues and expenses attributable to Fidelity's mutual fund business, and completion of agreed-upon procedures surrounding the mathematical accuracy of fund profitability and its conformity to allocation methodologies. After considering PwC's reports issued under the engagement and information provided by Fidelity, the Board believes that while other allocation methods may also be reasonable, Fidelity's profitability methodologies are reasonable in all material respects.
Annual Report
The Board has also reviewed Fidelity's non-fund businesses and any fall-out benefits related to the mutual fund business as well as cases where Fidelity's affiliates may benefit from or be related to the fund's business.
The Board considered the costs of the services provided by and the profits realized by Fidelity in connection with the operation of the fund and determined that the amount of profit is a fair entrepreneurial profit for the management of the fund.
Economies of Scale. The Board considered whether there have been economies of scale in respect of the management of the Fidelity funds, whether the Fidelity funds (including the fund) have appropriately benefited from any such economies of scale, and whether there is potential for realization of any further economies of scale. The Board considered the extent to which the fund will benefit from economies of scale through increased services to the fund, through waivers or reimbursements, or through fee or expense reductions.
The Board recognized that the fund's management contract incorporates a "group fee" structure, which provides for lower group fee rates as total fund assets under FMR's management increase, and for higher group fee rates as total fund assets under FMR's management decrease. FMR determines the group fee rates based on a tiered asset "breakpoint" schedule. The Board considered that the group fee is designed to deliver the benefits of economies of scale to fund shareholders when total fund assets increase, even if assets of any particular fund are unchanged or have declined, because some portion of Fidelity's costs are attributable to services provided to all Fidelity funds, and all funds benefit if those costs can be allocated among more assets. The Board concluded that, given the group fee structure, fund shareholders will achieve a certain level of economies of scale as assets under FMR's management increase at the fund complex level, regardless of whether Fidelity achieves any such economies of scale.
The Board further concluded that any potential economies of scale are being shared between fund shareholders and Fidelity in an appropriate manner.
Additional Information Requested by the Board. In order to develop fully the factual basis for consideration of the Fidelity funds' Advisory Contracts, the Board requested and received additional information on certain topics, including (i) fund performance trends and actions to be taken by FMR to improve certain funds' overall performance; (ii) portfolio manager changes that have occurred during the past year; (iii) Fidelity's fund profitability methodology, the profitability of certain fund service providers, and profitability trends for certain funds; (iv) Fidelity's compensation structure for portfolio managers and key personnel, including its effects on fund profitability and the extent to which portfolio manager compensation is linked to fund performance; (v) Fidelity's fee structures and rationale for recommending different fees among categories of funds; and (vi) Fidelity's rationale for recommending which funds should have a performance adjustment component as part of their management fees.
Based on its evaluation of all of the conclusions noted above, and after considering all material factors, the Board ultimately concluded that the advisory fee structures are fair and reasonable, and that the fund's Advisory Contracts should be renewed.
Annual Report
Investment Adviser
Fidelity Management & Research Company
Boston, MA
Investment Sub-Advisers
FMR Co., Inc.
Fidelity Management & Research
(U.K.) Inc.
Fidelity Research & Analysis Company
Fidelity Investments Japan Limited
FIL Investment Advisors
FIL Investment Advisors
(U.K.) Ltd.
Fidelity Management & Research
(Japan) Inc.
Fidelity Management & Research
(Hong Kong) Limited
General Distributor
Fidelity Distributors Corporation
Boston, MA
Transfer and Service Agents
Fidelity Investments Institutional
Operations Company, Inc.
Boston, MA
Fidelity Service Company, Inc.
Boston, MA
Custodian
Brown Brothers Harriman & Co.,
Boston, MA
AHKC-UANN-1208
1.861458.100
Fidelity Advisor
China Region Fund -
Institutional Class
Annual Report
October 31, 2008
Institutional Class is a class of
Fidelity® China Region Fund
(2_fidelity_logos) (Registered_Trademark)
Contents
Chairman's Message | <Click Here> | Ned Johnson's message to shareholders. |
Performance | <Click Here> | How the fund has done over time. |
Management's Discussion | <Click Here> | The manager's review of fund performance, strategy and outlook. |
Shareholder Expense Example | <Click Here> | An example of shareholder expenses. |
Investment Changes | <Click Here> | A summary of major shifts in the fund's investments over the past six months. |
Investments | <Click Here> | A complete list of the fund's investments with their market values. |
Financial Statements | <Click Here> | Statements of assets and liabilities, operations, and changes in net assets, as well as financial highlights. |
Notes | <Click Here> | Notes to the financial statements. |
Report of Independent Registered Public Accounting Firm | <Click Here> | |
Trustees and Officers | <Click Here> | |
Proxy Voting Results | <Click Here> | |
Board Approval of Investment Advisory Contracts and Management Fees | <Click Here> | |
To view a fund's proxy voting guidelines and proxy voting record for the 12-month period ended June 30, visit http://www.fidelity.com (search for "proxy voting guidelines") or visit the Securities and Exchange Commission's (SEC) web site at http://www.sec.gov. You may also call 1-877-208-0098 to request a free copy of the proxy voting guidelines.
Standard & Poor's, S&P and S&P 500 are registered service marks of The McGraw-Hill Companies, Inc. and have been licensed for use by Fidelity Distributors Corporation.
Other third party marks appearing herein are the property of their respective owners.
All other marks appearing herein are registered or unregistered trademarks or service marks of FMR LLC or an affiliated company.
This report and the financial statements contained herein are submitted for the general information of the shareholders of the funds. This report is not authorized for distribution to prospective investors in the funds unless preceded or accompanied by an effective prospectus.
A fund files its complete schedule of portfolio holdings with the SEC for the first and third quarters of each fiscal year on Form N-Q. Forms N-Q are available on the SEC's web site at http://www.sec.gov. A fund's Forms N-Q may be reviewed and copied at the SEC's Public Reference Room in Washington, DC. Information regarding the operation of the SEC's Public Reference Room may be obtained by calling 1-800-SEC-0330. For a complete list of a fund's portfolio holdings, view the most recent quarterly holdings listing, semiannual report, or annual report on Fidelity's web site at http://www.fidelity.com or http://www.advisor.fidelity.com, as applicable.
NOT FDIC INSURED · MAY LOSE VALUE · NO BANK GUARANTEE
Neither the funds nor Fidelity Distributors Corporation is a bank.
Annual Report
(photo_of_Edward_C_Johnson_3d)
Dear Shareholder:
Turmoil has been the watchword for the world's securities markets in 2008, with domestic and international stocks down sharply amid the global credit squeeze. A flight to quality boosted returns for U.S. Treasuries, one of the few asset classes with positive results heading into the latter stages of the year. Financial markets are always unpredictable, but there are a number of time-tested principles that can put the historical odds in your favor.
One of the basic tenets is to invest for the long term. Over time, riding out the markets' inevitable ups and downs has proven much more effective than selling into panic or chasing the hottest trend. Even missing only a few of the markets' best days can significantly diminish investor returns. Patience also affords the benefits of compounding - of earning interest on additional income or reinvested dividends and capital gains. There are tax advantages and cost benefits to consider as well. The more you sell, the more taxes you pay, and the more you trade, the higher the costs. While staying the course doesn't eliminate risk, it can considerably lessen the effect of short-term declines.
You can further manage your investing risk through diversification. And today, more than ever, geographic diversification should be taken into account. Studies indicate that asset allocation is the single most important determinant of a portfolio's long-term success. The right mix of stocks, bonds and cash - aligned to your particular risk tolerance and investment objective - is very important. Age-appropriate rebalancing is also an essential aspect of asset allocation. For younger investors, an emphasis on equities - which historically have been the best-performing asset class over time - is encouraged. As investors near their specific goal, such as retirement or sending a child to college, consideration may be given to replacing volatile assets (e.g. common stocks) with more-stable fixed investments (bonds or savings plans).
A third investment principle - investing regularly - can help lower the average cost of your purchases. Investing a certain amount of money each month or quarter helps ensure you won't pay for all your shares at market highs. This strategy - known as dollar cost averaging - also reduces unconstructive "emotion" from investing, helping shareholders avoid selling weak performers just prior to an upswing, or chasing a hot performer just before a correction.
We invite you to contact us via the Internet, through our Investor Centers or over the phone. It is our privilege to provide you the information you need to make the investments that are right for you.
Sincerely,
/s/Edward C. Johnson 3d
Edward C. Johnson 3d
Annual Report
Average annual total return reflects the change in the value of an investment, assuming reinvestment of the class' dividend income and capital gains (the profits earned upon the sale of securities that have grown in value, if any) and assuming a constant rate of performance each year. The $10,000 table and the fund's returns do not reflect the deduction of taxes that a shareholder would pay on fund distributions or the redemption of fund shares. During periods of reimbursement by Fidelity, a fund's total returns will be greater than it would be had the reimbursement not occurred. How a fund did yesterday is no guarantee of how it will do tomorrow.
Average Annual Total Returns
Periods ended October 31, 2008 | Past 1
year | Past 5
years | Past 10
years |
Institutional ClassA, B | -53.72% | 6.25% | 8.33% |
A The initial offering of Institutional Class shares took place on May 9, 2008. Returns prior to May 9, 2008 are those of China Region, the original retail class of the fund.
B Prior to September 1, 2000, the fund operated under certain different investment policies. The fund's historical performance may not represent its current investment policies.
$10,000 Over 10 Years
Let's say hypothetically that $10,000 was invested in Fidelity® China Region Fund - Institutional Class, a class of the fund on October 31, 1998. The chart shows how the value of your investment would have changed, and also shows how the MSCI® Golden Dragon Index performed over the same period. The initial offering of Institutional Class took place on May 9, 2008. See above for additional information regarding the performance of Institutional Class.
Annual Report
Comments from Wilson Wong, Portfolio Manager of Fidelity Advisor China Region Fund
In a dramatic reversal of what had been a multiyear global growth story, international stocks fell hard during the 12 months ending October 31, 2008, especially so during the latter stages of the period and mostly as a result of fallout from the financial crisis that emanated from the United States. The viral spread of this financial contagion - which began in the U.S. subprime mortgage market, then seized up the credit markets, hobbled major financial institutions and eventually slowed economic growth worldwide - left virtually no corner of the globe untouched. Developed international equity markets - as gauged by the MSCI® Europe, Australasia, Far East (EAFE®) Index, which monitors established markets outside the U.S. and Canada - fell 46.54%, while the Standard & Poor's 500SM Index, a measure of U.S. stocks, dropped 36.10%. Among countries constituting at least 1% of the EAFE index, Switzerland had the "least worst" showing, falling roughly 32%, followed by Japan, where stocks slid by around 37%. The weakest overall performance came from Belgium, where stocks slipped by nearly 70%. In the United Kingdom, the largest component of the index, equities were down almost 48%. Emerging markets were the weakest performers among the global economies, declining 56.22% as measured by the MSCI Emerging Markets Index.
During the past year, the fund's Advisor Class shares outperformed the -58.03% return of the MSCI Golden Dragon Index. (For specific class-level returns, please see the performance section of this report.) Favorable stock selection in China and Australia aided the fund's results relative to the index, although the fund had no exposure to Australia at period end. On a sector basis, performance was boosted by stock picking in materials and energy, along with an underweighting in the weak-performing industrials group. A modest cash position also was beneficial. At the stock level, Chunghwa Telecom, Taiwan's largest integrated telecommunication services provider, was the fund's biggest contributor. The firm's large cash surplus and evidence of effective cost controls proved attractive amid the severe volatility in stock prices. Other contributors were Tencent Holdings, a Chinese provider of online instant messaging services; Hang Seng Bank, a domestic bank in Hong Kong; and Taiwan Fertilizer, which I sold. Conversely, underweighting Taiwan detracted due to that country's relatively strong results. Further, stock selection and industry positioning within financials worked against fund performance. Yuanta Financial Holding, a diversified financial company based in Taiwan, eroded returns. Disappointment related to opportunities for the company that were expected to emerge from the potential easing of curbs on investment in China sidetracked the stock. Other detractors included an out-of-index stake in Focus Media Holding, a digital display and advertising firm, and Anhui Conch Cement, both based in China. All three detractors were sold off by period end.
Note to shareholders: Fidelity Advisor China Region Fund may invest up to 35% of its total assets in any industry that represents more than 20% of the Hong Kong, Taiwanese and Chinese market. As of October 31, 2008, the fund did not have more than 25% of its total assets invested in any one industry.
The views expressed above reflect those of the portfolio manager(s) only through the end of the period as stated on the cover of this report and do not necessarily represent the views of Fidelity or any other person in the Fidelity organization. Any such views are subject to change at any time based upon market or other conditions and Fidelity disclaims any responsibility to update such views. These views may not be relied on as investment advice and, because investment decisions for a Fidelity fund are based on numerous factors, may not be relied on as an indication of trading intent on behalf of any Fidelity fund.
Annual Report
China Region
As a shareholder of the Fund, you incur two types of costs: (1) transaction costs, including sales charges (loads) on purchase payments or redemption proceeds and redemption fees, and (2) ongoing costs, including management fees, distribution and/or service (12b-1) fees and other Fund expenses. This Example is intended to help you understand your ongoing costs (in dollars) of investing in the Fund and to compare these costs with the ongoing costs of investing in other mutual funds.
The actual expense Example is based on an investment of $1,000 invested at the beginning of the period and held for the entire period (May 1, 2008 to October 31, 2008) for China Region and for the entire period (May 9, 2008 to October 31, 2008) for Class A, Class T, Class B, Class C and Institutional Class.
The hypothetical expense Example is based on an investment of $1,000 invested for the one-half year period (May 1, 2008 to October 31, 2008).
Actual Expenses
The first line of the accompanying table for each class of the Fund provides information about actual account values and actual expenses. You may use the information in this line, together with the amount you invested, to estimate the expenses that you paid over the period. Simply divide your account value by $1,000.00 (for example, an $8,600 account value divided by $1,000.00 = 8.6), then multiply the result by the number in the first line for a class of the Fund under the heading entitled "Expenses Paid During Period" to estimate the expenses you paid on your account during this period. A small balance maintenance fee of $12.00 that is charged once a year may apply for certain accounts with a value of less than $2,000. This fee is not included in the table below. If it was, the estimate of expenses you paid during the period would be higher, and your ending account value lower, by this amount. In addition, the Fund, as a shareholder in the underlying Fidelity Central Funds, will indirectly bear its pro rata share of the fees and expenses incurred by the underlying Fidelity Central Funds. These fees and expenses are not included in the Fund's annualized expense ratio used to calculate the expense estimate in the table below.
Hypothetical Example for Comparison Purposes
The second line of the accompanying table for each class of the Fund provides information about hypothetical account values and hypothetical expenses based on a Class' actual expense ratio and an assumed rate of return of 5% per year before expenses, which is not the Class' actual return. The hypothetical account values and expenses may not be used to estimate the actual ending account balance or expenses you paid for the period. You may use this information to compare the ongoing costs of investing in the Fund and other funds. To do so, compare this 5% hypothetical example with the 5% hypothetical examples that appear in the shareholder reports of the other funds. A small balance maintenance fee of $12.00 that is charged once a year may apply for certain accounts with a value of less than $2,000. This fee is not included in the table below. If it was, the estimate of expenses you paid during the period would be higher, and your ending account value lower, by this amount. In addition, the Fund, as a shareholder in the underlying Fidelity Central Funds, will indirectly bear its pro rata share of the fees and expenses incurred by the underlying Fidelity Central Funds. These fees and expenses are not included in the Fund's annualized expense ratio used to calculate the expense estimate in the table below.
Please note that the expenses shown in the table are meant to highlight your ongoing costs only and do not reflect any transaction costs. Therefore, the second line of the table is useful in comparing ongoing costs only, and will not help you determine the relative total costs of owning different funds. In addition, if these transactional costs were included, your costs would have been higher.
| Annualized Expense Ratio | Beginning
Account Value | Ending
Account Value
October 31, 2008 | Expenses Paid
During Period |
Class A | 1.44% | | | |
Actual | | $ 1,000.00 | $ 569.30 | $ 5.43 B |
HypotheticalA | | $ 1,000.00 | $ 1,017.90 | $ 7.30 C |
Class T | 1.68% | | | |
Actual | | $ 1,000.00 | $ 568.60 | $ 6.34 B |
HypotheticalA | | $ 1,000.00 | $ 1,016.69 | $ 8.52 C |
Class B | 2.17% | | | |
Actual | | $ 1,000.00 | $ 567.30 | $ 8.18 B |
HypotheticalA | | $ 1,000.00 | $ 1,014.23 | $ 10.99 C |
Class C | 2.13% | | | |
Actual | | $ 1,000.00 | $ 567.30 | $ 8.03 B |
HypotheticalA | | $ 1,000.00 | $ 1,014.43 | $ 10.79 C |
China Region | 1.12% | | | |
Actual | | $ 1,000.00 | $ 569.20 | $ 4.42 B |
HypotheticalA | | $ 1,000.00 | $ 1,019.51 | $ 5.69 C |
Institutional Class | 1.06% | | | |
Actual | | $ 1,000.00 | $ 570.40 | $ 4.00 B |
HypotheticalA | | $ 1,000.00 | $ 1,019.81 | $ 5.38 C |
A 5% return per year before expenses
B Actual expenses are equal to each Class' annualized expense ratio, multiplied by the average account value over the period, multiplied by 184/366 (to reflect the one-half year period) for China Region and multiplied by 176/366 (to reflect the period May 9, 2008 to October 31, 2008) for Class A, Class T, Class B, Class C and Institutional Class.
C Hypothetical expenses are equal to each Class' annualized expense ratio; multiplied by the average account value over the period, multiplied by 184/366 (to reflect the one-half year period).
Annual Report
China Region
Investment Changes (Unaudited)
Geographic Diversification (% of fund's net assets) |
As of October 31, 2008 |
| Hong Kong | 37.0% | |
| Taiwan | 29.4% | |
| China | 24.1% | |
| United States of America | 7.9% | |
| Cayman Islands | 1.4% | |
| Indonesia | 0.2% | |
| Bermuda | 0.0% | |

Percentages are adjusted for the effect of futures contracts, if applicable. |
|
As of April 30, 2008 |
| Hong Kong | 31.9% | |
| Taiwan | 26.8% | |
| China | 21.2% | |
| Australia | 6.5% | |
| United States of America | 5.3% | |
| Indonesia | 3.0% | |
| Cayman Islands | 3.1% | |
| Bermuda | 1.3% | |
| Papua New Guinea | 0.4% | |
| Other | 0.5% | |

Percentages are adjusted for the effect of futures contracts, if applicable. |
Asset Allocation |
| % of fund's
net assets | % of fund's net assets
6 months ago |
Stocks | 92.1 | 95.1 |
Short-Term Investments and Net Other Assets | 7.9 | 4.9 |
Top Ten Stocks as of October 31, 2008 |
| % of fund's
net assets | % of fund's net assets
6 months ago |
Taiwan Semiconductor Manufacturing Co. Ltd. (Semiconductors & Semiconductor Equipment) | 9.8 | 0.0 |
China Mobile (Hong Kong) Ltd. (Wireless Telecommunication Services) | 8.6 | 9.9 |
Chunghwa Telecom Co. Ltd. (Diversified Telecommunication Services) | 7.1 | 3.5 |
Industrial & Commercial Bank of China (Commercial Banks) | 5.0 | 1.1 |
CLP Holdings Ltd. (Electric Utilities) | 4.6 | 1.7 |
China Life Insurance Co. Ltd. (H Shares) (Insurance) | 3.5 | 2.2 |
Cheung Kong Holdings Ltd. (Real Estate Management & Development) | 3.2 | 1.5 |
PetroChina Co. Ltd. (H Shares) (Oil, Gas & Consumable Fuels) | 2.9 | 1.2 |
Hutchison Whampoa Ltd. (Industrial Conglomerates) | 2.9 | 1.4 |
China Construction Bank Corp. (H Shares) (Commercial Banks) | 2.6 | 0.9 |
| 50.2 | |
Market Sectors as of October 31, 2008 |
| % of fund's
net assets | % of fund's net assets
6 months ago |
Financials | 27.7 | 23.1 |
Information Technology | 21.1 | 7.9 |
Telecommunication Services | 17.6 | 15.8 |
Energy | 8.5 | 9.8 |
Utilities | 8.0 | 3.0 |
Industrials | 3.6 | 3.0 |
Materials | 2.2 | 18.7 |
Consumer Discretionary | 1.9 | 12.0 |
Consumer Staples | 1.5 | 1.0 |
Annual Report
China Region
Investments October 31, 2008
Showing Percentage of Net Assets
Common Stocks - 92.1% |
| Shares | | Value |
CONSUMER DISCRETIONARY - 1.9% |
Distributors - 0.1% |
Li & Fung Ltd. | 196,000 | | $ 393,373 |
Diversified Consumer Services - 1.4% |
New Oriental Education & Technology Group, Inc. sponsored ADR (a) | 161,100 | | 10,302,345 |
Media - 0.4% |
Television Broadcasts Ltd. | 1,074,000 | | 2,986,824 |
Textiles, Apparel & Luxury Goods - 0.0% |
Ports Design Ltd. | 188,500 | | 219,146 |
TOTAL CONSUMER DISCRETIONARY | | 13,901,688 |
CONSUMER STAPLES - 1.5% |
Beverages - 1.1% |
Yantai Changyu Pioneer Wine Co. (B Shares) | 2,556,463 | | 7,944,154 |
Food & Staples Retailing - 0.4% |
Dairy Farm International Holdings Ltd. | 765,900 | | 3,138,297 |
TOTAL CONSUMER STAPLES | | 11,082,451 |
ENERGY - 8.5% |
Oil, Gas & Consumable Fuels - 8.5% |
China Petroleum & Chemical Corp. (H Shares) | 27,432,000 | | 18,013,552 |
China Shenhua Energy Co. Ltd. (H Shares) | 3,701,000 | | 7,026,601 |
CNOOC Ltd. | 18,229,000 | | 14,967,366 |
PetroChina Co. Ltd. (H Shares) | 28,744,000 | | 21,612,223 |
PT Bumi Resources Tbk | 12,829,500 | | 1,679,722 |
| | 63,299,464 |
FINANCIALS - 27.7% |
Commercial Banks - 9.6% |
China Construction Bank Corp. (H Shares) | 38,621,000 | | 19,158,951 |
China Merchants Bank Co. Ltd. (H Shares) | 1,983,000 | | 3,038,031 |
Hang Seng Bank Ltd. | 872,700 | | 10,889,031 |
Industrial & Commercial Bank of China (d) | 78,601,000 | | 36,983,144 |
Industrial & Commercial Bank of China (Asia) Ltd. | 934,000 | | 984,197 |
| | 71,053,354 |
Diversified Financial Services - 1.8% |
China Everbright Ltd. | 824,000 | | 773,681 |
Hong Kong Exchanges & Clearing Ltd. | 1,200,200 | | 12,170,932 |
| | 12,944,613 |
Insurance - 5.8% |
Cathay Financial Holding Co. Ltd. | 7,622,100 | | 8,145,491 |
|
| Shares | | Value |
China Life Insurance Co. Ltd. (H Shares) | 9,767,000 | | $ 26,101,108 |
Ping An Insurance (Group) Co. of China, Ltd. (H Shares) | 2,071,500 | | 8,859,181 |
| | 43,105,780 |
Real Estate Investment Trusts - 1.7% |
Link (REIT) | 7,225,000 | | 12,918,331 |
Real Estate Management & Development - 8.8% |
Cheung Kong Holdings Ltd. | 2,425,000 | | 23,283,548 |
China Overseas Land & Investment Ltd. | 11,176,000 | | 12,620,615 |
China Resources Land Ltd. | 1,194,000 | | 1,208,613 |
Hang Lung Properties Ltd. | 3,724,000 | | 9,099,513 |
Hopewell Holdings Ltd. | 1,188,000 | | 3,693,568 |
Hysan Development Co. Ltd. | 636,000 | | 997,280 |
Sinyi Realty, Inc. | 4,713,066 | | 5,215,307 |
Sun Hung Kai Properties Ltd. | 1,043,000 | | 9,137,772 |
| | 65,256,216 |
TOTAL FINANCIALS | | 205,278,294 |
INDUSTRIALS - 3.6% |
Construction & Engineering - 0.4% |
China Railway Construction Corp.
(H Shares) | 2,063,500 | | 2,549,104 |
Electrical Equipment - 0.2% |
BYD Co. Ltd. (H Shares) | 609,800 | | 1,036,428 |
Industrial Conglomerates - 2.9% |
Hutchison Whampoa Ltd. | 4,029,000 | | 21,514,860 |
Marine - 0.0% |
China Cosco Holdings Co. Ltd. (H Shares) | 347,500 | | 187,203 |
Transportation Infrastructure - 0.1% |
Cosco Pacific Ltd. | 1,390,000 | | 1,012,217 |
TOTAL INDUSTRIALS | | 26,299,812 |
INFORMATION TECHNOLOGY - 21.1% |
Computers & Peripherals - 2.7% |
Acer, Inc. | 2,966,000 | | 3,862,049 |
HTC Corp. | 944,000 | | 11,261,604 |
Wistron Corp. | 5,800,361 | | 4,633,607 |
| | 19,757,260 |
Electronic Equipment & Components - 3.5% |
AU Optronics Corp. | 11,903,000 | | 8,209,588 |
Hon Hai Precision Industry Co. Ltd. (Foxconn) | 7,297,674 | | 17,699,376 |
| | 25,908,964 |
Internet Software & Services - 3.0% |
Baidu.com, Inc. sponsored ADR (a)(d) | 18,400 | | 3,790,400 |
Tencent Holdings Ltd. | 2,520,600 | | 18,349,744 |
| | 22,140,144 |
Common Stocks - continued |
| Shares | | Value |
INFORMATION TECHNOLOGY - continued |
Semiconductors & Semiconductor Equipment - 11.9% |
Advanced Semiconductor Engineering, Inc. | 5,268,000 | | $ 2,243,008 |
ASM Pacific Technology Ltd. | 403,800 | | 1,349,061 |
MediaTek, Inc. | 1,057,000 | | 9,485,281 |
Siliconware Precision Industries Co. Ltd. | 2,553,000 | | 2,623,820 |
Taiwan Semiconductor Manufacturing Co. Ltd. | 49,955,443 | | 72,695,507 |
| | 88,396,677 |
TOTAL INFORMATION TECHNOLOGY | | 156,203,045 |
MATERIALS - 2.2% |
Chemicals - 2.2% |
Formosa Plastics Corp. | 4,867,000 | | 8,203,887 |
Nan Ya Plastics Corp. | 5,925,000 | | 8,262,847 |
| | 16,466,734 |
TELECOMMUNICATION SERVICES - 17.6% |
Diversified Telecommunication Services - 8.6% |
China Unicom (Hong Kong) Ltd. | 6,776,000 | | 9,674,060 |
Chunghwa Telecom Co. Ltd. | 29,533,680 | | 48,707,965 |
Chunghwa Telecom Co. Ltd. ADR | 229,203 | | 3,772,681 |
PCCW Ltd. | 4,537,000 | | 1,697,694 |
| | 63,852,400 |
Wireless Telecommunication Services - 9.0% |
China Mobile (Hong Kong) Ltd. | 7,257,000 | | 63,885,256 |
Taiwan Mobile Co. Ltd. | 2,102,000 | | 2,912,275 |
| | 66,797,531 |
TOTAL TELECOMMUNICATION SERVICES | | 130,649,931 |
UTILITIES - 8.0% |
Electric Utilities - 6.8% |
CLP Holdings Ltd. | 5,060,000 | | 34,124,265 |
Hong Kong Electric Holdings Ltd. | 3,022,000 | | 16,288,126 |
| | 50,412,391 |
|
| Shares | | Value |
Independent Power Producers & Energy Traders - 1.2% |
China Resources Power Holdings Co. Ltd. | 3,686,000 | | $ 7,203,713 |
Datang International Power Generation Co. Ltd. | 4,136,000 | | 1,557,700 |
| | 8,761,413 |
TOTAL UTILITIES | | 59,173,804 |
TOTAL COMMON STOCKS (Cost $955,883,902) | 682,355,223 |
Money Market Funds - 9.9% |
| | | |
Fidelity Cash Central Fund, 1.81% (b) | 58,337,954 | | 58,337,954 |
Fidelity Securities Lending Cash Central Fund, 2.67% (b)(c) | 15,487,600 | | 15,487,600 |
TOTAL MONEY MARKET FUNDS (Cost $73,825,554) | 73,825,554 |
TOTAL INVESTMENT
PORTFOLIO - 102.0% (Cost $1,029,709,456) | | 756,180,777 |
NET OTHER ASSETS - (2.0)% | | (14,997,555) |
NET ASSETS - 100% | $ 741,183,222 |
Legend |
(a) Non-income producing |
(b) Affiliated fund that is available only to investment companies and other accounts managed by Fidelity Investments. The rate quoted is the annualized seven-day yield of the fund at period end. A complete unaudited listing of the fund's holdings as of its most recent quarter end is available upon request. |
(c) Investment made with cash collateral received from securities on loan. |
(d) Security or a portion of the security is on loan at period end. |
Affiliated Central Funds |
Information regarding fiscal year to date income earned by the Fund from investments in Fidelity Central Funds is as follows: |
Fund | Income earned |
Fidelity Cash Central Fund | $ 1,865,355 |
Fidelity Securities Lending Cash Central Fund | 268,379 |
Total | $ 2,133,734 |
Income Tax Information |
At October 31, 2008, the fund had a capital loss carryforward of approximately $148,402,224 all of which will expire on October 31, 2016. |
See accompanying notes which are an integral part of the financial statements.
Annual Report
China Region
Statement of Assets and Liabilities
| October 31, 2008 |
| | |
Assets | | |
Investment in securities, at value (including securities loaned of $14,710,225) -
See accompanying schedule: Unaffiliated issuers
(cost $955,883,902) | $ 682,355,223 | |
Fidelity Central Funds
(cost $73,825,554) | 73,825,554 | |
Total Investments
(cost $1,029,709,456) | | $ 756,180,777 |
Foreign currency held at value
(cost $5,191) | | 5,191 |
Receivable for investments sold | | 3,216,321 |
Receivable for fund shares sold | | 1,570,428 |
Dividends receivable | | 2,916,194 |
Distributions receivable from Fidelity Central Funds | | 90,277 |
Prepaid expenses | | 463 |
Other receivables | | 393,529 |
Total assets | | 764,373,180 |
| | |
Liabilities | | |
Payable for investments purchased | $ 6,096,956 | |
Payable for fund shares redeemed | 623,679 | |
Accrued management fee | 460,443 | |
Distribution fees payable | 429 | |
Other affiliated payables | 279,944 | |
Other payables and accrued expenses | 240,907 | |
Collateral on securities loaned, at value | 15,487,600 | |
Total liabilities | | 23,189,958 |
| | |
Net Assets | | $ 741,183,222 |
Net Assets consist of: | | |
Paid in capital | | $ 1,162,196,359 |
Undistributed net investment income | | 6,027,366 |
Accumulated undistributed net realized gain (loss) on investments and foreign currency transactions | | (153,478,093) |
Net unrealized appreciation (depreciation) on investments and assets and liabilities in foreign currencies | | (273,562,410) |
Net Assets | | $ 741,183,222 |
Statement of Assets and Liabilities - continued
| October 31, 2008 |
| | |
Calculation of Maximum Offering Price Class A:
Net Asset Value and redemption
price per share ($340,222 ÷ 20,412 shares) | | $ 16.67 |
| | |
Maximum offering price per share (100/94.25 of $16.67) | | $ 17.69 |
Class T:
Net Asset Value and redemption
price per share ($107,102 ÷ 6,433 shares) | | $ 16.65 |
| | |
Maximum offering price per share (100/96.50 of $16.65) | | $ 17.25 |
Class B:
Net Asset Value and offering
price per share ($154,625 ÷ 9,310 shares)A | | $ 16.61 |
| | |
Class C:
Net Asset Value and offering
price per share ($232,824 ÷ 14,016 shares)A | | $ 16.61 |
| | |
China Region:
Net Asset Value, offering
price and redemption price per share ($740,288,870 ÷ 44,356,661 shares) | | $ 16.69 |
| | |
Institutional Class:
Net Asset Value, offering price and redemption price per share ($59,579 ÷ 3,568 shares) | | $ 16.70 |
A Redemption price per share is equal to net asset value less any applicable contingent deferred sales charge.
See accompanying notes which are an integral part of the financial statements.
Annual Report
Statement of Operations
| Year ended October 31, 2008 |
| | |
Investment Income | | |
Dividends | | $ 34,759,063 |
Interest | | 4,164 |
Income from Fidelity Central Funds (including $268,379 from security lending) | | 2,133,734 |
| | 36,896,961 |
Less foreign taxes withheld | | (3,209,864) |
Total income | | 33,687,097 |
| | |
Expenses | | |
Management fee | $ 9,927,896 | |
Transfer agent fees | 3,515,043 | |
Distribution fees | 1,942 | |
Accounting and security lending fees | 641,000 | |
Custodian fees and expenses | 985,602 | |
Independent trustees' compensation | 6,327 | |
Registration fees | 159,248 | |
Audit | 65,400 | |
Legal | 7,178 | |
Interest | 8,739 | |
Miscellaneous | 204,566 | |
Total expenses before reductions | 15,522,941 | |
Expense reductions | (2,068,258) | 13,454,683 |
Net investment income (loss) | | 20,232,414 |
Realized and Unrealized Gain (Loss) Net realized gain (loss) on: | | |
Investment securities: | | |
Unaffiliated issuers | (149,991,373) | |
Foreign currency transactions | (1,835,509) | |
Total net realized gain (loss) | | (151,826,882) |
Change in net unrealized appreciation (depreciation) on: Investment securities | (900,514,910) | |
Assets and liabilities in foreign currencies | (52,493) | |
Total change in net unrealized appreciation (depreciation) | | (900,567,403) |
Net gain (loss) | | (1,052,394,285) |
Net increase (decrease) in net assets resulting from operations | | $ (1,032,161,871) |
Statement of Changes in Net Assets
| Year ended
October 31,
2008 | Year ended
October 31,
2007 |
Increase (Decrease) in Net Assets | | |
Operations | | |
Net investment income (loss) | $ 20,232,414 | $ 17,487,006 |
Net realized gain (loss) | (151,826,882) | 248,422,709 |
Change in net unrealized appreciation (depreciation) | (900,567,403) | 471,226,907 |
Net increase (decrease) in net assets resulting from operations | (1,032,161,871) | 737,136,622 |
Distributions to shareholders from net investment income | (15,794,709) | (9,931,797) |
Distributions to shareholders from net realized gain | (223,593,729) | (6,849,518) |
Total distributions | (239,388,438) | (16,781,315) |
Share transactions - net increase (decrease) | (34,409,565) | 588,174,307 |
Redemption fees | 2,616,118 | 1,203,951 |
Total increase (decrease) in net assets | (1,303,343,756) | 1,309,733,565 |
| | |
Net Assets | | |
Beginning of period | 2,044,526,978 | 734,793,413 |
End of period (including undistributed net investment income of $6,027,366 and undistributed net investment income of $16,429,698, respectively) | $ 741,183,222 | $ 2,044,526,978 |
See accompanying notes which are an integral part of the financial statements.
Annual Report
Financial Highlights - Class A
Year ended October 31, | 2008 H |
Selected Per-Share Data | |
Net asset value, beginning of period | $ 29.28 |
Income from Investment Operations | |
Net investment income (loss)E | .28 |
Net realized and unrealized gain (loss) | (12.91) |
Total from investment operations | (12.63) |
Redemption fees added to paid in capitalE | .02 |
Net asset value, end of period | $ 16.67 |
Total ReturnB, C, D | (43.07)% |
Ratios to Average Net AssetsF, I | |
Expenses before reductions | 1.44%A |
Expenses net of fee waivers, if any | 1.44%A |
Expenses net of all reductions | 1.30%A |
Net investment income (loss) | 2.63%A |
Supplemental Data | |
Net assets, end of period (000 omitted) | $ 340 |
Portfolio turnover rateG | 133% |
A Annualized B Total returns for periods of less than one year are not annualized. C Total returns would have been lower had certain expenses not been reduced during the periods shown. D Total returns do not include the effect of the sales charges. E Calculated based on average shares outstanding during the period. F Fees and expenses of the underlying Fidelity Central Funds are not included in the Fund's expense ratio. The Fund indirectly bears its proportionate share of the expenses of any underlying Fidelity Central Funds. G Amount does not include the portfolio activity of any underlying Fidelity Central Funds. H For the period May 9, 2008 (commencement of sale of shares) to October 31, 2008. I Expense ratios reflect operating expenses of the class. Expenses before reductions do not reflect amounts reimbursed by the investment adviser or reductions from brokerage service arrangements or other expense offset arrangements and do not represent the amount paid by the class during periods when reimbursements or reductions occur. Expense ratios before reductions for start-up periods may not be representative of longer-term operating periods. Expenses net of fee waivers reflect expenses after reimbursement by the investment adviser but prior to reductions from brokerage service arrangements or other expense offset arrangements. Expenses net of all reductions represent the net expenses paid by the class. |
Financial Highlights - Class T
Year ended October 31, | 2008 H |
Selected Per-Share Data | |
Net asset value, beginning of period | $ 29.28 |
Income from Investment Operations | |
Net investment income (loss)E | .26 |
Net realized and unrealized gain (loss) | (12.91) |
Total from investment operations | (12.65) |
Redemption fees added to paid in capital E | .02 |
Net asset value, end of period | $ 16.65 |
Total ReturnB, C, D | (43.14)% |
Ratios to Average Net AssetsF, I | |
Expenses before reductions | 1.68%A |
Expenses net of fee waivers, if any | 1.68%A |
Expenses net of all reductions | 1.53%A |
Net investment income (loss) | 2.40%A |
Supplemental Data | |
Net assets, end of period (000 omitted) | $ 107 |
Portfolio turnover rateG | 133% |
A Annualized B Total returns for periods of less than one year are not annualized. C Total returns would have been lower had certain expenses not been reduced during the periods shown. D Total returns do not include the effect of the sales charges. E Calculated based on average shares outstanding during the period. F Fees and expenses of the underlying Fidelity Central Funds are not included in the Fund's expense ratio. The Fund indirectly bears its proportionate share of the expenses of any underlying Fidelity Central Funds. G Amount does not include the portfolio activity of any underlying Fidelity Central Funds. H For the period May 9, 2008 (commencement of sale of shares) to October 31, 2008. I Expense ratios reflect operating expenses of the class. Expenses before reductions do not reflect amounts reimbursed by the investment adviser or reductions from brokerage service arrangements or other expense offset arrangements and do not represent the amount paid by the class during periods when reimbursements or reductions occur. Expense ratios before reductions for start-up periods may not be representative of longer-term operating periods. Expenses net of fee waivers reflect expenses after reimbursement by the investment adviser but prior to reductions from brokerage service arrangements or other expense offset arrangements. Expenses net of all reductions represent the net expenses paid by the class. |
See accompanying notes which are an integral part of the financial statements.
Annual Report
Financial Highlights - Class B
Year ended October 31, | 2008 H |
Selected Per-Share Data | |
Net asset value, beginning of period | $ 29.28 |
Income from Investment Operations | |
Net investment income (loss)E | .20 |
Net realized and unrealized gain (loss) | (12.89) |
Total from investment operations | (12.69) |
Redemption fees added to paid in capitalE | .02 |
Net asset value, end of period | $ 16.61 |
Total ReturnB, C, D | (43.27)% |
Ratios to Average Net AssetsF, I | |
Expenses before reductions | 2.17% A |
Expenses net of fee waivers, if any | 2.17% A |
Expenses net of all reductions | 2.02% A |
Net investment income (loss) | 1.91% A |
Supplemental Data | |
Net assets, end of period (000 omitted) | $ 155 |
Portfolio turnover rate G | 133% |
A Annualized B Total returns for periods of less than one year are not annualized. C Total returns would have been lower had certain expenses not been reduced during the periods shown. D Total returns do not include the effect of the contingent deferred sales charge. E Calculated based on average shares outstanding during the period. F Fees and expenses of the underlying Fidelity Central Funds are not included in the Fund's expense ratio. The Fund indirectly bears its proportionate share of the expenses of any underlying Fidelity Central Funds. G Amount does not include the portfolio activity of any underlying Fidelity Central Funds. H For the period May 9, 2008 (commencement of sale of shares) to October 31, 2008. I Expense ratios reflect operating expenses of the class. Expenses before reductions do not reflect amounts reimbursed by the investment adviser or reductions from brokerage service arrangements or other expense offset arrangements and do not represent the amount paid by the class during periods when reimbursements or reductions occur. Expense ratios before reductions for start-up periods may not be representative of longer-term operating periods. Expenses net of fee waivers reflect expenses after reimbursement by the investment adviser but prior to reductions from brokerage service arrangements or other expense offset arrangements. Expenses net of all reductions represent the net expenses paid by the class. |
Financial Highlights - Class C
Year ended October 31, | 2008 H |
Selected Per-Share Data | |
Net asset value, beginning of period | $ 29.28 |
Income from Investment Operations | |
Net investment income (loss) E | .20 |
Net realized and unrealized gain (loss) | (12.89) |
Total from investment operations | (12.69) |
Redemption fees added to paid in capital E | .02 |
Net asset value, end of period | $ 16.61 |
Total ReturnB, C, D | (43.27)% |
Ratios to Average Net AssetsF, I | |
Expenses before reductions | 2.13%A |
Expenses net of fee waivers, if any | 2.13%A |
Expenses net of all reductions | 1.98%A |
Net investment income (loss) | 1.95%A |
Supplemental Data | |
Net assets, end of period (000 omitted) | $ 233 |
Portfolio turnover rateG | 133% |
A Annualized B Total returns for periods of less than one year are not annualized. C Total returns would have been lower had certain expenses not been reduced during the periods shown. D Total returns do not include the effect of the contingent deferred sales charge. E Calculated based on average shares outstanding during the period. F Fees and expenses of the underlying Fidelity Central Funds are not included in the Fund's expense ratio. The Fund indirectly bears its proportionate share of the expenses of any underlying Fidelity Central Funds. G Amount does not include the portfolio activity of any underlying Fidelity Central Funds. H For the period May 9, 2008 (commencement of sale of shares) to October 31, 2008. I Expense ratios reflect operating expenses of the class. Expenses before reductions do not reflect amounts reimbursed by the investment adviser or reductions from brokerage service arrangements or other expense offset arrangements and do not represent the amount paid by the class during periods when reimbursements or reductions occur. Expense ratios before reductions for start-up periods may not be representative of longer-term operating periods. Expenses net of fee waivers reflect expenses after reimbursement by the investment adviser but prior to reductions from brokerage service arrangements or other expense offset arrangements. Expenses net of all reductions represent the net expenses paid by the class. |
See accompanying notes which are an integral part of the financial statements.
Annual Report
Financial Highlights - China Region
Years ended October 31, | 2008 | 2007 | 2006 | 2005 | 2004 |
Selected Per-Share Data | | | | | |
Net asset value, beginning of period | $ 41.52 | $ 22.94 | $ 17.74 | $ 15.88 | $ 15.14 |
Income from Investment Operations | | | | | |
Net investment income (loss) B | .39 | .46 | .42 | .36 | .25 |
Net realized and unrealized gain (loss) | (20.42) | 18.58 | 4.99 | 1.75 | .73 |
Total from investment operations | (20.03) | 19.04 | 5.41 | 2.11 | .98 |
Distributions from net investment income | (.32) | (.29) | (.22) | (.26) | (.26) |
Distributions from net realized gain | (4.53) | (.20) | - | - | - |
Total distributions | (4.85) | (.49) | (.22) | (.26) | (.26) |
Redemption fees added to paid in capitalB | .05 | .03 | .01 | .01 | .02 |
Net asset value, end of period | $ 16.69 | $ 41.52 | $ 22.94 | $ 17.74 | $ 15.88 |
Total ReturnA | (53.75)% | 84.73% | 30.83% | 13.44% | 6.71% |
Ratios to Average Net AssetsC, E | | | | | |
Expenses before reductions | 1.11% | 1.08% | 1.14% | 1.16% | 1.22% |
Expenses net of fee waivers, if any | 1.11% | 1.08% | 1.14% | 1.16% | 1.22% |
Expenses net of all reductions | .96% | .92% | 1.08% | 1.12% | 1.22% |
Net investment income (loss) | 1.45% | 1.64% | 1.99% | 2.04% | 1.64% |
Supplemental Data | | | | | |
Net assets, end of period (000 omitted) | $ 740,289 | $ 2,044,527 | $ 734,793 | $ 396,905 | $ 296,004 |
Portfolio turnover rateD | 133% | 173% | 36% | 44% | 101% |
A Total returns would have been lower had certain expenses not been reduced during the periods shown. B Calculated based on average shares outstanding during the period. C Fees and expenses of the underlying Fidelity Central Funds are not included in the Fund's expense ratio. The Fund indirectly bears its proportionate share of the expenses of any underlying Fidelity Central Funds. D Amount does not include the portfolio activity of any underlying Fidelity Central Funds. E Expense ratios reflect operating expenses of the class. Expenses before reductions do not reflect amounts reimbursed by the investment adviser or reductions from brokerage service arrangements or other expense offset arrangements and do not represent the amount paid by the class during periods when reimbursements or reductions occur. Expenses net of fee waivers reflect expenses after reimbursement by the investment adviser but prior to reductions from brokerage service arrangements or other expense offset arrangements. Expenses net of all reductions represent the net expenses paid by the class. |
Financial Highlights - Institutional Class
Year ended October 31, | 2008 G |
Selected Per-Share Data | |
Net asset value, beginning of period | $ 29.28 |
Income from Investment Operations | |
Net investment income (loss)D | .34 |
Net realized and unrealized gain (loss) | (12.94) |
Total from investment operations | (12.60) |
Redemption fees added to paid in capitalD | .02 |
Net asset value, end of period | $ 16.70 |
Total ReturnB, C | (42.96)% |
Ratios to Average Net AssetsE, H | |
Expenses before reductions | 1.05%A |
Expenses net of fee waivers, if any | 1.05%A |
Expenses net of all reductions | .91%A |
Net investment income (loss) | 3.02%A |
Supplemental Data | |
Net assets, end of period (000 omitted) | $ 60 |
Portfolio turnover rateF | 133% |
A Annualized B Total returns for periods of less than one year are not annualized. C Total returns would have been lower had certain expenses not been reduced during the periods shown. D Calculated based on average shares outstanding during the period. E Fees and expenses of the underlying Fidelity Central Funds are not included in the Fund's expense ratio. The Fund indirectly bears its proportionate share of the expenses of any underlying Fidelity Central Funds. F Amount does not include the portfolio activity of any underlying Fidelity Central Funds. G For the period May 9, 2008 (commencement of sale of shares) to October 31, 2008. H Expense ratios reflect operating expenses of the class. Expenses before reductions do not reflect amounts reimbursed by the investment adviser or reductions from brokerage service arrangements or other expense offset arrangements and do not represent the amount paid by the class during periods when reimbursements or reductions occur. Expense ratios before reductions for start-up periods may not be representative of longer-term operating periods. Expenses net of fee waivers reflect expenses after reimbursement by the investment adviser but prior to reductions from brokerage service arrangements or other expense offset arrangements. Expenses net of all reductions represent the net expenses paid by the class. |
See accompanying notes which are an integral part of the financial statements.
Annual Report
China Region
Notes to Financial Statements
For the period ended October 31, 2008
1. Organization.
Fidelity China Region Fund (the Fund) is a fund of Fidelity Investment Trust (the trust) and is authorized to issue an unlimited number of shares. The trust is registered under the Investment Company Act of 1940, as amended (the 1940 Act), as an open-end management investment company organized as a Massachusetts business trust. The Fund commenced sale of Class A, Class T, Class B, Class C, and Institutional Class shares and the existing class was designated China Region on May 9, 2008. Class B shares will automatically convert to Class A shares after a holding period of seven years from the initial date of purchase. Investment income, realized and unrealized capital gains and losses, the common expenses of the Fund, and certain fund-level expense reductions, if any, are allocated on a pro rata basis to each class based on the relative net assets of each class to the total net assets of the Fund. Each class differs with respect to transfer agent and distribution and service plan fees incurred. Certain expense reductions also differ by class. The Fund's investments in emerging markets can be subject to social, economic, regulatory, and political uncertainties and can be extremely volatile.
2. Investments in Fidelity Central Funds.
The Fund may invest in Fidelity Central Funds, which are open-end investment companies available only to other investment companies and accounts managed by Fidelity Management & Research Company (FMR) and its affiliates. The Fund's Schedule of Investments lists each of the Fidelity Central Funds held as of period end, if any, as an investment of the Fund, but does not include the underlying holdings of each Fidelity Central Fund. As an Investing Fund, the Fund indirectly bears its proportionate share of the expenses of the underlying Fidelity Central Funds.
The Money Market Central Funds seek preservation of capital and current income and are managed by Fidelity Investments Money Management, Inc. (FIMM), an affiliate of FMR.
A complete unaudited list of holdings for each Fidelity Central Fund is available upon request or at the SEC's web site at www.sec.gov. In addition, the financial statements of the Fidelity Central Funds, which are not covered by the Fund's Report of Independent Registered Public Accounting Firm, are available on the SEC's web site or upon request.
3. Significant Accounting Policies.
The financial statements have been prepared in conformity with accounting principles generally accepted in the United States of America, which require management to make certain estimates and assumptions at the date of the financial statements. Actual results could differ from those estimates. The following summarizes the significant accounting policies of the Fund:
Security Valuation. Investments are valued as of 4:00 p.m. Eastern time on the last calendar day of the period. Wherever possible, the Fund uses independent pricing services approved by the Board of Trustees to value its investments.
Equity securities, including restricted securities, for which market quotations are readily available, are valued at the last reported sale price or official closing price as reported by an independent pricing service on the primary market or exchange on which they are traded. In the event there were no sales during the day or closing prices are not available, securities are valued at the last quoted bid price. Investments in open-end mutual funds, including the Fidelity Central Funds, are valued at their closing net asset value each business day. Short-term securities with remaining maturities of sixty days or less for which quotations are not readily available are valued at amortized cost, which approximates value.
When current market prices or quotations are not readily available or reliable, valuations may be determined in good faith in accordance with procedures adopted by the Board of Trustees. Factors used in determining value may include significant market or security specific events, changes in interest rates and credit quality, and developments in foreign markets which are monitored by evaluating the performance of ADRs, futures contracts and exchange-traded funds. The frequency with which these procedures are used cannot be predicted and may be utilized to a significant extent. The value of securities used for net asset value (NAV) calculation under these procedures may differ from published prices for the same securities.
Foreign Currency. The Fund uses foreign currency contracts to facilitate transactions in foreign-denominated securities. Losses from these transactions may arise from changes in the value of the foreign currency or if the counterparties do not perform under the contracts' terms.
Foreign-denominated assets, including investment securities, and liabilities are translated into U.S. dollars at the exchange rate at period end. Purchases and sales of investment securities, income and dividends received and expenses denominated in foreign currencies are translated into U.S. dollars at the exchange rate in effect on the transaction date.
The effects of exchange rate fluctuations on investments are included with the net realized and unrealized gain (loss) on investment securities. Other foreign currency transactions resulting in realized and unrealized gain (loss) are disclosed separately.
Annual Report
3. Significant Accounting Policies - continued
Investment Transactions and Income. For financial reporting purposes, the Fund's investment holdings and NAV include trades executed through the end of the last business day of the period. The NAV per share for processing shareholder transactions is calculated as of the close of business of the New York Stock Exchange (NYSE), normally 4:00 p.m. Eastern time and includes trades executed through the end of the prior business day. Gains and losses on securities sold are determined on the basis of identified cost. Dividend income is recorded on the ex-dividend date, except for certain dividends from foreign securities where the ex-dividend date may have passed, which are recorded as soon as the Fund is informed of the ex-dividend date. Non-cash dividends included in dividend income, if any, are recorded at the fair market value of the securities received. Interest income and distributions from the Fidelity Central Funds are accrued as earned. Interest income includes coupon interest and amortization of premium and accretion of discount on debt securities. Investment income is recorded net of foreign taxes withheld where recovery of such taxes is uncertain.
Expenses. Most expenses of the trust can be directly attributed to a fund. Expenses which cannot be directly attributed are apportioned among each Fund in the trust. Expense estimates are accrued in the period to which they relate and adjustments are made when actual amounts are known.
Income Tax Information and Distributions to Shareholders. Each year, the Fund intends to qualify as a regulated investment company by distributing substantially all of its taxable income and realized gains under Subchapter M of the Internal Revenue Code and filing its U.S. federal tax return. As a result, no provision for income taxes is required. The Fund is subject to the provisions of FASB Interpretation No. 48, Accounting for Uncertainties in Income Taxes (FIN 48). FIN 48 sets forth a minimum threshold for financial statement recognition of the benefit of a tax position taken or expected to be taken in a tax return. The implementation of FIN 48 did not result in any unrecognized tax benefits in the accompanying financial statements. Each of the Fund's federal tax returns for the prior three fiscal years remains subject to examination by the Internal Revenue Service (IRS). Foreign taxes are provided for based on the Fund's understanding of the tax rules and rates that exist in the foreign markets in which it invests.
Distributions are recorded on the ex-dividend date. Income dividends and capital gain distributions are declared separately for each class. Income and capital gain distributions are determined in accordance with income tax regulations, which may differ from generally accepted accounting principles. In addition, the Fund will claim a portion of the payment made to redeeming shareholders as a distribution for income tax purposes.
Capital accounts within the financial statements are adjusted for permanent book-tax differences. These adjustments have no impact on net assets or the results of operations. Temporary book-tax differences will reverse in a subsequent period.
Book-tax differences are primarily due to foreign currency transactions, passive foreign investment companies (PFIC), market discount, deferred trustees compensation and losses deferred due to wash sales.
The tax-basis components of distributable earnings and the federal tax cost as of period end were as follows:
Unrealized appreciation | $ 21,321,361 |
Unrealized depreciation | (299,959,636) |
Net unrealized appreciation (depreciation) | (278,638,275) |
Undistributed ordinary income | 5,975,924 |
Capital loss carryforward | (148,402,224) |
| |
Cost for federal income tax purposes | $ 1,034,819,052 |
The tax character of distributions paid was as follows:
| October 31, 2008 | October 31, 2007 |
Ordinary Income | $ 49,852,032 | $ 9,931,797 |
Long-term Capital Gains | 189,536,406 | 6,849,518 |
Total | $ 239,388,438 | $ 16,781,315 |
Short-Term Trading (Redemption) Fees. Shares held in the Fund less than 90 days are subject to a redemption fee equal to 1.50% of the proceeds of the redeemed shares. All redemption fees, including any estimated redemption fees paid by FMR, are retained by the Fund and accounted for as an addition to paid in capital.
New Accounting Pronouncement. In September 2006, Statement of Financial Accounting Standards No. 157, Fair Value Measurements (SFAS 157), was issued and is effective for fiscal years beginning after November 15, 2007. SFAS 157 defines fair value, establishes a framework for measuring fair value and results in expanded disclosures about fair value measurements.
Annual Report
China Region
Notes to Financial Statements - continued
4. Operating Policies.
Repurchase Agreements. FMR has received an Exemptive Order from the Securities and Exchange Commission (the SEC) which permits the Fund and other affiliated entities of FMR to transfer uninvested cash balances into joint trading accounts which are then invested in repurchase agreements. The Fund may also invest directly with institutions in repurchase agreements. Repurchase agreements are collateralized by government or non-government securities. Upon settlement date, collateral is held in segregated accounts with custodian banks and may be obtained in the event of a default of the counterparty. The Fund monitors, on a daily basis, the value of the collateral to ensure it is at least equal to the principal amount of the repurchase agreement (including accrued interest). In the event of a default by the counterparty, realization of the collateral proceeds could be delayed, during which time the value of the collateral may decline.
5. Purchases and Sales of Investments.
Purchases and sales of securities, other than short-term securities, aggregated $1,807,459,093 and $2,036,363,750, respectively.
6. Fees and Other Transactions with Affiliates.
Management Fee. FMR and its affiliates provide the Fund with investment management related services for which the Fund pays a monthly management fee. The management fee is the sum of an individual fund fee rate that is based on an annual rate of .45% of the Fund's average net assets and a group fee rate that averaged .26% during the period. The group fee rate is based upon the average net assets of all the mutual funds advised by FMR. The group fee rate decreases as assets under management increase and increases as assets under management decrease. For the period, the total annual management fee rate was .71% of the Fund's average net assets.
Distribution and Service Plan. In accordance with Rule 12b-1 of the 1940 Act, the Fund has adopted separate Distribution and Service Plans for each class of shares. Certain classes pay Fidelity Distributors Corporation (FDC), an affiliate of FMR, separate Distribution and Service Fees, each of which is based on an annual percentage of each class' average net assets. In addition, FDC may pay financial intermediaries for selling shares of the Fund and providing shareholder support services. For the period, the Distribution and Service Fee rates and the total amounts paid to and retained by FDC were as follows:
| Distribution
Fee | Service
Fee | Paid to
FDC | Retained
by FDC |
Class A | 0% | .25% | $ 396 | $ 184 |
Class T | .25% | .25% | 254 | 194 |
Class B | .75% | .25% | 626 | 565 |
Class C | .75% | .25% | 666 | 573 |
| | | $ 1,942 | $ 1,516 |
Sales Load. FDC receives a front-end sales charge of up to 5.75% for selling Class A shares, and 3.50% for selling Class T shares, some of which is paid to financial intermediaries for selling shares of the Fund. FDC receives the proceeds of contingent deferred sales charges levied on Class A, Class T, Class B, and Class C redemptions. These charges depend on the holding period. The deferred sales charges range from 5% to 1% for Class B, 1% for Class C, 1.00% to .50% for certain purchases of Class A shares and .25% for certain purchases of Class T shares.
For the period, sales charge amounts retained by FDC were as follows:
| Retained
by FDC |
Class A | $ 2,552 |
Class T | 96 |
Class B* | - |
Class C* | 19 |
| $ 2,667 |
* When Class B and Class C shares are initially sold, FDC pays commissions from its own resources to financial intermediaries through which the sales are made.
Annual Report
6. Fees and Other Transactions with Affiliates - continued
Transfer Agent Fees. Fidelity Investments Institutional Operations Company, Inc. (FIIOC), an affiliate of FMR, is the transfer, dividend disbursing and shareholder servicing agent for each class of the Fund. FIIOC receives account fees and asset-based fees that vary according to the account size and type of account of the shareholders of the respective classes of the Fund. FIIOC pays for typesetting, printing and mailing of shareholder reports, except proxy statements. Prior to January 1, 2008, Fidelity Service Company, Inc. (FSC), also an affiliate of FMR, was the transfer agent for China Region shares. For the period, each class paid the following transfer agent fees:
| Amount | % of
Average
Net Assets |
Class A | $ 498 | .31* |
Class T | 152 | .30* |
Class B | 183 | .29* |
Class C | 174 | .26* |
China Region | 3,513,962 | .25 |
Institutional Class | 74 | .18* |
| $ 3,515,043 | |
* Annualized
Accounting and Security Lending Fees. FSC maintains the Fund's accounting records. The accounting fee is based on the level of average net assets for the month. Under a separate contract, FSC administers the security lending program. The security lending fee is based on the number and duration of lending transactions.
Brokerage Commissions. The Fund placed a portion of its portfolio transactions with brokerage firms which are affiliates of the investment adviser. The commissions paid to these affiliated firms were $37 for the period.
Interfund Lending Program. Pursuant to an Exemptive Order issued by the SEC, the Fund, along with other registered investment companies having management contracts with FMR, may participate in an interfund lending program. This program provides an alternative credit facility allowing the funds to borrow from, or lend money to, other participating affiliated funds. At period end, there were no interfund loans outstanding. The Fund's activity in this program during the period for which loans were outstanding was as follows:
Borrower or Lender | Average Daily
Loan Balance | Weighted Average Interest Rate | Interest
Expense |
Borrower | $ 18,672,333 | 2.81% | $ 8,739 |
7. Committed Line of Credit.
The Fund participates with other funds managed by FMR in a $4.2 billion credit facility (the "line of credit") to be utilized for temporary or emergency purposes to fund shareholder redemptions or for other short-term liquidity purposes. The Fund has agreed to pay commitment fees on its pro rata portion of the line of credit, which amounted to $2,898 and is reflected in Miscellaneous Expense on the Statement of Operations. During the period, there were no borrowings on this line of credit.
8. Security Lending.
The Fund lends portfolio securities from time to time in order to earn additional income. On the settlement date of the loan, the Fund receives collateral (in the form of U.S. Treasury obligations, letters of credit and/or cash) against the loaned securities and maintains collateral in an amount not less than 100% of the market value of the loaned securities during the period of the loan. The market value of the loaned securities is determined at the close of business of the Fund and any additional required collateral is delivered to the Fund on the next business day. If the borrower defaults on its obligation to return the securities loaned because of insolvency or other reasons, a fund could experience delays and costs in recovering the securities loaned or in gaining access to the collateral. Any cash collateral received is invested in the Fidelity Securities Lending Cash Central Fund. The value of loaned securities and cash collateral at period end are disclosed on the Fund's Statement of Assets and Liabilities. Security lending income represents the income earned on investing cash collateral, less fees and expenses associated with the loan, plus any premium payments that may be received on the loan of certain types of securities. Security lending income is presented in the Statement of Operations as a component of income from Fidelity Central Funds.
Annual Report
China Region
Notes to Financial Statements - continued
9. Expense Reductions.
FMR voluntarily agreed to reimburse a portion of China Region's operating expenses. During the period, this reimbursement reduced the class' expenses by $56,475.
Many of the brokers with whom FMR places trades on behalf of the Fund provided services to the Fund in addition to trade execution. These services included payments of certain expenses on behalf of the Fund totaling $1,973,232 for the period. In addition, through arrangements with the Fund's custodian and each class' transfer agent, credits realized as a result of uninvested cash balances were used to reduce the Fund's expenses. During the period, these credits reduced the Fund's custody expenses by $20,941. During the period, credits reduced each class' transfer agent expense as noted in the table below.
| Transfer Agent
expense reduction |
China Region | $ 17,610 |
10. Other.
The Fund's organizational documents provide former and current trustees and officers with a limited indemnification against liabilities arising in connection with the performance of their duties to the Fund. In the normal course of business, the Fund may also enter into contracts that provide general indemnifications. The Fund's maximum exposure under these arrangements is unknown as this would be dependent on future claims that may be made against the Fund. The risk of material loss from such claims is considered remote.
In December 2006, the Independent Trustees, with the assistance of independent counsel, completed an investigation regarding gifts, gratuities and business entertainment provided by certain brokers to certain individuals who were employed on FMR's domestic equity trading desk during the period 2002 to 2004. The Independent Trustees and FMR agreed that, despite the absence of proof that the Fidelity mutual funds experienced diminished execution quality as a result of the improper receipt of gifts and business entertainment, the conduct at issue was serious and was worthy of redress. Accordingly, the Independent Trustees requested, and FMR agreed to make, a payment of $42 million plus accrued interest, which equaled approximately $7.3 million, to certain Fidelity mutual funds.
In March 2008, the Trustees approved a method for allocating this payment among the funds and, in total, FMR paid the fund $92, which is recorded in the accompanying Statement of Operations.
In a related administrative order dated March 5, 2008, the U.S. Securities and Exchange Commission ("SEC") announced a settlement with FMR and FMR Co., Inc. (an affiliate of FMR) involving the SEC's regulatory rules for investment advisers and the improper receipt of gifts, gratuities and business entertainment. Without admitting or denying the SEC's findings, FMR agreed to pay an $8 million civil penalty to the United States Treasury.
11. Distributions to Shareholders.
Distributions to shareholders of each class were as follows:
Years ended October 31, | 2008 | 2007 |
From net investment income | | |
China Region | $ 15,794,709 | $ 9,931,797 |
From net realized gain | | |
China Region | $ 223,593,729 | $ 6,849,518 |
Annual Report
12. Share Transactions.
Transactions for each class of shares were as follows:
| Shares | Dollars |
Years ended October 31, | 2008 A | 2007 | 2008 A | 2007 |
Class A | | | | |
Shares sold | 30,242 | - | $ 750,104 | $ - |
Shares redeemed | (9,830) | - | (195,417) | - |
Net increase (decrease) | 20,412 | - | $ 554,687 | $ - |
Class T | | | | |
Shares sold | 6,603 | - | $ 171,008 | $ - |
Shares redeemed | (170) | - | (3,942) | - |
Net increase (decrease) | 6,433 | - | $ 167,066 | $ - |
Class B | | | | |
Shares sold | 9,379 | - | $ 239,439 | $ - |
Shares redeemed | (69) | - | (1,147) | - |
Net increase (decrease) | 9,310 | - | $ 238,292 | $ - |
Class C | | | | |
Shares sold | 16,209 | - | $ 359,453 | $ - |
Shares redeemed | (2,193) | - | (34,305) | - |
Net increase (decrease) | 14,016 | - | $ 325,148 | $ - |
China Region | | | | |
Shares sold | 24,232,728 | 38,031,904 | $ 702,714,867 | $ 1,145,260,346 |
Reinvestment of distributions | 7,102,996 | 675,406 | 228,787,494 | 16,027,386 |
Shares redeemed | (36,222,341) | (21,493,222) | (967,305,455) | (573,113,425) |
Net increase (decrease) | (4,886,617) | 17,214,088 | $ (35,803,094) | $ 588,174,307 |
Institutional Class | | | | |
Shares sold | 5,359 | - | $ 145,686 | $ - |
Shares redeemed | (1,791) | - | (37,350) | - |
Net increase (decrease) | 3,568 | - | $ 108,336 | $ - |
A Share transactions for Class A, Class T, Class B, Class C, and Institutional Class are for the period May 9, 2008 (commencement of sale of shares) to October 31, 2008.
Annual Report
Report of Independent Registered Public Accounting Firm
To the Trustees of Fidelity Investment Trust and the Shareholders of Fidelity China Region Fund:
In our opinion, the accompanying statement of assets and liabilities, including the schedule of investments, and the related statements of operations and of changes in net assets and the financial highlights present fairly, in all material respects, the financial position of Fidelity China Region Fund (a fund of Fidelity Investment Trust) at October 31, 2008, the results of its operations for the periods indicated, the changes in its net assets for each of the periods indicated and the financial highlights for each of the periods indicated, in conformity with accounting principles generally accepted in the United States of America. These financial statements and financial highlights (hereafter referred to as "financial statements") are the responsibility of the Fidelity China Region Fund's management. Our responsibility is to express an opinion on these financial statements based on our audits. We conducted our audits of these financial statements in accordance with the standards of the Public Company Accounting Oversight Board (United States). Those standards require that we plan and perform the audit to obtain reasonable assurance about whether the financial statements are free of material misstatement. An audit includes examining, on a test basis, evidence supporting the amounts and disclosures in the financial statements, assessing the accounting principles used and significant estimates made by management, and evaluating the overall financial statement presentation. We believe that our audits, which included confirmation of securities at October 31, 2008 by correspondence with the custodian and brokers, provide a reasonable basis for our opinion.
/s/ PricewaterhouseCoopers LLP
PricewaterhouseCoopers LLP
Boston, Massachusetts
December 23, 2008
Annual Report
The Trustees, Member of the Advisory Board, and executive officers of the trust and fund, as applicable, are listed below. The Board of Trustees governs the fund and is responsible for protecting the interests of shareholders. The Trustees are experienced executives who meet periodically throughout the year to oversee the fund's activities, review contractual arrangements with companies that provide services to the fund, and review the fund's performance. Except for Edward C. Johnson 3d and James C. Curvey, each of the Trustees oversees 220 funds advised by FMR or an affiliate. Messrs. Johnson and Curvey oversee 379 funds advised by FMR or an affiliate.
The Trustees hold office without limit in time except that (a) any Trustee may resign; (b) any Trustee may be removed by written instrument, signed by at least two-thirds of the number of Trustees prior to such removal; (c) any Trustee who requests to be retired or who has become incapacitated by illness or injury may be retired by written instrument signed by a majority of the other Trustees; and (d) any Trustee may be removed at any special meeting of shareholders by a two-thirds vote of the outstanding voting securities of the trust. Each Trustee who is not an interested person (as defined in the 1940 Act) (Independent Trustee), shall retire not later than the last day of the calendar year in which his or her 72nd birthday occurs. The Independent Trustees may waive this mandatory retirement age policy with respect to individual Trustees. The executive officers and Advisory Board Member hold office without limit in time, except that any officer and Advisory Board Member may resign or may be removed by a vote of a majority of the Trustees at any regular meeting or any special meeting of the Trustees. Except as indicated, each individual has held the office shown or other offices in the same company for the past five years.
The fund's Statement of Additional Information (SAI) includes more information about the Trustees. To request a free copy, call Fidelity at 1-877-208-0098.
Interested Trustees*:
Correspondence intended for each Trustee who is an interested person may be sent to Fidelity Investments, 82 Devonshire Street, Boston, Massachusetts 02109.
Name, Age; Principal Occupation |
Edward C. Johnson 3d (78) |
| Year of Election or Appointment: 1984 Mr. Johnson is Chairman of the Board of Trustees. Mr. Johnson serves as Chief Executive Officer, Chairman, and a Director of FMR LLC; Chairman and a Director of FMR; Chairman and a Director of Fidelity Research & Analysis Company (FRAC); Chairman and a Director of Fidelity Investments Money Management, Inc.; and Chairman and a Director of FMR Co., Inc. In addition, Mr. Johnson serves as Chairman and Director of FIL Limited. Previously, Mr. Johnson served as President of FMR LLC (2006-2007). |
James C. Curvey (73) |
| Year of Election or Appointment: 2007 Mr. Curvey also serves as Trustee (2007-present) of other investment companies advised by FMR. Mr. Curvey is a Director of FMR and FMR Co., Inc. (2007-present). Mr. Curvey is also Vice Chairman (2006-present) and Director of FMR LLC. In addition, Mr. Curvey serves as an Overseer for the Boston Symphony Orchestra and a member of the Trustees of Villanova University. |
* Trustees have been determined to be "Interested Trustees" by virtue of, among other things, their affiliation with the trust or various entities under common control with FMR. FMR Corp. merged with and into FMR LLC on October 1, 2007. Any references to FMR LLC for prior periods are deemed to be references to the prior entity.
Independent Trustees:
Correspondence intended for each Independent Trustee (that is, the Trustees other than the Interested Trustees) may be sent to Fidelity Investments, P.O. Box 55235, Boston, Massachusetts 02205-5235.
Name, Age; Principal Occupation |
Dennis J. Dirks (60) |
| Year of Election or Appointment: 2005 Prior to his retirement in May 2003, Mr. Dirks was Chief Operating Officer and a member of the Board of The Depository Trust & Clearing Corporation (DTCC) (1999-2003). He also served as President, Chief Operating Officer, and Board member of The Depository Trust Company (DTC) (1999-2003) and President and Board member of the National Securities Clearing Corporation (NSCC) (1999-2003). In addition, Mr. Dirks served as a Trustee and a member of the Finance Committee of Manhattan College (2005-2008), and as Chief Executive Officer and Board member of the Government Securities Clearing Corporation (2001-2003) and Chief Executive Officer and Board member of the Mortgage-Backed Securities Clearing Corporation (2001-2003). Mr. Dirks also serves as a Trustee and a member of the Finance Committee of AHRC of Nassau County (2006-present). |
Alan J. Lacy (55) |
| Year of Election or Appointment: 2008 Mr. Lacy serves as Senior Adviser (2007-present) of Oak Hill Capital Partners, L.P. (a private equity firm). Mr. Lacy also served as Chief Executive Officer (2000-2005) and Vice Chairman (2005-2006) of Sears Holdings Corporation and Sears, Roebuck and Co. (retail). In addition, Mr. Lacy serves as a member of the Board of Directors of The Western Union Company (global money transfer, 2006-present) and Bristol-Myers Squibb (global pharmaceuticals, 2007-present). Mr. Lacy is a Trustee of the National Parks Conservation Association and The Field Museum of Natural History. |
Ned C. Lautenbach (64) |
| Year of Election or Appointment: 2000 Mr. Lautenbach is Chairman of the Independent Trustees (2006-present). Mr. Lautenbach is an Advisory Partner of Clayton, Dubilier & Rice, Inc. (private equity investment firm). Previously, Mr. Lautenbach was with the International Business Machines Corporation (IBM) from 1968 until his retirement in 1998. Mr. Lautenbach serves as a Director of Eaton Corporation (diversified industrial) as well as the Philharmonic Center for the Arts in Naples, Florida. He also is a member of the Board of Trustees of Fairfield University (2005-present), as well as a member of the Council on Foreign Relations. Previously, Mr. Lautenbach served as a Director of Sony Corporation (2006-2007). |
Joseph Mauriello (64) |
| Year of Election or Appointment: 2008 Prior to his retirement in January 2006, Mr. Mauriello served in numerous senior management positions including Deputy Chairman and Chief Operating Officer (2004-2005), and Vice Chairman of Financial Services (2002-2004) of KPMG LLP US (professional services firm, 1965-2005). Mr. Mauriello currently serves as a member of the Board of Directors of XL Capital Ltd. (global insurance and re-insurance company, 2006-present) and of Arcadia Resources Inc. (health care services and products, 2007-
present). He also served as a Director of the Hamilton Funds of the Bank of New York (2006-2007). |
Cornelia M. Small (64) |
| Year of Election or Appointment: 2005 Ms. Small is a member of the Investment Committee, and Chair (2008-present) and a member of the Board of Trustees of Smith College. Ms. Small also serves on the Investment Committee of the Berkshire Taconic Community Foundation (2008-present). Previously, Ms. Small served as Chairperson of the Investment Committee (2002-2008) of Smith College and as Co-Chair (2000-
2003) of the Annual Fund for the Fletcher School of Law and Diplomacy. In addition, she served as Chief Investment Officer, Director of Global Equity Investments, and a member of the Board of Directors of Scudder, Stevens & Clark and Scudder Kemper Investments. |
William S. Stavropoulos (69) |
| Year of Election or Appointment: 2001 Mr. Stavropoulos is Chairman Emeritus of the Board of Directors of The Dow Chemical Company, where he previously served in numerous senior management positions, including President (1993-2000; 2002-2003), CEO (1995-2000; 2002-2004), Chairman of the Executive Committee (2000-2006), and as a member of the Board of Directors (1990-2006). Currently, he is a Director of Teradata Corporation (data warehousing and technology solutions, 2008-present), Chemical Financial Corporation, Maersk Inc. (industrial conglomerate), Tyco International, Inc. (multinational manufacturing and services, 2007-present), and a member of the Advisory Board for Metalmark Capital (private equity investment firm, 2005-present). He is a special advisor to Clayton, Dubilier & Rice, Inc. (private equity investment). In addition, Mr. Stavropoulos is a member of the University of Notre Dame Advisory Council for the College of Science. |
David M. Thomas (59) |
| Year of Election or Appointment: 2008 Previously, Mr. Thomas served as Executive Chairman (2005-2006) and Chairman and Chief Executive Officer (2000-2005) of IMS Health, Inc. (pharmaceutical and healthcare information solutions). In addition, Mr. Thomas serves as a member of the Board of Directors of Fortune Brands, Inc. (consumer products holding company), and Interpublic Group of Companies, Inc. (marketing communication, 2004-present). |
Michael E. Wiley (58) |
| Year of Election or Appointment: 2008 Mr. Wiley also serves as a member of the Board of Trustees of the University of Tulsa (2000-2006; 2007-present). He serves as a Director of Tesoro Corporation (independent oil refiner and marketer, 2005-present), and a Director of Bill Barrett Corporation (exploration and production company, 2005-present). In addition, he also serves as a Director of Post Oak Bank (privately-held bank, 2004-present). Previously, Mr. Wiley served as a Sr. Energy Advisor of Katzenbach Partners, LLC (consulting firm, 2006-2007), as an Advisory Director of Riverstone Holdings (private investment firm), Chairman, President, and CEO of Baker Hughes, Inc. (oilfield services company, 2000-2004), and as Director of Spinnaker Exploration Company (exploration and production company, 2001-2005). |
Annual Report
Advisory Board Member and Executive Officers**:
Correspondence intended for each executive officer and Mr. Lynch may be sent to Fidelity Investments, 82 Devonshire Street, Boston, Massachusetts 02109.
Name, Age; Principal Occupation |
Peter S. Lynch (64) |
| Year of Election or Appointment: 2003 Member of the Advisory Board of Fidelity's Equity and High Income Funds. Mr. Lynch is Vice Chairman and a Director of FMR, and Vice Chairman (2001-present) and a Director of FMR Co., Inc. Previously, Mr. Lynch served as a Trustee of the Fidelity funds (1990-2003). In addition, he serves as a Trustee of Boston College and as the Chairman of the Inner-City Scholarship Fund. Previously, Mr. Lynch served on the Special Olympics International Board of Directors (1997-2006). |
Kenneth B. Robins (39) |
| Year of Election or Appointment: 2008 President and Treasurer of Fidelity's Equity and High Income Funds. Mr. Robins is an employee of Fidelity Investments (2004-
present). Before joining Fidelity Investments, Mr. Robins worked at KPMG LLP, where he was a partner in KPMG's department of professional practice (2002-2004). |
Walter C. Donovan (46) |
| Year of Election or Appointment: 2007 Vice President of Fidelity's Equity Funds. Mr. Donovan also serves as President of FMR and FMR Co., Inc., and Executive Vice President of Fidelity Investments Money Management, Inc. (2007-present). Previously, Mr. Donovan served as Executive Vice President of FMR and FMR Co., Inc. (2005-2007) and Senior Vice President of FMR (2003-2005) and FMR Co., Inc. (2004-2005). |
Eric M. Wetlaufer (46) |
| Year of Election or Appointment: 2006 Vice President of Fidelity's International Equity Funds. Mr. Wetlaufer also serves as Group Chief Investment Officer of FMR. Mr. Wetlaufer is Chairman, Chief Executive Officer, and President of Fidelity Management & Research (Hong Kong) Limited (2008-present); Chairman, Chief Executive Officer, President, and a Director of Fidelity Management & Research (Japan) Inc. (2008-present); Chairman and Chief Executive Officer (2007-present) and President and a Director (2006-present) of Fidelity Management & Research (U.K.) Inc. and President and a Director of Fidelity Research & Analysis Company (2006-present). Before joining Fidelity Investments in 2005, Mr. Wetlaufer was a partner in Oxhead Capital Management (2004-2005) and a Chief Investment Officer of Putnam Investments (1997-2003). |
Scott C. Goebel (40) |
| Year of Election or Appointment: 2008 Secretary and Chief Legal Officer (CLO) of the Fidelity funds. Mr. Goebel also serves as General Counsel, Secretary, and Senior Vice President of FMR (2008-present); Deputy General Counsel of FMR LLC; Chief Legal Secretary of Fidelity Management & Research (Hong Kong) Limited (2008-present) and Assistant Secretary of Fidelity Management & Research (Japan) Inc. (2008-
present). Previously, Mr. Goebel served as Assistant Secretary of the Funds (2007-2008) and as Vice President and Secretary of Fidelity Distributors Corporation (FDC) (2005-2007). |
John B. McGinty, Jr. (46) |
| Year of Election or Appointment: 2008 Assistant Secretary of Fidelity's Equity and High Income Funds. Mr. McGinty is an employee of Fidelity Investments (2004-present). Mr. McGinty also serves as Senior Vice President, Secretary, and Chief Legal Officer of FDC (2007-present). Before joining Fidelity Investments, Mr. McGinty practiced law at Ropes & Gray, LLP. |
Holly C. Laurent (54) |
| Year of Election or Appointment: 2008 Anti-Money Laundering (AML) Officer of the Fidelity funds. Ms. Laurent is an employee of Fidelity Investments. Previously, Ms. Laurent was Senior Vice President and Head of Legal for Fidelity Business Services India Pvt. Ltd. (2006-2008), Senior Vice President, Deputy General Counsel and Group Head for FMR LLC (2005-2006). |
Christine Reynolds (50) |
| Year of Election or Appointment: 2008 Chief Financial Officer of the Fidelity funds. Ms. Reynolds became President of Fidelity Pricing and Cash Management Services (FPCMS) in August 2008. She served as Chief Operating Officer of FPCMS from 2007 through July 2008. Previously, Ms. Reynolds served as President, Treasurer, and Anti-Money Laundering Officer of the Fidelity funds (2004-2007). Before joining Fidelity Investments, Ms. Reynolds worked at PricewaterhouseCoopers LLP (PwC) (1980-2002), where she was an audit partner with PwC's investment management practice. |
Kenneth A. Rathgeber (61) |
| Year of Election or Appointment: 2004 Chief Compliance Officer of Fidelity's Equity and High Income Funds. Mr. Rathgeber is Chief Compliance Officer of Fidelity Management & Research (Hong Kong) Limited (2008-present), Fidelity Management & Research (Japan) Inc. (2008-present), FMR (2005-present), FMR Co., Inc. (2005-present), Fidelity Management & Research (U.K.) Inc. (2005-present), Fidelity Research & Analysis Company (2005-present), Fidelity Investments Money Management, Inc. (2005-present), and Strategic Advisers, Inc. (2005-present). |
Bryan A. Mehrmann (47) |
| Year of Election or Appointment: 2005 Deputy Treasurer of the Fidelity funds. Mr. Mehrmann is an employee of Fidelity Investments. Previously, Mr. Mehrmann served as Vice President of Fidelity Investments Institutional Services Group (FIIS)/Fidelity Investments Institutional Operations Corporation, Inc. (FIIOC) Client Services (1998-2004). |
Adrien E. Deberghes (41) |
| Year of Election or Appointment: 2008 Deputy Treasurer of Fidelity's Equity and High Income Funds. Mr. Deberghes is an employee of Fidelity Investments (2008-present). Previously, Mr. Deberghes served as Senior Vice President of Mutual Fund Administration at State Street Corporation (2007-2008), Senior Director of Mutual Fund Administration at Investors Bank & Trust (2005-2007), and Director of Finance for Dunkin' Brands (2000-2005). |
Robert G. Byrnes (41) |
| Year of Election or Appointment: 2005 Assistant Treasurer of the Fidelity funds. Mr. Byrnes is an employee of Fidelity Investments (2005-present). Previously, Mr. Byrnes served as Vice President of Fidelity Pricing and Cash Management Services (FPCMS) (2003-2005). Before joining Fidelity Investments, Mr. Byrnes worked at Deutsche Asset Management where he served as Vice President of the Investment Operations Group (2000-2003). |
Peter L. Lydecker (54) |
| Year of Election or Appointment: 2004 Assistant Treasurer of the Fidelity funds. Mr. Lydecker is an employee of Fidelity Investments. |
Paul M. Murphy (61) |
| Year of Election or Appointment: 2007 Assistant Treasurer of the Fidelity funds. Mr. Murphy is an employee of Fidelity Investments (2007-present). Previously, Mr. Murphy served as Chief Financial Officer of the Fidelity Funds (2005-2006), Vice President and Associate General Counsel of FMR (2007), and Senior Vice President of Fidelity Pricing and Cash Management Services (FPCMS) (1994-2007). |
Gary W. Ryan (50) |
| Year of Election or Appointment: 2005 Assistant Treasurer of the Fidelity funds. Mr. Ryan is an employee of Fidelity Investments. Previously, Mr. Ryan served as Vice President of Fund Reporting in Fidelity Pricing and Cash Management Services (FPCMS) (1999-2005). |
** FMR Corp. merged with and into FMR LLC on October 1, 2007. Any references to FMR LLC for prior periods are deemed to be references to the prior entity.
Annual Report
A special meeting of the fund's shareholders was held on December 13, 2007. The results of votes taken among shareholders on the proposals before them are reported below. Each vote reported represents one dollar of net asset value held on the record date for the meeting.
PROPOSAL 1 |
To amend the Declaration of Trust to reduce the required quorum for shareholder meetings.A |
| # of
Votes | % of
Votes |
Affirmative | 45,014,793,255.82 | 80.372 |
Against | 6,871,112,667.08 | 12.268 |
Abstain | 2,163,456,438.02 | 3.863 |
Broker
Non-Votes | 1,958,633,563.89 | 3.497 |
TOTAL | 56,007,995,924.81 | 100.000 |
PROPOSAL 2 |
To elect the nominees specified below as Trustees.A |
| # of
Votes | % of
Votes |
James C. Curvey |
Affirmative | 53,384,952,361.03 | 95.317 |
Withheld | 2,623,043,563.78 | 4.683 |
TOTAL | 56,007,995,924.81 | 100.000 |
Dennis J. Dirks |
Affirmative | 53,595,104,608.67 | 95.692 |
Withheld | 2,412,891,316.14 | 4.308 |
TOTAL | 56,007,995,924.81 | 100.000 |
Albert R. Gamper, Jr. |
Affirmative | 53,570,235,221.69 | 95.647 |
Withheld | 2,437,760,703.12 | 4.353 |
TOTAL | 56,007,995,924.81 | 100.000 |
George H. Heilmeier |
Affirmative | 53,166,350,588.50 | 94.926 |
Withheld | 2,841,645,336.31 | 5.074 |
TOTAL | 56,007,995,924.81 | 100.000 |
Edward C. Johnson 3d |
Affirmative | 53,230,508,654.93 | 95.041 |
Withheld | 2,777,487,269.88 | 4.959 |
TOTAL | 56,007,995,924.81 | 100.000 |
James H. Keyes |
Affirmative | 53,549,161,456.52 | 95.610 |
Withheld | 2,458,834,468.29 | 4.390 |
TOTAL | 56,007,995,924.81 | 100.000 |
Marie L. Knowles |
Affirmative | 53,543,925,066.86 | 95.601 |
Withheld | 2,464,070,857.95 | 4.399 |
TOTAL | 56,007,995,924.81 | 100.000 |
Ned C. Lautenbach |
Affirmative | 53,547,116,322.50 | 95.606 |
Withheld | 2,460,879,602.31 | 4.394 |
TOTAL | 56,007,995,924.81 | 100.000 |
| # of
Votes | % of
Votes |
Cornelia M. Small |
Affirmative | 53,564,793,514.25 | 95.638 |
Withheld | 2,443,202,410.56 | 4.362 |
TOTAL | 56,007,995,924.81 | 100.000 |
William S. Stavropoulos |
Affirmative | 53,426,544,502.76 | 95.391 |
Withheld | 2,581,451,422.05 | 4.609 |
TOTAL | 56,007,995,924.81 | 100.000 |
Kenneth L. Wolfe |
Affirmative | 53,229,881,790.63 | 95.040 |
Withheld | 2,778,114,134.18 | 4.960 |
TOTAL | 56,007,995,924.81 | 100.000 |
A Denotes trust-wide proposal and voting results.
Annual Report
Proxy Voting Results
A special meeting of the fund's shareholders was held on April 16, 2008. The results of votes taken among shareholders on the proposal before them are reported below. Each vote reported represents one dollar of net asset value held on the record date for the meeting.
PROPOSAL 1 |
To elect a Board of Trustees.A |
| # of
Votes | % of
Votes |
James C. Curvey |
Affirmative | 44,485,656,811.55 | 94.702 |
Withheld | 2,488,551,854.62 | 5.298 |
TOTAL | 46,974,208,666.17 | 100.000 |
Dennis J. Dirks |
Affirmative | 44,706,671,638.31 | 95.173 |
Withheld | 2,267,537,027.86 | 4.827 |
TOTAL | 46,974,208,666.17 | 100.000 |
Edward C. Johnson 3d |
Affirmative | 44,294,881,638.16 | 94.296 |
Withheld | 2,679,327,028.01 | 5.704 |
TOTAL | 46,974,208,666.17 | 100.000 |
Alan J. Lacy |
Affirmative | 44,685,373,413.16 | 95.127 |
Withheld | 2,288,835,253.01 | 4.873 |
TOTAL | 46,974,208,666.17 | 100.000 |
Ned C. Lautenbach |
Affirmative | 44,634,541,379.41 | 95.019 |
Withheld | 2,339,667,286.76 | 4.981 |
TOTAL | 46,974,208,666.17 | 100.000 |
Joseph Mauriello |
Affirmative | 44,683,962,099.80 | 95.124 |
Withheld | 2,290,246,566.37 | 4.876 |
TOTAL | 46,974,208,666.17 | 100.000 |
Cornelia M. Small |
Affirmative | 44,671,688,375.36 | 95.098 |
Withheld | 2,302,520,290.81 | 4.902 |
TOTAL | 46,974,208,666.17 | 100.000 |
William S. Stavropoulos |
Affirmative | 44,465,262,087.61 | 94.659 |
Withheld | 2,508,946,578.56 | 5.341 |
TOTAL | 46,974,208,666.17 | 100.000 |
David M. Thomas |
Affirmative | 44,694,340,813.87 | 95.147 |
Withheld | 2,279,867,852.30 | 4.853 |
TOTAL | 46,974,208,666.17 | 100.000 |
Michael E. Wiley |
Affirmative | 44,686,513,174.78 | 95.130 |
Withheld | 2,287,695,491.39 | 4.870 |
TOTAL | 46,974,208,666.17 | 100.000 |
A Denotes trust-wide proposal and voting results.
Annual Report
Board Approval of Investment Advisory Contracts and Management Fees
Fidelity China Region Fund
Each year, typically in July, the Board of Trustees, including the Independent Trustees (together, the Board), votes on the renewal of the management contract and sub-advisory agreements (together, the Advisory Contracts) for the fund. The Board, assisted by the advice of fund counsel and Independent Trustees' counsel, requests and considers a broad range of information throughout the year.
The Board meets regularly and, acting directly and through its separate committees, requests and receives information concerning, and considers at each of its meetings factors that are relevant to, its annual consideration of the renewal of the fund's Advisory Contracts, including the services and support provided to the fund and its shareholders. At the time of the renewal, the Board had 12 standing committees, each composed of Independent Trustees with varying backgrounds, to which the Board has assigned specific subject matter responsibilities in order to enhance effective decision-making by the Board. Each committee has a written charter outlining the structure and purposes of the committee. The Board also meets as needed to consider matters specifically related to the Board's annual consideration of the renewal of Advisory Contracts.
At its July 2008 meeting, the Board of Trustees, including the Independent Trustees, unanimously determined to renew each fund's Advisory Contracts. In reaching its determination, the Board considered all factors it believed relevant, including (i) the nature, extent, and quality of the services to be provided to the fund and its shareholders (including the investment performance of the fund); (ii) the competitiveness of each fund's management fee and total expenses; (iii) the total costs of the services to be provided by and the profits to be realized by Fidelity from its relationship with the fund; (iv) the extent to which economies of scale would be realized as the fund grows; and (v) whether fee levels reflect these economies of scale, if any, for the benefit of fund shareholders. The Board also approved agreements with foreign sub-advisers Fidelity Management & Research (Japan) Inc. and Fidelity Management & Research (Hong Kong) Limited, as well as amendments to the fund's agreement with Fidelity Management & Research (U.K.) Inc.
In considering whether to renew the Advisory Contracts for the fund, the Board ultimately reached a determination, with the assistance of fund counsel and Independent Trustees' counsel and through the exercise of its business judgment, that the renewal of the Advisory Contracts and the compensation to be received by Fidelity under the management contract is consistent with Fidelity's fiduciary duty under applicable law. The Board's decision to renew the Advisory Contracts was not based on any single factor noted above, but rather was based on a comprehensive consideration of all the information provided to the Board at its meetings throughout the year. The Board, in reaching its determination to renew the Advisory Contracts, is aware that shareholders in the fund have a broad range of investment choices available to them, including a wide choice among mutual funds offered by competitors to Fidelity, and that the fund's shareholders, with the opportunity to review and weigh the disclosure provided by the fund in its prospectus and other public disclosures, have chosen to invest in this fund, managed by Fidelity.
Nature, Extent, and Quality of Services Provided. The Board considered staffing within the investment adviser, FMR, and the sub-advisers (together, the Investment Advisers), including the backgrounds of the fund's investment personnel and the fund's investment objective and discipline. The Independent Trustees also had discussions with senior management of Fidelity's investment operations and investment groups. The Board considered the structure of the portfolio manager compensation program and whether this structure provides appropriate incentives.
Resources Dedicated to Investment Management and Support Services. The Board reviewed the size, education, and experience of the Investment Advisers' investment staff, their use of technology, and the Investment Advisers' approach to recruiting, training, and retaining portfolio managers and other research, advisory, and management personnel. The Board noted that Fidelity's analysts have access to a variety of technological tools that enable them to perform both fundamental and quantitative analysis and to specialize in various disciplines. The Board considered Fidelity's extensive global research capabilities that enable the Investment Advisers to aggregate data from various sources in an effort to produce positive investment results. The Board also considered that Fidelity's portfolio managers and analysts have access to daily portfolio attribution that allows for monitoring of a fund's portfolio, as well as an electronic communication system that provides immediate real-time access to research concerning issuers and credit enhancers.
Shareholder and Administrative Services. The Board considered (i) the nature, extent, quality, and cost of advisory, administrative, distribution, and shareholder services performed by the Investment Advisers and their affiliates under the Advisory Contracts and under separate agreements covering transfer agency, pricing and bookkeeping, and securities lending services for the fund; (ii) the nature and extent of the Investment Advisers' supervision of third party service providers, principally custodians and subcustodians; and (iii) the resources devoted to, and the record of compliance with, the fund's compliance policies and procedures. The Board also reviewed the allocation of fund brokerage, including allocations to brokers affiliated with the Investment Advisers, the use of brokerage commissions to pay fund expenses, and the use of "soft" commission dollars to pay for research services. The Board further considered that Fidelity voluntarily pays for market data out of its own resources.
The Board noted that the growth of fund assets across the complex allows Fidelity to reinvest in the development of services designed to enhance the value or convenience of the Fidelity funds as investment vehicles. These services include 24 hour access to account information and market information through phone representatives and over the Internet, and investor education materials and asset allocation tools.
Investment in a Large Fund Family. The Board considered the benefits to shareholders of investing in a Fidelity fund, including the benefits of investing in a fund that is part of a large family of funds offering a variety of investment disciplines and providing for a large variety of mutual fund investor services. For example, fund shareholders are offered the privilege of exchanging shares of the fund for shares of other Fidelity funds, as set forth in the fund's prospectus, without paying a sales charge. The Board noted that Fidelity has taken a number of actions over the previous year that benefited particular funds, including (i) dedicating additional resources to investment research and to restructure the investment research teams; (ii) contractually agreeing to reduce the management fees on Fidelity's Institutional Money Market Funds and launching Class IV and Institutional Class of certain of these funds; (iii) reducing the transfer agent fees for the Fidelity Select Portfolios and Investor Class of the VIP funds; and (iv) launching Class K of 29 equity funds as a lower-fee class available to certain employer-sponsored retirement plans.
Annual Report
Investment Performance. The Board considered whether the fund has operated within its investment objective, as well as its record of compliance with its investment restrictions. It also reviewed the fund's absolute investment performance for Fidelity China Region (retail class), as well as the fund's relative investment performance for Fidelity China Region (retail class) measured against a broad-based securities market index over multiple periods. The Board noted that FMR does not believe that a meaningful peer group exists against which to compare the fund's performance. The following charts considered by the Board show, over the one-, three-, and five-year periods ended December 31, 2007, the cumulative total returns of Fidelity China Region (retail class) of the fund and the cumulative total returns of a broad-based securities market index ("benchmark"). (China Region Fund did not offer Advisor classes as of December 31, 2007.)
Fidelity China Region Fund
The Board stated that the investment performance of Fidelity China Region (retail class) of the fund compared favorably to its benchmark for all the periods shown.
The Board considered that FMR has taken steps to refocus and strengthen equity research, equity portfolio management, and compliance.
Based on its review, and giving particular weight to the nature and quality of the resources dedicated by the Investment Advisers to maintain and improve relative performance, the Board concluded that the nature, extent, and quality of the services provided to the fund will benefit the fund's shareholders, particularly in light of the Board's view that the fund's shareholders benefit from investing in a fund that is part of a large family of funds offering a variety of investment disciplines and services.
Competitiveness of Management Fee and Total Fund Expenses. The Board considered the fund's management fee and total expenses compared to "mapped groups" of competitive funds and classes. Fidelity creates "mapped groups" by combining similar Lipper investment objective categories that have comparable management fee characteristics. Combining Lipper investment objective categories aids the Board's management fee and total expense comparisons by broadening the competitive group used for comparison and by reducing the number of universes to which various Fidelity funds are compared. The Board also considered supplemental information about how the fund's management fee and total expenses ranked relative to groups based on Lipper classifications, which take into account a fund's market capitalization and style.
The Board considered two proprietary management fee comparisons for the 12-month periods shown in the chart below. The group of Lipper funds used by the Board for management fee comparisons is referred to below as the "Total Mapped Group." The Total Mapped Group comparison focuses on a fund's standing relative to the total universe of comparable funds available to investors, in terms of gross management fees before expense reimbursements or caps, and without giving effect to the fund's performance adjustment. "TMG %" represents the percentage of funds in the Total Mapped Group that had management fees that were lower than the fund's. For example, a TMG % of 9% means that 91% of the funds in the Total Mapped Group had higher management fees than the fund. The "Asset-Size Peer Group" (ASPG) comparison focuses on a fund's standing relative to non-Fidelity funds similar in size to the fund within the Total Mapped Group. The ASPG represents at least 15% of the funds in the Total Mapped Group with comparable asset size and management fee characteristics, subject to a minimum of 50 funds (or all funds in the Total Mapped Group if fewer than 50). Additional information, such as the ASPG quartile in which the fund's management fee ranked and the impact of the fund's performance adjustment, is also included in the chart and considered by the Board.
Annual Report
Board Approval of Investment Advisory Contracts and Management Fees - continued
Fidelity China Region Fund
The Board noted that the fund's management fee ranked below the median of its Total Mapped Group and below the median of its ASPG for 2007.
Based on its review, the Board concluded that the fund's management fee was fair and reasonable in light of the services that the fund receives and the other factors considered.
In its review of the fund's total expenses, the Board considered the fund's management fee as well as other fund expenses, such as transfer agent fees, pricing and bookkeeping fees, and custodial, legal, and audit fees. The Board also noted the effects of any waivers and reimbursements on fees and expenses. As part of its review, the Board also considered current and historical total expenses of the fund compared to competitive fund median expenses. The fund is compared to those funds and classes in the Total Mapped Group (used by the Board for management fee comparisons) that have a similar sales load structure.
The Board noted that the fund's total expenses ranked below its competitive median for 2007.
In its review of total expenses, the Board also considered Fidelity fee structures and other information on clients that FMR and its affiliates service in other competitive markets, such as other mutual funds advised or subadvised by FMR or its affiliates, pension plan clients, and other institutional clients.
Based on its review, the Board concluded that the fund's total expenses were reasonable in light of the services that the fund and its shareholders receive and the other factors considered.
Costs of the Services and Profitability. The Board considered the revenues earned and the expenses incurred by Fidelity in conducting the business of developing, marketing, distributing, managing, administering and servicing the fund and its shareholders. The Board also considered the level of Fidelity's profits in respect of all the Fidelity funds.
On an annual basis, FMR presents to the Board Fidelity's profitability for the fund. Fidelity calculates the profitability for each fund, as well as aggregate profitability for groups of Fidelity funds and all Fidelity funds, using a series of detailed revenue and cost allocation methodologies which originate with the audited books and records of Fidelity. The Audit Committee of the Board reviews any significant changes from the prior year's methodologies.
PricewaterhouseCoopers LLP (PwC), independent registered public accounting firm and auditor to Fidelity and certain Fidelity funds, has been engaged annually by the Board as part of the Board's assessment of the results of Fidelity's profitability analysis. PwC's engagement includes the review and assessment of Fidelity's methodologies used in determining the revenues and expenses attributable to Fidelity's mutual fund business, and completion of agreed-upon procedures surrounding the mathematical accuracy of fund profitability and its conformity to allocation methodologies. After considering PwC's reports issued under the engagement and information provided by Fidelity, the Board believes that while other allocation methods may also be reasonable, Fidelity's profitability methodologies are reasonable in all material respects.
Annual Report
The Board has also reviewed Fidelity's non-fund businesses and any fall-out benefits related to the mutual fund business as well as cases where Fidelity's affiliates may benefit from or be related to the fund's business.
The Board considered the costs of the services provided by and the profits realized by Fidelity in connection with the operation of the fund and determined that the amount of profit is a fair entrepreneurial profit for the management of the fund.
Economies of Scale. The Board considered whether there have been economies of scale in respect of the management of the Fidelity funds, whether the Fidelity funds (including the fund) have appropriately benefited from any such economies of scale, and whether there is potential for realization of any further economies of scale. The Board considered the extent to which the fund will benefit from economies of scale through increased services to the fund, through waivers or reimbursements, or through fee or expense reductions.
The Board recognized that the fund's management contract incorporates a "group fee" structure, which provides for lower group fee rates as total fund assets under FMR's management increase, and for higher group fee rates as total fund assets under FMR's management decrease. FMR determines the group fee rates based on a tiered asset "breakpoint" schedule. The Board considered that the group fee is designed to deliver the benefits of economies of scale to fund shareholders when total fund assets increase, even if assets of any particular fund are unchanged or have declined, because some portion of Fidelity's costs are attributable to services provided to all Fidelity funds, and all funds benefit if those costs can be allocated among more assets. The Board concluded that, given the group fee structure, fund shareholders will achieve a certain level of economies of scale as assets under FMR's management increase at the fund complex level, regardless of whether Fidelity achieves any such economies of scale.
The Board further concluded that any potential economies of scale are being shared between fund shareholders and Fidelity in an appropriate manner.
Additional Information Requested by the Board. In order to develop fully the factual basis for consideration of the Fidelity funds' Advisory Contracts, the Board requested and received additional information on certain topics, including (i) fund performance trends and actions to be taken by FMR to improve certain funds' overall performance; (ii) portfolio manager changes that have occurred during the past year; (iii) Fidelity's fund profitability methodology, the profitability of certain fund service providers, and profitability trends for certain funds; (iv) Fidelity's compensation structure for portfolio managers and key personnel, including its effects on fund profitability and the extent to which portfolio manager compensation is linked to fund performance; (v) Fidelity's fee structures and rationale for recommending different fees among categories of funds; and (vi) Fidelity's rationale for recommending which funds should have a performance adjustment component as part of their management fees.
Based on its evaluation of all of the conclusions noted above, and after considering all material factors, the Board ultimately concluded that the advisory fee structures are fair and reasonable, and that the fund's Advisory Contracts should be renewed.
Annual Report
Investment Adviser
Fidelity Management & Research Company
Boston, MA
Investment Sub-Advisers
FMR Co., Inc.
Fidelity Management & Research
(U.K.) Inc.
Fidelity Research & Analysis Company
Fidelity Investments Japan Limited
FIL Investment Advisors
FIL Investment Advisors
(U.K.) Ltd.
Fidelity Management & Research
(Hong Kong) Limited
Fidelity Management & Research
(Japan) Inc.
General Distributor
Fidelity Distributors Corporation
Boston, MA
Transfer and Service Agents
Fidelity Investments Institutional
Operations Company, Inc.
Boston, MA
Fidelity Service Company, Inc.
Boston, MA
Custodian
Brown Brothers Harriman & Co.,
Boston, MA
AHKCI-UANN-1208
1.861450.100
Fidelity®
Emerging Markets
Fund -
Class K
Annual Report
October 31, 2008
(2_fidelity_logos) (Registered_Trademark)
Contents
Chairman's Message | <Click Here> | Ned Johnson's message to shareholders. |
Performance | <Click Here> | How the fund has done over time. |
Management's Discussion | <Click Here> | The manager's review of fund performance, strategy and outlook. |
Shareholder Expense Example | <Click Here> | An example of shareholder expenses. |
Investment Changes | <Click Here> | A summary of major shifts in the fund's investments over the past six months. |
Investments | <Click Here> | A complete list of the fund's investments with their market values. |
Financial Statements | <Click Here> | Statements of assets and liabilities, operations, and changes in net assets, as well as financial highlights. |
Notes | <Click Here> | Notes to the financial statements. |
Report of Independent Registered Public Accounting Firm | <Click Here> | |
Trustees and Officers | <Click Here> | |
Board Approval of Investment Advisory Contracts and Management Fees | <Click Here> | |
To view a fund's proxy voting guidelines and proxy voting record for the 12-month period ended June 30, visit http://www.fidelity.com (search for "proxy voting guidelines") or visit the Securities and Exchange Commission's (SEC) web site at http://www.sec.gov. You may also call 1-800-544-8544 to request a free copy of the proxy voting guidelines.
Standard & Poor's, S&P and S&P 500 are registered service marks of The McGraw-Hill Companies, Inc. and have been licensed for use by Fidelity Distributors Corporation.
Other third party marks appearing herein are the property of their respective owners.
All other marks appearing herein are registered or unregistered trademarks or service marks of FMR LLC or an affiliated company.
This report and the financial statements contained herein are submitted for the general information of the shareholders of the funds. This report is not authorized for distribution to prospective investors in the funds unless preceded or accompanied by an effective prospectus.
A fund files its complete schedule of portfolio holdings with the SEC for the first and third quarters of each fiscal year on Form N-Q. Forms N-Q are available on the SEC's web site at http://www.sec.gov. A fund's Forms N-Q may be reviewed and copied at the SEC's Public Reference Room in Washington, DC. Information regarding the operation of the SEC's Public Reference Room may be obtained by calling 1-800-SEC-0330. For a complete list of a fund's portfolio holdings, view the most recent holdings listing, semiannual report, or annual report on Fidelity's web site at http://www.fidelity.com or http://www.advisor.fidelity.com, as applicable.
NOT FDIC INSURED · MAY LOSE VALUE · NO BANK GUARANTEE
Neither the funds nor Fidelity Distributors Corporation is a bank.
Annual Report
(photo_of_Edward_C_Johnson_3d)
Dear Shareholder:
Turmoil has been the watchword for the world's securities markets in 2008, with domestic and international stocks down sharply amid the global credit squeeze. A flight to quality boosted returns for U.S. Treasuries, one of the few asset classes with positive results heading into the latter stages of the year. Financial markets are always unpredictable, but there are a number of time-tested principles that can put the historical odds in your favor.
One of the basic tenets is to invest for the long term. Over time, riding out the markets' inevitable ups and downs has proven much more effective than selling into panic or chasing the hottest trend. Even missing only a few of the markets' best days can significantly diminish investor returns. Patience also affords the benefits of compounding - of earning interest on additional income or reinvested dividends and capital gains. There are tax advantages and cost benefits to consider as well. The more you sell, the more taxes you pay, and the more you trade, the higher the costs. While staying the course doesn't eliminate risk, it can considerably lessen the effect of short-term declines.
You can further manage your investing risk through diversification. And today, more than ever, geographic diversification should be taken into account. Studies indicate that asset allocation is the single most important determinant of a portfolio's long-term success. The right mix of stocks, bonds and cash - aligned to your particular risk tolerance and investment objective - is very important. Age-appropriate rebalancing is also an essential aspect of asset allocation. For younger investors, an emphasis on equities - which historically have been the best-performing asset class over time - is encouraged. As investors near their specific goal, such as retirement or sending a child to college, consideration may be given to replacing volatile assets (e.g. common stocks) with more-stable fixed investments (bonds or savings plans).
A third investment principle - investing regularly - can help lower the average cost of your purchases. Investing a certain amount of money each month or quarter helps ensure you won't pay for all your shares at market highs. This strategy - known as dollar cost averaging - also reduces unconstructive "emotion" from investing, helping shareholders avoid selling weak performers just prior to an upswing, or chasing a hot performer just before a correction.
We invite you to contact us via the Internet, through our Investor Centers or over the phone. It is our privilege to provide you the information you need to make the investments that are right for you.
Sincerely,
/s/Edward C. Johnson 3d
Edward C. Johnson 3d
Annual Report
Average annual total return reflects the change in the value of an investment, assuming reinvestment of the class' dividend income and capital gains (the profits earned upon the sale of securities that have grown in value, if any) and assuming a constant rate of performance each year. The $10,000 table and the fund's returns do not reflect the deduction of taxes that a shareholder would pay on fund distributions or the redemption of fund shares. During periods of reimbursement by Fidelity, a fund's total returns will be greater than it would be had the reimbursement not occurred. How a fund did yesterday is no guarantee of how it will do tomorrow.
Average Annual Total Returns
Periods ended October 31, 2008 | Past 1
year | Past 5
years | Past 10
years |
Class K A | -61.81% | 8.76% | 8.43% |
A The initial offering of Class K shares took place on May 9, 2008. Returns prior to May 9, 2008 are those of Emerging Markets, the original class of the fund.
$10,000 Over 10 Years
Let's say hypothetically that $10,000 was invested in Fidelity Emerging Markets Fund - Class K, a class of the fund, on October 31, 1998. The chart shows how the value of your investment would have changed, and also shows how the MSCI® Emerging Markets Index performed over the same period. The initial offering of Class K took place on May 9, 2008. See above for additional information regarding the performance of Class K.
Annual Report
Comments from Robert von Rekowsky, Portfolio Manager of Fidelity® Emerging Markets Fund
Stocks across the emerging-markets universe suffered steep losses during the 12 months ending October 31, 2008. In that time, the MSCI® Emerging Markets Index fell 56.22%. All three of the benchmark's primary regions - Europe/Middle East/Africa (EMEA), Latin America, and Asia ex Australia and New Zealand - declined by more than 50%. In EMEA, major benchmark component Russia saw its market tumble by more than 62%, while Brazil - representing the benchmark's largest weighting during the period, on average, at almost 15% - finished with a setback of more than 53%. In both cases, falling commodity prices triggered by slowing global economies had a negative impact on share prices. Meanwhile, South Korea, the second-largest benchmark component, experienced a nearly 60% drop. Chinese stocks also were hard-hit, down roughly 67%. Asian emerging markets suffered in part due to concerns about slowing exports in the wake of decelerating economic growth in the United States and Europe, as the U.S. credit crisis continued to worsen and expand its reach abroad.
During the past year, the fund's Class K shares trailed the MSCI Emerging Markets Index. (For specific class-level returns, please see the performance section of this report.) Stock selection detracted, particularly in Taiwan, South Korea, Brazil and Mexico. On a sector basis, the most damage was done through stock picking in consumer discretionary, materials, financials, telecommunication services and energy. Underweighting Israel's Teva Pharmaceutical Industries, a benchmark component, detracted from the fund's results. An industry leader in a defensive sector, Teva was more resistant to the selling pressure than most other stocks. Similar comments apply to Taiwan Semiconductor Manufacturing. Other detractors included Brazilian steel producer Siderurgica Nacional; Taiwan's Chunghwa Telecom, a benchmark constituent the fund didn't own that actually posted a small gain; wireless carrier China Mobile; and Russian natural gas producer and distributor Gazprom. Conversely, a modest cash position was beneficial, given the extreme weakness in stocks. Although fertilizer holding Israel Chemicals posted a loss, it managed to significantly outperform the benchmark. Another fertilizer stock, Russia-based Uralkali, also helped, as did underweighting and ultimately selling weak-performing benchmark component PetroChina. Egypt-based Orascom Construction, an out-of-benchmark holding, contributed as well. Many of the stocks I've mentioned were sold by period end.
The views expressed above reflect those of the portfolio manager(s) only through the end of the period as stated on the cover of this report and do not necessarily represent the views of Fidelity or any other person in the Fidelity organization. Any such views are subject to change at any time based upon market or other conditions and Fidelity disclaims any responsibility to update such views. These views may not be relied on as investment advice and, because investment decisions for a Fidelity fund are based on numerous factors, may not be relied on as an indication of trading intent on behalf of any Fidelity fund.
Annual Report
Emerging Markets
As a shareholder of the Fund, you incur two types of costs: (1) transaction costs and redemption fees, and (2) ongoing costs, including management fees and other Fund expenses. This Example is intended to help you understand your ongoing costs (in dollars) of investing in the Fund and to compare these costs with the ongoing costs of investing in other mutual funds.
The actual expense Example is based on an investment of $1,000 invested at the beginning of the period and held for the entire period (May 1, 2008 to October 31, 2008) for Emerging Markets and for the entire period (May 9, 2008 to October 31, 2008) for Class K.
The hypothetical expense Example is based on an investment of $1,000 invested for the one-half year period (May 1, 2008 to October 31, 2008).
Actual Expenses
The first line of the accompanying table for each class of the Fund provides information about actual account values and actual expenses. You may use the information in this line, together with the amount you invested, to estimate the expenses that you paid over the period. Simply divide your account value by $1,000.00 (for example, an $8,600 account value divided by $1,000.00 = 8.6), then multiply the result by the number in the first line for a class of the Fund under the heading entitled "Expenses Paid During Period" to estimate the expenses you paid on your account during this period. A small balance maintenance fee of $12.00 that is charged once a year may apply for certain accounts with a value of less than $2,000. This fee is not included in the table below. If it was, the estimate of expenses you paid during the period would be higher, and your ending account value lower, by this amount. In addition, the Fund, as a shareholder in the underlying Fidelity Central Funds, will indirectly bear its pro rata share of the fees and expenses incurred by the underlying Fidelity Central Funds. These fees and expenses are not included in the Fund's annualized expense ratio used to calculate the expense estimate in the table below.
Hypothetical Example for Comparison Purposes
The second line of the accompanying table for each class of the Fund provides information about hypothetical account values and hypothetical expenses based on a Class' actual expense ratio and an assumed rate of return of 5% per year before expenses, which is not the Class' actual return. The hypothetical account values and expenses may not be used to estimate the actual ending account balance or expenses you paid for the period. You may use this information to compare the ongoing costs of investing in the Fund and other funds. To do so, compare this 5% hypothetical example with the 5% hypothetical examples that appear in the shareholder reports of the other funds. A small balance maintenance fee of $12.00 that is charged once a year may apply for certain accounts with a value of less than $2,000. This fee is not included in the table below. If it was, the estimate of expenses you paid during the period would be higher, and your ending account value lower, by this amount. In addition, the Fund, as a shareholder in the underlying Fidelity Central Funds, will indirectly bear its pro rata share of the fees and expenses incurred by the underlying Fidelity Central Funds. These fees and expenses are not included in the Fund's annualized expense ratio used to calculate the expense estimate in the table below.
Please note that the expenses shown in the table are meant to highlight your ongoing costs only and do not reflect any transaction costs. Therefore, the second line of the table is useful in comparing ongoing costs only, and will not help you determine the relative total costs of owning different funds. In addition, if these transactional costs were included, your costs would have been higher.
| Annualized Expense Ratio | Beginning
Account Value | Ending
Account Value
October 31, 2008 | Expenses Paid
During Period |
Emerging Markets | 1.09% | | | |
Actual | | $ 1,000.00 | $ 431.10 | $ 3.92 B |
Hypothetical A | | $ 1,000.00 | $ 1,019.66 | $ 5.53 C |
Class K | .92% | | | |
Actual | | $ 1,000.00 | $ 428.90 | $ 3.16 B |
Hypothetical A | | $ 1,000.00 | $ 1,020.51 | $ 4.67 C |
A 5% return per year before expenses
B Actual expenses are equal to each Class' annualized expense ratio, multiplied by the average account value over the period, multiplied by 184/366 (to reflect the one-half year period) for Emerging Markets and multiplied by 176/366 (to reflect the period May 9, 2008 to October 31, 2008) for Class K.
C Hypothetical expenses are equal to each Class' annualized expense ratio; multiplied by the average account value over the period, multiplied by 184/366 (to reflect the one-half year period).
Annual Report
Emerging Markets
Geographic Diversification (% of fund's net assets) |
As of October 31, 2008 |
| Brazil | 15.0% | |
| South Africa | 9.3% | |
| Russia | 8.9% | |
| Korea (South) | 8.5% | |
| China | 6.6% | |
| India | 6.5% | |
| United States of America | 5.7% | |
| Taiwan | 5.5% | |
| Hong Kong | 4.9% | |
| Other | 29.1% | |

Percentages are adjusted for the effect of futures contracts, if applicable. |
|
As of April 30, 2008 |
| Brazil | 14.1% | |
| Russia | 12.5% | |
| Korea (South) | 11.8% | |
| South Africa | 6.6% | |
| Taiwan | 6.0% | |
| Hong Kong | 5.7% | |
| India | 5.6% | |
| China | 5.3% | |
| Mexico | 4.0% | |
| Other | 28.4% | |

Percentages are adjusted for the effect of futures contracts, if applicable. |
Asset Allocation |
| % of fund's
net assets | % of fund's net assets
6 months ago |
Stocks and Investment Companies | 95.1 | 98.1 |
Short-Term Investments and Net Other Assets | 4.9 | 1.9 |
Top Ten Stocks as of October 31, 2008 |
| % of fund's
net assets | % of fund's net assets
6 months ago |
Petroleo Brasileiro SA - Petrobras (PN) (non-vtg.) (Brazil, Oil, Gas & Consumable Fuels) | 3.6 | 1.9 |
OAO Gazprom sponsored ADR (Russia, Oil, Gas & Consumable Fuels) | 3.2 | 4.0 |
Companhia Vale do Rio Doce (PN-A) sponsored ADR (Brazil, Metals & Mining) | 2.7 | 3.5 |
Samsung Electronics Co. Ltd. (Korea (South), Semiconductors & Semiconductor Equipment) | 2.7 | 2.9 |
China Mobile (Hong Kong) Ltd. (Hong Kong, Wireless Telecommunication Services) | 2.2 | 3.5 |
America Movil SAB de CV Series L sponsored ADR (Mexico, Wireless Telecommunication Services) | 1.9 | 2.1 |
Industrial & Commercial Bank of China (China, Commercial Banks) | 1.9 | 1.0 |
MTN Group Ltd. (South Africa, Wireless Telecommunication Services) | 1.8 | 1.1 |
Banco Bradesco SA (PN) (Brazil, Commercial Banks) | 1.8 | 1.2 |
China Construction Bank Corp. (H Shares) (China, Commercial Banks) | 1.8 | 1.4 |
| 23.6 | |
Market Sectors as of October 31, 2008 |
| % of fund's
net assets | % of fund's net assets
6 months ago |
Financials | 24.9 | 21.1 |
Energy | 15.7 | 19.1 |
Materials | 11.2 | 17.9 |
Telecommunication Services | 10.3 | 9.4 |
Information Technology | 10.0 | 8.1 |
Industrials | 5.9 | 10.7 |
Consumer Staples | 6.0 | 3.3 |
Consumer Discretionary | 4.9 | 6.1 |
Utilities | 4.8 | 2.1 |
Health Care | 1.4 | 0.1 |
Annual Report
Emerging Markets
Showing Percentage of Net Assets
Common Stocks - 95.0% |
| Shares | | Value |
Australia - 0.1% |
Sino Gold Mining Ltd. (a) | 772,602 | | $ 1,778,599 |
Austria - 0.3% |
Erste Bank AG | 120,100 | | 3,201,864 |
Raiffeisen International Bank-Holding AG (e) | 93,500 | | 2,942,200 |
TOTAL AUSTRIA | | 6,144,064 |
Bahrain - 0.4% |
Gulf Finance House BSC: | | | |
(Reg. S) unit | 103,000 | | 1,751,000 |
GDR (f) | 442,090 | | 7,515,530 |
TOTAL BAHRAIN | | 9,266,530 |
Bermuda - 1.3% |
Aquarius Platinum Ltd. (Australia) | 1,471,059 | | 2,907,395 |
Central European Media Enterprises Ltd. Class A (a) | 114,600 | | 3,060,966 |
Credicorp Ltd. (NY Shares) | 284,500 | | 11,172,315 |
Dufry South America Ltd. unit | 472,943 | | 2,906,451 |
Ports Design Ltd. | 4,436,500 | | 5,157,774 |
West Siberian Resources Ltd. SDR (a) | 7,038,735 | | 2,846,230 |
TOTAL BERMUDA | | 28,051,131 |
Brazil - 14.9% |
America Latina Logistica SA unit | 1,128,200 | | 5,202,586 |
Anhanguera Educacional Participacoes SA unit | 410,059 | | 3,031,579 |
Banco Bradesco SA: | | | |
(PN) | 3,165,600 | | 36,348,378 |
(PN) sponsored ADR | 257,000 | | 3,006,900 |
Banco Daycoval SA (PN) | 1,030,400 | | 2,571,001 |
Banco do Brasil SA | 2,057,900 | | 13,597,620 |
Companhia de Saneamento de Minas Gerais | 12,700 | | 80,395 |
Companhia Energetica de Minas Gerais (CEMIG) (PN) sponsored ADR (non-vtg.) | 971,900 | | 14,782,599 |
Companhia Siderurgica Nacional SA (CSN) sponsored ADR (e) | 1,301,000 | | 17,693,600 |
Companhia Vale do Rio Doce (PN-A) sponsored ADR | 5,068,300 | | 59,349,793 |
GVT Holding SA (a) | 699,900 | | 7,616,045 |
Localiza Rent a Car SA | 2,233,800 | | 8,670,141 |
MRV Engenharia e Participacoes SA | 685,000 | | 3,548,124 |
Multiplan Empreendimentos Imobiliarios SA (a) | 396,900 | | 1,997,154 |
Net Servicos de Comunicacao SA sponsored ADR (e) | 2,153,766 | | 14,085,630 |
Petroleo Brasileiro SA - Petrobras: | | | |
(PN) (non-vtg.) | 3,175,400 | | 34,245,373 |
(PN) sponsored ADR (non-vtg.) | 1,985,100 | | 43,811,157 |
sponsored ADR | 334,900 | | 9,005,461 |
Redecard SA | 1,083,700 | | 11,772,381 |
SLC Agricola SA | 1,000 | | 5,175 |
|
| Shares | | Value |
Uniao de Bancos Brasileiros SA (Unibanco): | | | |
unit | 1,579,300 | | $ 9,778,496 |
GDR | 218,900 | | 13,808,212 |
Votorantim Celulose e Papel SA sponsored ADR (non-vtg.) (e) | 964,100 | | 9,727,769 |
TOTAL BRAZIL | | 323,735,569 |
British Virgin Islands - 0.0% |
Thunderbird Resorts, Inc. (a)(f) | 331,900 | | 1,161,650 |
Titanium Resources Group Ltd. (a) | 279,100 | | 37,726 |
TOTAL BRITISH VIRGIN ISLANDS | | 1,199,376 |
Canada - 0.2% |
Addax Petroleum, Inc. | 63,900 | | 953,890 |
Addax Petroleum, Inc. (f) | 20,700 | | 309,006 |
SouthGobi Energy Resources Ltd. (a) | 336,400 | | 2,343,473 |
TOTAL CANADA | | 3,606,369 |
Cayman Islands - 1.2% |
Chaoda Modern Agriculture (Holdings) Ltd. | 18,713,063 | | 13,183,766 |
China Aoyuan Property Group Ltd. | 596,000 | | 54,857 |
China Dongxiang Group Co. Ltd. | 16,516,000 | | 4,858,875 |
Suntech Power Holdings Co. Ltd. sponsored ADR (a) | 153,200 | | 2,681,000 |
The United Laboratories International Holdings Ltd. | 7,120,000 | | 1,690,137 |
Yingli Green Energy Holding Co. Ltd. ADR (a)(e) | 583,400 | | 3,074,518 |
TOTAL CAYMAN ISLANDS | | 25,543,153 |
China - 6.6% |
China Coal Energy Co. Ltd. (H Shares) | 12,160,700 | | 7,375,477 |
China Construction Bank Corp. (H Shares) (e) | 76,860,000 | | 38,128,401 |
China Gas Holdings Ltd. (e) | 19,410,000 | | 1,597,724 |
China Merchants Bank Co. Ltd. (H Shares) | 11,671,000 | | 17,880,415 |
China South Locomotive & Rolling Stock Corp. Ltd. (H Shares) | 15,635,000 | | 5,660,321 |
China Yurun Food Group Ltd. | 3,935,000 | | 4,676,975 |
Golden Eagle Retail Group Ltd. (H Shares) (e) | 8,449,000 | | 4,417,337 |
Industrial & Commercial Bank of China | 86,899,000 | | 40,887,498 |
Ping An Insurance (Group) Co. of China, Ltd. (H Shares) | 3,175,000 | | 13,578,518 |
Yantai Changyu Pioneer Wine Co. (B Shares) | 1,408,650 | | 4,377,350 |
ZTE Corp. (H Shares) | 1,854,400 | | 4,193,147 |
TOTAL CHINA | | 142,773,163 |
Cyprus - 0.1% |
Mirland Development Corp. PLC (a) | 932,005 | | 1,202,465 |
XXI Century Investments Public Ltd. (a) | 468,000 | | 243,761 |
TOTAL CYPRUS | | 1,446,226 |
Common Stocks - continued |
| Shares | | Value |
Czech Republic - 2.5% |
Ceske Energeticke Zavody AS | 712,200 | | $ 30,819,532 |
Komercni Banka AS | 105,000 | | 15,746,790 |
Philip Morris CR AS | 30,350 | | 8,430,332 |
TOTAL CZECH REPUBLIC | | 54,996,654 |
Egypt - 1.3% |
Commercial International Bank Ltd. sponsored GDR (e) | 2,018,726 | | 8,983,331 |
Eastern Tobacco Co. | 183,045 | | 7,081,741 |
Orascom Construction Industries SAE GDR | 132,012 | | 8,844,804 |
Telecom Egypt SAE | 1,501,400 | | 3,631,443 |
TOTAL EGYPT | | 28,541,319 |
Georgia - 0.1% |
Bank of Georgia unit (a) | 225,200 | | 1,565,140 |
Hong Kong - 4.9% |
China Mobile (Hong Kong) Ltd. | 5,392,400 | | 47,470,698 |
China Resources Power Holdings Co. Ltd. | 8,701,500 | | 17,005,727 |
CNOOC Ltd. | 28,941,000 | | 23,762,715 |
CNOOC Ltd. sponsored ADR (e) | 47,000 | | 3,839,430 |
CNPC (Hong Kong) Ltd. | 43,276,000 | | 13,268,622 |
REXCAPITAL Financial Holdings Ltd. (a) | 69,720,000 | | 1,288,336 |
TOTAL HONG KONG | | 106,635,528 |
India - 6.5% |
Axis Bank Ltd. | 383,781 | | 4,457,572 |
Axis Bank Ltd. GDR (Reg. S) | 481,200 | | 5,774,400 |
Bank of India | 1,492,779 | | 7,422,377 |
Bharti Airtel Ltd. (a) | 732,978 | | 9,924,663 |
Educomp Solutions Ltd. | 96,188 | | 4,500,027 |
Housing Development Finance Corp. Ltd. | 611,449 | | 22,255,918 |
Indian Overseas Bank | 3,790,657 | | 5,820,784 |
Infosys Technologies Ltd. sponsored ADR (e) | 910,000 | | 26,681,200 |
ITC Ltd. | 1,500 | | 4,789 |
Larsen & Toubro Ltd. | 757,236 | | 12,657,311 |
Reliance Industries Ltd. | 274,567 | | 7,804,584 |
Rolta India Ltd. | 2,170,765 | | 8,323,803 |
Satyam Computer Services Ltd. | 1,597,781 | | 10,101,600 |
Sintex Industries Ltd. | 1,483,223 | | 4,512,324 |
Tata Power Co. Ltd. | 853,306 | | 12,178,900 |
TOTAL INDIA | | 142,420,252 |
Indonesia - 2.4% |
PT Bayan Resources Group Tbk | 13,528,500 | | 2,089,261 |
PT Astra International Tbk | 9,794,500 | | 8,228,486 |
PT Bank Mandiri Persero Tbk | 16,170,000 | | 2,340,966 |
PT Bank Rakyat Indonesia Tbk | 39,267,000 | | 12,125,658 |
PT Bumi Resources Tbk | 77,031,500 | | 10,085,465 |
PT Perusahaan Gas Negara Tbk
Series B | 108,029,100 | | 13,730,188 |
|
| Shares | | Value |
PT Telkomunikasi Indonesia Tbk: | | | |
Series B | 2,533,000 | | $ 1,278,966 |
sponsored ADR (e) | 87,400 | | 1,751,496 |
TOTAL INDONESIA | | 51,630,486 |
Ireland - 0.1% |
Dragon Oil PLC (a) | 1,064,000 | | 2,752,626 |
Israel - 2.9% |
Cellcom Israel Ltd. | 355,200 | | 10,464,192 |
Check Point Software Technologies Ltd. (a) | 617,700 | | 12,489,894 |
Israel Chemicals Ltd. | 2,758,200 | | 26,736,475 |
Orpak Systems Ltd. | 631,800 | | 1,035,546 |
Teva Pharmaceutical Industries Ltd. sponsored ADR | 273,300 | | 11,719,104 |
TOTAL ISRAEL | | 62,445,211 |
Kazakhstan - 0.6% |
JSC Halyk Bank of Kazakhstan unit | 857,000 | | 3,642,250 |
KazMunaiGas Exploration & Production JSC (Reg. S) GDR | 615,859 | | 8,622,026 |
TOTAL KAZAKHSTAN | | 12,264,276 |
Korea (South) - 8.5% |
CJ CheilJedang Corp. (a) | 51,965 | | 6,069,219 |
Doosan Co. Ltd. (a) | 186,370 | | 13,559,690 |
KB Financial Group, Inc. (a) | 188,243 | | 4,727,285 |
Korea Gas Corp. | 320,898 | | 12,121,545 |
KT&G Corp. | 277,590 | | 17,871,433 |
LG Household & Health Care Ltd. | 70,560 | | 10,110,908 |
LIG Non-Life Insurance Co. Ltd. | 202,240 | | 2,362,256 |
MegaStudy Co. Ltd. | 87,151 | | 9,826,936 |
Meritz Fire & Marine Insurance Co. Ltd. | 2,387,760 | | 8,792,862 |
NHN Corp. (a) | 127,426 | | 13,602,872 |
Samsung Electronics Co. Ltd. | 138,466 | | 58,556,960 |
Shinhan Financial Group Co. Ltd. | 681,340 | | 16,627,078 |
Taewoong Co. Ltd. | 234,549 | | 11,457,105 |
TOTAL KOREA (SOUTH) | | 185,686,149 |
Lebanon - 0.3% |
Solidere GDR | 333,800 | | 7,093,250 |
Luxembourg - 0.7% |
Evraz Group SA GDR | 295,200 | | 4,546,080 |
MHP SA: | | | |
GDR (a)(f) | 584,500 | | 2,338,000 |
GDR (Reg. S) | 30,000 | | 120,000 |
Millicom International Cellular SA | 184,900 | | 7,396,000 |
TOTAL LUXEMBOURG | | 14,400,080 |
Malaysia - 1.3% |
DiGi.com Bhd | 2,484,000 | | 12,923,908 |
KNM Group Bhd | 32,098,500 | | 5,442,824 |
Common Stocks - continued |
| Shares | | Value |
Malaysia - continued |
Parkson Holdings Bhd | 10,410 | | $ 9,873 |
Public Bank Bhd | 4,442,200 | | 10,556,191 |
TOTAL MALAYSIA | | 28,932,796 |
Mexico - 3.5% |
America Movil SAB de CV Series L sponsored ADR | 1,352,200 | | 41,837,068 |
Banco Compartamos SA de CV | 1,766,500 | | 3,000,856 |
Cemex SA de CV sponsored ADR (e) | 1,294,900 | | 9,789,444 |
Fomento Economico Mexicano SA de CV sponsored ADR | 84,400 | | 2,134,476 |
Grupo Financiero Banorte SA de CV Series O | 7,566,200 | | 13,857,660 |
Urbi, Desarrollos Urbanos, SA de CV (a) | 4,021,800 | | 6,026,455 |
TOTAL MEXICO | | 76,645,959 |
Netherlands - 0.1% |
New World Resources BV | 267,400 | | 1,325,732 |
Nigeria - 0.3% |
Guaranty Trust Bank PLC: | | | |
(Reg. S) unit | 626,181 | | 3,443,996 |
sponsored GDR (f) | 480,872 | | 2,644,796 |
TOTAL NIGERIA | | 6,088,792 |
Oman - 0.4% |
BankMuscat SAOG sponsored GDR | 886,000 | | 8,151,200 |
Panama - 0.3% |
Intergroup Financial Services Corp. | 285,840 | | 3,144,240 |
Intergroup Financial Services Corp. (a)(f) | 222,096 | | 2,443,056 |
TOTAL PANAMA | | 5,587,296 |
Papua New Guinea - 0.3% |
Oil Search Ltd. | 2,093,978 | | 6,340,571 |
Peru - 0.4% |
Compania de Minas Buenaventura SA sponsored ADR | 681,600 | | 8,615,424 |
Philippines - 0.5% |
Ayala Corp. | 812,160 | | 3,875,746 |
Megaworld Corp. | 33,834,000 | | 540,512 |
Security Bank Corp. | 2,584,300 | | 2,064,264 |
SM Investments Corp. | 1,302,957 | | 5,283,881 |
TOTAL PHILIPPINES | | 11,764,403 |
Poland - 0.8% |
Kopex SA (a) | 9,870 | | 42,840 |
Powszechna Kasa Oszczednosci
Bank SA | 1,363,500 | | 15,288,639 |
Trakcja Polska SA | 930,950 | | 1,562,415 |
TOTAL POLAND | | 16,893,894 |
Romania - 0.1% |
Banca Transilvania SA (a) | 1,650,048 | | 1,501,424 |
|
| Shares | | Value |
Russia - 8.9% |
Bank St. Petersburg OJSC | 2,635,369 | | $ 3,294,211 |
Comstar United TeleSystems OJSC GDR (Reg. S) | 554,415 | | 1,546,818 |
LSR Group OJSC (a) | 124,500 | | 1,120,500 |
Lukoil Oil Co. sponsored ADR | 607,059 | | 23,553,889 |
Magnit OJSC GDR (Reg. S) (a) | 371,000 | | 1,669,500 |
Mobile TeleSystems OJSC sponsored ADR | 360,000 | | 14,094,000 |
OAO Gazprom sponsored ADR | 3,349,381 | | 68,494,837 |
OAO NOVATEK GDR | 223,202 | | 8,816,479 |
OAO Raspadskaya | 1,580,000 | | 3,318,000 |
OAO TMK | 752,400 | | 1,504,800 |
OJSC Rosneft unit | 1,197,100 | | 5,506,660 |
Pharmstandard OJSC unit (a) | 213,230 | | 3,411,680 |
Rosinter Restaurants Holding (a) | 108,200 | | 3,029,600 |
Sberbank (Savings Bank of the Russian Federation) | 9,855,100 | | 10,249,304 |
Sberbank (Savings Bank of the Russian Federation) GDR | 26,800 | | 4,915,546 |
Uralkali JSC | 1,542,600 | | 7,095,960 |
Uralkali JSC GDR (Reg. S) | 250,500 | | 5,232,945 |
Vimpel Communications sponsored
ADR | 1,165,300 | | 16,896,850 |
VSMPO-Avisma Corp. | 16,600 | | 913,000 |
Wimm-Bill-Dann Foods OJSC sponsored ADR (a)(e) | 200,375 | | 8,804,478 |
TOTAL RUSSIA | | 193,469,057 |
Singapore - 0.2% |
Straits Asia Resources Ltd. | 6,756,000 | | 4,501,054 |
Slovenia - 0.1% |
Nova Kreditna banka Maribor d.d. | 105,899 | | 1,899,832 |
South Africa - 9.3% |
African Bank Investments Ltd. | 4,412,426 | | 12,013,360 |
African Rainbow Minerals Ltd. | 830,551 | | 8,416,023 |
Aspen Pharmacare Holdings Ltd. | 3,834,820 | | 13,345,331 |
Aveng Ltd. | 2,269,600 | | 11,148,219 |
Bell Equipment Ltd. | 713,316 | | 1,022,152 |
Exxaro Resources Ltd. | 1,813,112 | | 11,951,322 |
FirstRand Ltd. | 10,389,456 | | 14,877,020 |
Harmony Gold Mining Co. Ltd. sponsored ADR (a) | 1,185,800 | | 8,668,198 |
Illovo Sugar Ltd. | 2,577,194 | | 5,697,788 |
Impala Platinum Holdings Ltd. | 1,263,928 | | 13,053,258 |
Mr. Price Group Ltd. | 5,031,447 | | 12,359,747 |
MTN Group Ltd. | 3,566,300 | | 39,787,789 |
Murray & Roberts Holdings Ltd. | 2,149,500 | | 14,516,275 |
Northam Platinum Ltd. | 994,250 | | 3,103,851 |
Raubex Group Ltd. | 4,143,363 | | 10,708,282 |
Sasol Ltd. sponsored ADR | 441,000 | | 12,758,130 |
Shoprite Holdings Ltd. | 1,661,135 | | 8,756,239 |
TOTAL SOUTH AFRICA | | 202,182,984 |
Common Stocks - continued |
| Shares | | Value |
Switzerland - 0.2% |
Orascom Development Holding AG | 150,334 | | $ 4,321,267 |
Taiwan - 5.5% |
Acer, Inc. | 5,742,000 | | 7,476,699 |
Asia Cement Corp. | 7,273,720 | | 4,278,010 |
China Steel Corp. | 19,765,038 | | 14,411,071 |
First Financial Holding Co. Ltd. | 35,018,588 | | 16,508,687 |
Fubon Financial Holding Co. Ltd. | 21,655,000 | | 13,130,211 |
Hon Hai Precision Industry Co. Ltd. (Foxconn) | 10,335,302 | | 25,066,672 |
HTC Corp. | 1,958,300 | | 23,361,863 |
Siliconware Precision Industries
Co. Ltd. | 15,752,633 | | 16,189,609 |
TOTAL TAIWAN | | 120,422,822 |
Thailand - 1.9% |
Mermaid Maritime PLC | 434,000 | | 93,837 |
Minor International PCL (For. Reg.) | 37,157,274 | | 8,139,987 |
PTT Exploration & Production PCL (For. Reg.) | 4,729,100 | | 11,800,757 |
Siam Commercial Bank PCL
(For. Reg.) | 11,232,800 | | 17,437,119 |
Total Access Communication PCL: | | | |
unit | 1,696,944 | | 1,212,837 |
(For. Reg.) | 4,265,656 | | 3,032,388 |
TOTAL THAILAND | | 41,716,925 |
Turkey - 3.5% |
Anadolu Efes Biracilik ve Malt Sanyii AS | 2,560,665 | | 21,566,289 |
Asya Katilim Bankasi AS | 10,605,468 | | 9,275,619 |
Bagfas Bandirma Gubre
Fabrikalari AS | 94,000 | | 4,506,495 |
Enka Insaat ve Sanayi AS | 2,550,963 | | 9,502,794 |
Tupras-Turkiye Petrol Rafinerileri AS | 1,303,400 | | 16,466,133 |
Turkiye Garanti Bankasi AS (a) | 8,888,895 | | 14,512,012 |
TOTAL TURKEY | | 75,829,342 |
United Arab Emirates - 0.0% |
Depa Ltd. GDR (a)(f) | 234,100 | | 749,120 |
United Kingdom - 0.7% |
Eurasian Natural Resources Corp. PLC | 715,102 | | 3,576,085 |
Prosperity Mineral Holdings Ltd. | 581,300 | | 206,879 |
Randgold Resources Ltd. sponsored ADR | 257,700 | | 7,991,277 |
Sibir Energy PLC (a) | 995,544 | | 3,960,983 |
TOTAL UNITED KINGDOM | | 15,735,224 |
United States of America - 0.8% |
Central European Distribution Corp. (a)(e) | 225,400 | | 6,489,266 |
|
| Shares | | Value |
CTC Media, Inc. (a) | 967,817 | | $ 7,161,846 |
Freeport-McMoRan Copper & Gold, Inc. Class B | 154,100 | | 4,484,310 |
TOTAL UNITED STATES OF AMERICA | | 18,135,422 |
TOTAL COMMON STOCKS (Cost $2,985,236,639) | 2,064,785,691 |
Nonconvertible Preferred Stocks - 0.1% |
| | | |
Brazil - 0.1% |
Usinas Siderurgicas de Minas Gerais SA - Usiminas (PN-A) (non-vtg.)
(Cost $9,734,995) | 235,400 | | $ 3,012,929 |
Convertible Bonds - 0.0% |
| Principal Amount (d) | | |
Brazil - 0.0% |
Companhia de Saneamento de Minas Gerais 8.55% 6/1/13 (g)(h)
(Cost $308,511) | BRL | 4,841 | | 122,580 |
Money Market Funds - 6.2% |
| Shares | | |
Fidelity Cash Central Fund, 1.81% (b) | 71,241,239 | | 71,241,239 |
Fidelity Securities Lending Cash Central Fund, 2.67% (b)(c) | 62,546,778 | | 62,546,778 |
TOTAL MONEY MARKET FUNDS (Cost $133,788,017) | 133,788,017 |
TOTAL INVESTMENT
PORTFOLIO - 101.3% (Cost $3,129,068,162) | | 2,201,709,217 |
NET OTHER ASSETS - (1.3)% | | (28,085,536) |
NET ASSETS - 100% | $ 2,173,623,681 |
Currency Abbreviation |
BRL | - | Brazilian real |
Legend |
(a) Non-income producing |
(b) Affiliated fund that is available only to investment companies and other accounts managed by Fidelity Investments. The rate quoted is the annualized seven-day yield of the fund at period end. A complete unaudited listing of the fund's holdings as of its most recent quarter end is available upon request. |
(c) Investment made with cash collateral received from securities on loan. |
(d) Principal amount is stated in United States dollars unless otherwise noted. |
(e) Security or a portion of the security is on loan at period end. |
(f) Security exempt from registration under Rule 144A of the Securities Act of 1933. These securities may be resold in transactions exempt from registration, normally to qualified institutional buyers. At the end of the period, the value of these securities amounted to $17,161,158 or 0.8% of net assets. |
(g) The coupon rate shown on floating or adjustable rate securities represents the rate at period end. |
(h) Restricted securities - Investment in securities not registered under the Securities Act of 1933 (excluding 144A issues). At the end of the period, the value of restricted securities (excluding 144A issues) amounted to $122,580 or 0.0% of net assets. |
Additional information on each holding is as follows: |
Security | Acquisition Date | Acquisition Cost |
Companhia de Saneamento de Minas Gerais 8.55% 6/1/13 | 8/22/07 | $ 308,511 |
Affiliated Central Funds |
Information regarding fiscal year to date income earned by the Fund from investments in Fidelity Central Funds is as follows: |
Fund | Income earned |
Fidelity Cash Central Fund | $ 3,390,485 |
Fidelity Securities Lending Cash Central Fund | 830,027 |
Total | $ 4,220,512 |
Income Tax Information |
At October 31, 2008, the fund had a capital loss carryforward of approximately $515,443,831 all of which will expire on October 31, 2016. |
See accompanying notes which are an integral part of the financial statements.
Annual Report
Emerging Markets
Statement of Assets and Liabilities
| October 31, 2008 |
| | |
Assets | | |
Investment in securities, at value (including securities loaned of $60,505,367) -
See accompanying schedule: Unaffiliated issuers
(cost $2,995,280,145) | $ 2,067,921,200 | |
Fidelity Central Funds
(cost $133,788,017) | 133,788,017 | |
Total Investments
(cost $3,129,068,162) | | $ 2,201,709,217 |
Cash | | 798,812 |
Foreign currency held at value
(cost $377,043) | | 371,411 |
Receivable for investments sold | | 21,135,254 |
Receivable for fund shares sold | | 7,515,316 |
Dividends receivable | | 9,835,504 |
Interest receivable | | 73 |
Distributions receivable from Fidelity Central Funds | | 153,331 |
Prepaid expenses | | 1,550 |
Other receivables | | 2,025,675 |
Total assets | | 2,243,546,143 |
| | |
Liabilities | | |
Payable for investments purchased | $ 1,214,674 | |
Payable for fund shares redeemed | 2,779,848 | |
Accrued management fee | 1,392,020 | |
Other affiliated payables | 914,510 | |
Other payables and accrued expenses | 1,074,632 | |
Collateral on securities loaned, at value | 62,546,778 | |
Total liabilities | | 69,922,462 |
| | |
Net Assets | | $ 2,173,623,681 |
Net Assets consist of: | | |
Paid in capital | | $ 3,607,387,257 |
Undistributed net investment income | | 43,729,580 |
Accumulated undistributed net realized gain (loss) on investments and foreign currency transactions | | (550,119,889) |
Net unrealized appreciation (depreciation) on investments and assets and liabilities in foreign currencies | | (927,373,267) |
Net Assets | | $ 2,173,623,681 |
Statement of Assets and Liabilities - continued
| October 31, 2008 |
| | |
Emerging Markets:
Net Asset Value, offering price and redemption price per share ($2,086,196,235 ÷ 152,164,731 shares) | | $ 13.71 |
| | |
Class K:
Net Asset Value, offering price and redemption price per share ($87,427,446 ÷ 6,370,238 shares) | | $ 13.72 |
See accompanying notes which are an integral part of the financial statements.
Annual Report
Statement of Operations
| Year ended October 31, 2008 |
| | |
Investment Income | | |
Dividends | | $ 125,836,277 |
Special dividends | | 16,131,115 |
Interest | | 94,334 |
Income from Fidelity Central Funds (including $830,027 from security lending) | | 4,220,512 |
| | 146,282,238 |
Less foreign taxes withheld | | (13,018,239) |
Total income | | 133,263,999 |
| | |
Expenses | | |
Management fee | $ 38,002,889 | |
Transfer agent fees | 11,879,816 | |
Accounting and security lending fees | 1,560,904 | |
Custodian fees and expenses | 4,909,985 | |
Independent trustees' compensation | 23,456 | |
Registration fees | 255,657 | |
Audit | 137,844 | |
Legal | 27,329 | |
Interest | 1,754 | |
Miscellaneous | 598,603 | |
Total expenses before reductions | 57,398,237 | |
Expense reductions | (2,735,376) | 54,662,861 |
Net investment income (loss) | | 78,601,138 |
Realized and Unrealized Gain (Loss) Net realized gain (loss) on: | | |
Investment securities: | | |
Unaffiliated issuers (net of foreign taxes of $2,740,177) | (540,020,009) | |
Foreign currency transactions | (5,265,584) | |
Total net realized gain (loss) | | (545,285,593) |
Change in net unrealized appreciation (depreciation) on: Investment securities (net of decrease in deferred foreign taxes of $11,693,088) | (3,580,625,871) | |
Assets and liabilities in foreign currencies | (1,146,382) | |
Total change in net unrealized appreciation (depreciation) | | (3,581,772,253) |
Net gain (loss) | | (4,127,057,846) |
Net increase (decrease) in net assets resulting from operations | | $ (4,048,456,708) |
Statement of Changes in Net Assets
| Year ended
October 31,
2008 | Year ended
October 31,
2007 |
Increase (Decrease) in Net Assets | | |
Operations | | |
Net investment income (loss) | $ 78,601,138 | $ 36,797,945 |
Net realized gain (loss) | (545,285,593) | 281,676,020 |
Change in net unrealized appreciation (depreciation) | (3,581,772,253) | 2,077,424,629 |
Net increase (decrease) in net assets resulting from operations | (4,048,456,708) | 2,395,898,594 |
Distributions to shareholders from net investment income | (34,024,353) | (28,224,601) |
Distributions to shareholders from net realized gain | (245,333,468) | - |
Total distributions | (279,357,821) | (28,224,601) |
Share transactions - net increase (decrease) | (112,421,513) | 1,233,682,324 |
Redemption fees | 4,815,140 | 2,543,001 |
Total increase (decrease) in net assets | (4,435,420,902) | 3,603,899,318 |
| | |
Net Assets | | |
Beginning of period | 6,609,044,583 | 3,005,145,265 |
End of period (including undistributed net investment income of $43,729,580 and undistributed net investment income of $25,569,936, respectively) | $ 2,173,623,681 | $ 6,609,044,583 |
See accompanying notes which are an integral part of the financial statements.
Annual Report
Financial Highlights - Emerging Markets
Years ended October 31, | 2008 | 2007 | 2006 | 2005 | 2004 |
Selected Per-Share Data | | | | | |
Net asset value, beginning of period | $ 37.55 | $ 22.04 | $ 15.71 | $ 11.30 | $ 9.81 |
Income from Investment Operations | | | | | |
Net investment income (loss) B | .42E | .25 | .21 | .21 | .14 |
Net realized and unrealized gain (loss) | (22.73) | 15.44 | 6.31 | 4.30 | 1.46 |
Total from investment operations | (22.31) | 15.69 | 6.52 | 4.51 | 1.60 |
Distributions from net investment income | (.19) | (.20) | (.21) | (.11) | (.12) |
Distributions from net realized gain | (1.37) | - | - | - | - |
Total distributions | (1.56) | (.20) | (.21) | (.11) | (.12) |
Redemption fees added to paid in capitalB | .03 | .02 | .02 | .01 | .01 |
Net asset value, end of period | $ 13.71 | $ 37.55 | $ 22.04 | $ 15.71 | $ 11.30 |
Total ReturnA | (61.84)% | 71.81% | 41.96% | 40.25% | 16.48% |
Ratios to Average Net AssetsC, F | | | | | |
Expenses before reductions | 1.07% | 1.05% | 1.11% | 1.16% | 1.23% |
Expenses net of fee waivers, if any | 1.07% | 1.05% | 1.11% | 1.16% | 1.23% |
Expenses net of all reductions | 1.02% | .99% | 1.01% | 1.07% | 1.18% |
Net investment income (loss) | 1.47%E | .89% | 1.04% | 1.53% | 1.27% |
Supplemental Data | | | | | |
Net assets, end of period (000 omitted) | $ 2,086,196 | $ 6,609,045 | $ 3,005,145 | $ 1,392,223 | $ 604,550 |
Portfolio turnover rateD | 63% | 52% | 66% | 68% | 112% |
A Total returns would have been lower had certain expenses not been reduced during the periods shown. B Calculated based on average shares outstanding during the period. C Fees and expenses of the underlying Fidelity Central Funds are not included in the Fund's expense ratio. The Fund indirectly bears its proportionate share of the expenses of any underlying Fidelity Central Funds. D Amount does not include the portfolio activity of any underlying Fidelity Central Funds. E Investment income per share reflects a special dividend which amounted to $.09 per share. Excluding the special dividend, the ratio of net investment income (loss) to average net assets would have been 1.17%. F Expense ratios reflect operating expenses of the class. Expenses before reductions do not reflect amounts reimbursed by the investment adviser or reductions from brokerage service arrangements or other expense offset arrangements and do not represent the amount paid by the class during periods when reimbursements or reductions occur. Expenses net of fee waivers reflect expenses after reimbursement by the investment adviser but prior to reductions from brokerage service arrangements or other expense offset arrangements. Expenses net of all reductions represent the net expenses paid by the class. |
Financial Highlights - Class K
Year ended October 31, | 2008 H |
Selected Per-Share Data | |
Net asset value, beginning of period | $ 31.99 |
Income from Investment Operations | |
Net investment income (loss) D | .15 G |
Net realized and unrealized gain (loss) | (18.43) |
Total from investment operations | (18.28) |
Redemption fees added to paid in capital D | .01 |
Net asset value, end of period | $ 13.72 |
Total Return B, C | (57.11)% |
Ratios to Average Net Assets E, I | |
Expenses before reductions | .92% A |
Expenses net of fee waivers, if any | .92% A |
Expenses net of all reductions | .87% A |
Net investment income (loss) | 2.02% A, G |
Supplemental Data | |
Net assets, end of period (000 omitted) | $ 87,427 |
Portfolio turnover rate F | 63% |
A Annualized B Total returns for periods of less than one year are not annualized. C Total returns would have been lower had certain expenses not been reduced during the periods shown. D Calculated based on average shares outstanding during the period. E Fees and expenses of the underlying Fidelity Central Funds are not included in the Fund's expense ratio. The Fund indirectly bears its proportionate share of the expenses of any underlying Fidelity Central Funds. F Amount does not include the portfolio activity of any underlying Fidelity Central Funds. G Investment income per share reflects a special dividend which amounted to $.02 per share. Excluding the special dividend, the ratio of net investment income (loss) to average net assets would have been 1.71%. H For the period May 9, 2008 (commencement of sale of shares) to October 31, 2008. I Expense ratios reflect operating expenses of the class. Expenses before reductions do not reflect amounts reimbursed by the investment adviser or reductions from brokerage service arrangements or other expense offset arrangements and do not represent the amount paid by the class during periods when reimbursements or reductions occur. Expense ratios before reductions for start-up periods may not be representative of longer-term operating periods. Expenses net of fee waivers reflect expenses after reimbursement by the investment adviser but prior to reductions from brokerage service arrangements or other expense offset arrangements. Expenses net of all reductions represent the net expenses paid by the class. |
See accompanying notes which are an integral part of the financial statements.
Annual Report
Emerging Markets
Notes to Financial Statements
For the period ended October 31, 2008
1. Organization.
Fidelity Emerging Markets Fund (the Fund) is a fund of Fidelity Investment Trust (the trust) and is authorized to issue an unlimited number of shares. The trust is registered under the Investment Company Act of 1940, as amended (the 1940 Act), as an open-end management investment company organized as a Massachusetts business trust. On January 17, 2008, the Board of Trustees approved the creation of an additional class of shares. The Fund commenced sale of Class K shares and the existing class was designated Emerging Markets on May 9, 2008. The Fund offers Emerging Markets and Class K shares, each of which has equal rights as to assets and voting privileges. Each class has exclusive voting rights with respect to matters that affect that class. Investment income, realized and unrealized capital gains and losses, the common expenses of the Fund, and certain fund-level expense reductions, if any, are allocated on a pro rata basis to each class based on the relative net assets of each class to the total net assets of the Fund. Each class differs with respect to transfer agent fees incurred. Certain expense reductions also differ by class. The Fund's investments in emerging markets can be subject to social, economic, regulatory, and political uncertainties and can be extremely volatile.
2. Investments in Fidelity Central Funds.
The Fund may invest in Fidelity Central Funds, which are open-end investment companies available only to other investment companies and accounts managed by Fidelity Management & Research Company (FMR) and its affiliates. The Fund's Schedule of Investments lists each of the Fidelity Central Funds held as of period end, if any, as an investment of the Fund, but does not include the underlying holdings of each Fidelity Central Fund. As an Investing Fund, the Fund indirectly bears its proportionate share of the expenses of the underlying Fidelity Central Funds.
The Money Market Central Funds seek preservation of capital and current income and are managed by Fidelity Investments Money Management, Inc. (FIMM), an affiliate of FMR.
A complete unaudited list of holdings for each Fidelity Central Fund is available upon request or at the SEC's web site at www.sec.gov. In addition, the financial statements of the Fidelity Central Funds are available on the SEC's web site or upon request.
3. Significant Accounting Policies.
The financial statements have been prepared in conformity with accounting principles generally accepted in the United States of America, which require management to make certain estimates and assumptions at the date of the financial statements. Actual results could differ from those estimates. The following summarizes the significant accounting policies of the Fund:
Security Valuation. Investments are valued as of 4:00 p.m. Eastern time on the last calendar day of the period. Wherever possible, the Fund uses independent pricing services approved by the Board of Trustees to value its investments.
Equity securities, including restricted securities, for which market quotations are readily available, are valued at the last reported sale price or official closing price as reported by an independent pricing service on the primary market or exchange on which they are traded. In the event there were no sales during the day or closing prices are not available, securities are valued at the last quoted bid price. Debt securities, including restricted securities, are valued by independent pricing services or by dealers who make markets in such securities. Pricing services consider yield or price of bonds of comparable quality, coupon, maturity and type as well as dealer supplied prices. Investments in open-end mutual funds, including the Fidelity Central Funds, are valued at their closing net asset value each business day. Short-term securities with remaining maturities of sixty days or less for which quotations are not readily available are valued at amortized cost, which approximates value.
When current market prices or quotations are not readily available or reliable, valuations may be determined in good faith in accordance with procedures adopted by the Board of Trustees. Factors used in determining value may include significant market or security specific events, changes in interest rates and credit quality, and developments in foreign markets which are monitored by evaluating the performance of ADRs, futures contracts and exchange-traded funds. The frequency with which these procedures are used cannot be predicted and may be utilized to a significant extent. The value of securities used for net asset value (NAV) calculation under these procedures may differ from published prices for the same securities.
Foreign Currency. The Fund uses foreign currency contracts to facilitate transactions in foreign-denominated securities. Losses from these transactions may arise from changes in the value of the foreign currency or if the counterparties do not perform under the contracts' terms.
Foreign-denominated assets, including investment securities, and liabilities are translated into U.S. dollars at the exchange rate at period end. Purchases and sales of investment securities, income and dividends received and expenses denominated in foreign currencies are translated into U.S. dollars at the exchange rate in effect on the transaction date.
The effects of exchange rate fluctuations on investments are included with the net realized and unrealized gain (loss) on investment securities. Other foreign currency transactions resulting in realized and unrealized gain (loss) are disclosed separately.
Annual Report
Emerging Markets
Notes to Financial Statements - continued
3. Significant Accounting Policies - continued
Investment Transactions and Income. For financial reporting purposes, the Fund's investment holdings and NAV include trades executed through the end of the last business day of the period. The NAV per share for processing shareholder transactions is calculated as of the close of business of the New York Stock Exchange (NYSE), normally 4:00 p.m. Eastern time and includes trades executed through the end of the prior business day. Gains and losses on securities sold are determined on the basis of identified cost and may include proceeds received from litigation. Dividend income is recorded on the ex-dividend date, except for certain dividends from foreign securities where the ex-dividend date may have passed, which are recorded as soon as the Fund is informed of the ex-dividend date. Non-cash dividends included in dividend income, if any, are recorded at the fair market value of the securities received. Distributions received on securities that represent a return of capital or capital gain are recorded as a reduction of cost of investments and/or as a realized gain. The Fund estimates the components of distributions received that may be considered return of capital distributions or capital gain distributions. Large, non-recurring dividends recognized by the Fund are presented separately on the Statement of Operations as "Special Dividends" and the impact of these dividends is presented in the Financial Highlights. Interest income and distributions from the Fidelity Central Funds are accrued as earned. Interest income includes coupon interest and amortization of premium and accretion of discount on debt securities. Investment income is recorded net of foreign taxes withheld where recovery of such taxes is uncertain.
Expenses. Most expenses of the trust can be directly attributed to a fund. Expenses which cannot be directly attributed are apportioned among each Fund in the trust. Expense estimates are accrued in the period to which they relate and adjustments are made when actual amounts are known.
Income Tax Information and Distributions to Shareholders. Each year, the Fund intends to qualify as a regulated investment company by distributing substantially all of its taxable income and realized gains under Subchapter M of the Internal Revenue Code and filing its U.S. federal tax return. As a result, no provision for income taxes is required. The Fund is subject to the provisions of FASB Interpretation No. 48, Accounting for Uncertainties in Income Taxes (FIN 48). FIN 48 sets forth a minimum threshold for financial statement recognition of the benefit of a tax position taken or expected to be taken in a tax return. The implementation of FIN 48 did not result in any unrecognized tax benefits in the accompanying financial statements. Each of the Fund's federal tax returns for the prior three fiscal years remains subject to examination by the Internal Revenue Service (IRS). Foreign taxes are provided for based on the Fund's understanding of the tax rules and rates that exist in the foreign markets in which it invests.
Distributions are recorded on the ex-dividend date. Income dividends and capital gain distributions are declared separately for each class. Income and capital gain distributions are determined in accordance with income tax regulations, which may differ from generally accepted accounting principles. In addition, the Fund will claim a portion of the payment made to redeeming shareholders as a distribution for income tax purposes.
Capital accounts within the financial statements are adjusted for permanent book-tax differences. These adjustments have no impact on net assets or the results of operations. Temporary book-tax differences will reverse in a subsequent period.
Book-tax differences are primarily due to foreign currency transactions, certain foreign taxes, passive foreign investment companies (PFIC), deferred trustees compensation, capital loss carryforwards and losses deferred due to wash sales.
The tax-basis components of distributable earnings and the federal tax cost as of period end were as follows:
Unrealized appreciation | $ 211,332,000 |
Unrealized depreciation | (1,173,383,176) |
Net unrealized appreciation (depreciation) | (962,051,176) |
Undistributed ordinary income | 31,514,547 |
Capital loss carryforward | (515,443,831) |
| |
Cost for federal income tax purposes | $ 3,163,760,393 |
The tax character of distributions paid was as follows:
| October 31, 2008 | October 31, 2007 |
Ordinary Income | $ 41,187,374 | $ 28,224,601 |
Long-term Capital Gains | 238,170,447 | - |
Total | $ 279,357,821 | $ 28,224,601 |
Short-Term Trading (Redemption) Fees. Shares held in the Fund less than 90 days are subject to a redemption fee equal to 1.50% of the proceeds of the redeemed shares. All redemption fees, including any estimated redemption fees paid by FMR, are retained by the Fund and accounted for as an addition to paid in capital.
New Accounting Pronouncement. In September 2006, Statement of Financial Accounting Standards No. 157, Fair Value Measurements (SFAS 157), was issued and is effective for fiscal years beginning after November 15, 2007. SFAS 157 defines fair value, establishes a framework for measuring fair value and results in expanded disclosures about fair value measurements.
Annual Report
4. Operating Policies.
Repurchase Agreements. FMR has received an Exemptive Order from the Securities and Exchange Commission (the SEC) which permits the Fund and other affiliated entities of FMR to transfer uninvested cash balances into joint trading accounts which are then invested in repurchase agreements. The Fund may also invest directly with institutions in repurchase agreements. Repurchase agreements are collateralized by government or non-government securities. Upon settlement date, collateral is held in segregated accounts with custodian banks and may be obtained in the event of a default of the counterparty. The Fund monitors, on a daily basis, the value of the collateral to ensure it is at least equal to the principal amount of the repurchase agreement (including accrued interest). In the event of a default by the counterparty, realization of the collateral proceeds could be delayed, during which time the value of the collateral may decline.
Restricted Securities. The Fund may invest in securities that are subject to legal or contractual restrictions on resale. These securities generally may be resold in transactions exempt from registration or to the public if the securities are registered. Disposal of these securities may involve time-consuming negotiations and expense, and prompt sale at an acceptable price may be difficult. Information regarding restricted securities is included at the end of the Fund's Schedule of Investments.
5. Purchases and Sales of Investments.
Purchases and sales of securities, other than short-term securities, aggregated $3,288,862,920 and $3,596,737,360, respectively.
6. Fees and Other Transactions with Affiliates.
Management Fee. FMR and its affiliates provide the Fund with investment management related services for which the Fund pays a monthly management fee. The management fee is the sum of an individual fund fee rate that is based on an annual rate of .45% of the Fund's average net assets and a group fee rate that averaged .26% during the period. The group fee rate is based upon the average net assets of all the mutual funds advised by FMR. The group fee rate decreases as assets under management increase and increases as assets under management decrease. For the period, the total annual management fee rate was .71% of the Fund's average net assets.
Transfer Agent Fees. Fidelity Investments Institutional Operations Company, Inc. (FIIOC), an affiliate of FMR, is the transfer, dividend disbursing and shareholder servicing agent for each class of the Fund. FIIOC receives account fees and asset-based fees that vary according to the account size and type of account of the shareholders of Emerging Markets and asset-based fees of .05% of average net assets for Class K. FIIOC pays for typesetting, printing and mailing of shareholder reports, except proxy statements. For the period, the transfer agent fees for Emerging Markets were equivalent to an annualized rate of .22% of average net assets. Prior to January 1, 2008, Fidelity Service Company, Inc. (FSC), also an affiliate of FMR, was the transfer agent for Emerging Markets. For the period, each class paid the following transfer agent fees:
| Amount |
Emerging Markets | $ 11,874,974 |
Class K | 4,842 |
Total | $ 11,879,816 |
Accounting and Security Lending Fees. FSC maintains the Fund's accounting records. The accounting fee is based on the level of average net assets for the month. Under a separate contract, FSC administers the security lending program. The security lending fee is based on the number and duration of lending transactions.
Brokerage Commissions. The Fund placed a portion of its portfolio transactions with brokerage firms which are affiliates of the investment adviser. The commissions paid to these affiliated firms were $485 for the period.
Interfund Lending Program. Pursuant to an Exemptive Order issued by the SEC, the Fund, along with other registered investment companies having management contracts with FMR, may participate in an interfund lending program. This program provides an alternative credit facility allowing the funds to borrow from, or lend money to, other participating affiliated funds. At period end, there were no interfund loans outstanding. The Fund's activity in this program during the period for which loans were outstanding was as follows:
Borrower or Lender | Average Daily
Loan Balance | Weighted Average Interest Rate | Interest
Expense |
Borrower | $ 4,222,000 | 4.77% | $ 1,119 |
7. Committed Line of Credit.
The Fund participates with other funds managed by FMR in a $4.2 billion credit facility (the "line of credit") to be utilized for temporary or emergency purposes to fund shareholder redemptions or for other short-term liquidity purposes. The Fund has agreed to pay commitment fees on its pro rata portion of the line of credit, which amounted to $11,091 and is reflected in Miscellaneous Expense on the Statement of Operations. During the period, there were no borrowings on this line of credit.
Annual Report
Emerging Markets
Notes to Financial Statements - continued
8. Security Lending.
The Fund lends portfolio securities from time to time in order to earn additional income. On the settlement date of the loan, the Fund receives collateral (in the form of U.S. Treasury obligations, letters of credit and/or cash) against the loaned securities and maintains collateral in an amount not less than 100% of the market value of the loaned securities during the period of the loan. The market value of the loaned securities is determined at the close of business of the Fund and any additional required collateral is delivered to the Fund on the next business day. If the reasons, a fund could experience delays and costs in recovering the securities loaned or in gaining access to the collateral. Any cash collateral received is invested in the Fidelity Securities Lending Cash Central Fund. The value of loaned securities and cash collateral at period end are disclosed on the Fund's Statement of Assets and Liabilities. Security lending income represents the income earned on investing cash collateral, less fees and expenses associated with the loan, plus any premium payments that may be received on the loan of certain types of securities. Security lending income is presented in the Statement of Operations as a component of income from Fidelity Central Funds.
9. Bank Borrowings.
The Fund is permitted to have bank borrowings for temporary or emergency purposes to fund shareholder redemptions. The Fund has established borrowing arrangements with certain banks. The interest rate on the borrowings is the bank's base rate, as revised from time to time. The average daily loan balance during the period for which loans were outstanding amounted to $5,081,000. The weighted average interest rate was 4.50%. The interest expense amounted to $635 under the bank borrowing program. At period end, there were no bank borrowings outstanding.
10. Expense Reductions.
FMR voluntarily agreed to reimburse a portion of Emerging Market's operating expenses. During the period, this reimbursement reduced the class' expenses by $12,763.
Many of the brokers with whom FMR places trades on behalf of the Fund provided services to the Fund in addition to trade execution. These services included payments of certain expenses on behalf of the Fund totaling $2,603,656 for the period. In addition, through arrangements with the Fund's custodian and each class' transfer agent, credits realized as a result of uninvested cash balances were used to reduce the Fund's expenses. During the period, these credits reduced the Fund's custody expenses by $2,580. During the period, credits reduced each class' transfer agent expense as noted in the table below.
| Transfer Agent
expense reduction |
Emerging Markets | $ 116,365 |
Class K | 12 |
| $ 116,377 |
11. Other.
The Fund's organizational documents provide former and current trustees and officers with a limited indemnification against liabilities arising in connection with the performance of their duties to the Fund. In the normal course of business, the Fund may also enter into contracts that provide general indemnifications. The Fund's maximum exposure under these arrangements is unknown as this would be dependent on future claims that may be made against the Fund. The risk of material loss from such claims is considered remote.
In December 2006, the Independent Trustees, with the assistance of independent counsel, completed an investigation regarding gifts, gratuities and business entertainment provided by certain brokers to certain individuals who were employed on FMR's domestic equity trading desk during the period 2002 to 2004. The Independent Trustees and FMR agreed that, despite the absence of proof that the Fidelity mutual funds experienced diminished execution quality as a result of the improper receipt of gifts and business entertainment, the conduct at issue was serious and was worthy of redress. Accordingly, the Independent Trustees requested, and FMR agreed to make, a payment of $42 million plus accrued interest, which equaled approximately $7.3 million, to certain Fidelity mutual funds.
In March 2008, the Trustees approved a method for allocating this payment among the funds and, in total, FMR paid the fund $477, which is recorded in the accompanying Statement of Operations.
In a related administrative order dated March 5, 2008, the U.S. Securities and Exchange Commission ("SEC") announced a settlement with FMR and FMR Co., Inc. (an affiliate of FMR) involving the SEC's regulatory rules for investment advisers and the improper receipt of gifts, gratuities and business entertainment. Without admitting or denying the SEC's findings, FMR agreed to pay an $8 million civil penalty to the United States Treasury.
Annual Report
12. Distributions to Shareholders.
Distributions to shareholders of each class were as follows:
Years ended October 31, | 2008 | 2007 |
From net investment income | | |
Emerging Markets | $ 34,024,353 | $ 28,224,601 |
From net realized gain | | |
Emerging Markets | $ 245,333,468 | $ - |
13. Share Transactions.
Transactions for each class of shares were as follows:
| Shares | Dollars |
Years ended October 31, | 2008 A | 2007 | 2008 A | 2007 |
Emerging Markets | | | | |
Shares sold | 88,151,350 | 96,979,878 | $ 2,616,256,871 | $ 2,766,036,681 |
Conversion to Class K | (6,470,724) | - | (122,161,593) | - |
Reinvestment of distributions | 7,825,864 | 1,154,965 | 270,227,076 | 27,314,929 |
Shares redeemed | (113,371,134) | (58,453,895) | (2,997,083,479) | (1,559,669,286) |
Net increase (decrease) | (23,864,644) | 39,680,948 | $ (232,761,125) | $ 1,233,682,324 |
Class K | | | | |
Shares sold | 379,643 | - | $ 5,848,087 | $ - |
Conversion to Class K | 6,466,184 | - | 122,161,593 | - |
Shares redeemed | (475,589) | - | (7,670,068) | - |
Net increase (decrease) | 6,370,238 | - | $ 120,339,612 | $ - |
A Share transactions for Class K are for the period May 9, 2008 (commencement of sale of shares) to October 31, 2008.
Annual Report
Report of Independent Registered Public Accounting Firm
To the Trustees of Fidelity Investment Trust and the Shareholders of Fidelity Emerging Markets Fund:
In our opinion, the accompanying statement of assets and liabilities, including the schedule of investments, and the related statements of operations and of changes in net assets and the financial highlights present fairly, in all material respects, the financial position of Fidelity Emerging Markets Fund (a fund of Fidelity Investment Trust) at October 31, 2008, the results of its operations for the periods indicated, the changes in its net assets for each of the periods indicated and the financial highlights for each of the periods indicated, in conformity with accounting principles generally accepted in the United States of America. These financial statements and financial highlights (hereafter referred to as "financial statements") are the responsibility of the Fidelity Emerging Markets Fund's management. Our responsibility is to express an opinion on these financial statements based on our audits. We conducted our audits of these financial statements in accordance with the standards of the Public Company Accounting Oversight Board (United States). Those standards require that we plan and perform the audit to obtain reasonable assurance about whether the financial statements are free of material misstatement. An audit includes examining, on a test basis, evidence supporting the amounts and disclosures in the financial statements, assessing the accounting principles used and significant estimates made by management, and evaluating the overall financial statement presentation. We believe that our audits, which included confirmation of securities at October 31, 2008 by correspondence with the custodian and brokers, provide a reasonable basis for our opinion.
/s/ PricewaterhouseCoopers LLP
PricewaterhouseCoopers LLP
Boston, Massachusetts
December 23, 2008
Annual Report
The Trustees, Member of the Advisory Board, and executive officers of the trust and fund, as applicable, are listed below. The Board of Trustees governs the fund and is responsible for protecting the interests of shareholders. The Trustees are experienced executives who meet periodically throughout the year to oversee the fund's activities, review contractual arrangements with companies that provide services to the fund, and review the fund's performance. Except for Edward C. Johnson 3d and James C. Curvey, each of the Trustees oversees 220 funds advised by FMR or an affiliate. Messrs. Johnson and Curvey oversee 379 funds advised by FMR or an affiliate.
The Trustees hold office without limit in time except that (a) any Trustee may resign; (b) any Trustee may be removed by written instrument, signed by at least two-thirds of the number of Trustees prior to such removal; (c) any Trustee who requests to be retired or who has become incapacitated by illness or injury may be retired by written instrument signed by a majority of the other Trustees; and (d) any Trustee may be removed at any special meeting of shareholders by a two-thirds vote of the outstanding voting securities of the trust. Each Trustee who is not an interested person (as defined in the 1940 Act) (Independent Trustee), shall retire not later than the last day of the calendar year in which his or her 72nd birthday occurs. The Independent Trustees may waive this mandatory retirement age policy with respect to individual Trustees. The executive officers and Advisory Board Member hold office without limit in time, except that any officer and Advisory Board Member may resign or may be removed by a vote of a majority of the Trustees at any regular meeting or any special meeting of the Trustees. Except as indicated, each individual has held the office shown or other offices in the same company for the past five years.
The fund's Statement of Additional Information (SAI) includes more information about the Trustees. To request a free copy, call Fidelity at 1-800-544-8544.
Interested Trustees*:
Correspondence intended for each Trustee who is an interested person may be sent to Fidelity Investments, 82 Devonshire Street, Boston, Massachusetts 02109.
Name, Age; Principal Occupation |
Edward C. Johnson 3d (78) |
| Year of Election or Appointment: 1984 Mr. Johnson is Chairman of the Board of Trustees. Mr. Johnson serves as Chief Executive Officer, Chairman, and a Director of FMR LLC; Chairman and a Director of FMR; Chairman and a Director of Fidelity Research & Analysis Company (FRAC); Chairman and a Director of Fidelity Investments Money Management, Inc.; and Chairman and a Director of FMR Co., Inc. In addition, Mr. Johnson serves as Chairman and Director of FIL Limited. Previously, Mr. Johnson served as President of FMR LLC (2006-2007). |
James C. Curvey (73) |
| Year of Election or Appointment: 2007 Mr. Curvey also serves as Trustee (2007-present) of other investment companies advised by FMR. Mr. Curvey is a Director of FMR and FMR Co., Inc. (2007-present). Mr. Curvey is also Vice Chairman (2006-present) and Director of FMR LLC. In addition, Mr. Curvey serves as an Overseer for the Boston Symphony Orchestra and a member of the Trustees of Villanova University. |
* Trustees have been determined to be "Interested Trustees" by virtue of, among other things, their affiliation with the trust or various entities under common control with FMR. FMR Corp. merged with and into FMR LLC on October 1, 2007. Any references to FMR LLC for prior periods are deemed to be references to the prior entity.
Independent Trustees:
Correspondence intended for each Independent Trustee (that is, the Trustees other than the Interested Trustees) may be sent to Fidelity Investments, P.O. Box 55235, Boston, Massachusetts 02205-5235.
Name, Age; Principal Occupation |
Dennis J. Dirks (60) |
| Year of Election or Appointment: 2005 Prior to his retirement in May 2003, Mr. Dirks was Chief Operating Officer and a member of the Board of The Depository Trust & Clearing Corporation (DTCC) (1999-2003). He also served as President, Chief Operating Officer, and Board member of The Depository Trust Company (DTC) (1999-2003) and President and Board member of the National Securities Clearing Corporation (NSCC) (1999-2003). In addition, Mr. Dirks served as a Trustee and a member of the Finance Committee of Manhattan College (2005-2008), and as Chief Executive Officer and Board member of the Government Securities Clearing Corporation (2001-2003) and Chief Executive Officer and Board member of the Mortgage-Backed Securities Clearing Corporation (2001-2003). Mr. Dirks also serves as a Trustee and a member of the Finance Committee of AHRC of Nassau County (2006-present). |
Alan J. Lacy (55) |
| Year of Election or Appointment: 2008 Mr. Lacy serves as Senior Adviser (2007-present) of Oak Hill Capital Partners, L.P. (a private equity firm). Mr. Lacy also served as Chief Executive Officer (2000-2005) and Vice Chairman (2005-2006) of Sears Holdings Corporation and Sears, Roebuck and Co. (retail). In addition, Mr. Lacy serves as a member of the Board of Directors of The Western Union Company (global money transfer, 2006-present) and Bristol-Myers Squibb (global pharmaceuticals, 2007-present). Mr. Lacy is a Trustee of the National Parks Conservation Association and The Field Museum of Natural History. |
Ned C. Lautenbach (64) |
| Year of Election or Appointment: 2000 Mr. Lautenbach is Chairman of the Independent Trustees (2006-present). Mr. Lautenbach is an Advisory Partner of Clayton, Dubilier & Rice, Inc. (private equity investment firm). Previously, Mr. Lautenbach was with the International Business Machines Corporation (IBM) from 1968 until his retirement in 1998. Mr. Lautenbach serves as a Director of Eaton Corporation (diversified industrial) as well as the Philharmonic Center for the Arts in Naples, Florida. He also is a member of the Board of Trustees of Fairfield University (2005-present), as well as a member of the Council on Foreign Relations. Previously, Mr. Lautenbach served as a Director of Sony Corporation (2006-2007). |
Joseph Mauriello (64) |
| Year of Election or Appointment: 2008 Prior to his retirement in January 2006, Mr. Mauriello served in numerous senior management positions including Deputy Chairman and Chief Operating Officer (2004-2005), and Vice Chairman of Financial Services (2002-2004) of KPMG LLP US (professional services firm, 1965-2005). Mr. Mauriello currently serves as a member of the Board of Directors of XL Capital Ltd. (global insurance and re-insurance company, 2006-present) and of Arcadia Resources Inc. (health care services and products, 2007-
present). He also served as a Director of the Hamilton Funds of the Bank of New York (2006-2007). |
Cornelia M. Small (64) |
| Year of Election or Appointment: 2005 Ms. Small is a member of the Investment Committee, and Chair (2008-present) and a member of the Board of Trustees of Smith College. Ms. Small also serves on the Investment Committee of the Berkshire Taconic Community Foundation (2008-present). Previously, Ms. Small served as Chairperson of the Investment Committee (2002-2008) of Smith College and as Co-Chair (2000-2003) of the Annual Fund for the Fletcher School of Law and Diplomacy. In addition, she served as Chief Investment Officer, Director of Global Equity Investments, and a member of the Board of Directors of Scudder, Stevens & Clark and Scudder Kemper Investments. |
William S. Stavropoulos (69) |
| Year of Election or Appointment: 2001 Mr. Stavropoulos is Chairman Emeritus of the Board of Directors of The Dow Chemical Company, where he previously served in numerous senior management positions, including President (1993-2000; 2002-2003), CEO (1995-2000; 2002-2004), Chairman of the Executive Committee (2000-2006), and as a member of the Board of Directors (1990-2006). Currently, he is a Director of Teradata Corporation (data warehousing and technology solutions, 2008-present), Chemical Financial Corporation, Maersk Inc. (industrial conglomerate), Tyco International, Inc. (multinational manufacturing and services, 2007-present), and a member of the Advisory Board for Metalmark Capital (private equity investment firm, 2005-present). He is a special advisor to Clayton, Dubilier & Rice, Inc. (private equity investment). In addition, Mr. Stavropoulos is a member of the University of Notre Dame Advisory Council for the College of Science. |
David M. Thomas (59) |
| Year of Election or Appointment: 2007 Previously, Mr. Thomas served as Executive Chairman (2005-2006) and Chairman and Chief Executive Officer (2000-2005) of IMS Health, Inc. (pharmaceutical and healthcare information solutions). In addition, Mr. Thomas serves as a member of the Board of Directors of Fortune Brands, Inc. (consumer products holding company), and Interpublic Group of Companies, Inc. (marketing communication, 2004-present). |
Michael E. Wiley (58) |
| Year of Election or Appointment: 2008 Mr. Wiley also serves as a member of the Board of Trustees of the University of Tulsa (2000-2006; 2007-present). He serves as a Director of Tesoro Corporation (independent oil refiner and marketer, 2005-present), and a Director of Bill Barrett Corporation (exploration and production company, 2005-present). In addition, he also serves as a Director of Post Oak Bank (privately-held bank, 2004-present). Previously, Mr. Wiley served as a Sr. Energy Advisor of Katzenbach Partners, LLC (consulting firm, 2006-2007), as an Advisory Director of Riverstone Holdings (private investment firm), Chairman, President, and CEO of Baker Hughes, Inc. (oilfield services company, 2000-2004), and as Director of Spinnaker Exploration Company (exploration and production company, 2001-2005). |
Annual Report
Advisory Board Member and Executive Officers**:
Correspondence intended for each executive officer and Mr. Lynch may be sent to Fidelity Investments, 82 Devonshire Street, Boston, Massachusetts 02109.
Name, Age; Principal Occupation |
Peter S. Lynch (64) |
| Year of Election or Appointment: 2003 Member of the Advisory Board of Fidelity's Equity and High Income Funds. Mr. Lynch is Vice Chairman and a Director of FMR, and Vice Chairman (2001-present) and a Director of FMR Co., Inc. Previously, Mr. Lynch served as a Trustee of the Fidelity funds (1990-2003). In addition, he serves as a Trustee of Boston College and as the Chairman of the Inner-City Scholarship Fund. Previously, Mr. Lynch served on the Special Olympics International Board of Directors (1997-2006). |
Kenneth B. Robins (39) |
| Year of Election or Appointment: 2008 President and Treasurer of Fidelity's Equity and High Income Funds. Mr. Robins is an employee of Fidelity Investments (2004-present). Before joining Fidelity Investments, Mr. Robins worked at KPMG LLP, where he was a partner in KPMG's department of professional practice (2002-2004). |
Walter C. Donovan (46) |
| Year of Election or Appointment: 2007 Vice President of Fidelity's Equity Funds. Mr. Donovan also serves as President of FMR and FMR Co., Inc., and Executive Vice President of Fidelity Investments Money Management, Inc. (2007-present). Previously, Mr. Donovan served as Executive Vice President of FMR and FMR Co., Inc. (2005-2007) and Senior Vice President of FMR (2003-2005) and FMR Co., Inc. (2004-2005). |
Eric M. Wetlaufer (46) |
| Year of Election or Appointment: 2006 Vice President of Fidelity's International Equity Funds. Mr. Wetlaufer also serves as Group Chief Investment Officer of FMR. Mr. Wetlaufer is Chairman, Chief Executive Officer, and President of Fidelity Management & Research (Hong Kong) Limited (2008-present); Chairman, Chief Executive Officer, President, and a Director of Fidelity Management & Research (Japan) Inc. (2008-present); Chairman and Chief Executive Officer (2007-present) and President and a Director (2006-present) of Fidelity Management & Research (U.K.) Inc. and President and a Director of Fidelity Research & Analysis Company (2006-present). Before joining Fidelity Investments in 2005, Mr. Wetlaufer was a partner in Oxhead Capital Management (2004-2005) and a Chief Investment Officer of Putnam Investments (1997-2003). |
Scott C. Goebel (40) |
| Year of Election or Appointment: 2008 Secretary and Chief Legal Officer (CLO) of the Fidelity funds. Mr. Goebel also serves as General Counsel, Secretary, and Senior Vice President of FMR (2008-present); Deputy General Counsel of FMR LLC; Chief Legal Secretary of Fidelity Management & Research (Hong Kong) Limited (2008-present) and Assistant Secretary of Fidelity Management & Research (Japan) Inc. (2008-
present). Previously, Mr. Goebel served as Assistant Secretary of the Funds (2007-2008) and as Vice President and Secretary of FDC (2005-2007). |
John B. McGinty, Jr. (46) |
| Year of Election or Appointment: 2008 Assistant Secretary of Fidelity's Equity and High Income Funds. Mr. McGinty is an employee of Fidelity Investments (2004-present). Mr. McGinty also serves as Senior Vice President, Secretary, and Chief Legal Officer of Fidelity Distributors Corporation (FDC) (2007-present). Before joining Fidelity Investments, Mr. McGinty practiced law at Ropes & Gray, LLP. |
Holly C. Laurent (54) |
| Year of Election or Appointment: 2008 Anti-Money Laundering (AML) Officer of the Fidelity funds. Ms. Laurent is an employee of Fidelity Investments. Previously, Ms. Laurent was Senior Vice President and Head of Legal for Fidelity Business Services India Pvt. Ltd. (2006-2008), Senior Vice President, Deputy General Counsel and Group Head for FMR LLC (2005-2006). |
Christine Reynolds (50) |
| Year of Election or Appointment: 2008 Chief Financial Officer of the Fidelity funds. Ms. Reynolds became President of Fidelity Pricing and Cash Management Services (FPCMS) in August 2008. She served as Chief Operating Officer of FPCMS from 2007 through July 2008. Previously, Ms. Reynolds served as President, Treasurer, and Anti-Money Laundering officer of the Fidelity funds (2004-2007). Before joining Fidelity Investments, Ms. Reynolds worked at PricewaterhouseCoopers LLP (PwC) (1980-2002), where she was an audit partner with PwC's investment management practice. |
Kenneth A. Rathgeber (61) |
| Year of Election or Appointment: 2004 Chief Compliance Officer of Fidelity's Equity and High Income Funds. Mr. Rathgeber is Chief Compliance Officer of Fidelity Management & Research (Hong Kong) Limited (2008-present), Fidelity Management & Research (Japan) Inc. (2008-present), FMR (2005-present), FMR Co., Inc. (2005-present), Fidelity Management & Research (U.K.) Inc. (2005-present), Fidelity Research & Analysis Company (2005-present), Fidelity Investments Money Management, Inc. (2005-present), and Strategic Advisers, Inc. (2005-present). |
Bryan A. Mehrmann (47) |
| Year of Election or Appointment: 2005 Deputy Treasurer of the Fidelity funds. Mr. Mehrmann is an employee of Fidelity Investments. Previously, Mr. Mehrmann served as Vice President of Fidelity Investments Institutional Services Group (FIIS)/Fidelity Investments Institutional Operations Corporation, Inc. (FIIOC) Client Services (1998-2004). |
Adrien E. Deberghes (41) |
| Year of Election or Appointment: 2008 Deputy Treasurer of Fidelity's Equity and High Income Funds. Mr. Deberghes is an employee of Fidelity Investments (2008-present). Previously, Mr. Deberghes served as Senior Vice President of Mutual Fund Administration at State Street Corporation (2007-2008), Senior Director of Mutual Fund Administration at Investors Bank & Trust (2005-2007), and Director of Finance for Dunkin' Brands (2000-2005). |
Robert G. Byrnes (41) |
| Year of Election or Appointment: 2005 Assistant Treasurer of the Fidelity funds. Mr. Byrnes is an employee of Fidelity Investments (2005-present). Previously, Mr. Byrnes served as Vice President of Fidelity Pricing and Cash Management Services (FPCMS) (2003-2005). Before joining Fidelity Investments, Mr. Byrnes worked at Deutsche Asset Management where he served as Vice President of the Investment Operations Group (2000-2003). |
Peter L. Lydecker (54) |
| Year of Election or Appointment: 2004 Assistant Treasurer of the Fidelity funds. Mr. Lydecker is an employee of Fidelity Investments. |
Paul M. Murphy (61) |
| Year of Election or Appointment: 2007 Assistant Treasurer of the Fidelity funds. Mr. Murphy is an employee of Fidelity Investments (2007-present). Previously, Mr. Murphy served as Chief Financial Officer of the Fidelity Funds (2005-2006), Vice President and Associate General Counsel of FMR (2007), and Senior Vice President of Fidelity Pricing and Cash Management Services (FPCMS) (1994-2007). |
Gary W. Ryan (50) |
| Year of Election or Appointment: 2005 Assistant Treasurer of the Fidelity funds. Mr. Ryan is an employee of Fidelity Investments. Previously, Mr. Ryan served as Vice President of Fund Reporting in Fidelity Pricing and Cash Management Services (FPCMS) (1999-2005). |
** FMR Corp. merged with and into FMR LLC on October 1, 2007. Any references to FMR LLC for prior periods are deemed to be references to the prior entity.
Annual Report
Board Approval of Investment Advisory Contracts and Management Fees
Fidelity Emerging Markets Fund
Each year, typically in July, the Board of Trustees, including the Independent Trustees (together, the Board), votes on the renewal of the management contract and sub-advisory agreements (together, the Advisory Contracts) for the fund. The Board, assisted by the advice of fund counsel and Independent Trustees' counsel, requests and considers a broad range of information throughout the year.
The Board meets regularly and, acting directly and through its separate committees, requests and receives information concerning, and considers at each of its meetings factors that are relevant to, its annual consideration of the renewal of the fund's Advisory Contracts, including the services and support provided to the fund and its shareholders. At the time of the renewal, the Board had 12 standing committees, each composed of Independent Trustees with varying backgrounds, to which the Board has assigned specific subject matter responsibilities in order to enhance effective decision-making by the Board. Each committee has a written charter outlining the structure and purposes of the committee. The Board also meets as needed to consider matters specifically related to the Board's annual consideration of the renewal of Advisory Contracts.
At its July 2008 meeting, the Board of Trustees, including the Independent Trustees, unanimously determined to renew the fund's Advisory Contracts. In reaching its determination, the Board considered all factors it believed relevant, including (i) the nature, extent, and quality of the services to be provided to the fund and its shareholders (including the investment performance of the fund); (ii) the competitiveness of the fund's management fee and total expenses; (iii) the total costs of the services to be provided by and the profits to be realized by Fidelity from its relationship with the fund; (iv) the extent to which economies of scale would be realized as the fund grows; and (v) whether fee levels reflect these economies of scale, if any, for the benefit of fund shareholders. The Board also approved agreements with foreign sub-advisers Fidelity Management & Research (Japan) Inc. and Fidelity Management & Research (Hong Kong) Limited, as well as amendments to the fund's agreement with Fidelity Management & Research (U.K.) Inc.
In considering whether to renew the Advisory Contracts for the fund, the Board ultimately reached a determination, with the assistance of fund counsel and Independent Trustees' counsel and through the exercise of its business judgment, that the renewal of the Advisory Contracts and the compensation to be received by Fidelity under the management contract is consistent with Fidelity's fiduciary duty under applicable law. The Board's decision to renew the Advisory Contracts was not based on any single factor noted above, but rather was based on a comprehensive consideration of all the information provided to the Board at its meetings throughout the year. The Board, in reaching its determination to renew the Advisory Contracts, is aware that shareholders in the fund have a broad range of investment choices available to them, including a wide choice among mutual funds offered by competitors to Fidelity, and that the fund's shareholders, with the opportunity to review and weigh the disclosure provided by the fund in its prospectus and other public disclosures, have chosen to invest in that fund, managed by Fidelity.
Nature, Extent, and Quality of Services Provided. The Board considered staffing within the investment adviser, FMR, and the sub-advisers (together, the Investment Advisers), including the backgrounds of the fund's investment personnel and the fund's investment objectives and disciplines. The Independent Trustees also had discussions with senior management of Fidelity's investment operations and investment groups. The Board considered the structure of the portfolio manager compensation program and whether this structure provides appropriate incentives.
Resources Dedicated to Investment Management and Support Services. The Board reviewed the size, education, and experience of the Investment Advisers' investment staff, their use of technology, and the Investment Advisers' approach to recruiting, training, and retaining portfolio managers and other research, advisory, and management personnel. The Board noted that Fidelity's analysts have access to a variety of technological tools that enable them to perform both fundamental and quantitative analysis and to specialize in various disciplines. The Board considered Fidelity's extensive global research capabilities that enable the Investment Advisers to aggregate data from various sources in an effort to produce positive investment results. The Board also considered that Fidelity's portfolio managers and analysts have access to daily portfolio attribution that allows for monitoring of a fund's portfolio, as well as an electronic communication system that provides immediate real-time access to research concerning issuers and credit enhancers.
Shareholder and Administrative Services. The Board considered (i) the nature, extent, quality, and cost of advisory, administrative, distribution, and shareholder services performed by the Investment Advisers and their affiliates under the Advisory Contracts and under separate agreements covering transfer agency, pricing and bookkeeping, and securities lending services for the fund; (ii) the nature and extent of the Investment Advisers' supervision of third party service providers, principally custodians and subcustodians; and (iii) the resources devoted to, and the record of compliance with, the fund's compliance policies and procedures. The Board also reviewed the allocation of fund brokerage, including allocations to brokers affiliated with the Investment Advisers, the use of brokerage commissions to pay fund expenses, and the use of "soft" commission dollars to pay for research services. The Board further considered that Fidelity voluntarily pays for market data out of its own resources.
The Board noted that the growth of fund assets across the complex allows Fidelity to reinvest in the development of services designed to enhance the value or convenience of the Fidelity funds as investment vehicles. These services include 24-hour access to account information and market information through phone representatives and over the Internet, and investor education materials and asset allocation tools.
Investment in a Large Fund Family. The Board considered the benefits to shareholders of investing in a Fidelity fund, including the benefits of investing in a fund that is part of a large family of funds offering a variety of investment disciplines and providing for a large variety of mutual fund investor services. For example, fund shareholders are offered the privilege of exchanging shares of a fund for shares of other Fidelity funds, as set forth in the fund's prospectus, without paying a sales charge. The Board noted that Fidelity has taken a number of actions over the previous year that benefited particular funds, including (i) dedicating additional resources to investment research and to restructure the investment research teams; (ii) contractually agreeing to reduce the management fees on Fidelity's Institutional Money Market Funds and launching Class IV and Institutional Class of certain of these funds; (iii) reducing the transfer agent fees for the Fidelity Select Portfolios and Investor Class of the VIP funds; and (iv) launching Class K of 29 equity funds as a lower-fee class available to certain employer-sponsored retirement plans.
Annual Report
Board Approval of Investment Advisory Contracts and Management Fees - continued
Investment Performance. The Board considered whether the fund has operated within its investment objective, as well as its record of compliance with its investment restrictions. It also reviewed the fund's absolute investment performance, as well as the fund's relative investment performance measured against (i) a broad-based securities market index, and (ii) a peer group of mutual funds deemed appropriate by the Board over multiple periods. The following charts considered by the Board show, over the one-, three-, and five-year periods ended December 31, 2007, the fund's cumulative total returns, the cumulative total returns of a broad-based securities market index ("benchmark"), and a range of cumulative total returns of a peer group of mutual funds identified by Morningstar, Inc. as having an investment style similar to that of the fund based on underlying portfolio holdings. (Emerging Markets Fund did not offer Class K as of December 31, 2007.) The box within each chart shows the 25th percentile return (bottom of box) and the 75th percentile return (top of box) of the peer group. Returns shown above the box are in the first quartile and returns shown below the box are in the fourth quartile. The percentage beaten number noted below each chart corresponds to the percentile box and represents the percentage of funds in the peer group whose performance was equal to or lower than that of the fund.
Fidelity Emerging Markets Fund
The Board reviewed the fund's relative investment performance against its peer group and stated that the performance of the fund was in the first quartile for all the periods shown. The Board also stated that the investment performance of the fund compared favorably to its benchmark for all the periods shown.
The Board considered that FMR has taken steps to refocus and strengthen equity research, equity portfolio management, and compliance.
Based on its review, and giving particular weight to the nature and quality of the resources dedicated by the Investment Advisers to maintain and improve relative performance, the Board concluded that the nature, extent, and quality of the services provided to the fund will benefit the fund's shareholders, particularly in light of the Board's view that the fund's shareholders benefit from investing in a fund that is part of a large family of funds offering a variety of investment disciplines and services.
Competitiveness of Management Fee and Total Fund Expenses. The Board considered the fund's management fee and total expenses compared to "mapped groups" of competitive funds and classes. Fidelity creates "mapped groups" by combining similar Lipper investment objective categories that have comparable management fee characteristics. Combining Lipper investment objective categories aids the Board's management fee and total expense comparisons by broadening the competitive group used for comparison and by reducing the number of universes to which various Fidelity funds are compared. The Board also considered supplemental information about how the fund's management fee and total expenses ranked relative to groups based on Lipper classifications, which take into account a fund's market capitalization and style.
The Board considered two proprietary management fee comparisons for the 12-month periods shown in the charts below. The group of Lipper funds used by the Board for management fee comparisons is referred to below as the "Total Mapped Group". The Total Mapped Group comparison focuses on a fund's standing relative to the total universe of comparable funds available to investors, in terms of gross management fees before expense reimbursements or caps. "TMG %" represents the percentage of funds in the Total Mapped Group that had management fees that were lower than a fund's. For example, a TMG % of 9% would mean that 91% of the funds in the Total Mapped Group had higher management fees than a fund. The "Asset-Size Peer Group" (ASPG) comparison focuses on a fund's standing relative to non-Fidelity funds similar in size to the fund within the Total Mapped Group. The ASPG represents at least 15% of the funds in the Total Mapped Group with comparable asset size and management fee characteristics, subject to a minimum of 50 funds (or all funds in the Total Mapped Group if fewer than 50). Additional information, such as the ASPG quartile in which a fund's management fee ranked, is also included in the charts and considered by the Board.
Annual Report
Fidelity Emerging Markets Fund
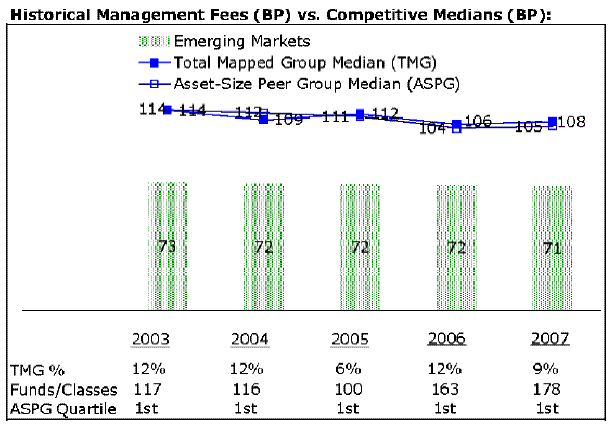
The Board noted that the fund's management fee ranked below the median of its Total Mapped Group and below the median of its ASPG for 2007.
Based on its review, the Board concluded that the fund's management fee was fair and reasonable in light of the services that the fund receives and the other factors considered.
In its review of the fund's total expenses, the Board considered the fund's management fee as well as other fund expenses, such as transfer agent fees, pricing and bookkeeping fees, and custodial, legal, and audit fees. The Board also noted the effects of any waivers and reimbursements on fees and expenses. As part of its review, the Board also considered current and historical total expenses of the fund compared to competitive fund median expenses. The fund is compared to those funds and classes in the Total Mapped Group (used by the Board for management fee comparisons) that have a similar sales load structure.
The Board noted that the fund's total expenses ranked below its competitive median for 2007.
In its review of total expenses, the Board also considered Fidelity fee structures and other information on clients that FMR and its affiliates service in other competitive markets, such as other mutual funds advised or subadvised by FMR or its affiliates, pension plan clients, and other institutional clients.
Based on its review, the Board concluded that the fund's total expenses were reasonable in light of the services that the fund and its shareholders receive and the other factors considered.
Costs of the Services and Profitability. The Board considered the revenues earned and the expenses incurred by Fidelity in conducting the business of developing, marketing, distributing, managing, administering and servicing the fund and its shareholders. The Board also considered the level of Fidelity's profits in respect of all the Fidelity funds.
On an annual basis, FMR presents to the Board Fidelity's profitability for the fund. Fidelity calculates the profitability for the fund, as well as aggregate profitability for groups of Fidelity funds and all Fidelity funds, using a series of detailed revenue and cost allocation methodologies which originate with the audited books and records of Fidelity. The Audit Committee of the Board reviews any significant changes from the prior year's methodologies.
PricewaterhouseCoopers LLP (PwC), independent registered public accounting firm and auditor to Fidelity and certain Fidelity funds, has been engaged annually by the Board as part of the Board's assessment of the results of Fidelity's profitability analysis. PwC's engagement includes the review and assessment of Fidelity's methodologies used in determining the revenues and expenses attributable to Fidelity's mutual fund business, and completion of agreed-upon procedures surrounding the mathematical accuracy of fund profitability and its conformity to allocation methodologies. After considering PwC's reports issued under the engagement and information provided by Fidelity, the Board believes that while other allocation methods may also be reasonable, Fidelity's profitability methodologies are reasonable in all material respects.
Annual Report
Board Approval of Investment Advisory Contracts and Management Fees - continued
The Board has also reviewed Fidelity's non-fund businesses and any fall-out benefits related to the mutual fund business as well as cases where Fidelity's affiliates may benefit from or be related to the funds' business.
The Board considered the costs of the services provided by and the profits realized by Fidelity in connection with the operation of the fund and determined that the amount of profit is a fair entrepreneurial profit for the management of the fund.
Economies of Scale. The Board considered whether there have been economies of scale in respect of the management of the Fidelity funds, whether the Fidelity funds (including the fund) have appropriately benefited from any such economies of scale, and whether there is potential for realization of any further economies of scale. The Board considered the extent to which the fund will benefit from economies of scale through increased services to the fund, through waivers or reimbursements, or through fee or expense reductions.
The Board recognized that the fund's management contract incorporates a "group fee" structure, which provides for lower group fee rates as total fund assets under FMR's management increase, and for higher group fee rates as total fund assets under FMR's management decrease. FMR determines the group fee rates based on a tiered asset "breakpoint" schedule. The Board considered that the group fee is designed to deliver the benefits of economies of scale to fund shareholders when total fund assets increase, even if assets of any particular fund are unchanged or have declined, because some portion of Fidelity's costs are attributable to services provided to all Fidelity funds, and all funds benefit if those costs can be allocated among more assets. The Board concluded that, given the group fee structure, fund shareholders will achieve a certain level of economies of scale as assets under FMR's management increase at the fund complex level, regardless of whether Fidelity achieves any such economies of scale.
The Board further concluded that any potential economies of scale are being shared between fund shareholders and Fidelity in an appropriate manner.
Additional Information Requested by the Board. In order to develop fully the factual basis for consideration of the Fidelity funds' Advisory Contracts, the Board requested and received additional information on certain topics, including (i) fund performance trends and actions to be taken by FMR to improve certain funds' overall performance; (ii) portfolio manager changes that have occurred during the past year; (iii) Fidelity's fund profitability methodology, the profitability of certain fund service providers, and profitability trends for certain funds; (iv) Fidelity's compensation structure for portfolio managers and key personnel, including its effects on fund profitability and the extent to which portfolio manager compensation is linked to fund performance; (v) Fidelity's fee structures and rationale for recommending different fees among categories of funds; and (vi) Fidelity's rationale for recommending which funds should have a performance adjustment component as part of their management fees.
Based on its evaluation of all of the conclusions noted above, and after considering all material factors, the Board ultimately concluded that the advisory fee structures are fair and reasonable, and that the fund's Advisory Contracts should be renewed.
Annual Report
Managing Your Investments
Fidelity offers several ways to conveniently manage your personal investments via your telephone or PC. You can access your account information, conduct trades and research your investments 24 hours a day.
By Phone
Fidelity Automated Service Telephone provides a single toll-free number to access account balances, positions, quotes and trading. It's easy to navigate the service, and on your first call, the system will help you create a personal identification number (PIN) for security.
(phone_graphic)
Fidelity Automated Service Telephone (FAST®)
1-800-544-5555
Press
For mutual fund and brokerage trading.
For quotes.*
For account balances and holdings.
To review orders and mutual fund activity.
To change your PIN.
To speak to a Fidelity representative.
By PC
Fidelity's web site on the Internet provides a wide range of information, including daily financial news, fund performance, interactive planning tools and news about Fidelity products and services.
(computer_graphic)
Fidelity's Web Site
www.fidelity.com
* When you call the quotes line, please remember that a fund's yield and return will vary and, except for money market funds, share price will also vary. This means that you may have a gain or loss when you sell your shares. There is no assurance that money market funds will be able to maintain a stable $1 share price; an investment in a money market fund is not insured or guaranteed by the U.S. government. Total returns are historical and include changes in share price, reinvestment of dividends and capital gains, and the effects of any sales charges.
Annual Report
To Write Fidelity
We'll give your correspondence immediate attention and send you written confirmation upon completion of your request.
(letter_graphic)
Making Changes
To Your Account
(such as changing name, address, bank, etc.)
Fidelity Investments
P.O. Box 770001
Cincinnati, OH 45277-0002
(letter_graphic)
For Non-Retirement
Accounts
Buying shares
Fidelity Investments
P.O. Box 770001
Cincinnati, OH 45277-0003
Overnight Express
Fidelity Investments
Attn: Distribution Services
100 Crosby Parkway - KC1H
Covington, KY 41015
Selling shares
Fidelity Investments
P.O. Box 770001
Cincinnati, OH 45277-0035
Overnight Express
Fidelity Investments
Attn: Distribution Services
100 Crosby Parkway - KC1H
Covington, KY 41015
General Correspondence
Fidelity Investments
P.O. Box 500
Merrimack, NH 03054-0500
(letter_graphic)
For Retirement
Accounts
Buying shares
Fidelity Investments
P.O. Box 770001
Cincinnati, OH 45277-0003
Selling shares
Fidelity Investments
P.O. Box 770001
Cincinnati, OH 45277-0035
Overnight Express
Fidelity Investments
Attn: Distribution Services
100 Crosby Parkway - KC1H
Covington, KY 41015
General Correspondence
Fidelity Investments
P.O. Box 500
Merrimack, NH 03054-0500
Annual Report
To Visit Fidelity
For directions and hours,
please call 1-800-544-9797.
Arizona
7001 West Ray Road
Chandler, AZ
15445 N. Scottsdale Road
Scottsdale, AZ
California
815 East Birch Street
Brea, CA
1411 Chapin Avenue
Burlingame, CA
851 East Hamilton Avenue
Campbell, CA
19200 Von Karman Avenue
Irvine, CA
601 Larkspur Landing Circle
Larkspur, CA
2000 Avenue of the Stars
Los Angeles, CA
27101 Puerta Real
Mission Viejo, CA
73-575 El Paseo
Palm Desert, CA
251 University Avenue
Palo Alto, CA
123 South Lake Avenue
Pasadena, CA
16656 Bernardo Ctr. Drive
Rancho Bernardo, CA
1220 Roseville Parkway
Roseville, CA
1740 Arden Way
Sacramento, CA
7676 Hazard Center Drive
San Diego, CA
11943 El Camino Real
San Diego, CA
8 Montgomery Street
San Francisco, CA
3793 State Street
Santa Barbara, CA
1200 Wilshire Boulevard
Santa Monica, CA
398 West El Camino Real
Sunnyvale, CA
111 South Westlake Blvd
Thousand Oaks, CA
21701 Hawthorne Boulevard
Torrance, CA
2001 North Main Street
Walnut Creek, CA
6326 Canoga Avenue
Woodland Hills, CA
Colorado
281 East Flatiron Circle
Broomfield, CO
1625 Broadway
Denver, CO
9185 Westview Road
Lone Tree, CO
Connecticut
48 West Putnam Avenue
Greenwich, CT
265 Church Street
New Haven, CT
300 Atlantic Street
Stamford, CT
29 South Main Street
West Hartford, CT
Delaware
400 Delaware Avenue
Wilmington, DE
Florida
175 East Altamonte Drive
Altamonte Springs, FL
4400 N. Federal Highway
Boca Raton, FL
121 Alhambra Plaza
Coral Gables, FL
2948 N. Federal Highway
Ft. Lauderdale, FL
4671 Town Center Parkway
Jacksonville, FL
8880 Tamiami Trail, North
Naples, FL
230 Royal Palm Way
Palm Beach, FL
3501 PGA Boulevard
Palm Beach Gardens, FL
3550 Tamiami Trail, South
Sarasota, FL
1502 N. Westshore Blvd.
Tampa, FL
2465 State Road 7
Wellington, FL
Georgia
3445 Peachtree Road, N.E.
Atlanta, GA
1000 Abernathy Road
Atlanta, GA
Illinois
One North LaSalle Street
Chicago, IL
401 North Michigan Avenue
Chicago, IL
One Skokie Valley Road
Highland Park, IL
1415 West 22nd Street
Oak Brook, IL
15105 S LaGrange Road
Orland Park, IL
1572 East Golf Road
Schaumburg, IL
Indiana
4729 East 82nd Street
Indianapolis, IN
8480 Keystone Crossing
Indianapolis, IN
Kansas
5400 College Boulevard
Overland Park, KS
Maine
Three Canal Plaza
Portland, ME
Maryland
7315 Wisconsin Avenue
Bethesda, MD
610 York Road
Towson, MD
Massachusetts
801 Boylston Street
Boston, MA
155 Congress Street
Boston, MA
300 Granite Street
Braintree, MA
44 Mall Road
Burlington, MA
238 Main Street
Cambridge, MA
200 Endicott Street
Danvers, MA
405 Cochituate Road
Framingham, MA
551 Boston Turnpike
Shrewsbury, MA
Michigan
500 E. Eisenhower Pkwy.
Ann Arbor, MI
280 Old N. Woodward Ave.
Birmingham, MI
30200 Northwestern Hwy.
Farmington Hills, MI
43420 Grand River Avenue
Novi, MI
Minnesota
7740 France Avenue South
Edina, MN
8342 3rd Street North
Oakdale, MN
Missouri
1524 South Lindbergh Blvd.
St. Louis, MO
Nevada
2225 Village Walk Drive
Henderson, NV
New Jersey
501 Route 73 South
Marlton, NJ
150 Essex Street
Millburn, NJ
35 Morris Street
Morristown, NJ
396 Route 17, North
Paramus, NJ
3518 Route 1 North
Princeton, NJ
530 Broad Street
Shrewsbury, NJ
New Mexico
2261 Q Street NE
Albuquerque, NM
New York
1130 Franklin Avenue
Garden City, NY
37 West Jericho Turnpike
Huntington Station, NY
1271 Avenue of the Americas
New York, NY
980 Madison Avenue
New York, NY
61 Broadway
New York, NY
350 Park Avenue
New York, NY
200 Fifth Avenue
New York, NY
733 Third Avenue
New York, NY
11 Penn Plaza
New York, NY
2070 Broadway
New York, NY
1075 Northern Blvd.
Roslyn, NY
799 Central Park Avenue
Scarsdale, NY
North Carolina
4611 Sharon Road
Charlotte, NC
7011 Fayetteville Road
Durham, NC
Ohio
3805 Edwards Road
Cincinnati, OH
1324 Polaris Parkway
Columbus, OH
1800 Crocker Road
Westlake, OH
28699 Chagrin Boulevard
Woodmere Village, OH
Oregon
7493 SW Bridgeport Road
Tigard, OR
Pennsylvania
600 West DeKalb Pike
King of Prussia, PA
1735 Market Street
Philadelphia, PA
12001 Perry Highway
Wexford, PA
Rhode Island
10 Memorial Boulevard
Providence, RI
Tennessee
3018 Peoples Street
Johnson City, TN
7628 West Farmington Blvd.
Germantown, TN
2035 Mallory Lane
Franklin, TN
Texas
10000 Research Boulevard
Austin, TX
4001 Northwest Parkway
Dallas, TX
12532 Memorial Drive
Houston, TX
2701 Drexel Drive
Houston, TX
6560 Fannin Street
Houston, TX
1701 Lake Robbins Drive
The Woodlands, TX
6500 N. MacArthur Blvd.
Irving, TX
6005 West Park Boulevard
Plano, TX
14100 San Pedro
San Antonio, TX
1576 East Southlake Blvd.
Southlake, TX
Utah
279 West South Temple
Salt Lake City, UT
Virginia
1861 International Drive
McLean, VA
Washington
10500 NE 8th Street
Bellevue, WA
1518 6th Avenue
Seattle, WA
Washington, DC
1900 K Street, N.W.
Washington, DC
Wisconsin
16020 West Bluemound Road
Brookfield, WI
Annual Report
Investment Adviser
Fidelity Management & Research Company
Boston, MA
Investment Sub-Advisers
FMR Co., Inc.
Fidelity Management & Research (U.K.) Inc.
Fidelity Research & Analysis Company
Fidelity Investments Japan Limited
FIL Investment Advisors
FIL Investment Advisors
(U.K.) Limited
Fidelity Management & Research
(Hong Kong) Limited
Fidelity Management & Research
(Japan) Inc.
General Distributor
Fidelity Distributors Corporation
Boston, MA
Transfer and Service Agents
Fidelity Investments Institutional
Operations Company, Inc.
Boston, MA
Fidelity Service Company, Inc.
Boston, MA
Custodians
JPMorgan Chase Bank
New York, NY
Fidelity's International Equity Funds
International Capital Appreciation Fund
Canada Fund
China Region Fund
Diversified International Fund
Emerging Markets Fund
Europe Fund
Europe Capital Appreciation Fund
Global Balanced Fund
Global Commodity Stock Fund
International Discovery Fund
International Growth Fund
International Small Cap Fund
International Small Cap Opportunities Fund
International Value Fund
Japan Fund
Japan Smaller Companies Fund
Latin America Fund
Nordic Fund
Overseas Fund
Pacific Basin Fund
Southeast Asia Fund
Total International Equity
Worldwide Fund
Corporate Headquarters
82 Devonshire Street
Boston, MA 02109
www.fidelity.com
The Fidelity Telephone Connection
Mutual Fund 24-Hour Service
Exchanges/Redemptions
and Account Assistance 1-800-544-6666
Product Information 1-800-544-8888
Retirement Accounts 1-800-544-4774
(8 a.m. - 9 p.m.)
TDD Service 1-800-544-0118
for the deaf and hearing impaired
(9 a.m. - 9 p.m. Eastern time)
Fidelity Automated Service
Telephone (FAST®) 1-800-544-5555
Automated line for quickest service
EMF-K-UANN-1208
1.863014.100
Fidelity®
Emerging Europe,
Middle East, Africa (EMEA)
Fund
Annual Report
October 31, 2008
(2_fidelity_logos) (Registered_Trademark)
Contents
Chairman's Message | <Click Here> | Ned Johnson's message to shareholders. |
Shareholder Expense Example | <Click Here> | An example of shareholder expenses. |
Investment Summary | <Click Here> | A summary of the fund's holdings. |
Investments | <Click Here> | A complete list of the fund's investments with their market values. |
Financial Statements | <Click Here> | Statements of assets and liabilities, operations, and changes in net assets, as well as financial highlights. |
Notes | <Click Here> | Notes to the financial statements. |
Report of Independent Registered Public Accounting Firm | <Click Here> | |
Trustees and Officers | <Click Here> | |
Board Approval of Investment Advisory Contracts and Management Fees | <Click Here> | |
To view a fund's proxy voting guidelines and proxy voting record for the 12-month period ended June 30, visit http://www.fidelity.com (search for "proxy voting guidelines") or visit the Securities and Exchange Commission's (SEC) web site at http://www.sec.gov. You may also call 1-800-544-8544 to request a free copy of the proxy voting guidelines.
Standard & Poor's, S&P and S&P 500 are registered service marks of The McGraw-Hill Companies, Inc. and have been licensed for use by Fidelity Distributors Corporation.
Other third party marks appearing herein are the property of their respective owners.
All other marks appearing herein are registered or unregistered trademarks or service marks of FMR LLC or an affiliated company.
Annual Report
This report and the financial statements contained herein are submitted for the general information of the shareholders of the fund. This report is not authorized for distribution to prospective investors in the fund unless preceded or accompanied by an effective prospectus.
A fund files its complete schedule of portfolio holdings with the SEC for the first and third quarters of each fiscal year on Form N-Q. Forms N-Q are available on the SEC's web site at http://www.sec.gov. A fund's Forms N-Q may be reviewed and copied at the SEC's Public Reference Room in Washington, DC. Information regarding the operation of the SEC's Public Reference Room may be obtained by calling 1-800-SEC-0330. For a complete list of a fund's portfolio holdings, view the most recent holdings listing, semiannual report, or annual report on Fidelity's web site at http://www.fidelity.com or http://advisor.fidelity.com, as applicable.
NOT FDIC INSURED · MAY LOSE VALUE · NO BANK GUARANTEE
Neither the fund nor Fidelity Distributors Corporation is a bank.
Annual Report
(photo_of_Edward_C_Johnson_3d)
Dear Shareholder:
Turmoil has been the watchword for the world's securities markets in 2008, with domestic and international stocks down sharply amid the global credit squeeze. A flight to quality boosted returns for U.S. Treasuries, one of the few asset classes with positive results heading into the latter stages of the year. Financial markets are always unpredictable, but there are a number of time-tested principles that can put the historical odds in your favor.
One of the basic tenets is to invest for the long term. Over time, riding out the markets' inevitable ups and downs has proven much more effective than selling into panic or chasing the hottest trend. Even missing only a few of the markets' best days can significantly diminish investor returns. Patience also affords the benefits of compounding - of earning interest on additional income or reinvested dividends and capital gains. There are tax advantages and cost benefits to consider as well. The more you sell, the more taxes you pay, and the more you trade, the higher the costs. While staying the course doesn't eliminate risk, it can considerably lessen the effect of short-term declines.
You can further manage your investing risk through diversification. And today, more than ever, geographic diversification should be taken into account. Studies indicate that asset allocation is the single most important determinant of a portfolio's long-term success. The right mix of stocks, bonds and cash - aligned to your particular risk tolerance and investment objective - is very important. Age-appropriate rebalancing is also an essential aspect of asset allocation. For younger investors, an emphasis on equities - which historically have been the best-performing asset class over time - is encouraged. As investors near their specific goal, such as retirement or sending a child to college, consideration may be given to replacing volatile assets (e.g. common stocks) with more-stable fixed investments (bonds or savings plans).
A third investment principle - investing regularly - can help lower the average cost of your purchases. Investing a certain amount of money each month or quarter helps ensure you won't pay for all your shares at market highs. This strategy - known as dollar cost averaging - also reduces unconstructive "emotion" from investing, helping shareholders avoid selling weak performers just prior to an upswing, or chasing a hot performer just before a correction.
We invite you to contact us via the Internet, through our Investor Centers or over the phone. It is our privilege to provide you the information you need to make the investments that are right for you.
Sincerely,
/s/Edward C. Johnson 3d
Edward C. Johnson 3d
Annual Report
Shareholder Expense Example
As a shareholder of the Fund, you incur two types of costs: (1) transaction costs, including sales charges (loads) on purchase payments or redemption proceeds, redemption fees, and (2) ongoing costs, including management fees, distribution and/or service (12b-1) fees and other Fund expenses. This Example is intended to help you understand your ongoing costs (in dollars) of investing in the Fund and to compare these costs with the ongoing costs of investing in other mutual funds.
The actual expense Example is based on an investment of $1,000 invested at the beginning of the period and held for the entire period (May 8, 2008 to October 31, 2008). The hypothetical expense Example is based on an investment of $1,000 invested for the one-half year period (May 1, 2008 to October 31, 2008).
Actual Expenses
The first line of the accompanying table for each class of the Fund provides information about actual account values and actual expenses. You may use the information in this line, together with the amount you invested, to estimate the expenses that you paid over the period. Simply divide your account value by $1,000.00 (for example, an $8,600 account value divided by $1,000.00 = 8.6), then multiply the result by the number in the first line for a class of the Fund under the heading entitled "Expenses Paid During Period" to estimate the expenses you paid on your account during this period. A small balance maintenance fee of $12.00 that is charged once a year may apply for certain accounts with a value of less than $2,000. This fee is not included in the table below. If it was, the estimate of expenses you paid during the period would be higher, and your ending account value lower, by this amount. In addition, the Fund, as a shareholder in the underlying Fidelity Central Funds, will indirectly bear its pro rata share of the fees and expenses incurred by the underlying Fidelity Central Funds. These fees and expenses are not included in the Fund's annualized expense ratio used to calculate the expense estimate in the table below.
Hypothetical Example for Comparison Purposes
The second line of the accompanying table for each class of the Fund provides information about hypothetical account values and hypothetical expenses based on a Class' actual expense ratio and an assumed rate of return of 5% per year before expenses, which is not the Class' actual return. The hypothetical account values and expenses may not be used to estimate the actual ending account balance or expenses you paid for the period. You may use this information to compare the ongoing costs of investing in the Fund and other funds. To do so, compare this 5% hypothetical example with the 5% hypothetical examples that appear in the shareholder reports of the other funds. A small balance maintenance fee of $12.00 that is charged once a year may apply for certain accounts with a value of less than $2,000. This fee is not included in the table below. If it was, the estimate of expenses you paid during the period would be higher, and your ending account value lower, by this amount. In addition, the Fund, as a shareholder in the underlying Fidelity Central Funds, will indirectly bear its pro rata share of the fees and expenses incurred by the underlying Fidelity Central Funds. These fees and expenses are not included in the Fund's annualized expense ratio used to calculate the expense estimate in the table below.
Annual Report
Shareholder Expense Example - continued
Please note that the expenses shown in the table are meant to highlight your ongoing costs only and do not reflect any transaction costs. Therefore, the second line of the table is useful in comparing ongoing costs only, and will not help you determine the relative total costs of owning different funds. In addition, if these transactional costs were included, your costs would have been higher.
| Annualized Expense Ratio | Beginning
Account Value | Ending
Account Value
October 31, 2008 | Expenses Paid
During Period |
Class A | 1.50% | | | |
Actual | | $ 1,000.00 | $ 475.00 | $ 5.35B |
HypotheticalA | | $ 1,000.00 | $ 1,017.60 | $ 7.61C |
Class T | 1.75% | | | |
Actual | | $ 1,000.00 | $ 475.00 | $ 6.24B |
HypotheticalA | | $ 1,000.00 | $ 1,016.34 | $ 8.87C |
Class B | 2.25% | | | |
Actual | | $ 1,000.00 | $ 473.00 | $ 8.01B |
HypotheticalA | | $ 1,000.00 | $ 1,013.83 | $ 11.39C |
Class C | 2.25% | | | |
Actual | | $ 1,000.00 | $ 473.00 | $ 8.01B |
HypotheticalA | | $ 1,000.00 | $ 1,013.83 | $ 11.39C |
Emerging Europe,
Middle East, Africa (EMEA) | 1.25% | | | |
Actual | | $ 1,000.00 | $ 476.00 | $ 4.46B |
HypotheticalA | | $ 1,000.00 | $ 1,018.85 | $ 6.34C |
Institutional Class | 1.25% | | | |
Actual | | $ 1,000.00 | $ 476.00 | $ 4.46B |
HypotheticalA | | $ 1,000.00 | $ 1,018.85 | $ 6.34C |
A 5% return per year before expenses
B Actual expenses are equal to each Class' annualized expense ratio, multiplied by the average account value over the period, multiplied by 177/366 (to reflect the period May 8, 2008 to October 31, 2008).
C Hypothetical expenses are equal to each Class' annualized expense ratio, multiplied by the average account value over the period, multiplied by 184/366 (to reflect the one-half year period).
Annual Report
Investment Summary (Unaudited)
Geographic Diversification (% of fund's net assets) |
As of October 31, 2008 |
 | South Africa 38.1% | |
 | Russia 30.8% | |
 | Israel 7.2% | |
 | Czech Republic 5.7% | |
 | United States of America 3.9% | |
 | Egypt 3.4% | |
 | Turkey 2.4% | |
 | Kenya 2.2% | |
 | Nigeria 2.0% | |
 | Other 4.3% | |

Percentages are adjusted for the effect of futures contracts, if applicable. |
Asset Allocation |
| % of fund's
net assets |
Stocks and Investment Companies | 96.1 |
Short-Term Investments and Net Other Assets | 3.9 |
Top Ten Stocks as of October 31, 2008 |
| % of fund's
net assets |
OAO Gazprom (Russia, Oil, Gas & Consumable Fuels) | 13.9 |
MTN Group Ltd. (South Africa, Wireless Telecommunication Services) | 8.9 |
Sasol Ltd. (South Africa, Oil, Gas & Consumable Fuels) | 6.5 |
Lukoil Oil Co. sponsored ADR (Russia, Oil, Gas & Consumable Fuels) | 6.4 |
Teva Pharmaceutical Industries Ltd. (Israel, Pharmaceuticals) | 6.7 |
Ceske Energeticke Zavody AS (Czech Republic, Electric Utilities) | 4.5 |
Harmony Gold Mining Co. Ltd. (South Africa, Metals & Mining) | 4.4 |
Raubex Group Ltd. (South Africa, Construction & Engineering) | 3.6 |
Exxaro Resources Ltd. (South Africa, Metals & Mining) | 2.9 |
Sberbank (Savings Bank of the Russian Federation) (Russia, Commercial Banks) | 2.6 |
| 60.4 |
Market Sectors as of October 31, 2008 |
| % of fund's
net assets |
Energy | 29.4 |
Materials | 16.3 |
Telecommunication Services | 16.1 |
Industrials | 9.1 |
Consumer Staples | 7.0 |
Health Care | 6.7 |
Utilities | 4.7 |
Financials | 4.4 |
Consumer Discretionary | 1.0 |
Information Technology | 0.3 |
Annual Report
Investments October 31, 2008
Showing Percentage of Net Assets
Common Stocks - 95.0% |
| Shares | | Value |
Canada - 0.2% |
Addax Petroleum, Inc. | 5,300 | | $ 79,118 |
Czech Republic - 5.7% |
Ceske Energeticke Zavody AS | 39,400 | | 1,704,984 |
Cesky Telecom AS | 22,291 | | 472,353 |
TOTAL CZECH REPUBLIC | | 2,177,337 |
Egypt - 3.4% |
Arab Cotton Ginning | 218,800 | | 137,203 |
EFG-Hermes Holding SAE | 36,600 | | 163,279 |
Egyptian Co. for Mobile Services (MobiNil) | 44,811 | | 851,100 |
Orascom Construction Industries | 4,280 | | 141,854 |
TOTAL EGYPT | | 1,293,436 |
Israel - 7.2% |
EL AL Israel Airlines Ltd. | 236,200 | | 54,736 |
Partner Communications Co. Ltd. ADR | 6,300 | | 117,684 |
Teva Pharmaceutical Industries Ltd. | 56,800 | | 2,316,489 |
Teva Pharmaceutical Industries Ltd. sponsored ADR | 6,600 | | 283,008 |
TOTAL ISRAEL | | 2,771,917 |
Kenya - 2.2% |
Athi River Mining Ltd. | 392,806 | | 465,621 |
British American Tobacco Kenya Ltd. | 30,000 | | 57,125 |
East African Breweries Ltd. | 209,743 | | 322,682 |
TOTAL KENYA | | 845,428 |
Nigeria - 2.0% |
Guaranty Trust Bank PLC (Reg. S) unit | 92,526 | | 508,893 |
Nigerian Breweries PLC | 853,181 | | 233,193 |
Zenith Bank PLC (a) | 200,000 | | 42,515 |
TOTAL NIGERIA | | 784,601 |
Poland - 1.6% |
Telekomunikacja Polska SA | 79,700 | | 599,617 |
Russia - 30.8% |
Comstar United TeleSystems OJSC GDR (Reg. S) | 52,000 | | 145,080 |
Lukoil Oil Co. sponsored ADR | 64,300 | | 2,456,260 |
Mobile TeleSystems OJSC sponsored ADR | 6,700 | | 262,305 |
OAO Gazprom | 1,058,700 | | 5,124,106 |
OAO Gazprom sponsored ADR (Reg. S) | 10,900 | | 216,583 |
OAO Tatneft | 405,200 | | 688,840 |
OJSC MMC Norilsk Nickel | 3,084 | | 300,690 |
Common Stocks - continued |
| Shares | | Value |
Russia - continued |
OJSC MMC Norilsk Nickel: | | | |
ADR | 23,900 | | $ 239,239 |
sponsored ADR | 16,400 | | 171,380 |
Polymetal JSC GDR (Reg. S) (a) | 289,000 | | 867,000 |
RusHydro OJSC (a) | 4,544,300 | | 83,615 |
Sberbank (Savings Bank of the Russian Federation) | 888,100 | | 923,624 |
Sberbank (Savings Bank of the Russian Federation) GDR | 500 | | 91,708 |
Vimpel Communications sponsored ADR | 11,100 | | 160,950 |
Wimm-Bill-Dann Foods OJSC sponsored ADR (a) | 2,200 | | 96,668 |
TOTAL RUSSIA | | 11,828,048 |
South Africa - 38.1% |
AFGRI Ltd. | 473,100 | | 213,064 |
Africa Cellular Towers Ltd. (a) | 2,702,300 | | 359,569 |
Austro Group Ltd. (a) | 411,000 | | 42,068 |
Aveng Ltd. | 96,100 | | 472,041 |
Cashbuild Ltd. | 38,475 | | 212,656 |
DRDGOLD Ltd. | 1,057,400 | | 422,094 |
Exxaro Resources Ltd. | 169,300 | | 1,115,959 |
Gold Fields Ltd. | 59,400 | | 413,725 |
Harmony Gold Mining Co. Ltd. (a) | 231,800 | | 1,696,181 |
Kwikspace Modular Buildings Ltd. | 936,224 | | 618,080 |
MTN Group Ltd. | 306,600 | | 3,420,614 |
Murray & Roberts Holdings Ltd. | 112,300 | | 758,399 |
Paracon Holdings Ltd. | 823,200 | | 106,165 |
Raubex Group Ltd. | 539,200 | | 1,393,531 |
Sasol Ltd. | 85,000 | | 2,509,980 |
Shoprite Holdings Ltd. | 138,200 | | 728,485 |
Zeder Investments Ltd. | 834,386 | | 136,645 |
TOTAL SOUTH AFRICA | | 14,619,256 |
Turkey - 2.4% |
Bim Birlesik Magazalar AS JSC | 42,000 | | 843,510 |
Tupras-Turkiye Petrol Rafinerileri AS | 5,000 | | 63,166 |
TOTAL TURKEY | | 906,676 |
United Kingdom - 1.0% |
Afren PLC (a) | 205,300 | | 157,504 |
Randgold Resources Ltd. sponsored ADR | 7,600 | | 235,676 |
TOTAL UNITED KINGDOM | | 393,180 |
Common Stocks - continued |
| Shares | | Value |
Zambia - 0.4% |
Celtel Zambia Ltd. | 1,355,201 | | $ 166,444 |
TOTAL COMMON STOCKS (Cost $67,520,085) | 36,465,058 |
Investment Companies - 1.1% |
| | | |
Canada - 1.1% |
Horizons BetaPro COMEX Gold Bullion Bull Plus ETF (a)
(Cost $752,672) | 45,500 | | 434,322 |
Money Market Funds - 5.3% |
| | | |
Fidelity Cash Central Fund, 1.81% (b)
(Cost $2,034,731) | 2,034,731 | | 2,034,731 |
TOTAL INVESTMENT PORTFOLIO - 101.4% (Cost $70,307,488) | | 38,934,111 |
NET OTHER ASSETS - (1.4)% | | (540,051) |
NET ASSETS - 100% | $ 38,394,060 |
Legend |
(a) Non-income producing |
(b) Affiliated fund that is available only to investment companies and other accounts managed by Fidelity Investments. The rate quoted is the annualized seven-day yield of the fund at period end. A complete unaudited listing of the fund's holdings as of its most recent quarter end is available upon request. |
Affiliated Central Funds |
Information regarding fiscal year to date income earned by the Fund from investments in Fidelity Central Funds is as follows: |
Fund | Income earned |
Fidelity Cash Central Fund | $ 55,332 |
Income Tax Information |
At October 31, 2008, the fund had a capital loss carryforward of approximately $9,997,975 all of which will expire on October 31, 2016. |
See accompanying notes which are an integral part of the financial statements.
Annual Report
Statement of Assets and Liabilities
| October 31, 2008 |
| | |
Assets | | |
Investment in securities, at value - See accompanying schedule: Unaffiliated issuers (cost $68,272,757) | $ 36,899,380 | |
Fidelity Central Funds (cost $2,034,731) | 2,034,731 | |
Total Investments (cost $70,307,488) | | $ 38,934,111 |
Receivable for investments sold | | 147,681 |
Receivable for fund shares sold | | 217,122 |
Dividends receivable | | 42,049 |
Distributions receivable from Fidelity Central Funds | | 1,244 |
Receivable from investment adviser for expense reductions | | 41,228 |
Other receivables | | 35,067 |
Total assets | | 39,418,502 |
| | |
Liabilities | | |
Payable to custodian bank | $ 132,397 | |
Payable for investments purchased | 600,641 | |
Payable for fund shares redeemed | 87,638 | |
Accrued management fee | 26,555 | |
Distribution fees payable | 1,620 | |
Other affiliated payables | 16,432 | |
Other payables and accrued expenses | 159,159 | |
Total liabilities | | 1,024,442 |
| | |
Net Assets | | $ 38,394,060 |
Net Assets consist of: | | |
Paid in capital | | $ 79,823,062 |
Undistributed net investment income | | 215,625 |
Accumulated undistributed net realized gain (loss) on investments and foreign currency transactions | | (10,269,495) |
Net unrealized appreciation (depreciation) on investments and assets and liabilities in foreign currencies | | (31,375,132) |
Net Assets | | $ 38,394,060 |
See accompanying notes which are an integral part of the financial statements.
Annual Report
Statement of Assets and Liabilities - continued
| October 31, 2008 |
| | |
Calculation of Maximum Offering Price Class A:
Net Asset Value and redemption price per share ($1,368,278 ÷ 287,952 shares) | | $ 4.75 |
| | |
Maximum offering price per share (100/94.25 of $4.75) | | $ 5.04 |
Class T:
Net Asset Value and redemption price per share ($567,501 ÷ 119,577 shares) | | $ 4.75 |
| | |
Maximum offering price per share (100/96.50 of $4.75) | | $ 4.92 |
Class B:
Net Asset Value and offering price per share
($487,381 ÷ 102,948 shares)A | | $ 4.73 |
| | |
Class C:
Net Asset Value and offering price per share
($740,888 ÷ 156,496 shares)A | | $ 4.73 |
| | |
Emerging Europe, Middle East, Africa (EMEA):
Net Asset Value, offering price and redemption price per share ($32,534,805 ÷ 6,838,077 shares) | | $ 4.76 |
| | |
Institutional Class:
Net Asset Value, offering price and redemption price per share ($2,695,207 ÷ 566,502 shares) | | $ 4.76 |
A Redemption price per share is equal to net asset value less any applicable contingent deferred sales charge.
See accompanying notes which are an integral part of the financial statements.
Annual Report
Financial Statements - continued
Statement of Operations
| For the period May 8, 2008
(commencement of operations) to
October 31, 2008 |
| | |
Investment Income | | |
Dividends | | $ 559,154 |
Interest | | 16,892 |
Income from Fidelity Central Funds | | 55,332 |
| | 631,378 |
Less foreign taxes withheld | | (19,984) |
Total income | | 611,394 |
| | |
Expenses | | |
Management fee | $ 199,081 | |
Transfer agent fees | 78,494 | |
Distribution fees | 12,456 | |
Accounting fees and expenses | 12,758 | |
Custodian fees and expenses | 155,316 | |
Independent trustees' compensation | 95 | |
Registration fees | 55,550 | |
Audit | 49,557 | |
Total expenses before reductions | 563,307 | |
Expense reductions | (303,697) | 259,610 |
Net investment income (loss) | | 351,784 |
Realized and Unrealized Gain (Loss) Net realized gain (loss) on: | | |
Investment securities: | | |
Unaffiliated issuers | (10,268,466) | |
Foreign currency transactions | (137,188) | |
Total net realized gain (loss) | | (10,405,654) |
Change in net unrealized appreciation (depreciation) on: Investment securities | (31,373,377) | |
Assets and liabilities in foreign currencies | (1,755) | |
Total change in net unrealized appreciation (depreciation) | | (31,375,132) |
Net gain (loss) | | (41,780,786) |
Net increase (decrease) in net assets resulting from operations | | $ (41,429,002) |
See accompanying notes which are an integral part of the financial statements.
Annual Report
Statement of Changes in Net Assets
| For the period
May 8, 2008
(commencement of operations) to
October 31, 2008 |
Increase (Decrease) in Net Assets | |
Operations | |
Net investment income (loss) | $ 351,784 |
Net realized gain (loss) | (10,405,654) |
Change in net unrealized appreciation (depreciation) | (31,375,132) |
Net increase (decrease) in net assets resulting from operations | (41,429,002) |
Share transactions - net increase (decrease) | 79,670,886 |
Redemption fees | 152,176 |
Total increase (decrease) in net assets | 38,394,060 |
| |
Net Assets | |
Beginning of period | - |
End of period (including undistributed net investment income of $215,625) | $ 38,394,060 |
See accompanying notes which are an integral part of the financial statements.
Annual Report
Financial Highlights - Class A
Year ended October 31, | 2008 H |
Selected Per-Share Data | |
Net asset value, beginning of period | $ 10.00 |
Income from Investment Operations | |
Net investment income (loss) E | .04 |
Net realized and unrealized gain (loss) | (5.31) |
Total from investment operations | (5.27) |
Redemption fees added to paid in capital E | .02 |
Net asset value, end of period | $ 4.75 |
Total Return B, C, D | (52.50)% |
Ratios to Average Net Assets F, I | |
Expenses before reductions | 2.50% A |
Expenses net of fee waivers, if any | 1.50% A |
Expenses net of all reductions | 1.23% A |
Net investment income (loss) | 1.20% A |
Supplemental Data | |
Net assets, end of period (000 omitted) | $ 1,368 |
Portfolio turnover rate G | 68% |
A Annualized
B Total returns for periods of less than one year are not annualized.
C Total returns would have been lower had certain expenses not been reduced during the periods shown.
D Total returns do not include the effect of the sales charges.
E Calculated based on average shares outstanding during the period.
F Fees and expenses of the underlying Fidelity Central Funds are not included in the Fund's expense ratio. The Fund indirectly bears its proportionate share of the expenses of any underlying Fidelity Central Funds.
G Amount does not include the portfolio activity of any underlying Fidelity Central Funds.
H For the period May 8, 2008 (commencement of operations) to October 31, 2008.
I Expense ratios reflect operating expenses of the class. Expenses before reductions do not reflect amounts reimbursed by the investment adviser or reductions from brokerage service arrangements or other expense offset arrangements and do not represent the amount paid by the class during periods when reimbursements or reductions occur. Expense ratios before reductions for start-up periods may not be representative of longer-term operating periods. Expenses net of fee waivers reflect expenses after reimbursement by the investment adviser but prior to reductions from brokerage service arrangements or other expense offset arrangements. Expenses net of all reductions represent the net expenses paid by the class.
See accompanying notes which are an integral part of the financial statements.
Annual Report
Financial Highlights - Class T
Year ended October 31, | 2008 H |
Selected Per-Share Data | |
Net asset value, beginning of period | $ 10.00 |
Income from Investment Operations | |
Net investment income (loss) E | .04 |
Net realized and unrealized gain (loss) | (5.31) |
Total from investment operations | (5.27) |
Redemption fees added to paid in capital E | .02 |
Net asset value, end of period | $ 4.75 |
Total Return B, C, D | (52.50)% |
Ratios to Average Net Assets F, I | |
Expenses before reductions | 2.78% A |
Expenses net of fee waivers, if any | 1.75% A |
Expenses net of all reductions | 1.49% A |
Net investment income (loss) | .95% A |
Supplemental Data | |
Net assets, end of period (000 omitted) | $ 568 |
Portfolio turnover rate G | 68% |
A Annualized
B Total returns for periods of less than one year are not annualized.
C Total returns would have been lower had certain expenses not been reduced during the periods shown.
D Total returns do not include the effect of the sales charges.
E Calculated based on average shares outstanding during the period.
F Fees and expenses of the underlying Fidelity Central Funds are not included in the Fund's expense ratio. The Fund indirectly bears its proportionate share of the expenses of any underlying Fidelity Central Funds.
G Amount does not include the portfolio activity of any underlying Fidelity Central Funds.
H For the period May 8, 2008 (commencement of operations) to October 31, 2008.
I Expense ratios reflect operating expenses of the class. Expenses before reductions do not reflect amounts reimbursed by the investment adviser or reductions from brokerage service arrangements or other expense offset arrangements and do not represent the amount paid by the class during periods when reimbursements or reductions occur. Expense ratios before reductions for start-up periods may not be representative of longer-term operating periods. Expenses net of fee waivers reflect expenses after reimbursement by the investment adviser but prior to reductions from brokerage service arrangements or other expense offset arrangements. Expenses net of all reductions represent the net expenses paid by the class.
See accompanying notes which are an integral part of the financial statements.
Annual Report
Financial Highlights - Class B
Year ended October 31, | 2008 H |
Selected Per-Share Data | |
Net asset value, beginning of period | $ 10.00 |
Income from Investment Operations | |
Net investment income (loss) E | .02 |
Net realized and unrealized gain (loss) | (5.31) |
Total from investment operations | (5.29) |
Redemption fees added to paid in capital E | .02 |
Net asset value, end of period | $ 4.73 |
Total Return B, C, D | (52.70)% |
Ratios to Average Net Assets F, I | |
Expenses before reductions | 3.32% A |
Expenses net of fee waivers, if any | 2.25% A |
Expenses net of all reductions | 1.99% A |
Net investment income (loss) | .45% A |
Supplemental Data | |
Net assets, end of period (000 omitted) | $ 487 |
Portfolio turnover rate G | 68% |
A Annualized
B Total returns for periods of less than one year are not annualized.
C Total returns would have been lower had certain expenses not been reduced during the periods shown.
D Total returns do not include the effect of the contingent deferred sales charge.
E Calculated based on average shares outstanding during the period.
F Fees and expenses of the underlying Fidelity Central Funds are not included in the Fund's expense ratio. The Fund indirectly bears its proportionate share of the expenses of any underlying Fidelity Central Funds.
G Amount does not include the portfolio activity of any underlying Fidelity Central Funds.
H For the period May 8, 2008 (commencement of operations) to October 31, 2008.
I Expense ratios reflect operating expenses of the class. Expenses before reductions do not reflect amounts reimbursed by the investment adviser or reductions from brokerage service arrangements or other expense offset arrangements and do not represent the amount paid by the class during periods when reimbursements or reductions occur. Expense ratios before reductions for start-up periods may not be representative of longer-term operating periods. Expenses net of fee waivers reflect expenses after reimbursement by the investment adviser but prior to reductions from brokerage service arrangements or other expense offset arrangements. Expenses net of all reductions represent the net expenses paid by the class.
See accompanying notes which are an integral part of the financial statements.
Annual Report
Financial Highlights - Class C
Year ended October 31, | 2008 H |
Selected Per-Share Data | |
Net asset value, beginning of period | $ 10.00 |
Income from Investment Operations | |
Net investment income (loss) E | .02 |
Net realized and unrealized gain (loss) | (5.31) |
Total from investment operations | (5.29) |
Redemption fees added to paid in capital E | .02 |
Net asset value, end of period | $ 4.73 |
Total Return B, C, D | (52.70)% |
Ratios to Average Net Assets F, I | |
Expenses before reductions | 3.28% A |
Expenses net of fee waivers, if any | 2.25% A |
Expenses net of all reductions | 1.99% A |
Net investment income (loss) | .45% A |
Supplemental Data | |
Net assets, end of period (000 omitted) | $ 741 |
Portfolio turnover rate G | 68% |
A Annualized
B Total returns for periods of less than one year are not annualized.
C Total returns would have been lower had certain expenses not been reduced during the periods shown.
D Total returns do not include the effect of the contingent deferred sales charge.
E Calculated based on average shares outstanding during the period.
F Fees and expenses of the underlying Fidelity Central Funds are not included in the Fund's expense ratio. The Fund indirectly bears its proportionate share of the expenses of any underlying Fidelity Central Funds.
G Amount does not include the portfolio activity of any underlying Fidelity Central Funds.
H For the period May 8, 2008 (commencement of operations) to October 31, 2008.
I Expense ratios reflect operating expenses of the class. Expenses before reductions do not reflect amounts reimbursed by the investment adviser or reductions from brokerage service arrangements or other expense offset arrangements and do not represent the amount paid by the class during periods when reimbursements or reductions occur. Expense ratios before reductions for start-up periods may not be representative of longer-term operating periods. Expenses net of fee waivers reflect expenses after reimbursement by the investment adviser but prior to reductions from brokerage service arrangements or other expense offset arrangements. Expenses net of all reductions represent the net expenses paid by the class.
See accompanying notes which are an integral part of the financial statements.
Annual Report
Financial Highlights - Emerging Europe, Middle East, Africa (EMEA)
Year ended October 31, | 2008 G |
Selected Per-Share Data | |
Net asset value, beginning of period | $ 10.00 |
Income from Investment Operations | |
Net investment income (loss) D | .05 |
Net realized and unrealized gain (loss) | (5.31) |
Total from investment operations | (5.26) |
Redemption fees added to paid in capital D | .02 |
Net asset value, end of period | $ 4.76 |
Total Return B, C | (52.40)% |
Ratios to Average Net Assets E, H | |
Expenses before reductions | 2.19% A |
Expenses net of fee waivers, if any | 1.25% A |
Expenses net of all reductions | .98% A |
Net investment income (loss) | 1.45% A |
Supplemental Data | |
Net assets, end of period (000 omitted) | $ 32,535 |
Portfolio turnover rate F | 68% |
A Annualized
B Total returns for periods of less than one year are not annualized.
C Total returns would have been lower had certain expenses not been reduced during the periods shown.
D Calculated based on average shares outstanding during the period.
E Fees and expenses of the underlying Fidelity Central Funds are not included in the Fund's expense ratio. The Fund indirectly bears its proportionate share of the expenses of any underlying Fidelity Central Funds.
F Amount does not include the portfolio activity of any underlying Fidelity Central Funds.
G For the period May 8, 2008 (commencement of operations) to October 31, 2008.
H Expense ratios reflect operating expenses of the class. Expenses before reductions do not reflect amounts reimbursed by the investment adviser or reductions from brokerage service arrangements or other expense offset arrangements and do not represent the amount paid by the class during periods when reimbursements or reductions occur. Expense ratios before reductions for start-up periods may not be representative of longer-term operating periods. Expenses net of fee waivers reflect expenses after reimbursement by the investment adviser but prior to reductions from brokerage service arrangements or other expense offset arrangements. Expenses net of all reductions represent the net expenses paid by the class.
See accompanying notes which are an integral part of the financial statements.
Annual Report
Financial Highlights - Institutional Class
Year ended October 31, | 2008 G |
Selected Per-Share Data | |
Net asset value, beginning of period | $ 10.00 |
Income from Investment Operations | |
Net investment income (loss) D | .05 |
Net realized and unrealized gain (loss) | (5.31) |
Total from investment operations | (5.26) |
Redemption fees added to paid in capital D | .02 |
Net asset value, end of period | $ 4.76 |
Total Return B, C | (52.40)% |
Ratios to Average Net Assets E, H | |
Expenses before reductions | 2.12% A |
Expenses net of fee waivers, if any | 1.25% A |
Expenses net of all reductions | .98% A |
Net investment income (loss) | 1.46% A |
Supplemental Data | |
Net assets, end of period (000 omitted) | $ 2,695 |
Portfolio turnover rate F | 68% |
A Annualized
B Total returns for periods of less than one year are not annualized.
C Total returns would have been lower had certain expenses not been reduced during the periods shown.
D Calculated based on average shares outstanding during the period.
E Fees and expenses of the underlying Fidelity Central Funds are not included in the Fund's expense ratio. The Fund indirectly bears its proportionate share of the expenses of any underlying Fidelity Central Funds.
F Amount does not include the portfolio activity of any underlying Fidelity Central Funds.
G For the period May 8, 2008 (commencement of operations) to October 31, 2008.
H Expense ratios reflect operating expenses of the class. Expenses before reductions do not reflect amounts reimbursed by the investment adviser or reductions from brokerage service arrangements or other expense offset arrangements and do not represent the amount paid by the class during periods when reimbursements or reductions occur. Expense ratios before reductions for start-up periods may not be representative of longer-term operating periods. Expenses net of fee waivers reflect expenses after reimbursement by the investment adviser but prior to reductions from brokerage service arrangements or other expense offset arrangements. Expenses net of all reductions represent the net expenses paid by the class.
See accompanying notes which are an integral part of the financial statements.
Annual Report
Notes to Financial Statements
For the period ended October 31, 2008
1. Organization.
Fidelity Emerging Europe, Middle East, Africa (EMEA) Fund (the Fund) is a non-diversified fund of Fidelity Investment Trust (the trust) and is authorized to issue an unlimited number of shares. The trust is registered under the Investment Company Act of 1940, as amended (the 1940 Act), as an open-end management investment company organized as a Massachusetts business trust. The Fund offers Class A, Class T, Class B, Class C, Emerging Europe, Middle East, Africa (EMEA), and Institutional Class shares, each of which has equal rights as to assets and voting privileges. Each class has exclusive voting rights with respect to matters that affect that class. Class B shares will automatically convert to Class A shares after a holding period of seven years from the initial date of purchase. Investment income, realized and unrealized capital gains and losses, the common expenses of the Fund, and certain fund-level expense reductions, if any, are allocated on a pro rata basis to each class based on the relative net assets of each class to the total net assets of the Fund. Each class differs with respect to transfer agent and distribution and service plan fees incurred. Certain expense reductions also differ by class. The Fund's investments in emerging markets can be subject to social economic, regulatory, and political uncertainties and can be extremely volatile.
2. Investments in Fidelity Central Funds.
The Fund may invest in Fidelity Central Funds, which are open-end investment companies available only to other investment companies and accounts managed by Fidelity Management & Research Company (FMR) and its affiliates. The Fund's Schedule of Investments lists each of the Fidelity Central Funds held as of period end, if any, as an investment of the Fund, but does not include the underlying holdings of each Fidelity Central Fund. As an Investing Fund, the Fund indirectly bears its proportionate share of the expenses of the underlying Fidelity Central Funds.
The Money Market Central Funds seek preservation of capital and current income and are managed by Fidelity Investments Money Management, Inc. (FIMM), an affiliate of FMR.
A complete unaudited list of holdings for each Fidelity Central Fund is available upon request or at the SEC's web site at www.sec.gov. In addition, the financial statements of the Fidelity Central Funds, which are not covered by the Fund's Report of Independent Registered Public Accounting Firm, are available on the SEC's web site or upon request.
Annual Report
3. Significant Accounting Policies.
The financial statements have been prepared in conformity with accounting principles generally accepted in the United States of America, which require management to make certain estimates and assumptions at the date of the financial statements. Actual results could differ from those estimates. The following summarizes the significant accounting policies of the Fund:
Security Valuation. Investments are valued as of 4:00 p.m. Eastern time on the last calendar day of the period. Wherever possible, the Fund uses independent pricing services approved by the Board of Trustees to value its investments.
Equity securities, including restricted securities, for which market quotations are readily available, are valued at the last reported sale price or official closing price as reported by an independent pricing service on the primary market or exchange on which they are traded. In the event there were no sales during the day or closing prices are not available, securities are valued at the last quoted bid price. Investments in open-end mutual funds, including the Fidelity Central Funds, are valued at their closing net asset value each business day. Short-term securities with remaining maturities of sixty days or less for which quotations are not readily available are valued at amortized cost, which approximates value.
When current market prices or quotations are not readily available or reliable, valuations may be determined in good faith in accordance with procedures adopted by the Board of Trustees. Factors used in determining value may include significant market or security specific events, changes in interest rates and credit quality, and developments in foreign markets which are monitored by evaluating the performance of ADRs, futures contracts and exchange-traded funds. The frequency with which these procedures are used cannot be predicted and may be utilized to a significant extent. The value of securities used for net asset value (NAV) calculation under these procedures may differ from published prices for the same securities.
Foreign Currency. The Fund uses foreign currency contracts to facilitate transactions in foreign-denominated securities. Losses from these transactions may arise from changes in the value of the foreign currency or if the counterparties do not perform under the contracts' terms.
Foreign-denominated assets, including investment securities, and liabilities are translated into U.S. dollars at the exchange rate at period end. Purchases and sales of investment securities, income and dividends received and expenses denominated in foreign currencies are translated into U.S. dollars at the exchange rate in effect on the transaction date.
Annual Report
Notes to Financial Statements - continued
3. Significant Accounting Policies - continued
Foreign Currency - continued
The effects of exchange rate fluctuations on investments are included with the net realized and unrealized gain (loss) on investment securities. Other foreign currency transactions resulting in realized and unrealized gain (loss) are disclosed separately.
Investment Transactions and Income. For financial reporting purposes, the Fund's investment holdings and NAV include trades executed through the end of the last business day of the period. The NAV per share for processing shareholder transactions is calculated as of the close of business of the New York Stock Exchange (NYSE), normally 4:00 p.m. Eastern time and includes trades executed through the end of the prior business day. Gains and losses on securities sold are determined on the basis of identified cost. Dividend income is recorded on the ex-dividend date, except for certain dividends from foreign securities where the ex-dividend date may have passed, which are recorded as soon as the Fund is informed of the ex-dividend date. Non-cash dividends included in dividend income, if any, are recorded at the fair market value of the securities received. Interest income and distributions from the Fidelity Central Funds are accrued as earned. Interest income includes coupon interest and amortization of premium and accretion of discount on debt securities. Investment income is recorded net of foreign taxes withheld where recovery of such taxes is uncertain.
Expenses. Most expenses of the trust can be directly attributed to a fund. Expenses which cannot be directly attributed are apportioned among each Fund in the trust. Expense estimates are accrued in the period to which they relate and adjustments are made when actual amounts are known.
Income Tax Information and Distributions to Shareholders. Each year, the Fund intends to qualify as a regulated investment company by distributing substantially all of its taxable income and realized gains under Subchapter M of the Internal Revenue Code and filing its U.S. federal tax return. As a result, no provision for income taxes is required. The Fund is subject to the provisions of FASB Interpretation No. 48, Accounting for Uncertainties in Income Taxes (FIN 48). FIN 48 sets forth a minimum threshold for financial statement recognition of the benefit of a tax position taken or expected to be taken in a tax return. There are no unrecognized tax benefits in the accompanying financial statements in connection with the tax positions expected to be taken in the initial filing of the Fund's federal tax return. Foreign taxes are provided for based on the Fund's understanding of the tax rules and rates that exist in the foreign markets in which it invests.
Annual Report
3. Significant Accounting Policies - continued
Income Tax Information and Distributions to Shareholders - continued
Distributions are recorded on the ex-dividend date. Income dividends and capital gain distributions are declared separately for each class. Income and capital gain distributions are determined in accordance with income tax regulations, which may differ from generally accepted accounting principles. In addition, the Fund will claim a portion of the payment made to redeeming shareholders as a distribution for income tax purposes.
Capital accounts within the financial statements are adjusted for permanent book-tax differences. These adjustments have no impact on net assets or the results of operations. Temporary book-tax differences will reverse in a subsequent period.
Book-tax differences are primarily due to foreign currency transactions, passive foreign investment companies (PFIC), capital loss carryforwards and losses deferred due to wash sales.
The tax-basis components of distributable earnings and the federal tax cost as of period end were as follows:
Unrealized appreciation | $ 544,450 |
Unrealized depreciation | (32,191,102) |
Net unrealized appreciation (depreciation) | (31,646,652) |
Undistributed ordinary income | 215,374 |
Capital loss carryforward | (9,997,975) |
| |
Cost for federal income tax purposes | $ 70,580,763 |
Short-Term Trading (Redemption) Fees. Shares held in the Fund less than 90 days are subject to a redemption fee equal to 1.50% of the proceeds of the redeemed shares. All redemption fees, including any estimated redemption fees paid by FMR, are retained by the Fund and accounted for as an addition to paid in capital.
New Accounting Pronouncement. In September 2006, Statement of Financial Accounting Standards No. 157, Fair Value Measurements (SFAS 157), was issued and is effective for fiscal years beginning after November 15, 2007. SFAS 157 defines fair value, establishes a framework for measuring fair value and results in expanded disclosures about fair value measurements. The Fund will adopt the provisions of SFAS 157 effective for its fiscal year beginning November 1, 2008.
4. Operating Policies.
Repurchase Agreements. FMR has received an Exemptive Order from the Securities and Exchange Commission (the SEC) which permits the Fund and other affiliated entities of FMR to transfer uninvested cash balances into joint trading accounts which are then invested in repurchase agreements. The Fund may also invest directly with
Annual Report
Notes to Financial Statements - continued
4. Operating Policies - continued
Repurchase Agreements - continued
institutions in repurchase agreements. Repurchase agreements are collateralized by government or non-government securities. Upon settlement date, collateral is held in segregated accounts with custodian banks and may be obtained in the event of a default of the counterparty. The Fund monitors, on a daily basis, the value of the collateral to ensure it is at least equal to the principal amount of the repurchase agreement (including accrued interest). In the event of a default by the counterparty, realization of the collateral proceeds could be delayed, during which time the value of the collateral may decline.
5. Purchases and Sales of Investments.
Purchases and sales of securities, other than short-term securities, aggregated $111,504,337 and $32,962,700, respectively.
6. Fees and Other Transactions with Affiliates.
Management Fee. FMR and its affiliates provide the Fund with investment management related services for which the Fund pays a monthly management fee. The management fee is the sum of an individual fund fee rate that is based on an annual rate of .55% of the Fund's average net assets and a group fee rate that averaged .26% during the period. The group fee rate is based upon the average net assets of all the mutual funds advised by FMR. The group fee rate decreases as assets under management increase and increases as assets under management decrease. For the period, the total annualized management fee rate was .81% of the Fund's average net assets.
Distribution and Service Plan. In accordance with Rule 12b-1 of the 1940 Act, the Fund has adopted separate Distribution and Service Plans for each class of shares. Certain classes pay Fidelity Distributors Corporation (FDC), an affiliate of FMR, separate Distribution and Service Fees, each of which is based on an annual percentage of each class' average net assets. In addition, FDC may pay financial intermediaries for selling shares of the Fund and providing shareholder support services. For the period, the Distribution and Service Fee rates and the total amounts paid to and retained by FDC were as follows:
| Distribution
Fee | Service
Fee | Paid to
FDC | Retained
by FDC |
Class A | .00% | .25% | $ 1,896 | $ 761 |
Class T | .25% | .25% | 2,000 | 1,515 |
Class B | .75% | .25% | 3,632 | 3,482 |
Class C | .75% | .25% | 4,928 | 4,437 |
| | | $ 12,456 | $ 10,195 |
Annual Report
6. Fees and Other Transactions with Affiliates - continued
Sales Load. FDC receives a front-end sales charge of up to 5.75% for selling Class A shares, and 3.50% for selling Class T shares, some of which is paid to financial intermediaries for selling shares of the Fund. FDC receives the proceeds of contingent deferred sales charges levied on Class A, Class T, Class B, and Class C redemptions. These charges depend on the holding period. The deferred sales charges range from 5% to 1% for Class B, 1% for Class C, 1.00% to .50% for certain purchases of Class A shares and .25% for certain purchases of Class T shares.
For the period, sales charge amounts retained by FDC were as follows:
| Retained
by FDC |
Class A | $ 5,923 |
Class T | 524 |
Class B* | 513 |
Class C* | 272 |
| $ 7,232 |
* When Class B and Class C shares are initially sold, FDC pays commissions from its own resources to financial intermediaries through which the sales are made.
Transfer Agent Fees. Fidelity Investments Institutional Operations Company, Inc. (FIIOC), an affiliate of FMR, is the transfer, dividend disbursing and shareholder servicing agent for each class of the Fund. FIIOC receives account fees and asset-based fees that vary according to the account size and type of account of the shareholders of the respective classes of the Fund. FIIOC pays for typesetting, printing and mailing of shareholder reports, except proxy statements. For the period, the total transfer agent fees paid by each class were as follows:
| Amount | % of
Average
Net Assets* |
Class A | $ 2,312 | .31 |
Class T | 907 | .23 |
Class B | 902 | .25 |
Class C | 1,374 | .28 |
Emerging Europe, Middle East, Africa (EMEA) | 71,417 | .33 |
Institutional Class | 1,582 | .20 |
| $ 78,494 | |
* Annualized
Annual Report
Notes to Financial Statements - continued
6. Fees and Other Transactions with Affiliates - continued
Accounting Fees. Fidelity Service Company, Inc. (FSC), an affiliate of FMR, maintains the Fund's accounting records. The fee is based on the level of average net assets for the month.
Brokerage Commissions. The Fund placed a portion of its portfolio transactions with brokerage firms which are affiliates of the investment adviser. The commissions paid to these affiliated firms were $166 for the period.
7. Expense Reductions.
FMR voluntarily agreed to reimburse each class to the extent annual operating expenses exceeded certain levels of average net assets as noted in the table below. Some expenses, for example interest expense, are excluded from this reimbursement.
The following classes were in reimbursement during the period:
| Expense
Limitations | Reimbursement
from adviser |
Class A | 1.50% | $ 7,707 |
Class T | 1.75% | 4,165 |
Class B | 2.25% | 3,924 |
Class C | 2.25% | 5,138 |
Emerging Europe, Middle East, Africa (EMEA) | 1.25% | 208,302 |
Institutional Class | 1.25% | 7,188 |
| | $ 236,424 |
Many of the brokers with whom FMR places trades on behalf of the Fund provided services to the Fund in addition to trade execution. These services included payments of certain expenses on behalf of the Fund totaling $65,477 for the period. In addition, through arrangements with the Fund's custodian and each class' transfer agent, credits realized as a result of uninvested cash balances were used to reduce the Fund's expenses. During the period, these credits reduced the Fund's custody expenses by $1,796.
8. Other.
The Fund's organizational documents provide former and current trustees and officers with a limited indemnification against liabilities arising in connection with the performance of their duties to the Fund. In the normal course of business, the Fund may also enter into contracts that provide general indemnifications. The Fund's maximum
Annual Report
8. Other - continued
exposure under these arrangements is unknown as this would be dependent on future claims that may be made against the Fund. The risk of material loss from such claims is considered remote.
At the end of the period, FMR or its affiliates were the owners of record of 32% of the total outstanding shares of the Fund.
9. Share Transactions.
Transactions for each class of shares were as follows:
| SharesA | DollarsA |
Year ended October 31, | 2008 | 2008 |
Class A | | |
Shares sold | 344,487 | $ 3,038,678 |
Shares redeemed | (56,535) | (363,899) |
Net increase (decrease) | 287,952 | $ 2,674,779 |
Class T | | |
Shares sold | 130,067 | $ 1,228,022 |
Shares redeemed | (10,490) | (50,821) |
Net increase (decrease) | 119,577 | $ 1,177,201 |
Class B | | |
Shares sold | 115,650 | $ 1,098,908 |
Shares redeemed | (12,702) | (76,194) |
Net increase (decrease) | 102,948 | $ 1,022,714 |
Class C | | |
Shares sold | 174,986 | $ 1,629,690 |
Shares redeemed | (18,490) | (109,269) |
Net increase (decrease) | 156,496 | $ 1,520,421 |
Emerging Europe, Middle East, Africa (EMEA) | | |
Shares sold | 10,218,704 | $ 92,385,312 |
Shares redeemed | (3,380,627) | (23,437,711) |
Net increase (decrease) | 6,838,077 | $ 68,947,601 |
Institutional Class | | |
Shares sold | 598,356 | $ 4,518,354 |
Shares redeemed | (31,854) | (190,184) |
Net increase (decrease) | 566,502 | $ 4,328,170 |
A For the period May 8, 2008 (commencement of operations) to October 31, 2008.
Annual Report
To the Trustees of Fidelity Investment Trust and Shareholders of Fidelity Emerging Europe, Middle East, Africa (EMEA) Fund:
We have audited the accompanying statement of assets and liabilities of Fidelity Emerging Europe, Middle East, Africa (EMEA) Fund (the Fund), a fund of Fidelity Investment Trust, including the schedule of investments, as of October 31, 2008, and the related statement of operations, the statement of changes in net assets and the financial highlights for the period from May 8, 2008 (Commencement of Operations) to October 31, 2008. These financial statements and financial highlights are the responsibility of the Fund's management. Our responsibility is to express an opinion on these financial statements and financial highlights based on our audit.
We conducted our audit in accordance with standards of the Public Company Accounting Oversight Board (United States). Those standards require that we plan and perform the audit to obtain reasonable assurance about whether the financial statements and financial highlights are free of material misstatement. The Fund is not required to have, nor were we engaged to perform, an audit of its internal control over financial reporting. Our audits included consideration of internal control over financial reporting as a basis for designing audit procedures that are appropriate in the circumstances, but not for the purpose of expressing an opinion on the effectiveness of the Fund's internal control over financial reporting. Accordingly, we express no such opinion. An audit also includes examining, on a test basis, evidence supporting the amounts and disclosures in the financial statements, assessing the accounting principles used and significant estimates made by management, as well as evaluating the overall financial statement presentation. Our procedures included confirmation of securities owned as of October 31, 2008, by correspondence with the custodians and brokers; where replies were not received from brokers, we performed other auditing procedures. We believe that our audit provides a reasonable basis for our opinion.
In our opinion, the financial statements and financial highlights referred to above present fairly, in all material respects, the financial position of Fidelity Emerging Europe, Middle East, Africa (EMEA) Fund as of October 31, 2008, the results of its operations, the changes in its net assets and its financial highlights for the period from May 8, 2008 (Commencement of Operations) to October 31, 2008, in conformity with accounting principles generally accepted in the United States of America.
/s/ Deloitte & Touche LLP
DELOITTE & TOUCHE LLP
Boston, Massachusetts
December 19, 2008
Annual Report
The Trustees, Member of the Advisory Board, and executive officers of the trust and fund, as applicable, are listed below. The Board of Trustees governs the fund and is responsible for protecting the interests of shareholders. The Trustees are experienced executives who meet periodically throughout the year to oversee the fund's activities, review contractual arrangements with companies that provide services to the fund, and review the fund's performance. Except for Edward C. Johnson 3d and James C. Curvey, each of the Trustees oversees 220 funds advised by FMR or an affiliate. Messrs. Johnson and Curvey oversee 379 funds advised by FMR or an affiliate.
The Trustees hold office without limit in time except that (a) any Trustee may resign; (b) any Trustee may be removed by written instrument, signed by at least two-thirds of the number of Trustees prior to such removal; (c) any Trustee who requests to be retired or who has become incapacitated by illness or injury may be retired by written instrument signed by a majority of the other Trustees; and (d) any Trustee may be removed at any special meeting of shareholders by a two-thirds vote of the outstanding voting securities of the trust. Each Trustee who is not an interested person (as defined in the 1940 Act) (Independent Trustee), shall retire not later than the last day of the calendar year in which his or her 72nd birthday occurs. The Independent Trustees may waive this mandatory retirement age policy with respect to individual Trustees. The executive officers and Advisory Board Member hold office without limit in time, except that any officer and Advisory Board Member may resign or may be removed by a vote of a majority of the Trustees at any regular meeting or any special meeting of the Trustees. Except as indicated, each individual has held the office shown or other offices in the same company for the past five years.
The fund's Statement of Additional Information (SAI) includes more information about the Trustees. To request a free copy, call Fidelity at 1-800-544-8544.
Interested Trustees*:
Correspondence intended for each Trustee who is an interested person may be sent to Fidelity Investments, 82 Devonshire Street, Boston, Massachusetts 02109.
Name, Age; Principal Occupation |
Edward C. Johnson 3d (78) |
| Year of Election or Appointment: 1984 Mr. Johnson is Chairman of the Board of Trustees. Mr. Johnson serves as Chief Executive Officer, Chairman, and a Director of FMR LLC; Chairman and a Director of FMR; Chairman and a Director of Fidelity Research & Analysis Company (FRAC); Chairman and a Director of Fidelity Investments Money Management, Inc.; and Chairman and a Director of FMR Co., Inc. In addition, Mr. Johnson serves as Chairman and Director of FIL Limited. Previously, Mr. Johnson served as President of FMR LLC (2006-2007). |
James C. Curvey (73) |
| Year of Election or Appointment: 2007 Mr. Curvey also serves as Trustee (2007-present) of other investment companies advised by FMR. Mr. Curvey is a Director of FMR and FMR Co., Inc. (2007-present). Mr. Curvey is also Vice Chairman (2006-
present) and Director of FMR LLC. In addition, Mr. Curvey serves as an Overseer for the Boston Symphony Orchestra and a member of the Trustees of Villanova University. |
* Trustees have been determined to be "Interested Trustees" by virtue of, among other things, their affiliation with the trust or various entities under common control with FMR. FMR Corp. merged with and into FMR LLC on October 1, 2007. Any references to FMR LLC for prior periods are deemed to be references to the prior entity.
Independent Trustees:
Correspondence intended for each Independent Trustee (that is, the Trustees other than the Interested Trustees) may be sent to Fidelity Investments, P.O. Box 55235, Boston, Massachusetts 02205-5235.
Name, Age; Principal Occupation |
Dennis J. Dirks (60) |
| Year of Election or Appointment: 2005 Prior to his retirement in May 2003, Mr. Dirks was Chief Operating Officer and a member of the Board of The Depository Trust & Clearing Corporation (DTCC) (1999-2003). He also served as President, Chief Operating Officer, and Board member of The Depository Trust Company (DTC) (1999-2003) and President and Board member of the National Securities Clearing Corporation (NSCC) (1999-2003). In addition, Mr. Dirks served as a Trustee and a member of the Finance Committee of Manhattan College (2005-2008), and as Chief Executive Officer and Board member of the Government Securities Clearing Corporation (2001-2003) and Chief Executive Officer and Board member of the Mortgage-Backed Securities Clearing Corporation (2001-2003). Mr. Dirks also serves as a Trustee and a member of the Finance Committee of AHRC of Nassau County (2006-present). |
Alan J. Lacy (55) |
| Year of Election or Appointment: 2008 Mr. Lacy serves as Senior Adviser (2007-present) of Oak Hill Capital Partners, L.P. (a private equity firm). Mr. Lacy also served as Chief Executive Officer (2000-2005) and Vice Chairman (2005-2006) of Sears Holdings Corporation and Sears, Roebuck and Co. (retail). In addition, Mr. Lacy serves as a member of the Board of Directors of The Western Union Company (global money transfer, 2006-present) and Bristol-Myers Squibb (global pharmaceuticals, 2007-present). Mr. Lacy is a Trustee of the National Parks Conservation Association and The Field Museum of Natural History. |
Ned C. Lautenbach (64) |
| Year of Election or Appointment: 2000 Mr. Lautenbach is Chairman of the Independent Trustees (2006-present). Mr. Lautenbach is an Advisory Partner of Clayton, Dubilier & Rice, Inc. (private equity investment firm). Previously, Mr. Lautenbach was with the International Business Machines Corporation (IBM) from 1968 until his retirement in 1998. Mr. Lautenbach serves as a Director of Eaton Corporation (diversified industrial) as well as the Philharmonic Center for the Arts in Naples, Florida. He also is a member of the Board of Trustees of Fairfield University (2005-present), as well as a member of the Council on Foreign Relations. Previously, Mr. Lautenbach served as a Director of Sony Corporation (2006-2007). |
Joseph Mauriello (64) |
| Year of Election or Appointment: 2008 Prior to his retirement in January 2006, Mr. Mauriello served in numerous senior management positions including Deputy Chairman and Chief Operating Officer (2004-2005), and Vice Chairman of Financial Services (2002-2004) of KPMG LLP US (professional services firm, 1965-2005). Mr. Mauriello currently serves as a member of the Board of Directors of XL Capital Ltd. (global insurance and re-insurance company, 2006-present) and of Arcadia Resources Inc. (health care services and products, 2007-present). He also served as a Director of the Hamilton Funds of the Bank of New York (2006-2007). |
Cornelia M. Small (64) |
| Year of Election or Appointment: 2005 Ms. Small is a member of the Investment Committee, and Chair (2008-present) and a member of the Board of Trustees of Smith College. Ms. Small also serves on the Investment Committee of the Berkshire Taconic Community Foundation (2008-present). Previously, Ms. Small served as Chairperson of the Investment Committee (2002-2008) of Smith College and as Co-Chair (2000-2003) of the Annual Fund for the Fletcher School of Law and Diplomacy. In addition, she served as Chief Investment Officer, Director of Global Equity Investments, and a member of the Board of Directors of Scudder, Stevens & Clark and Scudder Kemper Investments. |
William S. Stavropoulos (69) |
| Year of Election or Appointment: 2001 Mr. Stavropoulos is Chairman Emeritus of the Board of Directors of The Dow Chemical Company, where he previously served in numerous senior management positions, including President (1993-2000; 2002-2003), CEO (1995-2000; 2002-2004), Chairman of the Executive Committee (2000-2006), and as a member of the Board of Directors (1990-2006). Currently, he is a Director of Teradata Corporation (data warehousing and technology solutions, 2008-present), Chemical Financial Corporation, Maersk Inc. (industrial conglomerate), Tyco International, Inc. (multinational manufacturing and services, 2007-present), and a member of the Advisory Board for Metalmark Capital (private equity investment firm, 2005-present). He is a special advisor to Clayton, Dubilier & Rice, Inc. (private equity investment). In addition, Mr. Stavropoulos is a member of the University of Notre Dame Advisory Council for the College of Science. |
David M. Thomas (59) |
| Year of Election or Appointment: 2008 Previously, Mr. Thomas served as Executive Chairman (2005-2006) and Chairman and Chief Executive Officer (2000-2005) of IMS Health, Inc. (pharmaceutical and healthcare information solutions). In addition, Mr. Thomas serves as a member of the Board of Directors of Fortune Brands, Inc. (consumer products holding company), and Interpublic Group of Companies, Inc. (marketing communication, 2004-present). |
Michael E. Wiley (58) |
| Year of Election or Appointment: 2008 Mr. Wiley also serves as a member of the Board of Trustees of the University of Tulsa (2000-2006; 2007-present). He serves as a Director of Tesoro Corporation (independent oil refiner and marketer, 2005-present), and a Director of Bill Barrett Corporation (exploration and production company, 2005-present). In addition, he also serves as a Director of Post Oak Bank (privately-held bank, 2004-present). Previously, Mr. Wiley served as a Sr. Energy Advisor of Katzenbach Partners, LLC (consulting firm, 2006-2007), as an Advisory Director of Riverstone Holdings (private investment firm), Chairman, President, and CEO of Baker Hughes, Inc. (oilfield services company, 2000-2004), and as Director of Spinnaker Exploration Company (exploration and production company, 2001-2005). |
Advisory Board Member and Executive Officers**:
Correspondence intended for each executive officer and Mr. Lynch may be sent to Fidelity Investments, 82 Devonshire Street, Boston, Massachusetts 02109.
Name, Age; Principal Occupation |
Peter S. Lynch (64) |
| Year of Election or Appointment: 2003 Member of the Advisory Board of Fidelity's Equity and High Income Funds. Mr. Lynch is Vice Chairman and a Director of FMR, and Vice Chairman (2001-present) and a Director of FMR Co., Inc. Previously, Mr. Lynch served as a Trustee of the Fidelity funds (1990-2003). In addition, he serves as a Trustee of Boston College and as the Chairman of the Inner-City Scholarship Fund. Previously, Mr. Lynch served on the Special Olympics International Board of Directors (1997-2006). |
Kenneth B. Robins (39) |
| Year of Election or Appointment: 2008 President and Treasurer of Fidelity's Equity and High Income Funds. Mr. Robins is an employee of Fidelity Investments (2004-present). Before joining Fidelity Investments, Mr. Robins worked at KPMG LLP, where he was a partner in KPMG's department of professional practice (2002-2004). |
Walter C. Donovan (46) |
| Year of Election or Appointment: 2007 Vice President of Fidelity's Equity Funds. Mr. Donovan also serves as President of FMR and FMR Co., Inc., and Executive Vice President of Fidelity Investments Money Management, Inc. (2007-present). Previously, Mr. Donovan served as Executive Vice President of FMR and FMR Co., Inc. (2005-2007) and Senior Vice President of FMR (2003-2005) and FMR Co., Inc. (2004-2005). |
Eric M. Wetlaufer (46) |
| Year of Election or Appointment: 2006 Vice President of Fidelity's International Equity Funds. Mr. Wetlaufer also serves as Group Chief Investment Officer of FMR. Mr. Wetlaufer is Chairman, Chief Executive Officer, and President of Fidelity Management & Research (Hong Kong) Limited (2008-present); Chairman, Chief Executive Officer, President, and a Director of Fidelity Management & Research (Japan) Inc. (2008-present); Chairman and Chief Executive Officer (2007-present) and President and a Director (2006-present) of Fidelity Management & Research (U.K.) Inc. and President and a Director of Fidelity Research & Analysis Company (2006-present). Before joining Fidelity Investments in 2005, Mr. Wetlaufer was a partner in Oxhead Capital Management (2004-2005) and a Chief Investment Officer of Putnam Investments (1997-2003). |
Scott C. Goebel (40) |
| Year of Election or Appointment: 2008 Secretary and Chief Legal Officer (CLO) of the Fidelity funds. Mr. Goebel also serves as General Counsel, Secretary, and Senior Vice President of FMR (2008-present); Deputy General Counsel of FMR LLC; Chief Legal Secretary of Fidelity Management & Research (Hong Kong) Limited (2008-present) and Assistant Secretary of Fidelity Management & Research (Japan) Inc. (2008-present). Previously, Mr. Goebel served as Assistant Secretary of the Funds (2007-2008) and as Vice President and Secretary of Fidelity Distributors Corporation (FDC) (2005-2007). |
John B. McGinty, Jr. (46) |
| Year of Election or Appointment: 2008 Assistant Secretary of Fidelity's Equity and High Income Funds. Mr. McGinty is an employee of Fidelity Investments (2004-present). Mr. McGinty also serves as Senior Vice President, Secretary, and Chief Legal Officer of FDC (2007-present). Before joining Fidelity Investments, Mr. McGinty practiced law at Ropes & Gray, LLP. |
Holly C. Laurent (54) |
| Year of Election or Appointment: 2008 Anti-Money Laundering (AML) Officer of the Fidelity funds. Ms. Laurent is an employee of Fidelity Investments. Previously, Ms. Laurent was Senior Vice President and Head of Legal for Fidelity Business Services India Pvt. Ltd. (2006-2008), Senior Vice President, Deputy General Counsel and Group Head for FMR LLC (2005-2006). |
Christine Reynolds (50) |
| Year of Election or Appointment: 2008 Chief Financial Officer of the Fidelity funds. Ms. Reynolds became President of Fidelity Pricing and Cash Management Services (FPCMS) in August 2008. She served as Chief Operating Officer of FPCMS from 2007 through July 2008. Previously, Ms. Reynolds served as President, Treasurer, and Anti-Money Laundering officer of the Fidelity funds (2004-2007). Before joining Fidelity Investments, Ms. Reynolds worked at PricewaterhouseCoopers LLP (PwC) (1980-2002), where she was an audit partner with PwC's investment management practice. |
Kenneth A. Rathgeber (61) |
| Year of Election or Appointment: 2004 Chief Compliance Officer of Fidelity's Equity and High Income Funds. Mr. Rathgeber is Chief Compliance Officer of Fidelity Management & Research (Hong Kong) Limited (2008-present), Fidelity Management & Research (Japan) Inc. (2008-present), FMR (2005-present), FMR Co., Inc. (2005-present), Fidelity Management & Research (U.K.) Inc. (2005-present), Fidelity Research & Analysis Company (2005-present), Fidelity Investments Money Management, Inc. (2005-present), and Strategic Advisers, Inc. (2005-present). |
Bryan A. Mehrmann (47) |
| Year of Election or Appointment: 2005 Deputy Treasurer of the Fidelity funds. Mr. Mehrmann is an employee of Fidelity Investments. Previously, Mr. Mehrmann served as Vice President of Fidelity Investments Institutional Services Group (FIIS)/Fidelity Investments Institutional Operations Corporation, Inc. (FIIOC) Client Services (1998-2004). |
Adrien E. Deberghes (41) |
| Year of Election or Appointment: 2008 Deputy Treasurer of Fidelity's Equity and High Income Funds. Mr. Deberghes is an employee of Fidelity Investments (2008-present). Previously, Mr. Deberghes served as Senior Vice President of Mutual Fund Administration at State Street Corporation (2007-2008), Senior Director of Mutual Fund Administration at Investors Bank & Trust (2005-2007), and Director of Finance for Dunkin' Brands (2000-2005). |
Robert G. Byrnes (41) |
| Year of Election or Appointment: 2005 Assistant Treasurer of the Fidelity funds. Mr. Byrnes is an employee of Fidelity Investments (2005-present). Previously, Mr. Byrnes served as Vice President of Fidelity Pricing and Cash Management Services (FPCMS) (2003-2005). Before joining Fidelity Investments, Mr. Byrnes worked at Deutsche Asset Management where he served as Vice President of the Investment Operations Group (2000-2003). |
Peter L. Lydecker (54) |
| Year of Election or Appointment: 2004 Assistant Treasurer of the Fidelity funds. Mr. Lydecker is an employee of Fidelity Investments. |
Paul M. Murphy (61) |
| Year of Election or Appointment: 2007 Assistant Treasurer of the Fidelity funds. Mr. Murphy is an employee of Fidelity Investments (2007-present). Previously, Mr. Murphy served as Chief Financial Officer of the Fidelity Funds (2005-2006), Vice President and Associate General Counsel of FMR (2007), and Senior Vice President of Fidelity Pricing and Cash Management Services (FPCMS) (1994-2007). |
Gary W. Ryan (50) |
| Year of Election or Appointment: 2005 Assistant Treasurer of the Fidelity funds. Mr. Ryan is an employee of Fidelity Investments. Previously, Mr. Ryan served as Vice President of Fund Reporting in Fidelity Pricing and Cash Management Services (FPCMS) (1999-2005). |
** FMR Corp. merged with and into FMR LLC on October 1, 2007. Any references to FMR LLC for prior periods are deemed to be references to the prior entity.
Annual Report
Board Approval of Investment Advisory Contracts and Management Fees
Fidelity Emerging Europe, Middle East, Africa (EMEA) Fund
Each year, typically in July, the Board of Trustees, including the Independent Trustees (together, the Board), votes on the renewal of the management contract and sub-advisory agreements (together, the Advisory Contracts) for the fund. The Board, assisted by the advice of fund counsel and Independent Trustees' counsel, requests and considers a broad range of information throughout the year.
The Board meets regularly and, acting directly and through its separate committees, requests and receives information concerning, and considers at each of its meetings factors that are relevant to, its annual consideration of the renewal of the fund's Advisory Contracts, including the services and support provided to the fund and its shareholders. At the time of the renewal, the Board had 12 standing committees, each composed of Independent Trustees with varying backgrounds, to which the Board has assigned specific subject matter responsibilities in order to enhance effective decision-making by the Board. Each committee has a written charter outlining the structure and purposes of the committee. The Board also meets as needed to consider matters specifically related to the Board's annual consideration of the renewal of Advisory Contracts.
At its July 2008 meeting, the Board of Trustees, including the Independent Trustees, unanimously determined to renew the fund's Advisory Contracts. In reaching its determination, the Board considered a broad range of information. The Board also approved agreements with foreign sub-advisers Fidelity Management & Research (Japan) Inc. and Fidelity Management & Research (Hong Kong) Limited, as well as amendments to the fund's agreement with Fidelity Management & Research (U.K.) Inc.
In considering whether to renew the Advisory Contracts for the fund, the Board ultimately reached a determination, with the assistance of fund counsel and Independent Trustees' counsel and through the exercise of its business judgment, that the renewal of the Advisory Contracts and the compensation to be received by Fidelity under the management contract is consistent with Fidelity's fiduciary duty under applicable law. The Board's decision to renew the Advisory Contracts was not based on any single factor, but rather was based on a comprehensive consideration of all the information provided to the Board at its meetings throughout the year. The Board, in reaching its determination to renew the Advisory Contracts, is aware that shareholders in the fund have a broad range of investment choices available to them, including a wide choice among mutual funds offered by competitors to Fidelity, and that the fund's shareholders, with the opportunity to review and weigh the disclosure provided by the fund in its prospectus and other public disclosures, have chosen to invest in this fund, managed by Fidelity.
Nature, Extent, and Quality of Services Provided. The Board considered staffing within the investment adviser, FMR, and the sub-advisers (together, the Investment Advisers), including the backgrounds of the fund's investment personnel and the fund's investment objective and discipline. The Independent Trustees also had discussions with senior management of Fidelity's investment operations and investment groups. The Board considered the structure of the portfolio manager compensation program and whether this structure provides appropriate incentives.
Annual Report
Board Approval of Investment Advisory Contracts and
Management Fees - continued
Resources Dedicated to Investment Management and Support Services. The Board reviewed the size, education, and experience of the Investment Advisers' investment staff, their use of technology, and the Investment Advisers' approach to recruiting, training, and retaining portfolio managers and other research, advisory, and management personnel. The Board noted that Fidelity's analysts have access to a variety of technological tools that enable them to perform both fundamental and quantitative analysis and to specialize in various disciplines. The Board considered Fidelity's extensive global research capabilities that enable the Investment Advisers to aggregate data from various sources in an effort to produce positive investment results. The Board also considered that Fidelity's portfolio managers and analysts have access to daily portfolio attribution that allows for monitoring of a fund's portfolio, as well as an electronic communication system that provides immediate real-time access to research concerning issuers and credit enhancers.
Shareholder and Administrative Services. The Board considered (i) the nature, extent, quality, and cost of advisory, administrative, distribution, and shareholder services performed by the Investment Advisers and their affiliates under the Advisory Contracts and under separate agreements covering transfer agency, pricing and bookkeeping, and securities lending services for the fund; (ii) the nature and extent of the Investment Advisers' supervision of third party service providers, principally custodians and subcustodians; and (iii) the resources devoted to, and the record of compliance with, the fund's compliance policies and procedures. The Board also reviewed the allocation of fund brokerage, including allocations to brokers affiliated with the Investment Advisers, the use of brokerage commissions to pay fund expenses, and the use of "soft" commission dollars to pay for research services. The Board further considered that Fidelity voluntarily pays for market data out of its own resources.
The Board noted that the growth of fund assets across the complex allows Fidelity to reinvest in the development of services designed to enhance the value or convenience of the Fidelity funds as investment vehicles. These services include 24-hour access to account information and market information through phone representatives and over the Internet, and investor education materials and asset allocation tools.
Investment in a Large Fund Family. The Board considered the benefits to shareholders of investing in a Fidelity fund, including the benefits of investing in a fund that is part of a large family of funds offering a variety of investment disciplines and providing for a large variety of mutual fund investor services. For example, fund shareholders are offered the privilege of exchanging shares of the fund for shares of other Fidelity funds, as set forth in the fund's prospectus, without paying a sales charge. The Board noted that Fidelity has taken a number of actions over the previous year that benefited particular funds, including (i) dedicating additional resources to investment research and to restructure the investment research teams; (ii) contractually agreeing to reduce the management fees on Fidelity's Institutional Money Market Funds and launching Class IV and Institutional Class of certain of these funds; (iii) reducing the transfer agent fees for the Fidelity Select Portfolios and Investor Class of the VIP funds; and (iv) launching Class K of 29 equity funds as a lower-fee class available to certain employer-sponsored retirement plans.
Annual Report
Investment Performance. The Board considered whether the fund has operated within its investment objective, as well as its record of compliance with its investment restrictions. The Board noted that it is not possible to evaluate performance in any comprehensive fashion because the fund had been in operation for less than one calendar year. Once the fund has been in operation for at least one calendar year, the Board will review the fund's absolute investment performance for each class, as well as the fund's relative investment performance for each class measured against a broad-based securities market index and a peer group of mutual funds.
Based on its review, the Board concluded that the nature, extent, and quality of the services provided to the fund will benefit the fund's shareholders, particularly in light of the Board's view that the fund's shareholders benefit from investing in a fund that is part of a large family of funds offering a variety of investment disciplines and services.
Competitiveness of Management Fee and Total Fund Expenses. The Board considered the fund's management fee and projected total operating expenses of each class of the fund in reviewing the Advisory Contracts. The Board noted that the fund's management fee rate is lower than the median fee rate of funds with similar Lipper investment objective categories and comparable management fee characteristics. The Board considered that the projected total operating expenses are comparable to those of similar classes and funds that Fidelity offers to shareholders. The Board also considered supplemental information about how the fund's management fee and total expenses ranked relative to groups based on Lipper classifications, which take into account a fund's market capitalization and style.
Based on its review, the Board concluded that the fund's management fee and proposed total expenses of each class were fair and reasonable in light of the services that the fund and its shareholders receive and the other factors considered.
Costs of the Services and Profitability. The fund has only recently commenced operations and therefore no revenue, cost, or profitability data was available for the Board to review in respect of the fund at the time in renew the Advisory Contracts. In connection with its future renewal of the fund's Advisory Contracts, the Board will consider the revenues earned and the expenses incurred by Fidelity in conducting the business of developing, marketing, distributing, managing, administering and servicing the fund and its shareholders.
Annual Report
Board Approval of Investment Advisory Contracts and
Management Fees - continued
Economies of Scale. The Board considered whether there have been economies of scale in respect of the management of the Fidelity funds, whether the Fidelity funds (including the fund) have appropriately benefited from any such economies of scale, and whether there is potential for realization of any further economies of scale. The Board considered the extent to which the fund will benefit from economies of scale through increased services to the fund, through waivers or reimbursements, or through fee or expense reductions.
The Board recognized that the fund's management contract incorporates a "group fee" structure, which provides for lower group fee rates as total fund assets under FMR's management increase, and for higher group fee rates as total fund assets under FMR's management decrease. FMR determines the group fee rates based on a tiered asset "breakpoint" schedule. The Board considered that the group fee is designed to deliver the benefits of economies of scale to fund shareholders when total fund assets increase, even if assets of any particular fund are unchanged or have declined, because some portion of Fidelity's costs are attributable to services provided to all Fidelity funds, and all funds benefit if those costs can be allocated among more assets. The Board concluded that, given the group fee structure, fund shareholders will achieve a certain level of economies of scale as assets under FMR's management increase at the fund complex level, regardless of whether Fidelity achieves any such economies of scale.
The Board further concluded that any potential economies of scale are being shared between fund shareholders and Fidelity in an appropriate manner.
Additional Information Requested by the Board. In order to develop fully the factual basis for consideration of the Fidelity funds' Advisory Contracts, the Board requested and received additional information on certain topics, including (i) fund performance trends and actions to be taken by FMR to improve certain funds' overall performance; (ii) portfolio manager changes that have occurred during the past year; (iii) Fidelity's fund profitability methodology, the profitability of certain fund service providers, and profitability trends for certain funds; (iv) Fidelity's compensation structure for portfolio managers and key personnel, including its effects on fund profitability and the extent to which portfolio manager compensation is linked to fund performance; (v) Fidelity's fee structures and rationale for recommending different fees among categories of funds; and (vi) Fidelity's rationale for recommending which funds should have a performance adjustment component as part of their management fees.
Based on its evaluation of all of the conclusions noted above, and after considering all material factors, the Board ultimately concluded that the advisory fee structures are fair and reasonable, and that the fund's Advisory Contracts should be renewed.
Annual Report
Managing Your Investments
Fidelity offers several ways to conveniently manage your personal investments via your telephone or PC. You can access your account information, conduct trades and research your investments 24 hours a day.
By Phone
Fidelity Automated Service Telephone provides a single toll-free number to access account balances, positions, quotes and trading. It's easy to navigate the service, and on your first call, the system will help you create a personal identification number (PIN) for security.
(phone_graphic)
Fidelity Automated
Service Telephone (FAST®)
1-800-544-5555
Press
For mutual fund and brokerage trading.
For quotes.*
For account balances and holdings.
To review orders and mutual
fund activity.
To change your PIN.
To speak to a Fidelity representative.
By PC
Fidelity's web site on the Internet provides a wide range of information, including daily financial news, fund performance, interactive planning tools and news about Fidelity products and services.
(computer_graphic)
Fidelity's Web Site
www.fidelity.com
* When you call the quotes line, please remember that a fund's yield and return will vary and, except for money market funds, share price will also vary. This means that you may have a gain or loss when you sell your shares. There is no assurance that money market funds will be able to maintain a stable $1 share price; an investment in a money market fund is not insured or guaranteed by the U.S. government. Total returns are historical and include changes in share price, reinvestment of dividends and capital gains, and the effects of any sales charges.
Annual Report
To Write Fidelity
We'll give your correspondence immediate attention and send you written confirmation upon completion of your request.
(letter_graphic)
Making Changes
To Your Account
(such as changing name, address, bank, etc.)
Fidelity Investments
P.O. Box 770001
Cincinnati, OH 45277-0002
(letter_graphic)
For Non-Retirement
Accounts
Buying shares
Fidelity Investments
P.O. Box 770001
Cincinnati, OH 45277-0003
Overnight Express
Fidelity Investments
Attn: Distribution Services
100 Crosby Parkway - KC1H
Covington, KY 41015
Selling shares
Fidelity Investments
P.O. Box 770001
Cincinnati, OH 45277-0035
Overnight Express
Fidelity Investments
Attn: Distribution Services
100 Crosby Parkway - KC1H
Covington, KY 41015
General Correspondence
Fidelity Investments
P.O. Box 500
Merrimack, NH 03054-0500
(letter_graphic)
For Retirement
Accounts
Buying shares
Fidelity Investments
P.O. Box 770001
Cincinnati, OH 45277-0003
Selling shares
Fidelity Investments
P.O. Box 770001
Cincinnati, OH 45277-0035
Overnight Express
Fidelity Investments
Attn: Distribution Services
100 Crosby Parkway - KC1H
Covington, KY 41015
General Correspondence
Fidelity Investments
P.O. Box 500
Merrimack, NH 03054-0500
Annual Report
To Visit Fidelity
For directions and hours,
please call 1-800-544-9797.
Arizona
7001 West Ray Road
Chandler, AZ
15445 N. Scottsdale Road
Scottsdale, AZ
California
815 East Birch Street
Brea, CA
1411 Chapin Avenue
Burlingame, CA
851 East Hamilton Avenue
Campbell, CA
19200 Von Karman Avenue
Irvine, CA
601 Larkspur Landing Circle
Larkspur, CA
2000 Avenue of the Stars
Los Angeles, CA
27101 Puerta Real
Mission Viejo, CA
73-575 El Paseo
Palm Desert, CA
251 University Avenue
Palo Alto, CA
123 South Lake Avenue
Pasadena, CA
16656 Bernardo Ctr. Drive
Rancho Bernardo, CA
1220 Roseville Parkway
Roseville, CA
1740 Arden Way
Sacramento, CA
7676 Hazard Center Drive
San Diego, CA
11943 El Camino Real
San Diego, CA
8 Montgomery Street
San Francisco, CA
3793 State Street
Santa Barbara, CA
1200 Wilshire Boulevard
Santa Monica, CA
398 West El Camino Real
Sunnyvale, CA
111 South Westlake Blvd
Thousand Oaks, CA
21701 Hawthorne Boulevard
Torrance, CA
2001 North Main Street
Walnut Creek, CA
6326 Canoga Avenue
Woodland Hills, CA
Colorado
281 East Flatiron Circle
Broomfield, CO
1625 Broadway
Denver, CO
9185 Westview Road
Lone Tree, CO
Connecticut
48 West Putnam Avenue
Greenwich, CT
265 Church Street
New Haven, CT
300 Atlantic Street
Stamford, CT
29 South Main Street
West Hartford, CT
Delaware
400 Delaware Avenue
Wilmington, DE
Florida
175 East Altamonte Drive
Altamonte Springs, FL
4400 N. Federal Highway
Boca Raton, FL
121 Alhambra Plaza
Coral Gables, FL
2948 N. Federal Highway
Ft. Lauderdale, FL
4671 Town Center Parkway
Jacksonville, FL
8880 Tamiami Trail, North
Naples, FL
230 Royal Palm Way
Palm Beach, FL
3501 PGA Boulevard
Palm Beach Gardens, FL
3550 Tamiami Trail, South
Sarasota, FL
1502 N. Westshore Blvd.
Tampa, FL
2465 State Road 7
Wellington, FL
Georgia
3445 Peachtree Road, N.E.
Atlanta, GA
1000 Abernathy Road
Atlanta, GA
Illinois
One North LaSalle Street
Chicago, IL
401 North Michigan Avenue
Chicago, IL
One Skokie Valley Road
Highland Park, IL
1415 West 22nd Street
Oak Brook, IL
15105 S LaGrange Road
Orland Park, IL
1572 East Golf Road
Schaumburg, IL
Indiana
4729 East 82nd Street
Indianapolis, IN
8480 Keystone Crossing
Indianapolis, IN
Kansas
5400 College Boulevard
Overland Park, KS
Maine
Three Canal Plaza
Portland, ME
Maryland
7315 Wisconsin Avenue
Bethesda, MD
610 York Road
Towson, MD
Massachusetts
801 Boylston Street
Boston, MA
155 Congress Street
Boston, MA
300 Granite Street
Braintree, MA
44 Mall Road
Burlington, MA
238 Main Street
Cambridge, MA
200 Endicott Street
Danvers, MA
Annual Report
405 Cochituate Road
Framingham, MA
551 Boston Turnpike
Shrewsbury, MA
Michigan
500 E. Eisenhower Pkwy.
Ann Arbor, MI
280 Old N. Woodward Ave.
Birmingham, MI
30200 Northwestern Hwy.
Farmington Hills, MI
43420 Grand River Avenue
Novi, MI
Minnesota
7740 France Avenue South
Edina, MN
8342 3rd Street North
Oakdale, MN
Missouri
1524 South Lindbergh Blvd.
St. Louis, MO
Nevada
2225 Village Walk Drive
Henderson, NV
New Jersey
501 Route 73 South
Marlton, NJ
150 Essex Street
Millburn, NJ
35 Morris Street
Morristown, NJ
396 Route 17, North
Paramus, NJ
3518 Route 1 North
Princeton, NJ
530 Broad Street
Shrewsbury, NJ
New Mexico
2261 Q Street NE
Albuquerque, NM
New York
1130 Franklin Avenue
Garden City, NY
37 West Jericho Turnpike
Huntington Station, NY
1271 Avenue of the Americas
New York, NY
980 Madison Avenue
New York, NY
61 Broadway
New York, NY
350 Park Avenue
New York, NY
200 Fifth Avenue
New York, NY
733 Third Avenue
New York, NY
11 Penn Plaza
New York, NY
2070 Broadway
New York, NY
1075 Northern Blvd.
Roslyn, NY
799 Central Park Avenue
Scarsdale, NY
North Carolina
4611 Sharon Road
Charlotte, NC
7011 Fayetteville Road
Durham, NC
Ohio
3805 Edwards Road
Cincinnati, OH
1324 Polaris Parkway
Columbus, OH
1800 Crocker Road
Westlake, OH
28699 Chagrin Boulevard
Woodmere Village, OH
Oregon
7493 SW Bridgeport Road
Tigard, OR
Pennsylvania
600 West DeKalb Pike
King of Prussia, PA
1735 Market Street
Philadelphia, PA
12001 Perry Highway
Wexford, PA
Rhode Island
10 Memorial Boulevard
Providence, RI
Tennessee
3018 Peoples Street
Johnson City, TN
7628 West Farmington Blvd.
Germantown, TN
2035 Mallory Lane
Franklin, TN
Texas
10000 Research Boulevard
Austin, TX
4001 Northwest Parkway
Dallas, TX
12532 Memorial Drive
Houston, TX
2701 Drexel Drive
Houston, TX
6560 Fannin Street
Houston, TX
1701 Lake Robbins Drive
The Woodlands, TX
6500 N. MacArthur Blvd.
Irving, TX
6005 West Park Boulevard
Plano, TX
14100 San Pedro
San Antonio, TX
1576 East Southlake Blvd.
Southlake, TX
Utah
279 West South Temple
Salt Lake City, UT
Virginia
1861 International Drive
McLean, VA
Washington
10500 NE 8th Street
Bellevue, WA
1518 6th Avenue
Seattle, WA
Washington, DC
1900 K Street, N.W.
Washington, DC
Wisconsin
16020 West Bluemound Road
Brookfield, WI
Fidelity Brokerage Services, Inc., 100 Summer St., Boston, MA 02110 Member NYSE/SIPC
Annual Report
Investment Adviser
Fidelity Management &
Research Company
Boston, MA
Investment Sub-Advisers
FMR Co., Inc.
Fidelity Management & Research
(U.K.) Inc.
Fidelity Research & Analysis Company
Fidelity Investments Japan Limited
FIL Investment Advisors
FIL Investment Advisors
(U.K.) Ltd.
Fidelity Management & Research
(Hong Kong) Limited
Fidelity Management & Research
(Japan) Inc.
General Distributor
Fidelity Distributors Corporation
Boston, MA
Transfer and Service Agents
Fidelity Investments Institutional
Operations Company, Inc.
Boston, MA
Fidelity Service Company, Inc.
Boston, MA
Custodian
State Street Bank & Trust Company
Quincy, MA
EME-UANN-1208
1.861971.100
(Fidelity Investment logo)(registered trademark)
Fidelity Advisor
Emerging Europe,
Middle East, Africa (EMEA)
Fund - Class A, Class T, Class B
and Class C
Annual Report
October 31, 2008
Class A, Class T, Class B, and Class C are classes of Fidelity® Emerging Europe,
Middle East, Africa (EMEA) Fund
(2_fidelity_logos) (Registered_Trademark)
Contents
Chairman's Message | <Click Here> | Ned Johnson's message to shareholders. |
Shareholder Expense Example | <Click Here> | An example of shareholder expenses. |
Investment Summary | <Click Here> | A summary of the fund's holdings. |
Investments | <Click Here> | A complete list of the fund's investments with their market values. |
Financial Statements | <Click Here> | Statements of assets and liabilities, operations, and changes in net assets, as well as financial highlights. |
Notes | <Click Here> | Notes to the financial statements. |
Report of Independent Registered Public Accounting Firm | <Click Here> | |
Trustees and Officers | <Click Here> | |
Board Approval of Investment Advisory Contracts and Management Fees | <Click Here> | |
To view a fund's proxy voting guidelines and proxy voting record for the 12-month period ended June 30, visit http://www.fidelity.com (search for "proxy voting guidelines") or visit the Securities and Exchange Commission's (SEC) web site at http://www.sec.gov. You may also call 1-877-208-0098 to request a free copy of the proxy voting guidelines.
Standard & Poor's, S&P and S&P 500 are registered service marks of The McGraw-Hill Companies, Inc. and have been licensed for use by Fidelity Distributors Corporation.
Other third party marks appearing herein are the property of their respective owners.
All other marks appearing herein are registered or unregistered trademarks or service marks of FMR LLC or an affiliated company.
Annual Report
This report and the financial statements contained herein are submitted for the general information of the shareholders of the fund. This report is not authorized for distribution to prospective investors in the fund unless preceded or accompanied by an effective prospectus.
A fund files its complete schedule of portfolio holdings with the SEC for the first and third quarters of each fiscal year on Form N-Q. Forms N-Q are available on the SEC's web site at http://www.sec.gov. A fund's Forms N-Q may be reviewed and copied at the SEC's Public Reference Room in Washington, DC. Information regarding the operation of the SEC's Public Reference Room may be obtained by calling 1-800-SEC-0330. For a complete list of a fund's portfolio holdings, view the most recent holdings listing, semiannual report, or annual report on Fidelity's web site at http://www.fidelity.com or http://advisor.fidelity.com, as applicable.
NOT FDIC INSURED · MAY LOSE VALUE · NO BANK GUARANTEE
Neither the fund nor Fidelity Distributors Corporation is a bank.
Annual Report
(photo_of_Edward_C_Johnson_3d)
Dear Shareholder:
Turmoil has been the watchword for the world's securities markets in 2008, with domestic and international stocks down sharply amid the global credit squeeze. A flight to quality boosted returns for U.S. Treasuries, one of the few asset classes with positive results heading into the latter stages of the year. Financial markets are always unpredictable, but there are a number of time-tested principles that can put the historical odds in your favor.
One of the basic tenets is to invest for the long term. Over time, riding out the markets' inevitable ups and downs has proven much more effective than selling into panic or chasing the hottest trend. Even missing only a few of the markets' best days can significantly diminish investor returns. Patience also affords the benefits of compounding - of earning interest on additional income or reinvested dividends and capital gains. There are tax advantages and cost benefits to consider as well. The more you sell, the more taxes you pay, and the more you trade, the higher the costs. While staying the course doesn't eliminate risk, it can considerably lessen the effect of short-term declines.
You can further manage your investing risk through diversification. And today, more than ever, geographic diversification should be taken into account. Studies indicate that asset allocation is the single most important determinant of a portfolio's long-term success. The right mix of stocks, bonds and cash - aligned to your particular risk tolerance and investment objective - is very important. Age-appropriate rebalancing is also an essential aspect of asset allocation. For younger investors, an emphasis on equities - which historically have been the best-performing asset class over time - is encouraged. As investors near their specific goal, such as retirement or sending a child to college, consideration may be given to replacing volatile assets (e.g. common stocks) with more-stable fixed investments (bonds or savings plans).
A third investment principle - investing regularly - can help lower the average cost of your purchases. Investing a certain amount of money each month or quarter helps ensure you won't pay for all your shares at market highs. This strategy - known as dollar cost averaging - also reduces unconstructive "emotion" from investing, helping shareholders avoid selling weak performers just prior to an upswing, or chasing a hot performer just before a correction.
We invite you to contact us via the Internet, through our Investor Centers or over the phone. It is our privilege to provide you the information you need to make the investments that are right for you.
Sincerely,
/s/Edward C. Johnson 3d
Edward C. Johnson 3d
Annual Report
Shareholder Expense Example
As a shareholder of the Fund, you incur two types of costs: (1) transaction costs, including sales charges (loads) on purchase payments or redemption proceeds, redemption fees, and (2) ongoing costs, including management fees, distribution and/or service (12b-1) fees and other Fund expenses. This Example is intended to help you understand your ongoing costs (in dollars) of investing in the Fund and to compare these costs with the ongoing costs of investing in other mutual funds.
The actual expense Example is based on an investment of $1,000 invested at the beginning of the period and held for the entire period (May 8, 2008 to October 31, 2008). The hypothetical expense Example is based on an investment of $1,000 invested for the one-half year period (May 1, 2008 to October 31, 2008).
Actual Expenses
The first line of the accompanying table for each class of the Fund provides information about actual account values and actual expenses. You may use the information in this line, together with the amount you invested, to estimate the expenses that you paid over the period. Simply divide your account value by $1,000.00 (for example, an $8,600 account value divided by $1,000.00 = 8.6), then multiply the result by the number in the first line for a class of the Fund under the heading entitled "Expenses Paid During Period" to estimate the expenses you paid on your account during this period. A small balance maintenance fee of $12.00 that is charged once a year may apply for certain accounts with a value of less than $2,000. This fee is not included in the table below. If it was, the estimate of expenses you paid during the period would be higher, and your ending account value lower, by this amount. In addition, the Fund, as a shareholder in the underlying Fidelity Central Funds, will indirectly bear its pro rata share of the fees and expenses incurred by the underlying Fidelity Central Funds. These fees and expenses are not included in the Fund's annualized expense ratio used to calculate the expense estimate in the table below.
Hypothetical Example for Comparison Purposes
The second line of the accompanying table for each class of the Fund provides information about hypothetical account values and hypothetical expenses based on a Class' actual expense ratio and an assumed rate of return of 5% per year before expenses, which is not the Class' actual return. The hypothetical account values and expenses may not be used to estimate the actual ending account balance or expenses you paid for the period. You may use this information to compare the ongoing costs of investing in the Fund and other funds. To do so, compare this 5% hypothetical example with the 5% hypothetical examples that appear in the shareholder reports of the other funds. A small balance maintenance fee of $12.00 that is charged once a year may apply for certain accounts with a value of less than $2,000. This fee is not included in the table below. If it was, the estimate of expenses you paid during the period would be higher, and your ending account value lower, by this amount. In addition, the Fund, as a shareholder in the underlying Fidelity Central Funds, will indirectly bear its pro rata share of the fees and expenses incurred by the underlying Fidelity Central Funds. These fees and expenses are not included in the Fund's annualized expense ratio used to calculate the expense estimate in the table below.
Annual Report
Please note that the expenses shown in the table are meant to highlight your ongoing costs only and do not reflect any transaction costs. Therefore, the second line of the table is useful in comparing ongoing costs only, and will not help you determine the relative total costs of owning different funds. In addition, if these transactional costs were included, your costs would have been higher.
| Annualized Expense Ratio | Beginning
Account Value | Ending
Account Value
October 31, 2008 | Expenses Paid
During Period |
Class A | 1.50% | | | |
Actual | | $ 1,000.00 | $ 475.00 | $ 5.35B |
HypotheticalA | | $ 1,000.00 | $ 1,017.60 | $ 7.61C |
Class T | 1.75% | | | |
Actual | | $ 1,000.00 | $ 475.00 | $ 6.24B |
HypotheticalA | | $ 1,000.00 | $ 1,016.34 | $ 8.87C |
Class B | 2.25% | | | |
Actual | | $ 1,000.00 | $ 473.00 | $ 8.01B |
HypotheticalA | | $ 1,000.00 | $ 1,013.83 | $ 11.39C |
Class C | 2.25% | | | |
Actual | | $ 1,000.00 | $ 473.00 | $ 8.01B |
HypotheticalA | | $ 1,000.00 | $ 1,013.83 | $ 11.39C |
Emerging Europe,
Middle East, Africa (EMEA) | 1.25% | | | |
Actual | | $ 1,000.00 | $ 476.00 | $ 4.46B |
HypotheticalA | | $ 1,000.00 | $ 1,018.85 | $ 6.34C |
Institutional Class | 1.25% | | | |
Actual | | $ 1,000.00 | $ 476.00 | $ 4.46B |
HypotheticalA | | $ 1,000.00 | $ 1,018.85 | $ 6.34C |
A 5% return per year before expenses
B Actual expenses are equal to each Class' annualized expense ratio, multiplied by the average account value over the period, multiplied by 177/366 (to reflect the period May 8, 2008 to October 31, 2008).
C Hypothetical expenses are equal to each Class' annualized expense ratio, multiplied by the average account value over the period, multiplied by 184/366 (to reflect the one-half year period).
Annual Report
Investment Summary (Unaudited)
Geographic Diversification (% of fund's net assets) |
As of October 31, 2008 |
| South Africa 38.1% | |
| Russia 30.8% | |
| Israel 7.2% | |
| Czech Republic 5.7% | |
| United States of America 3.9% | |
| Egypt 3.4% | |
| Turkey 2.4% | |
| Kenya 2.2% | |
| Nigeria 2.0% | |
| Other 4.3% | |

Percentages are adjusted for the effect of futures contracts, if applicable. |
Asset Allocation |
| % of fund's
net assets |
Stocks and Investment Companies | 96.1 |
Short-Term Investments and Net Other Assets | 3.9 |
Top Ten Stocks as of October 31, 2008 |
| % of fund's
net assets |
OAO Gazprom (Russia, Oil, Gas & Consumable Fuels) | 13.9 |
MTN Group Ltd. (South Africa, Wireless Telecommunication Services) | 8.9 |
Sasol Ltd. (South Africa, Oil, Gas & Consumable Fuels) | 6.5 |
Lukoil Oil Co. sponsored ADR (Russia, Oil, Gas & Consumable Fuels) | 6.4 |
Teva Pharmaceutical Industries Ltd. (Israel, Pharmaceuticals) | 6.7 |
Ceske Energeticke Zavody AS (Czech Republic, Electric Utilities) | 4.5 |
Harmony Gold Mining Co. Ltd. (South Africa, Metals & Mining) | 4.4 |
Raubex Group Ltd. (South Africa, Construction & Engineering) | 3.6 |
Exxaro Resources Ltd. (South Africa, Metals & Mining) | 2.9 |
Sberbank (Savings Bank of the Russian Federation) (Russia, Commercial Banks) | 2.6 |
| 60.4 |
Market Sectors as of October 31, 2008 |
| % of fund's
net assets |
Energy | 29.4 |
Materials | 16.3 |
Telecommunication Services | 16.1 |
Industrials | 9.1 |
Consumer Staples | 7.0 |
Health Care | 6.7 |
Utilities | 4.7 |
Financials | 4.4 |
Consumer Discretionary | 1.0 |
Information Technology | 0.3 |
Annual Report
Investments October 31, 2008
Showing Percentage of Net Assets
Common Stocks - 95.0% |
| Shares | | Value |
Canada - 0.2% |
Addax Petroleum, Inc. | 5,300 | | $ 79,118 |
Czech Republic - 5.7% |
Ceske Energeticke Zavody AS | 39,400 | | 1,704,984 |
Cesky Telecom AS | 22,291 | | 472,353 |
TOTAL CZECH REPUBLIC | | 2,177,337 |
Egypt - 3.4% |
Arab Cotton Ginning | 218,800 | | 137,203 |
EFG-Hermes Holding SAE | 36,600 | | 163,279 |
Egyptian Co. for Mobile Services (MobiNil) | 44,811 | | 851,100 |
Orascom Construction Industries | 4,280 | | 141,854 |
TOTAL EGYPT | | 1,293,436 |
Israel - 7.2% |
EL AL Israel Airlines Ltd. | 236,200 | | 54,736 |
Partner Communications Co. Ltd. ADR | 6,300 | | 117,684 |
Teva Pharmaceutical Industries Ltd. | 56,800 | | 2,316,489 |
Teva Pharmaceutical Industries Ltd. sponsored ADR | 6,600 | | 283,008 |
TOTAL ISRAEL | | 2,771,917 |
Kenya - 2.2% |
Athi River Mining Ltd. | 392,806 | | 465,621 |
British American Tobacco Kenya Ltd. | 30,000 | | 57,125 |
East African Breweries Ltd. | 209,743 | | 322,682 |
TOTAL KENYA | | 845,428 |
Nigeria - 2.0% |
Guaranty Trust Bank PLC (Reg. S) unit | 92,526 | | 508,893 |
Nigerian Breweries PLC | 853,181 | | 233,193 |
Zenith Bank PLC (a) | 200,000 | | 42,515 |
TOTAL NIGERIA | | 784,601 |
Poland - 1.6% |
Telekomunikacja Polska SA | 79,700 | | 599,617 |
Russia - 30.8% |
Comstar United TeleSystems OJSC GDR (Reg. S) | 52,000 | | 145,080 |
Lukoil Oil Co. sponsored ADR | 64,300 | | 2,456,260 |
Mobile TeleSystems OJSC sponsored ADR | 6,700 | | 262,305 |
OAO Gazprom | 1,058,700 | | 5,124,106 |
OAO Gazprom sponsored ADR (Reg. S) | 10,900 | | 216,583 |
OAO Tatneft | 405,200 | | 688,840 |
OJSC MMC Norilsk Nickel | 3,084 | | 300,690 |
Common Stocks - continued |
| Shares | | Value |
Russia - continued |
OJSC MMC Norilsk Nickel: | | | |
ADR | 23,900 | | $ 239,239 |
sponsored ADR | 16,400 | | 171,380 |
Polymetal JSC GDR (Reg. S) (a) | 289,000 | | 867,000 |
RusHydro OJSC (a) | 4,544,300 | | 83,615 |
Sberbank (Savings Bank of the Russian Federation) | 888,100 | | 923,624 |
Sberbank (Savings Bank of the Russian Federation) GDR | 500 | | 91,708 |
Vimpel Communications sponsored ADR | 11,100 | | 160,950 |
Wimm-Bill-Dann Foods OJSC sponsored ADR (a) | 2,200 | | 96,668 |
TOTAL RUSSIA | | 11,828,048 |
South Africa - 38.1% |
AFGRI Ltd. | 473,100 | | 213,064 |
Africa Cellular Towers Ltd. (a) | 2,702,300 | | 359,569 |
Austro Group Ltd. (a) | 411,000 | | 42,068 |
Aveng Ltd. | 96,100 | | 472,041 |
Cashbuild Ltd. | 38,475 | | 212,656 |
DRDGOLD Ltd. | 1,057,400 | | 422,094 |
Exxaro Resources Ltd. | 169,300 | | 1,115,959 |
Gold Fields Ltd. | 59,400 | | 413,725 |
Harmony Gold Mining Co. Ltd. (a) | 231,800 | | 1,696,181 |
Kwikspace Modular Buildings Ltd. | 936,224 | | 618,080 |
MTN Group Ltd. | 306,600 | | 3,420,614 |
Murray & Roberts Holdings Ltd. | 112,300 | | 758,399 |
Paracon Holdings Ltd. | 823,200 | | 106,165 |
Raubex Group Ltd. | 539,200 | | 1,393,531 |
Sasol Ltd. | 85,000 | | 2,509,980 |
Shoprite Holdings Ltd. | 138,200 | | 728,485 |
Zeder Investments Ltd. | 834,386 | | 136,645 |
TOTAL SOUTH AFRICA | | 14,619,256 |
Turkey - 2.4% |
Bim Birlesik Magazalar AS JSC | 42,000 | | 843,510 |
Tupras-Turkiye Petrol Rafinerileri AS | 5,000 | | 63,166 |
TOTAL TURKEY | | 906,676 |
United Kingdom - 1.0% |
Afren PLC (a) | 205,300 | | 157,504 |
Randgold Resources Ltd. sponsored ADR | 7,600 | | 235,676 |
TOTAL UNITED KINGDOM | | 393,180 |
Common Stocks - continued |
| Shares | | Value |
Zambia - 0.4% |
Celtel Zambia Ltd. | 1,355,201 | | $ 166,444 |
TOTAL COMMON STOCKS (Cost $67,520,085) | 36,465,058 |
Investment Companies - 1.1% |
| | | |
Canada - 1.1% |
Horizons BetaPro COMEX Gold Bullion Bull Plus ETF (a)
(Cost $752,672) | 45,500 | | 434,322 |
Money Market Funds - 5.3% |
| | | |
Fidelity Cash Central Fund, 1.81% (b)
(Cost $2,034,731) | 2,034,731 | | 2,034,731 |
TOTAL INVESTMENT PORTFOLIO - 101.4% (Cost $70,307,488) | | 38,934,111 |
NET OTHER ASSETS - (1.4)% | | (540,051) |
NET ASSETS - 100% | $ 38,394,060 |
Legend |
(a) Non-income producing |
(b) Affiliated fund that is available only to investment companies and other accounts managed by Fidelity Investments. The rate quoted is the annualized seven-day yield of the fund at period end. A complete unaudited listing of the fund's holdings as of its most recent quarter end is available upon request. |
Affiliated Central Funds |
Information regarding fiscal year to date income earned by the Fund from investments in Fidelity Central Funds is as follows: |
Fund | Income earned |
Fidelity Cash Central Fund | $ 55,332 |
Income Tax Information |
At October 31, 2008, the fund had a capital loss carryforward of approximately $9,997,975 all of which will expire on October 31, 2016. |
See accompanying notes which are an integral part of the financial statements.
Annual Report
Statement of Assets and Liabilities
| October 31, 2008 |
| | |
Assets | | |
Investment in securities, at value - See accompanying schedule: Unaffiliated issuers (cost $68,272,757) | $ 36,899,380 | |
Fidelity Central Funds (cost $2,034,731) | 2,034,731 | |
Total Investments (cost $70,307,488) | | $ 38,934,111 |
Receivable for investments sold | | 147,681 |
Receivable for fund shares sold | | 217,122 |
Dividends receivable | | 42,049 |
Distributions receivable from Fidelity Central Funds | | 1,244 |
Receivable from investment adviser for expense reductions | | 41,228 |
Other receivables | | 35,067 |
Total assets | | 39,418,502 |
| | |
Liabilities | | |
Payable to custodian bank | $ 132,397 | |
Payable for investments purchased | 600,641 | |
Payable for fund shares redeemed | 87,638 | |
Accrued management fee | 26,555 | |
Distribution fees payable | 1,620 | |
Other affiliated payables | 16,432 | |
Other payables and accrued expenses | 159,159 | |
Total liabilities | | 1,024,442 |
| | |
Net Assets | | $ 38,394,060 |
Net Assets consist of: | | |
Paid in capital | | $ 79,823,062 |
Undistributed net investment income | | 215,625 |
Accumulated undistributed net realized gain (loss) on investments and foreign currency transactions | | (10,269,495) |
Net unrealized appreciation (depreciation) on investments and assets and liabilities in foreign currencies | | (31,375,132) |
Net Assets | | $ 38,394,060 |
See accompanying notes which are an integral part of the financial statements.
Annual Report
Statement of Assets and Liabilities - continued
| October 31, 2008 |
| | |
Calculation of Maximum Offering Price Class A:
Net Asset Value and redemption price per share ($1,368,278 ÷ 287,952 shares) | | $ 4.75 |
| | |
Maximum offering price per share (100/94.25 of $4.75) | | $ 5.04 |
Class T:
Net Asset Value and redemption price per share ($567,501 ÷ 119,577 shares) | | $ 4.75 |
| | |
Maximum offering price per share (100/96.50 of $4.75) | | $ 4.92 |
Class B:
Net Asset Value and offering price per share
($487,381 ÷ 102,948 shares)A | | $ 4.73 |
| | |
Class C:
Net Asset Value and offering price per share
($740,888 ÷ 156,496 shares)A | | $ 4.73 |
| | |
Emerging Europe, Middle East, Africa (EMEA):
Net Asset Value, offering price and redemption price per share ($32,534,805 ÷ 6,838,077 shares) | | $ 4.76 |
| | |
Institutional Class:
Net Asset Value, offering price and redemption price per share ($2,695,207 ÷ 566,502 shares) | | $ 4.76 |
A Redemption price per share is equal to net asset value less any applicable contingent deferred sales charge.
See accompanying notes which are an integral part of the financial statements.
Annual Report
Financial Statements - continued
Statement of Operations
| For the period May 8, 2008
(commencement of operations) to
October 31, 2008 |
| | |
Investment Income | | |
Dividends | | $ 559,154 |
Interest | | 16,892 |
Income from Fidelity Central Funds | | 55,332 |
| | 631,378 |
Less foreign taxes withheld | | (19,984) |
Total income | | 611,394 |
| | |
Expenses | | |
Management fee | $ 199,081 | |
Transfer agent fees | 78,494 | |
Distribution fees | 12,456 | |
Accounting fees and expenses | 12,758 | |
Custodian fees and expenses | 155,316 | |
Independent trustees' compensation | 95 | |
Registration fees | 55,550 | |
Audit | 49,557 | |
Total expenses before reductions | 563,307 | |
Expense reductions | (303,697) | 259,610 |
Net investment income (loss) | | 351,784 |
Realized and Unrealized Gain (Loss) Net realized gain (loss) on: | | |
Investment securities: | | |
Unaffiliated issuers | (10,268,466) | |
Foreign currency transactions | (137,188) | |
Total net realized gain (loss) | | (10,405,654) |
Change in net unrealized appreciation (depreciation) on: Investment securities | (31,373,377) | |
Assets and liabilities in foreign currencies | (1,755) | |
Total change in net unrealized appreciation (depreciation) | | (31,375,132) |
Net gain (loss) | | (41,780,786) |
Net increase (decrease) in net assets resulting from operations | | $ (41,429,002) |
See accompanying notes which are an integral part of the financial statements.
Annual Report
Statement of Changes in Net Assets
| For the period
May 8, 2008
(commencement of operations) to
October 31, 2008 |
Increase (Decrease) in Net Assets | |
Operations | |
Net investment income (loss) | $ 351,784 |
Net realized gain (loss) | (10,405,654) |
Change in net unrealized appreciation (depreciation) | (31,375,132) |
Net increase (decrease) in net assets resulting from operations | (41,429,002) |
Share transactions - net increase (decrease) | 79,670,886 |
Redemption fees | 152,176 |
Total increase (decrease) in net assets | 38,394,060 |
| |
Net Assets | |
Beginning of period | - |
End of period (including undistributed net investment income of $215,625) | $ 38,394,060 |
See accompanying notes which are an integral part of the financial statements.
Annual Report
Financial Highlights - Class A
Year ended October 31, | 2008 H |
Selected Per-Share Data | |
Net asset value, beginning of period | $ 10.00 |
Income from Investment Operations | |
Net investment income (loss) E | .04 |
Net realized and unrealized gain (loss) | (5.31) |
Total from investment operations | (5.27) |
Redemption fees added to paid in capital E | .02 |
Net asset value, end of period | $ 4.75 |
Total Return B, C, D | (52.50)% |
Ratios to Average Net Assets F, I | |
Expenses before reductions | 2.50% A |
Expenses net of fee waivers, if any | 1.50% A |
Expenses net of all reductions | 1.23% A |
Net investment income (loss) | 1.20% A |
Supplemental Data | |
Net assets, end of period (000 omitted) | $ 1,368 |
Portfolio turnover rate G | 68% |
A Annualized
B Total returns for periods of less than one year are not annualized.
C Total returns would have been lower had certain expenses not been reduced during the periods shown.
D Total returns do not include the effect of the sales charges.
E Calculated based on average shares outstanding during the period.
F Fees and expenses of the underlying Fidelity Central Funds are not included in the Fund's expense ratio. The Fund indirectly bears its proportionate share of the expenses of any underlying Fidelity Central Funds.
G Amount does not include the portfolio activity of any underlying Fidelity Central Funds.
H For the period May 8, 2008 (commencement of operations) to October 31, 2008.
I Expense ratios reflect operating expenses of the class. Expenses before reductions do not reflect amounts reimbursed by the investment adviser or reductions from brokerage service arrangements or other expense offset arrangements and do not represent the amount paid by the class during periods when reimbursements or reductions occur. Expense ratios before reductions for start-up periods may not be representative of longer-term operating periods. Expenses net of fee waivers reflect expenses after reimbursement by the investment adviser but prior to reductions from brokerage service arrangements or other expense offset arrangements. Expenses net of all reductions represent the net expenses paid by the class.
See accompanying notes which are an integral part of the financial statements.
Annual Report
Financial Highlights - Class T
Year ended October 31, | 2008 H |
Selected Per-Share Data | |
Net asset value, beginning of period | $ 10.00 |
Income from Investment Operations | |
Net investment income (loss) E | .04 |
Net realized and unrealized gain (loss) | (5.31) |
Total from investment operations | (5.27) |
Redemption fees added to paid in capital E | .02 |
Net asset value, end of period | $ 4.75 |
Total Return B, C, D | (52.50)% |
Ratios to Average Net Assets F, I | |
Expenses before reductions | 2.78% A |
Expenses net of fee waivers, if any | 1.75% A |
Expenses net of all reductions | 1.49% A |
Net investment income (loss) | .95% A |
Supplemental Data | |
Net assets, end of period (000 omitted) | $ 568 |
Portfolio turnover rate G | 68% |
A Annualized
B Total returns for periods of less than one year are not annualized.
C Total returns would have been lower had certain expenses not been reduced during the periods shown.
D Total returns do not include the effect of the sales charges.
E Calculated based on average shares outstanding during the period.
F Fees and expenses of the underlying Fidelity Central Funds are not included in the Fund's expense ratio. The Fund indirectly bears its proportionate share of the expenses of any underlying Fidelity Central Funds.
G Amount does not include the portfolio activity of any underlying Fidelity Central Funds.
H For the period May 8, 2008 (commencement of operations) to October 31, 2008.
I Expense ratios reflect operating expenses of the class. Expenses before reductions do not reflect amounts reimbursed by the investment adviser or reductions from brokerage service arrangements or other expense offset arrangements and do not represent the amount paid by the class during periods when reimbursements or reductions occur. Expense ratios before reductions for start-up periods may not be representative of longer-term operating periods. Expenses net of fee waivers reflect expenses after reimbursement by the investment adviser but prior to reductions from brokerage service arrangements or other expense offset arrangements. Expenses net of all reductions represent the net expenses paid by the class.
See accompanying notes which are an integral part of the financial statements.
Annual Report
Financial Highlights - Class B
Year ended October 31, | 2008 H |
Selected Per-Share Data | |
Net asset value, beginning of period | $ 10.00 |
Income from Investment Operations | |
Net investment income (loss) E | .02 |
Net realized and unrealized gain (loss) | (5.31) |
Total from investment operations | (5.29) |
Redemption fees added to paid in capital E | .02 |
Net asset value, end of period | $ 4.73 |
Total Return B, C, D | (52.70)% |
Ratios to Average Net Assets F, I | |
Expenses before reductions | 3.32% A |
Expenses net of fee waivers, if any | 2.25% A |
Expenses net of all reductions | 1.99% A |
Net investment income (loss) | .45% A |
Supplemental Data | |
Net assets, end of period (000 omitted) | $ 487 |
Portfolio turnover rate G | 68% |
A Annualized
B Total returns for periods of less than one year are not annualized.
C Total returns would have been lower had certain expenses not been reduced during the periods shown.
D Total returns do not include the effect of the contingent deferred sales charge.
E Calculated based on average shares outstanding during the period.
F Fees and expenses of the underlying Fidelity Central Funds are not included in the Fund's expense ratio. The Fund indirectly bears its proportionate share of the expenses of any underlying Fidelity Central Funds.
G Amount does not include the portfolio activity of any underlying Fidelity Central Funds.
H For the period May 8, 2008 (commencement of operations) to October 31, 2008.
I Expense ratios reflect operating expenses of the class. Expenses before reductions do not reflect amounts reimbursed by the investment adviser or reductions from brokerage service arrangements or other expense offset arrangements and do not represent the amount paid by the class during periods when reimbursements or reductions occur. Expense ratios before reductions for start-up periods may not be representative of longer-term operating periods. Expenses net of fee waivers reflect expenses after reimbursement by the investment adviser but prior to reductions from brokerage service arrangements or other expense offset arrangements. Expenses net of all reductions represent the net expenses paid by the class.
See accompanying notes which are an integral part of the financial statements.
Annual Report
Financial Highlights - Class C
Year ended October 31, | 2008 H |
Selected Per-Share Data | |
Net asset value, beginning of period | $ 10.00 |
Income from Investment Operations | |
Net investment income (loss) E | .02 |
Net realized and unrealized gain (loss) | (5.31) |
Total from investment operations | (5.29) |
Redemption fees added to paid in capital E | .02 |
Net asset value, end of period | $ 4.73 |
Total Return B, C, D | (52.70)% |
Ratios to Average Net Assets F, I | |
Expenses before reductions | 3.28% A |
Expenses net of fee waivers, if any | 2.25% A |
Expenses net of all reductions | 1.99% A |
Net investment income (loss) | .45% A |
Supplemental Data | |
Net assets, end of period (000 omitted) | $ 741 |
Portfolio turnover rate G | 68% |
A Annualized
B Total returns for periods of less than one year are not annualized.
C Total returns would have been lower had certain expenses not been reduced during the periods shown.
D Total returns do not include the effect of the contingent deferred sales charge.
E Calculated based on average shares outstanding during the period.
F Fees and expenses of the underlying Fidelity Central Funds are not included in the Fund's expense ratio. The Fund indirectly bears its proportionate share of the expenses of any underlying Fidelity Central Funds.
G Amount does not include the portfolio activity of any underlying Fidelity Central Funds.
H For the period May 8, 2008 (commencement of operations) to October 31, 2008.
I Expense ratios reflect operating expenses of the class. Expenses before reductions do not reflect amounts reimbursed by the investment adviser or reductions from brokerage service arrangements or other expense offset arrangements and do not represent the amount paid by the class during periods when reimbursements or reductions occur. Expense ratios before reductions for start-up periods may not be representative of longer-term operating periods. Expenses net of fee waivers reflect expenses after reimbursement by the investment adviser but prior to reductions from brokerage service arrangements or other expense offset arrangements. Expenses net of all reductions represent the net expenses paid by the class.
See accompanying notes which are an integral part of the financial statements.
Annual Report
Financial Highlights - Emerging Europe, Middle East, Africa (EMEA)
Year ended October 31, | 2008 G |
Selected Per-Share Data | |
Net asset value, beginning of period | $ 10.00 |
Income from Investment Operations | |
Net investment income (loss) D | .05 |
Net realized and unrealized gain (loss) | (5.31) |
Total from investment operations | (5.26) |
Redemption fees added to paid in capital D | .02 |
Net asset value, end of period | $ 4.76 |
Total Return B, C | (52.40)% |
Ratios to Average Net Assets E, H | |
Expenses before reductions | 2.19% A |
Expenses net of fee waivers, if any | 1.25% A |
Expenses net of all reductions | .98% A |
Net investment income (loss) | 1.45% A |
Supplemental Data | |
Net assets, end of period (000 omitted) | $ 32,535 |
Portfolio turnover rate F | 68% |
A Annualized
B Total returns for periods of less than one year are not annualized.
C Total returns would have been lower had certain expenses not been reduced during the periods shown.
D Calculated based on average shares outstanding during the period.
E Fees and expenses of the underlying Fidelity Central Funds are not included in the Fund's expense ratio. The Fund indirectly bears its proportionate share of the expenses of any underlying Fidelity Central Funds.
F Amount does not include the portfolio activity of any underlying Fidelity Central Funds.
G For the period May 8, 2008 (commencement of operations) to October 31, 2008.
H Expense ratios reflect operating expenses of the class. Expenses before reductions do not reflect amounts reimbursed by the investment adviser or reductions from brokerage service arrangements or other expense offset arrangements and do not represent the amount paid by the class during periods when reimbursements or reductions occur. Expense ratios before reductions for start-up periods may not be representative of longer-term operating periods. Expenses net of fee waivers reflect expenses after reimbursement by the investment adviser but prior to reductions from brokerage service arrangements or other expense offset arrangements. Expenses net of all reductions represent the net expenses paid by the class.
See accompanying notes which are an integral part of the financial statements.
Annual Report
Financial Highlights - Institutional Class
Year ended October 31, | 2008 G |
Selected Per-Share Data | |
Net asset value, beginning of period | $ 10.00 |
Income from Investment Operations | |
Net investment income (loss) D | .05 |
Net realized and unrealized gain (loss) | (5.31) |
Total from investment operations | (5.26) |
Redemption fees added to paid in capital D | .02 |
Net asset value, end of period | $ 4.76 |
Total Return B, C | (52.40)% |
Ratios to Average Net Assets E, H | |
Expenses before reductions | 2.12% A |
Expenses net of fee waivers, if any | 1.25% A |
Expenses net of all reductions | .98% A |
Net investment income (loss) | 1.46% A |
Supplemental Data | |
Net assets, end of period (000 omitted) | $ 2,695 |
Portfolio turnover rate F | 68% |
A Annualized
B Total returns for periods of less than one year are not annualized.
C Total returns would have been lower had certain expenses not been reduced during the periods shown.
D Calculated based on average shares outstanding during the period.
E Fees and expenses of the underlying Fidelity Central Funds are not included in the Fund's expense ratio. The Fund indirectly bears its proportionate share of the expenses of any underlying Fidelity Central Funds.
F Amount does not include the portfolio activity of any underlying Fidelity Central Funds.
G For the period May 8, 2008 (commencement of operations) to October 31, 2008.
H Expense ratios reflect operating expenses of the class. Expenses before reductions do not reflect amounts reimbursed by the investment adviser or reductions from brokerage service arrangements or other expense offset arrangements and do not represent the amount paid by the class during periods when reimbursements or reductions occur. Expense ratios before reductions for start-up periods may not be representative of longer-term operating periods. Expenses net of fee waivers reflect expenses after reimbursement by the investment adviser but prior to reductions from brokerage service arrangements or other expense offset arrangements. Expenses net of all reductions represent the net expenses paid by the class.
See accompanying notes which are an integral part of the financial statements.
Annual Report
Notes to Financial Statements
For the period ended October 31, 2008
1. Organization.
Fidelity Emerging Europe, Middle East, Africa (EMEA) Fund (the Fund) is a non-diversified fund of Fidelity Investment Trust (the trust) and is authorized to issue an unlimited number of shares. The trust is registered under the Investment Company Act of 1940, as amended (the 1940 Act), as an open-end management investment company organized as a Massachusetts business trust. The Fund offers Class A, Class T, Class B, Class C, Emerging Europe, Middle East, Africa (EMEA), and Institutional Class shares, each of which has equal rights as to assets and voting privileges. Each class has exclusive voting rights with respect to matters that affect that class. Class B shares will automatically convert to Class A shares after a holding period of seven years from the initial date of purchase. Investment income, realized and unrealized capital gains and losses, the common expenses of the Fund, and certain fund-level expense reductions, if any, are allocated on a pro rata basis to each class based on the relative net assets of each class to the total net assets of the Fund. Each class differs with respect to transfer agent and distribution and service plan fees incurred. Certain expense reductions also differ by class. The Fund's investments in emerging markets can be subject to social economic, regulatory, and political uncertainties and can be extremely volatile.
2. Investments in Fidelity Central Funds.
The Fund may invest in Fidelity Central Funds, which are open-end investment companies available only to other investment companies and accounts managed by Fidelity Management & Research Company (FMR) and its affiliates. The Fund's Schedule of Investments lists each of the Fidelity Central Funds held as of period end, if any, as an investment of the Fund, but does not include the underlying holdings of each Fidelity Central Fund. As an Investing Fund, the Fund indirectly bears its proportionate share of the expenses of the underlying Fidelity Central Funds.
The Money Market Central Funds seek preservation of capital and current income and are managed by Fidelity Investments Money Management, Inc. (FIMM), an affiliate of FMR.
A complete unaudited list of holdings for each Fidelity Central Fund is available upon request or at the SEC's web site at www.sec.gov. In addition, the financial statements of the Fidelity Central Funds, which are not covered by the Fund's Report of Independent Registered Public Accounting Firm, are available on the SEC's web site or upon request.
Annual Report
3. Significant Accounting Policies.
The financial statements have been prepared in conformity with accounting principles generally accepted in the United States of America, which require management to make certain estimates and assumptions at the date of the financial statements. Actual results could differ from those estimates. The following summarizes the significant accounting policies of the Fund:
Security Valuation. Investments are valued as of 4:00 p.m. Eastern time on the last calendar day of the period. Wherever possible, the Fund uses independent pricing services approved by the Board of Trustees to value its investments.
Equity securities, including restricted securities, for which market quotations are readily available, are valued at the last reported sale price or official closing price as reported by an independent pricing service on the primary market or exchange on which they are traded. In the event there were no sales during the day or closing prices are not available, securities are valued at the last quoted bid price. Investments in open-end mutual funds, including the Fidelity Central Funds, are valued at their closing net asset value each business day. Short-term securities with remaining maturities of sixty days or less for which quotations are not readily available are valued at amortized cost, which approximates value.
When current market prices or quotations are not readily available or reliable, valuations may be determined in good faith in accordance with procedures adopted by the Board of Trustees. Factors used in determining value may include significant market or security specific events, changes in interest rates and credit quality, and developments in foreign markets which are monitored by evaluating the performance of ADRs, futures contracts and exchange-traded funds. The frequency with which these procedures are used cannot be predicted and may be utilized to a significant extent. The value of securities used for net asset value (NAV) calculation under these procedures may differ from published prices for the same securities.
Foreign Currency. The Fund uses foreign currency contracts to facilitate transactions in foreign-denominated securities. Losses from these transactions may arise from changes in the value of the foreign currency or if the counterparties do not perform under the contracts' terms.
Foreign-denominated assets, including investment securities, and liabilities are translated into U.S. dollars at the exchange rate at period end. Purchases and sales of investment securities, income and dividends received and expenses denominated in foreign currencies are translated into U.S. dollars at the exchange rate in effect on the transaction date.
Annual Report
Notes to Financial Statements - continued
3. Significant Accounting Policies - continued
Foreign Currency - continued
The effects of exchange rate fluctuations on investments are included with the net realized and unrealized gain (loss) on investment securities. Other foreign currency transactions resulting in realized and unrealized gain (loss) are disclosed separately.
Investment Transactions and Income. For financial reporting purposes, the Fund's investment holdings and NAV include trades executed through the end of the last business day of the period. The NAV per share for processing shareholder transactions is calculated as of the close of business of the New York Stock Exchange (NYSE), normally 4:00 p.m. Eastern time and includes trades executed through the end of the prior business day. Gains and losses on securities sold are determined on the basis of identified cost. Dividend income is recorded on the ex-dividend date, except for certain dividends from foreign securities where the ex-dividend date may have passed, which are recorded as soon as the Fund is informed of the ex-dividend date. Non-cash dividends included in dividend income, if any, are recorded at the fair market value of the securities received. Interest income and distributions from the Fidelity Central Funds are accrued as earned. Interest income includes coupon interest and amortization of premium and accretion of discount on debt securities. Investment income is recorded net of foreign taxes withheld where recovery of such taxes is uncertain.
Expenses. Most expenses of the trust can be directly attributed to a fund. Expenses which cannot be directly attributed are apportioned among each Fund in the trust. Expense estimates are accrued in the period to which they relate and adjustments are made when actual amounts are known.
Income Tax Information and Distributions to Shareholders. Each year, the Fund intends to qualify as a regulated investment company by distributing substantially all of its taxable income and realized gains under Subchapter M of the Internal Revenue Code and filing its U.S. federal tax return. As a result, no provision for income taxes is required. The Fund is subject to the provisions of FASB Interpretation No. 48, Accounting for Uncertainties in Income Taxes (FIN 48). FIN 48 sets forth a minimum threshold for financial statement recognition of the benefit of a tax position taken or expected to be taken in a tax return. There are no unrecognized tax benefits in the accompanying financial statements in connection with the tax positions expected to be taken in the initial filing of the Fund's federal tax return. Foreign taxes are provided for based on the Fund's understanding of the tax rules and rates that exist in the foreign markets in which it invests.
Annual Report
3. Significant Accounting Policies - continued
Income Tax Information and Distributions to Shareholders - continued
Distributions are recorded on the ex-dividend date. Income dividends and capital gain distributions are declared separately for each class. Income and capital gain distributions are determined in accordance with income tax regulations, which may differ from generally accepted accounting principles. In addition, the Fund will claim a portion of the payment made to redeeming shareholders as a distribution for income tax purposes.
Capital accounts within the financial statements are adjusted for permanent book-tax differences. These adjustments have no impact on net assets or the results of operations. Temporary book-tax differences will reverse in a subsequent period.
Book-tax differences are primarily due to foreign currency transactions, passive foreign investment companies (PFIC), capital loss carryforwards and losses deferred due to wash sales.
The tax-basis components of distributable earnings and the federal tax cost as of period end were as follows:
Unrealized appreciation | $ 544,450 |
Unrealized depreciation | (32,191,102) |
Net unrealized appreciation (depreciation) | (31,646,652) |
Undistributed ordinary income | 215,374 |
Capital loss carryforward | (9,997,975) |
| |
Cost for federal income tax purposes | $ 70,580,763 |
Short-Term Trading (Redemption) Fees. Shares held in the Fund less than 90 days are subject to a redemption fee equal to 1.50% of the proceeds of the redeemed shares. All redemption fees, including any estimated redemption fees paid by FMR, are retained by the Fund and accounted for as an addition to paid in capital.
New Accounting Pronouncement. In September 2006, Statement of Financial Accounting Standards No. 157, Fair Value Measurements (SFAS 157), was issued and is effective for fiscal years beginning after November 15, 2007. SFAS 157 defines fair value, establishes a framework for measuring fair value and results in expanded disclosures about fair value measurements. The Fund will adopt the provisions of SFAS 157 effective for its fiscal year beginning November 1, 2008.
4. Operating Policies.
Repurchase Agreements. FMR has received an Exemptive Order from the Securities and Exchange Commission (the SEC) which permits the Fund and other affiliated entities of FMR to transfer uninvested cash balances into joint trading accounts which are then invested in repurchase agreements. The Fund may also invest directly with
Annual Report
Notes to Financial Statements - continued
4. Operating Policies - continued
Repurchase Agreements - continued
institutions in repurchase agreements. Repurchase agreements are collateralized by government or non-government securities. Upon settlement date, collateral is held in segregated accounts with custodian banks and may be obtained in the event of a default of the counterparty. The Fund monitors, on a daily basis, the value of the collateral to ensure it is at least equal to the principal amount of the repurchase agreement (including accrued interest). In the event of a default by the counterparty, realization of the collateral proceeds could be delayed, during which time the value of the collateral may decline.
5. Purchases and Sales of Investments.
Purchases and sales of securities, other than short-term securities, aggregated $111,504,337 and $32,962,700, respectively.
6. Fees and Other Transactions with Affiliates.
Management Fee. FMR and its affiliates provide the Fund with investment management related services for which the Fund pays a monthly management fee. The management fee is the sum of an individual fund fee rate that is based on an annual rate of .55% of the Fund's average net assets and a group fee rate that averaged .26% during the period. The group fee rate is based upon the average net assets of all the mutual funds advised by FMR. The group fee rate decreases as assets under management increase and increases as assets under management decrease. For the period, the total annualized management fee rate was .81% of the Fund's average net assets.
Distribution and Service Plan. In accordance with Rule 12b-1 of the 1940 Act, the Fund has adopted separate Distribution and Service Plans for each class of shares. Certain classes pay Fidelity Distributors Corporation (FDC), an affiliate of FMR, separate Distribution and Service Fees, each of which is based on an annual percentage of each class' average net assets. In addition, FDC may pay financial intermediaries for selling shares of the Fund and providing shareholder support services. For the period, the Distribution and Service Fee rates and the total amounts paid to and retained by FDC were as follows:
| Distribution
Fee | Service
Fee | Paid to
FDC | Retained
by FDC |
Class A | .00% | .25% | $ 1,896 | $ 761 |
Class T | .25% | .25% | 2,000 | 1,515 |
Class B | .75% | .25% | 3,632 | 3,482 |
Class C | .75% | .25% | 4,928 | 4,437 |
| | | $ 12,456 | $ 10,195 |
Annual Report
6. Fees and Other Transactions with Affiliates - continued
Sales Load. FDC receives a front-end sales charge of up to 5.75% for selling Class A shares, and 3.50% for selling Class T shares, some of which is paid to financial intermediaries for selling shares of the Fund. FDC receives the proceeds of contingent deferred sales charges levied on Class A, Class T, Class B, and Class C redemptions. These charges depend on the holding period. The deferred sales charges range from 5% to 1% for Class B, 1% for Class C, 1.00% to .50% for certain purchases of Class A shares and .25% for certain purchases of Class T shares.
For the period, sales charge amounts retained by FDC were as follows:
| Retained
by FDC |
Class A | $ 5,923 |
Class T | 524 |
Class B* | 513 |
Class C* | 272 |
| $ 7,232 |
* When Class B and Class C shares are initially sold, FDC pays commissions from its own resources to financial intermediaries through which the sales are made.
Transfer Agent Fees. Fidelity Investments Institutional Operations Company, Inc. (FIIOC), an affiliate of FMR, is the transfer, dividend disbursing and shareholder servicing agent for each class of the Fund. FIIOC receives account fees and asset-based fees that vary according to the account size and type of account of the shareholders of the respective classes of the Fund. FIIOC pays for typesetting, printing and mailing of shareholder reports, except proxy statements. For the period, the total transfer agent fees paid by each class were as follows:
| Amount | % of
Average
Net Assets* |
Class A | $ 2,312 | .31 |
Class T | 907 | .23 |
Class B | 902 | .25 |
Class C | 1,374 | .28 |
Emerging Europe, Middle East, Africa (EMEA) | 71,417 | .33 |
Institutional Class | 1,582 | .20 |
| $ 78,494 | |
* Annualized
Annual Report
Notes to Financial Statements - continued
6. Fees and Other Transactions with Affiliates - continued
Accounting Fees. Fidelity Service Company, Inc. (FSC), an affiliate of FMR, maintains the Fund's accounting records. The fee is based on the level of average net assets for the month.
Brokerage Commissions. The Fund placed a portion of its portfolio transactions with brokerage firms which are affiliates of the investment adviser. The commissions paid to these affiliated firms were $166 for the period.
7. Expense Reductions.
FMR voluntarily agreed to reimburse each class to the extent annual operating expenses exceeded certain levels of average net assets as noted in the table below. Some expenses, for example interest expense, are excluded from this reimbursement.
The following classes were in reimbursement during the period:
| Expense
Limitations | Reimbursement
from adviser |
Class A | 1.50% | $ 7,707 |
Class T | 1.75% | 4,165 |
Class B | 2.25% | 3,924 |
Class C | 2.25% | 5,138 |
Emerging Europe, Middle East, Africa (EMEA) | 1.25% | 208,302 |
Institutional Class | 1.25% | 7,188 |
| | $ 236,424 |
Many of the brokers with whom FMR places trades on behalf of the Fund provided services to the Fund in addition to trade execution. These services included payments of certain expenses on behalf of the Fund totaling $65,477 for the period. In addition, through arrangements with the Fund's custodian and each class' transfer agent, credits realized as a result of uninvested cash balances were used to reduce the Fund's expenses. During the period, these credits reduced the Fund's custody expenses by $1,796.
8. Other.
The Fund's organizational documents provide former and current trustees and officers with a limited indemnification against liabilities arising in connection with the performance of their duties to the Fund. In the normal course of business, the Fund may also enter into contracts that provide general indemnifications. The Fund's maximum
Annual Report
8. Other - continued
exposure under these arrangements is unknown as this would be dependent on future claims that may be made against the Fund. The risk of material loss from such claims is considered remote.
At the end of the period, FMR or its affiliates were the owners of record of 32% of the total outstanding shares of the Fund.
9. Share Transactions.
Transactions for each class of shares were as follows:
| SharesA | DollarsA |
Year ended October 31, | 2008 | 2008 |
Class A | | |
Shares sold | 344,487 | $ 3,038,678 |
Shares redeemed | (56,535) | (363,899) |
Net increase (decrease) | 287,952 | $ 2,674,779 |
Class T | | |
Shares sold | 130,067 | $ 1,228,022 |
Shares redeemed | (10,490) | (50,821) |
Net increase (decrease) | 119,577 | $ 1,177,201 |
Class B | | |
Shares sold | 115,650 | $ 1,098,908 |
Shares redeemed | (12,702) | (76,194) |
Net increase (decrease) | 102,948 | $ 1,022,714 |
Class C | | |
Shares sold | 174,986 | $ 1,629,690 |
Shares redeemed | (18,490) | (109,269) |
Net increase (decrease) | 156,496 | $ 1,520,421 |
Emerging Europe, Middle East, Africa (EMEA) | | |
Shares sold | 10,218,704 | $ 92,385,312 |
Shares redeemed | (3,380,627) | (23,437,711) |
Net increase (decrease) | 6,838,077 | $ 68,947,601 |
Institutional Class | | |
Shares sold | 598,356 | $ 4,518,354 |
Shares redeemed | (31,854) | (190,184) |
Net increase (decrease) | 566,502 | $ 4,328,170 |
A For the period May 8, 2008 (commencement of operations) to October 31, 2008.
Annual Report
To the Trustees of Fidelity Investment Trust and Shareholders of Fidelity Emerging Europe, Middle East, Africa (EMEA) Fund:
We have audited the accompanying statement of assets and liabilities of Fidelity Emerging Europe, Middle East, Africa (EMEA) Fund (the Fund), a fund of Fidelity Investment Trust, including the schedule of investments, as of October 31, 2008, and the related statement of operations, the statement of changes in net assets and the financial highlights for the period from May 8, 2008 (Commencement of Operations) to October 31, 2008. These financial statements and financial highlights are the responsibility of the Fund's management. Our responsibility is to express an opinion on these financial statements and financial highlights based on our audit.
We conducted our audit in accordance with standards of the Public Company Accounting Oversight Board (United States). Those standards require that we plan and perform the audit to obtain reasonable assurance about whether the financial statements and financial highlights are free of material misstatement. The Fund is not required to have, nor were we engaged to perform, an audit of its internal control over financial reporting. Our audits included consideration of internal control over financial reporting as a basis for designing audit procedures that are appropriate in the circumstances, but not for the purpose of expressing an opinion on the effectiveness of the Fund's internal control over financial reporting. Accordingly, we express no such opinion. An audit also includes examining, on a test basis, evidence supporting the amounts and disclosures in the financial statements, assessing the accounting principles used and significant estimates made by management, as well as evaluating the overall financial statement presentation. Our procedures included confirmation of securities owned as of October 31, 2008, by correspondence with the custodians and brokers; where replies were not received from brokers, we performed other auditing procedures. We believe that our audit provides a reasonable basis for our opinion.
In our opinion, the financial statements and financial highlights referred to above present fairly, in all material respects, the financial position of Fidelity Emerging Europe, Middle East, Africa (EMEA) Fund as of October 31, 2008, the results of its operations, the changes in its net assets and its financial highlights for the period from May 8, 2008 (Commencement of Operations) to October 31, 2008, in conformity with accounting principles generally accepted in the United States of America.
/s/ Deloitte & Touche LLP
DELOITTE & TOUCHE LLP
Boston, Massachusetts
December 19, 2008
Annual Report
The Trustees, Member of the Advisory Board, and executive officers of the trust and fund, as applicable, are listed below. The Board of Trustees governs the fund and is responsible for protecting the interests of shareholders. The Trustees are experienced executives who meet periodically throughout the year to oversee the fund's activities, review contractual arrangements with companies that provide services to the fund, and review the fund's performance. Except for Edward C. Johnson 3d and James C. Curvey, each of the Trustees oversees 220 funds advised by FMR or an affiliate. Messrs. Johnson and Curvey oversee 379 funds advised by FMR or an affiliate.
The Trustees hold office without limit in time except that (a) any Trustee may resign; (b) any Trustee may be removed by written instrument, signed by at least two-thirds of the number of Trustees prior to such removal; (c) any Trustee who requests to be retired or who has become incapacitated by illness or injury may be retired by written instrument signed by a majority of the other Trustees; and (d) any Trustee may be removed at any special meeting of shareholders by a two-thirds vote of the outstanding voting securities of the trust. Each Trustee who is not an interested person (as defined in the 1940 Act) (Independent Trustee), shall retire not later than the last day of the calendar year in which his or her 72nd birthday occurs. The Independent Trustees may waive this mandatory retirement age policy with respect to individual Trustees. The executive officers and Advisory Board Member hold office without limit in time, except that any officer and Advisory Board Member may resign or may be removed by a vote of a majority of the Trustees at any regular meeting or any special meeting of the Trustees. Except as indicated, each individual has held the office shown or other offices in the same company for the past five years.
The fund's Statement of Additional Information (SAI) includes more information about the Trustees. To request a free copy, call Fidelity at 1-877-208-0098.
Interested Trustees*:
Correspondence intended for each Trustee who is an interested person may be sent to Fidelity Investments, 82 Devonshire Street, Boston, Massachusetts 02109.
Name, Age; Principal Occupation |
Edward C. Johnson 3d (78) |
| Year of Election or Appointment: 1984 Mr. Johnson is Chairman of the Board of Trustees. Mr. Johnson serves as Chief Executive Officer, Chairman, and a Director of FMR LLC; Chairman and a Director of FMR; Chairman and a Director of Fidelity Research & Analysis Company (FRAC); Chairman and a Director of Fidelity Investments Money Management, Inc.; and Chairman and a Director of FMR Co., Inc. In addition, Mr. Johnson serves as Chairman and Director of FIL Limited. Previously, Mr. Johnson served as President of FMR LLC (2006-2007). |
James C. Curvey (73) |
| Year of Election or Appointment: 2007 Mr. Curvey also serves as Trustee (2007-present) of other investment companies advised by FMR. Mr. Curvey is a Director of FMR and FMR Co., Inc. (2007-present). Mr. Curvey is also Vice Chairman (2006-
present) and Director of FMR LLC. In addition, Mr. Curvey serves as an Overseer for the Boston Symphony Orchestra and a member of the Trustees of Villanova University. |
* Trustees have been determined to be "Interested Trustees" by virtue of, among other things, their affiliation with the trust or various entities under common control with FMR. FMR Corp. merged with and into FMR LLC on October 1, 2007. Any references to FMR LLC for prior periods are deemed to be references to the prior entity.
Independent Trustees:
Correspondence intended for each Independent Trustee (that is, the Trustees other than the Interested Trustees) may be sent to Fidelity Investments, P.O. Box 55235, Boston, Massachusetts 02205-5235.
Name, Age; Principal Occupation |
Dennis J. Dirks (60) |
| Year of Election or Appointment: 2005 Prior to his retirement in May 2003, Mr. Dirks was Chief Operating Officer and a member of the Board of The Depository Trust & Clearing Corporation (DTCC) (1999-2003). He also served as President, Chief Operating Officer, and Board member of The Depository Trust Company (DTC) (1999-2003) and President and Board member of the National Securities Clearing Corporation (NSCC) (1999-2003). In addition, Mr. Dirks served as a Trustee and a member of the Finance Committee of Manhattan College (2005-2008), and as Chief Executive Officer and Board member of the Government Securities Clearing Corporation (2001-2003) and Chief Executive Officer and Board member of the Mortgage-Backed Securities Clearing Corporation (2001-2003). Mr. Dirks also serves as a Trustee and a member of the Finance Committee of AHRC of Nassau County (2006-present). |
Alan J. Lacy (55) |
| Year of Election or Appointment: 2008 Mr. Lacy serves as Senior Adviser (2007-present) of Oak Hill Capital Partners, L.P. (a private equity firm). Mr. Lacy also served as Chief Executive Officer (2000-2005) and Vice Chairman (2005-2006) of Sears Holdings Corporation and Sears, Roebuck and Co. (retail). In addition, Mr. Lacy serves as a member of the Board of Directors of The Western Union Company (global money transfer, 2006-present) and Bristol-Myers Squibb (global pharmaceuticals, 2007-present). Mr. Lacy is a Trustee of the National Parks Conservation Association and The Field Museum of Natural History. |
Ned C. Lautenbach (64) |
| Year of Election or Appointment: 2000 Mr. Lautenbach is Chairman of the Independent Trustees (2006-present). Mr. Lautenbach is an Advisory Partner of Clayton, Dubilier & Rice, Inc. (private equity investment firm). Previously, Mr. Lautenbach was with the International Business Machines Corporation (IBM) from 1968 until his retirement in 1998. Mr. Lautenbach serves as a Director of Eaton Corporation (diversified industrial) as well as the Philharmonic Center for the Arts in Naples, Florida. He also is a member of the Board of Trustees of Fairfield University (2005-present), as well as a member of the Council on Foreign Relations. Previously, Mr. Lautenbach served as a Director of Sony Corporation (2006-2007). |
Joseph Mauriello (64) |
| Year of Election or Appointment: 2008 Prior to his retirement in January 2006, Mr. Mauriello served in numerous senior management positions including Deputy Chairman and Chief Operating Officer (2004-2005), and Vice Chairman of Financial Services (2002-2004) of KPMG LLP US (professional services firm, 1965-2005). Mr. Mauriello currently serves as a member of the Board of Directors of XL Capital Ltd. (global insurance and re-insurance company, 2006-present) and of Arcadia Resources Inc. (health care services and products, 2007-present). He also served as a Director of the Hamilton Funds of the Bank of New York (2006-2007). |
Cornelia M. Small (64) |
| Year of Election or Appointment: 2005 Ms. Small is a member of the Investment Committee, and Chair (2008-present) and a member of the Board of Trustees of Smith College. Ms. Small also serves on the Investment Committee of the Berkshire Taconic Community Foundation (2008-present). Previously, Ms. Small served as Chairperson of the Investment Committee (2002-2008) of Smith College and as Co-Chair (2000-2003) of the Annual Fund for the Fletcher School of Law and Diplomacy. In addition, she served as Chief Investment Officer, Director of Global Equity Investments, and a member of the Board of Directors of Scudder, Stevens & Clark and Scudder Kemper Investments. |
William S. Stavropoulos (69) |
| Year of Election or Appointment: 2001 Mr. Stavropoulos is Chairman Emeritus of the Board of Directors of The Dow Chemical Company, where he previously served in numerous senior management positions, including President (1993-2000; 2002-2003), CEO (1995-2000; 2002-2004), Chairman of the Executive Committee (2000-2006), and as a member of the Board of Directors (1990-2006). Currently, he is a Director of Teradata Corporation (data warehousing and technology solutions, 2008-present), Chemical Financial Corporation, Maersk Inc. (industrial conglomerate), Tyco International, Inc. (multinational manufacturing and services, 2007-present), and a member of the Advisory Board for Metalmark Capital (private equity investment firm, 2005-present). He is a special advisor to Clayton, Dubilier & Rice, Inc. (private equity investment). In addition, Mr. Stavropoulos is a member of the University of Notre Dame Advisory Council for the College of Science. |
David M. Thomas (59) |
| Year of Election or Appointment: 2008 Previously, Mr. Thomas served as Executive Chairman (2005-2006) and Chairman and Chief Executive Officer (2000-2005) of IMS Health, Inc. (pharmaceutical and healthcare information solutions). In addition, Mr. Thomas serves as a member of the Board of Directors of Fortune Brands, Inc. (consumer products holding company), and Interpublic Group of Companies, Inc. (marketing communication, 2004-present). |
Michael E. Wiley (58) |
| Year of Election or Appointment: 2008 Mr. Wiley also serves as a member of the Board of Trustees of the University of Tulsa (2000-2006; 2007-present). He serves as a Director of Tesoro Corporation (independent oil refiner and marketer, 2005-present), and a Director of Bill Barrett Corporation (exploration and production company, 2005-present). In addition, he also serves as a Director of Post Oak Bank (privately-held bank, 2004-present). Previously, Mr. Wiley served as a Sr. Energy Advisor of Katzenbach Partners, LLC (consulting firm, 2006-2007), as an Advisory Director of Riverstone Holdings (private investment firm), Chairman, President, and CEO of Baker Hughes, Inc. (oilfield services company, 2000-2004), and as Director of Spinnaker Exploration Company (exploration and production company, 2001-2005). |
Advisory Board Member and Executive Officers**:
Correspondence intended for each executive officer and Mr. Lynch may be sent to Fidelity Investments, 82 Devonshire Street, Boston, Massachusetts 02109.
Name, Age; Principal Occupation |
Peter S. Lynch (64) |
| Year of Election or Appointment: 2003 Member of the Advisory Board of Fidelity's Equity and High Income Funds. Mr. Lynch is Vice Chairman and a Director of FMR, and Vice Chairman (2001-present) and a Director of FMR Co., Inc. Previously, Mr. Lynch served as a Trustee of the Fidelity funds (1990-2003). In addition, he serves as a Trustee of Boston College and as the Chairman of the Inner-City Scholarship Fund. Previously, Mr. Lynch served on the Special Olympics International Board of Directors (1997-2006). |
Kenneth B. Robins (39) |
| Year of Election or Appointment: 2008 President and Treasurer of Fidelity's Equity and High Income Funds. Mr. Robins is an employee of Fidelity Investments (2004-present). Before joining Fidelity Investments, Mr. Robins worked at KPMG LLP, where he was a partner in KPMG's department of professional practice (2002-2004). |
Walter C. Donovan (46) |
| Year of Election or Appointment: 2007 Vice President of Fidelity's Equity Funds. Mr. Donovan also serves as President of FMR and FMR Co., Inc., and Executive Vice President of Fidelity Investments Money Management, Inc. (2007-present). Previously, Mr. Donovan served as Executive Vice President of FMR and FMR Co., Inc. (2005-2007) and Senior Vice President of FMR (2003-2005) and FMR Co., Inc. (2004-2005). |
Eric M. Wetlaufer (46) |
| Year of Election or Appointment: 2006 Vice President of Fidelity's International Equity Funds. Mr. Wetlaufer also serves as Group Chief Investment Officer of FMR. Mr. Wetlaufer is Chairman, Chief Executive Officer, and President of Fidelity Management & Research (Hong Kong) Limited (2008-present); Chairman, Chief Executive Officer, President, and a Director of Fidelity Management & Research (Japan) Inc. (2008-present); Chairman and Chief Executive Officer (2007-present) and President and a Director (2006-present) of Fidelity Management & Research (U.K.) Inc. and President and a Director of Fidelity Research & Analysis Company (2006-present). Before joining Fidelity Investments in 2005, Mr. Wetlaufer was a partner in Oxhead Capital Management (2004-2005) and a Chief Investment Officer of Putnam Investments (1997-2003). |
Scott C. Goebel (40) |
| Year of Election or Appointment: 2008 Secretary and Chief Legal Officer (CLO) of the Fidelity funds. Mr. Goebel also serves as General Counsel, Secretary, and Senior Vice President of FMR (2008-present); Deputy General Counsel of FMR LLC; Chief Legal Secretary of Fidelity Management & Research (Hong Kong) Limited (2008-present) and Assistant Secretary of Fidelity Management & Research (Japan) Inc. (2008-present). Previously, Mr. Goebel served as Assistant Secretary of the Funds (2007-2008) and as Vice President and Secretary of Fidelity Distributors Corporation (FDC) (2005-2007). |
John B. McGinty, Jr. (46) |
| Year of Election or Appointment: 2008 Assistant Secretary of Fidelity's Equity and High Income Funds. Mr. McGinty is an employee of Fidelity Investments (2004-present). Mr. McGinty also serves as Senior Vice President, Secretary, and Chief Legal Officer of FDC (2007-present). Before joining Fidelity Investments, Mr. McGinty practiced law at Ropes & Gray, LLP. |
Holly C. Laurent (54) |
| Year of Election or Appointment: 2008 Anti-Money Laundering (AML) Officer of the Fidelity funds. Ms. Laurent is an employee of Fidelity Investments. Previously, Ms. Laurent was Senior Vice President and Head of Legal for Fidelity Business Services India Pvt. Ltd. (2006-2008), Senior Vice President, Deputy General Counsel and Group Head for FMR LLC (2005-2006). |
Christine Reynolds (50) |
| Year of Election or Appointment: 2008 Chief Financial Officer of the Fidelity funds. Ms. Reynolds became President of Fidelity Pricing and Cash Management Services (FPCMS) in August 2008. She served as Chief Operating Officer of FPCMS from 2007 through July 2008. Previously, Ms. Reynolds served as President, Treasurer, and Anti-Money Laundering officer of the Fidelity funds (2004-2007). Before joining Fidelity Investments, Ms. Reynolds worked at PricewaterhouseCoopers LLP (PwC) (1980-2002), where she was an audit partner with PwC's investment management practice. |
Kenneth A. Rathgeber (61) |
| Year of Election or Appointment: 2004 Chief Compliance Officer of Fidelity's Equity and High Income Funds. Mr. Rathgeber is Chief Compliance Officer of Fidelity Management & Research (Hong Kong) Limited (2008-present), Fidelity Management & Research (Japan) Inc. (2008-present), FMR (2005-present), FMR Co., Inc. (2005-present), Fidelity Management & Research (U.K.) Inc. (2005-present), Fidelity Research & Analysis Company (2005-present), Fidelity Investments Money Management, Inc. (2005-present), and Strategic Advisers, Inc. (2005-present). |
Bryan A. Mehrmann (47) |
| Year of Election or Appointment: 2005 Deputy Treasurer of the Fidelity funds. Mr. Mehrmann is an employee of Fidelity Investments. Previously, Mr. Mehrmann served as Vice President of Fidelity Investments Institutional Services Group (FIIS)/Fidelity Investments Institutional Operations Corporation, Inc. (FIIOC) Client Services (1998-2004). |
Adrien E. Deberghes (41) |
| Year of Election or Appointment: 2008 Deputy Treasurer of Fidelity's Equity and High Income Funds. Mr. Deberghes is an employee of Fidelity Investments (2008-present). Previously, Mr. Deberghes served as Senior Vice President of Mutual Fund Administration at State Street Corporation (2007-2008), Senior Director of Mutual Fund Administration at Investors Bank & Trust (2005-2007), and Director of Finance for Dunkin' Brands (2000-2005). |
Robert G. Byrnes (41) |
| Year of Election or Appointment: 2005 Assistant Treasurer of the Fidelity funds. Mr. Byrnes is an employee of Fidelity Investments (2005-present). Previously, Mr. Byrnes served as Vice President of Fidelity Pricing and Cash Management Services (FPCMS) (2003-2005). Before joining Fidelity Investments, Mr. Byrnes worked at Deutsche Asset Management where he served as Vice President of the Investment Operations Group (2000-2003). |
Peter L. Lydecker (54) |
| Year of Election or Appointment: 2004 Assistant Treasurer of the Fidelity funds. Mr. Lydecker is an employee of Fidelity Investments. |
Paul M. Murphy (61) |
| Year of Election or Appointment: 2007 Assistant Treasurer of the Fidelity funds. Mr. Murphy is an employee of Fidelity Investments (2007-present). Previously, Mr. Murphy served as Chief Financial Officer of the Fidelity Funds (2005-2006), Vice President and Associate General Counsel of FMR (2007), and Senior Vice President of Fidelity Pricing and Cash Management Services (FPCMS) (1994-2007). |
Gary W. Ryan (50) |
| Year of Election or Appointment: 2005 Assistant Treasurer of the Fidelity funds. Mr. Ryan is an employee of Fidelity Investments. Previously, Mr. Ryan served as Vice President of Fund Reporting in Fidelity Pricing and Cash Management Services (FPCMS) (1999-2005). |
** FMR Corp. merged with and into FMR LLC on October 1, 2007. Any references to FMR LLC for prior periods are deemed to be references to the prior entity.
Annual Report
Board Approval of Investment Advisory Contracts and Management Fees
Fidelity Emerging Europe, Middle East, Africa (EMEA) Fund
Each year, typically in July, the Board of Trustees, including the Independent Trustees (together, the Board), votes on the renewal of the management contract and sub-advisory agreements (together, the Advisory Contracts) for the fund. The Board, assisted by the advice of fund counsel and Independent Trustees' counsel, requests and considers a broad range of information throughout the year.
The Board meets regularly and, acting directly and through its separate committees, requests and receives information concerning, and considers at each of its meetings factors that are relevant to, its annual consideration of the renewal of the fund's Advisory Contracts, including the services and support provided to the fund and its shareholders. At the time of the renewal, the Board had 12 standing committees, each composed of Independent Trustees with varying backgrounds, to which the Board has assigned specific subject matter responsibilities in order to enhance effective decision-making by the Board. Each committee has a written charter outlining the structure and purposes of the committee. The Board also meets as needed to consider matters specifically related to the Board's annual consideration of the renewal of Advisory Contracts.
At its July 2008 meeting, the Board of Trustees, including the Independent Trustees, unanimously determined to renew the fund's Advisory Contracts. In reaching its determination, the Board considered a broad range of information. The Board also approved agreements with foreign sub-advisers Fidelity Management & Research (Japan) Inc. and Fidelity Management & Research (Hong Kong) Limited, as well as amendments to the fund's agreement with Fidelity Management & Research (U.K.) Inc.
In considering whether to renew the Advisory Contracts for the fund, the Board ultimately reached a determination, with the assistance of fund counsel and Independent Trustees' counsel and through the exercise of its business judgment, that the renewal of the Advisory Contracts and the compensation to be received by Fidelity under the management contract is consistent with Fidelity's fiduciary duty under applicable law. The Board's decision to renew the Advisory Contracts was not based on any single factor, but rather was based on a comprehensive consideration of all the information provided to the Board at its meetings throughout the year. The Board, in reaching its determination to renew the Advisory Contracts, is aware that shareholders in the fund have a broad range of investment choices available to them, including a wide choice among mutual funds offered by competitors to Fidelity, and that the fund's shareholders, with the opportunity to review and weigh the disclosure provided by the fund in its prospectus and other public disclosures, have chosen to invest in this fund, managed by Fidelity.
Nature, Extent, and Quality of Services Provided. The Board considered staffing within the investment adviser, FMR, and the sub-advisers (together, the Investment Advisers), including the backgrounds of the fund's investment personnel and the fund's investment objective and discipline. The Independent Trustees also had discussions with senior management of Fidelity's investment operations and investment groups. The Board considered the structure of the portfolio manager compensation program and whether this structure provides appropriate incentives.
Annual Report
Board Approval of Investment Advisory Contracts and
Management Fees - continued
Resources Dedicated to Investment Management and Support Services. The Board reviewed the size, education, and experience of the Investment Advisers' investment staff, their use of technology, and the Investment Advisers' approach to recruiting, training, and retaining portfolio managers and other research, advisory, and management personnel. The Board noted that Fidelity's analysts have access to a variety of technological tools that enable them to perform both fundamental and quantitative analysis and to specialize in various disciplines. The Board considered Fidelity's extensive global research capabilities that enable the Investment Advisers to aggregate data from various sources in an effort to produce positive investment results. The Board also considered that Fidelity's portfolio managers and analysts have access to daily portfolio attribution that allows for monitoring of a fund's portfolio, as well as an electronic communication system that provides immediate real-time access to research concerning issuers and credit enhancers.
Shareholder and Administrative Services. The Board considered (i) the nature, extent, quality, and cost of advisory, administrative, distribution, and shareholder services performed by the Investment Advisers and their affiliates under the Advisory Contracts and under separate agreements covering transfer agency, pricing and bookkeeping, and securities lending services for the fund; (ii) the nature and extent of the Investment Advisers' supervision of third party service providers, principally custodians and subcustodians; and (iii) the resources devoted to, and the record of compliance with, the fund's compliance policies and procedures. The Board also reviewed the allocation of fund brokerage, including allocations to brokers affiliated with the Investment Advisers, the use of brokerage commissions to pay fund expenses, and the use of "soft" commission dollars to pay for research services. The Board further considered that Fidelity voluntarily pays for market data out of its own resources.
The Board noted that the growth of fund assets across the complex allows Fidelity to reinvest in the development of services designed to enhance the value or convenience of the Fidelity funds as investment vehicles. These services include 24-hour access to account information and market information through phone representatives and over the Internet, and investor education materials and asset allocation tools.
Investment in a Large Fund Family. The Board considered the benefits to shareholders of investing in a Fidelity fund, including the benefits of investing in a fund that is part of a large family of funds offering a variety of investment disciplines and providing for a large variety of mutual fund investor services. For example, fund shareholders are offered the privilege of exchanging shares of the fund for shares of other Fidelity funds, as set forth in the fund's prospectus, without paying a sales charge. The Board noted that Fidelity has taken a number of actions over the previous year that benefited particular funds, including (i) dedicating additional resources to investment research and to restructure the investment research teams; (ii) contractually agreeing to reduce the management fees on Fidelity's Institutional Money Market Funds and launching Class IV and Institutional Class of certain of these funds; (iii) reducing the transfer agent fees for the Fidelity Select Portfolios and Investor Class of the VIP funds; and (iv) launching Class K of 29 equity funds as a lower-fee class available to certain employer-sponsored retirement plans.
Annual Report
Investment Performance. The Board considered whether the fund has operated within its investment objective, as well as its record of compliance with its investment restrictions. The Board noted that it is not possible to evaluate performance in any comprehensive fashion because the fund had been in operation for less than one calendar year. Once the fund has been in operation for at least one calendar year, the Board will review the fund's absolute investment performance for each class, as well as the fund's relative investment performance for each class measured against a broad-based securities market index and a peer group of mutual funds.
Based on its review, the Board concluded that the nature, extent, and quality of the services provided to the fund will benefit the fund's shareholders, particularly in light of the Board's view that the fund's shareholders benefit from investing in a fund that is part of a large family of funds offering a variety of investment disciplines and services.
Competitiveness of Management Fee and Total Fund Expenses. The Board considered the fund's management fee and projected total operating expenses of each class of the fund in reviewing the Advisory Contracts. The Board noted that the fund's management fee rate is lower than the median fee rate of funds with similar Lipper investment objective categories and comparable management fee characteristics. The Board considered that the projected total operating expenses are comparable to those of similar classes and funds that Fidelity offers to shareholders. The Board also considered supplemental information about how the fund's management fee and total expenses ranked relative to groups based on Lipper classifications, which take into account a fund's market capitalization and style.
Based on its review, the Board concluded that the fund's management fee and proposed total expenses of each class were fair and reasonable in light of the services that the fund and its shareholders receive and the other factors considered.
Costs of the Services and Profitability. The fund has only recently commenced operations and therefore no revenue, cost, or profitability data was available for the Board to review in respect of the fund at the time in renew the Advisory Contracts. In connection with its future renewal of the fund's Advisory Contracts, the Board will consider the revenues earned and the expenses incurred by Fidelity in conducting the business of developing, marketing, distributing, managing, administering and servicing the fund and its shareholders.
Annual Report
Board Approval of Investment Advisory Contracts and
Management Fees - continued
Economies of Scale. The Board considered whether there have been economies of scale in respect of the management of the Fidelity funds, whether the Fidelity funds (including the fund) have appropriately benefited from any such economies of scale, and whether there is potential for realization of any further economies of scale. The Board considered the extent to which the fund will benefit from economies of scale through increased services to the fund, through waivers or reimbursements, or through fee or expense reductions.
The Board recognized that the fund's management contract incorporates a "group fee" structure, which provides for lower group fee rates as total fund assets under FMR's management increase, and for higher group fee rates as total fund assets under FMR's management decrease. FMR determines the group fee rates based on a tiered asset "breakpoint" schedule. The Board considered that the group fee is designed to deliver the benefits of economies of scale to fund shareholders when total fund assets increase, even if assets of any particular fund are unchanged or have declined, because some portion of Fidelity's costs are attributable to services provided to all Fidelity funds, and all funds benefit if those costs can be allocated among more assets. The Board concluded that, given the group fee structure, fund shareholders will achieve a certain level of economies of scale as assets under FMR's management increase at the fund complex level, regardless of whether Fidelity achieves any such economies of scale.
The Board further concluded that any potential economies of scale are being shared between fund shareholders and Fidelity in an appropriate manner.
Additional Information Requested by the Board. In order to develop fully the factual basis for consideration of the Fidelity funds' Advisory Contracts, the Board requested and received additional information on certain topics, including (i) fund performance trends and actions to be taken by FMR to improve certain funds' overall performance; (ii) portfolio manager changes that have occurred during the past year; (iii) Fidelity's fund profitability methodology, the profitability of certain fund service providers, and profitability trends for certain funds; (iv) Fidelity's compensation structure for portfolio managers and key personnel, including its effects on fund profitability and the extent to which portfolio manager compensation is linked to fund performance; (v) Fidelity's fee structures and rationale for recommending different fees among categories of funds; and (vi) Fidelity's rationale for recommending which funds should have a performance adjustment component as part of their management fees.
Based on its evaluation of all of the conclusions noted above, and after considering all material factors, the Board ultimately concluded that the advisory fee structures are fair and reasonable, and that the fund's Advisory Contracts should be renewed.
Annual Report
Investment Adviser
Fidelity Management & Research Company
Boston, MA
Investment Sub-Advisers
FMR Co., Inc.
Fidelity Management & Research
(U.K.) Inc.
Fidelity Research & Analysis Company
Fidelity Investments Japan Limited
FIL Investment Advisors
FIL Investment Advisors
(U.K.) Ltd.
Fidelity Management & Research
(Hong Kong) Limited
Fidelity Management & Research
(Japan) Inc.
General Distributor
Fidelity Distributors Corporation
Boston, MA
Transfer and Service Agents
Fidelity Investments Institutional
Operations Company, Inc.
Boston, MA
Fidelity Service Company, Inc.
Boston, MA
Custodian
State Street Bank & Trust Company
Quincy, MA
AEME-UANN-1208
1.861988.100

(Fidelity Investment logo)(registered trademark)
Fidelity Advisor
Emerging Europe,
Middle East, Africa (EMEA)
Fund - Institutional Class
Annual Report
October 31, 2008
Institutional Class is a
class of Fidelity® Emerging Europe, Middle East, Africa (EMEA) Fund
(2_fidelity_logos) (Registered_Trademark)
Contents
Chairman's Message | <Click Here> | Ned Johnson's message to shareholders. |
Shareholder Expense Example | <Click Here> | An example of shareholder expenses. |
Investment Summary | <Click Here> | A summary of the fund's holdings. |
Investments | <Click Here> | A complete list of the fund's investments with their market values. |
Financial Statements | <Click Here> | Statements of assets and liabilities, operations, and changes in net assets, as well as financial highlights. |
Notes | <Click Here> | Notes to the financial statements. |
Report of Independent Registered Public Accounting Firm | <Click Here> | |
Trustees and Officers | <Click Here> | |
Board Approval of Investment Advisory Contracts and Management Fees | <Click Here> | |
To view a fund's proxy voting guidelines and proxy voting record for the 12-month period ended June 30, visit http://www.fidelity.com (search for "proxy voting guidelines") or visit the Securities and Exchange Commission's (SEC) web site at http://www.sec.gov. You may also call 1-877-208-0098 to request a free copy of the proxy voting guidelines.
Standard & Poor's, S&P and S&P 500 are registered service marks of The McGraw-Hill Companies, Inc. and have been licensed for use by Fidelity Distributors Corporation.
Other third party marks appearing herein are the property of their respective owners.
All other marks appearing herein are registered or unregistered trademarks or service marks of FMR LLC or an affiliated company.
Annual Report
This report and the financial statements contained herein are submitted for the general information of the shareholders of the fund. This report is not authorized for distribution to prospective investors in the fund unless preceded or accompanied by an effective prospectus.
A fund files its complete schedule of portfolio holdings with the SEC for the first and third quarters of each fiscal year on Form N-Q. Forms N-Q are available on the SEC's web site at http://www.sec.gov. A fund's Forms N-Q may be reviewed and copied at the SEC's Public Reference Room in Washington, DC. Information regarding the operation of the SEC's Public Reference Room may be obtained by calling 1-800-SEC-0330. For a complete list of a fund's portfolio holdings, view the most recent holdings listing, semiannual report, or annual report on Fidelity's web site at http://www.fidelity.com or http://advisor.fidelity.com, as applicable.
NOT FDIC INSURED · MAY LOSE VALUE · NO BANK GUARANTEE
Neither the fund nor Fidelity Distributors Corporation is a bank.
Annual Report
(photo_of_Edward_C_Johnson_3d)
Dear Shareholder:
Turmoil has been the watchword for the world's securities markets in 2008, with domestic and international stocks down sharply amid the global credit squeeze. A flight to quality boosted returns for U.S. Treasuries, one of the few asset classes with positive results heading into the latter stages of the year. Financial markets are always unpredictable, but there are a number of time-tested principles that can put the historical odds in your favor.
One of the basic tenets is to invest for the long term. Over time, riding out the markets' inevitable ups and downs has proven much more effective than selling into panic or chasing the hottest trend. Even missing only a few of the markets' best days can significantly diminish investor returns. Patience also affords the benefits of compounding - of earning interest on additional income or reinvested dividends and capital gains. There are tax advantages and cost benefits to consider as well. The more you sell, the more taxes you pay, and the more you trade, the higher the costs. While staying the course doesn't eliminate risk, it can considerably lessen the effect of short-term declines.
You can further manage your investing risk through diversification. And today, more than ever, geographic diversification should be taken into account. Studies indicate that asset allocation is the single most important determinant of a portfolio's long-term success. The right mix of stocks, bonds and cash - aligned to your particular risk tolerance and investment objective - is very important. Age-appropriate rebalancing is also an essential aspect of asset allocation. For younger investors, an emphasis on equities - which historically have been the best-performing asset class over time - is encouraged. As investors near their specific goal, such as retirement or sending a child to college, consideration may be given to replacing volatile assets (e.g. common stocks) with more-stable fixed investments (bonds or savings plans).
A third investment principle - investing regularly - can help lower the average cost of your purchases. Investing a certain amount of money each month or quarter helps ensure you won't pay for all your shares at market highs. This strategy - known as dollar cost averaging - also reduces unconstructive "emotion" from investing, helping shareholders avoid selling weak performers just prior to an upswing, or chasing a hot performer just before a correction.
We invite you to contact us via the Internet, through our Investor Centers or over the phone. It is our privilege to provide you the information you need to make the investments that are right for you.
Sincerely,
/s/Edward C. Johnson 3d
Edward C. Johnson 3d
Annual Report
Shareholder Expense Example
As a shareholder of the Fund, you incur two types of costs: (1) transaction costs, including sales charges (loads) on purchase payments or redemption proceeds, redemption fees, and (2) ongoing costs, including management fees, distribution and/or service (12b-1) fees and other Fund expenses. This Example is intended to help you understand your ongoing costs (in dollars) of investing in the Fund and to compare these costs with the ongoing costs of investing in other mutual funds.
The actual expense Example is based on an investment of $1,000 invested at the beginning of the period and held for the entire period (May 8, 2008 to October 31, 2008). The hypothetical expense Example is based on an investment of $1,000 invested for the one-half year period (May 1, 2008 to October 31, 2008).
Actual Expenses
The first line of the accompanying table for each class of the Fund provides information about actual account values and actual expenses. You may use the information in this line, together with the amount you invested, to estimate the expenses that you paid over the period. Simply divide your account value by $1,000.00 (for example, an $8,600 account value divided by $1,000.00 = 8.6), then multiply the result by the number in the first line for a class of the Fund under the heading entitled "Expenses Paid During Period" to estimate the expenses you paid on your account during this period. A small balance maintenance fee of $12.00 that is charged once a year may apply for certain accounts with a value of less than $2,000. This fee is not included in the table below. If it was, the estimate of expenses you paid during the period would be higher, and your ending account value lower, by this amount. In addition, the Fund, as a shareholder in the underlying Fidelity Central Funds, will indirectly bear its pro rata share of the fees and expenses incurred by the underlying Fidelity Central Funds. These fees and expenses are not included in the Fund's annualized expense ratio used to calculate the expense estimate in the table below.
Hypothetical Example for Comparison Purposes
The second line of the accompanying table for each class of the Fund provides information about hypothetical account values and hypothetical expenses based on a Class' actual expense ratio and an assumed rate of return of 5% per year before expenses, which is not the Class' actual return. The hypothetical account values and expenses may not be used to estimate the actual ending account balance or expenses you paid for the period. You may use this information to compare the ongoing costs of investing in the Fund and other funds. To do so, compare this 5% hypothetical example with the 5% hypothetical examples that appear in the shareholder reports of the other funds. A small balance maintenance fee of $12.00 that is charged once a year may apply for certain accounts with a value of less than $2,000. This fee is not included in the table below. If it was, the estimate of expenses you paid during the period would be higher, and your ending account value lower, by this amount. In addition, the Fund, as a shareholder in the underlying Fidelity Central Funds, will indirectly bear its pro rata share of the fees and expenses incurred by the underlying Fidelity Central Funds. These fees and expenses are not included in the Fund's annualized expense ratio used to calculate the expense estimate in the table below.
Annual Report
Please note that the expenses shown in the table are meant to highlight your ongoing costs only and do not reflect any transaction costs. Therefore, the second line of the table is useful in comparing ongoing costs only, and will not help you determine the relative total costs of owning different funds. In addition, if these transactional costs were included, your costs would have been higher.
| Annualized Expense Ratio | Beginning
Account Value | Ending
Account Value
October 31, 2008 | Expenses Paid
During Period |
Class A | 1.50% | | | |
Actual | | $ 1,000.00 | $ 475.00 | $ 5.35B |
HypotheticalA | | $ 1,000.00 | $ 1,017.60 | $ 7.61C |
Class T | 1.75% | | | |
Actual | | $ 1,000.00 | $ 475.00 | $ 6.24B |
HypotheticalA | | $ 1,000.00 | $ 1,016.34 | $ 8.87C |
Class B | 2.25% | | | |
Actual | | $ 1,000.00 | $ 473.00 | $ 8.01B |
HypotheticalA | | $ 1,000.00 | $ 1,013.83 | $ 11.39C |
Class C | 2.25% | | | |
Actual | | $ 1,000.00 | $ 473.00 | $ 8.01B |
HypotheticalA | | $ 1,000.00 | $ 1,013.83 | $ 11.39C |
Emerging Europe,
Middle East, Africa (EMEA) | 1.25% | | | |
Actual | | $ 1,000.00 | $ 476.00 | $ 4.46B |
HypotheticalA | | $ 1,000.00 | $ 1,018.85 | $ 6.34C |
Institutional Class | 1.25% | | | |
Actual | | $ 1,000.00 | $ 476.00 | $ 4.46B |
HypotheticalA | | $ 1,000.00 | $ 1,018.85 | $ 6.34C |
A 5% return per year before expenses
B Actual expenses are equal to each Class' annualized expense ratio, multiplied by the average account value over the period, multiplied by 177/366 (to reflect the period May 8, 2008 to October 31, 2008).
C Hypothetical expenses are equal to each Class' annualized expense ratio, multiplied by the average account value over the period, multiplied by 184/366 (to reflect the one-half year period).
Annual Report
Investment Summary (Unaudited)
Geographic Diversification (% of fund's net assets) |
As of October 31, 2008 |
| South Africa 38.1% | |
| Russia 30.8% | |
| Israel 7.2% | |
| Czech Republic 5.7% | |
| United States of America 3.9% | |
| Egypt 3.4% | |
| Turkey 2.4% | |
| Kenya 2.2% | |
| Nigeria 2.0% | |
| Other 4.3% | |

Percentages are adjusted for the effect of futures contracts, if applicable. |
Asset Allocation |
| % of fund's
net assets |
Stocks and Investment Companies | 96.1 |
Short-Term Investments and Net Other Assets | 3.9 |
Top Ten Stocks as of October 31, 2008 |
| % of fund's
net assets |
OAO Gazprom (Russia, Oil, Gas & Consumable Fuels) | 13.9 |
MTN Group Ltd. (South Africa, Wireless Telecommunication Services) | 8.9 |
Sasol Ltd. (South Africa, Oil, Gas & Consumable Fuels) | 6.5 |
Lukoil Oil Co. sponsored ADR (Russia, Oil, Gas & Consumable Fuels) | 6.4 |
Teva Pharmaceutical Industries Ltd. (Israel, Pharmaceuticals) | 6.7 |
Ceske Energeticke Zavody AS (Czech Republic, Electric Utilities) | 4.5 |
Harmony Gold Mining Co. Ltd. (South Africa, Metals & Mining) | 4.4 |
Raubex Group Ltd. (South Africa, Construction & Engineering) | 3.6 |
Exxaro Resources Ltd. (South Africa, Metals & Mining) | 2.9 |
Sberbank (Savings Bank of the Russian Federation) (Russia, Commercial Banks) | 2.6 |
| 60.4 |
Market Sectors as of October 31, 2008 |
| % of fund's
net assets |
Energy | 29.4 |
Materials | 16.3 |
Telecommunication Services | 16.1 |
Industrials | 9.1 |
Consumer Staples | 7.0 |
Health Care | 6.7 |
Utilities | 4.7 |
Financials | 4.4 |
Consumer Discretionary | 1.0 |
Information Technology | 0.3 |
Annual Report
Investments October 31, 2008
Showing Percentage of Net Assets
Common Stocks - 95.0% |
| Shares | | Value |
Canada - 0.2% |
Addax Petroleum, Inc. | 5,300 | | $ 79,118 |
Czech Republic - 5.7% |
Ceske Energeticke Zavody AS | 39,400 | | 1,704,984 |
Cesky Telecom AS | 22,291 | | 472,353 |
TOTAL CZECH REPUBLIC | | 2,177,337 |
Egypt - 3.4% |
Arab Cotton Ginning | 218,800 | | 137,203 |
EFG-Hermes Holding SAE | 36,600 | | 163,279 |
Egyptian Co. for Mobile Services (MobiNil) | 44,811 | | 851,100 |
Orascom Construction Industries | 4,280 | | 141,854 |
TOTAL EGYPT | | 1,293,436 |
Israel - 7.2% |
EL AL Israel Airlines Ltd. | 236,200 | | 54,736 |
Partner Communications Co. Ltd. ADR | 6,300 | | 117,684 |
Teva Pharmaceutical Industries Ltd. | 56,800 | | 2,316,489 |
Teva Pharmaceutical Industries Ltd. sponsored ADR | 6,600 | | 283,008 |
TOTAL ISRAEL | | 2,771,917 |
Kenya - 2.2% |
Athi River Mining Ltd. | 392,806 | | 465,621 |
British American Tobacco Kenya Ltd. | 30,000 | | 57,125 |
East African Breweries Ltd. | 209,743 | | 322,682 |
TOTAL KENYA | | 845,428 |
Nigeria - 2.0% |
Guaranty Trust Bank PLC (Reg. S) unit | 92,526 | | 508,893 |
Nigerian Breweries PLC | 853,181 | | 233,193 |
Zenith Bank PLC (a) | 200,000 | | 42,515 |
TOTAL NIGERIA | | 784,601 |
Poland - 1.6% |
Telekomunikacja Polska SA | 79,700 | | 599,617 |
Russia - 30.8% |
Comstar United TeleSystems OJSC GDR (Reg. S) | 52,000 | | 145,080 |
Lukoil Oil Co. sponsored ADR | 64,300 | | 2,456,260 |
Mobile TeleSystems OJSC sponsored ADR | 6,700 | | 262,305 |
OAO Gazprom | 1,058,700 | | 5,124,106 |
OAO Gazprom sponsored ADR (Reg. S) | 10,900 | | 216,583 |
OAO Tatneft | 405,200 | | 688,840 |
OJSC MMC Norilsk Nickel | 3,084 | | 300,690 |
Common Stocks - continued |
| Shares | | Value |
Russia - continued |
OJSC MMC Norilsk Nickel: | | | |
ADR | 23,900 | | $ 239,239 |
sponsored ADR | 16,400 | | 171,380 |
Polymetal JSC GDR (Reg. S) (a) | 289,000 | | 867,000 |
RusHydro OJSC (a) | 4,544,300 | | 83,615 |
Sberbank (Savings Bank of the Russian Federation) | 888,100 | | 923,624 |
Sberbank (Savings Bank of the Russian Federation) GDR | 500 | | 91,708 |
Vimpel Communications sponsored ADR | 11,100 | | 160,950 |
Wimm-Bill-Dann Foods OJSC sponsored ADR (a) | 2,200 | | 96,668 |
TOTAL RUSSIA | | 11,828,048 |
South Africa - 38.1% |
AFGRI Ltd. | 473,100 | | 213,064 |
Africa Cellular Towers Ltd. (a) | 2,702,300 | | 359,569 |
Austro Group Ltd. (a) | 411,000 | | 42,068 |
Aveng Ltd. | 96,100 | | 472,041 |
Cashbuild Ltd. | 38,475 | | 212,656 |
DRDGOLD Ltd. | 1,057,400 | | 422,094 |
Exxaro Resources Ltd. | 169,300 | | 1,115,959 |
Gold Fields Ltd. | 59,400 | | 413,725 |
Harmony Gold Mining Co. Ltd. (a) | 231,800 | | 1,696,181 |
Kwikspace Modular Buildings Ltd. | 936,224 | | 618,080 |
MTN Group Ltd. | 306,600 | | 3,420,614 |
Murray & Roberts Holdings Ltd. | 112,300 | | 758,399 |
Paracon Holdings Ltd. | 823,200 | | 106,165 |
Raubex Group Ltd. | 539,200 | | 1,393,531 |
Sasol Ltd. | 85,000 | | 2,509,980 |
Shoprite Holdings Ltd. | 138,200 | | 728,485 |
Zeder Investments Ltd. | 834,386 | | 136,645 |
TOTAL SOUTH AFRICA | | 14,619,256 |
Turkey - 2.4% |
Bim Birlesik Magazalar AS JSC | 42,000 | | 843,510 |
Tupras-Turkiye Petrol Rafinerileri AS | 5,000 | | 63,166 |
TOTAL TURKEY | | 906,676 |
United Kingdom - 1.0% |
Afren PLC (a) | 205,300 | | 157,504 |
Randgold Resources Ltd. sponsored ADR | 7,600 | | 235,676 |
TOTAL UNITED KINGDOM | | 393,180 |
Common Stocks - continued |
| Shares | | Value |
Zambia - 0.4% |
Celtel Zambia Ltd. | 1,355,201 | | $ 166,444 |
TOTAL COMMON STOCKS (Cost $67,520,085) | 36,465,058 |
Investment Companies - 1.1% |
| | | |
Canada - 1.1% |
Horizons BetaPro COMEX Gold Bullion Bull Plus ETF (a)
(Cost $752,672) | 45,500 | | 434,322 |
Money Market Funds - 5.3% |
| | | |
Fidelity Cash Central Fund, 1.81% (b)
(Cost $2,034,731) | 2,034,731 | | 2,034,731 |
TOTAL INVESTMENT PORTFOLIO - 101.4% (Cost $70,307,488) | | 38,934,111 |
NET OTHER ASSETS - (1.4)% | | (540,051) |
NET ASSETS - 100% | $ 38,394,060 |
Legend |
(a) Non-income producing |
(b) Affiliated fund that is available only to investment companies and other accounts managed by Fidelity Investments. The rate quoted is the annualized seven-day yield of the fund at period end. A complete unaudited listing of the fund's holdings as of its most recent quarter end is available upon request. |
Affiliated Central Funds |
Information regarding fiscal year to date income earned by the Fund from investments in Fidelity Central Funds is as follows: |
Fund | Income earned |
Fidelity Cash Central Fund | $ 55,332 |
Income Tax Information |
At October 31, 2008, the fund had a capital loss carryforward of approximately $9,997,975 all of which will expire on October 31, 2016. |
See accompanying notes which are an integral part of the financial statements.
Annual Report
Statement of Assets and Liabilities
| October 31, 2008 |
| | |
Assets | | |
Investment in securities, at value - See accompanying schedule: Unaffiliated issuers (cost $68,272,757) | $ 36,899,380 | |
Fidelity Central Funds (cost $2,034,731) | 2,034,731 | |
Total Investments (cost $70,307,488) | | $ 38,934,111 |
Receivable for investments sold | | 147,681 |
Receivable for fund shares sold | | 217,122 |
Dividends receivable | | 42,049 |
Distributions receivable from Fidelity Central Funds | | 1,244 |
Receivable from investment adviser for expense reductions | | 41,228 |
Other receivables | | 35,067 |
Total assets | | 39,418,502 |
| | |
Liabilities | | |
Payable to custodian bank | $ 132,397 | |
Payable for investments purchased | 600,641 | |
Payable for fund shares redeemed | 87,638 | |
Accrued management fee | 26,555 | |
Distribution fees payable | 1,620 | |
Other affiliated payables | 16,432 | |
Other payables and accrued expenses | 159,159 | |
Total liabilities | | 1,024,442 |
| | |
Net Assets | | $ 38,394,060 |
Net Assets consist of: | | |
Paid in capital | | $ 79,823,062 |
Undistributed net investment income | | 215,625 |
Accumulated undistributed net realized gain (loss) on investments and foreign currency transactions | | (10,269,495) |
Net unrealized appreciation (depreciation) on investments and assets and liabilities in foreign currencies | | (31,375,132) |
Net Assets | | $ 38,394,060 |
See accompanying notes which are an integral part of the financial statements.
Annual Report
Statement of Assets and Liabilities - continued
| October 31, 2008 |
| | |
Calculation of Maximum Offering Price Class A:
Net Asset Value and redemption price per share ($1,368,278 ÷ 287,952 shares) | | $ 4.75 |
| | |
Maximum offering price per share (100/94.25 of $4.75) | | $ 5.04 |
Class T:
Net Asset Value and redemption price per share ($567,501 ÷ 119,577 shares) | | $ 4.75 |
| | |
Maximum offering price per share (100/96.50 of $4.75) | | $ 4.92 |
Class B:
Net Asset Value and offering price per share
($487,381 ÷ 102,948 shares)A | | $ 4.73 |
| | |
Class C:
Net Asset Value and offering price per share
($740,888 ÷ 156,496 shares)A | | $ 4.73 |
| | |
Emerging Europe, Middle East, Africa (EMEA):
Net Asset Value, offering price and redemption price per share ($32,534,805 ÷ 6,838,077 shares) | | $ 4.76 |
| | |
Institutional Class:
Net Asset Value, offering price and redemption price per share ($2,695,207 ÷ 566,502 shares) | | $ 4.76 |
A Redemption price per share is equal to net asset value less any applicable contingent deferred sales charge.
See accompanying notes which are an integral part of the financial statements.
Annual Report
Financial Statements - continued
Statement of Operations
| For the period May 8, 2008
(commencement of operations) to
October 31, 2008 |
| | |
Investment Income | | |
Dividends | | $ 559,154 |
Interest | | 16,892 |
Income from Fidelity Central Funds | | 55,332 |
| | 631,378 |
Less foreign taxes withheld | | (19,984) |
Total income | | 611,394 |
| | |
Expenses | | |
Management fee | $ 199,081 | |
Transfer agent fees | 78,494 | |
Distribution fees | 12,456 | |
Accounting fees and expenses | 12,758 | |
Custodian fees and expenses | 155,316 | |
Independent trustees' compensation | 95 | |
Registration fees | 55,550 | |
Audit | 49,557 | |
Total expenses before reductions | 563,307 | |
Expense reductions | (303,697) | 259,610 |
Net investment income (loss) | | 351,784 |
Realized and Unrealized Gain (Loss) Net realized gain (loss) on: | | |
Investment securities: | | |
Unaffiliated issuers | (10,268,466) | |
Foreign currency transactions | (137,188) | |
Total net realized gain (loss) | | (10,405,654) |
Change in net unrealized appreciation (depreciation) on: Investment securities | (31,373,377) | |
Assets and liabilities in foreign currencies | (1,755) | |
Total change in net unrealized appreciation (depreciation) | | (31,375,132) |
Net gain (loss) | | (41,780,786) |
Net increase (decrease) in net assets resulting from operations | | $ (41,429,002) |
See accompanying notes which are an integral part of the financial statements.
Annual Report
Statement of Changes in Net Assets
| For the period
May 8, 2008
(commencement of operations) to
October 31, 2008 |
Increase (Decrease) in Net Assets | |
Operations | |
Net investment income (loss) | $ 351,784 |
Net realized gain (loss) | (10,405,654) |
Change in net unrealized appreciation (depreciation) | (31,375,132) |
Net increase (decrease) in net assets resulting from operations | (41,429,002) |
Share transactions - net increase (decrease) | 79,670,886 |
Redemption fees | 152,176 |
Total increase (decrease) in net assets | 38,394,060 |
| |
Net Assets | |
Beginning of period | - |
End of period (including undistributed net investment income of $215,625) | $ 38,394,060 |
See accompanying notes which are an integral part of the financial statements.
Annual Report
Financial Highlights - Class A
Year ended October 31, | 2008 H |
Selected Per-Share Data | |
Net asset value, beginning of period | $ 10.00 |
Income from Investment Operations | |
Net investment income (loss) E | .04 |
Net realized and unrealized gain (loss) | (5.31) |
Total from investment operations | (5.27) |
Redemption fees added to paid in capital E | .02 |
Net asset value, end of period | $ 4.75 |
Total Return B, C, D | (52.50)% |
Ratios to Average Net Assets F, I | |
Expenses before reductions | 2.50% A |
Expenses net of fee waivers, if any | 1.50% A |
Expenses net of all reductions | 1.23% A |
Net investment income (loss) | 1.20% A |
Supplemental Data | |
Net assets, end of period (000 omitted) | $ 1,368 |
Portfolio turnover rate G | 68% |
A Annualized
B Total returns for periods of less than one year are not annualized.
C Total returns would have been lower had certain expenses not been reduced during the periods shown.
D Total returns do not include the effect of the sales charges.
E Calculated based on average shares outstanding during the period.
F Fees and expenses of the underlying Fidelity Central Funds are not included in the Fund's expense ratio. The Fund indirectly bears its proportionate share of the expenses of any underlying Fidelity Central Funds.
G Amount does not include the portfolio activity of any underlying Fidelity Central Funds.
H For the period May 8, 2008 (commencement of operations) to October 31, 2008.
I Expense ratios reflect operating expenses of the class. Expenses before reductions do not reflect amounts reimbursed by the investment adviser or reductions from brokerage service arrangements or other expense offset arrangements and do not represent the amount paid by the class during periods when reimbursements or reductions occur. Expense ratios before reductions for start-up periods may not be representative of longer-term operating periods. Expenses net of fee waivers reflect expenses after reimbursement by the investment adviser but prior to reductions from brokerage service arrangements or other expense offset arrangements. Expenses net of all reductions represent the net expenses paid by the class.
See accompanying notes which are an integral part of the financial statements.
Annual Report
Financial Highlights - Class T
Year ended October 31, | 2008 H |
Selected Per-Share Data | |
Net asset value, beginning of period | $ 10.00 |
Income from Investment Operations | |
Net investment income (loss) E | .04 |
Net realized and unrealized gain (loss) | (5.31) |
Total from investment operations | (5.27) |
Redemption fees added to paid in capital E | .02 |
Net asset value, end of period | $ 4.75 |
Total Return B, C, D | (52.50)% |
Ratios to Average Net Assets F, I | |
Expenses before reductions | 2.78% A |
Expenses net of fee waivers, if any | 1.75% A |
Expenses net of all reductions | 1.49% A |
Net investment income (loss) | .95% A |
Supplemental Data | |
Net assets, end of period (000 omitted) | $ 568 |
Portfolio turnover rate G | 68% |
A Annualized
B Total returns for periods of less than one year are not annualized.
C Total returns would have been lower had certain expenses not been reduced during the periods shown.
D Total returns do not include the effect of the sales charges.
E Calculated based on average shares outstanding during the period.
F Fees and expenses of the underlying Fidelity Central Funds are not included in the Fund's expense ratio. The Fund indirectly bears its proportionate share of the expenses of any underlying Fidelity Central Funds.
G Amount does not include the portfolio activity of any underlying Fidelity Central Funds.
H For the period May 8, 2008 (commencement of operations) to October 31, 2008.
I Expense ratios reflect operating expenses of the class. Expenses before reductions do not reflect amounts reimbursed by the investment adviser or reductions from brokerage service arrangements or other expense offset arrangements and do not represent the amount paid by the class during periods when reimbursements or reductions occur. Expense ratios before reductions for start-up periods may not be representative of longer-term operating periods. Expenses net of fee waivers reflect expenses after reimbursement by the investment adviser but prior to reductions from brokerage service arrangements or other expense offset arrangements. Expenses net of all reductions represent the net expenses paid by the class.
See accompanying notes which are an integral part of the financial statements.
Annual Report
Financial Highlights - Class B
Year ended October 31, | 2008 H |
Selected Per-Share Data | |
Net asset value, beginning of period | $ 10.00 |
Income from Investment Operations | |
Net investment income (loss) E | .02 |
Net realized and unrealized gain (loss) | (5.31) |
Total from investment operations | (5.29) |
Redemption fees added to paid in capital E | .02 |
Net asset value, end of period | $ 4.73 |
Total Return B, C, D | (52.70)% |
Ratios to Average Net Assets F, I | |
Expenses before reductions | 3.32% A |
Expenses net of fee waivers, if any | 2.25% A |
Expenses net of all reductions | 1.99% A |
Net investment income (loss) | .45% A |
Supplemental Data | |
Net assets, end of period (000 omitted) | $ 487 |
Portfolio turnover rate G | 68% |
A Annualized
B Total returns for periods of less than one year are not annualized.
C Total returns would have been lower had certain expenses not been reduced during the periods shown.
D Total returns do not include the effect of the contingent deferred sales charge.
E Calculated based on average shares outstanding during the period.
F Fees and expenses of the underlying Fidelity Central Funds are not included in the Fund's expense ratio. The Fund indirectly bears its proportionate share of the expenses of any underlying Fidelity Central Funds.
G Amount does not include the portfolio activity of any underlying Fidelity Central Funds.
H For the period May 8, 2008 (commencement of operations) to October 31, 2008.
I Expense ratios reflect operating expenses of the class. Expenses before reductions do not reflect amounts reimbursed by the investment adviser or reductions from brokerage service arrangements or other expense offset arrangements and do not represent the amount paid by the class during periods when reimbursements or reductions occur. Expense ratios before reductions for start-up periods may not be representative of longer-term operating periods. Expenses net of fee waivers reflect expenses after reimbursement by the investment adviser but prior to reductions from brokerage service arrangements or other expense offset arrangements. Expenses net of all reductions represent the net expenses paid by the class.
See accompanying notes which are an integral part of the financial statements.
Annual Report
Financial Highlights - Class C
Year ended October 31, | 2008 H |
Selected Per-Share Data | |
Net asset value, beginning of period | $ 10.00 |
Income from Investment Operations | |
Net investment income (loss) E | .02 |
Net realized and unrealized gain (loss) | (5.31) |
Total from investment operations | (5.29) |
Redemption fees added to paid in capital E | .02 |
Net asset value, end of period | $ 4.73 |
Total Return B, C, D | (52.70)% |
Ratios to Average Net Assets F, I | |
Expenses before reductions | 3.28% A |
Expenses net of fee waivers, if any | 2.25% A |
Expenses net of all reductions | 1.99% A |
Net investment income (loss) | .45% A |
Supplemental Data | |
Net assets, end of period (000 omitted) | $ 741 |
Portfolio turnover rate G | 68% |
A Annualized
B Total returns for periods of less than one year are not annualized.
C Total returns would have been lower had certain expenses not been reduced during the periods shown.
D Total returns do not include the effect of the contingent deferred sales charge.
E Calculated based on average shares outstanding during the period.
F Fees and expenses of the underlying Fidelity Central Funds are not included in the Fund's expense ratio. The Fund indirectly bears its proportionate share of the expenses of any underlying Fidelity Central Funds.
G Amount does not include the portfolio activity of any underlying Fidelity Central Funds.
H For the period May 8, 2008 (commencement of operations) to October 31, 2008.
I Expense ratios reflect operating expenses of the class. Expenses before reductions do not reflect amounts reimbursed by the investment adviser or reductions from brokerage service arrangements or other expense offset arrangements and do not represent the amount paid by the class during periods when reimbursements or reductions occur. Expense ratios before reductions for start-up periods may not be representative of longer-term operating periods. Expenses net of fee waivers reflect expenses after reimbursement by the investment adviser but prior to reductions from brokerage service arrangements or other expense offset arrangements. Expenses net of all reductions represent the net expenses paid by the class.
See accompanying notes which are an integral part of the financial statements.
Annual Report
Financial Highlights - Emerging Europe, Middle East, Africa (EMEA)
Year ended October 31, | 2008 G |
Selected Per-Share Data | |
Net asset value, beginning of period | $ 10.00 |
Income from Investment Operations | |
Net investment income (loss) D | .05 |
Net realized and unrealized gain (loss) | (5.31) |
Total from investment operations | (5.26) |
Redemption fees added to paid in capital D | .02 |
Net asset value, end of period | $ 4.76 |
Total Return B, C | (52.40)% |
Ratios to Average Net Assets E, H | |
Expenses before reductions | 2.19% A |
Expenses net of fee waivers, if any | 1.25% A |
Expenses net of all reductions | .98% A |
Net investment income (loss) | 1.45% A |
Supplemental Data | |
Net assets, end of period (000 omitted) | $ 32,535 |
Portfolio turnover rate F | 68% |
A Annualized
B Total returns for periods of less than one year are not annualized.
C Total returns would have been lower had certain expenses not been reduced during the periods shown.
D Calculated based on average shares outstanding during the period.
E Fees and expenses of the underlying Fidelity Central Funds are not included in the Fund's expense ratio. The Fund indirectly bears its proportionate share of the expenses of any underlying Fidelity Central Funds.
F Amount does not include the portfolio activity of any underlying Fidelity Central Funds.
G For the period May 8, 2008 (commencement of operations) to October 31, 2008.
H Expense ratios reflect operating expenses of the class. Expenses before reductions do not reflect amounts reimbursed by the investment adviser or reductions from brokerage service arrangements or other expense offset arrangements and do not represent the amount paid by the class during periods when reimbursements or reductions occur. Expense ratios before reductions for start-up periods may not be representative of longer-term operating periods. Expenses net of fee waivers reflect expenses after reimbursement by the investment adviser but prior to reductions from brokerage service arrangements or other expense offset arrangements. Expenses net of all reductions represent the net expenses paid by the class.
See accompanying notes which are an integral part of the financial statements.
Annual Report
Financial Highlights - Institutional Class
Year ended October 31, | 2008 G |
Selected Per-Share Data | |
Net asset value, beginning of period | $ 10.00 |
Income from Investment Operations | |
Net investment income (loss) D | .05 |
Net realized and unrealized gain (loss) | (5.31) |
Total from investment operations | (5.26) |
Redemption fees added to paid in capital D | .02 |
Net asset value, end of period | $ 4.76 |
Total Return B, C | (52.40)% |
Ratios to Average Net Assets E, H | |
Expenses before reductions | 2.12% A |
Expenses net of fee waivers, if any | 1.25% A |
Expenses net of all reductions | .98% A |
Net investment income (loss) | 1.46% A |
Supplemental Data | |
Net assets, end of period (000 omitted) | $ 2,695 |
Portfolio turnover rate F | 68% |
A Annualized
B Total returns for periods of less than one year are not annualized.
C Total returns would have been lower had certain expenses not been reduced during the periods shown.
D Calculated based on average shares outstanding during the period.
E Fees and expenses of the underlying Fidelity Central Funds are not included in the Fund's expense ratio. The Fund indirectly bears its proportionate share of the expenses of any underlying Fidelity Central Funds.
F Amount does not include the portfolio activity of any underlying Fidelity Central Funds.
G For the period May 8, 2008 (commencement of operations) to October 31, 2008.
H Expense ratios reflect operating expenses of the class. Expenses before reductions do not reflect amounts reimbursed by the investment adviser or reductions from brokerage service arrangements or other expense offset arrangements and do not represent the amount paid by the class during periods when reimbursements or reductions occur. Expense ratios before reductions for start-up periods may not be representative of longer-term operating periods. Expenses net of fee waivers reflect expenses after reimbursement by the investment adviser but prior to reductions from brokerage service arrangements or other expense offset arrangements. Expenses net of all reductions represent the net expenses paid by the class.
See accompanying notes which are an integral part of the financial statements.
Annual Report
Notes to Financial Statements
For the period ended October 31, 2008
1. Organization.
Fidelity Emerging Europe, Middle East, Africa (EMEA) Fund (the Fund) is a non-diversified fund of Fidelity Investment Trust (the trust) and is authorized to issue an unlimited number of shares. The trust is registered under the Investment Company Act of 1940, as amended (the 1940 Act), as an open-end management investment company organized as a Massachusetts business trust. The Fund offers Class A, Class T, Class B, Class C, Emerging Europe, Middle East, Africa (EMEA), and Institutional Class shares, each of which has equal rights as to assets and voting privileges. Each class has exclusive voting rights with respect to matters that affect that class. Class B shares will automatically convert to Class A shares after a holding period of seven years from the initial date of purchase. Investment income, realized and unrealized capital gains and losses, the common expenses of the Fund, and certain fund-level expense reductions, if any, are allocated on a pro rata basis to each class based on the relative net assets of each class to the total net assets of the Fund. Each class differs with respect to transfer agent and distribution and service plan fees incurred. Certain expense reductions also differ by class. The Fund's investments in emerging markets can be subject to social economic, regulatory, and political uncertainties and can be extremely volatile.
2. Investments in Fidelity Central Funds.
The Fund may invest in Fidelity Central Funds, which are open-end investment companies available only to other investment companies and accounts managed by Fidelity Management & Research Company (FMR) and its affiliates. The Fund's Schedule of Investments lists each of the Fidelity Central Funds held as of period end, if any, as an investment of the Fund, but does not include the underlying holdings of each Fidelity Central Fund. As an Investing Fund, the Fund indirectly bears its proportionate share of the expenses of the underlying Fidelity Central Funds.
The Money Market Central Funds seek preservation of capital and current income and are managed by Fidelity Investments Money Management, Inc. (FIMM), an affiliate of FMR.
A complete unaudited list of holdings for each Fidelity Central Fund is available upon request or at the SEC's web site at www.sec.gov. In addition, the financial statements of the Fidelity Central Funds, which are not covered by the Fund's Report of Independent Registered Public Accounting Firm, are available on the SEC's web site or upon request.
Annual Report
3. Significant Accounting Policies.
The financial statements have been prepared in conformity with accounting principles generally accepted in the United States of America, which require management to make certain estimates and assumptions at the date of the financial statements. Actual results could differ from those estimates. The following summarizes the significant accounting policies of the Fund:
Security Valuation. Investments are valued as of 4:00 p.m. Eastern time on the last calendar day of the period. Wherever possible, the Fund uses independent pricing services approved by the Board of Trustees to value its investments.
Equity securities, including restricted securities, for which market quotations are readily available, are valued at the last reported sale price or official closing price as reported by an independent pricing service on the primary market or exchange on which they are traded. In the event there were no sales during the day or closing prices are not available, securities are valued at the last quoted bid price. Investments in open-end mutual funds, including the Fidelity Central Funds, are valued at their closing net asset value each business day. Short-term securities with remaining maturities of sixty days or less for which quotations are not readily available are valued at amortized cost, which approximates value.
When current market prices or quotations are not readily available or reliable, valuations may be determined in good faith in accordance with procedures adopted by the Board of Trustees. Factors used in determining value may include significant market or security specific events, changes in interest rates and credit quality, and developments in foreign markets which are monitored by evaluating the performance of ADRs, futures contracts and exchange-traded funds. The frequency with which these procedures are used cannot be predicted and may be utilized to a significant extent. The value of securities used for net asset value (NAV) calculation under these procedures may differ from published prices for the same securities.
Foreign Currency. The Fund uses foreign currency contracts to facilitate transactions in foreign-denominated securities. Losses from these transactions may arise from changes in the value of the foreign currency or if the counterparties do not perform under the contracts' terms.
Foreign-denominated assets, including investment securities, and liabilities are translated into U.S. dollars at the exchange rate at period end. Purchases and sales of investment securities, income and dividends received and expenses denominated in foreign currencies are translated into U.S. dollars at the exchange rate in effect on the transaction date.
Annual Report
Notes to Financial Statements - continued
3. Significant Accounting Policies - continued
Foreign Currency - continued
The effects of exchange rate fluctuations on investments are included with the net realized and unrealized gain (loss) on investment securities. Other foreign currency transactions resulting in realized and unrealized gain (loss) are disclosed separately.
Investment Transactions and Income. For financial reporting purposes, the Fund's investment holdings and NAV include trades executed through the end of the last business day of the period. The NAV per share for processing shareholder transactions is calculated as of the close of business of the New York Stock Exchange (NYSE), normally 4:00 p.m. Eastern time and includes trades executed through the end of the prior business day. Gains and losses on securities sold are determined on the basis of identified cost. Dividend income is recorded on the ex-dividend date, except for certain dividends from foreign securities where the ex-dividend date may have passed, which are recorded as soon as the Fund is informed of the ex-dividend date. Non-cash dividends included in dividend income, if any, are recorded at the fair market value of the securities received. Interest income and distributions from the Fidelity Central Funds are accrued as earned. Interest income includes coupon interest and amortization of premium and accretion of discount on debt securities. Investment income is recorded net of foreign taxes withheld where recovery of such taxes is uncertain.
Expenses. Most expenses of the trust can be directly attributed to a fund. Expenses which cannot be directly attributed are apportioned among each Fund in the trust. Expense estimates are accrued in the period to which they relate and adjustments are made when actual amounts are known.
Income Tax Information and Distributions to Shareholders. Each year, the Fund intends to qualify as a regulated investment company by distributing substantially all of its taxable income and realized gains under Subchapter M of the Internal Revenue Code and filing its U.S. federal tax return. As a result, no provision for income taxes is required. The Fund is subject to the provisions of FASB Interpretation No. 48, Accounting for Uncertainties in Income Taxes (FIN 48). FIN 48 sets forth a minimum threshold for financial statement recognition of the benefit of a tax position taken or expected to be taken in a tax return. There are no unrecognized tax benefits in the accompanying financial statements in connection with the tax positions expected to be taken in the initial filing of the Fund's federal tax return. Foreign taxes are provided for based on the Fund's understanding of the tax rules and rates that exist in the foreign markets in which it invests.
Annual Report
3. Significant Accounting Policies - continued
Income Tax Information and Distributions to Shareholders - continued
Distributions are recorded on the ex-dividend date. Income dividends and capital gain distributions are declared separately for each class. Income and capital gain distributions are determined in accordance with income tax regulations, which may differ from generally accepted accounting principles. In addition, the Fund will claim a portion of the payment made to redeeming shareholders as a distribution for income tax purposes.
Capital accounts within the financial statements are adjusted for permanent book-tax differences. These adjustments have no impact on net assets or the results of operations. Temporary book-tax differences will reverse in a subsequent period.
Book-tax differences are primarily due to foreign currency transactions, passive foreign investment companies (PFIC), capital loss carryforwards and losses deferred due to wash sales.
The tax-basis components of distributable earnings and the federal tax cost as of period end were as follows:
Unrealized appreciation | $ 544,450 |
Unrealized depreciation | (32,191,102) |
Net unrealized appreciation (depreciation) | (31,646,652) |
Undistributed ordinary income | 215,374 |
Capital loss carryforward | (9,997,975) |
| |
Cost for federal income tax purposes | $ 70,580,763 |
Short-Term Trading (Redemption) Fees. Shares held in the Fund less than 90 days are subject to a redemption fee equal to 1.50% of the proceeds of the redeemed shares. All redemption fees, including any estimated redemption fees paid by FMR, are retained by the Fund and accounted for as an addition to paid in capital.
New Accounting Pronouncement. In September 2006, Statement of Financial Accounting Standards No. 157, Fair Value Measurements (SFAS 157), was issued and is effective for fiscal years beginning after November 15, 2007. SFAS 157 defines fair value, establishes a framework for measuring fair value and results in expanded disclosures about fair value measurements. The Fund will adopt the provisions of SFAS 157 effective for its fiscal year beginning November 1, 2008.
4. Operating Policies.
Repurchase Agreements. FMR has received an Exemptive Order from the Securities and Exchange Commission (the SEC) which permits the Fund and other affiliated entities of FMR to transfer uninvested cash balances into joint trading accounts which are then invested in repurchase agreements. The Fund may also invest directly with
Annual Report
Notes to Financial Statements - continued
4. Operating Policies - continued
Repurchase Agreements - continued
institutions in repurchase agreements. Repurchase agreements are collateralized by government or non-government securities. Upon settlement date, collateral is held in segregated accounts with custodian banks and may be obtained in the event of a default of the counterparty. The Fund monitors, on a daily basis, the value of the collateral to ensure it is at least equal to the principal amount of the repurchase agreement (including accrued interest). In the event of a default by the counterparty, realization of the collateral proceeds could be delayed, during which time the value of the collateral may decline.
5. Purchases and Sales of Investments.
Purchases and sales of securities, other than short-term securities, aggregated $111,504,337 and $32,962,700, respectively.
6. Fees and Other Transactions with Affiliates.
Management Fee. FMR and its affiliates provide the Fund with investment management related services for which the Fund pays a monthly management fee. The management fee is the sum of an individual fund fee rate that is based on an annual rate of .55% of the Fund's average net assets and a group fee rate that averaged .26% during the period. The group fee rate is based upon the average net assets of all the mutual funds advised by FMR. The group fee rate decreases as assets under management increase and increases as assets under management decrease. For the period, the total annualized management fee rate was .81% of the Fund's average net assets.
Distribution and Service Plan. In accordance with Rule 12b-1 of the 1940 Act, the Fund has adopted separate Distribution and Service Plans for each class of shares. Certain classes pay Fidelity Distributors Corporation (FDC), an affiliate of FMR, separate Distribution and Service Fees, each of which is based on an annual percentage of each class' average net assets. In addition, FDC may pay financial intermediaries for selling shares of the Fund and providing shareholder support services. For the period, the Distribution and Service Fee rates and the total amounts paid to and retained by FDC were as follows:
| Distribution
Fee | Service
Fee | Paid to
FDC | Retained
by FDC |
Class A | .00% | .25% | $ 1,896 | $ 761 |
Class T | .25% | .25% | 2,000 | 1,515 |
Class B | .75% | .25% | 3,632 | 3,482 |
Class C | .75% | .25% | 4,928 | 4,437 |
| | | $ 12,456 | $ 10,195 |
Annual Report
6. Fees and Other Transactions with Affiliates - continued
Sales Load. FDC receives a front-end sales charge of up to 5.75% for selling Class A shares, and 3.50% for selling Class T shares, some of which is paid to financial intermediaries for selling shares of the Fund. FDC receives the proceeds of contingent deferred sales charges levied on Class A, Class T, Class B, and Class C redemptions. These charges depend on the holding period. The deferred sales charges range from 5% to 1% for Class B, 1% for Class C, 1.00% to .50% for certain purchases of Class A shares and .25% for certain purchases of Class T shares.
For the period, sales charge amounts retained by FDC were as follows:
| Retained
by FDC |
Class A | $ 5,923 |
Class T | 524 |
Class B* | 513 |
Class C* | 272 |
| $ 7,232 |
* When Class B and Class C shares are initially sold, FDC pays commissions from its own resources to financial intermediaries through which the sales are made.
Transfer Agent Fees. Fidelity Investments Institutional Operations Company, Inc. (FIIOC), an affiliate of FMR, is the transfer, dividend disbursing and shareholder servicing agent for each class of the Fund. FIIOC receives account fees and asset-based fees that vary according to the account size and type of account of the shareholders of the respective classes of the Fund. FIIOC pays for typesetting, printing and mailing of shareholder reports, except proxy statements. For the period, the total transfer agent fees paid by each class were as follows:
| Amount | % of
Average
Net Assets* |
Class A | $ 2,312 | .31 |
Class T | 907 | .23 |
Class B | 902 | .25 |
Class C | 1,374 | .28 |
Emerging Europe, Middle East, Africa (EMEA) | 71,417 | .33 |
Institutional Class | 1,582 | .20 |
| $ 78,494 | |
* Annualized
Annual Report
Notes to Financial Statements - continued
6. Fees and Other Transactions with Affiliates - continued
Accounting Fees. Fidelity Service Company, Inc. (FSC), an affiliate of FMR, maintains the Fund's accounting records. The fee is based on the level of average net assets for the month.
Brokerage Commissions. The Fund placed a portion of its portfolio transactions with brokerage firms which are affiliates of the investment adviser. The commissions paid to these affiliated firms were $166 for the period.
7. Expense Reductions.
FMR voluntarily agreed to reimburse each class to the extent annual operating expenses exceeded certain levels of average net assets as noted in the table below. Some expenses, for example interest expense, are excluded from this reimbursement.
The following classes were in reimbursement during the period:
| Expense
Limitations | Reimbursement
from adviser |
Class A | 1.50% | $ 7,707 |
Class T | 1.75% | 4,165 |
Class B | 2.25% | 3,924 |
Class C | 2.25% | 5,138 |
Emerging Europe, Middle East, Africa (EMEA) | 1.25% | 208,302 |
Institutional Class | 1.25% | 7,188 |
| | $ 236,424 |
Many of the brokers with whom FMR places trades on behalf of the Fund provided services to the Fund in addition to trade execution. These services included payments of certain expenses on behalf of the Fund totaling $65,477 for the period. In addition, through arrangements with the Fund's custodian and each class' transfer agent, credits realized as a result of uninvested cash balances were used to reduce the Fund's expenses. During the period, these credits reduced the Fund's custody expenses by $1,796.
8. Other.
The Fund's organizational documents provide former and current trustees and officers with a limited indemnification against liabilities arising in connection with the performance of their duties to the Fund. In the normal course of business, the Fund may also enter into contracts that provide general indemnifications. The Fund's maximum
Annual Report
8. Other - continued
exposure under these arrangements is unknown as this would be dependent on future claims that may be made against the Fund. The risk of material loss from such claims is considered remote.
At the end of the period, FMR or its affiliates were the owners of record of 32% of the total outstanding shares of the Fund.
9. Share Transactions.
Transactions for each class of shares were as follows:
| SharesA | DollarsA |
Year ended October 31, | 2008 | 2008 |
Class A | | |
Shares sold | 344,487 | $ 3,038,678 |
Shares redeemed | (56,535) | (363,899) |
Net increase (decrease) | 287,952 | $ 2,674,779 |
Class T | | |
Shares sold | 130,067 | $ 1,228,022 |
Shares redeemed | (10,490) | (50,821) |
Net increase (decrease) | 119,577 | $ 1,177,201 |
Class B | | |
Shares sold | 115,650 | $ 1,098,908 |
Shares redeemed | (12,702) | (76,194) |
Net increase (decrease) | 102,948 | $ 1,022,714 |
Class C | | |
Shares sold | 174,986 | $ 1,629,690 |
Shares redeemed | (18,490) | (109,269) |
Net increase (decrease) | 156,496 | $ 1,520,421 |
Emerging Europe, Middle East, Africa (EMEA) | | |
Shares sold | 10,218,704 | $ 92,385,312 |
Shares redeemed | (3,380,627) | (23,437,711) |
Net increase (decrease) | 6,838,077 | $ 68,947,601 |
Institutional Class | | |
Shares sold | 598,356 | $ 4,518,354 |
Shares redeemed | (31,854) | (190,184) |
Net increase (decrease) | 566,502 | $ 4,328,170 |
A For the period May 8, 2008 (commencement of operations) to October 31, 2008.
Annual Report
To the Trustees of Fidelity Investment Trust and Shareholders of Fidelity Emerging Europe, Middle East, Africa (EMEA) Fund:
We have audited the accompanying statement of assets and liabilities of Fidelity Emerging Europe, Middle East, Africa (EMEA) Fund (the Fund), a fund of Fidelity Investment Trust, including the schedule of investments, as of October 31, 2008, and the related statement of operations, the statement of changes in net assets and the financial highlights for the period from May 8, 2008 (Commencement of Operations) to October 31, 2008. These financial statements and financial highlights are the responsibility of the Fund's management. Our responsibility is to express an opinion on these financial statements and financial highlights based on our audit.
We conducted our audit in accordance with standards of the Public Company Accounting Oversight Board (United States). Those standards require that we plan and perform the audit to obtain reasonable assurance about whether the financial statements and financial highlights are free of material misstatement. The Fund is not required to have, nor were we engaged to perform, an audit of its internal control over financial reporting. Our audits included consideration of internal control over financial reporting as a basis for designing audit procedures that are appropriate in the circumstances, but not for the purpose of expressing an opinion on the effectiveness of the Fund's internal control over financial reporting. Accordingly, we express no such opinion. An audit also includes examining, on a test basis, evidence supporting the amounts and disclosures in the financial statements, assessing the accounting principles used and significant estimates made by management, as well as evaluating the overall financial statement presentation. Our procedures included confirmation of securities owned as of October 31, 2008, by correspondence with the custodians and brokers; where replies were not received from brokers, we performed other auditing procedures. We believe that our audit provides a reasonable basis for our opinion.
In our opinion, the financial statements and financial highlights referred to above present fairly, in all material respects, the financial position of Fidelity Emerging Europe, Middle East, Africa (EMEA) Fund as of October 31, 2008, the results of its operations, the changes in its net assets and its financial highlights for the period from May 8, 2008 (Commencement of Operations) to October 31, 2008, in conformity with accounting principles generally accepted in the United States of America.
/s/ Deloitte & Touche LLP
DELOITTE & TOUCHE LLP
Boston, Massachusetts
December 19, 2008
Annual Report
The Trustees, Member of the Advisory Board, and executive officers of the trust and fund, as applicable, are listed below. The Board of Trustees governs the fund and is responsible for protecting the interests of shareholders. The Trustees are experienced executives who meet periodically throughout the year to oversee the fund's activities, review contractual arrangements with companies that provide services to the fund, and review the fund's performance. Except for Edward C. Johnson 3d and James C. Curvey, each of the Trustees oversees 220 funds advised by FMR or an affiliate. Messrs. Johnson and Curvey oversee 379 funds advised by FMR or an affiliate.
The Trustees hold office without limit in time except that (a) any Trustee may resign; (b) any Trustee may be removed by written instrument, signed by at least two-thirds of the number of Trustees prior to such removal; (c) any Trustee who requests to be retired or who has become incapacitated by illness or injury may be retired by written instrument signed by a majority of the other Trustees; and (d) any Trustee may be removed at any special meeting of shareholders by a two-thirds vote of the outstanding voting securities of the trust. Each Trustee who is not an interested person (as defined in the 1940 Act) (Independent Trustee), shall retire not later than the last day of the calendar year in which his or her 72nd birthday occurs. The Independent Trustees may waive this mandatory retirement age policy with respect to individual Trustees. The executive officers and Advisory Board Member hold office without limit in time, except that any officer and Advisory Board Member may resign or may be removed by a vote of a majority of the Trustees at any regular meeting or any special meeting of the Trustees. Except as indicated, each individual has held the office shown or other offices in the same company for the past five years.
The fund's Statement of Additional Information (SAI) includes more information about the Trustees. To request a free copy, call Fidelity at 1-877-208-0098.
Interested Trustees*:
Correspondence intended for each Trustee who is an interested person may be sent to Fidelity Investments, 82 Devonshire Street, Boston, Massachusetts 02109.
Name, Age; Principal Occupation |
Edward C. Johnson 3d (78) |
| Year of Election or Appointment: 1984 Mr. Johnson is Chairman of the Board of Trustees. Mr. Johnson serves as Chief Executive Officer, Chairman, and a Director of FMR LLC; Chairman and a Director of FMR; Chairman and a Director of Fidelity Research & Analysis Company (FRAC); Chairman and a Director of Fidelity Investments Money Management, Inc.; and Chairman and a Director of FMR Co., Inc. In addition, Mr. Johnson serves as Chairman and Director of FIL Limited. Previously, Mr. Johnson served as President of FMR LLC (2006-2007). |
James C. Curvey (73) |
| Year of Election or Appointment: 2007 Mr. Curvey also serves as Trustee (2007-present) of other investment companies advised by FMR. Mr. Curvey is a Director of FMR and FMR Co., Inc. (2007-present). Mr. Curvey is also Vice Chairman (2006-
present) and Director of FMR LLC. In addition, Mr. Curvey serves as an Overseer for the Boston Symphony Orchestra and a member of the Trustees of Villanova University. |
* Trustees have been determined to be "Interested Trustees" by virtue of, among other things, their affiliation with the trust or various entities under common control with FMR. FMR Corp. merged with and into FMR LLC on October 1, 2007. Any references to FMR LLC for prior periods are deemed to be references to the prior entity.
Independent Trustees:
Correspondence intended for each Independent Trustee (that is, the Trustees other than the Interested Trustees) may be sent to Fidelity Investments, P.O. Box 55235, Boston, Massachusetts 02205-5235.
Name, Age; Principal Occupation |
Dennis J. Dirks (60) |
| Year of Election or Appointment: 2005 Prior to his retirement in May 2003, Mr. Dirks was Chief Operating Officer and a member of the Board of The Depository Trust & Clearing Corporation (DTCC) (1999-2003). He also served as President, Chief Operating Officer, and Board member of The Depository Trust Company (DTC) (1999-2003) and President and Board member of the National Securities Clearing Corporation (NSCC) (1999-2003). In addition, Mr. Dirks served as a Trustee and a member of the Finance Committee of Manhattan College (2005-2008), and as Chief Executive Officer and Board member of the Government Securities Clearing Corporation (2001-2003) and Chief Executive Officer and Board member of the Mortgage-Backed Securities Clearing Corporation (2001-2003). Mr. Dirks also serves as a Trustee and a member of the Finance Committee of AHRC of Nassau County (2006-present). |
Alan J. Lacy (55) |
| Year of Election or Appointment: 2008 Mr. Lacy serves as Senior Adviser (2007-present) of Oak Hill Capital Partners, L.P. (a private equity firm). Mr. Lacy also served as Chief Executive Officer (2000-2005) and Vice Chairman (2005-2006) of Sears Holdings Corporation and Sears, Roebuck and Co. (retail). In addition, Mr. Lacy serves as a member of the Board of Directors of The Western Union Company (global money transfer, 2006-present) and Bristol-Myers Squibb (global pharmaceuticals, 2007-present). Mr. Lacy is a Trustee of the National Parks Conservation Association and The Field Museum of Natural History. |
Ned C. Lautenbach (64) |
| Year of Election or Appointment: 2000 Mr. Lautenbach is Chairman of the Independent Trustees (2006-present). Mr. Lautenbach is an Advisory Partner of Clayton, Dubilier & Rice, Inc. (private equity investment firm). Previously, Mr. Lautenbach was with the International Business Machines Corporation (IBM) from 1968 until his retirement in 1998. Mr. Lautenbach serves as a Director of Eaton Corporation (diversified industrial) as well as the Philharmonic Center for the Arts in Naples, Florida. He also is a member of the Board of Trustees of Fairfield University (2005-present), as well as a member of the Council on Foreign Relations. Previously, Mr. Lautenbach served as a Director of Sony Corporation (2006-2007). |
Joseph Mauriello (64) |
| Year of Election or Appointment: 2008 Prior to his retirement in January 2006, Mr. Mauriello served in numerous senior management positions including Deputy Chairman and Chief Operating Officer (2004-2005), and Vice Chairman of Financial Services (2002-2004) of KPMG LLP US (professional services firm, 1965-2005). Mr. Mauriello currently serves as a member of the Board of Directors of XL Capital Ltd. (global insurance and re-insurance company, 2006-present) and of Arcadia Resources Inc. (health care services and products, 2007-present). He also served as a Director of the Hamilton Funds of the Bank of New York (2006-2007). |
Cornelia M. Small (64) |
| Year of Election or Appointment: 2005 Ms. Small is a member of the Investment Committee, and Chair (2008-present) and a member of the Board of Trustees of Smith College. Ms. Small also serves on the Investment Committee of the Berkshire Taconic Community Foundation (2008-present). Previously, Ms. Small served as Chairperson of the Investment Committee (2002-2008) of Smith College and as Co-Chair (2000-2003) of the Annual Fund for the Fletcher School of Law and Diplomacy. In addition, she served as Chief Investment Officer, Director of Global Equity Investments, and a member of the Board of Directors of Scudder, Stevens & Clark and Scudder Kemper Investments. |
William S. Stavropoulos (69) |
| Year of Election or Appointment: 2001 Mr. Stavropoulos is Chairman Emeritus of the Board of Directors of The Dow Chemical Company, where he previously served in numerous senior management positions, including President (1993-2000; 2002-2003), CEO (1995-2000; 2002-2004), Chairman of the Executive Committee (2000-2006), and as a member of the Board of Directors (1990-2006). Currently, he is a Director of Teradata Corporation (data warehousing and technology solutions, 2008-present), Chemical Financial Corporation, Maersk Inc. (industrial conglomerate), Tyco International, Inc. (multinational manufacturing and services, 2007-present), and a member of the Advisory Board for Metalmark Capital (private equity investment firm, 2005-present). He is a special advisor to Clayton, Dubilier & Rice, Inc. (private equity investment). In addition, Mr. Stavropoulos is a member of the University of Notre Dame Advisory Council for the College of Science. |
David M. Thomas (59) |
| Year of Election or Appointment: 2008 Previously, Mr. Thomas served as Executive Chairman (2005-2006) and Chairman and Chief Executive Officer (2000-2005) of IMS Health, Inc. (pharmaceutical and healthcare information solutions). In addition, Mr. Thomas serves as a member of the Board of Directors of Fortune Brands, Inc. (consumer products holding company), and Interpublic Group of Companies, Inc. (marketing communication, 2004-present). |
Michael E. Wiley (58) |
| Year of Election or Appointment: 2008 Mr. Wiley also serves as a member of the Board of Trustees of the University of Tulsa (2000-2006; 2007-present). He serves as a Director of Tesoro Corporation (independent oil refiner and marketer, 2005-present), and a Director of Bill Barrett Corporation (exploration and production company, 2005-present). In addition, he also serves as a Director of Post Oak Bank (privately-held bank, 2004-present). Previously, Mr. Wiley served as a Sr. Energy Advisor of Katzenbach Partners, LLC (consulting firm, 2006-2007), as an Advisory Director of Riverstone Holdings (private investment firm), Chairman, President, and CEO of Baker Hughes, Inc. (oilfield services company, 2000-2004), and as Director of Spinnaker Exploration Company (exploration and production company, 2001-2005). |
Advisory Board Member and Executive Officers**:
Correspondence intended for each executive officer and Mr. Lynch may be sent to Fidelity Investments, 82 Devonshire Street, Boston, Massachusetts 02109.
Name, Age; Principal Occupation |
Peter S. Lynch (64) |
| Year of Election or Appointment: 2003 Member of the Advisory Board of Fidelity's Equity and High Income Funds. Mr. Lynch is Vice Chairman and a Director of FMR, and Vice Chairman (2001-present) and a Director of FMR Co., Inc. Previously, Mr. Lynch served as a Trustee of the Fidelity funds (1990-2003). In addition, he serves as a Trustee of Boston College and as the Chairman of the Inner-City Scholarship Fund. Previously, Mr. Lynch served on the Special Olympics International Board of Directors (1997-2006). |
Kenneth B. Robins (39) |
| Year of Election or Appointment: 2008 President and Treasurer of Fidelity's Equity and High Income Funds. Mr. Robins is an employee of Fidelity Investments (2004-present). Before joining Fidelity Investments, Mr. Robins worked at KPMG LLP, where he was a partner in KPMG's department of professional practice (2002-2004). |
Walter C. Donovan (46) |
| Year of Election or Appointment: 2007 Vice President of Fidelity's Equity Funds. Mr. Donovan also serves as President of FMR and FMR Co., Inc., and Executive Vice President of Fidelity Investments Money Management, Inc. (2007-present). Previously, Mr. Donovan served as Executive Vice President of FMR and FMR Co., Inc. (2005-2007) and Senior Vice President of FMR (2003-2005) and FMR Co., Inc. (2004-2005). |
Eric M. Wetlaufer (46) |
| Year of Election or Appointment: 2006 Vice President of Fidelity's International Equity Funds. Mr. Wetlaufer also serves as Group Chief Investment Officer of FMR. Mr. Wetlaufer is Chairman, Chief Executive Officer, and President of Fidelity Management & Research (Hong Kong) Limited (2008-present); Chairman, Chief Executive Officer, President, and a Director of Fidelity Management & Research (Japan) Inc. (2008-present); Chairman and Chief Executive Officer (2007-present) and President and a Director (2006-present) of Fidelity Management & Research (U.K.) Inc. and President and a Director of Fidelity Research & Analysis Company (2006-present). Before joining Fidelity Investments in 2005, Mr. Wetlaufer was a partner in Oxhead Capital Management (2004-2005) and a Chief Investment Officer of Putnam Investments (1997-2003). |
Scott C. Goebel (40) |
| Year of Election or Appointment: 2008 Secretary and Chief Legal Officer (CLO) of the Fidelity funds. Mr. Goebel also serves as General Counsel, Secretary, and Senior Vice President of FMR (2008-present); Deputy General Counsel of FMR LLC; Chief Legal Secretary of Fidelity Management & Research (Hong Kong) Limited (2008-present) and Assistant Secretary of Fidelity Management & Research (Japan) Inc. (2008-present). Previously, Mr. Goebel served as Assistant Secretary of the Funds (2007-2008) and as Vice President and Secretary of Fidelity Distributors Corporation (FDC) (2005-2007). |
John B. McGinty, Jr. (46) |
| Year of Election or Appointment: 2008 Assistant Secretary of Fidelity's Equity and High Income Funds. Mr. McGinty is an employee of Fidelity Investments (2004-present). Mr. McGinty also serves as Senior Vice President, Secretary, and Chief Legal Officer of FDC (2007-present). Before joining Fidelity Investments, Mr. McGinty practiced law at Ropes & Gray, LLP. |
Holly C. Laurent (54) |
| Year of Election or Appointment: 2008 Anti-Money Laundering (AML) Officer of the Fidelity funds. Ms. Laurent is an employee of Fidelity Investments. Previously, Ms. Laurent was Senior Vice President and Head of Legal for Fidelity Business Services India Pvt. Ltd. (2006-2008), Senior Vice President, Deputy General Counsel and Group Head for FMR LLC (2005-2006). |
Christine Reynolds (50) |
| Year of Election or Appointment: 2008 Chief Financial Officer of the Fidelity funds. Ms. Reynolds became President of Fidelity Pricing and Cash Management Services (FPCMS) in August 2008. She served as Chief Operating Officer of FPCMS from 2007 through July 2008. Previously, Ms. Reynolds served as President, Treasurer, and Anti-Money Laundering officer of the Fidelity funds (2004-2007). Before joining Fidelity Investments, Ms. Reynolds worked at PricewaterhouseCoopers LLP (PwC) (1980-2002), where she was an audit partner with PwC's investment management practice. |
Kenneth A. Rathgeber (61) |
| Year of Election or Appointment: 2004 Chief Compliance Officer of Fidelity's Equity and High Income Funds. Mr. Rathgeber is Chief Compliance Officer of Fidelity Management & Research (Hong Kong) Limited (2008-present), Fidelity Management & Research (Japan) Inc. (2008-present), FMR (2005-present), FMR Co., Inc. (2005-present), Fidelity Management & Research (U.K.) Inc. (2005-present), Fidelity Research & Analysis Company (2005-present), Fidelity Investments Money Management, Inc. (2005-present), and Strategic Advisers, Inc. (2005-present). |
Bryan A. Mehrmann (47) |
| Year of Election or Appointment: 2005 Deputy Treasurer of the Fidelity funds. Mr. Mehrmann is an employee of Fidelity Investments. Previously, Mr. Mehrmann served as Vice President of Fidelity Investments Institutional Services Group (FIIS)/Fidelity Investments Institutional Operations Corporation, Inc. (FIIOC) Client Services (1998-2004). |
Adrien E. Deberghes (41) |
| Year of Election or Appointment: 2008 Deputy Treasurer of Fidelity's Equity and High Income Funds. Mr. Deberghes is an employee of Fidelity Investments (2008-present). Previously, Mr. Deberghes served as Senior Vice President of Mutual Fund Administration at State Street Corporation (2007-2008), Senior Director of Mutual Fund Administration at Investors Bank & Trust (2005-2007), and Director of Finance for Dunkin' Brands (2000-2005). |
Robert G. Byrnes (41) |
| Year of Election or Appointment: 2005 Assistant Treasurer of the Fidelity funds. Mr. Byrnes is an employee of Fidelity Investments (2005-present). Previously, Mr. Byrnes served as Vice President of Fidelity Pricing and Cash Management Services (FPCMS) (2003-2005). Before joining Fidelity Investments, Mr. Byrnes worked at Deutsche Asset Management where he served as Vice President of the Investment Operations Group (2000-2003). |
Peter L. Lydecker (54) |
| Year of Election or Appointment: 2004 Assistant Treasurer of the Fidelity funds. Mr. Lydecker is an employee of Fidelity Investments. |
Paul M. Murphy (61) |
| Year of Election or Appointment: 2007 Assistant Treasurer of the Fidelity funds. Mr. Murphy is an employee of Fidelity Investments (2007-present). Previously, Mr. Murphy served as Chief Financial Officer of the Fidelity Funds (2005-2006), Vice President and Associate General Counsel of FMR (2007), and Senior Vice President of Fidelity Pricing and Cash Management Services (FPCMS) (1994-2007). |
Gary W. Ryan (50) |
| Year of Election or Appointment: 2005 Assistant Treasurer of the Fidelity funds. Mr. Ryan is an employee of Fidelity Investments. Previously, Mr. Ryan served as Vice President of Fund Reporting in Fidelity Pricing and Cash Management Services (FPCMS) (1999-2005). |
** FMR Corp. merged with and into FMR LLC on October 1, 2007. Any references to FMR LLC for prior periods are deemed to be references to the prior entity.
Annual Report
Board Approval of Investment Advisory Contracts and Management Fees
Fidelity Emerging Europe, Middle East, Africa (EMEA) Fund
Each year, typically in July, the Board of Trustees, including the Independent Trustees (together, the Board), votes on the renewal of the management contract and sub-advisory agreements (together, the Advisory Contracts) for the fund. The Board, assisted by the advice of fund counsel and Independent Trustees' counsel, requests and considers a broad range of information throughout the year.
The Board meets regularly and, acting directly and through its separate committees, requests and receives information concerning, and considers at each of its meetings factors that are relevant to, its annual consideration of the renewal of the fund's Advisory Contracts, including the services and support provided to the fund and its shareholders. At the time of the renewal, the Board had 12 standing committees, each composed of Independent Trustees with varying backgrounds, to which the Board has assigned specific subject matter responsibilities in order to enhance effective decision-making by the Board. Each committee has a written charter outlining the structure and purposes of the committee. The Board also meets as needed to consider matters specifically related to the Board's annual consideration of the renewal of Advisory Contracts.
At its July 2008 meeting, the Board of Trustees, including the Independent Trustees, unanimously determined to renew the fund's Advisory Contracts. In reaching its determination, the Board considered a broad range of information. The Board also approved agreements with foreign sub-advisers Fidelity Management & Research (Japan) Inc. and Fidelity Management & Research (Hong Kong) Limited, as well as amendments to the fund's agreement with Fidelity Management & Research (U.K.) Inc.
In considering whether to renew the Advisory Contracts for the fund, the Board ultimately reached a determination, with the assistance of fund counsel and Independent Trustees' counsel and through the exercise of its business judgment, that the renewal of the Advisory Contracts and the compensation to be received by Fidelity under the management contract is consistent with Fidelity's fiduciary duty under applicable law. The Board's decision to renew the Advisory Contracts was not based on any single factor, but rather was based on a comprehensive consideration of all the information provided to the Board at its meetings throughout the year. The Board, in reaching its determination to renew the Advisory Contracts, is aware that shareholders in the fund have a broad range of investment choices available to them, including a wide choice among mutual funds offered by competitors to Fidelity, and that the fund's shareholders, with the opportunity to review and weigh the disclosure provided by the fund in its prospectus and other public disclosures, have chosen to invest in this fund, managed by Fidelity.
Nature, Extent, and Quality of Services Provided. The Board considered staffing within the investment adviser, FMR, and the sub-advisers (together, the Investment Advisers), including the backgrounds of the fund's investment personnel and the fund's investment objective and discipline. The Independent Trustees also had discussions with senior management of Fidelity's investment operations and investment groups. The Board considered the structure of the portfolio manager compensation program and whether this structure provides appropriate incentives.
Annual Report
Board Approval of Investment Advisory Contracts and
Management Fees - continued
Resources Dedicated to Investment Management and Support Services. The Board reviewed the size, education, and experience of the Investment Advisers' investment staff, their use of technology, and the Investment Advisers' approach to recruiting, training, and retaining portfolio managers and other research, advisory, and management personnel. The Board noted that Fidelity's analysts have access to a variety of technological tools that enable them to perform both fundamental and quantitative analysis and to specialize in various disciplines. The Board considered Fidelity's extensive global research capabilities that enable the Investment Advisers to aggregate data from various sources in an effort to produce positive investment results. The Board also considered that Fidelity's portfolio managers and analysts have access to daily portfolio attribution that allows for monitoring of a fund's portfolio, as well as an electronic communication system that provides immediate real-time access to research concerning issuers and credit enhancers.
Shareholder and Administrative Services. The Board considered (i) the nature, extent, quality, and cost of advisory, administrative, distribution, and shareholder services performed by the Investment Advisers and their affiliates under the Advisory Contracts and under separate agreements covering transfer agency, pricing and bookkeeping, and securities lending services for the fund; (ii) the nature and extent of the Investment Advisers' supervision of third party service providers, principally custodians and subcustodians; and (iii) the resources devoted to, and the record of compliance with, the fund's compliance policies and procedures. The Board also reviewed the allocation of fund brokerage, including allocations to brokers affiliated with the Investment Advisers, the use of brokerage commissions to pay fund expenses, and the use of "soft" commission dollars to pay for research services. The Board further considered that Fidelity voluntarily pays for market data out of its own resources.
The Board noted that the growth of fund assets across the complex allows Fidelity to reinvest in the development of services designed to enhance the value or convenience of the Fidelity funds as investment vehicles. These services include 24-hour access to account information and market information through phone representatives and over the Internet, and investor education materials and asset allocation tools.
Investment in a Large Fund Family. The Board considered the benefits to shareholders of investing in a Fidelity fund, including the benefits of investing in a fund that is part of a large family of funds offering a variety of investment disciplines and providing for a large variety of mutual fund investor services. For example, fund shareholders are offered the privilege of exchanging shares of the fund for shares of other Fidelity funds, as set forth in the fund's prospectus, without paying a sales charge. The Board noted that Fidelity has taken a number of actions over the previous year that benefited particular funds, including (i) dedicating additional resources to investment research and to restructure the investment research teams; (ii) contractually agreeing to reduce the management fees on Fidelity's Institutional Money Market Funds and launching Class IV and Institutional Class of certain of these funds; (iii) reducing the transfer agent fees for the Fidelity Select Portfolios and Investor Class of the VIP funds; and (iv) launching Class K of 29 equity funds as a lower-fee class available to certain employer-sponsored retirement plans.
Annual Report
Investment Performance. The Board considered whether the fund has operated within its investment objective, as well as its record of compliance with its investment restrictions. The Board noted that it is not possible to evaluate performance in any comprehensive fashion because the fund had been in operation for less than one calendar year. Once the fund has been in operation for at least one calendar year, the Board will review the fund's absolute investment performance for each class, as well as the fund's relative investment performance for each class measured against a broad-based securities market index and a peer group of mutual funds.
Based on its review, the Board concluded that the nature, extent, and quality of the services provided to the fund will benefit the fund's shareholders, particularly in light of the Board's view that the fund's shareholders benefit from investing in a fund that is part of a large family of funds offering a variety of investment disciplines and services.
Competitiveness of Management Fee and Total Fund Expenses. The Board considered the fund's management fee and projected total operating expenses of each class of the fund in reviewing the Advisory Contracts. The Board noted that the fund's management fee rate is lower than the median fee rate of funds with similar Lipper investment objective categories and comparable management fee characteristics. The Board considered that the projected total operating expenses are comparable to those of similar classes and funds that Fidelity offers to shareholders. The Board also considered supplemental information about how the fund's management fee and total expenses ranked relative to groups based on Lipper classifications, which take into account a fund's market capitalization and style.
Based on its review, the Board concluded that the fund's management fee and proposed total expenses of each class were fair and reasonable in light of the services that the fund and its shareholders receive and the other factors considered.
Costs of the Services and Profitability. The fund has only recently commenced operations and therefore no revenue, cost, or profitability data was available for the Board to review in respect of the fund at the time in renew the Advisory Contracts. In connection with its future renewal of the fund's Advisory Contracts, the Board will consider the revenues earned and the expenses incurred by Fidelity in conducting the business of developing, marketing, distributing, managing, administering and servicing the fund and its shareholders.
Annual Report
Board Approval of Investment Advisory Contracts and
Management Fees - continued
Economies of Scale. The Board considered whether there have been economies of scale in respect of the management of the Fidelity funds, whether the Fidelity funds (including the fund) have appropriately benefited from any such economies of scale, and whether there is potential for realization of any further economies of scale. The Board considered the extent to which the fund will benefit from economies of scale through increased services to the fund, through waivers or reimbursements, or through fee or expense reductions.
The Board recognized that the fund's management contract incorporates a "group fee" structure, which provides for lower group fee rates as total fund assets under FMR's management increase, and for higher group fee rates as total fund assets under FMR's management decrease. FMR determines the group fee rates based on a tiered asset "breakpoint" schedule. The Board considered that the group fee is designed to deliver the benefits of economies of scale to fund shareholders when total fund assets increase, even if assets of any particular fund are unchanged or have declined, because some portion of Fidelity's costs are attributable to services provided to all Fidelity funds, and all funds benefit if those costs can be allocated among more assets. The Board concluded that, given the group fee structure, fund shareholders will achieve a certain level of economies of scale as assets under FMR's management increase at the fund complex level, regardless of whether Fidelity achieves any such economies of scale.
The Board further concluded that any potential economies of scale are being shared between fund shareholders and Fidelity in an appropriate manner.
Additional Information Requested by the Board. In order to develop fully the factual basis for consideration of the Fidelity funds' Advisory Contracts, the Board requested and received additional information on certain topics, including (i) fund performance trends and actions to be taken by FMR to improve certain funds' overall performance; (ii) portfolio manager changes that have occurred during the past year; (iii) Fidelity's fund profitability methodology, the profitability of certain fund service providers, and profitability trends for certain funds; (iv) Fidelity's compensation structure for portfolio managers and key personnel, including its effects on fund profitability and the extent to which portfolio manager compensation is linked to fund performance; (v) Fidelity's fee structures and rationale for recommending different fees among categories of funds; and (vi) Fidelity's rationale for recommending which funds should have a performance adjustment component as part of their management fees.
Based on its evaluation of all of the conclusions noted above, and after considering all material factors, the Board ultimately concluded that the advisory fee structures are fair and reasonable, and that the fund's Advisory Contracts should be renewed.
Annual Report
Investment Adviser
Fidelity Management & Research Company
Boston, MA
Investment Sub-Advisers
FMR Co., Inc.
Fidelity Management & Research
(U.K.) Inc.
Fidelity Research & Analysis Company
Fidelity Investments
Japan Limited
FIL Investment Advisors
FIL Investment Advisors
(U.K.) Ltd.
Fidelity Management & Research
(Hong Kong) Limited
Fidelity Management & Research
(Japan) Inc.
General Distributor
Fidelity Distributors Corporation
Boston, MA
Transfer and Service Agents
Fidelity Investments Institutional
Operations Company, Inc.
Boston, MA
Fidelity Service Company, Inc.
Boston, MA
Custodian
State Street Bank & Trust Company
Quincy, MA
AEMEI-UANN-1208
1.861980.100
Fidelity®
International Discovery
Fund
Annual Report
October 31, 2008
(2_fidelity_logos) (Registered_Trademark)
Contents
Chairman's Message | <Click Here> | Ned Johnson's message to shareholders. |
Performance | <Click Here> | How the fund has done over time. |
Management's Discussion | <Click Here> | The manager's review of fund performance, strategy and outlook. |
Shareholder Expense Example | <Click Here> | An example of shareholder expenses. |
Investment Changes | <Click Here> | A summary of major shifts in the fund's investments over the past six months. |
Investments | <Click Here> | A complete list of the fund's investments with their market values. |
Financial Statements | <Click Here> | Statements of assets and liabilities, operations, and changes in net assets, as well as financial highlights. |
Notes | <Click Here> | Notes to the financial statements. |
Report of Independent Registered Public Accounting Firm | <Click Here> | |
Trustees and Officers | <Click Here> | |
Distributions | <Click Here> | |
Proxy Voting Results | <Click Here> | |
Board Approval of Investment Advisory Contracts and Management Fees | <Click Here> | |
To view a fund's proxy voting guidelines and proxy voting record for the 12-month period ended June 30, visit http://www.fidelity.com (search for "proxy voting guidelines") or visit the Securities and Exchange Commission's (SEC) web site at http://www.sec.gov. You may also call 1-800-544-8544 to request a free copy of the proxy voting guidelines.
Standard & Poor's, S&P and S&P 500 are registered service marks of The McGraw-Hill Companies, Inc. and have been licensed for use by Fidelity Distributors Corporation.
Other third party marks appearing herein are the property of their respective owners.
All other marks appearing herein are registered or unregistered trademarks or service marks of FMR LLC or an affiliated company.
Annual Report
This report and the financial statements contained herein are submitted for the general information of the shareholders of the fund. This report is not authorized for distribution to prospective investors in the fund unless preceded or accompanied by an effective prospectus.
A fund files its complete schedule of portfolio holdings with the SEC for the first and third quarters of each fiscal year on Form N-Q. Forms N-Q are available on the SEC's web site at http://www.sec.gov. A fund's Forms N-Q may be reviewed and copied at the SEC's Public Reference Room in Washington, DC. Information regarding the operation of the SEC's Public Reference Room may be obtained by calling 1-800-SEC-0330. For a complete list of a fund's portfolio holdings, view the most recent holdings listing, semiannual report, or annual report on Fidelity's web site at http://www.fidelity.com or http://www.fidelity.com/holdings, as applicable.
NOT FDIC INSURED · MAY LOSE VALUE · NO BANK GUARANTEE
Neither the fund nor Fidelity Distributors Corporation is a bank.
Annual Report
(photo_of_Edward_C_Johnson_3d)
Dear Shareholder:
Turmoil has been the watchword for the world's securities markets in 2008, with domestic and international stocks down sharply amid the global credit squeeze. A flight to quality boosted returns for U.S. Treasuries, one of the few asset classes with positive results heading into the latter stages of the year. Financial markets are always unpredictable, but there are a number of time-tested principles that can put the historical odds in your favor.
One of the basic tenets is to invest for the long term. Over time, riding out the markets' inevitable ups and downs has proven much more effective than selling into panic or chasing the hottest trend. Even missing only a few of the markets' best days can significantly diminish investor returns. Patience also affords the benefits of compounding - of earning interest on additional income or reinvested dividends and capital gains. There are tax advantages and cost benefits to consider as well. The more you sell, the more taxes you pay, and the more you trade, the higher the costs. While staying the course doesn't eliminate risk, it can considerably lessen the effect of short-term declines.
You can further manage your investing risk through diversification. And today, more than ever, geographic diversification should be taken into account. Studies indicate that asset allocation is the single most important determinant of a portfolio's long-term success. The right mix of stocks, bonds and cash - aligned to your particular risk tolerance and investment objective - is very important. Age-appropriate rebalancing is also an essential aspect of asset allocation. For younger investors, an emphasis on equities - which historically have been the best-performing asset class over time - is encouraged. As investors near their specific goal, such as retirement or sending a child to college, consideration may be given to replacing volatile assets (e.g. common stocks) with more-stable fixed investments (bonds or savings plans).
A third investment principle - investing regularly - can help lower the average cost of your purchases. Investing a certain amount of money each month or quarter helps ensure you won't pay for all your shares at market highs. This strategy - known as dollar cost averaging - also reduces unconstructive "emotion" from investing, helping shareholders avoid selling weak performers just prior to an upswing, or chasing a hot performer just before a correction.
We invite you to contact us via the Internet, through our Investor Centers or over the phone. It is our privilege to provide you the information you need to make the investments that are right for you.
Sincerely,
/s/Edward C. Johnson 3d
Edward C. Johnson 3d
Annual Report
Average annual total return reflects the change in the value of an investment, assuming reinvestment of the class' dividend income and capital gains (the profits earned upon the sale of securities that have grown in value, if any) and assuming a constant rate of performance each year. The $10,000 table and the fund's returns do not reflect the deduction of taxes that a shareholder would pay on fund distributions or the redemption of fund shares. During periods of reimbursement by Fidelity, a fund's total return will be greater than it would be had the reimbursement not occurred. How a fund did yesterday is no guarantee of how it will do tomorrow.
Average Annual Total Returns
Periods ended October 31, 2008 | Past 1
year | Past 5
years | Past 10
years |
International Discovery A | -47.55% | 4.97% | 5.98% |
A Prior to October 1, 2004, International Discovery Fund operated under certain different investment policies. Accordingly, the fund's historical performance may not represent its current investment policies.
$10,000 Over 10 Years
Let's say hypothetically that $10,000 was invested in International Discovery, a class of the fund, on October 31, 1998. The chart shows how the value of your investment would have changed, and also shows how the MSCI® EAFE ® Index (Europe, Australasia, Far East) performed over the same period.

Annual Report
Comments from William Kennedy, Portfolio Manager of Fidelity® International Discovery Fund
In a dramatic reversal of what had been a multiyear global growth story, international stocks fell long and hard during the 12 months ending October 31, 2008, especially so during the latter stages of the period and mostly as a result of fallout from the financial crisis that emanated from the United States. The viral spread of this financial contagion - which began in the U.S. subprime mortgage market, then seized up the credit markets, hobbled major financial institutions and eventually slowed economic growth worldwide - left virtually no corner of the globe untouched. Developed international equity markets - as gauged by the MSCI® Europe, Australasia, Far East (EAFE®) Index, which monitors established markets outside the U.S. and Canada - fell 46.54%, while the Standard & Poor's 500SM Index, a measure of U.S. stocks, dropped 36.10%. Among countries constituting at least 1% of the EAFE index, Switzerland had the "least worst" showing, falling roughly 32%, followed by Japan, where stocks slid by around 37%. Meanwhile, the weakest overall performance came from Belgium, where stocks slipped by nearly 70%. In the United Kingdom, the largest component of the index, equities were down almost 48%. Emerging markets were the weakest performers among the global economies, declining 56.22% as measured by the MSCI Emerging Markets Index.
For the 12 months ending October 31, 2008, the fund's Retail Class shares returned -47.55%, which was just shy of the MSCI EAFE's return. Stock selection in Japan, where the yen was strong, detracted from performance. Stock selection in the energy, utilities and industrials sectors was also disappointing, as were currency impacts on our emerging markets holdings. The fund lost ground from not owning index component Volkswagen, the German car company, as a competitor bought shares that drove the stock price up. Other detractors included Babcock & Brown, an Australian infrastructure development company hurt by the credit crunch. It was no longer held at period end. An underweighting in BP, a British integrated oil company that held up well as energy prices declined, further undermined returns. On the upside, the fund benefited from a small cash position as well as country and sector weightings, including underweightings in financials and materials and an overweighting in health care. Top contributors included CSL, an Australian company with steady growth from its blood plasma and biotechnology businesses. Not owning Fortis, a Belgian diversified financials company in the index, also helped, as the company ran into funding difficulties.
The views expressed above reflect those of the portfolio manager(s) only through the end of the period as stated on the cover of this report and do not necessarily represent the views of Fidelity or any other person in the Fidelity organization. Any such views are subject to change at any time based upon market or other conditions and Fidelity disclaims any responsibility to update such views. These views may not be relied on as investment advice and, because investment decisions for a Fidelity fund are based on numerous factors, may not be relied on as an indication of trading intent on behalf of any Fidelity fund.
Annual Report
Shareholder Expense Example
As a shareholder of the Fund, you incur two types of costs: (1) transaction costs, including sales charges (loads) on redemptions of shares purchased prior to October 12, 1990, and redemption fees, and (2) ongoing costs, including management fees, distribution and/or service (12b-1) fees and other Fund expenses. This Example is intended to help you understand your ongoing costs (in dollars) of investing in the Fund and to compare these costs with the ongoing costs of investing in other mutual funds.
The actual expense Example is based on an investment of $1,000 invested at the beginning of the period and held for the entire period (May 1, 2008 to October 31, 2008) for the Class A, Class T, Class B, Class C, International Discovery and Institutional Class and for the entire period (May 9, 2008 to October 31, 2008) for Class K. The hypothetical expense Example is based on an investment of $1,000 invested for the one half year period (May 1, 2008 to October 31, 2008).
Actual Expenses
The first line of the accompanying table for each class of the Fund provides information about actual account values and actual expenses. You may use the information in this line, together with the amount you invested, to estimate the expenses that you paid over the period. Simply divide your account value by $1,000.00 (for example, an $8,600 account value divided by $1,000.00 = 8.6), then multiply the result by the number in the first line for a class of the Fund under the heading entitled "Expenses Paid During Period" to estimate the expenses you paid on your account during this period. A small balance maintenance fee of $12.00 that is charged once a year may apply for certain accounts with a value of less than $2,000. This fee is not included in the table below. If it was, the estimate of expenses you paid during the period would be higher, and your ending account value lower, by this amount. In addition, the Fund, as a shareholder in the underlying Fidelity Central Funds, will indirectly bear its pro rata share of the fees and expenses incurred by the underlying Fidelity Central Funds. These fees and expenses are not included in the Fund's annualized expense ratio used to calculate the expense estimate in the table below.
Hypothetical Example for Comparison Purposes
The second line of the accompanying table for each class of the Fund provides information about hypothetical account values and hypothetical expenses based on a Class' actual expense ratio and an assumed rate of return of 5% per year before expenses, which is not the Class' actual return. The hypothetical account values and expenses may not be used to estimate the actual ending account balance or expenses you paid for the period. You may use this information to compare the ongoing costs of investing in the Fund and other funds. To do so, compare this 5% hypothetical example with the 5% hypothetical examples that appear in the shareholder reports of the other funds. A small balance maintenance fee of $12.00 that is charged once a year may apply for certain accounts with a value of less than $2,000. This fee is not included in the table below. If it was, the estimate of expenses you paid during the period would be higher, and your ending account value lower, by this amount. In addition, the Fund, as a shareholder in the underlying Fidelity Central Funds, will indirectly bear its pro rata share of the fees and expenses incurred by the underlying Fidelity Central Funds. These fees and expenses are not included in the Fund's annualized expense ratio used to calculate the expense estimate in the table below.
Annual Report
Please note that the expenses shown in the table are meant to highlight your ongoing costs only and do not reflect any transaction costs. Therefore, the second line of the table is useful in comparing ongoing costs only, and will not help you determine the relative total costs of owning different funds. In addition, if these transactional costs were included, your costs would have been higher.
| Annualized Expense Ratio | Beginning
Account Value
May 1, 2008 | Ending
Account Value
October 31, 2008 | Expenses Paid
During Period |
Class A | 1.33% | | | |
Actual | | $ 1,000.00 | $ 594.40 | $ 5.33 B |
Hypothetical A | | $ 1,000.00 | $ 1,018.45 | $ 6.75 C |
Class T | 1.68% | | | |
Actual | | $ 1,000.00 | $ 593.30 | $ 6.73 B |
Hypothetical A | | $ 1,000.00 | $ 1,016.69 | $ 8.52 C |
Class B | 2.19% | | | |
Actual | | $ 1,000.00 | $ 591.80 | $ 8.76 B |
Hypothetical A | | $ 1,000.00 | $ 1,014.13 | $ 11.09 C |
Class C | 2.18% | | | |
Actual | | $ 1,000.00 | $ 591.90 | $ 8.72 B |
Hypothetical A | | $ 1,000.00 | $ 1,014.18 | $ 11.04 C |
International Discovery | 1.08% | | | |
Actual | | $ 1,000.00 | $ 594.90 | $ 4.33 B |
Hypothetical A | | $ 1,000.00 | $ 1,019.71 | $ 5.48 C |
Class K | .93% | | | |
Actual | | $ 1,000.00 | $ 592.80 | $ 3.56 B |
Hypothetical A | | $ 1,000.00 | $ 1,020.46 | $ 4.72 C |
Institutional Class | 1.06% | | | |
Actual | | $ 1,000.00 | $ 595.20 | $ 4.25 B |
Hypothetical A | | $ 1,000.00 | $ 1,019.81 | $ 5.38 C |
A 5% return per year before expenses
B Actual expenses are equal to each Class' annualized expense ratio (shown in the table below); multiplied by the average account value over the period, multiplied by 184/366 (to reflect the one-half year period) for Class A, Class T, Class B, Class C, International Discovery and Institutional Class and multiplied by 176/366 (to reflect the period May 9, 2008 to October 31, 2008) for Class K.
C Hypothetical expenses are equal to each Class' annualized expense ratio (shown in the table below); multiplied by the average account value over the period, multiplied by 184/366 (to reflect the one-half year period).
Annual Report
Investment Changes (Unaudited)
Geographic Diversification (% of fund's net assets) |
As of October 31, 2008 |
| United Kingdom 22.5% |
| Japan 16.0% |
| Switzerland 12.5% |
| Germany 12.1% |
| United States of America 6.9% |
 | France 5.7% |
| Australia 5.0% |
| Spain 3.9% |
| Italy 2.0% |
| Other 13.4% |

Percentages are adjusted for the effect of futures contracts, if applicable. |
|
As of April 30, 2008 |
| United Kingdom 17.5% |
| Japan 15.4% |
| Germany 12.6% |
| Switzerland 8.0% |
| France 6.7% |
| Australia 5.4% |
| United States of America 4.2% |
| Spain 3.8% |
| Canada 3.0% |
| Other 23.4% |

Percentages are adjusted for the effect of futures contracts, if applicable. |
Asset Allocation |
| % of fund's
net assets | % of fund's net assets
6 months ago |
Stocks and Equity Futures | 94.3 | 96.3 |
Short-Term Investments and Net Other Assets | 5.7 | 3.7 |
Top Ten Stocks as of October 31, 2008 |
| % of fund's
net assets | % of fund's net assets
6 months ago |
Nestle SA (Reg.) (Switzerland, Food Products) | 3.0 | 1.8 |
Royal Dutch Shell PLC Class B (United Kingdom, Oil, Gas & Consumable Fuels) | 2.7 | 2.0 |
Roche Holding AG (participation certificate) (Switzerland, Pharmaceuticals) | 2.2 | 0.9 |
E.ON AG (Germany, Electric Utilities) | 2.2 | 2.0 |
CSL Ltd. (Australia, Biotechnology) | 2.1 | 1.7 |
Vodafone Group PLC (United Kingdom, Wireless Telecommunication Services) | 2.0 | 1.6 |
Telefonica SA (Spain, Diversified Telecommunication Services) | 1.9 | 1.6 |
HSBC Holdings PLC (United Kingdom) (Reg.) (United Kingdom, Commercial Banks) | 1.9 | 0.7 |
Toyota Motor Corp. (Japan, Automobiles) | 1.5 | 1.0 |
BHP Billiton PLC (United Kingdom, Metals & Mining) | 1.5 | 1.2 |
| 21.0 | |
Market Sectors as of October 31, 2008 |
| % of fund's
net assets | % of fund's net assets
6 months ago |
Financials | 19.8 | 20.2 |
Health Care | 15.8 | 9.2 |
Consumer Staples | 10.8 | 8.6 |
Telecommunication Services | 7.7 | 6.9 |
Energy | 7.5 | 9.4 |
Information Technology | 7.3 | 9.1 |
Consumer Discretionary | 6.7 | 7.2 |
Industrials | 5.9 | 9.9 |
Utilities | 5.5 | 6.0 |
Materials | 5.1 | 8.4 |
Annual Report
Investments October 31, 2008
Showing Percentage of Net Assets
Common Stocks - 90.7% |
| Shares | | Value (000s) |
Australia - 5.0% |
ABB Grain Ltd. | 1,694,386 | | $ 9,253 |
Commonwealth Bank of Australia | 1,505,851 | | 41,142 |
Computershare Ltd. | 7,275,075 | | 41,108 |
CSL Ltd. | 6,733,245 | | 163,665 |
National Australia Bank Ltd. | 2,188,189 | | 35,487 |
QBE Insurance Group Ltd. | 2,204,978 | | 37,599 |
Westpac Banking Corp. | 240,907 | | 3,304 |
Woolworths Ltd. | 3,270,417 | | 60,934 |
TOTAL AUSTRALIA | | 392,492 |
Belgium - 0.1% |
Hansen Transmission International NV | 6,191,000 | | 10,384 |
Brazil - 0.4% |
BM&F BOVESPA SA | 3,185,693 | | 8,464 |
Vivo Participacoes SA sponsored ADR | 2,046,100 | | 22,384 |
TOTAL BRAZIL | | 30,848 |
Canada - 1.6% |
Canadian Natural Resources Ltd. | 585,000 | | 29,507 |
Niko Resources Ltd. | 498,400 | | 21,824 |
Open Text Corp. (a)(d) | 1,858,400 | | 47,100 |
Petrobank Energy & Resources Ltd. (a) | 813,500 | | 15,517 |
Talisman Energy, Inc. | 1,185,900 | | 11,713 |
Timminco Ltd. (a) | 484,400 | | 2,732 |
TOTAL CANADA | | 128,393 |
Cayman Islands - 0.2% |
China Dongxiang Group Co. Ltd. | 49,139,000 | | 14,456 |
China - 0.3% |
ZTE Corp. (H Shares) | 9,367,280 | | 21,181 |
Cyprus - 0.0% |
Aisi Realty Public Ltd. (a)(e) | 10,023,000 | | 1,469 |
Czech Republic - 0.4% |
Ceske Energeticke Zavody AS | 726,800 | | 31,451 |
Denmark - 1.1% |
Novo Nordisk AS Series B | 1,562,200 | | 83,738 |
Finland - 0.9% |
Nokia Corp. sponsored ADR (d) | 4,627,100 | | 70,239 |
France - 5.7% |
Alstom SA | 1,018,312 | | 50,471 |
AXA SA | 1,784,766 | | 34,096 |
Common Stocks - continued |
| Shares | | Value (000s) |
France - continued |
BNP Paribas SA | 1,261,039 | | $ 91,049 |
Cap Gemini SA | 684,300 | | 22,048 |
CNP Assurances | 218,000 | | 17,566 |
Eutelsat Communications | 2,321,754 | | 49,832 |
GDF Suez | 1,614,778 | | 72,180 |
L'Air Liquide SA | 497,774 | | 42,955 |
LVMH Moet Hennessy - Louis Vuitton | 272,400 | | 18,127 |
Orpea (a)(d) | 560,828 | | 18,246 |
Sechilienne-Sidec | 182,432 | | 7,005 |
Societe Generale Series A | 441,320 | | 24,054 |
TOTAL FRANCE | | 447,629 |
Germany - 11.0% |
Allianz AG (Reg.) | 748,030 | | 55,980 |
Bayer AG | 551,600 | | 30,707 |
Bayer AG sponsored ADR | 237,840 | | 13,131 |
Beiersdorf AG | 90,350 | | 4,790 |
Daimler AG (Reg.) | 340,400 | | 11,771 |
Deutsche Bank AG | 507,100 | | 19,256 |
Deutsche Boerse AG | 267,325 | | 21,375 |
Deutsche Telekom AG (Reg.) | 4,103,000 | | 61,284 |
E.ON AG | 4,453,900 | | 170,392 |
Fresenius Medical Care AG | 808,400 | | 36,766 |
GEA Group AG | 1,773,100 | | 25,912 |
Gerresheimer AG | 1,207,200 | | 42,322 |
Linde AG | 550,793 | | 46,257 |
Muenchener Rueckversicherungs-Gesellschaft AG (Reg.) | 786,000 | | 104,322 |
Q-Cells AG (a)(d) | 365,515 | | 14,379 |
RWE AG | 1,232,900 | | 103,032 |
Siemens AG (Reg.) | 645,600 | | 38,688 |
SolarWorld AG (d) | 804,033 | | 20,264 |
Symrise AG | 1,793,000 | | 22,271 |
Wincor Nixdorf AG | 256,500 | | 11,222 |
TOTAL GERMANY | | 854,121 |
Greece - 0.3% |
Public Power Corp. of Greece | 1,609,345 | | 19,900 |
Hong Kong - 1.1% |
Cheung Kong Holdings Ltd. | 3,875,000 | | 37,206 |
China Unicom (Hong Kong) Ltd. | 13,364,000 | | 19,080 |
Hang Seng Bank Ltd. | 2,361,100 | | 29,460 |
TOTAL HONG KONG | | 85,746 |
Common Stocks - continued |
| Shares | | Value (000s) |
India - 0.8% |
Infosys Technologies Ltd. | 718,452 | | $ 20,942 |
Reliance Industries Ltd. | 409,023 | | 11,627 |
Satyam Computer Services Ltd. | 3,263,566 | | 20,633 |
Titan Industries Ltd. | 390,000 | | 8,175 |
TOTAL INDIA | | 61,377 |
Indonesia - 0.2% |
PT Bumi Resources Tbk | 47,032,000 | | 6,158 |
PT Indosat Tbk | 24,300,500 | | 11,764 |
TOTAL INDONESIA | | 17,922 |
Ireland - 0.3% |
Paddy Power PLC (Ireland) | 1,445,597 | | 24,647 |
Israel - 0.9% |
Nice Systems Ltd. sponsored ADR (a) | 918,700 | | 20,542 |
Teva Pharmaceutical Industries Ltd. sponsored ADR | 1,085,700 | | 46,555 |
TOTAL ISRAEL | | 67,097 |
Italy - 1.7% |
ENI SpA | 3,210,300 | | 76,624 |
Fiat SpA | 3,091,100 | | 24,567 |
Finmeccanica SpA | 788,864 | | 9,651 |
Finmeccanica SpA rights 11/7/08 (a) | 1,232,600 | | 524 |
Prysmian SpA | 1,016,400 | | 12,330 |
UniCredit SpA | 5,114,800 | | 12,515 |
TOTAL ITALY | | 136,211 |
Japan - 13.8% |
Aeon Mall Co. Ltd. | 1,073,500 | | 26,499 |
Asics Corp. | 3,914,000 | | 24,523 |
Canon Marketing Japan, Inc. | 2,296,500 | | 38,417 |
Canon, Inc. | 1,697,450 | | 59,394 |
Daiwa Securities Group, Inc. | 5,423,000 | | 30,658 |
East Japan Railway Co. | 10,753 | | 76,514 |
Konica Minolta Holdings, Inc. | 2,130,500 | | 13,991 |
Matsushita Electric Industrial Co. Ltd. | 4,011,000 | | 64,589 |
Mitsubishi Corp. | 3,196,500 | | 53,577 |
Mitsubishi UFJ Financial Group, Inc. | 16,855,700 | | 105,919 |
Mitsui & Co. Ltd. | 3,040,000 | | 29,455 |
Nintendo Co. Ltd. | 91,250 | | 28,470 |
Nippon Building Fund, Inc. | 2,590 | | 24,886 |
Nippon Telegraph & Telephone Corp. | 12,237 | | 49,933 |
Common Stocks - continued |
| Shares | | Value (000s) |
Japan - continued |
Nomura Holdings, Inc. | 9,963,700 | | $ 94,395 |
Promise Co. Ltd. | 1,379,000 | | 24,751 |
Rakuten, Inc. (d) | 46,965 | | 23,281 |
Ricoh Co. Ltd. | 3,390,000 | | 36,481 |
Seven & I Holdings Co. Ltd. | 1,143,400 | | 32,103 |
Sony Corp. sponsored ADR | 465,300 | | 10,814 |
Sony Financial Holdings, Inc. | 6,285 | | 20,440 |
Sumitomo Mitsui Financial Group, Inc. | 16,438 | | 65,894 |
Tokyo Electron Ltd. | 691,700 | | 23,063 |
Toyota Motor Corp. | 2,939,300 | | 114,777 |
TOTAL JAPAN | | 1,072,824 |
Korea (South) - 0.9% |
LG Household & Health Care Ltd. | 207,070 | | 29,672 |
NHN Corp. (a) | 346,842 | | 37,026 |
TOTAL KOREA (SOUTH) | | 66,698 |
Luxembourg - 0.6% |
Reinet Investments SCA (a) | 29,552 | | 308 |
Reinet Investments SCA (a) | 186,332 | | 3,618 |
SES SA (A Shares) FDR unit | 2,399,068 | | 41,107 |
TOTAL LUXEMBOURG | | 45,033 |
Malaysia - 0.1% |
KNM Group Bhd | 32,198,300 | | 5,460 |
Mexico - 0.5% |
America Movil SAB de CV Series L sponsored ADR | 1,262,200 | | 39,052 |
Netherlands - 1.5% |
AMG Advanced Metallurgical Group NV (a)(d) | 585,100 | | 9,471 |
ASML Holding NV (Netherlands) | 485,800 | | 8,505 |
Gemalto NV (a) | 331,217 | | 9,280 |
Koninklijke KPN NV | 6,660,700 | | 93,804 |
TOTAL NETHERLANDS | | 121,060 |
Norway - 0.2% |
Pronova BioPharma ASA | 4,726,590 | | 12,279 |
Papua New Guinea - 0.3% |
Oil Search Ltd. | 6,566,347 | | 19,883 |
Russia - 0.4% |
OAO Gazprom sponsored ADR | 1,657,700 | | 33,900 |
Singapore - 0.1% |
Singapore Exchange Ltd. | 2,172,000 | | 7,775 |
Common Stocks - continued |
| Shares | | Value (000s) |
Spain - 3.9% |
Banco Santander SA | 3,311,500 | | $ 35,814 |
Grifols SA | 3,624,108 | | 72,123 |
Red Electrica Corporacion SA | 628,000 | | 27,526 |
Repsol YPF SA | 1,089,200 | | 20,712 |
Telefonica SA | 8,021,700 | | 148,521 |
TOTAL SPAIN | | 304,696 |
Sweden - 0.1% |
Modern Times Group MTG AB (B Shares) | 540,150 | | 11,588 |
Switzerland - 12.5% |
Actelion Ltd. (Reg.) (a) | 1,419,010 | | 74,947 |
BB BIOTECH AG | 354,261 | | 22,463 |
Credit Suisse Group (Reg.) | 1,149,050 | | 42,958 |
EFG International | 1,978,630 | | 42,586 |
Julius Baer Holding AG | 488,128 | | 19,087 |
Nestle SA (Reg.) | 6,009,533 | | 233,639 |
Novartis AG: | | | |
(Reg.) | 1,609,626 | | 81,684 |
sponsored ADR | 994,500 | | 50,710 |
Roche Holding AG (participation certificate) | 1,115,576 | | 170,565 |
SGS Societe Generale de Surveillance Holding SA (Reg.) | 25,313 | | 24,916 |
Sonova Holding AG | 574,683 | | 23,873 |
Syngenta AG (Switzerland) | 426,660 | | 79,740 |
Tecan Group AG | 212,300 | | 9,529 |
The Swatch Group AG (Bearer) | 75,432 | | 11,768 |
UBS AG (For. Reg.) | 516,022 | | 8,754 |
Zurich Financial Services AG (Reg.) | 389,534 | | 79,011 |
TOTAL SWITZERLAND | | 976,230 |
Thailand - 0.1% |
Total Access Communication PCL unit | 14,109,900 | | 10,085 |
United Kingdom - 22.5% |
AstraZeneca PLC (United Kingdom) | 1,559,200 | | 66,068 |
Autonomy Corp. PLC (a) | 1,365,900 | | 21,655 |
BAE Systems PLC | 8,539,409 | | 47,994 |
Barclays PLC | 3,933,200 | | 11,273 |
BG Group PLC | 2,944,100 | | 43,285 |
BG Group PLC sponsored ADR | 207,400 | | 15,534 |
BHP Billiton PLC | 6,691,800 | | 113,616 |
BP PLC | 6,979,400 | | 56,885 |
British American Tobacco PLC: | | | |
(United Kingdom) | 3,175,400 | | 87,088 |
Common Stocks - continued |
| Shares | | Value (000s) |
United Kingdom - continued |
British American Tobacco PLC: - continued | | | |
sponsored ADR | 404,500 | | $ 21,989 |
Capita Group PLC | 4,290,793 | | 44,331 |
Compass Group PLC | 4,055,000 | | 18,854 |
Diageo PLC | 1,514,500 | | 23,109 |
GlaxoSmithKline PLC sponsored ADR | 1,381,600 | | 53,468 |
HSBC Holdings PLC: | | | |
(Hong Kong) (Reg.) | 3,704,844 | | 44,100 |
(United Kingdom) (Reg.) | 12,259,500 | | 145,186 |
Imperial Tobacco Group PLC | 1,644,800 | | 44,078 |
Informa PLC | 7,983,600 | | 27,045 |
Man Group PLC | 10,947,800 | | 63,199 |
Misys PLC | 7,892,600 | | 14,131 |
Prudential PLC | 6,511,200 | | 32,704 |
Reckitt Benckiser Group PLC | 2,636,700 | | 111,518 |
Rio Tinto PLC (Reg.) | 1,712,500 | | 79,985 |
Royal Bank of Scotland Group PLC | 10,165,495 | | 11,196 |
Royal Dutch Shell PLC Class B | 7,883,059 | | 213,697 |
Shire PLC | 1,814,400 | | 23,859 |
SSL International PLC | 6,429,705 | | 43,420 |
Standard Chartered PLC (United Kingdom) | 990,000 | | 16,360 |
Unilever PLC | 3,552,700 | | 79,805 |
Vodafone Group PLC | 80,550,435 | | 154,937 |
William Morrison Supermarkets PLC | 6,595,100 | | 28,078 |
TOTAL UNITED KINGDOM | | 1,758,447 |
United States of America - 1.2% |
Macquarie Infrastructure Co. LLC | 131,000 | | 1,330 |
Philip Morris International, Inc. | 1,529,600 | | 66,492 |
Visa, Inc. | 440,500 | | 24,382 |
TOTAL UNITED STATES OF AMERICA | | 92,204 |
TOTAL COMMON STOCKS (Cost $9,659,419) | 7,076,515 |
Nonconvertible Preferred Stocks - 1.4% |
| | | |
Germany - 1.1% |
Fresenius AG (non-vtg.) | 1,371,100 | | 88,425 |
Nonconvertible Preferred Stocks - continued |
| Shares | | Value (000s) |
Italy - 0.3% |
Intesa Sanpaolo SpA | 6,761,102 | | $ 20,068 |
TOTAL NONCONVERTIBLE PREFERRED STOCKS (Cost $135,122) | 108,493 |
Government Obligations - 0.3% |
| Principal Amount (000s) | | |
United States of America - 0.3% |
U.S. Treasury Bills, yield at date of purchase 0.33% to 1.72% 12/4/08 to 1/29/09 (f)
(Cost $20,322) | | $ 20,350 | | 20,341 |
Money Market Funds - 8.5% |
| Shares | | |
Fidelity Cash Central Fund, 1.81% (b) | 645,326,349 | | 645,326 |
Fidelity Securities Lending Cash Central Fund, 2.67% (b)(c) | 20,061,695 | | 20,062 |
TOTAL MONEY MARKET FUNDS (Cost $665,388) | 665,388 |
TOTAL INVESTMENT PORTFOLIO - 100.9% (Cost $10,480,251) | | 7,870,737 |
NET OTHER ASSETS - (0.9)% | | (73,080) |
NET ASSETS - 100% | $ 7,797,657 |
Futures Contracts |
| Expiration Date | | Underlying Face Amount at Value
(000s) | | Unrealized Appreciation/
(Depreciation) (000s) |
Purchased |
Equity Index Contracts |
1,759 CME Nikkei 225 Index Contracts (Japan) | Dec. 2008 | | $ 78,583 | | $ (28,790) |
1,070 TOPIX 150 Index Contracts (Japan) | Dec. 2008 | | 92,755 | | (36,491) |
TOTAL EQUITY INDEX CONTRACTS | | $ 171,338 | | $ (65,281) |
|
The face value of futures purchased as a percentage of net assets - 2.2% |
Legend |
(a) Non-income producing |
(b) Affiliated fund that is available only to investment companies and other accounts managed by Fidelity Investments. The rate quoted is the annualized seven-day yield of the fund at period end. A complete unaudited listing of the fund's holdings as of its most recent quarter end is available upon request. |
(c) Investment made with cash collateral received from securities on loan. |
(d) Security or a portion of the security is on loan at period end. |
(e) Affiliated company |
(f) Security or a portion of the security was pledged to cover margin requirements for futures contracts. At the period end, the value of securities pledged amounted to $20,341,000. |
Affiliated Central Funds |
Information regarding fiscal year to date income earned by the Fund from investments in Fidelity Central Funds is as follows: |
Fund | Income earned
(Amounts in thousands) |
Fidelity Cash Central Fund | $ 24,831 |
Fidelity Securities Lending Cash Central Fund | 11,130 |
Total | $ 35,961 |
Other Affiliated Issuers |
An affiliated company is a company in which the fund has ownership of at least 5% of the voting securities. Fiscal year to date transactions with companies which are or were affiliates are as follows: |
Affiliates
(Amounts in thousands) | Value, beginning of period | Purchases | Sales Proceeds | Dividend Income | Value,
end of
period |
Aisi Realty Public Ltd. | $ 8,752 | $ - | $ - | $ - | $ 1,469 |
Renovo Group PLC | 42,523 | - | 6,236 | - | - |
Total | $ 51,275 | $ - | $ 6,236 | $ - | $ 1,469 |
Income Tax Information
At October 31, 2008, the fund had a capital loss carryforward of approximately $637,482,000 all of which will expire on October 31, 2016. |
See accompanying notes which are an integral part of the financial statements.
Annual Report
Statement of Assets and Liabilities
Amounts in thousands (except per-share amounts) | October 31, 2008 |
| | |
Assets | | |
Investment in securities, at value (including securities loaned of $19,297) - See accompanying schedule: Unaffiliated issuers (cost $9,808,248) | $ 7,203,880 | |
Fidelity Central Funds (cost $665,388) | 665,388 | |
Other affiliated issuers (cost $6,615) | 1,469 | |
Total Investments (cost $10,480,251) | | $ 7,870,737 |
Foreign currency held at value (cost $5,841) | | 5,690 |
Receivable for investments sold | | 66,423 |
Receivable for fund shares sold | | 14,159 |
Dividends receivable | | 25,197 |
Distributions receivable from Fidelity Central Funds | | 856 |
Other receivables | | 1,128 |
Total assets | | 7,984,190 |
| | |
Liabilities | | |
Payable for investments purchased | $ 141,169 | |
Payable for fund shares redeemed | 9,351 | |
Accrued management fee | 5,296 | |
Distribution fees payable | 155 | |
Payable for daily variation on futures contracts | 7,529 | |
Other affiliated payables | 2,276 | |
Other payables and accrued expenses | 695 | |
Collateral on securities loaned, at value | 20,062 | |
Total liabilities | | 186,533 |
| | |
Net Assets | | $ 7,797,657 |
Net Assets consist of: | | |
Paid in capital | | $ 10,988,479 |
Undistributed net investment income | | 120,184 |
Accumulated undistributed net realized gain (loss) on investments and foreign currency transactions | | (636,064) |
Net unrealized appreciation (depreciation) on investments and assets and liabilities in foreign currencies | | (2,674,942) |
Net Assets | | $ 7,797,657 |
See accompanying notes which are an integral part of the financial statements.
Annual Report
Statement of Assets and Liabilities - continued
Amounts in thousands (except per-share amounts) | October 31, 2008 |
| | |
Calculation of Maximum Offering Price
Class A:
Net Asset Value and redemption price per share ($379,564 ÷ 16,031.5 shares) | | $ 23.68 |
| | |
Maximum offering price per share (100/94.25 of $23.68) | | $ 25.12 |
Class T:
Net Asset Value and redemption price per share ($63,690 ÷ 2,711.8 shares) | | $ 23.49 |
| | |
Maximum offering price per share (100/96.50 of $23.49) | | $ 24.34 |
Class B:
Net Asset Value and offering price per share ($14,961 ÷ 643.5 shares) A | | $ 23.25 |
| | |
Class C:
Net Asset Value and offering price per share ($36,410 ÷ 1,562.3 shares) A | | $ 23.31 |
| | |
| | |
International Discovery:
Net Asset Value, offering price and redemption price per share ($6,998,759 ÷ 293,060.0 shares) | | $ 23.88 |
| | |
Class K:
Net Asset Value, offering price and redemption price per share ($145,192 ÷ 6,074.3 shares) | | $ 23.90 |
| | |
Institutional Class:
Net Asset Value, offering price and redemption price per share ($159,081 ÷ 6,654.3 shares) | | $ 23.91 |
A Redemption price per share is equal to net asset value less any applicable contingent deferred sales charge.
See accompanying notes which are an integral part of the financial statements.
Annual Report
Financial Statements - continued
Statement of Operations
Amounts in thousands | Year ended October 31, 2008 |
| | |
Investment Income | | |
Dividends | | $ 318,308 |
Interest | | 161 |
Income from Fidelity Central Funds | | 35,961 |
| | 354,430 |
Less foreign taxes withheld | | (27,021) |
Total income | | 327,409 |
| | |
Expenses | | |
Management fee
Basic fee | $ 90,977 | |
Performance adjustment | 13,226 | |
Transfer agent fees | 28,436 | |
Distribution fees | 2,431 | |
Accounting and security lending fees | 1,917 | |
Custodian fees and expenses | 2,341 | |
Independent trustees' compensation | 56 | |
Registration fees | 466 | |
Audit | 115 | |
Legal | 65 | |
Miscellaneous | 1,638 | |
Total expenses before reductions | 141,668 | |
Expense reductions | (5,009) | 136,659 |
Net investment income (loss) | | 190,750 |
Realized and Unrealized Gain (Loss) Net realized gain (loss) on: | | |
Investment securities: | | |
Unaffiliated issuers (net of foreign taxes of $366) | (569,251) | |
Other affiliated issuers | (20,894) | |
Foreign currency transactions | (36,433) | |
Futures contracts | (37,990) | |
Total net realized gain (loss) | | (664,568) |
Change in net unrealized appreciation (depreciation) on: Investment securities (net of decrease in deferred foreign taxes of $4,165) | (6,819,805) | |
Assets and liabilities in foreign currencies | (192) | |
Futures contracts | (68,439) | |
Total change in net unrealized appreciation (depreciation) | | (6,888,436) |
Net gain (loss) | | (7,553,004) |
Net increase (decrease) in net assets resulting from operations | | $ (7,362,254) |
See accompanying notes which are an integral part of the financial statements.
Annual Report
Statement of Changes in Net Assets
Amounts in thousands | Year ended
October 31,
2008 | Year ended
October 31,
2007 |
Increase (Decrease) in Net Assets | | |
Operations | | |
Net investment income (loss) | $ 190,750 | $ 144,458 |
Net realized gain (loss) | (664,568) | 608,100 |
Change in net unrealized appreciation (depreciation) | (6,888,436) | 2,677,967 |
Net increase (decrease) in net assets resulting
from operations | (7,362,254) | 3,430,525 |
Distributions to shareholders from net investment income | (129,574) | (85,862) |
Distributions to shareholders from net realized gain | (528,706) | (224,325) |
Total distributions | (658,280) | (310,187) |
Share transactions - net increase (decrease) | 1,069,130 | 3,385,409 |
Redemption fees | 709 | 502 |
Total increase (decrease) in net assets | (6,950,695) | 6,506,249 |
| | |
Net Assets | | |
Beginning of period | 14,748,352 | 8,242,103 |
End of period (including undistributed net investment income of $120,184 and undistributed net investment income of $137,292, respectively) | $ 7,797,657 | $ 14,748,352 |
See accompanying notes which are an integral part of the financial statements.
Annual Report
Financial Highlights - Class A
Years ended October 31, | 2008 | 2007 | 2006 | 2005 H |
Selected Per-Share Data | | | |
Net asset value, beginning of period | $ 47.34 | $ 36.47 | $ 30.57 | $ 27.41 |
Income from Investment
Operations | | | | |
Net investment income (loss) E | .46 | .44 | .42 | .28 |
Net realized and unrealized gain (loss) | (22.08) | 11.76 | 7.19 | 2.88 |
Total from investment operations | (21.62) | 12.20 | 7.61 | 3.16 |
Distributions from net investment income | (.37) | (.35) | (.31) | - |
Distributions from net realized gain | (1.67) | (.98) | (1.40) | - |
Total distributions | (2.04) | (1.33) | (1.71) | - |
Redemption fees added to paid in capital E,J | - | - | - | - |
Net asset value, end of period | $ 23.68 | $ 47.34 | $ 36.47 | $ 30.57 |
Total Return B,C,D | (47.65)% | 34.54% | 26.01% | 11.53% |
Ratios to Average Net Assets F,I | | | |
Expenses before reductions | 1.32% | 1.25% | 1.27% | 1.42% A |
Expenses net of fee waivers, if any | 1.32% | 1.25% | 1.27% | 1.42% A |
Expenses net of all reductions | 1.29% | 1.22% | 1.21% | 1.36% A |
Net investment income (loss) | 1.27% | 1.08% | 1.22% | 1.15% A |
Supplemental Data | | | |
Net assets, end of period (in millions) | $ 380 | $ 417 | $ 140 | $ 2 |
Portfolio turnover rate G | 79% | 56% | 56% | 75% |
A Annualized
B Total returns for periods of less than one year are not annualized.
C Total returns would have been lower had certain expenses not been reduced during the periods shown.
D Total returns do not include the effect of the sales charges.
E Calculated based on average shares outstanding during the period.
F Fees and expenses of the underlying Fidelity Central Funds are not included in the Fund's expense ratio. The Fund indirectly bears its proportionate share of the expenses of any underlying Fidelity Central Funds.
G Amount does not include the portfolio activity of any underlying Fidelity Central Funds.
H For the period January 6, 2005 (commencement of sale of shares) to October 31, 2005.
I Expense ratios reflect operating expenses of the class. Expenses before reductions do not reflect amounts reimbursed by the investment adviser or reductions from brokerage service arrangements or other expense offset arrangements and do not represent the amount paid by the class during periods when reimbursements or reductions occur. Expense ratios before reductions for start-up periods may not be representative of longer-term operating periods. Expenses net of fee waivers reflect expenses after reimbursement by the investment adviser but prior to reductions from brokerage service arrangements or other expense offset arrangements. Expenses net of all reductions represent the net expenses paid by the class.
J Amount represents less than $.01 per share.
See accompanying notes which are an integral part of the financial statements.
Annual Report
Financial Highlights - Class T
Years ended October 31, | 2008 | 2007 | 2006 | 2005 H |
Selected Per-Share Data | | | |
Net asset value, beginning of period | $ 47.06 | $ 36.30 | $ 30.49 | $ 27.41 |
Income from Investment
Operations | | | | |
Net investment income (loss) E | .33 | .29 | .27 | .20 |
Net realized and unrealized gain (loss) | (21.94) | 11.71 | 7.18 | 2.88 |
Total from investment operations | (21.61) | 12.00 | 7.45 | 3.08 |
Distributions from net investment income | (.29) | (.26) | (.24) | - |
Distributions from net realized gain | (1.67) | (.98) | (1.40) | - |
Total distributions | (1.96) | (1.24) | (1.64) | - |
Redemption fees added to paid in capital E,J | - | - | - | - |
Net asset value, end of period | $ 23.49 | $ 47.06 | $ 36.30 | $ 30.49 |
Total Return B,C,D | (47.84)% | 34.08% | 25.49% | 11.24% |
Ratios to Average Net Assets F,I | | | |
Expenses before reductions | 1.68% | 1.63% | 1.71% | 1.75% A |
Expenses net of fee waivers, if any | 1.68% | 1.63% | 1.71% | 1.75% A |
Expenses net of all reductions | 1.64% | 1.60% | 1.65% | 1.69% A |
Net investment income (loss) | .91% | .70% | .78% | .83% A |
Supplemental Data | | | |
Net assets, end of period (in millions) | $ 64 | $ 53 | $ 10 | $ 2 |
Portfolio turnover rate G | 79% | 56% | 56% | 75% |
A Annualized
B Total returns for periods of less than one year are not annualized.
C Total returns would have been lower had certain expenses not been reduced during the periods shown.
D Total returns do not include the effect of the sales charges.
E Calculated based on average shares outstanding during the period.
F Fees and expenses of the underlying Fidelity Central Funds are not included in the Fund's expense ratio. The Fund indirectly bears its proportionate share of the expenses of any underlying Fidelity Central Funds.
G Amount does not include the portfolio activity of any underlying Fidelity Central Funds.
H For the period January 6, 2005 (commencement of sale of shares) to October 31, 2005.
I Expense ratios reflect operating expenses of the class. Expenses before reductions do not reflect amounts reimbursed by the investment adviser or reductions from brokerage service arrangements or other expense offset arrangements and do not represent the amount paid by the class during periods when reimbursements or reductions occur. Expense ratios before reductions for start-up periods may not be representative of longer-term operating periods. Expenses net of fee waivers reflect expenses after reimbursement by the investment adviser but prior to reductions from brokerage service arrangements or other expense offset arrangements. Expenses net of all reductions represent the net expenses paid by the class.
J Amount represents less than $.01 per share.
See accompanying notes which are an integral part of the financial statements.
Annual Report
Financial Highlights - Class B
Years ended October 31, | 2008 | 2007 | 2006 | 2005 H |
Selected Per-Share Data | | | | |
Net asset value, beginning of period | $ 46.70 | $ 36.12 | $ 30.36 | $ 27.41 |
Income from Investment
Operations | | | | |
Net investment income (loss) E | .15 | .08 | .08 | .08 |
Net realized and unrealized gain (loss) | (21.77) | 11.64 | 7.19 | 2.87 |
Total from investment operations | (21.62) | 11.72 | 7.27 | 2.95 |
Distributions from net investment income | (.16) | (.16) | (.11) | - |
Distributions from net realized gain | (1.67) | (.98) | (1.40) | - |
Total distributions | (1.83) | (1.14) | (1.51) | - |
Redemption fees added to paid in capital E,J | - | - | - | - |
Net asset value, end of period | $ 23.25 | $ 46.70 | $ 36.12 | $ 30.36 |
Total Return B,C,D | (48.11)% | 33.37% | 24.91% | 10.76% |
Ratios to Average Net Assets F,I | | | | |
Expenses before reductions | 2.19% | 2.14% | 2.27% | 2.24% A |
Expenses net of fee waivers, if any | 2.19% | 2.14% | 2.25% | 2.24% A |
Expenses net of all reductions | 2.15% | 2.10% | 2.19% | 2.18% A |
Net investment income (loss) | .40% | .19% | .24% | .33% A |
Supplemental Data | | | | |
Net assets, end of period (in millions) | $ 15 | $ 17 | $ 4 | $ 1 |
Portfolio turnover rate G | 79% | 56% | 56% | 75% |
A Annualized
B Total returns for periods of less than one year are not annualized.
C Total returns would have been lower had certain expenses not been reduced during the periods shown.
D Total returns do not include the effect of the contingent deferred sales charge.
E Calculated based on average shares outstanding during the period.
F Fees and expenses of the underlying Fidelity Central Funds are not included in the Fund's expense ratio. The Fund indirectly bears its proportionate share of the expenses of any underlying Fidelity Central Funds.
G Amount does not include the portfolio activity of any underlying Fidelity Central Funds.
H For the period January 6, 2005 (commencement of sale of shares) to October 31, 2005.
I Expense ratios reflect operating expenses of the class. Expenses before reductions do not reflect amounts reimbursed by the investment adviser or reductions from brokerage service arrangements or other expense offset arrangements and do not represent the amount paid by the class during periods when reimbursements or reductions occur. Expense ratios before reductions for start-up periods may not be representative of longer-term operating periods. Expenses net of fee waivers reflect expenses after reimbursement by the investment adviser but prior to reductions from brokerage service arrangements or other expense offset arrangements. Expenses net of all reductions represent the net expenses paid by the class.
J Amount represents less than $.01 per share.
See accompanying notes which are an integral part of the financial statements.
Annual Report
Financial Highlights - Class C
Years ended October 31, | 2008 | 2007 | 2006 | 2005 H |
Selected Per-Share Data | | | |
Net asset value, beginning of period | $ 46.82 | $ 36.19 | $ 30.41 | $ 27.41 |
Income from Investment
Operations | | | | |
Net investment income (loss) E | .15 | .09 | .11 | .13 |
Net realized and unrealized gain (loss) | (21.82) | 11.66 | 7.19 | 2.87 |
Total from investment operations | (21.67) | 11.75 | 7.30 | 3.00 |
Distributions from net investment income | (.17) | (.14) | (.12) | - |
Distributions from net realized gain | (1.67) | (.98) | (1.40) | - |
Total distributions | (1.84) | (1.12) | (1.52) | - |
Redemption fees added to paid in capital E,J | - | - | - | - |
Net asset value, end of period | $ 23.31 | $ 46.82 | $ 36.19 | $ 30.41 |
Total Return B,C,D | (48.10)% | 33.38% | 24.97% | 10.94% |
Ratios to Average Net Assets F,I | | | | |
Expenses before reductions | 2.17% | 2.11% | 2.16% | 2.04% A |
Expenses net of fee waivers, if any | 2.17% | 2.11% | 2.16% | 2.04% A |
Expenses net of all reductions | 2.13% | 2.08% | 2.11% | 1.98% A |
Net investment income (loss) | .42% | .22% | .33% | .53% A |
Supplemental Data | | | |
Net assets, end of period (in millions) | $ 36 | $ 28 | $ 6 | $ 2 |
Portfolio turnover rate G | 79% | 56% | 56% | 75% |
A Annualized
B Total returns for periods of less than one year are not annualized.
C Total returns would have been lower had certain expenses not been reduced during the periods shown.
D Total returns do not include the effect of the contingent deferred sales charge.
E Calculated based on average shares outstanding during the period.
F Fees and expenses of the underlying Fidelity Central Funds are not included in the Fund's expense ratio. The Fund indirectly bears its proportionate share of the expenses of any underlying Fidelity Central Funds.
G Amount does not include the portfolio activity of any underlying Fidelity Central Funds.
H For the period January 6, 2005 (commencement of sale of shares) to October 31, 2005.
I Expense ratios reflect operating expenses of the class. Expenses before reductions do not reflect amounts reimbursed by the investment adviser or reductions from brokerage service arrangements or other expense offset arrangements and do not represent the amount paid by the class during periods when reimbursements or reductions occur. Expense ratios before reductions for start-up periods may not be representative of longer-term operating periods. Expenses net of fee waivers reflect expenses after reimbursement by the investment adviser but prior to reductions from brokerage service arrangements or other expense offset arrangements. Expenses net of all reductions represent the net expenses paid by the class.
J Amount represents less than $.01 per share.
See accompanying notes which are an integral part of the financial statements.
Annual Report
Financial Highlights - International Discovery
Years ended October 31, | 2008 | 2007 | 2006 | 2005 | 2004 |
Selected Per-Share Data | | | | | |
Net asset value, beginning of period | $ 47.68 | $ 36.67 | $ 30.65 | $ 25.31 | $ 21.87 |
Income from Investment Operations | | | | | |
Net investment income (loss) B | .57 | .53 | .48 | .37 | .22 |
Net realized and unrealized gain (loss) | (22.29) | 11.84 | 7.25 | 5.24 | 3.40 |
Total from investment operations | (21.72) | 12.37 | 7.73 | 5.61 | 3.62 |
Distributions from net investment income | (.41) | (.38) | (.31) | (.15) | (.18) |
Distributions from net realized gain | (1.67) | (.98) | (1.40) | (.12) | - |
Total distributions | (2.08) | (1.36) | (1.71) | (.27) | (.18) |
Redemption fees added to paid in capital B,F | - | - | - | - | - |
Net asset value, end of period | $ 23.88 | $ 47.68 | $ 36.67 | $ 30.65 | $ 25.31 |
Total Return A | (47.55)% | 34.85% | 26.34% | 22.29% | 16.65% |
Ratios to Average Net Assets C,E | | | | | |
Expenses before reductions | 1.09% | 1.04% | 1.09% | 1.08% | 1.10% |
Expenses net of fee waivers, if any | 1.09% | 1.04% | 1.08% | 1.07% | 1.10% |
Expenses net of all reductions | 1.05% | 1.00% | 1.03% | 1.01% | 1.06% |
Net investment income (loss) | 1.51% | 1.30% | 1.41% | 1.35% | .92% |
Supplemental Data | | | | | |
Net assets, end of period (in millions) | $ 6,999 | $ 14,176 | $ 8,054 | $ 3,949 | $ 2,193 |
Portfolio turnover rate D | 79% | 56% | 56% | 75% | 87% |
A Total returns would have been lower had certain expenses not been reduced during the periods shown.
B Calculated based on average shares outstanding during the period.
C Fees and expenses of the underlying Fidelity Central Funds are not included in the Fund's expense ratio. The Fund indirectly bears its proportionate share of the expenses of any underlying Fidelity Central Funds.
D Amount does not include the portfolio activity of any underlying Fidelity Central Funds.
E Expense ratios reflect operating expenses of the class. Expenses before reductions do not reflect amounts reimbursed by the investment adviser or reductions from brokerage service arrangements or other expense offset arrangements and do not represent the amount paid by the class during periods when reimbursements or reductions occur. Expenses net of fee waivers reflect expenses after reimbursement by the investment adviser but prior to reductions from brokerage service arrangements or other expense offset arrangements. Expenses net of all reductions represent the net expenses paid by the class.
F Amount represents less than $.01 per share.
See accompanying notes which are an integral part of the financial statements.
Annual Report
Financial Highlights - Class K
Year ended October 31, | 2008 G |
Selected Per-Share Data | |
Net asset value, beginning of period | $ 40.32 |
Income from Investment Operations | |
Net investment income (loss) D | .10 |
Net realized and unrealized gain (loss) | (16.52) |
Total from investment operations | (16.42) |
Redemption fees added to paid in capital D,I | - |
Net asset value, end of period | $ 23.90 |
Total Return B,C | (40.72)% |
Ratios to Average Net Assets E,H | |
Expenses before reductions | .93% A |
Expenses net of fee waivers, if any | .93% A |
Expenses net of all reductions | .89% A |
Net investment income (loss) | .83% A |
Supplemental Data | |
Net assets, end of period (in millions) | $ 145 |
Portfolio turnover rate F | 79% |
A Annualized
B Total returns for periods of less than one year are not annualized.
C Total returns would have been lower had certain expenses not been reduced during the periods shown.
D Calculated based on average shares outstanding during the period.
E Fees and expenses of the underlying Fidelity Central Funds are not included in the Fund's expense ratio. The Fund indirectly bears its proportionate share of the expenses of any underlying Fidelity Central Funds.
F Amount does not include the portfolio activity of any underlying Fidelity Central Funds.
G For the period May 9, 2008 (commencement of sale of shares) to October 31, 2008.
H Expense ratios reflect operating expenses of the class. Expenses before reductions do not reflect amounts reimbursed by the investment adviser or reductions from brokerage service arrangements or other expense offset arrangements and do not represent the amount paid by the class during periods when reimbursements or reductions occur. Expense ratios before reductions for start-up periods may not be representative of longer-term operating periods. Expenses net of fee waivers reflect expenses after reimbursement by the investment adviser but prior to reductions from brokerage service arrangements or other expense offset arrangements. Expenses net of all reductions represent the net expenses paid by the class.
I Amount represents less than $.01 per share.
See accompanying notes which are an integral part of the financial statements.
Annual Report
Financial Highlights - Institutional Class
Years ended October 31, | 2008 | 2007 | 2006 | 2005 G |
Selected Per-Share Data | | | | |
Net asset value, beginning of period | $ 47.73 | $ 36.71 | $ 30.68 | $ 27.41 |
Income from Investment
Operations | | | | |
Net investment income (loss) D | .53 | .55 | .51 | .38 |
Net realized and unrealized gain (loss) | (22.24) | 11.85 | 7.25 | 2.89 |
Total from investment operations | (21.71) | 12.40 | 7.76 | 3.27 |
Distributions from net investment income | (.44) | (.40) | (.33) | - |
Distributions from net realized gain | (1.67) | (.98) | (1.40) | - |
Total distributions | (2.11) | (1.38) | (1.73) | - |
Redemption fees added to paid in capital D,I | - | - | - | - |
Net asset value, end of period | $ 23.91 | $ 47.73 | $ 36.71 | $ 30.68 |
Total Return B,C | (47.51)% | 34.93% | 26.45% | 11.93% |
Ratios to Average Net Assets E,H | | | | |
Expenses before reductions | 1.05% | .97% | 1.00% | .97% A |
Expenses net of fee waivers, if any | 1.05% | .97% | 1.00% | .97% A |
Expenses net of all reductions | 1.01% | .94% | .95% | .90% A |
Net investment income (loss) | 1.54% | 1.36% | 1.49% | 1.60% A |
Supplemental Data | | | | |
Net assets, end of period (in millions) | $ 159 | $ 58 | $ 28 | $ 10 |
Portfolio turnover rate F | 79% | 56% | 56% | 75% |
A Annualized
B Total returns for periods of less than one year are not annualized.
C Total returns would have been lower had certain expenses not been reduced during the periods shown.
D Calculated based on average shares outstanding during the period.
E Fees and expenses of the underlying Fidelity Central Funds are not included in the Fund's expense ratio. The Fund indirectly bears its proportionate share of the expenses of any underlying Fidelity Central Funds.
F Amount does not include the portfolio activity of any underlying Fidelity Central Funds.
G For the period January 6, 2005 (commencement of sale of shares) to October 31, 2005.
H Expense ratios reflect operating expenses of the class. Expenses before reductions do not reflect amounts reimbursed by the investment adviser or reductions from brokerage service arrangements or other expense offset arrangements and do not represent the amount paid by the class during periods when reimbursements or reductions occur. Expense ratios before reductions for start-up periods may not be representative of longer-term operating periods. Expenses net of fee waivers reflect expenses after reimbursement by the investment adviser but prior to reductions from brokerage service arrangements or other expense offset arrangements. Expenses net of all reductions represent the net expenses paid by the class.
I Amount represents less than $.01 per share.
See accompanying notes which are an integral part of the financial statements.
Annual Report
Notes to Financial Statements
For the period ended October 31, 2008
(Amounts in thousands except ratios)
1. Organization.
Fidelity International Discovery Fund (the Fund) is a fund of Fidelity Investment Trust (the trust) and is authorized to issue an unlimited number of shares. The trust is registered under the Investment Company Act of 1940, as amended (the 1940 Act), as an open-end management investment company organized as a Massachusetts business trust. On January 17, 2008, the Board of Trustees of the Fund approved the creation of an additional class of shares. The Fund commenced sale of Class K shares on May 9, 2008. The Fund offers Class A, Class T, Class B, Class C, International Discovery, Class K and Institutional Class shares, each of which has equal rights as to assets and voting privileges. Each class has exclusive voting rights with respect to matters that affect that class. Class B shares will automatically convert to Class A shares after a holding period of seven years from the initial date of purchase. Investment income, realized and unrealized capital gains and losses, the common expenses of the Fund, and certain fund-level expense reductions, if any, are allocated on a pro-rata basis to each class based on the relative net assets of each class to the total net assets of the Fund. Each class differs with respect to transfer agent and distribution and service plan fees incurred. Certain expense reductions also differ by class. The Fund's investments in emerging markets can be subject to social, economic, regulatory, and political uncertainties and can be extremely volatile.
2. Investments in Fidelity Central Funds.
The Fund may invest in Fidelity Central Funds, which are open-end investment companies available only to other investment companies and accounts managed by Fidelity Management & Research Company (FMR) and its affiliates. The Fund's Schedule of Investments lists each of the Fidelity Central Funds held as of period end, if any, as an investment of the Fund, but does not include the underlying holdings of each Fidelity Central Fund. As an Investing Fund, the Fund indirectly bears its proportionate share of the expenses of the underlying Fidelity Central Funds.
The Money Market Central Funds seek preservation of capital and current income and are managed by Fidelity Investments Money Management, Inc. (FIMM), an affiliate of FMR.
A complete unaudited list of holdings for each Fidelity Central Fund is available upon request or at the SEC's web site at www.sec.gov. In addition, the financial statements of the Fidelity Central Funds, which are not covered by the Fund's Report of Independent Registered Public Accounting Firm, are available on the SEC's web site or upon request.
3. Significant Accounting Policies.
The financial statements have been prepared in conformity with accounting principles generally accepted in the United States of America, which require management to make
Annual Report
3. Significant Accounting Policies - continued
certain estimates and assumptions at the date of the financial statements. Actual results could differ from those estimates. The following summarizes the significant accounting policies of the Fund:
Security Valuation. Investments are valued as of 4:00 p.m. Eastern time on the last calendar day of the period. Wherever possible, the Fund uses independent pricing services approved by the Board of Trustees to value its investments.
Equity securities, including restricted securities, for which market quotations are readily available, are valued at the last reported sale price or official closing price as reported by an independent pricing service on the primary market or exchange on which they are traded. In the event there were no sales during the day or closing prices are not available, securities are valued at the last quoted bid price. Futures contracts are valued at the settlement price established each day by the board of trade or exchange on which they are traded. Investments in open-end mutual funds, including the Fidelity Central Funds, are valued at their closing net asset value each business day. Short-term securities with remaining maturities of sixty days or less for which quotations are not readily available are valued at amortized cost, which approximates value.
When current market prices or quotations are not readily available or reliable, valuations may be determined in good faith in accordance with procedures adopted by the Board of Trustees. Factors used in determining value may include significant market or security specific events, changes in interest rates and credit quality, and developments in foreign markets which are monitored by evaluating the performance of ADRs, futures contracts and exchange-traded funds. The frequency with which these procedures are used cannot be predicted and may be utilized to a significant extent. The value of securities used for net asset value (NAV) calculation under these procedures may differ from published prices for the same securities.
Foreign Currency. The Fund uses foreign currency contracts to facilitate transactions in foreign-denominated securities. Losses from these transactions may arise from changes in the value of the foreign currency or if the counterparties do not perform under the contracts' terms.
Foreign-denominated assets, including investment securities, and liabilities are translated into U.S. dollars at the exchange rate at period end. Purchases and sales of investment securities, income and dividends received and expenses denominated in foreign currencies are translated into U.S. dollars at the exchange rate in effect on the transaction date.
The effects of exchange rate fluctuations on investments are included with the net realized and unrealized gain (loss) on investment securities. Other foreign currency transactions resulting in realized and unrealized gain (loss) are disclosed separately.
Annual Report
Notes to Financial Statements - continued
(Amounts in thousands except ratios)
3. Significant Accounting Policies - continued
Investment Transactions and Income. For financial reporting purposes, the Fund's investment holdings and NAV include trades executed through the end of the last business day of the period. The NAV per share for processing shareholder transactions is calculated as of the close of business of the New York Stock Exchange (NYSE) normally 4:00 p.m. Eastern time and includes trades executed through the end of the prior business day. Gains and losses on securities sold are determined on the basis of identified cost and may include proceeds received from litigation. Dividend income is recorded on the ex-dividend date, except for certain dividends from foreign securities where the ex-dividend date may have passed, which are recorded as soon as the Fund is informed of the ex-dividend date. Non-cash dividends included in dividend income, if any, are recorded at the fair market value of the securities received. Distributions received on securities that represent a return of capital or capital gain are recorded as a reduction of cost of investments and/or as a realized gain. The Fund estimates the components of distributions received that may be considered return of capital distributions or capital gain distributions. Interest income and distributions from the Fidelity Central Funds are accrued as earned. Interest income includes coupon interest and amortization of premium and accretion of discount on debt securities. Investment income is recorded net of foreign taxes withheld where recovery of such taxes is uncertain.
Expenses. Most expenses of the trust can be directly attributed to a fund. Expenses which cannot be directly attributed are apportioned among each Fund in the trust. Expense estimates are accrued in the period to which they relate and adjustments are made when actual amounts are known.
Income Tax Information and Distributions to Shareholders. Each year, the Fund intends to qualify as a regulated investment company by distributing substantially all of its taxable income and realized gains under Subchapter M of the Internal Revenue Code and filing its U.S. federal tax return. As a result, no provision for income taxes is required. The Fund is subject to the provisions of FASB Interpretation No. 48, Accounting for Uncertainties in Income Taxes (FIN 48). FIN 48 sets forth a minimum threshold for financial statement recognition of the benefit of a tax position taken or expected to be taken in a tax return. The implementation of FIN 48 did not result in any unrecognized tax benefits in the accompanying financial statements. Each of the Fund's federal tax returns for the prior three fiscal years remains subject to examination by the Internal Revenue Service (IRS). Foreign taxes are provided for based on the Fund's understanding of the tax rules and rates that exist in the foreign markets in which it invests.
Distributions are recorded on the ex-dividend date. Income dividends and capital gain distributions are declared separately for each class. Income and capital gain distributions are determined in accordance with income tax regulations, which may differ from
Annual Report
3. Significant Accounting Policies - continued
Income Tax Information and Distributions to Shareholders - continued
generally accepted accounting principles. In addition, the Fund will claim a portion of the payment made to redeeming shareholders as a distribution for income tax purposes.
Capital accounts within the financial statements are adjusted for permanent book-tax differences. These adjustments have no impact on net assets or the results of operations. Temporary book-tax differences will reverse in a subsequent period.
Book-tax differences are primarily due to futures transactions, foreign currency transactions, certain foreign taxes, passive foreign investment companies (PFIC), market discount, deferred trustees compensation and losses deferred due to wash sales.
The tax-basis components of distributable earnings and the federal tax cost as of period end were as follows:
Unrealized appreciation | $ 370,565 |
Unrealized depreciation | (3,044,089) |
Net unrealized appreciation (depreciation) | (2,673,524) |
Undistributed ordinary income | 93,213 |
Capital loss carryforward | (637,482) |
| |
Cost for federal income tax purposes | $ 10,544,261 |
The tax character of distributions paid was as follows:
| October 31, 2008 | October 31, 2007 |
Ordinary Income | $ 164,399 | $ 145,377 |
Long-term Capital Gains | 493,881 | 164,810 |
Total | $ 658,280 | $ 310,187 |
Short-Term Trading (Redemption) Fees. Shares held in the Fund less than 30 days are subject to a redemption fee equal to 1.00% of the proceeds of the redeemed shares. All redemption fees, including any estimated redemption fees paid by FMR, are retained by the Fund and accounted for as an addition to paid in capital.
New Accounting Pronouncements. In September 2006, Statement of Financial Accounting Standards No. 157, Fair Value Measurements (SFAS 157), was issued and is effective for fiscal years beginning after November 15, 2007. SFAS 157 defines fair value, establishes a framework for measuring fair value and results in expanded disclosures about fair value measurements.
Annual Report
Notes to Financial Statements - continued
(Amounts in thousands except ratios)
3. Significant Accounting Policies - continued
New Accounting Pronouncements - continued
In addition, in March 2008, Statement of Financial Accounting Standards No. 161, Disclosures about Derivative Instruments and Hedging Activities (SFAS 161), was issued and is effective for reporting periods beginning after November 15, 2008. SFAS 161 requires enhanced disclosures to provide information about the reasons the Fund invests in derivative instruments, the accounting treatment and the effect derivatives have on financial performance.
4. Operating Policies.
Repurchase Agreements. FMR has received an Exemptive Order from the Securities and Exchange Commission (the SEC) which permits the Fund and other affiliated entities of FMR to transfer uninvested cash balances into joint trading accounts which are then invested in repurchase agreements. The Fund may also invest directly with institutions in repurchase agreements. Repurchase agreements are collateralized by government or non-government securities. Upon settlement date, collateral is held in segregated accounts with custodian banks and may be obtained in the event of a default of the counterparty. The Fund monitors, on a daily basis, the value of the collateral to ensure it is at least equal to the principal amount of the repurchase agreement (including accrued interest). In the event of a default by the counterparty, realization of the collateral proceeds could be delayed, during which time the value of the collateral may decline.
Futures Contracts. The Fund may use futures contracts to manage its exposure to the stock markets. Buying futures tends to increase a fund's exposure to the underlying instrument, while selling futures tends to decrease a fund's exposure to the underlying instrument or hedge other fund investments. Upon entering into a futures contract, a fund is required to deposit with a clearing broker, no later than the following business day, an amount ("initial margin") equal to a certain percentage of the face value of the contract. The initial margin may be in the form of cash or securities and is transferred to a segregated account on settlement date. Subsequent payments ("variation margin") are made or received by a fund depending on the daily fluctuations in the value of the futures contract and are accounted for as unrealized gains or losses. Realized gains (losses) are recorded upon the expiration or closing of the futures contract. Securities deposited to meet margin requirements are identified in the Schedule of Investments. Futures contracts involve, to varying degrees, risk of loss in excess of any futures variation margin reflected in the Statement of Assets and Liabilities. The underlying face amount at value of any open futures contracts at period end is shown in the Schedule of Investments under the caption "Futures Contracts." This amount reflects each contract's exposure to the underlying instrument at period end. Losses may arise from changes in the value of
Annual Report
4. Operating Policies - continued
Futures Contracts - continued
the underlying instruments or if the counterparties do not perform under the contract's terms.
5. Purchases and Sales of Investments.
Purchases and sales of securities other than short-term securities, aggregated $10,031,748 and $9,562,944, respectively.
6. Fees and Other Transactions with Affiliates.
Management Fee. FMR and its affiliates provide the Fund with investment management related services for which the Fund pays a monthly management fee. The management fee is the sum of an individual fund fee rate that is based on an annual rate of .45% of the Fund's average net assets and a group fee rate that averaged .26% during the period. The group fee rate is based upon the average net assets of all the mutual funds advised by FMR. The group fee rate decreases as assets under management increase and increases as assets under management decrease. In addition, the management fee is subject to a performance adjustment up to a maximum of ±.20% of the Fund's average net assets over a 36 month performance period). The upward or downward adjustment to the management fee is based on the relative investment performance of the retail class of the Fund, International Discovery as compared to an appropriate benchmark index. For the period, the total annual management fee rate, including the performance adjustment, was .81% of the Fund's average net assets.
Distribution and Service Plan. In accordance with Rule 12b-1 of the 1940 Act, the Fund has adopted separate Distribution and Service Plans for each class of shares. Certain classes pay Fidelity Distributors Corporation (FDC), an affiliate of FMR, separate Distribution and Service Fees, each of which is based on an annual percentage of each class' average net assets. In addition, FDC may pay financial intermediaries for selling shares of the Fund and providing shareholder support services. For the period, the Distribution and Service Fee rates and the total amounts paid to and retained by FDC were as follows:
| Distribution
Fee | Service
Fee | Paid to
FDC | Retained
by FDC |
Class A | 0% | .25% | $ 1,335 | $ 160 |
Class T | .25% | .25% | 393 | 3 |
Class B | .75% | .25% | 224 | 168 |
Class C | .75% | .25% | 479 | 189 |
| | | $ 2,431 | $ 520 |
Annual Report
Notes to Financial Statements - continued
(Amounts in thousands except ratios)
6. Fees and Other Transactions with Affiliates - continued
Sales Load. FDC receives a front-end sales charge of up to 5.75% for selling Class A shares, and 3.50% for selling Class T shares, some of which is paid to financial intermediaries for selling shares of the Fund. FDC receives the proceeds of contingent deferred sales charges levied on Class A, Class T, Class B, and Class C redemptions. These charges depend on the holding period. The deferred sales charges range from 5% to 1% for Class B, 1% for Class C, 1.00% to .50% for certain purchases of Class A shares and .25% for certain purchases of Class T shares.
For the period, sales charge amounts retained by FDC were as follows:
| Retained
by FDC |
Class A | $ 284 |
Class T | 46 |
Class B* | 36 |
Class C* | 14 |
| $ 380 |
* When Class B and Class C shares are initially sold, FDC pays commissions from its own resources to financial intermediaries through which the sales are made.
Transfer Agent Fees. Fidelity Investments Institutional Operations Company, Inc. (FIIOC), an affiliate of FMR, is the transfer, dividend disbursing and shareholder servicing agent for each class of the Fund. FIIOC receives account fees and asset-based fees that vary according to the account size and type of account of the shareholders of the respective classes of the Fund. FIIOC pays for typesetting, printing and mailing of shareholder reports, except proxy statements. Prior to January 1, 2008, Fidelity Service Company, Inc. (FSC) also an affiliate of FMR was the sub-transfer for International Discovery shares. For the period, the total transfer agent fees paid by each class were as follows:
| Amount | % of
Average
Net Assets |
Class A | $ 1,109 | .21 |
Class T | 248 | .31 |
Class B | 73 | .32 |
Class C | 146 | .30 |
International Discovery | 26,685 | .22 |
Class K | 8 | .05* |
Institutional Class | 167 | .18 |
| $ 28,436 | |
* Annualized
Annual Report
6. Fees and Other Transactions with Affiliates - continued
Accounting and Security Lending Fees. FSC maintains the Fund's accounting records. The accounting fee is based on the level of average net assets for the month. Under a separate contract, FSC administers the security lending program. The security lending fee is based on the number and duration of lending transactions.
Brokerage Commissions. The Fund placed a portion of its portfolio transactions with brokerage firms which are affiliates of the investment adviser. The commissions paid to these affiliated firms were $6 for the period.
7. Committed Line of Credit.
The Fund participates with other funds managed by FMR in a $4.2 billion credit facility (the "line of credit") to be utilized for temporary or emergency purposes to fund shareholder redemptions or for other short-term liquidity purposes. The Fund has agreed to pay commitment fees on its pro rata portion of the line of credit, which amounted to $26 and is reflected in Miscellaneous Expense on the Statement of Operations. During the period, there were no borrowings on this line of credit.
8. Security Lending.
The Fund lends portfolio securities from time to time in order to earn additional income. On the settlement date of the loan, the Fund receives collateral (in the form of U.S. Treasury obligations, letters of credit and/or cash) against the loaned securities and maintains collateral in an amount not less than 100% of the market value of the loaned securities during the period of the loan. The market value of the loaned securities is determined at the close of business of the Fund and any additional required collateral is delivered to the Fund on the next business day. If the borrower defaults on its obligation to return the securities loaned because of insolvency or other reasons, a fund could experience delays and costs in recovering the securities loaned or in gaining access to the collateral. Any cash collateral received is invested in the Fidelity Securities Lending Cash Central Fund. The value of loaned securities and cash collateral at period end are disclosed on the Fund's Statement of Assets and Liabilities. Security lending income represents the income earned on investing cash collateral, less fees and expenses associated with the loan, plus any premium payments that may be received on the loan of certain types of securities. Security lending income is presented in the Statement of Operations as a component of income from Fidelity Central Funds. Net income from lending portfolio securities during the period amounted to $11,130.
Annual Report
Notes to Financial Statements - continued
(Amounts in thousands except ratios)
9. Expense Reductions.
Many of the brokers with whom FMR places trades on behalf of the Fund provided services to the Fund in addition to trade execution. These services included payments of certain expenses on behalf of the Fund totaling $4,760 for the period. In addition, through arrangements with each class' transfer agent, credits realized as a result of uninvested cash balances were used to reduce the Fund's expenses. During the period, these credits reduced the Fund's custody expenses by $1. During the period, credits reduced each class' transfer agent expense as noted in the table below.
| Transfer Agent
expense reduction |
International Discovery | $ 248 |
10. Other.
The Fund's organizational documents provide former and current trustees and officers with a limited indemnification against liabilities arising in connection with the performance of their duties to the Fund. In the normal course of business, the Fund may also enter into contracts that provide general indemnifications. The Fund's maximum exposure under these arrangements is unknown as this would be dependent on future claims that may be made against the Fund. The risk of material loss from such claims is considered remote.
In December 2006, the Independent Trustees, with the assistance of independent counsel, completed an investigation regarding gifts, gratuities and business entertainment provided by certain brokers to certain individuals who were employed on FMR's domestic equity trading desk during the period 2002 to 2004. The Independent Trustees and FMR agreed that, despite the absence of proof that the Fidelity mutual funds experienced diminished execution quality as a result of the improper receipt of gifts and business entertainment, the conduct at issue was serious and was worthy of redress. Accordingly, the Independent Trustees requested, and FMR agreed to make, a payment of $42 million plus accrued interest, which equaled approximately $7.3 million, to certain Fidelity mutual funds.
In March 2008, the Trustees approved a method for allocating this payment among the funds and, in total, FMR paid the fund $5, which is recorded in the accompanying Statement of Operations.
In a related administrative order dated March 5, 2008, the U.S. Securities and Exchange Commission ("SEC") announced a settlement with FMR and FMR Co., Inc. (an affiliate of FMR) involving the SEC's regulatory rules for investment advisers and the improper receipt of gifts, gratuities and business entertainment. Without admitting or denying the
Annual Report
10. Other - continued
SEC's findings, FMR agreed to pay an $8 million civil penalty to the United States Treasury.
11. Distributions to Shareholders.
Distributions to shareholders of each class were as follows:
Years ended October 31, | 2008 | 2007 |
From net investment income | | |
Class A | $ 3,599 | $ 1,387 |
Class T | 387 | 80 |
Class B | 67 | 21 |
Class C | 123 | 24 |
International Discovery | 124,823 | 84,038 |
Institutional Class | 575 | 312 |
Total | $ 129,574 | $ 85,862 |
From net realized gain | | |
Class A | $ 16,423 | $ 3,929 |
Class T | 2,244 | 302 |
Class B | 719 | 130 |
Class C | 1,185 | 170 |
International Discovery | 505,958 | 219,032 |
Institutional Class | 2,177 | 762 |
Total | $ 528,706 | $ 224,325 |
12. Share Transactions.
Transactions for each class of shares were as follows:
| Shares Years ended October 31, | Dollars Years ended October 31, |
| 2008 A | 2007 | 2008 A | 2007 |
Class A | | | | |
Shares sold | 13,337 | 5,675 | $ 505,827 | $ 234,633 |
Reinvestment of distributions | 252 | 63 | 11,025 | 2,271 |
Shares redeemed | (6,361) | (770) | (213,706) | (31,203) |
Net increase (decrease) | 7,228 | 4,968 | $ 303,146 | $ 205,701 |
Annual Report
Notes to Financial Statements - continued
(Amounts in thousands except ratios)
12. Share Transactions - continued
| Shares Years ended October 31, | Dollars Years ended October 31, |
| 2008 A | 2007 | 2008 A | 2007 |
Class T | | | | |
Shares sold | 2,322 | 1,031 | $ 87,236 | $ 42,252 |
Reinvestment of distributions | 59 | 10 | 2,571 | 371 |
Shares redeemed | (800) | (187) | (27,654) | (7,614) |
Net increase (decrease) | 1,581 | 854 | $ 62,153 | $ 35,009 |
Class B | | | | |
Shares sold | 487 | 293 | $ 18,856 | $ 11,952 |
Reinvestment of distributions | 17 | 4 | 721 | 136 |
Shares redeemed | (228) | (53) | (7,554) | (2,096) |
Net increase (decrease) | 276 | 244 | $ 12,023 | $ 9,992 |
Class C | | | | |
Shares sold | 1,350 | 481 | $ 51,762 | $ 19,749 |
Reinvestment of distributions | 25 | 4 | 1,076 | 139 |
Shares redeemed | (405) | (55) | (13,335) | (2,234) |
Net increase (decrease) | 970 | 430 | $ 39,503 | $ 17,654 |
International Discovery | | | | |
Shares sold | 98,885 | 133,089 | $ 3,784,869 | $ 5,367,776 |
Conversion to Class K | (6,197) | - | (182,264) | - |
Reinvestment of distributions | 13,646 | 7,929 | 600,976 | 289,550 |
Shares redeemed | (110,609) | (63,328) | (3,914,448) | (2,558,324) |
Net increase (decrease) | (4,275) | 77,690 | $ 289,133 | $ 3,099,002 |
Class K | | | | |
Shares sold | 215 | - | $ 6,017 | $ - |
Conversion from International Discovery | 6,197 | - | 182,264 | - |
Reinvestment of distributions | - | - | - | - |
Shares redeemed | (338) | - | (8,716) | - |
Net increase (decrease) | 6,074 | - | $ 179,565 | $ - |
Annual Report
12. Share Transactions - continued
| Shares Years ended October 31, | Dollars Years ended October 31, |
| 2008 A | 2007 | 2008 A | 2007 |
Institutional Class | | | | |
Shares sold | 7,551 | 538 | $ 243,799 | $ 22,351 |
Reinvestment of distributions | 42 | 19 | 1,852 | 700 |
Shares redeemed | (2,148) | (120) | (62,044) | (5,000) |
Net increase (decrease) | 5,445 | 437 | $ 183,607 | $ 18,051 |
A Share transactions for Class K are for the period May 9, 2008 (commencement of sale of shares) to October 31, 2008.
Annual Report
To the Trustees of Fidelity Investment Trust and the Shareholders of Fidelity International Discovery Fund:
In our opinion, the accompanying statement of assets and liabilities, including the schedule of investments, and the related statements of operations and of changes in net assets and the financial highlights present fairly, in all material respects, the financial position of Fidelity International Discovery Fund (a fund of Fidelity Investment Trust) at October 31, 2008, the results of its operations for the year then ended, the changes in its net assets for each of the two years in the period then ended and the financial highlights for each of the periods indicated, in conformity with accounting principles generally accepted in the United States of America. These financial statements and financial highlights (hereafter referred to as "financial statements") are the responsibility of the Fidelity International Discovery Fund's management. Our responsibility is to express an opinion on these financial statements based on our audits. We conducted our audits of these financial statements in accordance with the standards of the Public Company Accounting Oversight Board (United States). Those standards require that we plan and perform the audit to obtain reasonable assurance about whether the financial statements are free of material misstatement. An audit includes examining, on a test basis, evidence supporting the amounts and disclosures in the financial statements, assessing the accounting principles used and significant estimates made by management, and evaluating the overall financial statement presentation. We believe that our audits, which included confirmation of securities at October 31, 2008 by correspondence with the custodian and brokers, provide a reasonable basis for our opinion.
/s/ PricewaterhouseCoopers LLP
PricewaterhouseCoopers LLP
Boston, Massachusetts
December 23, 2008
Annual Report
The Trustees, Member of the Advisory Board, and executive officers of the trust and fund, as applicable, are listed below. The Board of Trustees governs the fund and is responsible for protecting the interests of shareholders. The Trustees are experienced executives who meet periodically throughout the year to oversee the fund's activities, review contractual arrangements with companies that provide services to the fund, and review the fund's performance. Except for Edward C. Johnson 3d and James C. Curvey, each of the Trustees oversees 220 funds advised by FMR or an affiliate. Messrs. Johnson and Curvey oversee 379 funds advised by FMR or an affiliate.
The Trustees hold office without limit in time except that (a) any Trustee may resign; (b) any Trustee may be removed by written instrument, signed by at least two-thirds of the number of Trustees prior to such removal; (c) any Trustee who requests to be retired or who has become incapacitated by illness or injury may be retired by written instrument signed by a majority of the other Trustees; and (d) any Trustee may be removed at any special meeting of shareholders by a two-thirds vote of the outstanding voting securities of the trust. Each Trustee who is not an interested person (as defined in the 1940 Act) (Independent Trustee), shall retire not later than the last day of the calendar year in which his or her 72nd birthday occurs. The Independent Trustees may waive this mandatory retirement age policy with respect to individual Trustees. The executive officers and Advisory Board Member hold office without limit in time, except that any officer and Advisory Board Member may resign or may be removed by a vote of a majority of the Trustees at any regular meeting or any special meeting of the Trustees. Except as indicated, each individual has held the office shown or other offices in the same company for the past five years.
The fund's Statement of Additional Information (SAI) includes more information about the Trustees. To request a free copy, call Fidelity at 1-800-544-8544.
Interested Trustees*:
Correspondence intended for each Trustee who is an interested person may be sent to Fidelity Investments, 82 Devonshire Street, Boston, Massachusetts 02109.
Name, Age; Principal Occupation |
Edward C. Johnson 3d (78) |
| Year of Election or Appointment: 1984 Mr. Johnson is Chairman of the Board of Trustees. Mr. Johnson serves as Chief Executive Officer, Chairman, and a Director of FMR LLC; Chairman and a Director of FMR; Chairman and a Director of Fidelity Research & Analysis Company (FRAC); Chairman and a Director of Fidelity Investments Money Management, Inc.; and Chairman and a Director of FMR Co., Inc. In addition, Mr. Johnson serves as Chairman and Director of FIL Limited. Previously, Mr. Johnson served as President of FMR LLC (2006-2007). |
James C. Curvey (73) |
| Year of Election or Appointment: 2007 Mr. Curvey also serves as Trustee (2007-present) of other investment companies advised by FMR. Mr. Curvey is a Director of FMR and FMR Co., Inc. (2007-present). Mr. Curvey is also Vice Chairman (2006-
present) and Director of FMR LLC. In addition, Mr. Curvey serves as an Overseer for the Boston Symphony Orchestra and a member of the Trustees of Villanova University. |
* Trustees have been determined to be "Interested Trustees" by virtue of, among other things, their affiliation with the trust or various entities under common control with FMR. FMR Corp. merged with and into FMR LLC on October 1, 2007. Any references to FMR LLC for prior periods are deemed to be references to the prior entity.
Independent Trustees:
Correspondence intended for each Independent Trustee (that is, the Trustees other than the Interested Trustees) may be sent to Fidelity Investments, P.O. Box 55235, Boston, Massachusetts 02205-5235.
Name, Age; Principal Occupation |
Dennis J. Dirks (60) |
| Year of Election or Appointment: 2005 Prior to his retirement in May 2003, Mr. Dirks was Chief Operating Officer and a member of the Board of The Depository Trust & Clearing Corporation (DTCC) (1999-2003). He also served as President, Chief Operating Officer, and Board member of The Depository Trust Company (DTC) (1999-2003) and President and Board member of the National Securities Clearing Corporation (NSCC) (1999-2003). In addition, Mr. Dirks served as a Trustee and a member of the Finance Committee of Manhattan College (2005-2008), and as Chief Executive Officer and Board member of the Government Securities Clearing Corporation (2001-2003) and Chief Executive Officer and Board member of the Mortgage-Backed Securities Clearing Corporation (2001-2003). Mr. Dirks also serves as a Trustee and a member of the Finance Committee of AHRC of Nassau County (2006-present). |
Alan J. Lacy (55) |
| Year of Election or Appointment: 2008 Mr. Lacy serves as Senior Adviser (2007-present) of Oak Hill Capital Partners, L.P. (a private equity firm). Mr. Lacy also served as Chief Executive Officer (2000-2005) and Vice Chairman (2005-2006) of Sears Holdings Corporation and Sears, Roebuck and Co. (retail). In addition, Mr. Lacy serves as a member of the Board of Directors of The Western Union Company (global money transfer, 2006-present) and Bristol-Myers Squibb (global pharmaceuticals, 2007-present). Mr. Lacy is a Trustee of the National Parks Conservation Association and The Field Museum of Natural History. |
Ned C. Lautenbach (64) |
| Year of Election or Appointment: 2000 Mr. Lautenbach is Chairman of the Independent Trustees (2006-present). Mr. Lautenbach is an Advisory Partner of Clayton, Dubilier & Rice, Inc. (private equity investment firm). Previously, Mr. Lautenbach was with the International Business Machines Corporation (IBM) from 1968 until his retirement in 1998. Mr. Lautenbach serves as a Director of Eaton Corporation (diversified industrial) as well as the Philharmonic Center for the Arts in Naples, Florida. He also is a member of the Board of Trustees of Fairfield University (2005-present), as well as a member of the Council on Foreign Relations. Previously, Mr. Lautenbach served as a Director of Sony Corporation (2006-2007). |
Joseph Mauriello (64) |
| Year of Election or Appointment: 2008 Prior to his retirement in January 2006, Mr. Mauriello served in numerous senior management positions including Deputy Chairman and Chief Operating Officer (2004-2005), and Vice Chairman of Financial Services (2002-2004) of KPMG LLP US (professional services firm, 1965-
2005). Mr. Mauriello currently serves as a member of the Board of Directors of XL Capital Ltd. (global insurance and re-insurance company, 2006-present) and of Arcadia Resources Inc. (health care services and products, 2007-present). He also served as a Director of the Hamilton Funds of the Bank of New York (2006-2007). |
Cornelia M. Small (64) |
| Year of Election or Appointment: 2005 Ms. Small is a member of the Investment Committee, and Chair (2008-present) and a member of the Board of Trustees of Smith College. Ms. Small also serves on the Investment Committee of the Berkshire Taconic Community Foundation (2008-present). Previously, Ms. Small served as Chairperson of the Investment Committee (2002-2008) of Smith College and as Co-Chair (2000-2003) of the Annual Fund for the Fletcher School of Law and Diplomacy. In addition, she served as Chief Investment Officer, Director of Global Equity Investments, and a member of the Board of Directors of Scudder, Stevens & Clark and Scudder Kemper Investments. |
William S. Stavropoulos (69) |
| Year of Election or Appointment: 2001 Mr. Stavropoulos is Chairman Emeritus of the Board of Directors of The Dow Chemical Company, where he previously served in numerous senior management positions, including President (1993-2000; 2002-
2003), CEO (1995-2000; 2002-2004), Chairman of the Executive Committee (2000-2006), and as a member of the Board of Directors (1990-2006). Currently, he is a Director of Teradata Corporation (data warehousing and technology solutions, 2008-present), Chemical Financial Corporation, Maersk Inc. (industrial conglomerate), Tyco International, Inc. (multinational manufacturing and services, 2007-present), and a member of the Advisory Board for Metalmark Capital (private equity investment firm, 2005-present). He is a special advisor to Clayton, Dubilier & Rice, Inc. (private equity investment). In addition, Mr. Stavropoulos is a member of the University of Notre Dame Advisory Council for the College of Science. |
David M. Thomas (59) |
| Year of Election or Appointment: 2008 Previously, Mr. Thomas served as Executive Chairman (2005-2006) and Chairman and Chief Executive Officer (2000-2005) of IMS Health, Inc. (pharmaceutical and healthcare information solutions). In addition, Mr. Thomas serves as a member of the Board of Directors of Fortune Brands, Inc. (consumer products holding company), and Interpublic Group of Companies, Inc. (marketing communication, 2004-present). |
Michael E. Wiley (58) |
| Year of Election or Appointment: 2008 Mr. Wiley also serves as a member of the Board of Trustees of the University of Tulsa (2000-2006; 2007-present). He serves as a Director of Tesoro Corporation (independent oil refiner and marketer, 2005-
present), and a Director of Bill Barrett Corporation (exploration and production company, 2005-present). In addition, he also serves as a Director of Post Oak Bank (privately-held bank, 2004-present). Previously, Mr. Wiley served as a Sr. Energy Advisor of Katzenbach Partners, LLC (consulting firm, 2006-2007), as an Advisory Director of Riverstone Holdings (private investment firm), Chairman, President, and CEO of Baker Hughes, Inc. (oilfield services company, 2000-2004), and as Director of Spinnaker Exploration Company (exploration and production company, 2001-2005). |
Advisory Board Member and Executive Officers**:
Correspondence intended for each executive officer and Mr. Lynch may be sent to Fidelity Investments, 82 Devonshire Street, Boston, Massachusetts 02109.
Name, Age; Principal Occupation |
Peter S. Lynch (64) |
| Year of Election or Appointment: 2003 Member of the Advisory Board of Fidelity's Equity and High Income Funds. Mr. Lynch is Vice Chairman and a Director of FMR, and Vice Chairman (2001-present) and a Director of FMR Co., Inc. Previously, Mr. Lynch served as a Trustee of the Fidelity funds (1990-2003). In addition, he serves as a Trustee of Boston College and as the Chairman of the Inner-City Scholarship Fund. Previously, Mr. Lynch served on the Special Olympics International Board of Directors (1997-2006). |
Kenneth B. Robins (39) |
| Year of Election or Appointment: 2008 President and Treasurer of Fidelity's Equity and High Income Funds. Mr. Robins is an employee of Fidelity Investments (2004-present). Before joining Fidelity Investments, Mr. Robins worked at KPMG LLP, where he was a partner in KPMG's department of professional practice (2002-2004). |
Walter C. Donovan (46) |
| Year of Election or Appointment: 2007 Vice President of Fidelity's Equity Funds. Mr. Donovan also serves as President of FMR and FMR Co., Inc., and Executive Vice President of Fidelity Investments Money Management, Inc. (2007-present). Previously, Mr. Donovan served as Executive Vice President of FMR and FMR Co., Inc. (2005-2007) and Senior Vice President of FMR (2003-2005) and FMR Co., Inc. (2004-2005). |
Eric M. Wetlaufer (46) |
| Year of Election or Appointment: 2006 Vice President of Fidelity's International Equity Funds. Mr. Wetlaufer also serves as Group Chief Investment Officer of FMR. Mr. Wetlaufer is Chairman, Chief Executive Officer, and President of Fidelity Management & Research (Hong Kong) Limited (2008-present); Chairman, Chief Executive Officer, President, and a Director of Fidelity Management & Research (Japan) Inc. (2008-present); Chairman and Chief Executive Officer (2007-present) and President and a Director (2006-present) of Fidelity Management & Research (U.K.) Inc. and President and a Director of Fidelity Research & Analysis Company (2006-present). Before joining Fidelity Investments in 2005, Mr. Wetlaufer was a partner in Oxhead Capital Management (2004-2005) and a Chief Investment Officer of Putnam Investments (1997-2003). |
Scott C. Goebel (40) |
| Year of Election or Appointment: 2008 Secretary and Chief Legal Officer (CLO) of the Fidelity funds. Mr. Goebel also serves as General Counsel, Secretary, and Senior Vice President of FMR (2008-present); Deputy General Counsel of FMR LLC; Chief Legal Secretary of Fidelity Management & Research (Hong Kong) Limited (2008-present) and Assistant Secretary of Fidelity Management & Research (Japan) Inc. (2008-present). Previously, Mr. Goebel served as Assistant Secretary of the Funds (2007-2008) and as Vice President and Secretary of Fidelity Distributors Corporation (FDC) (2005-2007). |
John B. McGinty, Jr. (46) |
| Year of Election or Appointment: 2008 Assistant Secretary of Fidelity's Equity and High Income Funds. Mr. McGinty is an employee of Fidelity Investments (2004-present). Mr. McGinty also serves as Senior Vice President, Secretary, and Chief Legal Officer of FDC (2007-present). Before joining Fidelity Investments, Mr. McGinty practiced law at Ropes & Gray, LLP. |
Holly C. Laurent (54) |
| Year of Election or Appointment: 2008 Anti-Money Laundering (AML) Officer of the Fidelity funds. Ms. Laurent is an employee of Fidelity Investments. Previously, Ms. Laurent was Senior Vice President and Head of Legal for Fidelity Business Services India Pvt. Ltd. (2006-2008), Senior Vice President, Deputy General Counsel and Group Head for FMR LLC (2005-2006). |
Christine Reynolds (50) |
| Year of Election or Appointment: 2008 Chief Financial Officer of the Fidelity funds. Ms. Reynolds became President of Fidelity Pricing and Cash Management Services (FPCMS) in August 2008. She served as Chief Operating Officer of FPCMS from 2007 through July 2008. Previously, Ms. Reynolds served as President, Treasurer, and Anti-Money Laundering officer of the Fidelity funds (2004-
2007). Before joining Fidelity Investments, Ms. Reynolds worked at PricewaterhouseCoopers LLP (PwC) (1980-2002), where she was an audit partner with PwC's investment management practice. |
Kenneth A. Rathgeber (61) |
| Year of Election or Appointment: 2004 Chief Compliance Officer of Fidelity's Equity and High Income Funds. Mr. Rathgeber is Chief Compliance Officer of Fidelity Management & Research (Hong Kong) Limited (2008-present), Fidelity Management & Research (Japan) Inc. (2008-present), FMR (2005-present), FMR Co., Inc. (2005-present), Fidelity Management & Research (U.K.) Inc. (2005-
present), Fidelity Research & Analysis Company (2005-present), Fidelity Investments Money Management, Inc. (2005-present), and Strategic Advisers, Inc. (2005-present). |
Bryan A. Mehrmann (47) |
| Year of Election or Appointment: 2005 Deputy Treasurer of the Fidelity funds. Mr. Mehrmann is an employee of Fidelity Investments. Previously, Mr. Mehrmann served as Vice President of Fidelity Investments Institutional Services Group (FIIS)/Fidelity Investments Institutional Operations Corporation, Inc. (FIIOC) Client Services (1998-2004). |
Adrien E. Deberghes (41) |
| Year of Election or Appointment: 2008 Deputy Treasurer of Fidelity's Equity and High Income Funds. Mr. Deberghes is an employee of Fidelity Investments (2008-present). Previously, Mr. Deberghes served as Senior Vice President of Mutual Fund Administration at State Street Corporation (2007-2008), Senior Director of Mutual Fund Administration at Investors Bank & Trust (2005-2007), and Director of Finance for Dunkin' Brands (2000-2005). |
Robert G. Byrnes (41) |
| Year of Election or Appointment: 2005 Assistant Treasurer of the Fidelity funds. Mr. Byrnes is an employee of Fidelity Investments (2005-present). Previously, Mr. Byrnes served as Vice President of Fidelity Pricing and Cash Management Services (FPCMS) (2003-2005). Before joining Fidelity Investments, Mr. Byrnes worked at Deutsche Asset Management where he served as Vice President of the Investment Operations Group (2000-2003). |
Peter L. Lydecker (54) |
| Year of Election or Appointment: 2004 Assistant Treasurer of the Fidelity funds. Mr. Lydecker is an employee of Fidelity Investments. |
Paul M. Murphy (61) |
| Year of Election or Appointment: 2007 Assistant Treasurer of the Fidelity funds. Mr. Murphy is an employee of Fidelity Investments (2007-present). Previously, Mr. Murphy served as Chief Financial Officer of the Fidelity Funds (2005-2006), Vice President and Associate General Counsel of FMR (2007), and Senior Vice President of Fidelity Pricing and Cash Management Services (FPCMS) (1994-2007). |
Gary W. Ryan (50) |
| Year of Election or Appointment: 2005 Assistant Treasurer of the Fidelity funds. Mr. Ryan is an employee of Fidelity Investments. Previously, Mr. Ryan served as Vice President of Fund Reporting in Fidelity Pricing and Cash Management Services (FPCMS) (1999-2005). |
** FMR Corp. merged with and into FMR LLC on October 1, 2007. Any references to FMR LLC for prior periods are deemed to be references to the prior entity.
Annual Report
International Discovery Fund designates 87% of the dividend distributed during the fiscal year as amounts which may be taken into account as a dividend for purposes of the maximum rate under section 1(h)(11) of the Internal Revenue Code.
The amounts per share which represent income derived from sources within, and taxes paid to, foreign countries or possessions of the United States are as follows:
| Pay Date | Income | Taxes |
International Discovery Fund | 12/10/07 | $0.418 | $0.0646 |
The fund will notify shareholders in January 2009 of amounts for use in preparing 2008 income tax returns.
Annual Report
A special meeting of the fund's shareholders was held on April 16, 2008. The results of votes taken among shareholders on the proposals before them are reported below. Each vote reported represents one dollar of net asset value held on the record date for the meeting.
PROPOSAL 1 |
To elect a Board of Trustees.A |
| # of
Votes | % of
Votes |
James C. Curvey |
Affirmative | 44,485,656,811.55 | 94.702 |
Withheld | 2,488,551,854.62 | 5.298 |
TOTAL | 46,974,208,666.17 | 100.000 |
Dennis J. Dirks |
Affirmative | 44,706,671,638.31 | 95.173 |
Withheld | 2,267,537,027.86 | 4.827 |
TOTAL | 46,974,208,666.17 | 100.000 |
Edward C. Johnson 3d |
Affirmative | 44,294,881,638.16 | 94.296 |
Withheld | 2,679,327,028.01 | 5.704 |
TOTAL | 46,974,208,666.17 | 100.000 |
Alan J. Lacy |
Affirmative | 44,685,373,413.16 | 95.127 |
Withheld | 2,288,835,253.01 | 4.873 |
TOTAL | 46,974,208,666.17 | 100.000 |
Ned C. Lautenbach |
Affirmative | 44,634,541,379.41 | 95.019 |
Withheld | 2,339,667,286.76 | 4.981 |
TOTAL | 46,974,208,666.17 | 100.000 |
Joseph Mauriello |
Affirmative | 44,683,962,099.80 | 95.124 |
Withheld | 2,290,246,566.37 | 4.876 |
TOTAL | 46,974,208,666.17 | 100.000 |
Cornelia M. Small |
Affirmative | 44,671,688,375.36 | 95.098 |
Withheld | 2,302,520,290.81 | 4.902 |
TOTAL | 46,974,208,666.17 | 100.000 |
| # of
Votes | % of
Votes |
William S. Stavropoulos |
Affirmative | 44,465,262,087.61 | 94.659 |
Withheld | 2,508,946,578.56 | 5.341 |
TOTAL | 46,974,208,666.17 | 100.000 |
David M. Thomas |
Affirmative | 44,694,340,813.87 | 95.147 |
Withheld | 2,279,867,852.30 | 4.853 |
TOTAL | 46,974,208,666.17 | 100.000 |
Michael E. Wiley |
Affirmative | 44,686,513,174.78 | 95.130 |
Withheld | 2,287,695,491.39 | 4.870 |
TOTAL | 46,974,208,666.17 | 100.000 |
PROPOSAL 5 |
Shareholder proposal concerning "oversight procedures to screen out investments in companies that, in the judgement of the Board, substantially contribute to genocide, patterns of extraordinary and egregious violations of human rights, or crimes against humanity." |
| # of
Votes | % of
Votes |
Affirmative | 1,337,480,153.27 | 21.306 |
Against | 4,280,655,741.12 | 68.193 |
Abstain | 268,134,649.82 | 4.271 |
Broker
Non-Votes | 391,079,068.84 | 6.230 |
TOTAL | 6,277,349,613.05 | 100.000 |
A Denotes trust-wide proposal and voting results.
Annual Report
Proxy Voting Results
A special meeting of the fund's shareholders was held on December 13, 2007. The results of votes taken among shareholders on the proposals before them are reported below. Each vote reported represents one dollar of net asset value held on the record date for the meeting.
PROPOSAL 1 |
To amend the Declaration of Trust to reduce the required quorum for shareholder meetings.A |
| # of
Votes | % of
Votes |
Affirmative | 45,014,793,255.82 | 80.372 |
Against | 6,871,112,667.08 | 12.268 |
Abstain | 2,163,456,438.02 | 3.863 |
Broker
Non-Votes | 1,958,633,563.89 | 3.497 |
TOTAL | 56,007,995,924.81 | 100.000 |
PROPOSAL 2 |
To elect the nominees specified below as Trustees.A |
| # of
Votes | % of
Votes |
James C. Curvey |
Affirmative | 53,384,952,361.03 | 95.317 |
Withheld | 2,623,043,563.78 | 4.683 |
TOTAL | 56,007,995,924.81 | 100.000 |
Dennis J. Dirks |
Affirmative | 53,595,104,608.67 | 95.692 |
Withheld | 2,412,891,316.14 | 4.308 |
TOTAL | 56,007,995,924.81 | 100.000 |
Albert R. Gamper, Jr. |
Affirmative | 53,570,235,221.69 | 95.647 |
Withheld | 2,437,760,703.12 | 4.353 |
TOTAL | 56,007,995,924.81 | 100.000 |
George H. Heilmeier |
Affirmative | 53,166,350,588.50 | 94.926 |
Withheld | 2,841,645,336.31 | 5.074 |
TOTAL | 56,007,995,924.81 | 100.000 |
| # of
Votes | % of
Votes |
Edward C. Johnson 3d |
Affirmative | 53,230,508,654.93 | 95.041 |
Withheld | 2,777,487,269.88 | 4.959 |
TOTAL | 56,007,995,924.81 | 100.000 |
James H. Keyes |
Affirmative | 53,549,161,456.52 | 95.610 |
Withheld | 2,458,834,468.29 | 4.390 |
TOTAL | 56,007,995,924.81 | 100.000 |
Marie L. Knowles |
Affirmative | 53,543,925,066.86 | 95.601 |
Withheld | 2,464,070,857.95 | 4.399 |
TOTAL | 56,007,995,924.81 | 100.000 |
Ned C. Lautenbach |
Affirmative | 53,547,116,322.50 | 95.606 |
Withheld | 2,460,879,602.31 | 4.394 |
TOTAL | 56,007,995,924.81 | 100.000 |
Cornelia M. Small |
Affirmative | 53,564,793,514.25 | 95.638 |
Withheld | 2,443,202,410.56 | 4.362 |
TOTAL | 56,007,995,924.81 | 100.000 |
William S. Stavropoulos |
Affirmative | 53,426,544,502.76 | 95.391 |
Withheld | 2,581,451,422.05 | 4.609 |
TOTAL | 56,007,995,924.81 | 100.000 |
Kenneth L. Wolfe |
Affirmative | 53,229,881,790.63 | 95.040 |
Withheld | 2,778,114,134.18 | 4.960 |
TOTAL | 56,007,995,924.81 | 100.000 |
A Denotes trust-wide proposal and voting results.
Annual Report
Board Approval of Investment Advisory Contracts and Management Fees
Fidelity International Discovery Fund
Each year, typically in July, the Board of Trustees, including the Independent Trustees (together, the Board), votes on the renewal of the management contract and sub-advisory agreements (together, the Advisory Contracts) for the fund. The Board, assisted by the advice of fund counsel and Independent Trustees' counsel, requests and considers a broad range of information throughout the year.
The Board meets regularly and, acting directly and through its separate committees, requests and receives information concerning, and considers at each of its meetings factors that are relevant to, its annual consideration of the renewal of the fund's Advisory Contracts, including the services and support provided to the fund and its shareholders. At the time of the renewal, the Board had 12 standing committees, each composed of Independent Trustees with varying backgrounds, to which the Board has assigned specific subject matter responsibilities in order to enhance effective decision-making by the Board. Each committee has a written charter outlining the structure and purposes of the committee. The Board also meets as needed to consider matters specifically related to the Board's annual consideration of the renewal of Advisory Contracts.
At its July 2008 meeting, the Board of Trustees, including the Independent Trustees, unanimously determined to renew the fund's Advisory Contracts. In reaching its determination, the Board considered all factors it believed relevant, including (i) the nature, extent, and quality of the services to be provided to the fund and its shareholders (including the investment performance of the fund); (ii) the competitiveness of the fund's management fee and total expenses; (iii) the total costs of the services to be provided by and the profits to be realized by Fidelity from its relationship with the fund; (iv) the extent to which economies of scale would be realized as the fund grows; and (v) whether fee levels reflect these economies of scale, if any, for the benefit of fund shareholders. The Board also approved agreements with foreign sub-advisers Fidelity Management & Research (Japan) Inc. and Fidelity Management & Research (Hong Kong) Limited, as well as amendments to the fund's agreement with Fidelity Management & Research (U.K.) Inc.
In considering whether to renew the Advisory Contracts for the fund, the Board ultimately reached a determination, with the assistance of fund counsel and Independent Trustees' counsel and through the exercise of its business judgment, that the renewal of the Advisory Contracts and the compensation to be received by Fidelity under the management contract is consistent with Fidelity's fiduciary duty under applicable law. The Board's decision to renew the Advisory Contracts was not based on any single factor noted above, but rather was based on a comprehensive consideration of all the information provided to the Board at its meetings throughout the year. The Board, in reaching its determination to renew the Advisory Contracts, is aware that shareholders in the fund have a broad range of investment choices available to them, including a wide choice among mutual funds offered by competitors to Fidelity, and that the fund's shareholders, with the opportunity to review and weigh the disclosure provided by the fund in its prospectus and other public disclosures, have chosen to invest in this fund, managed by Fidelity.
Annual Report
Board Approval of Investment Advisory Contracts and
Management Fees - continued
Nature, Extent, and Quality of Services Provided. The Board considered staffing within the investment adviser, FMR, and the sub-advisers (together, the Investment Advisers), including the backgrounds of the fund's investment personnel and the fund's investment objective and discipline. The Independent Trustees also had discussions with senior management of Fidelity's investment operations and investment groups. The Board considered the structure of the portfolio manager compensation program and whether this structure provides appropriate incentives.
Resources Dedicated to Investment Management and Support Services. The Board reviewed the size, education, and experience of the Investment Advisers' investment staff, their use of technology, and the Investment Advisers' approach to recruiting, training, and retaining portfolio managers and other research, advisory, and management personnel. The Board noted that Fidelity's analysts have access to a variety of technological tools that enable them to perform both fundamental and quantitative analysis and to specialize in various disciplines. The Board considered Fidelity's extensive global research capabilities that enable the Investment Advisers to aggregate data from various sources in an effort to produce positive investment results. The Board also considered that Fidelity's portfolio managers and analysts have access to daily portfolio attribution that allows for monitoring of a fund's portfolio, as well as an electronic communication system that provides immediate real-time access to research concerning issuers and credit enhancers.
Shareholder and Administrative Services. The Board considered (i) the nature, extent, quality, and cost of advisory, administrative, distribution, and shareholder services performed by the Investment Advisers and their affiliates under the Advisory Contracts and under separate agreements covering transfer agency, pricing and bookkeeping, and securities lending services for the fund; (ii) the nature and extent of the Investment Advisers' supervision of third party service providers, principally custodians and subcustodians; and (iii) the resources devoted to, and the record of compliance with, the fund's compliance policies and procedures. The Board also reviewed the allocation of fund brokerage, including allocations to brokers affiliated with the Investment Advisers, the use of brokerage commissions to pay fund expenses, and the use of "soft" commission dollars to pay for research services. The Board further considered that Fidelity voluntarily pays for market data out of its own resources.
The Board noted that the growth of fund assets across the complex allows Fidelity to reinvest in the development of services designed to enhance the value or convenience of the Fidelity funds as investment vehicles. These services include 24-hour access to account information and market information through phone representatives and over the Internet, and investor education materials and asset allocation tools.
Annual Report
Investment in a Large Fund Family. The Board considered the benefits to shareholders of investing in a Fidelity fund, including the benefits of investing in a fund that is part of a large family of funds offering a variety of investment disciplines and providing for a large variety of mutual fund investor services. For example, fund shareholders are offered the privilege of exchanging shares of the fund for shares of other Fidelity funds, as set forth in the fund's prospectus, without paying a sales charge. The Board noted that Fidelity has taken a number of actions over the previous year that benefited particular funds, including (i) dedicating additional resources to investment research and to restructure the investment research teams; (ii) contractually agreeing to reduce the management fees on Fidelity's Institutional Money Market Funds and launching Class IV and Institutional Class of certain of these funds; (iii) reducing the transfer agent fees for the Fidelity Select Portfolios and Investor Class of the VIP funds; and (iv) launching Class K of 29 equity funds as a lower-fee class available to certain employer-sponsored retirement plans.
Investment Performance. The Board considered whether the fund has operated within its investment objective, as well as its record of compliance with its investment restrictions. It also reviewed the fund's absolute investment performance for each class, as well as the fund's relative investment performance for each class measured against (i) a broad-based securities market index, and (ii) a peer group of mutual funds deemed appropriate by the Board over multiple periods. The following charts considered by the Board show, over the one-, three-, and five-year periods ended December 31, 2007, as available, the cumulative total returns of Fidelity International Discovery (retail class) and Class B of the fund, the cumulative total returns of a broad-based securities market index ("benchmark"), and a range of cumulative total returns of a peer group of mutual funds identified by Morningstar, Inc. as having an investment style similar to that of the fund based on underlying portfolio holdings. The returns of Fidelity International Discovery (retail class) and Class B show the performance of the highest and lowest performing classes, respectively. (The fund did not offer Class K as of December 31, 2007.) The box within each chart shows the 25th percentile return (bottom of box) and the 75th percentile return (top of box) of the peer group. Returns shown above the box are in the first quartile and returns shown below the box are in the fourth quartile. The percentage beaten numbers noted below each chart correspond to the percentile box and represent the percentage of funds in the peer group whose performance was equal to or lower than that of the class indicated.
Annual Report
Board Approval of Investment Advisory Contracts and
Management Fees - continued
Fidelity International Discovery Fund
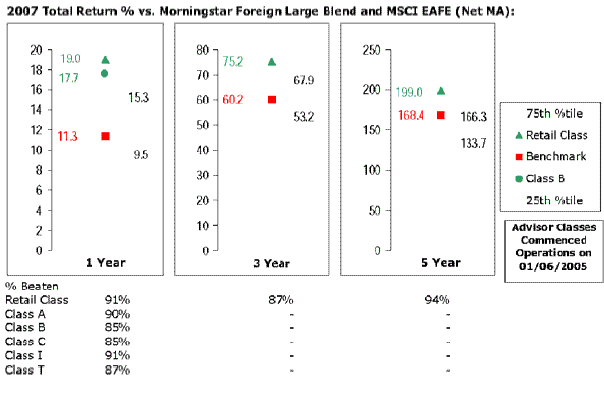
The Board reviewed the fund's relative investment performance against its peer group and stated that the performance of Fidelity International Discovery (retail class) of the fund was in the first quartile for all the periods shown. The Board also stated that the investment performance of Fidelity International Discovery (retail class) of the fund compared favorably to its benchmark for all the periods shown. The Board considered that the variations in performance among the fund's classes reflect the variations in class expenses, which result in lower performance for higher expense classes.
The Board also considered that the fund's management fee is subject to upward or downward adjustment depending upon whether, and to what extent, the fund's investment performance for the performance period exceeds, or is exceeded by, the record (over the same period) of a Board-approved performance adjustment index. The Board realizes that the performance adjustment provides FMR with a strong economic incentive to seek to achieve superior performance for the fund's shareholders and helps to more closely align the interests of FMR and the fund's shareholders.
The Board considered that FMR has taken steps to refocus and strengthen equity research, equity portfolio management, and compliance.
Based on its review, and giving particular weight to the nature and quality of the resources dedicated by the Investment Advisers to maintain and improve relative performance, the Board concluded that the nature, extent, and quality of the services provided to the fund will benefit the fund's shareholders, particularly in light of the Board's view that the fund's shareholders benefit from investing in a fund that is part of a large family of funds offering a variety of investment disciplines and services.
Annual Report
Competitiveness of Management Fee and Total Fund Expenses. The Board considered the fund's management fee and total expenses compared to "mapped groups" of competitive funds and classes. Fidelity creates "mapped groups" by combining similar Lipper investment objective categories that have comparable management fee characteristics. Combining Lipper investment objective categories aids the Board's management fee and total expense comparisons by broadening the competitive group used for comparison and by reducing the number of universes to which various Fidelity funds are compared. The Board also considered supplemental information about how the fund's management fee and total expenses ranked relative to groups based on Lipper classifications, which take into account a fund's market capitalization and style.
The Board considered two proprietary management fee comparisons for the 12-month periods shown in the chart below. The group of Lipper funds used by the Board for management fee comparisons is referred to below as the "Total Mapped Group." The Total Mapped Group comparison focuses on a fund's standing relative to the total universe of comparable funds available to investors, in terms of gross management fees before expense reimbursements or caps, and without giving effect to the fund's performance adjustment. "TMG %" represents the percentage of funds in the Total Mapped Group that had management fees that were lower than the fund's. For example, a TMG% of 14% means that 86% of the funds in the Total Mapped Group had higher management fees than the fund. The "Asset-Size Peer Group" (ASPG) comparison focuses on a fund's standing relative to non-Fidelity funds similar in size to the fund within the Total Mapped Group. The ASPG represents at least 15% of the funds in the Total Mapped Group with comparable asset size and management fee characteristics, subject to a minimum of 50 funds (or all funds in the Total Mapped Group if fewer than 50). Additional information, such as the ASPG quartile in which the fund's management fee ranked and the impact of the fund's performance adjustment, is also included in the chart and considered by the Board.
Annual Report
Board Approval of Investment Advisory Contracts and
Management Fees - continued
Fidelity International Discovery Fund
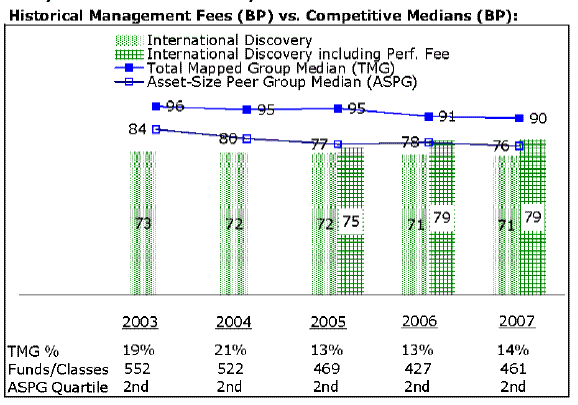
The Board noted that the fund's management fee ranked below the median of its Total Mapped Group and below the median of its ASPG for 2007. The Board also noted the effect of the fund's positive performance adjustment on the fund's management fee ranking. The Board noted that the performance adjustment for each year represents calculations for performance periods that differ from the periods shown in the performance charts above.
Based on its review, the Board concluded that the fund's management fee was fair and reasonable in light of the services that the fund receives and the other factors considered.
In its review of each class's total expenses, the Board considered the fund's management fee as well as other fund or class expenses, as applicable, such as transfer agent fees, pricing and bookkeeping fees, fund-paid 12b-1 fees, and custodial, legal, and audit fees. The Board also noted the effects of any waivers and reimbursements on fees and expenses, as well as the impact of the fund's performance adjustment. As part of its review, the Board also considered current and historical total expenses of each class of the fund compared to competitive fund median expenses. Each class of the fund is compared to those funds and classes in the Total Mapped Group (used by the Board for management fee comparisons) that have a similar sales load structure.
The Board noted that the total expenses of each of Class A, Class B, Class C, Institutional Class, and Fidelity International Discovery (retail class) ranked below its competitive median for 2007, and the total expenses of Class T ranked above its competitive median for 2007. The Board considered that the total expenses for Class T were above the median primarily because its 12b-1 fee is higher than the typical front-end load class. The Board noted that the fund offers multiple classes, each of which has a different sales load and 12b-1 fee structure, and that the multiple structures are intended to offer a range of pricing options for the intermediary market. The Board also noted that the total expenses of the classes vary primarily by the level of their 12b-1 fees, although differences in transfer agent fees may also cause expenses to vary from class to class.
Annual Report
In its review of total expenses, the Board also considered Fidelity fee structures and other information on clients that FMR and its affiliates service in other competitive markets, such as other mutual funds advised or subadvised by FMR or its affiliates, pension plan clients, and other institutional clients.
Based on its review, the Board concluded that the total expenses of each class of the fund were reasonable, although in one case above the median of the universe presented for comparison, in light of the services that the fund and its shareholders receive and the other factors considered.
Costs of the Services and Profitability. The Board considered the revenues earned and the expenses incurred by Fidelity in conducting the business of developing, marketing, distributing, managing, administering and servicing the fund and its shareholders. The Board also considered the level of Fidelity's profits in respect of all the Fidelity funds.
On an annual basis, FMR presents to the Board Fidelity's profitability for the fund. Fidelity calculates the profitability for each fund, as well as aggregate profitability for groups of Fidelity funds and all Fidelity funds, using a series of detailed revenue and cost allocation methodologies which originate with the audited books and records of Fidelity. The Audit Committee of the Board reviews any significant changes from the prior year's methodologies.
PricewaterhouseCoopers LLP (PwC), independent registered public accounting firm and auditor to Fidelity and certain Fidelity funds, has been engaged annually by the Board as part of the Board's assessment of the results of Fidelity's profitability analysis. PwC's engagement includes the review and assessment of Fidelity's methodologies used in determining the revenues and expenses attributable to Fidelity's mutual fund business, and completion of agreed-upon procedures surrounding the mathematical accuracy of fund profitability and its conformity to allocation methodologies. After considering PwC's reports issued under the engagement and information provided by Fidelity, the Board believes that while other allocation methods may also be reasonable, Fidelity's profitability methodologies are reasonable in all material respects.
The Board has also reviewed Fidelity's non-fund businesses and any fall-out benefits related to the mutual fund business as well as cases where Fidelity's affiliates may benefit from or be related to the fund's business.
Annual Report
Board Approval of Investment Advisory Contracts and
Management Fees - continued
The Board considered the costs of the services provided by and the profits realized by Fidelity in connection with the operation of the fund and determined that the amount of profit is a fair entrepreneurial profit for the management of the fund.
Economies of Scale. The Board considered whether there have been economies of scale in respect of the management of the Fidelity funds, whether the Fidelity funds (including the fund) have appropriately benefited from any such economies of scale, and whether there is potential for realization of any further economies of scale. The Board considered the extent to which the fund will benefit from economies of scale through increased services to the fund, through waivers or reimbursements, or through fee or expense reductions.
The Board recognized that the fund's management contract incorporates a "group fee" structure, which provides for lower group fee rates as total fund assets under FMR's management increase, and for higher group fee rates as total fund assets under FMR's management decrease. FMR determines the group fee rates based on a tiered asset "breakpoint" schedule. The Board considered that the group fee is designed to deliver the benefits of economies of scale to fund shareholders when total fund assets increase, even if assets of any particular fund are unchanged or have declined, because some portion of Fidelity's costs are attributable to services provided to all Fidelity funds, and all funds benefit if those costs can be allocated among more assets. The Board concluded that, given the group fee structure, fund shareholders will achieve a certain level of economies of scale as assets under FMR's management increase at the fund complex level, regardless of whether Fidelity achieves any such economies of scale.
The Board further concluded that any potential economies of scale are being shared between fund shareholders and Fidelity in an appropriate manner.
Additional Information Requested by the Board. In order to develop fully the factual basis for consideration of the Fidelity funds' Advisory Contracts, the Board requested and received additional information on certain topics, including (i) fund performance trends and actions to be taken by FMR to improve certain funds' overall performance; (ii) portfolio manager changes that have occurred during the past year; (iii) Fidelity's fund profitability methodology, the profitability of certain fund service providers, and profitability trends for certain funds; (iv) Fidelity's compensation structure for portfolio managers and key personnel, including its effects on fund profitability and the extent to which portfolio manager compensation is linked to fund performance; (v) Fidelity's fee structures and rationale for recommending different fees among categories of funds; and (vi) Fidelity's rationale for recommending which funds should have a performance adjustment component as part of their management fees.
Based on its evaluation of all of the conclusions noted above, and after considering all material factors, the Board ultimately concluded that the advisory fee structures are fair and reasonable, and that the fund's Advisory Contracts should be renewed.
Annual Report
Managing Your Investments
Fidelity offers several ways to conveniently manage your personal investments via your telephone or PC. You can access your account information, conduct trades and research your investments 24 hours a day.
By Phone
Fidelity Automated Service Telephone provides a single toll-free number to access account balances, positions, quotes and trading. It's easy to navigate the service, and on your first call, the system will help you create a personal identification number (PIN) for security.
(phone_graphic)
Fidelity Automated
Service Telephone (FAST®)
1-800-544-5555
Press
For mutual fund and brokerage trading.
For quotes.*
For account balances and holdings.
To review orders and mutual
fund activity.
To change your PIN.
To speak to a Fidelity representative.
By PC
Fidelity's web site on the Internet provides a wide range of information, including daily financial news, fund performance, interactive planning tools and news about Fidelity products and services.
(computer_graphic)
Fidelity's Web Site
www.fidelity.com
* When you call the quotes line, please remember that a fund's yield and return will vary and, except for money market funds, share price will also vary. This means that you may have a gain or loss when you sell your shares. There is no assurance that money market funds will be able to maintain a stable $1 share price; an investment in a money market fund is not insured or guaranteed by the U.S. government. Total returns are historical and include changes in share price, reinvestment of dividends and capital gains, and the effects of any sales charges.
Annual Report
Investment Adviser
Fidelity Management & Research Company
Boston, MA
Investment Sub-Advisers
FMR Co., Inc.
Fidelity Management & Research
(U.K.) Inc.
Fidelity Research & Analysis Company
FIL Investment Advisors
Fidelity Investments Japan Limited
FIL Investment Advisors (U.K.) Limited
Fidelity Management & Research
(Hong Kong) Limited
Fidelity Management & Research
(Japan) Inc.
General Distributor
Fidelity Distributors Corporation
Boston, MA
Transfer and Service Agents
Fidelity Investments Institutional
Operations Company, Inc.
Boston, MA
Fidelity Service Company, Inc.
Boston, MA
Custodian
The Northern Trust Company
Chicago, IL
The Fidelity Telephone Connection
Mutual Fund 24-Hour Service
Exchanges/Redemptions
and Account Assistance 1-800-544-6666
Product Information 1-800-544-8888
Retirement Accounts 1-800-544-4774
(8 a.m. - 9 p.m.)
TDD Service 1-800-544-0118
for the deaf and hearing impaired
(9 a.m. - 9 p.m. Eastern time)
Fidelity Automated Service
Telephone (FAST®) 1-800-544-5555
Automated line for quickest service
IGI-UANN-1208
1.807257.104

Fidelity®
International Discovery
Fund -
Class K
Annual Report
October 31, 2008
(2_fidelity_logos) (Registered_Trademark)
Contents
Chairman's Message | <Click Here> | Ned Johnson's message to shareholders. |
Performance | <Click Here> | How the fund has done over time. |
Management's Discussion | <Click Here> | The manager's review of fund performance, strategy and outlook. |
Shareholder Expense Example | <Click Here> | An example of shareholder expenses. |
Investment Changes | <Click Here> | A summary of major shifts in the fund's investments over the past six months. |
Investments | <Click Here> | A complete list of the fund's investments with their market values. |
Financial Statements | <Click Here> | Statements of assets and liabilities, operations, and changes in net assets, as well as financial highlights. |
Notes | <Click Here> | Notes to the financial statements. |
Report of Independent Registered Public Accounting Firm | <Click Here> | |
Trustees and Officers | <Click Here> | |
Proxy Voting Results | <Click Here> | |
Board Approval of Investment Advisory Contracts and Management Fees | <Click Here> | |
To view a fund's proxy voting guidelines and proxy voting record for the 12-month period ended June 30, visit http://www.fidelity.com (search for "proxy voting guidelines") or visit the Securities and Exchange Commission's (SEC) web site at http://www.sec.gov. You may also call 1-800-544-8544 to request a free copy of the proxy voting guidelines.
Standard & Poor's, S&P and S&P 500 are registered service marks of The McGraw-Hill Companies, Inc. and have been licensed for use by Fidelity Distributors Corporation.
Other third party marks appearing herein are the property of their respective owners.
All other marks appearing herein are registered or unregistered trademarks or service marks of FMR LLC or an affiliated company.
Annual Report
This report and the financial statements contained herein are submitted for the general information of the shareholders of the fund. This report is not authorized for distribution to prospective investors in the fund unless preceded or accompanied by an effective prospectus.
A fund files its complete schedule of portfolio holdings with the SEC for the first and third quarters of each fiscal year on Form N-Q. Forms N-Q are available on the SEC's web site at http://www.sec.gov. A fund's Forms N-Q may be reviewed and copied at the SEC's Public Reference Room in Washington, DC. Information regarding the operation of the SEC's Public Reference Room may be obtained by calling 1-800-SEC-0330. For a complete list of a fund's portfolio holdings, view the most recent holdings listing, semiannual report, or annual report on Fidelity's web site at http://www.fidelity.com or http://www.fidelity.com/holdings, as applicable.
NOT FDIC INSURED · MAY LOSE VALUE · NO BANK GUARANTEE
Neither the fund nor Fidelity Distributors Corporation is a bank.
Annual Report
(photo_of_Edward_C_Johnson_3d)
Dear Shareholder:
Turmoil has been the watchword for the world's securities markets in 2008, with domestic and international stocks down sharply amid the global credit squeeze. A flight to quality boosted returns for U.S. Treasuries, one of the few asset classes with positive results heading into the latter stages of the year. Financial markets are always unpredictable, but there are a number of time-tested principles that can put the historical odds in your favor.
One of the basic tenets is to invest for the long term. Over time, riding out the markets' inevitable ups and downs has proven much more effective than selling into panic or chasing the hottest trend. Even missing only a few of the markets' best days can significantly diminish investor returns. Patience also affords the benefits of compounding - of earning interest on additional income or reinvested dividends and capital gains. There are tax advantages and cost benefits to consider as well. The more you sell, the more taxes you pay, and the more you trade, the higher the costs. While staying the course doesn't eliminate risk, it can considerably lessen the effect of short-term declines.
You can further manage your investing risk through diversification. And today, more than ever, geographic diversification should be taken into account. Studies indicate that asset allocation is the single most important determinant of a portfolio's long-term success. The right mix of stocks, bonds and cash - aligned to your particular risk tolerance and investment objective - is very important. Age-appropriate rebalancing is also an essential aspect of asset allocation. For younger investors, an emphasis on equities - which historically have been the best-performing asset class over time - is encouraged. As investors near their specific goal, such as retirement or sending a child to college, consideration may be given to replacing volatile assets (e.g. common stocks) with more-stable fixed investments (bonds or savings plans).
A third investment principle - investing regularly - can help lower the average cost of your purchases. Investing a certain amount of money each month or quarter helps ensure you won't pay for all your shares at market highs. This strategy - known as dollar cost averaging - also reduces unconstructive "emotion" from investing, helping shareholders avoid selling weak performers just prior to an upswing, or chasing a hot performer just before a correction.
We invite you to contact us via the Internet, through our Investor Centers or over the phone. It is our privilege to provide you the information you need to make the investments that are right for you.
Sincerely,
/s/Edward C. Johnson 3d
Edward C. Johnson 3d
Annual Report
Average annual total return reflects the change in the value of an investment, assuming reinvestment of the class' dividend income and capital gains (the profits earned upon the sale of securities that have grown in value, if any) and assuming a constant rate of performance each year. The $10,000 table and the fund's returns do not reflect the deduction of taxes that a shareholder would pay on fund distributions or the redemption of fund shares. During periods of reimbursement by Fidelity, a fund's total return will be greater than it would be had the reimbursement not occurred. How a fund did yesterday is no guarantee of how it will do tomorrow.
Average Annual Total Returns
Periods ended October 31, 2008 | Past 1
year | Past 5
years | Past 10
years |
Class KA,B | -47.50% | 4.99% | 5.99% |
A The initial offering of Class K shares took place on May 9, 2008. Returns prior to May 9, 2008 are those of International Discovery, the original class of the fund.
B Prior to October 1, 2004, the fund operated under certain different investment policies. Accordingly, the fund's historical performances may not represent its current investment policies.
Annual Report
$10,000 Over 10 Years
Let's say hypothetically that $10,000 was invested in Fidelity International Discovery Fund - Class K, a class of the fund on October 31, 1998. The chart shows how the value of your investment would have changed, and also shows how the MSCI® EAFE ® Index (Europe, Australasia, Far East) performed over the same period. The initial offering of Class K took place on May 9, 2008. See above for additional information regarding the performance of Class K.
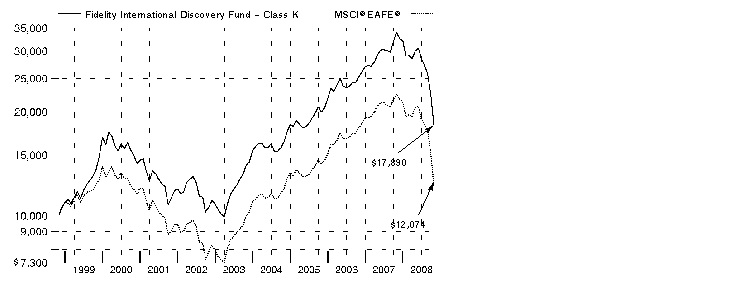
Annual Report
Comments from William Kennedy, Portfolio Manager of Fidelity® International Discovery Fund
In a dramatic reversal of what had been a multiyear global growth story, international stocks fell long and hard during the 12 months ending October 31, 2008, especially so during the latter stages of the period and mostly as a result of fallout from the financial crisis that emanated from the United States. The viral spread of this financial contagion - which began in the U.S. subprime mortgage market, then seized up the credit markets, hobbled major financial institutions and eventually slowed economic growth worldwide - left virtually no corner of the globe untouched. Developed international equity markets - as gauged by the MSCI® Europe, Australasia, Far East (EAFE®) Index, which monitors established markets outside the U.S. and Canada - fell 46.54%, while the Standard & Poor's 500SM Index, a measure of U.S. stocks, dropped 36.10%. Among countries constituting at least 1% of the EAFE index, Switzerland had the "least worst" showing, falling roughly 32%, followed by Japan, where stocks slid by around 37%. Meanwhile, the weakest overall performance came from Belgium, where stocks slipped by nearly 70%. In the United Kingdom, the largest component of the index, equities were down almost 48%. Emerging markets were the weakest performers among the global economies, declining 56.22% as measured by the MSCI Emerging Markets Index.
For the 12 months ending October 31, 2008, the fund's Class K shares trailed the MSCI EAFE's return. (For specific class-level returns, please see the performance section of this shareholder report.) Stock selection in Japan, where the yen was strong, detracted from performance. Stock selection in the energy, utilities and industrials sectors was also disappointing, as were currency impacts on our emerging markets holdings. The fund lost ground from not owning index component Volkswagen, the German car company, as a competitor bought shares that drove the stock price up. Other detractors included Babcock & Brown, an Australian infrastructure development company hurt by the credit crunch. It was no longer held at period end. An underweighting in BP, a British integrated oil company that held up well as energy prices declined, further undermined returns. On the upside, the fund benefited from a small cash position as well as country and sector weightings, including underweightings in financials and materials and an overweighting in health care. Top contributors included CSL, an Australian company with steady growth from its blood plasma and biotechnology businesses. Not owning Fortis, a Belgian diversified financials company in the index, also helped, as the company ran into funding difficulties.
The views expressed above reflect those of the portfolio manager(s) only through the end of the period as stated on the cover of this report and do not necessarily represent the views of Fidelity or any other person in the Fidelity organization. Any such views are subject to change at any time based upon market or other conditions and Fidelity disclaims any responsibility to update such views. These views may not be relied on as investment advice and, because investment decisions for a Fidelity fund are based on numerous factors, may not be relied on as an indication of trading intent on behalf of any Fidelity fund.
Annual Report
Shareholder Expense Example
As a shareholder of the Fund, you incur two types of costs: (1) transaction costs, including sales charges (loads) on redemptions of shares purchased prior to October 12, 1990, and redemption fees, and (2) ongoing costs, including management fees, distribution and/or service (12b-1) fees and other Fund expenses. This Example is intended to help you understand your ongoing costs (in dollars) of investing in the Fund and to compare these costs with the ongoing costs of investing in other mutual funds.
The actual expense Example is based on an investment of $1,000 invested at the beginning of the period and held for the entire period (May 1, 2008 to October 31, 2008) for the Class A, Class T, Class B, Class C, International Discovery and Institutional Class and for the entire period (May 9, 2008 to October 31, 2008) for Class K. The hypothetical expense Example is based on an investment of $1,000 invested for the one half year period (May 1, 2008 to October 31, 2008).
Actual Expenses
The first line of the accompanying table for each class of the Fund provides information about actual account values and actual expenses. You may use the information in this line, together with the amount you invested, to estimate the expenses that you paid over the period. Simply divide your account value by $1,000.00 (for example, an $8,600 account value divided by $1,000.00 = 8.6), then multiply the result by the number in the first line for a class of the Fund under the heading entitled "Expenses Paid During Period" to estimate the expenses you paid on your account during this period. A small balance maintenance fee of $12.00 that is charged once a year may apply for certain accounts with a value of less than $2,000. This fee is not included in the table below. If it was, the estimate of expenses you paid during the period would be higher, and your ending account value lower, by this amount. In addition, the Fund, as a shareholder in the underlying Fidelity Central Funds, will indirectly bear its pro rata share of the fees and expenses incurred by the underlying Fidelity Central Funds. These fees and expenses are not included in the Fund's annualized expense ratio used to calculate the expense estimate in the table below.
Hypothetical Example for Comparison Purposes
The second line of the accompanying table for each class of the Fund provides information about hypothetical account values and hypothetical expenses based on a Class' actual expense ratio and an assumed rate of return of 5% per year before expenses, which is not the Class' actual return. The hypothetical account values and expenses may not be used to estimate the actual ending account balance or expenses you paid for the period. You may use this information to compare the ongoing costs of investing in the Fund and other funds. To do so, compare this 5% hypothetical example with the 5% hypothetical examples that appear in the shareholder reports of the other funds. A small balance maintenance fee of $12.00 that is charged once a year may apply for certain accounts with a value of less than $2,000. This fee is not included in the table below. If it was, the estimate of expenses you paid during the period would be higher, and your ending account value lower, by this amount. In addition, the Fund, as a shareholder in the underlying Fidelity Central Funds, will indirectly bear its pro rata share of the fees and expenses incurred by the underlying Fidelity Central Funds. These fees and expenses are not included in the Fund's annualized expense ratio used to calculate the expense estimate in the table below.
Annual Report
Please note that the expenses shown in the table are meant to highlight your ongoing costs only and do not reflect any transaction costs. Therefore, the second line of the table is useful in comparing ongoing costs only, and will not help you determine the relative total costs of owning different funds. In addition, if these transactional costs were included, your costs would have been higher.
| Annualized Expense Ratio | Beginning
Account Value
May 1, 2008 | Ending
Account Value
October 31, 2008 | Expenses Paid
During Period |
Class A | 1.33% | | | |
Actual | | $ 1,000.00 | $ 594.40 | $ 5.33 B |
Hypothetical A | | $ 1,000.00 | $ 1,018.45 | $ 6.75 C |
Class T | 1.68% | | | |
Actual | | $ 1,000.00 | $ 593.30 | $ 6.73 B |
Hypothetical A | | $ 1,000.00 | $ 1,016.69 | $ 8.52 C |
Class B | 2.19% | | | |
Actual | | $ 1,000.00 | $ 591.80 | $ 8.76 B |
Hypothetical A | | $ 1,000.00 | $ 1,014.13 | $ 11.09 C |
Class C | 2.18% | | | |
Actual | | $ 1,000.00 | $ 591.90 | $ 8.72 B |
Hypothetical A | | $ 1,000.00 | $ 1,014.18 | $ 11.04 C |
International Discovery | 1.08% | | | |
Actual | | $ 1,000.00 | $ 594.90 | $ 4.33 B |
Hypothetical A | | $ 1,000.00 | $ 1,019.71 | $ 5.48 C |
Class K | .93% | | | |
Actual | | $ 1,000.00 | $ 592.80 | $ 3.56 B |
Hypothetical A | | $ 1,000.00 | $ 1,020.46 | $ 4.72 C |
Institutional Class | 1.06% | | | |
Actual | | $ 1,000.00 | $ 595.20 | $ 4.25 B |
Hypothetical A | | $ 1,000.00 | $ 1,019.81 | $ 5.38 C |
A 5% return per year before expenses
B Actual expenses are equal to each Class' annualized expense ratio (shown in the table below); multiplied by the average account value over the period, multiplied by 184/366 (to reflect the one-half year period) for Class A, Class T, Class B, Class C, International Discovery and Institutional Class and multiplied by 176/366 (to reflect the period May 9, 2008 to October 31, 2008) for Class K.
C Hypothetical expenses are equal to each Class' annualized expense ratio (shown in the table below); multiplied by the average account value over the period, multiplied by 184/366 (to reflect the one-half year period).
Annual Report
Investment Changes (Unaudited)
Geographic Diversification (% of fund's net assets) |
As of October 31, 2008 |
| United Kingdom 22.5% |
| Japan 16.0% |
| Switzerland 12.5% |
| Germany 12.1% |
| United States of America 6.9% |
| France 5.7% |
| Australia 5.0% |
| Spain 3.9% |
| Italy 2.0% |
| Other 13.4% |

Percentages are adjusted for the effect of futures contracts, if applicable. |
|
As of April 30, 2008 |
| United Kingdom 17.5% |
| Japan 15.4% |
| Germany 12.6% |
| Switzerland 8.0% |
| France 6.7% |
| Australia 5.4% |
| United States of America 4.2% |
| Spain 3.8% |
| Canada 3.0% |
| Other 23.4% |

Percentages are adjusted for the effect of futures contracts, if applicable. |
Asset Allocation |
| % of fund's
net assets | % of fund's net assets
6 months ago |
Stocks and Equity Futures | 94.3 | 96.3 |
Short-Term Investments and Net Other Assets | 5.7 | 3.7 |
Top Ten Stocks as of October 31, 2008 |
| % of fund's
net assets | % of fund's net assets
6 months ago |
Nestle SA (Reg.) (Switzerland, Food Products) | 3.0 | 1.8 |
Royal Dutch Shell PLC Class B (United Kingdom, Oil, Gas & Consumable Fuels) | 2.7 | 2.0 |
Roche Holding AG (participation certificate) (Switzerland, Pharmaceuticals) | 2.2 | 0.9 |
E.ON AG (Germany, Electric Utilities) | 2.2 | 2.0 |
CSL Ltd. (Australia, Biotechnology) | 2.1 | 1.7 |
Vodafone Group PLC (United Kingdom, Wireless Telecommunication Services) | 2.0 | 1.6 |
Telefonica SA (Spain, Diversified Telecommunication Services) | 1.9 | 1.6 |
HSBC Holdings PLC (United Kingdom) (Reg.) (United Kingdom, Commercial Banks) | 1.9 | 0.7 |
Toyota Motor Corp. (Japan, Automobiles) | 1.5 | 1.0 |
BHP Billiton PLC (United Kingdom, Metals & Mining) | 1.5 | 1.2 |
| 21.0 | |
Market Sectors as of October 31, 2008 |
| % of fund's
net assets | % of fund's net assets
6 months ago |
Financials | 19.8 | 20.2 |
Health Care | 15.8 | 9.2 |
Consumer Staples | 10.8 | 8.6 |
Telecommunication Services | 7.7 | 6.9 |
Energy | 7.5 | 9.4 |
Information Technology | 7.3 | 9.1 |
Consumer Discretionary | 6.7 | 7.2 |
Industrials | 5.9 | 9.9 |
Utilities | 5.5 | 6.0 |
Materials | 5.1 | 8.4 |
Annual Report
Investments October 31, 2008
Showing Percentage of Net Assets
Common Stocks - 90.7% |
| Shares | | Value (000s) |
Australia - 5.0% |
ABB Grain Ltd. | 1,694,386 | | $ 9,253 |
Commonwealth Bank of Australia | 1,505,851 | | 41,142 |
Computershare Ltd. | 7,275,075 | | 41,108 |
CSL Ltd. | 6,733,245 | | 163,665 |
National Australia Bank Ltd. | 2,188,189 | | 35,487 |
QBE Insurance Group Ltd. | 2,204,978 | | 37,599 |
Westpac Banking Corp. | 240,907 | | 3,304 |
Woolworths Ltd. | 3,270,417 | | 60,934 |
TOTAL AUSTRALIA | | 392,492 |
Belgium - 0.1% |
Hansen Transmission International NV | 6,191,000 | | 10,384 |
Brazil - 0.4% |
BM&F BOVESPA SA | 3,185,693 | | 8,464 |
Vivo Participacoes SA sponsored ADR | 2,046,100 | | 22,384 |
TOTAL BRAZIL | | 30,848 |
Canada - 1.6% |
Canadian Natural Resources Ltd. | 585,000 | | 29,507 |
Niko Resources Ltd. | 498,400 | | 21,824 |
Open Text Corp. (a)(d) | 1,858,400 | | 47,100 |
Petrobank Energy & Resources Ltd. (a) | 813,500 | | 15,517 |
Talisman Energy, Inc. | 1,185,900 | | 11,713 |
Timminco Ltd. (a) | 484,400 | | 2,732 |
TOTAL CANADA | | 128,393 |
Cayman Islands - 0.2% |
China Dongxiang Group Co. Ltd. | 49,139,000 | | 14,456 |
China - 0.3% |
ZTE Corp. (H Shares) | 9,367,280 | | 21,181 |
Cyprus - 0.0% |
Aisi Realty Public Ltd. (a)(e) | 10,023,000 | | 1,469 |
Czech Republic - 0.4% |
Ceske Energeticke Zavody AS | 726,800 | | 31,451 |
Denmark - 1.1% |
Novo Nordisk AS Series B | 1,562,200 | | 83,738 |
Finland - 0.9% |
Nokia Corp. sponsored ADR (d) | 4,627,100 | | 70,239 |
France - 5.7% |
Alstom SA | 1,018,312 | | 50,471 |
AXA SA | 1,784,766 | | 34,096 |
Common Stocks - continued |
| Shares | | Value (000s) |
France - continued |
BNP Paribas SA | 1,261,039 | | $ 91,049 |
Cap Gemini SA | 684,300 | | 22,048 |
CNP Assurances | 218,000 | | 17,566 |
Eutelsat Communications | 2,321,754 | | 49,832 |
GDF Suez | 1,614,778 | | 72,180 |
L'Air Liquide SA | 497,774 | | 42,955 |
LVMH Moet Hennessy - Louis Vuitton | 272,400 | | 18,127 |
Orpea (a)(d) | 560,828 | | 18,246 |
Sechilienne-Sidec | 182,432 | | 7,005 |
Societe Generale Series A | 441,320 | | 24,054 |
TOTAL FRANCE | | 447,629 |
Germany - 11.0% |
Allianz AG (Reg.) | 748,030 | | 55,980 |
Bayer AG | 551,600 | | 30,707 |
Bayer AG sponsored ADR | 237,840 | | 13,131 |
Beiersdorf AG | 90,350 | | 4,790 |
Daimler AG (Reg.) | 340,400 | | 11,771 |
Deutsche Bank AG | 507,100 | | 19,256 |
Deutsche Boerse AG | 267,325 | | 21,375 |
Deutsche Telekom AG (Reg.) | 4,103,000 | | 61,284 |
E.ON AG | 4,453,900 | | 170,392 |
Fresenius Medical Care AG | 808,400 | | 36,766 |
GEA Group AG | 1,773,100 | | 25,912 |
Gerresheimer AG | 1,207,200 | | 42,322 |
Linde AG | 550,793 | | 46,257 |
Muenchener Rueckversicherungs-Gesellschaft AG (Reg.) | 786,000 | | 104,322 |
Q-Cells AG (a)(d) | 365,515 | | 14,379 |
RWE AG | 1,232,900 | | 103,032 |
Siemens AG (Reg.) | 645,600 | | 38,688 |
SolarWorld AG (d) | 804,033 | | 20,264 |
Symrise AG | 1,793,000 | | 22,271 |
Wincor Nixdorf AG | 256,500 | | 11,222 |
TOTAL GERMANY | | 854,121 |
Greece - 0.3% |
Public Power Corp. of Greece | 1,609,345 | | 19,900 |
Hong Kong - 1.1% |
Cheung Kong Holdings Ltd. | 3,875,000 | | 37,206 |
China Unicom (Hong Kong) Ltd. | 13,364,000 | | 19,080 |
Hang Seng Bank Ltd. | 2,361,100 | | 29,460 |
TOTAL HONG KONG | | 85,746 |
Common Stocks - continued |
| Shares | | Value (000s) |
India - 0.8% |
Infosys Technologies Ltd. | 718,452 | | $ 20,942 |
Reliance Industries Ltd. | 409,023 | | 11,627 |
Satyam Computer Services Ltd. | 3,263,566 | | 20,633 |
Titan Industries Ltd. | 390,000 | | 8,175 |
TOTAL INDIA | | 61,377 |
Indonesia - 0.2% |
PT Bumi Resources Tbk | 47,032,000 | | 6,158 |
PT Indosat Tbk | 24,300,500 | | 11,764 |
TOTAL INDONESIA | | 17,922 |
Ireland - 0.3% |
Paddy Power PLC (Ireland) | 1,445,597 | | 24,647 |
Israel - 0.9% |
Nice Systems Ltd. sponsored ADR (a) | 918,700 | | 20,542 |
Teva Pharmaceutical Industries Ltd. sponsored ADR | 1,085,700 | | 46,555 |
TOTAL ISRAEL | | 67,097 |
Italy - 1.7% |
ENI SpA | 3,210,300 | | 76,624 |
Fiat SpA | 3,091,100 | | 24,567 |
Finmeccanica SpA | 788,864 | | 9,651 |
Finmeccanica SpA rights 11/7/08 (a) | 1,232,600 | | 524 |
Prysmian SpA | 1,016,400 | | 12,330 |
UniCredit SpA | 5,114,800 | | 12,515 |
TOTAL ITALY | | 136,211 |
Japan - 13.8% |
Aeon Mall Co. Ltd. | 1,073,500 | | 26,499 |
Asics Corp. | 3,914,000 | | 24,523 |
Canon Marketing Japan, Inc. | 2,296,500 | | 38,417 |
Canon, Inc. | 1,697,450 | | 59,394 |
Daiwa Securities Group, Inc. | 5,423,000 | | 30,658 |
East Japan Railway Co. | 10,753 | | 76,514 |
Konica Minolta Holdings, Inc. | 2,130,500 | | 13,991 |
Matsushita Electric Industrial Co. Ltd. | 4,011,000 | | 64,589 |
Mitsubishi Corp. | 3,196,500 | | 53,577 |
Mitsubishi UFJ Financial Group, Inc. | 16,855,700 | | 105,919 |
Mitsui & Co. Ltd. | 3,040,000 | | 29,455 |
Nintendo Co. Ltd. | 91,250 | | 28,470 |
Nippon Building Fund, Inc. | 2,590 | | 24,886 |
Nippon Telegraph & Telephone Corp. | 12,237 | | 49,933 |
Common Stocks - continued |
| Shares | | Value (000s) |
Japan - continued |
Nomura Holdings, Inc. | 9,963,700 | | $ 94,395 |
Promise Co. Ltd. | 1,379,000 | | 24,751 |
Rakuten, Inc. (d) | 46,965 | | 23,281 |
Ricoh Co. Ltd. | 3,390,000 | | 36,481 |
Seven & I Holdings Co. Ltd. | 1,143,400 | | 32,103 |
Sony Corp. sponsored ADR | 465,300 | | 10,814 |
Sony Financial Holdings, Inc. | 6,285 | | 20,440 |
Sumitomo Mitsui Financial Group, Inc. | 16,438 | | 65,894 |
Tokyo Electron Ltd. | 691,700 | | 23,063 |
Toyota Motor Corp. | 2,939,300 | | 114,777 |
TOTAL JAPAN | | 1,072,824 |
Korea (South) - 0.9% |
LG Household & Health Care Ltd. | 207,070 | | 29,672 |
NHN Corp. (a) | 346,842 | | 37,026 |
TOTAL KOREA (SOUTH) | | 66,698 |
Luxembourg - 0.6% |
Reinet Investments SCA (a) | 29,552 | | 308 |
Reinet Investments SCA (a) | 186,332 | | 3,618 |
SES SA (A Shares) FDR unit | 2,399,068 | | 41,107 |
TOTAL LUXEMBOURG | | 45,033 |
Malaysia - 0.1% |
KNM Group Bhd | 32,198,300 | | 5,460 |
Mexico - 0.5% |
America Movil SAB de CV Series L sponsored ADR | 1,262,200 | | 39,052 |
Netherlands - 1.5% |
AMG Advanced Metallurgical Group NV (a)(d) | 585,100 | | 9,471 |
ASML Holding NV (Netherlands) | 485,800 | | 8,505 |
Gemalto NV (a) | 331,217 | | 9,280 |
Koninklijke KPN NV | 6,660,700 | | 93,804 |
TOTAL NETHERLANDS | | 121,060 |
Norway - 0.2% |
Pronova BioPharma ASA | 4,726,590 | | 12,279 |
Papua New Guinea - 0.3% |
Oil Search Ltd. | 6,566,347 | | 19,883 |
Russia - 0.4% |
OAO Gazprom sponsored ADR | 1,657,700 | | 33,900 |
Singapore - 0.1% |
Singapore Exchange Ltd. | 2,172,000 | | 7,775 |
Common Stocks - continued |
| Shares | | Value (000s) |
Spain - 3.9% |
Banco Santander SA | 3,311,500 | | $ 35,814 |
Grifols SA | 3,624,108 | | 72,123 |
Red Electrica Corporacion SA | 628,000 | | 27,526 |
Repsol YPF SA | 1,089,200 | | 20,712 |
Telefonica SA | 8,021,700 | | 148,521 |
TOTAL SPAIN | | 304,696 |
Sweden - 0.1% |
Modern Times Group MTG AB (B Shares) | 540,150 | | 11,588 |
Switzerland - 12.5% |
Actelion Ltd. (Reg.) (a) | 1,419,010 | | 74,947 |
BB BIOTECH AG | 354,261 | | 22,463 |
Credit Suisse Group (Reg.) | 1,149,050 | | 42,958 |
EFG International | 1,978,630 | | 42,586 |
Julius Baer Holding AG | 488,128 | | 19,087 |
Nestle SA (Reg.) | 6,009,533 | | 233,639 |
Novartis AG: | | | |
(Reg.) | 1,609,626 | | 81,684 |
sponsored ADR | 994,500 | | 50,710 |
Roche Holding AG (participation certificate) | 1,115,576 | | 170,565 |
SGS Societe Generale de Surveillance Holding SA (Reg.) | 25,313 | | 24,916 |
Sonova Holding AG | 574,683 | | 23,873 |
Syngenta AG (Switzerland) | 426,660 | | 79,740 |
Tecan Group AG | 212,300 | | 9,529 |
The Swatch Group AG (Bearer) | 75,432 | | 11,768 |
UBS AG (For. Reg.) | 516,022 | | 8,754 |
Zurich Financial Services AG (Reg.) | 389,534 | | 79,011 |
TOTAL SWITZERLAND | | 976,230 |
Thailand - 0.1% |
Total Access Communication PCL unit | 14,109,900 | | 10,085 |
United Kingdom - 22.5% |
AstraZeneca PLC (United Kingdom) | 1,559,200 | | 66,068 |
Autonomy Corp. PLC (a) | 1,365,900 | | 21,655 |
BAE Systems PLC | 8,539,409 | | 47,994 |
Barclays PLC | 3,933,200 | | 11,273 |
BG Group PLC | 2,944,100 | | 43,285 |
BG Group PLC sponsored ADR | 207,400 | | 15,534 |
BHP Billiton PLC | 6,691,800 | | 113,616 |
BP PLC | 6,979,400 | | 56,885 |
British American Tobacco PLC: | | | |
(United Kingdom) | 3,175,400 | | 87,088 |
Common Stocks - continued |
| Shares | | Value (000s) |
United Kingdom - continued |
British American Tobacco PLC: - continued | | | |
sponsored ADR | 404,500 | | $ 21,989 |
Capita Group PLC | 4,290,793 | | 44,331 |
Compass Group PLC | 4,055,000 | | 18,854 |
Diageo PLC | 1,514,500 | | 23,109 |
GlaxoSmithKline PLC sponsored ADR | 1,381,600 | | 53,468 |
HSBC Holdings PLC: | | | |
(Hong Kong) (Reg.) | 3,704,844 | | 44,100 |
(United Kingdom) (Reg.) | 12,259,500 | | 145,186 |
Imperial Tobacco Group PLC | 1,644,800 | | 44,078 |
Informa PLC | 7,983,600 | | 27,045 |
Man Group PLC | 10,947,800 | | 63,199 |
Misys PLC | 7,892,600 | | 14,131 |
Prudential PLC | 6,511,200 | | 32,704 |
Reckitt Benckiser Group PLC | 2,636,700 | | 111,518 |
Rio Tinto PLC (Reg.) | 1,712,500 | | 79,985 |
Royal Bank of Scotland Group PLC | 10,165,495 | | 11,196 |
Royal Dutch Shell PLC Class B | 7,883,059 | | 213,697 |
Shire PLC | 1,814,400 | | 23,859 |
SSL International PLC | 6,429,705 | | 43,420 |
Standard Chartered PLC (United Kingdom) | 990,000 | | 16,360 |
Unilever PLC | 3,552,700 | | 79,805 |
Vodafone Group PLC | 80,550,435 | | 154,937 |
William Morrison Supermarkets PLC | 6,595,100 | | 28,078 |
TOTAL UNITED KINGDOM | | 1,758,447 |
United States of America - 1.2% |
Macquarie Infrastructure Co. LLC | 131,000 | | 1,330 |
Philip Morris International, Inc. | 1,529,600 | | 66,492 |
Visa, Inc. | 440,500 | | 24,382 |
TOTAL UNITED STATES OF AMERICA | | 92,204 |
TOTAL COMMON STOCKS (Cost $9,659,419) | 7,076,515 |
Nonconvertible Preferred Stocks - 1.4% |
| | | |
Germany - 1.1% |
Fresenius AG (non-vtg.) | 1,371,100 | | 88,425 |
Nonconvertible Preferred Stocks - continued |
| Shares | | Value (000s) |
Italy - 0.3% |
Intesa Sanpaolo SpA | 6,761,102 | | $ 20,068 |
TOTAL NONCONVERTIBLE PREFERRED STOCKS (Cost $135,122) | 108,493 |
Government Obligations - 0.3% |
| Principal Amount (000s) | | |
United States of America - 0.3% |
U.S. Treasury Bills, yield at date of purchase 0.33% to 1.72% 12/4/08 to 1/29/09 (f)
(Cost $20,322) | | $ 20,350 | | 20,341 |
Money Market Funds - 8.5% |
| Shares | | |
Fidelity Cash Central Fund, 1.81% (b) | 645,326,349 | | 645,326 |
Fidelity Securities Lending Cash Central Fund, 2.67% (b)(c) | 20,061,695 | | 20,062 |
TOTAL MONEY MARKET FUNDS (Cost $665,388) | 665,388 |
TOTAL INVESTMENT PORTFOLIO - 100.9% (Cost $10,480,251) | | 7,870,737 |
NET OTHER ASSETS - (0.9)% | | (73,080) |
NET ASSETS - 100% | $ 7,797,657 |
Futures Contracts |
| Expiration Date | | Underlying Face Amount at Value
(000s) | | Unrealized Appreciation/
(Depreciation) (000s) |
Purchased |
Equity Index Contracts |
1,759 CME Nikkei 225 Index Contracts (Japan) | Dec. 2008 | | $ 78,583 | | $ (28,790) |
1,070 TOPIX 150 Index Contracts (Japan) | Dec. 2008 | | 92,755 | | (36,491) |
TOTAL EQUITY INDEX CONTRACTS | | $ 171,338 | | $ (65,281) |
|
The face value of futures purchased as a percentage of net assets - 2.2% |
Legend |
(a) Non-income producing |
(b) Affiliated fund that is available only to investment companies and other accounts managed by Fidelity Investments. The rate quoted is the annualized seven-day yield of the fund at period end. A complete unaudited listing of the fund's holdings as of its most recent quarter end is available upon request. |
(c) Investment made with cash collateral received from securities on loan. |
(d) Security or a portion of the security is on loan at period end. |
(e) Affiliated company |
(f) Security or a portion of the security was pledged to cover margin requirements for futures contracts. At the period end, the value of securities pledged amounted to $20,341,000. |
Affiliated Central Funds |
Information regarding fiscal year to date income earned by the Fund from investments in Fidelity Central Funds is as follows: |
Fund | Income earned
(Amounts in thousands) |
Fidelity Cash Central Fund | $ 24,831 |
Fidelity Securities Lending Cash Central Fund | 11,130 |
Total | $ 35,961 |
Other Affiliated Issuers |
An affiliated company is a company in which the fund has ownership of at least 5% of the voting securities. Fiscal year to date transactions with companies which are or were affiliates are as follows: |
Affiliates
(Amounts in thousands) | Value, beginning of period | Purchases | Sales Proceeds | Dividend Income | Value,
end of
period |
Aisi Realty Public Ltd. | $ 8,752 | $ - | $ - | $ - | $ 1,469 |
Renovo Group PLC | 42,523 | - | 6,236 | - | - |
Total | $ 51,275 | $ - | $ 6,236 | $ - | $ 1,469 |
Income Tax Information
At October 31, 2008, the fund had a capital loss carryforward of approximately $637,482,000 all of which will expire on October 31, 2016. |
See accompanying notes which are an integral part of the financial statements.
Annual Report
Statement of Assets and Liabilities
Amounts in thousands (except per-share amounts) | October 31, 2008 |
| | |
Assets | | |
Investment in securities, at value (including securities loaned of $19,297) - See accompanying schedule: Unaffiliated issuers (cost $9,808,248) | $ 7,203,880 | |
Fidelity Central Funds (cost $665,388) | 665,388 | |
Other affiliated issuers (cost $6,615) | 1,469 | |
Total Investments (cost $10,480,251) | | $ 7,870,737 |
Foreign currency held at value (cost $5,841) | | 5,690 |
Receivable for investments sold | | 66,423 |
Receivable for fund shares sold | | 14,159 |
Dividends receivable | | 25,197 |
Distributions receivable from Fidelity Central Funds | | 856 |
Other receivables | | 1,128 |
Total assets | | 7,984,190 |
| | |
Liabilities | | |
Payable for investments purchased | $ 141,169 | |
Payable for fund shares redeemed | 9,351 | |
Accrued management fee | 5,296 | |
Distribution fees payable | 155 | |
Payable for daily variation on futures contracts | 7,529 | |
Other affiliated payables | 2,276 | |
Other payables and accrued expenses | 695 | |
Collateral on securities loaned, at value | 20,062 | |
Total liabilities | | 186,533 |
| | |
Net Assets | | $ 7,797,657 |
Net Assets consist of: | | |
Paid in capital | | $ 10,988,479 |
Undistributed net investment income | | 120,184 |
Accumulated undistributed net realized gain (loss) on investments and foreign currency transactions | | (636,064) |
Net unrealized appreciation (depreciation) on investments and assets and liabilities in foreign currencies | | (2,674,942) |
Net Assets | | $ 7,797,657 |
See accompanying notes which are an integral part of the financial statements.
Annual Report
Statement of Assets and Liabilities - continued
Amounts in thousands (except per-share amounts) | October 31, 2008 |
| | |
Calculation of Maximum Offering Price
Class A:
Net Asset Value and redemption price per share ($379,564 ÷ 16,031.5 shares) | | $ 23.68 |
| | |
Maximum offering price per share (100/94.25 of $23.68) | | $ 25.12 |
Class T:
Net Asset Value and redemption price per share ($63,690 ÷ 2,711.8 shares) | | $ 23.49 |
| | |
Maximum offering price per share (100/96.50 of $23.49) | | $ 24.34 |
Class B:
Net Asset Value and offering price per share ($14,961 ÷ 643.5 shares) A | | $ 23.25 |
| | |
Class C:
Net Asset Value and offering price per share ($36,410 ÷ 1,562.3 shares) A | | $ 23.31 |
| | |
| | |
International Discovery:
Net Asset Value, offering price and redemption price per share ($6,998,759 ÷ 293,060.0 shares) | | $ 23.88 |
| | |
Class K:
Net Asset Value, offering price and redemption price per share ($145,192 ÷ 6,074.3 shares) | | $ 23.90 |
| | |
Institutional Class:
Net Asset Value, offering price and redemption price per share ($159,081 ÷ 6,654.3 shares) | | $ 23.91 |
A Redemption price per share is equal to net asset value less any applicable contingent deferred sales charge.
See accompanying notes which are an integral part of the financial statements.
Annual Report
Financial Statements - continued
Statement of Operations
Amounts in thousands | Year ended October 31, 2008 |
| | |
Investment Income | | |
Dividends | | $ 318,308 |
Interest | | 161 |
Income from Fidelity Central Funds | | 35,961 |
| | 354,430 |
Less foreign taxes withheld | | (27,021) |
Total income | | 327,409 |
| | |
Expenses | | |
Management fee
Basic fee | $ 90,977 | |
Performance adjustment | 13,226 | |
Transfer agent fees | 28,436 | |
Distribution fees | 2,431 | |
Accounting and security lending fees | 1,917 | |
Custodian fees and expenses | 2,341 | |
Independent trustees' compensation | 56 | |
Registration fees | 466 | |
Audit | 115 | |
Legal | 65 | |
Miscellaneous | 1,638 | |
Total expenses before reductions | 141,668 | |
Expense reductions | (5,009) | 136,659 |
Net investment income (loss) | | 190,750 |
Realized and Unrealized Gain (Loss) Net realized gain (loss) on: | | |
Investment securities: | | |
Unaffiliated issuers (net of foreign taxes of $366) | (569,251) | |
Other affiliated issuers | (20,894) | |
Foreign currency transactions | (36,433) | |
Futures contracts | (37,990) | |
Total net realized gain (loss) | | (664,568) |
Change in net unrealized appreciation (depreciation) on: Investment securities (net of decrease in deferred foreign taxes of $4,165) | (6,819,805) | |
Assets and liabilities in foreign currencies | (192) | |
Futures contracts | (68,439) | |
Total change in net unrealized appreciation (depreciation) | | (6,888,436) |
Net gain (loss) | | (7,553,004) |
Net increase (decrease) in net assets resulting from operations | | $ (7,362,254) |
See accompanying notes which are an integral part of the financial statements.
Annual Report
Statement of Changes in Net Assets
Amounts in thousands | Year ended
October 31,
2008 | Year ended
October 31,
2007 |
Increase (Decrease) in Net Assets | | |
Operations | | |
Net investment income (loss) | $ 190,750 | $ 144,458 |
Net realized gain (loss) | (664,568) | 608,100 |
Change in net unrealized appreciation (depreciation) | (6,888,436) | 2,677,967 |
Net increase (decrease) in net assets resulting
from operations | (7,362,254) | 3,430,525 |
Distributions to shareholders from net investment income | (129,574) | (85,862) |
Distributions to shareholders from net realized gain | (528,706) | (224,325) |
Total distributions | (658,280) | (310,187) |
Share transactions - net increase (decrease) | 1,069,130 | 3,385,409 |
Redemption fees | 709 | 502 |
Total increase (decrease) in net assets | (6,950,695) | 6,506,249 |
| | |
Net Assets | | |
Beginning of period | 14,748,352 | 8,242,103 |
End of period (including undistributed net investment income of $120,184 and undistributed net investment income of $137,292, respectively) | $ 7,797,657 | $ 14,748,352 |
See accompanying notes which are an integral part of the financial statements.
Annual Report
Financial Highlights - Class A
Years ended October 31, | 2008 | 2007 | 2006 | 2005 H |
Selected Per-Share Data | | | |
Net asset value, beginning of period | $ 47.34 | $ 36.47 | $ 30.57 | $ 27.41 |
Income from Investment
Operations | | | | |
Net investment income (loss) E | .46 | .44 | .42 | .28 |
Net realized and unrealized gain (loss) | (22.08) | 11.76 | 7.19 | 2.88 |
Total from investment operations | (21.62) | 12.20 | 7.61 | 3.16 |
Distributions from net investment income | (.37) | (.35) | (.31) | - |
Distributions from net realized gain | (1.67) | (.98) | (1.40) | - |
Total distributions | (2.04) | (1.33) | (1.71) | - |
Redemption fees added to paid in capital E,J | - | - | - | - |
Net asset value, end of period | $ 23.68 | $ 47.34 | $ 36.47 | $ 30.57 |
Total Return B,C,D | (47.65)% | 34.54% | 26.01% | 11.53% |
Ratios to Average Net Assets F,I | | | |
Expenses before reductions | 1.32% | 1.25% | 1.27% | 1.42% A |
Expenses net of fee waivers, if any | 1.32% | 1.25% | 1.27% | 1.42% A |
Expenses net of all reductions | 1.29% | 1.22% | 1.21% | 1.36% A |
Net investment income (loss) | 1.27% | 1.08% | 1.22% | 1.15% A |
Supplemental Data | | | |
Net assets, end of period (in millions) | $ 380 | $ 417 | $ 140 | $ 2 |
Portfolio turnover rate G | 79% | 56% | 56% | 75% |
A Annualized
B Total returns for periods of less than one year are not annualized.
C Total returns would have been lower had certain expenses not been reduced during the periods shown.
D Total returns do not include the effect of the sales charges.
E Calculated based on average shares outstanding during the period.
F Fees and expenses of the underlying Fidelity Central Funds are not included in the Fund's expense ratio. The Fund indirectly bears its proportionate share of the expenses of any underlying Fidelity Central Funds.
G Amount does not include the portfolio activity of any underlying Fidelity Central Funds.
H For the period January 6, 2005 (commencement of sale of shares) to October 31, 2005.
I Expense ratios reflect operating expenses of the class. Expenses before reductions do not reflect amounts reimbursed by the investment adviser or reductions from brokerage service arrangements or other expense offset arrangements and do not represent the amount paid by the class during periods when reimbursements or reductions occur. Expense ratios before reductions for start-up periods may not be representative of longer-term operating periods. Expenses net of fee waivers reflect expenses after reimbursement by the investment adviser but prior to reductions from brokerage service arrangements or other expense offset arrangements. Expenses net of all reductions represent the net expenses paid by the class.
J Amount represents less than $.01 per share.
See accompanying notes which are an integral part of the financial statements.
Annual Report
Financial Highlights - Class T
Years ended October 31, | 2008 | 2007 | 2006 | 2005 H |
Selected Per-Share Data | | | |
Net asset value, beginning of period | $ 47.06 | $ 36.30 | $ 30.49 | $ 27.41 |
Income from Investment
Operations | | | | |
Net investment income (loss) E | .33 | .29 | .27 | .20 |
Net realized and unrealized gain (loss) | (21.94) | 11.71 | 7.18 | 2.88 |
Total from investment operations | (21.61) | 12.00 | 7.45 | 3.08 |
Distributions from net investment income | (.29) | (.26) | (.24) | - |
Distributions from net realized gain | (1.67) | (.98) | (1.40) | - |
Total distributions | (1.96) | (1.24) | (1.64) | - |
Redemption fees added to paid in capital E,J | - | - | - | - |
Net asset value, end of period | $ 23.49 | $ 47.06 | $ 36.30 | $ 30.49 |
Total Return B,C,D | (47.84)% | 34.08% | 25.49% | 11.24% |
Ratios to Average Net Assets F,I | | | |
Expenses before reductions | 1.68% | 1.63% | 1.71% | 1.75% A |
Expenses net of fee waivers, if any | 1.68% | 1.63% | 1.71% | 1.75% A |
Expenses net of all reductions | 1.64% | 1.60% | 1.65% | 1.69% A |
Net investment income (loss) | .91% | .70% | .78% | .83% A |
Supplemental Data | | | |
Net assets, end of period (in millions) | $ 64 | $ 53 | $ 10 | $ 2 |
Portfolio turnover rate G | 79% | 56% | 56% | 75% |
A Annualized
B Total returns for periods of less than one year are not annualized.
C Total returns would have been lower had certain expenses not been reduced during the periods shown.
D Total returns do not include the effect of the sales charges.
E Calculated based on average shares outstanding during the period.
F Fees and expenses of the underlying Fidelity Central Funds are not included in the Fund's expense ratio. The Fund indirectly bears its proportionate share of the expenses of any underlying Fidelity Central Funds.
G Amount does not include the portfolio activity of any underlying Fidelity Central Funds.
H For the period January 6, 2005 (commencement of sale of shares) to October 31, 2005.
I Expense ratios reflect operating expenses of the class. Expenses before reductions do not reflect amounts reimbursed by the investment adviser or reductions from brokerage service arrangements or other expense offset arrangements and do not represent the amount paid by the class during periods when reimbursements or reductions occur. Expense ratios before reductions for start-up periods may not be representative of longer-term operating periods. Expenses net of fee waivers reflect expenses after reimbursement by the investment adviser but prior to reductions from brokerage service arrangements or other expense offset arrangements. Expenses net of all reductions represent the net expenses paid by the class.
J Amount represents less than $.01 per share.
See accompanying notes which are an integral part of the financial statements.
Annual Report
Financial Highlights - Class B
Years ended October 31, | 2008 | 2007 | 2006 | 2005 H |
Selected Per-Share Data | | | | |
Net asset value, beginning of period | $ 46.70 | $ 36.12 | $ 30.36 | $ 27.41 |
Income from Investment
Operations | | | | |
Net investment income (loss) E | .15 | .08 | .08 | .08 |
Net realized and unrealized gain (loss) | (21.77) | 11.64 | 7.19 | 2.87 |
Total from investment operations | (21.62) | 11.72 | 7.27 | 2.95 |
Distributions from net investment income | (.16) | (.16) | (.11) | - |
Distributions from net realized gain | (1.67) | (.98) | (1.40) | - |
Total distributions | (1.83) | (1.14) | (1.51) | - |
Redemption fees added to paid in capital E,J | - | - | - | - |
Net asset value, end of period | $ 23.25 | $ 46.70 | $ 36.12 | $ 30.36 |
Total Return B,C,D | (48.11)% | 33.37% | 24.91% | 10.76% |
Ratios to Average Net Assets F,I | | | | |
Expenses before reductions | 2.19% | 2.14% | 2.27% | 2.24% A |
Expenses net of fee waivers, if any | 2.19% | 2.14% | 2.25% | 2.24% A |
Expenses net of all reductions | 2.15% | 2.10% | 2.19% | 2.18% A |
Net investment income (loss) | .40% | .19% | .24% | .33% A |
Supplemental Data | | | | |
Net assets, end of period (in millions) | $ 15 | $ 17 | $ 4 | $ 1 |
Portfolio turnover rate G | 79% | 56% | 56% | 75% |
A Annualized
B Total returns for periods of less than one year are not annualized.
C Total returns would have been lower had certain expenses not been reduced during the periods shown.
D Total returns do not include the effect of the contingent deferred sales charge.
E Calculated based on average shares outstanding during the period.
F Fees and expenses of the underlying Fidelity Central Funds are not included in the Fund's expense ratio. The Fund indirectly bears its proportionate share of the expenses of any underlying Fidelity Central Funds.
G Amount does not include the portfolio activity of any underlying Fidelity Central Funds.
H For the period January 6, 2005 (commencement of sale of shares) to October 31, 2005.
I Expense ratios reflect operating expenses of the class. Expenses before reductions do not reflect amounts reimbursed by the investment adviser or reductions from brokerage service arrangements or other expense offset arrangements and do not represent the amount paid by the class during periods when reimbursements or reductions occur. Expense ratios before reductions for start-up periods may not be representative of longer-term operating periods. Expenses net of fee waivers reflect expenses after reimbursement by the investment adviser but prior to reductions from brokerage service arrangements or other expense offset arrangements. Expenses net of all reductions represent the net expenses paid by the class.
J Amount represents less than $.01 per share.
See accompanying notes which are an integral part of the financial statements.
Annual Report
Financial Highlights - Class C
Years ended October 31, | 2008 | 2007 | 2006 | 2005 H |
Selected Per-Share Data | | | |
Net asset value, beginning of period | $ 46.82 | $ 36.19 | $ 30.41 | $ 27.41 |
Income from Investment
Operations | | | | |
Net investment income (loss) E | .15 | .09 | .11 | .13 |
Net realized and unrealized gain (loss) | (21.82) | 11.66 | 7.19 | 2.87 |
Total from investment operations | (21.67) | 11.75 | 7.30 | 3.00 |
Distributions from net investment income | (.17) | (.14) | (.12) | - |
Distributions from net realized gain | (1.67) | (.98) | (1.40) | - |
Total distributions | (1.84) | (1.12) | (1.52) | - |
Redemption fees added to paid in capital E,J | - | - | - | - |
Net asset value, end of period | $ 23.31 | $ 46.82 | $ 36.19 | $ 30.41 |
Total Return B,C,D | (48.10)% | 33.38% | 24.97% | 10.94% |
Ratios to Average Net Assets F,I | | | | |
Expenses before reductions | 2.17% | 2.11% | 2.16% | 2.04% A |
Expenses net of fee waivers, if any | 2.17% | 2.11% | 2.16% | 2.04% A |
Expenses net of all reductions | 2.13% | 2.08% | 2.11% | 1.98% A |
Net investment income (loss) | .42% | .22% | .33% | .53% A |
Supplemental Data | | | |
Net assets, end of period (in millions) | $ 36 | $ 28 | $ 6 | $ 2 |
Portfolio turnover rate G | 79% | 56% | 56% | 75% |
A Annualized
B Total returns for periods of less than one year are not annualized.
C Total returns would have been lower had certain expenses not been reduced during the periods shown.
D Total returns do not include the effect of the contingent deferred sales charge.
E Calculated based on average shares outstanding during the period.
F Fees and expenses of the underlying Fidelity Central Funds are not included in the Fund's expense ratio. The Fund indirectly bears its proportionate share of the expenses of any underlying Fidelity Central Funds.
G Amount does not include the portfolio activity of any underlying Fidelity Central Funds.
H For the period January 6, 2005 (commencement of sale of shares) to October 31, 2005.
I Expense ratios reflect operating expenses of the class. Expenses before reductions do not reflect amounts reimbursed by the investment adviser or reductions from brokerage service arrangements or other expense offset arrangements and do not represent the amount paid by the class during periods when reimbursements or reductions occur. Expense ratios before reductions for start-up periods may not be representative of longer-term operating periods. Expenses net of fee waivers reflect expenses after reimbursement by the investment adviser but prior to reductions from brokerage service arrangements or other expense offset arrangements. Expenses net of all reductions represent the net expenses paid by the class.
J Amount represents less than $.01 per share.
See accompanying notes which are an integral part of the financial statements.
Annual Report
Financial Highlights - International Discovery
Years ended October 31, | 2008 | 2007 | 2006 | 2005 | 2004 |
Selected Per-Share Data | | | | | |
Net asset value, beginning of period | $ 47.68 | $ 36.67 | $ 30.65 | $ 25.31 | $ 21.87 |
Income from Investment Operations | | | | | |
Net investment income (loss) B | .57 | .53 | .48 | .37 | .22 |
Net realized and unrealized gain (loss) | (22.29) | 11.84 | 7.25 | 5.24 | 3.40 |
Total from investment operations | (21.72) | 12.37 | 7.73 | 5.61 | 3.62 |
Distributions from net investment income | (.41) | (.38) | (.31) | (.15) | (.18) |
Distributions from net realized gain | (1.67) | (.98) | (1.40) | (.12) | - |
Total distributions | (2.08) | (1.36) | (1.71) | (.27) | (.18) |
Redemption fees added to paid in capital B,F | - | - | - | - | - |
Net asset value, end of period | $ 23.88 | $ 47.68 | $ 36.67 | $ 30.65 | $ 25.31 |
Total Return A | (47.55)% | 34.85% | 26.34% | 22.29% | 16.65% |
Ratios to Average Net Assets C,E | | | | | |
Expenses before reductions | 1.09% | 1.04% | 1.09% | 1.08% | 1.10% |
Expenses net of fee waivers, if any | 1.09% | 1.04% | 1.08% | 1.07% | 1.10% |
Expenses net of all reductions | 1.05% | 1.00% | 1.03% | 1.01% | 1.06% |
Net investment income (loss) | 1.51% | 1.30% | 1.41% | 1.35% | .92% |
Supplemental Data | | | | | |
Net assets, end of period (in millions) | $ 6,999 | $ 14,176 | $ 8,054 | $ 3,949 | $ 2,193 |
Portfolio turnover rate D | 79% | 56% | 56% | 75% | 87% |
A Total returns would have been lower had certain expenses not been reduced during the periods shown.
B Calculated based on average shares outstanding during the period.
C Fees and expenses of the underlying Fidelity Central Funds are not included in the Fund's expense ratio. The Fund indirectly bears its proportionate share of the expenses of any underlying Fidelity Central Funds.
D Amount does not include the portfolio activity of any underlying Fidelity Central Funds.
E Expense ratios reflect operating expenses of the class. Expenses before reductions do not reflect amounts reimbursed by the investment adviser or reductions from brokerage service arrangements or other expense offset arrangements and do not represent the amount paid by the class during periods when reimbursements or reductions occur. Expenses net of fee waivers reflect expenses after reimbursement by the investment adviser but prior to reductions from brokerage service arrangements or other expense offset arrangements. Expenses net of all reductions represent the net expenses paid by the class.
F Amount represents less than $.01 per share.
See accompanying notes which are an integral part of the financial statements.
Annual Report
Financial Highlights - Class K
Year ended October 31, | 2008 G |
Selected Per-Share Data | |
Net asset value, beginning of period | $ 40.32 |
Income from Investment Operations | |
Net investment income (loss) D | .10 |
Net realized and unrealized gain (loss) | (16.52) |
Total from investment operations | (16.42) |
Redemption fees added to paid in capital D,I | - |
Net asset value, end of period | $ 23.90 |
Total Return B,C | (40.72)% |
Ratios to Average Net Assets E,H | |
Expenses before reductions | .93% A |
Expenses net of fee waivers, if any | .93% A |
Expenses net of all reductions | .89% A |
Net investment income (loss) | .83% A |
Supplemental Data | |
Net assets, end of period (in millions) | $ 145 |
Portfolio turnover rate F | 79% |
A Annualized
B Total returns for periods of less than one year are not annualized.
C Total returns would have been lower had certain expenses not been reduced during the periods shown.
D Calculated based on average shares outstanding during the period.
E Fees and expenses of the underlying Fidelity Central Funds are not included in the Fund's expense ratio. The Fund indirectly bears its proportionate share of the expenses of any underlying Fidelity Central Funds.
F Amount does not include the portfolio activity of any underlying Fidelity Central Funds.
G For the period May 9, 2008 (commencement of sale of shares) to October 31, 2008.
H Expense ratios reflect operating expenses of the class. Expenses before reductions do not reflect amounts reimbursed by the investment adviser or reductions from brokerage service arrangements or other expense offset arrangements and do not represent the amount paid by the class during periods when reimbursements or reductions occur. Expense ratios before reductions for start-up periods may not be representative of longer-term operating periods. Expenses net of fee waivers reflect expenses after reimbursement by the investment adviser but prior to reductions from brokerage service arrangements or other expense offset arrangements. Expenses net of all reductions represent the net expenses paid by the class.
I Amount represents less than $.01 per share.
See accompanying notes which are an integral part of the financial statements.
Annual Report
Financial Highlights - Institutional Class
Years ended October 31, | 2008 | 2007 | 2006 | 2005 G |
Selected Per-Share Data | | | | |
Net asset value, beginning of period | $ 47.73 | $ 36.71 | $ 30.68 | $ 27.41 |
Income from Investment
Operations | | | | |
Net investment income (loss) D | .53 | .55 | .51 | .38 |
Net realized and unrealized gain (loss) | (22.24) | 11.85 | 7.25 | 2.89 |
Total from investment operations | (21.71) | 12.40 | 7.76 | 3.27 |
Distributions from net investment income | (.44) | (.40) | (.33) | - |
Distributions from net realized gain | (1.67) | (.98) | (1.40) | - |
Total distributions | (2.11) | (1.38) | (1.73) | - |
Redemption fees added to paid in capital D,I | - | - | - | - |
Net asset value, end of period | $ 23.91 | $ 47.73 | $ 36.71 | $ 30.68 |
Total Return B,C | (47.51)% | 34.93% | 26.45% | 11.93% |
Ratios to Average Net Assets E,H | | | | |
Expenses before reductions | 1.05% | .97% | 1.00% | .97% A |
Expenses net of fee waivers, if any | 1.05% | .97% | 1.00% | .97% A |
Expenses net of all reductions | 1.01% | .94% | .95% | .90% A |
Net investment income (loss) | 1.54% | 1.36% | 1.49% | 1.60% A |
Supplemental Data | | | | |
Net assets, end of period (in millions) | $ 159 | $ 58 | $ 28 | $ 10 |
Portfolio turnover rate F | 79% | 56% | 56% | 75% |
A Annualized
B Total returns for periods of less than one year are not annualized.
C Total returns would have been lower had certain expenses not been reduced during the periods shown.
D Calculated based on average shares outstanding during the period.
E Fees and expenses of the underlying Fidelity Central Funds are not included in the Fund's expense ratio. The Fund indirectly bears its proportionate share of the expenses of any underlying Fidelity Central Funds.
F Amount does not include the portfolio activity of any underlying Fidelity Central Funds.
G For the period January 6, 2005 (commencement of sale of shares) to October 31, 2005.
H Expense ratios reflect operating expenses of the class. Expenses before reductions do not reflect amounts reimbursed by the investment adviser or reductions from brokerage service arrangements or other expense offset arrangements and do not represent the amount paid by the class during periods when reimbursements or reductions occur. Expense ratios before reductions for start-up periods may not be representative of longer-term operating periods. Expenses net of fee waivers reflect expenses after reimbursement by the investment adviser but prior to reductions from brokerage service arrangements or other expense offset arrangements. Expenses net of all reductions represent the net expenses paid by the class.
I Amount represents less than $.01 per share.
See accompanying notes which are an integral part of the financial statements.
Annual Report
Notes to Financial Statements
For the period ended October 31, 2008
(Amounts in thousands except ratios)
1. Organization.
Fidelity International Discovery Fund (the Fund) is a fund of Fidelity Investment Trust (the trust) and is authorized to issue an unlimited number of shares. The trust is registered under the Investment Company Act of 1940, as amended (the 1940 Act), as an open-end management investment company organized as a Massachusetts business trust. On January 17, 2008, the Board of Trustees of the Fund approved the creation of an additional class of shares. The Fund commenced sale of Class K shares on May 9, 2008. The Fund offers Class A, Class T, Class B, Class C, International Discovery, Class K and Institutional Class shares, each of which has equal rights as to assets and voting privileges. Each class has exclusive voting rights with respect to matters that affect that class. Class B shares will automatically convert to Class A shares after a holding period of seven years from the initial date of purchase. Investment income, realized and unrealized capital gains and losses, the common expenses of the Fund, and certain fund-level expense reductions, if any, are allocated on a pro-rata basis to each class based on the relative net assets of each class to the total net assets of the Fund. Each class differs with respect to transfer agent and distribution and service plan fees incurred. Certain expense reductions also differ by class. The Fund's investments in emerging markets can be subject to social, economic, regulatory, and political uncertainties and can be extremely volatile.
2. Investments in Fidelity Central Funds.
The Fund may invest in Fidelity Central Funds, which are open-end investment companies available only to other investment companies and accounts managed by Fidelity Management & Research Company (FMR) and its affiliates. The Fund's Schedule of Investments lists each of the Fidelity Central Funds held as of period end, if any, as an investment of the Fund, but does not include the underlying holdings of each Fidelity Central Fund. As an Investing Fund, the Fund indirectly bears its proportionate share of the expenses of the underlying Fidelity Central Funds.
The Money Market Central Funds seek preservation of capital and current income and are managed by Fidelity Investments Money Management, Inc. (FIMM), an affiliate of FMR.
A complete unaudited list of holdings for each Fidelity Central Fund is available upon request or at the SEC's web site at www.sec.gov. In addition, the financial statements of the Fidelity Central Funds, which are not covered by the Fund's Report of Independent Registered Public Accounting Firm, are available on the SEC's web site or upon request.
3. Significant Accounting Policies.
The financial statements have been prepared in conformity with accounting principles generally accepted in the United States of America, which require management to make
Annual Report
3. Significant Accounting Policies - continued
certain estimates and assumptions at the date of the financial statements. Actual results could differ from those estimates. The following summarizes the significant accounting policies of the Fund:
Security Valuation. Investments are valued as of 4:00 p.m. Eastern time on the last calendar day of the period. Wherever possible, the Fund uses independent pricing services approved by the Board of Trustees to value its investments.
Equity securities, including restricted securities, for which market quotations are readily available, are valued at the last reported sale price or official closing price as reported by an independent pricing service on the primary market or exchange on which they are traded. In the event there were no sales during the day or closing prices are not available, securities are valued at the last quoted bid price. Futures contracts are valued at the settlement price established each day by the board of trade or exchange on which they are traded. Investments in open-end mutual funds, including the Fidelity Central Funds, are valued at their closing net asset value each business day. Short-term securities with remaining maturities of sixty days or less for which quotations are not readily available are valued at amortized cost, which approximates value.
When current market prices or quotations are not readily available or reliable, valuations may be determined in good faith in accordance with procedures adopted by the Board of Trustees. Factors used in determining value may include significant market or security specific events, changes in interest rates and credit quality, and developments in foreign markets which are monitored by evaluating the performance of ADRs, futures contracts and exchange-traded funds. The frequency with which these procedures are used cannot be predicted and may be utilized to a significant extent. The value of securities used for net asset value (NAV) calculation under these procedures may differ from published prices for the same securities.
Foreign Currency. The Fund uses foreign currency contracts to facilitate transactions in foreign-denominated securities. Losses from these transactions may arise from changes in the value of the foreign currency or if the counterparties do not perform under the contracts' terms.
Foreign-denominated assets, including investment securities, and liabilities are translated into U.S. dollars at the exchange rate at period end. Purchases and sales of investment securities, income and dividends received and expenses denominated in foreign currencies are translated into U.S. dollars at the exchange rate in effect on the transaction date.
The effects of exchange rate fluctuations on investments are included with the net realized and unrealized gain (loss) on investment securities. Other foreign currency transactions resulting in realized and unrealized gain (loss) are disclosed separately.
Annual Report
Notes to Financial Statements - continued
(Amounts in thousands except ratios)
3. Significant Accounting Policies - continued
Investment Transactions and Income. For financial reporting purposes, the Fund's investment holdings and NAV include trades executed through the end of the last business day of the period. The NAV per share for processing shareholder transactions is calculated as of the close of business of the New York Stock Exchange (NYSE) normally 4:00 p.m. Eastern time and includes trades executed through the end of the prior business day. Gains and losses on securities sold are determined on the basis of identified cost and may include proceeds received from litigation. Dividend income is recorded on the ex-dividend date, except for certain dividends from foreign securities where the ex-dividend date may have passed, which are recorded as soon as the Fund is informed of the ex-dividend date. Non-cash dividends included in dividend income, if any, are recorded at the fair market value of the securities received. Distributions received on securities that represent a return of capital or capital gain are recorded as a reduction of cost of investments and/or as a realized gain. The Fund estimates the components of distributions received that may be considered return of capital distributions or capital gain distributions. Interest income and distributions from the Fidelity Central Funds are accrued as earned. Interest income includes coupon interest and amortization of premium and accretion of discount on debt securities. Investment income is recorded net of foreign taxes withheld where recovery of such taxes is uncertain.
Expenses. Most expenses of the trust can be directly attributed to a fund. Expenses which cannot be directly attributed are apportioned among each Fund in the trust. Expense estimates are accrued in the period to which they relate and adjustments are made when actual amounts are known.
Income Tax Information and Distributions to Shareholders. Each year, the Fund intends to qualify as a regulated investment company by distributing substantially all of its taxable income and realized gains under Subchapter M of the Internal Revenue Code and filing its U.S. federal tax return. As a result, no provision for income taxes is required. The Fund is subject to the provisions of FASB Interpretation No. 48, Accounting for Uncertainties in Income Taxes (FIN 48). FIN 48 sets forth a minimum threshold for financial statement recognition of the benefit of a tax position taken or expected to be taken in a tax return. The implementation of FIN 48 did not result in any unrecognized tax benefits in the accompanying financial statements. Each of the Fund's federal tax returns for the prior three fiscal years remains subject to examination by the Internal Revenue Service (IRS). Foreign taxes are provided for based on the Fund's understanding of the tax rules and rates that exist in the foreign markets in which it invests.
Distributions are recorded on the ex-dividend date. Income dividends and capital gain distributions are declared separately for each class. Income and capital gain distributions are determined in accordance with income tax regulations, which may differ from
Annual Report
3. Significant Accounting Policies - continued
Income Tax Information and Distributions to Shareholders - continued
generally accepted accounting principles. In addition, the Fund will claim a portion of the payment made to redeeming shareholders as a distribution for income tax purposes.
Capital accounts within the financial statements are adjusted for permanent book-tax differences. These adjustments have no impact on net assets or the results of operations. Temporary book-tax differences will reverse in a subsequent period.
Book-tax differences are primarily due to futures transactions, foreign currency transactions, certain foreign taxes, passive foreign investment companies (PFIC), market discount, deferred trustees compensation and losses deferred due to wash sales.
The tax-basis components of distributable earnings and the federal tax cost as of period end were as follows:
Unrealized appreciation | $ 370,565 |
Unrealized depreciation | (3,044,089) |
Net unrealized appreciation (depreciation) | (2,673,524) |
Undistributed ordinary income | 93,213 |
Capital loss carryforward | (637,482) |
| |
Cost for federal income tax purposes | $ 10,544,261 |
The tax character of distributions paid was as follows:
| October 31, 2008 | October 31, 2007 |
Ordinary Income | $ 164,399 | $ 145,377 |
Long-term Capital Gains | 493,881 | 164,810 |
Total | $ 658,280 | $ 310,187 |
Short-Term Trading (Redemption) Fees. Shares held in the Fund less than 30 days are subject to a redemption fee equal to 1.00% of the proceeds of the redeemed shares. All redemption fees, including any estimated redemption fees paid by FMR, are retained by the Fund and accounted for as an addition to paid in capital.
New Accounting Pronouncements. In September 2006, Statement of Financial Accounting Standards No. 157, Fair Value Measurements (SFAS 157), was issued and is effective for fiscal years beginning after November 15, 2007. SFAS 157 defines fair value, establishes a framework for measuring fair value and results in expanded disclosures about fair value measurements.
Annual Report
Notes to Financial Statements - continued
(Amounts in thousands except ratios)
3. Significant Accounting Policies - continued
New Accounting Pronouncements - continued
In addition, in March 2008, Statement of Financial Accounting Standards No. 161, Disclosures about Derivative Instruments and Hedging Activities (SFAS 161), was issued and is effective for reporting periods beginning after November 15, 2008. SFAS 161 requires enhanced disclosures to provide information about the reasons the Fund invests in derivative instruments, the accounting treatment and the effect derivatives have on financial performance.
4. Operating Policies.
Repurchase Agreements. FMR has received an Exemptive Order from the Securities and Exchange Commission (the SEC) which permits the Fund and other affiliated entities of FMR to transfer uninvested cash balances into joint trading accounts which are then invested in repurchase agreements. The Fund may also invest directly with institutions in repurchase agreements. Repurchase agreements are collateralized by government or non-government securities. Upon settlement date, collateral is held in segregated accounts with custodian banks and may be obtained in the event of a default of the counterparty. The Fund monitors, on a daily basis, the value of the collateral to ensure it is at least equal to the principal amount of the repurchase agreement (including accrued interest). In the event of a default by the counterparty, realization of the collateral proceeds could be delayed, during which time the value of the collateral may decline.
Futures Contracts. The Fund may use futures contracts to manage its exposure to the stock markets. Buying futures tends to increase a fund's exposure to the underlying instrument, while selling futures tends to decrease a fund's exposure to the underlying instrument or hedge other fund investments. Upon entering into a futures contract, a fund is required to deposit with a clearing broker, no later than the following business day, an amount ("initial margin") equal to a certain percentage of the face value of the contract. The initial margin may be in the form of cash or securities and is transferred to a segregated account on settlement date. Subsequent payments ("variation margin") are made or received by a fund depending on the daily fluctuations in the value of the futures contract and are accounted for as unrealized gains or losses. Realized gains (losses) are recorded upon the expiration or closing of the futures contract. Securities deposited to meet margin requirements are identified in the Schedule of Investments. Futures contracts involve, to varying degrees, risk of loss in excess of any futures variation margin reflected in the Statement of Assets and Liabilities. The underlying face amount at value of any open futures contracts at period end is shown in the Schedule of Investments under the caption "Futures Contracts." This amount reflects each contract's exposure to the underlying instrument at period end. Losses may arise from changes in the value of
Annual Report
4. Operating Policies - continued
Futures Contracts - continued
the underlying instruments or if the counterparties do not perform under the contract's terms.
5. Purchases and Sales of Investments.
Purchases and sales of securities other than short-term securities, aggregated $10,031,748 and $9,562,944, respectively.
6. Fees and Other Transactions with Affiliates.
Management Fee. FMR and its affiliates provide the Fund with investment management related services for which the Fund pays a monthly management fee. The management fee is the sum of an individual fund fee rate that is based on an annual rate of .45% of the Fund's average net assets and a group fee rate that averaged .26% during the period. The group fee rate is based upon the average net assets of all the mutual funds advised by FMR. The group fee rate decreases as assets under management increase and increases as assets under management decrease. In addition, the management fee is subject to a performance adjustment up to a maximum of ±.20% of the Fund's average net assets over a 36 month performance period). The upward or downward adjustment to the management fee is based on the relative investment performance of the retail class of the Fund, International Discovery as compared to an appropriate benchmark index. For the period, the total annual management fee rate, including the performance adjustment, was .81% of the Fund's average net assets.
Distribution and Service Plan. In accordance with Rule 12b-1 of the 1940 Act, the Fund has adopted separate Distribution and Service Plans for each class of shares. Certain classes pay Fidelity Distributors Corporation (FDC), an affiliate of FMR, separate Distribution and Service Fees, each of which is based on an annual percentage of each class' average net assets. In addition, FDC may pay financial intermediaries for selling shares of the Fund and providing shareholder support services. For the period, the Distribution and Service Fee rates and the total amounts paid to and retained by FDC were as follows:
| Distribution
Fee | Service
Fee | Paid to
FDC | Retained
by FDC |
Class A | 0% | .25% | $ 1,335 | $ 160 |
Class T | .25% | .25% | 393 | 3 |
Class B | .75% | .25% | 224 | 168 |
Class C | .75% | .25% | 479 | 189 |
| | | $ 2,431 | $ 520 |
Annual Report
Notes to Financial Statements - continued
(Amounts in thousands except ratios)
6. Fees and Other Transactions with Affiliates - continued
Sales Load. FDC receives a front-end sales charge of up to 5.75% for selling Class A shares, and 3.50% for selling Class T shares, some of which is paid to financial intermediaries for selling shares of the Fund. FDC receives the proceeds of contingent deferred sales charges levied on Class A, Class T, Class B, and Class C redemptions. These charges depend on the holding period. The deferred sales charges range from 5% to 1% for Class B, 1% for Class C, 1.00% to .50% for certain purchases of Class A shares and .25% for certain purchases of Class T shares.
For the period, sales charge amounts retained by FDC were as follows:
| Retained
by FDC |
Class A | $ 284 |
Class T | 46 |
Class B* | 36 |
Class C* | 14 |
| $ 380 |
* When Class B and Class C shares are initially sold, FDC pays commissions from its own resources to financial intermediaries through which the sales are made.
Transfer Agent Fees. Fidelity Investments Institutional Operations Company, Inc. (FIIOC), an affiliate of FMR, is the transfer, dividend disbursing and shareholder servicing agent for each class of the Fund. FIIOC receives account fees and asset-based fees that vary according to the account size and type of account of the shareholders of the respective classes of the Fund. FIIOC pays for typesetting, printing and mailing of shareholder reports, except proxy statements. Prior to January 1, 2008, Fidelity Service Company, Inc. (FSC) also an affiliate of FMR was the sub-transfer for International Discovery shares. For the period, the total transfer agent fees paid by each class were as follows:
| Amount | % of
Average
Net Assets |
Class A | $ 1,109 | .21 |
Class T | 248 | .31 |
Class B | 73 | .32 |
Class C | 146 | .30 |
International Discovery | 26,685 | .22 |
Class K | 8 | .05* |
Institutional Class | 167 | .18 |
| $ 28,436 | |
* Annualized
Annual Report
6. Fees and Other Transactions with Affiliates - continued
Accounting and Security Lending Fees. FSC maintains the Fund's accounting records. The accounting fee is based on the level of average net assets for the month. Under a separate contract, FSC administers the security lending program. The security lending fee is based on the number and duration of lending transactions.
Brokerage Commissions. The Fund placed a portion of its portfolio transactions with brokerage firms which are affiliates of the investment adviser. The commissions paid to these affiliated firms were $6 for the period.
7. Committed Line of Credit.
The Fund participates with other funds managed by FMR in a $4.2 billion credit facility (the "line of credit") to be utilized for temporary or emergency purposes to fund shareholder redemptions or for other short-term liquidity purposes. The Fund has agreed to pay commitment fees on its pro rata portion of the line of credit, which amounted to $26 and is reflected in Miscellaneous Expense on the Statement of Operations. During the period, there were no borrowings on this line of credit.
8. Security Lending.
The Fund lends portfolio securities from time to time in order to earn additional income. On the settlement date of the loan, the Fund receives collateral (in the form of U.S. Treasury obligations, letters of credit and/or cash) against the loaned securities and maintains collateral in an amount not less than 100% of the market value of the loaned securities during the period of the loan. The market value of the loaned securities is determined at the close of business of the Fund and any additional required collateral is delivered to the Fund on the next business day. If the borrower defaults on its obligation to return the securities loaned because of insolvency or other reasons, a fund could experience delays and costs in recovering the securities loaned or in gaining access to the collateral. Any cash collateral received is invested in the Fidelity Securities Lending Cash Central Fund. The value of loaned securities and cash collateral at period end are disclosed on the Fund's Statement of Assets and Liabilities. Security lending income represents the income earned on investing cash collateral, less fees and expenses associated with the loan, plus any premium payments that may be received on the loan of certain types of securities. Security lending income is presented in the Statement of Operations as a component of income from Fidelity Central Funds. Net income from lending portfolio securities during the period amounted to $11,130.
Annual Report
Notes to Financial Statements - continued
(Amounts in thousands except ratios)
9. Expense Reductions.
Many of the brokers with whom FMR places trades on behalf of the Fund provided services to the Fund in addition to trade execution. These services included payments of certain expenses on behalf of the Fund totaling $4,760 for the period. In addition, through arrangements with each class' transfer agent, credits realized as a result of uninvested cash balances were used to reduce the Fund's expenses. During the period, these credits reduced the Fund's custody expenses by $1. During the period, credits reduced each class' transfer agent expense as noted in the table below.
| Transfer Agent
expense reduction |
International Discovery | $ 248 |
10. Other.
The Fund's organizational documents provide former and current trustees and officers with a limited indemnification against liabilities arising in connection with the performance of their duties to the Fund. In the normal course of business, the Fund may also enter into contracts that provide general indemnifications. The Fund's maximum exposure under these arrangements is unknown as this would be dependent on future claims that may be made against the Fund. The risk of material loss from such claims is considered remote.
In December 2006, the Independent Trustees, with the assistance of independent counsel, completed an investigation regarding gifts, gratuities and business entertainment provided by certain brokers to certain individuals who were employed on FMR's domestic equity trading desk during the period 2002 to 2004. The Independent Trustees and FMR agreed that, despite the absence of proof that the Fidelity mutual funds experienced diminished execution quality as a result of the improper receipt of gifts and business entertainment, the conduct at issue was serious and was worthy of redress. Accordingly, the Independent Trustees requested, and FMR agreed to make, a payment of $42 million plus accrued interest, which equaled approximately $7.3 million, to certain Fidelity mutual funds.
In March 2008, the Trustees approved a method for allocating this payment among the funds and, in total, FMR paid the fund $5, which is recorded in the accompanying Statement of Operations.
In a related administrative order dated March 5, 2008, the U.S. Securities and Exchange Commission ("SEC") announced a settlement with FMR and FMR Co., Inc. (an affiliate of FMR) involving the SEC's regulatory rules for investment advisers and the improper receipt of gifts, gratuities and business entertainment. Without admitting or denying the
Annual Report
10. Other - continued
SEC's findings, FMR agreed to pay an $8 million civil penalty to the United States Treasury.
11. Distributions to Shareholders.
Distributions to shareholders of each class were as follows:
Years ended October 31, | 2008 | 2007 |
From net investment income | | |
Class A | $ 3,599 | $ 1,387 |
Class T | 387 | 80 |
Class B | 67 | 21 |
Class C | 123 | 24 |
International Discovery | 124,823 | 84,038 |
Institutional Class | 575 | 312 |
Total | $ 129,574 | $ 85,862 |
From net realized gain | | |
Class A | $ 16,423 | $ 3,929 |
Class T | 2,244 | 302 |
Class B | 719 | 130 |
Class C | 1,185 | 170 |
International Discovery | 505,958 | 219,032 |
Institutional Class | 2,177 | 762 |
Total | $ 528,706 | $ 224,325 |
12. Share Transactions.
Transactions for each class of shares were as follows:
| Shares Years ended October 31, | Dollars Years ended October 31, |
| 2008 A | 2007 | 2008 A | 2007 |
Class A | | | | |
Shares sold | 13,337 | 5,675 | $ 505,827 | $ 234,633 |
Reinvestment of distributions | 252 | 63 | 11,025 | 2,271 |
Shares redeemed | (6,361) | (770) | (213,706) | (31,203) |
Net increase (decrease) | 7,228 | 4,968 | $ 303,146 | $ 205,701 |
Annual Report
Notes to Financial Statements - continued
(Amounts in thousands except ratios)
12. Share Transactions - continued
| Shares Years ended October 31, | Dollars Years ended October 31, |
| 2008 A | 2007 | 2008 A | 2007 |
Class T | | | | |
Shares sold | 2,322 | 1,031 | $ 87,236 | $ 42,252 |
Reinvestment of distributions | 59 | 10 | 2,571 | 371 |
Shares redeemed | (800) | (187) | (27,654) | (7,614) |
Net increase (decrease) | 1,581 | 854 | $ 62,153 | $ 35,009 |
Class B | | | | |
Shares sold | 487 | 293 | $ 18,856 | $ 11,952 |
Reinvestment of distributions | 17 | 4 | 721 | 136 |
Shares redeemed | (228) | (53) | (7,554) | (2,096) |
Net increase (decrease) | 276 | 244 | $ 12,023 | $ 9,992 |
Class C | | | | |
Shares sold | 1,350 | 481 | $ 51,762 | $ 19,749 |
Reinvestment of distributions | 25 | 4 | 1,076 | 139 |
Shares redeemed | (405) | (55) | (13,335) | (2,234) |
Net increase (decrease) | 970 | 430 | $ 39,503 | $ 17,654 |
International Discovery | | | | |
Shares sold | 98,885 | 133,089 | $ 3,784,869 | $ 5,367,776 |
Conversion to Class K | (6,197) | - | (182,264) | - |
Reinvestment of distributions | 13,646 | 7,929 | 600,976 | 289,550 |
Shares redeemed | (110,609) | (63,328) | (3,914,448) | (2,558,324) |
Net increase (decrease) | (4,275) | 77,690 | $ 289,133 | $ 3,099,002 |
Class K | | | | |
Shares sold | 215 | - | $ 6,017 | $ - |
Conversion from International Discovery | 6,197 | - | 182,264 | - |
Reinvestment of distributions | - | - | - | - |
Shares redeemed | (338) | - | (8,716) | - |
Net increase (decrease) | 6,074 | - | $ 179,565 | $ - |
Annual Report
12. Share Transactions - continued
| Shares Years ended October 31, | Dollars Years ended October 31, |
| 2008 A | 2007 | 2008 A | 2007 |
Institutional Class | | | | |
Shares sold | 7,551 | 538 | $ 243,799 | $ 22,351 |
Reinvestment of distributions | 42 | 19 | 1,852 | 700 |
Shares redeemed | (2,148) | (120) | (62,044) | (5,000) |
Net increase (decrease) | 5,445 | 437 | $ 183,607 | $ 18,051 |
A Share transactions for Class K are for the period May 9, 2008 (commencement of sale of shares) to October 31, 2008.
Annual Report
To the Trustees of Fidelity Investment Trust and the Shareholders of Fidelity International Discovery Fund:
In our opinion, the accompanying statement of assets and liabilities, including the schedule of investments, and the related statements of operations and of changes in net assets and the financial highlights present fairly, in all material respects, the financial position of Fidelity International Discovery Fund (a fund of Fidelity Investment Trust) at October 31, 2008, the results of its operations for the year then ended, the changes in its net assets for each of the two years in the period then ended and the financial highlights for each of the periods indicated, in conformity with accounting principles generally accepted in the United States of America. These financial statements and financial highlights (hereafter referred to as "financial statements") are the responsibility of the Fidelity International Discovery Fund's management. Our responsibility is to express an opinion on these financial statements based on our audits. We conducted our audits of these financial statements in accordance with the standards of the Public Company Accounting Oversight Board (United States). Those standards require that we plan and perform the audit to obtain reasonable assurance about whether the financial statements are free of material misstatement. An audit includes examining, on a test basis, evidence supporting the amounts and disclosures in the financial statements, assessing the accounting principles used and significant estimates made by management, and evaluating the overall financial statement presentation. We believe that our audits, which included confirmation of securities at October 31, 2008 by correspondence with the custodian and brokers, provide a reasonable basis for our opinion.
/s/ PricewaterhouseCoopers LLP
PricewaterhouseCoopers LLP
Boston, Massachusetts
December 23, 2008
Annual Report
The Trustees, Member of the Advisory Board, and executive officers of the trust and fund, as applicable, are listed below. The Board of Trustees governs the fund and is responsible for protecting the interests of shareholders. The Trustees are experienced executives who meet periodically throughout the year to oversee the fund's activities, review contractual arrangements with companies that provide services to the fund, and review the fund's performance. Except for Edward C. Johnson 3d and James C. Curvey, each of the Trustees oversees 220 funds advised by FMR or an affiliate. Messrs. Johnson and Curvey oversee 379 funds advised by FMR or an affiliate.
The Trustees hold office without limit in time except that (a) any Trustee may resign; (b) any Trustee may be removed by written instrument, signed by at least two-thirds of the number of Trustees prior to such removal; (c) any Trustee who requests to be retired or who has become incapacitated by illness or injury may be retired by written instrument signed by a majority of the other Trustees; and (d) any Trustee may be removed at any special meeting of shareholders by a two-thirds vote of the outstanding voting securities of the trust. Each Trustee who is not an interested person (as defined in the 1940 Act) (Independent Trustee), shall retire not later than the last day of the calendar year in which his or her 72nd birthday occurs. The Independent Trustees may waive this mandatory retirement age policy with respect to individual Trustees. The executive officers and Advisory Board Member hold office without limit in time, except that any officer and Advisory Board Member may resign or may be removed by a vote of a majority of the Trustees at any regular meeting or any special meeting of the Trustees. Except as indicated, each individual has held the office shown or other offices in the same company for the past five years.
The fund's Statement of Additional Information (SAI) includes more information about the Trustees. To request a free copy, call Fidelity at 1-800-544-8544.
Interested Trustees*:
Correspondence intended for each Trustee who is an interested person may be sent to Fidelity Investments, 82 Devonshire Street, Boston, Massachusetts 02109.
Name, Age; Principal Occupation |
Edward C. Johnson 3d (78) |
| Year of Election or Appointment: 1984 Mr. Johnson is Chairman of the Board of Trustees. Mr. Johnson serves as Chief Executive Officer, Chairman, and a Director of FMR LLC; Chairman and a Director of FMR; Chairman and a Director of Fidelity Research & Analysis Company (FRAC); Chairman and a Director of Fidelity Investments Money Management, Inc.; and Chairman and a Director of FMR Co., Inc. In addition, Mr. Johnson serves as Chairman and Director of FIL Limited. Previously, Mr. Johnson served as President of FMR LLC (2006-2007). |
James C. Curvey (73) |
| Year of Election or Appointment: 2007 Mr. Curvey also serves as Trustee (2007-present) of other investment companies advised by FMR. Mr. Curvey is a Director of FMR and FMR Co., Inc. (2007-present). Mr. Curvey is also Vice Chairman (2006-
present) and Director of FMR LLC. In addition, Mr. Curvey serves as an Overseer for the Boston Symphony Orchestra and a member of the Trustees of Villanova University. |
* Trustees have been determined to be "Interested Trustees" by virtue of, among other things, their affiliation with the trust or various entities under common control with FMR. FMR Corp. merged with and into FMR LLC on October 1, 2007. Any references to FMR LLC for prior periods are deemed to be references to the prior entity.
Independent Trustees:
Correspondence intended for each Independent Trustee (that is, the Trustees other than the Interested Trustees) may be sent to Fidelity Investments, P.O. Box 55235, Boston, Massachusetts 02205-5235.
Name, Age; Principal Occupation |
Dennis J. Dirks (60) |
| Year of Election or Appointment: 2005 Prior to his retirement in May 2003, Mr. Dirks was Chief Operating Officer and a member of the Board of The Depository Trust & Clearing Corporation (DTCC) (1999-2003). He also served as President, Chief Operating Officer, and Board member of The Depository Trust Company (DTC) (1999-2003) and President and Board member of the National Securities Clearing Corporation (NSCC) (1999-2003). In addition, Mr. Dirks served as a Trustee and a member of the Finance Committee of Manhattan College (2005-2008), and as Chief Executive Officer and Board member of the Government Securities Clearing Corporation (2001-2003) and Chief Executive Officer and Board member of the Mortgage-Backed Securities Clearing Corporation (2001-2003). Mr. Dirks also serves as a Trustee and a member of the Finance Committee of AHRC of Nassau County (2006-present). |
Alan J. Lacy (55) |
| Year of Election or Appointment: 2008 Mr. Lacy serves as Senior Adviser (2007-present) of Oak Hill Capital Partners, L.P. (a private equity firm). Mr. Lacy also served as Chief Executive Officer (2000-2005) and Vice Chairman (2005-2006) of Sears Holdings Corporation and Sears, Roebuck and Co. (retail). In addition, Mr. Lacy serves as a member of the Board of Directors of The Western Union Company (global money transfer, 2006-present) and Bristol-Myers Squibb (global pharmaceuticals, 2007-present). Mr. Lacy is a Trustee of the National Parks Conservation Association and The Field Museum of Natural History. |
Ned C. Lautenbach (64) |
| Year of Election or Appointment: 2000 Mr. Lautenbach is Chairman of the Independent Trustees (2006-present). Mr. Lautenbach is an Advisory Partner of Clayton, Dubilier & Rice, Inc. (private equity investment firm). Previously, Mr. Lautenbach was with the International Business Machines Corporation (IBM) from 1968 until his retirement in 1998. Mr. Lautenbach serves as a Director of Eaton Corporation (diversified industrial) as well as the Philharmonic Center for the Arts in Naples, Florida. He also is a member of the Board of Trustees of Fairfield University (2005-present), as well as a member of the Council on Foreign Relations. Previously, Mr. Lautenbach served as a Director of Sony Corporation (2006-2007). |
Joseph Mauriello (64) |
| Year of Election or Appointment: 2008 Prior to his retirement in January 2006, Mr. Mauriello served in numerous senior management positions including Deputy Chairman and Chief Operating Officer (2004-2005), and Vice Chairman of Financial Services (2002-2004) of KPMG LLP US (professional services firm, 1965-
2005). Mr. Mauriello currently serves as a member of the Board of Directors of XL Capital Ltd. (global insurance and re-insurance company, 2006-present) and of Arcadia Resources Inc. (health care services and products, 2007-present). He also served as a Director of the Hamilton Funds of the Bank of New York (2006-2007). |
Cornelia M. Small (64) |
| Year of Election or Appointment: 2005 Ms. Small is a member of the Investment Committee, and Chair (2008-present) and a member of the Board of Trustees of Smith College. Ms. Small also serves on the Investment Committee of the Berkshire Taconic Community Foundation (2008-present). Previously, Ms. Small served as Chairperson of the Investment Committee (2002-2008) of Smith College and as Co-Chair (2000-2003) of the Annual Fund for the Fletcher School of Law and Diplomacy. In addition, she served as Chief Investment Officer, Director of Global Equity Investments, and a member of the Board of Directors of Scudder, Stevens & Clark and Scudder Kemper Investments. |
William S. Stavropoulos (69) |
| Year of Election or Appointment: 2001 Mr. Stavropoulos is Chairman Emeritus of the Board of Directors of The Dow Chemical Company, where he previously served in numerous senior management positions, including President (1993-2000; 2002-
2003), CEO (1995-2000; 2002-2004), Chairman of the Executive Committee (2000-2006), and as a member of the Board of Directors (1990-2006). Currently, he is a Director of Teradata Corporation (data warehousing and technology solutions, 2008-present), Chemical Financial Corporation, Maersk Inc. (industrial conglomerate), Tyco International, Inc. (multinational manufacturing and services, 2007-present), and a member of the Advisory Board for Metalmark Capital (private equity investment firm, 2005-present). He is a special advisor to Clayton, Dubilier & Rice, Inc. (private equity investment). In addition, Mr. Stavropoulos is a member of the University of Notre Dame Advisory Council for the College of Science. |
David M. Thomas (59) |
| Year of Election or Appointment: 2008 Previously, Mr. Thomas served as Executive Chairman (2005-2006) and Chairman and Chief Executive Officer (2000-2005) of IMS Health, Inc. (pharmaceutical and healthcare information solutions). In addition, Mr. Thomas serves as a member of the Board of Directors of Fortune Brands, Inc. (consumer products holding company), and Interpublic Group of Companies, Inc. (marketing communication, 2004-present). |
Michael E. Wiley (58) |
| Year of Election or Appointment: 2008 Mr. Wiley also serves as a member of the Board of Trustees of the University of Tulsa (2000-2006; 2007-present). He serves as a Director of Tesoro Corporation (independent oil refiner and marketer, 2005-
present), and a Director of Bill Barrett Corporation (exploration and production company, 2005-present). In addition, he also serves as a Director of Post Oak Bank (privately-held bank, 2004-present). Previously, Mr. Wiley served as a Sr. Energy Advisor of Katzenbach Partners, LLC (consulting firm, 2006-2007), as an Advisory Director of Riverstone Holdings (private investment firm), Chairman, President, and CEO of Baker Hughes, Inc. (oilfield services company, 2000-2004), and as Director of Spinnaker Exploration Company (exploration and production company, 2001-2005). |
Advisory Board Member and Executive Officers**:
Correspondence intended for each executive officer and Mr. Lynch may be sent to Fidelity Investments, 82 Devonshire Street, Boston, Massachusetts 02109.
Name, Age; Principal Occupation |
Peter S. Lynch (64) |
| Year of Election or Appointment: 2003 Member of the Advisory Board of Fidelity's Equity and High Income Funds. Mr. Lynch is Vice Chairman and a Director of FMR, and Vice Chairman (2001-present) and a Director of FMR Co., Inc. Previously, Mr. Lynch served as a Trustee of the Fidelity funds (1990-2003). In addition, he serves as a Trustee of Boston College and as the Chairman of the Inner-City Scholarship Fund. Previously, Mr. Lynch served on the Special Olympics International Board of Directors (1997-2006). |
Kenneth B. Robins (39) |
| Year of Election or Appointment: 2008 President and Treasurer of Fidelity's Equity and High Income Funds. Mr. Robins is an employee of Fidelity Investments (2004-present). Before joining Fidelity Investments, Mr. Robins worked at KPMG LLP, where he was a partner in KPMG's department of professional practice (2002-2004). |
Walter C. Donovan (46) |
| Year of Election or Appointment: 2007 Vice President of Fidelity's Equity Funds. Mr. Donovan also serves as President of FMR and FMR Co., Inc., and Executive Vice President of Fidelity Investments Money Management, Inc. (2007-present). Previously, Mr. Donovan served as Executive Vice President of FMR and FMR Co., Inc. (2005-2007) and Senior Vice President of FMR (2003-2005) and FMR Co., Inc. (2004-2005). |
Eric M. Wetlaufer (46) |
| Year of Election or Appointment: 2006 Vice President of Fidelity's International Equity Funds. Mr. Wetlaufer also serves as Group Chief Investment Officer of FMR. Mr. Wetlaufer is Chairman, Chief Executive Officer, and President of Fidelity Management & Research (Hong Kong) Limited (2008-present); Chairman, Chief Executive Officer, President, and a Director of Fidelity Management & Research (Japan) Inc. (2008-present); Chairman and Chief Executive Officer (2007-present) and President and a Director (2006-present) of Fidelity Management & Research (U.K.) Inc. and President and a Director of Fidelity Research & Analysis Company (2006-present). Before joining Fidelity Investments in 2005, Mr. Wetlaufer was a partner in Oxhead Capital Management (2004-2005) and a Chief Investment Officer of Putnam Investments (1997-2003). |
Scott C. Goebel (40) |
| Year of Election or Appointment: 2008 Secretary and Chief Legal Officer (CLO) of the Fidelity funds. Mr. Goebel also serves as General Counsel, Secretary, and Senior Vice President of FMR (2008-present); Deputy General Counsel of FMR LLC; Chief Legal Secretary of Fidelity Management & Research (Hong Kong) Limited (2008-present) and Assistant Secretary of Fidelity Management & Research (Japan) Inc. (2008-present). Previously, Mr. Goebel served as Assistant Secretary of the Funds (2007-2008) and as Vice President and Secretary of Fidelity Distributors Corporation (FDC) (2005-2007). |
John B. McGinty, Jr. (46) |
| Year of Election or Appointment: 2008 Assistant Secretary of Fidelity's Equity and High Income Funds. Mr. McGinty is an employee of Fidelity Investments (2004-present). Mr. McGinty also serves as Senior Vice President, Secretary, and Chief Legal Officer of FDC (2007-present). Before joining Fidelity Investments, Mr. McGinty practiced law at Ropes & Gray, LLP. |
Holly C. Laurent (54) |
| Year of Election or Appointment: 2008 Anti-Money Laundering (AML) Officer of the Fidelity funds. Ms. Laurent is an employee of Fidelity Investments. Previously, Ms. Laurent was Senior Vice President and Head of Legal for Fidelity Business Services India Pvt. Ltd. (2006-2008), Senior Vice President, Deputy General Counsel and Group Head for FMR LLC (2005-2006). |
Christine Reynolds (50) |
| Year of Election or Appointment: 2008 Chief Financial Officer of the Fidelity funds. Ms. Reynolds became President of Fidelity Pricing and Cash Management Services (FPCMS) in August 2008. She served as Chief Operating Officer of FPCMS from 2007 through July 2008. Previously, Ms. Reynolds served as President, Treasurer, and Anti-Money Laundering officer of the Fidelity funds (2004-
2007). Before joining Fidelity Investments, Ms. Reynolds worked at PricewaterhouseCoopers LLP (PwC) (1980-2002), where she was an audit partner with PwC's investment management practice. |
Kenneth A. Rathgeber (61) |
| Year of Election or Appointment: 2004 Chief Compliance Officer of Fidelity's Equity and High Income Funds. Mr. Rathgeber is Chief Compliance Officer of Fidelity Management & Research (Hong Kong) Limited (2008-present), Fidelity Management & Research (Japan) Inc. (2008-present), FMR (2005-present), FMR Co., Inc. (2005-present), Fidelity Management & Research (U.K.) Inc. (2005-
present), Fidelity Research & Analysis Company (2005-present), Fidelity Investments Money Management, Inc. (2005-present), and Strategic Advisers, Inc. (2005-present). |
Bryan A. Mehrmann (47) |
| Year of Election or Appointment: 2005 Deputy Treasurer of the Fidelity funds. Mr. Mehrmann is an employee of Fidelity Investments. Previously, Mr. Mehrmann served as Vice President of Fidelity Investments Institutional Services Group (FIIS)/Fidelity Investments Institutional Operations Corporation, Inc. (FIIOC) Client Services (1998-2004). |
Adrien E. Deberghes (41) |
| Year of Election or Appointment: 2008 Deputy Treasurer of Fidelity's Equity and High Income Funds. Mr. Deberghes is an employee of Fidelity Investments (2008-present). Previously, Mr. Deberghes served as Senior Vice President of Mutual Fund Administration at State Street Corporation (2007-2008), Senior Director of Mutual Fund Administration at Investors Bank & Trust (2005-2007), and Director of Finance for Dunkin' Brands (2000-2005). |
Robert G. Byrnes (41) |
| Year of Election or Appointment: 2005 Assistant Treasurer of the Fidelity funds. Mr. Byrnes is an employee of Fidelity Investments (2005-present). Previously, Mr. Byrnes served as Vice President of Fidelity Pricing and Cash Management Services (FPCMS) (2003-2005). Before joining Fidelity Investments, Mr. Byrnes worked at Deutsche Asset Management where he served as Vice President of the Investment Operations Group (2000-2003). |
Peter L. Lydecker (54) |
| Year of Election or Appointment: 2004 Assistant Treasurer of the Fidelity funds. Mr. Lydecker is an employee of Fidelity Investments. |
Paul M. Murphy (61) |
| Year of Election or Appointment: 2007 Assistant Treasurer of the Fidelity funds. Mr. Murphy is an employee of Fidelity Investments (2007-present). Previously, Mr. Murphy served as Chief Financial Officer of the Fidelity Funds (2005-2006), Vice President and Associate General Counsel of FMR (2007), and Senior Vice President of Fidelity Pricing and Cash Management Services (FPCMS) (1994-2007). |
Gary W. Ryan (50) |
| Year of Election or Appointment: 2005 Assistant Treasurer of the Fidelity funds. Mr. Ryan is an employee of Fidelity Investments. Previously, Mr. Ryan served as Vice President of Fund Reporting in Fidelity Pricing and Cash Management Services (FPCMS) (1999-2005). |
** FMR Corp. merged with and into FMR LLC on October 1, 2007. Any references to FMR LLC for prior periods are deemed to be references to the prior entity.
Annual Report
A special meeting of the fund's shareholders was held on April 16, 2008. The results of votes taken among shareholders on the proposals before them are reported below. Each vote reported represents one dollar of net asset value held on the record date for the meeting.
PROPOSAL 1 |
To elect a Board of Trustees.A |
| # of
Votes | % of
Votes |
James C. Curvey |
Affirmative | 44,485,656,811.55 | 94.702 |
Withheld | 2,488,551,854.62 | 5.298 |
TOTAL | 46,974,208,666.17 | 100.000 |
Dennis J. Dirks |
Affirmative | 44,706,671,638.31 | 95.173 |
Withheld | 2,267,537,027.86 | 4.827 |
TOTAL | 46,974,208,666.17 | 100.000 |
Edward C. Johnson 3d |
Affirmative | 44,294,881,638.16 | 94.296 |
Withheld | 2,679,327,028.01 | 5.704 |
TOTAL | 46,974,208,666.17 | 100.000 |
Alan J. Lacy |
Affirmative | 44,685,373,413.16 | 95.127 |
Withheld | 2,288,835,253.01 | 4.873 |
TOTAL | 46,974,208,666.17 | 100.000 |
Ned C. Lautenbach |
Affirmative | 44,634,541,379.41 | 95.019 |
Withheld | 2,339,667,286.76 | 4.981 |
TOTAL | 46,974,208,666.17 | 100.000 |
Joseph Mauriello |
Affirmative | 44,683,962,099.80 | 95.124 |
Withheld | 2,290,246,566.37 | 4.876 |
TOTAL | 46,974,208,666.17 | 100.000 |
Cornelia M. Small |
Affirmative | 44,671,688,375.36 | 95.098 |
Withheld | 2,302,520,290.81 | 4.902 |
TOTAL | 46,974,208,666.17 | 100.000 |
| # of
Votes | % of
Votes |
William S. Stavropoulos |
Affirmative | 44,465,262,087.61 | 94.659 |
Withheld | 2,508,946,578.56 | 5.341 |
TOTAL | 46,974,208,666.17 | 100.000 |
David M. Thomas |
Affirmative | 44,694,340,813.87 | 95.147 |
Withheld | 2,279,867,852.30 | 4.853 |
TOTAL | 46,974,208,666.17 | 100.000 |
Michael E. Wiley |
Affirmative | 44,686,513,174.78 | 95.130 |
Withheld | 2,287,695,491.39 | 4.870 |
TOTAL | 46,974,208,666.17 | 100.000 |
PROPOSAL 5 |
Shareholder proposal concerning "oversight procedures to screen out investments in companies that, in the judgement of the Board, substantially contribute to genocide, patterns of extraordinary and egregious violations of human rights, or crimes against humanity." |
| # of
Votes | % of
Votes |
Affirmative | 1,337,480,153.27 | 21.306 |
Against | 4,280,655,741.12 | 68.193 |
Abstain | 268,134,649.82 | 4.271 |
Broker
Non-Votes | 391,079,068.84 | 6.230 |
TOTAL | 6,277,349,613.05 | 100.000 |
A Denotes trust-wide proposal and voting results.
Semiannual Report
Proxy Voting Results
A special meeting of the fund's shareholders was held on December 13, 2007. The results of votes taken among shareholders on the proposals before them are reported below. Each vote reported represents one dollar of net asset value held on the record date for the meeting.
PROPOSAL 1 |
To amend the Declaration of Trust to reduce the required quorum for shareholder meetings.A |
| # of
Votes | % of
Votes |
Affirmative | 45,014,793,255.82 | 80.372 |
Against | 6,871,112,667.08 | 12.268 |
Abstain | 2,163,456,438.02 | 3.863 |
Broker
Non-Votes | 1,958,633,563.89 | 3.497 |
TOTAL | 56,007,995,924.81 | 100.000 |
PROPOSAL 2 |
To elect the nominees specified below as Trustees.A |
| # of
Votes | % of
Votes |
James C. Curvey |
Affirmative | 53,384,952,361.03 | 95.317 |
Withheld | 2,623,043,563.78 | 4.683 |
TOTAL | 56,007,995,924.81 | 100.000 |
Dennis J. Dirks |
Affirmative | 53,595,104,608.67 | 95.692 |
Withheld | 2,412,891,316.14 | 4.308 |
TOTAL | 56,007,995,924.81 | 100.000 |
Albert R. Gamper, Jr. |
Affirmative | 53,570,235,221.69 | 95.647 |
Withheld | 2,437,760,703.12 | 4.353 |
TOTAL | 56,007,995,924.81 | 100.000 |
George H. Heilmeier |
Affirmative | 53,166,350,588.50 | 94.926 |
Withheld | 2,841,645,336.31 | 5.074 |
TOTAL | 56,007,995,924.81 | 100.000 |
| # of
Votes | % of
Votes |
Edward C. Johnson 3d |
Affirmative | 53,230,508,654.93 | 95.041 |
Withheld | 2,777,487,269.88 | 4.959 |
TOTAL | 56,007,995,924.81 | 100.000 |
James H. Keyes |
Affirmative | 53,549,161,456.52 | 95.610 |
Withheld | 2,458,834,468.29 | 4.390 |
TOTAL | 56,007,995,924.81 | 100.000 |
Marie L. Knowles |
Affirmative | 53,543,925,066.86 | 95.601 |
Withheld | 2,464,070,857.95 | 4.399 |
TOTAL | 56,007,995,924.81 | 100.000 |
Ned C. Lautenbach |
Affirmative | 53,547,116,322.50 | 95.606 |
Withheld | 2,460,879,602.31 | 4.394 |
TOTAL | 56,007,995,924.81 | 100.000 |
Cornelia M. Small |
Affirmative | 53,564,793,514.25 | 95.638 |
Withheld | 2,443,202,410.56 | 4.362 |
TOTAL | 56,007,995,924.81 | 100.000 |
William S. Stavropoulos |
Affirmative | 53,426,544,502.76 | 95.391 |
Withheld | 2,581,451,422.05 | 4.609 |
TOTAL | 56,007,995,924.81 | 100.000 |
Kenneth L. Wolfe |
Affirmative | 53,229,881,790.63 | 95.040 |
Withheld | 2,778,114,134.18 | 4.960 |
TOTAL | 56,007,995,924.81 | 100.000 |
A Denotes trust-wide proposal and voting results.
Annual Report
Board Approval of Investment Advisory Contracts and Management Fees
Fidelity International Discovery Fund
Each year, typically in July, the Board of Trustees, including the Independent Trustees (together, the Board), votes on the renewal of the management contract and sub-advisory agreements (together, the Advisory Contracts) for the fund. The Board, assisted by the advice of fund counsel and Independent Trustees' counsel, requests and considers a broad range of information throughout the year.
The Board meets regularly and, acting directly and through its separate committees, requests and receives information concerning, and considers at each of its meetings factors that are relevant to, its annual consideration of the renewal of the fund's Advisory Contracts, including the services and support provided to the fund and its shareholders. At the time of the renewal, the Board had 12 standing committees, each composed of Independent Trustees with varying backgrounds, to which the Board has assigned specific subject matter responsibilities in order to enhance effective decision-making by the Board. Each committee has a written charter outlining the structure and purposes of the committee. The Board also meets as needed to consider matters specifically related to the Board's annual consideration of the renewal of Advisory Contracts.
At its July 2008 meeting, the Board of Trustees, including the Independent Trustees, unanimously determined to renew the fund's Advisory Contracts. In reaching its determination, the Board considered all factors it believed relevant, including (i) the nature, extent, and quality of the services to be provided to the fund and its shareholders (including the investment performance of the fund); (ii) the competitiveness of the fund's management fee and total expenses; (iii) the total costs of the services to be provided by and the profits to be realized by Fidelity from its relationship with the fund; (iv) the extent to which economies of scale would be realized as the fund grows; and (v) whether fee levels reflect these economies of scale, if any, for the benefit of fund shareholders. The Board also approved agreements with foreign sub-advisers Fidelity Management & Research (Japan) Inc. and Fidelity Management & Research (Hong Kong) Limited, as well as amendments to the fund's agreement with Fidelity Management & Research (U.K.) Inc.
In considering whether to renew the Advisory Contracts for the fund, the Board ultimately reached a determination, with the assistance of fund counsel and Independent Trustees' counsel and through the exercise of its business judgment, that the renewal of the Advisory Contracts and the compensation to be received by Fidelity under the management contract is consistent with Fidelity's fiduciary duty under applicable law. The Board's decision to renew the Advisory Contracts was not based on any single factor noted above, but rather was based on a comprehensive consideration of all the information provided to the Board at its meetings throughout the year. The Board, in reaching its determination to renew the Advisory Contracts, is aware that shareholders in the fund have a broad range of investment choices available to them, including a wide choice among mutual funds offered by competitors to Fidelity, and that the fund's shareholders, with the opportunity to review and weigh the disclosure provided by the fund in its prospectus and other public disclosures, have chosen to invest in this fund, managed by Fidelity.
Annual Report
Nature, Extent, and Quality of Services Provided. The Board considered staffing within the investment adviser, FMR, and the sub-advisers (together, the Investment Advisers), including the backgrounds of the fund's investment personnel and the fund's investment objective and discipline. The Independent Trustees also had discussions with senior management of Fidelity's investment operations and investment groups. The Board considered the structure of the portfolio manager compensation program and whether this structure provides appropriate incentives.
Resources Dedicated to Investment Management and Support Services. The Board reviewed the size, education, and experience of the Investment Advisers' investment staff, their use of technology, and the Investment Advisers' approach to recruiting, training, and retaining portfolio managers and other research, advisory, and management personnel. The Board noted that Fidelity's analysts have access to a variety of technological tools that enable them to perform both fundamental and quantitative analysis and to specialize in various disciplines. The Board considered Fidelity's extensive global research capabilities that enable the Investment Advisers to aggregate data from various sources in an effort to produce positive investment results. The Board also considered that Fidelity's portfolio managers and analysts have access to daily portfolio attribution that allows for monitoring of a fund's portfolio, as well as an electronic communication system that provides immediate real-time access to research concerning issuers and credit enhancers.
Shareholder and Administrative Services. The Board considered (i) the nature, extent, quality, and cost of advisory, administrative, distribution, and shareholder services performed by the Investment Advisers and their affiliates under the Advisory Contracts and under separate agreements covering transfer agency, pricing and bookkeeping, and securities lending services for the fund; (ii) the nature and extent of the Investment Advisers' supervision of third party service providers, principally custodians and subcustodians; and (iii) the resources devoted to, and the record of compliance with, the fund's compliance policies and procedures. The Board also reviewed the allocation of fund brokerage, including allocations to brokers affiliated with the Investment Advisers, the use of brokerage commissions to pay fund expenses, and the use of "soft" commission dollars to pay for research services. The Board further considered that Fidelity voluntarily pays for market data out of its own resources.
The Board noted that the growth of fund assets across the complex allows Fidelity to reinvest in the development of services designed to enhance the value or convenience of the Fidelity funds as investment vehicles. These services include 24-hour access to account information and market information through phone representatives and over the Internet, and investor education materials and asset allocation tools.
Annual Report
Board Approval of Investment Advisory Contracts and
Management Fees - continued
Investment in a Large Fund Family. The Board considered the benefits to shareholders of investing in a Fidelity fund, including the benefits of investing in a fund that is part of a large family of funds offering a variety of investment disciplines and providing for a large variety of mutual fund investor services. For example, fund shareholders are offered the privilege of exchanging shares of the fund for shares of other Fidelity funds, as set forth in the fund's prospectus, without paying a sales charge. The Board noted that Fidelity has taken a number of actions over the previous year that benefited particular funds, including (i) dedicating additional resources to investment research and to restructure the investment research teams; (ii) contractually agreeing to reduce the management fees on Fidelity's Institutional Money Market Funds and launching Class IV and Institutional Class of certain of these funds; (iii) reducing the transfer agent fees for the Fidelity Select Portfolios and Investor Class of the VIP funds; and (iv) launching Class K of 29 equity funds as a lower-fee class available to certain employer-sponsored retirement plans.
Investment Performance. The Board considered whether the fund has operated within its investment objective, as well as its record of compliance with its investment restrictions. It also reviewed the fund's absolute investment performance for each class, as well as the fund's relative investment performance for each class measured against (i) a broad-based securities market index, and (ii) a peer group of mutual funds deemed appropriate by the Board over multiple periods. The following charts considered by the Board show, over the one-, three-, and five-year periods ended December 31, 2007, as available, the cumulative total returns of Fidelity International Discovery (retail class) and Class B of the fund, the cumulative total returns of a broad-based securities market index ("benchmark"), and a range of cumulative total returns of a peer group of mutual funds identified by Morningstar, Inc. as having an investment style similar to that of the fund based on underlying portfolio holdings. The returns of Fidelity International Discovery (retail class) and Class B show the performance of the highest and lowest performing classes, respectively. (The fund did not offer Class K as of December 31, 2007.) The box within each chart shows the 25th percentile return (bottom of box) and the 75th percentile return (top of box) of the peer group. Returns shown above the box are in the first quartile and returns shown below the box are in the fourth quartile. The percentage beaten numbers noted below each chart correspond to the percentile box and represent the percentage of funds in the peer group whose performance was equal to or lower than that of the class indicated.
Annual Report
Fidelity International Discovery Fund

The Board reviewed the fund's relative investment performance against its peer group and stated that the performance of Fidelity International Discovery (retail class) of the fund was in the first quartile for all the periods shown. The Board also stated that the investment performance of Fidelity International Discovery (retail class) of the fund compared favorably to its benchmark for all the periods shown. The Board considered that the variations in performance among the fund's classes reflect the variations in class expenses, which result in lower performance for higher expense classes.
The Board also considered that the fund's management fee is subject to upward or downward adjustment depending upon whether, and to what extent, the fund's investment performance for the performance period exceeds, or is exceeded by, the record (over the same period) of a Board-approved performance adjustment index. The Board realizes that the performance adjustment provides FMR with a strong economic incentive to seek to achieve superior performance for the fund's shareholders and helps to more closely align the interests of FMR and the fund's shareholders.
The Board considered that FMR has taken steps to refocus and strengthen equity research, equity portfolio management, and compliance.
Based on its review, and giving particular weight to the nature and quality of the resources dedicated by the Investment Advisers to maintain and improve relative performance, the Board concluded that the nature, extent, and quality of the services provided to the fund will benefit the fund's shareholders, particularly in light of the Board's view that the fund's shareholders benefit from investing in a fund that is part of a large family of funds offering a variety of investment disciplines and services.
Annual Report
Board Approval of Investment Advisory Contracts and
Management Fees - continued
Competitiveness of Management Fee and Total Fund Expenses. The Board considered the fund's management fee and total expenses compared to "mapped groups" of competitive funds and classes. Fidelity creates "mapped groups" by combining similar Lipper investment objective categories that have comparable management fee characteristics. Combining Lipper investment objective categories aids the Board's management fee and total expense comparisons by broadening the competitive group used for comparison and by reducing the number of universes to which various Fidelity funds are compared. The Board also considered supplemental information about how the fund's management fee and total expenses ranked relative to groups based on Lipper classifications, which take into account a fund's market capitalization and style.
The Board considered two proprietary management fee comparisons for the 12-month periods shown in the chart below. The group of Lipper funds used by the Board for management fee comparisons is referred to below as the "Total Mapped Group." The Total Mapped Group comparison focuses on a fund's standing relative to the total universe of comparable funds available to investors, in terms of gross management fees before expense reimbursements or caps, and without giving effect to the fund's performance adjustment. "TMG %" represents the percentage of funds in the Total Mapped Group that had management fees that were lower than the fund's. For example, a TMG% of 14% means that 86% of the funds in the Total Mapped Group had higher management fees than the fund. The "Asset-Size Peer Group" (ASPG) comparison focuses on a fund's standing relative to non-Fidelity funds similar in size to the fund within the Total Mapped Group. The ASPG represents at least 15% of the funds in the Total Mapped Group with comparable asset size and management fee characteristics, subject to a minimum of 50 funds (or all funds in the Total Mapped Group if fewer than 50). Additional information, such as the ASPG quartile in which the fund's management fee ranked and the impact of the fund's performance adjustment, is also included in the chart and considered by the Board.
Annual Report
Fidelity International Discovery Fund

The Board noted that the fund's management fee ranked below the median of its Total Mapped Group and below the median of its ASPG for 2007. The Board also noted the effect of the fund's positive performance adjustment on the fund's management fee ranking. The Board noted that the performance adjustment for each year represents calculations for performance periods that differ from the periods shown in the performance charts above.
Based on its review, the Board concluded that the fund's management fee was fair and reasonable in light of the services that the fund receives and the other factors considered.
In its review of each class's total expenses, the Board considered the fund's management fee as well as other fund or class expenses, as applicable, such as transfer agent fees, pricing and bookkeeping fees, fund-paid 12b-1 fees, and custodial, legal, and audit fees. The Board also noted the effects of any waivers and reimbursements on fees and expenses, as well as the impact of the fund's performance adjustment. As part of its review, the Board also considered current and historical total expenses of each class of the fund compared to competitive fund median expenses. Each class of the fund is compared to those funds and classes in the Total Mapped Group (used by the Board for management fee comparisons) that have a similar sales load structure.
The Board noted that the total expenses of each of Class A, Class B, Class C, Institutional Class, and Fidelity International Discovery (retail class) ranked below its competitive median for 2007, and the total expenses of Class T ranked above its competitive median for 2007. The Board considered that the total expenses for Class T were above the median primarily because its 12b-1 fee is higher than the typical front-end load class. The Board noted that the fund offers multiple classes, each of which has a different sales load and 12b-1 fee structure, and that the multiple structures are intended to offer a range of pricing options for the intermediary market. The Board also noted that the total expenses of the classes vary primarily by the level of their 12b-1 fees, although differences in transfer agent fees may also cause expenses to vary from class to class.
Annual Report
Board Approval of Investment Advisory Contracts and
Management Fees - continued
In its review of total expenses, the Board also considered Fidelity fee structures and other information on clients that FMR and its affiliates service in other competitive markets, such as other mutual funds advised or subadvised by FMR or its affiliates, pension plan clients, and other institutional clients.
Based on its review, the Board concluded that the total expenses of each class of the fund were reasonable, although in one case above the median of the universe presented for comparison, in light of the services that the fund and its shareholders receive and the other factors considered.
Costs of the Services and Profitability. The Board considered the revenues earned and the expenses incurred by Fidelity in conducting the business of developing, marketing, distributing, managing, administering and servicing the fund and its shareholders. The Board also considered the level of Fidelity's profits in respect of all the Fidelity funds.
On an annual basis, FMR presents to the Board Fidelity's profitability for the fund. Fidelity calculates the profitability for each fund, as well as aggregate profitability for groups of Fidelity funds and all Fidelity funds, using a series of detailed revenue and cost allocation methodologies which originate with the audited books and records of Fidelity. The Audit Committee of the Board reviews any significant changes from the prior year's methodologies.
PricewaterhouseCoopers LLP (PwC), independent registered public accounting firm and auditor to Fidelity and certain Fidelity funds, has been engaged annually by the Board as part of the Board's assessment of the results of Fidelity's profitability analysis. PwC's engagement includes the review and assessment of Fidelity's methodologies used in determining the revenues and expenses attributable to Fidelity's mutual fund business, and completion of agreed-upon procedures surrounding the mathematical accuracy of fund profitability and its conformity to allocation methodologies. After considering PwC's reports issued under the engagement and information provided by Fidelity, the Board believes that while other allocation methods may also be reasonable, Fidelity's profitability methodologies are reasonable in all material respects.
The Board has also reviewed Fidelity's non-fund businesses and any fall-out benefits related to the mutual fund business as well as cases where Fidelity's affiliates may benefit from or be related to the fund's business.
Annual Report
The Board considered the costs of the services provided by and the profits realized by Fidelity in connection with the operation of the fund and determined that the amount of profit is a fair entrepreneurial profit for the management of the fund.
Economies of Scale. The Board considered whether there have been economies of scale in respect of the management of the Fidelity funds, whether the Fidelity funds (including the fund) have appropriately benefited from any such economies of scale, and whether there is potential for realization of any further economies of scale. The Board considered the extent to which the fund will benefit from economies of scale through increased services to the fund, through waivers or reimbursements, or through fee or expense reductions.
The Board recognized that the fund's management contract incorporates a "group fee" structure, which provides for lower group fee rates as total fund assets under FMR's management increase, and for higher group fee rates as total fund assets under FMR's management decrease. FMR determines the group fee rates based on a tiered asset "breakpoint" schedule. The Board considered that the group fee is designed to deliver the benefits of economies of scale to fund shareholders when total fund assets increase, even if assets of any particular fund are unchanged or have declined, because some portion of Fidelity's costs are attributable to services provided to all Fidelity funds, and all funds benefit if those costs can be allocated among more assets. The Board concluded that, given the group fee structure, fund shareholders will achieve a certain level of economies of scale as assets under FMR's management increase at the fund complex level, regardless of whether Fidelity achieves any such economies of scale.
The Board further concluded that any potential economies of scale are being shared between fund shareholders and Fidelity in an appropriate manner.
Additional Information Requested by the Board. In order to develop fully the factual basis for consideration of the Fidelity funds' Advisory Contracts, the Board requested and received additional information on certain topics, including (i) fund performance trends and actions to be taken by FMR to improve certain funds' overall performance; (ii) portfolio manager changes that have occurred during the past year; (iii) Fidelity's fund profitability methodology, the profitability of certain fund service providers, and profitability trends for certain funds; (iv) Fidelity's compensation structure for portfolio managers and key personnel, including its effects on fund profitability and the extent to which portfolio manager compensation is linked to fund performance; (v) Fidelity's fee structures and rationale for recommending different fees among categories of funds; and (vi) Fidelity's rationale for recommending which funds should have a performance adjustment component as part of their management fees.
Based on its evaluation of all of the conclusions noted above, and after considering all material factors, the Board ultimately concluded that the advisory fee structures are fair and reasonable, and that the fund's Advisory Contracts should be renewed.
Annual Report
Managing Your Investments
Fidelity offers several ways to conveniently manage your personal investments via your telephone or PC. You can access your account information, conduct trades and research your investments 24 hours a day.
By Phone
Fidelity Automated Service Telephone provides a single toll-free number to access account balances, positions, quotes and trading. It's easy to navigate the service, and on your first call, the system will help you create a personal identification number (PIN) for security.
(phone_graphic)
Fidelity Automated
Service Telephone (FAST®)
1-800-544-5555
Press
For mutual fund and brokerage trading.
For quotes.*
For account balances and holdings.
To review orders and mutual
fund activity.
To change your PIN.
To speak to a Fidelity representative.
By PC
Fidelity's web site on the Internet provides a wide range of information, including daily financial news, fund performance, interactive planning tools and news about Fidelity products and services.
(computer_graphic)
Fidelity's Web Site
www.fidelity.com
* When you call the quotes line, please remember that a fund's yield and return will vary and, except for money market funds, share price will also vary. This means that you may have a gain or loss when you sell your shares. There is no assurance that money market funds will be able to maintain a stable $1 share price; an investment in a money market fund is not insured or guaranteed by the U.S. government. Total returns are historical and include changes in share price, reinvestment of dividends and capital gains, and the effects of any sales charges.
Annual Report
Investment Adviser
Fidelity Management & Research Company
Boston, MA
Investment Sub-Advisers
FMR Co., Inc.
Fidelity Management & Research
(U.K.) Inc.
Fidelity Research & Analysis Company
Fidelity Investments
Japan Limited
FIL Investment Advisors
FIL Investment Advisors
(U.K.) Ltd.
Fidelity Management & Research
(Hong Kong) Limited
Fidelity Management & Research
(Japan) Inc.
General Distributor
Fidelity Distributors Corporation
Boston, MA
Transfer and Service Agents
Fidelity Investments Institutional
Operations Company, Inc.
Boston, MA
Fidelity Service Company, Inc.
Boston, MA
Custodian
Citibank, N.A.
New York, NY
The Fidelity Telephone Connection
Mutual Fund 24-Hour Service
Exchanges/Redemptions
and Account Assistance 1-800-544-6666
Product Information 1-800-544-6666
Retirement Accounts 1-800-544-4774
(8 a.m. - 9 p.m.)
TDD Service 1-800-544-0118
for the deaf and hearing impaired
(9 a.m. - 9 p.m. Eastern time)
Fidelity Automated Service
Telephone (FAST®) 1-800-544-5555
Automated line for quickest service
IGI-K-UANN-1208
1.863305.100
(Fidelity Investment logo)(registered trademark)
Fidelity Advisor
International Discovery
Fund - Class A, Class T, Class B
and Class C
Annual Report
October 31, 2008
Class A, Class T, Class B, and Class C are classes of Fidelity® International Discovery Fund
(2_fidelity_logos) (Registered_Trademark)
Contents
Chairman's Message | <Click Here> | Ned Johnson's message to shareholders. |
Performance | <Click Here> | How the fund has done over time. |
Management's Discussion | <Click Here> | The manager's review of fund performance, strategy and outlook. |
Shareholder Expense Example | <Click Here> | An example of shareholder expenses. |
Investment Changes | <Click Here> | A summary of major shifts in the fund's investments over the past six months. |
Investments | <Click Here> | A complete list of the fund's investments with their market values. |
Financial Statements | <Click Here> | Statements of assets and liabilities, operations, and changes in net assets, as well as financial highlights. |
Notes | <Click Here> | Notes to financial statements. |
Report of Independent Registered Public Accounting Firm | <Click Here> | |
Trustees and Officers | <Click Here> | |
Distributions | <Click Here> | |
Proxy Voting Results | <Click Here> | |
Board Approval of Investment Advisory Contracts and Management Fees | <Click Here> | |
To view a fund's proxy voting guidelines and proxy voting record for the 12-month period ended June 30, visit http://www.fidelity.com (search for "proxy voting guidelines") or visit the Securities and Exchange Commission's (SEC) web site at http://www.sec.gov. You may also call 1-877-208-0098 to request a free copy of the proxy voting guidelines.
Standard & Poor's, S&P and S&P 500 are registered service marks of The McGraw-Hill Companies, Inc. and have been licensed for use by Fidelity Distributors Corporation.
Other third party marks appearing herein are the property of their respective owners.
All other marks appearing herein are registered or unregistered trademarks or service marks of FMR LLC or an affiliated company.
Annual Report
This report and the financial statements contained herein are submitted for the general information of the shareholders of the fund. This report is not authorized for distribution to prospective investors in the fund unless preceded or accompanied by an effective prospectus.
A fund files its complete schedule of portfolio holdings with the SEC for the first and third quarters of each fiscal year on Form N-Q. Forms N-Q are available on the SEC's web site at http://www.sec.gov. A fund's Forms N-Q may be reviewed and copied at the SEC's Public Reference Room in Washington, DC. Information regarding the operation of the SEC's Public Reference Room may be obtained by calling 1-800-SEC-0330. For a complete list of a fund's portfolio holdings, view the most recent holdings listing, semiannual report, or annual report on Fidelity's web site at http://www.fidelity.com or http://www.advisor.fidelity.com, as applicable.
NOT FDIC INSURED · MAY LOSE VALUE · NO BANK GUARANTEE
Neither the fund nor Fidelity Distributors Corporation is a bank.
Annual Report
(photo_of_Edward_C_Johnson_3d)
Dear Shareholder:
Turmoil has been the watchword for the world's securities markets in 2008, with domestic and international stocks down sharply amid the global credit squeeze. A flight to quality boosted returns for U.S. Treasuries, one of the few asset classes with positive results heading into the latter stages of the year. Financial markets are always unpredictable, but there are a number of time-tested principles that can put the historical odds in your favor.
One of the basic tenets is to invest for the long term. Over time, riding out the markets' inevitable ups and downs has proven much more effective than selling into panic or chasing the hottest trend. Even missing only a few of the markets' best days can significantly diminish investor returns. Patience also affords the benefits of compounding - of earning interest on additional income or reinvested dividends and capital gains. There are tax advantages and cost benefits to consider as well. The more you sell, the more taxes you pay, and the more you trade, the higher the costs. While staying the course doesn't eliminate risk, it can considerably lessen the effect of short-term declines.
You can further manage your investing risk through diversification. And today, more than ever, geographic diversification should be taken into account. Studies indicate that asset allocation is the single most important determinant of a portfolio's long-term success. The right mix of stocks, bonds and cash - aligned to your particular risk tolerance and investment objective - is very important. Age-appropriate rebalancing is also an essential aspect of asset allocation. For younger investors, an emphasis on equities - which historically have been the best-performing asset class over time - is encouraged. As investors near their specific goal, such as retirement or sending a child to college, consideration may be given to replacing volatile assets (e.g. common stocks) with more-stable fixed investments (bonds or savings plans).
A third investment principle - investing regularly - can help lower the average cost of your purchases. Investing a certain amount of money each month or quarter helps ensure you won't pay for all your shares at market highs. This strategy - known as dollar cost averaging - also reduces unconstructive "emotion" from investing, helping shareholders avoid selling weak performers just prior to an upswing, or chasing a hot performer just before a correction.
We invite you to contact us via the Internet, through our Investor Centers or over the phone. It is our privilege to provide you the information you need to make the investments that are right for you.
Sincerely,
/s/Edward C. Johnson 3d
Edward C. Johnson 3d
Annual Report
Average annual total return reflects the change in the value of an investment, assuming reinvestment of the class' dividend income and capital gains (the profits earned upon the sale of securities that have grown in value, if any) and assuming a constant rate of performance each year. The $10,000 table and the fund's returns do not reflect the deduction of taxes that a shareholder would pay on fund distributions or the redemption of fund shares. During periods of reimbursement by Fidelity, a fund's total return will be greater than it would be had the reimbursement not occurred. How a fund did yesterday is no guarantee of how it will do tomorrow.
Average Annual Total Returns
Periods ended October 31, 2008 | Past 1
year | Past 5
years | Past 10
years |
Class A (incl. 5.75% sales charge) A, E | -50.66% | 3.54% | 5.25% |
Class T (incl. 3.50% sales charge) B, E | -49.67% | 3.74% | 5.36% |
Class B (incl. contingent deferred sales charge) C, E | -50.60% | 3.74% | 5.53% |
Class C (incl. contingent deferred sales charge) D , E | -48.60% | 4.13% | 5.55% |
A Class A shares bear a 0.25% 12b-1 fee. The initial offering of Class A shares took place on Janu-ary 6, 2005. Returns prior to January 6, 2005 are those of International Discovery, the original class of the fund, which has no 12b-1 fee. Had Class A shares' 12b-1 fee been reflected, returns prior to January 6, 2005 would have been lower.
B Class T shares bear a 0.50% 12b-1 fee. The initial offering of Class T shares took place on Janu-ary 6, 2005. Returns prior to January 6, 2005 are those of International Discovery, the original class of the fund, which has no 12b-1 fee. Had Class T shares' 12b-1 fee been reflected, returns prior to January 6, 2005 would have been lower.
C Class B shares bear a 1.00% 12b-1 fee. The initial offering of Class B shares took place on Janu-ary 6, 2005. Returns prior to January 6, 2005 are those of International Discovery, the original class of the fund, which has no 12b-1 fee. Had Class B shares' 12b-1 fee been reflected, returns prior to January 6, 2005 would have been lower. Class B shares' contingent deferred sales charges included in the past one year, past five year, and past 10 year total return figures are 5%, 2%, and 0% respectively.
D Class C shares bear a 1.00% 12b-1 fee. The initial offering of Class C shares took place on Janu-ary 6, 2005. Returns prior to January 6, 2005 are those of International Discovery, the original class of the fund, which has no 12b-1 fee. Had Class C shares' 12b-1 fee been reflected, returns prior to January 6, 2005 would have been lower. Class C shares' contingent deferred sales charges included in the past one year, past five year, and past 10 year total return figures are 1%, 0%, and 0% respectively.
E Prior to October 1, 2004, the fund operated under certain different investment policies. Accordingly, the fund's historical performance may not represent its current investment policies.
Annual Report
$10,000 Over 10 Years
Let's say hypothetically that $10,000 was invested in Fidelity Advisor International Discovery Fund - Class A on October 31, 1998 and the current 5.75% sales charge was paid. The chart shows how the value of your investment would have changed, and also shows how the MSCI® EAFE® Index (Europe, Australasia, Far East) performed over the same period. The initial offering of Class A took place on January 6, 2005. See the previous page for additional information regarding the performance of Class A.
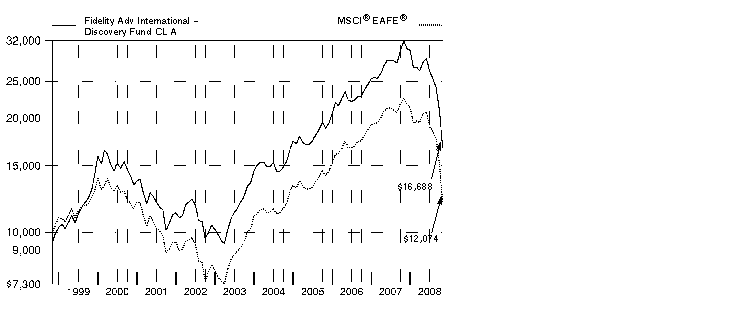
In prior years, the performance from year to year was represented by the performance of Class T. Going forward, the fund's performance will be represented by Class A for consistency with other fund materials.
Annual Report
Comments from William Kennedy, Portfolio Manager of Fidelity Advisor International Discovery Fund
In a dramatic reversal of what had been a multiyear global growth story, international stocks fell long and hard during the 12 months ending October 31, 2008, especially so during the latter stages of the period and mostly as a result of fallout from the financial crisis that emanated from the United States. The viral spread of this financial contagion - which began in the U.S. subprime mortgage market, then seized up the credit markets, hobbled major financial institutions and eventually slowed economic growth worldwide - left virtually no corner of the globe untouched. Developed international equity markets - as gauged by the MSCI® Europe, Australasia, Far East (EAFE®) Index, which monitors established markets outside the U.S. and Canada - fell 46.54%, while the Standard & Poor's 500SM Index, a measure of U.S. stocks, dropped 36.10%. Among countries constituting at least 1% of the EAFE index, Switzerland had the "least worst" showing, falling roughly 32%, followed by Japan, where stocks slid by around 37%. Meanwhile, the weakest overall performance came from Belgium, where stocks slipped by nearly 70%.In the United Kingdom, the largest component of the index, equities were down almost 48%. Emerging markets were the weakest performers among the global economies, declining 56.22% as measured by the MSCI Emerging Markets Index.
For the 12 months ending October 31, 2008, the fund's Class A, Class T, Class B and Class C shares returned -47.65%, -47.84%, -48.11% and -48.10%, respectively (excluding sales charges), which was just shy of the MSCI EAFE's return. Stock selection in Japan, where the yen was strong, detracted from performance. Stock selection in the energy, utilities and industrials sectors was also disappointing, as were currency impacts on our emerging markets holdings. The fund lost ground from not owning index component Volkswagen, the German car company, as a competitor bought shares that drove the stock price up. Other detractors included Babcock & Brown, an Australian infrastructure development company hurt by the credit crunch. It was no longer held at period end. An underweighting in BP, a British integrated oil company that held up well as energy prices declined, further undermined returns. On the upside, the fund benefited from a small cash position as well as country and sector weightings, including underweightings in financials and materials and an overweighting in health care. Top contributors included CSL, an Australian company with steady growth from its blood plasma and biotechnology businesses. Not owning Fortis, a Belgian diversified financials company in the index, also helped, as the company ran into funding difficulties.
The views expressed above reflect those of the portfolio manager(s) only through the end of the period as stated on the cover of this report and do not necessarily represent the views of Fidelity or any other person in the Fidelity organization. Any such views are subject to change at any time based upon market or other conditions and Fidelity disclaims any responsibility to update such views. These views may not be relied on as investment advice and, because investment decisions for a Fidelity fund are based on numerous factors, may not be relied on as an indication of trading intent on behalf of any Fidelity fund.
Annual Report
Shareholder Expense Example
As a shareholder of the Fund, you incur two types of costs: (1) transaction costs, including sales charges (loads) on redemptions of shares purchased prior to October 12, 1990, and redemption fees, and (2) ongoing costs, including management fees, distribution and/or service (12b-1) fees and other Fund expenses. This Example is intended to help you understand your ongoing costs (in dollars) of investing in the Fund and to compare these costs with the ongoing costs of investing in other mutual funds.
The actual expense Example is based on an investment of $1,000 invested at the beginning of the period and held for the entire period (May 1, 2008 to October 31, 2008) for the Class A, Class T, Class B, Class C, International Discovery and Institutional Class and for the entire period (May 9, 2008 to October 31, 2008) for Class K. The hypothetical expense Example is based on an investment of $1,000 invested for the one half year period (May 1, 2008 to October 31, 2008).
Actual Expenses
The first line of the accompanying table for each class of the Fund provides information about actual account values and actual expenses. You may use the information in this line, together with the amount you invested, to estimate the expenses that you paid over the period. Simply divide your account value by $1,000.00 (for example, an $8,600 account value divided by $1,000.00 = 8.6), then multiply the result by the number in the first line for a class of the Fund under the heading entitled "Expenses Paid During Period" to estimate the expenses you paid on your account during this period. A small balance maintenance fee of $12.00 that is charged once a year may apply for certain accounts with a value of less than $2,000. This fee is not included in the table below. If it was, the estimate of expenses you paid during the period would be higher, and your ending account value lower, by this amount. In addition, the Fund, as a shareholder in the underlying Fidelity Central Funds, will indirectly bear its pro rata share of the fees and expenses incurred by the underlying Fidelity Central Funds. These fees and expenses are not included in the Fund's annualized expense ratio used to calculate the expense estimate in the table below.
Hypothetical Example for Comparison Purposes
The second line of the accompanying table for each class of the Fund provides information about hypothetical account values and hypothetical expenses based on a Class' actual expense ratio and an assumed rate of return of 5% per year before expenses, which is not the Class' actual return. The hypothetical account values and expenses may not be used to estimate the actual ending account balance or expenses you paid for the period. You may use this information to compare the ongoing costs of investing in the Fund and other funds. To do so, compare this 5% hypothetical example with the 5% hypothetical examples that appear in the shareholder reports of the other funds. A small balance maintenance fee of $12.00 that is charged once a year may apply for certain accounts with a value of less than $2,000. This fee is not included in the table below. If it was, the estimate of expenses you paid during the period would be higher, and your ending account value lower, by this amount. In addition, the Fund, as a shareholder in the underlying Fidelity Central Funds, will indirectly bear its pro rata share of the fees and expenses incurred by the underlying Fidelity Central Funds. These fees and expenses are not included in the Fund's annualized expense ratio used to calculate the expense estimate in the table below.
Annual Report
Please note that the expenses shown in the table are meant to highlight your ongoing costs only and do not reflect any transaction costs. Therefore, the second line of the table is useful in comparing ongoing costs only, and will not help you determine the relative total costs of owning different funds. In addition, if these transactional costs were included, your costs would have been higher.
| Annualized Expense Ratio | Beginning
Account Value
May 1, 2008 | Ending
Account Value
October 31, 2008 | Expenses Paid
During Period |
Class A | 1.33% | | | |
Actual | | $ 1,000.00 | $ 594.40 | $ 5.33 B |
Hypothetical A | | $ 1,000.00 | $ 1,018.45 | $ 6.75 C |
Class T | 1.68% | | | |
Actual | | $ 1,000.00 | $ 593.30 | $ 6.73 B |
Hypothetical A | | $ 1,000.00 | $ 1,016.69 | $ 8.52 C |
Class B | 2.19% | | | |
Actual | | $ 1,000.00 | $ 591.80 | $ 8.76 B |
Hypothetical A | | $ 1,000.00 | $ 1,014.13 | $ 11.09 C |
Class C | 2.18% | | | |
Actual | | $ 1,000.00 | $ 591.90 | $ 8.72 B |
Hypothetical A | | $ 1,000.00 | $ 1,014.18 | $ 11.04 C |
International Discovery | 1.08% | | | |
Actual | | $ 1,000.00 | $ 594.90 | $ 4.33 B |
Hypothetical A | | $ 1,000.00 | $ 1,019.71 | $ 5.48 C |
Class K | .93% | | | |
Actual | | $ 1,000.00 | $ 592.80 | $ 3.56 B |
Hypothetical A | | $ 1,000.00 | $ 1,020.46 | $ 4.72 C |
Institutional Class | 1.06% | | | |
Actual | | $ 1,000.00 | $ 595.20 | $ 4.25 B |
Hypothetical A | | $ 1,000.00 | $ 1,019.81 | $ 5.38 C |
A 5% return per year before expenses
B Actual expenses are equal to each Class' annualized expense ratio (shown in the table below); multiplied by the average account value over the period, multiplied by 184/366 (to reflect the one-half year period) for Class A, Class T, Class B, Class C, International Discovery and Institutional Class and multiplied by 176/366 (to reflect the period May 9, 2008 to October 31, 2008) for Class K.
C Hypothetical expenses are equal to each Class' annualized expense ratio (shown in the table below); multiplied by the average account value over the period, multiplied by 184/366 (to reflect the one-half year period).
Annual Report
Investment Changes (Unaudited)
Geographic Diversification (% of fund's net assets) |
As of October 31, 2008 |
| United Kingdom 22.5% |
| Japan 16.0% |
| Switzerland 12.5% |
| Germany 12.1% |
| United States of America 6.9% |
| France 5.7% |
| Australia 5.0% |
| Spain 3.9% |
| Italy 2.0% |
| Other 13.4% |

Percentages are adjusted for the effect of futures contracts, if applicable. |
|
As of April 30, 2008 |
| United Kingdom 17.5% |
| Japan 15.4% |
| Germany 12.6% |
| Switzerland 8.0% |
| France 6.7% |
| Australia 5.4% |
| United States of America 4.2% |
| Spain 3.8% |
| Canada 3.0% |
| Other 23.4% |

Percentages are adjusted for the effect of futures contracts, if applicable. |
Asset Allocation |
| % of fund's
net assets | % of fund's net assets
6 months ago |
Stocks and Equity Futures | 94.3 | 96.3 |
Short-Term Investments and Net Other Assets | 5.7 | 3.7 |
Top Ten Stocks as of October 31, 2008 |
| % of fund's
net assets | % of fund's net assets
6 months ago |
Nestle SA (Reg.) (Switzerland, Food Products) | 3.0 | 1.8 |
Royal Dutch Shell PLC Class B (United Kingdom, Oil, Gas & Consumable Fuels) | 2.7 | 2.0 |
Roche Holding AG (participation certificate) (Switzerland, Pharmaceuticals) | 2.2 | 0.9 |
E.ON AG (Germany, Electric Utilities) | 2.2 | 2.0 |
CSL Ltd. (Australia, Biotechnology) | 2.1 | 1.7 |
Vodafone Group PLC (United Kingdom, Wireless Telecommunication Services) | 2.0 | 1.6 |
Telefonica SA (Spain, Diversified Telecommunication Services) | 1.9 | 1.6 |
HSBC Holdings PLC (United Kingdom) (Reg.) (United Kingdom, Commercial Banks) | 1.9 | 0.7 |
Toyota Motor Corp. (Japan, Automobiles) | 1.5 | 1.0 |
BHP Billiton PLC (United Kingdom, Metals & Mining) | 1.5 | 1.2 |
| 21.0 | |
Market Sectors as of October 31, 2008 |
| % of fund's
net assets | % of fund's net assets
6 months ago |
Financials | 19.8 | 20.2 |
Health Care | 15.8 | 9.2 |
Consumer Staples | 10.8 | 8.6 |
Telecommunication Services | 7.7 | 6.9 |
Energy | 7.5 | 9.4 |
Information Technology | 7.3 | 9.1 |
Consumer Discretionary | 6.7 | 7.2 |
Industrials | 5.9 | 9.9 |
Utilities | 5.5 | 6.0 |
Materials | 5.1 | 8.4 |
Annual Report
Investments October 31, 2008
Showing Percentage of Net Assets
Common Stocks - 90.7% |
| Shares | | Value (000s) |
Australia - 5.0% |
ABB Grain Ltd. | 1,694,386 | | $ 9,253 |
Commonwealth Bank of Australia | 1,505,851 | | 41,142 |
Computershare Ltd. | 7,275,075 | | 41,108 |
CSL Ltd. | 6,733,245 | | 163,665 |
National Australia Bank Ltd. | 2,188,189 | | 35,487 |
QBE Insurance Group Ltd. | 2,204,978 | | 37,599 |
Westpac Banking Corp. | 240,907 | | 3,304 |
Woolworths Ltd. | 3,270,417 | | 60,934 |
TOTAL AUSTRALIA | | 392,492 |
Belgium - 0.1% |
Hansen Transmission International NV | 6,191,000 | | 10,384 |
Brazil - 0.4% |
BM&F BOVESPA SA | 3,185,693 | | 8,464 |
Vivo Participacoes SA sponsored ADR | 2,046,100 | | 22,384 |
TOTAL BRAZIL | | 30,848 |
Canada - 1.6% |
Canadian Natural Resources Ltd. | 585,000 | | 29,507 |
Niko Resources Ltd. | 498,400 | | 21,824 |
Open Text Corp. (a)(d) | 1,858,400 | | 47,100 |
Petrobank Energy & Resources Ltd. (a) | 813,500 | | 15,517 |
Talisman Energy, Inc. | 1,185,900 | | 11,713 |
Timminco Ltd. (a) | 484,400 | | 2,732 |
TOTAL CANADA | | 128,393 |
Cayman Islands - 0.2% |
China Dongxiang Group Co. Ltd. | 49,139,000 | | 14,456 |
China - 0.3% |
ZTE Corp. (H Shares) | 9,367,280 | | 21,181 |
Cyprus - 0.0% |
Aisi Realty Public Ltd. (a)(e) | 10,023,000 | | 1,469 |
Czech Republic - 0.4% |
Ceske Energeticke Zavody AS | 726,800 | | 31,451 |
Denmark - 1.1% |
Novo Nordisk AS Series B | 1,562,200 | | 83,738 |
Finland - 0.9% |
Nokia Corp. sponsored ADR (d) | 4,627,100 | | 70,239 |
France - 5.7% |
Alstom SA | 1,018,312 | | 50,471 |
AXA SA | 1,784,766 | | 34,096 |
Common Stocks - continued |
| Shares | | Value (000s) |
France - continued |
BNP Paribas SA | 1,261,039 | | $ 91,049 |
Cap Gemini SA | 684,300 | | 22,048 |
CNP Assurances | 218,000 | | 17,566 |
Eutelsat Communications | 2,321,754 | | 49,832 |
GDF Suez | 1,614,778 | | 72,180 |
L'Air Liquide SA | 497,774 | | 42,955 |
LVMH Moet Hennessy - Louis Vuitton | 272,400 | | 18,127 |
Orpea (a)(d) | 560,828 | | 18,246 |
Sechilienne-Sidec | 182,432 | | 7,005 |
Societe Generale Series A | 441,320 | | 24,054 |
TOTAL FRANCE | | 447,629 |
Germany - 11.0% |
Allianz AG (Reg.) | 748,030 | | 55,980 |
Bayer AG | 551,600 | | 30,707 |
Bayer AG sponsored ADR | 237,840 | | 13,131 |
Beiersdorf AG | 90,350 | | 4,790 |
Daimler AG (Reg.) | 340,400 | | 11,771 |
Deutsche Bank AG | 507,100 | | 19,256 |
Deutsche Boerse AG | 267,325 | | 21,375 |
Deutsche Telekom AG (Reg.) | 4,103,000 | | 61,284 |
E.ON AG | 4,453,900 | | 170,392 |
Fresenius Medical Care AG | 808,400 | | 36,766 |
GEA Group AG | 1,773,100 | | 25,912 |
Gerresheimer AG | 1,207,200 | | 42,322 |
Linde AG | 550,793 | | 46,257 |
Muenchener Rueckversicherungs-Gesellschaft AG (Reg.) | 786,000 | | 104,322 |
Q-Cells AG (a)(d) | 365,515 | | 14,379 |
RWE AG | 1,232,900 | | 103,032 |
Siemens AG (Reg.) | 645,600 | | 38,688 |
SolarWorld AG (d) | 804,033 | | 20,264 |
Symrise AG | 1,793,000 | | 22,271 |
Wincor Nixdorf AG | 256,500 | | 11,222 |
TOTAL GERMANY | | 854,121 |
Greece - 0.3% |
Public Power Corp. of Greece | 1,609,345 | | 19,900 |
Hong Kong - 1.1% |
Cheung Kong Holdings Ltd. | 3,875,000 | | 37,206 |
China Unicom (Hong Kong) Ltd. | 13,364,000 | | 19,080 |
Hang Seng Bank Ltd. | 2,361,100 | | 29,460 |
TOTAL HONG KONG | | 85,746 |
Common Stocks - continued |
| Shares | | Value (000s) |
India - 0.8% |
Infosys Technologies Ltd. | 718,452 | | $ 20,942 |
Reliance Industries Ltd. | 409,023 | | 11,627 |
Satyam Computer Services Ltd. | 3,263,566 | | 20,633 |
Titan Industries Ltd. | 390,000 | | 8,175 |
TOTAL INDIA | | 61,377 |
Indonesia - 0.2% |
PT Bumi Resources Tbk | 47,032,000 | | 6,158 |
PT Indosat Tbk | 24,300,500 | | 11,764 |
TOTAL INDONESIA | | 17,922 |
Ireland - 0.3% |
Paddy Power PLC (Ireland) | 1,445,597 | | 24,647 |
Israel - 0.9% |
Nice Systems Ltd. sponsored ADR (a) | 918,700 | | 20,542 |
Teva Pharmaceutical Industries Ltd. sponsored ADR | 1,085,700 | | 46,555 |
TOTAL ISRAEL | | 67,097 |
Italy - 1.7% |
ENI SpA | 3,210,300 | | 76,624 |
Fiat SpA | 3,091,100 | | 24,567 |
Finmeccanica SpA | 788,864 | | 9,651 |
Finmeccanica SpA rights 11/7/08 (a) | 1,232,600 | | 524 |
Prysmian SpA | 1,016,400 | | 12,330 |
UniCredit SpA | 5,114,800 | | 12,515 |
TOTAL ITALY | | 136,211 |
Japan - 13.8% |
Aeon Mall Co. Ltd. | 1,073,500 | | 26,499 |
Asics Corp. | 3,914,000 | | 24,523 |
Canon Marketing Japan, Inc. | 2,296,500 | | 38,417 |
Canon, Inc. | 1,697,450 | | 59,394 |
Daiwa Securities Group, Inc. | 5,423,000 | | 30,658 |
East Japan Railway Co. | 10,753 | | 76,514 |
Konica Minolta Holdings, Inc. | 2,130,500 | | 13,991 |
Matsushita Electric Industrial Co. Ltd. | 4,011,000 | | 64,589 |
Mitsubishi Corp. | 3,196,500 | | 53,577 |
Mitsubishi UFJ Financial Group, Inc. | 16,855,700 | | 105,919 |
Mitsui & Co. Ltd. | 3,040,000 | | 29,455 |
Nintendo Co. Ltd. | 91,250 | | 28,470 |
Nippon Building Fund, Inc. | 2,590 | | 24,886 |
Nippon Telegraph & Telephone Corp. | 12,237 | | 49,933 |
Common Stocks - continued |
| Shares | | Value (000s) |
Japan - continued |
Nomura Holdings, Inc. | 9,963,700 | | $ 94,395 |
Promise Co. Ltd. | 1,379,000 | | 24,751 |
Rakuten, Inc. (d) | 46,965 | | 23,281 |
Ricoh Co. Ltd. | 3,390,000 | | 36,481 |
Seven & I Holdings Co. Ltd. | 1,143,400 | | 32,103 |
Sony Corp. sponsored ADR | 465,300 | | 10,814 |
Sony Financial Holdings, Inc. | 6,285 | | 20,440 |
Sumitomo Mitsui Financial Group, Inc. | 16,438 | | 65,894 |
Tokyo Electron Ltd. | 691,700 | | 23,063 |
Toyota Motor Corp. | 2,939,300 | | 114,777 |
TOTAL JAPAN | | 1,072,824 |
Korea (South) - 0.9% |
LG Household & Health Care Ltd. | 207,070 | | 29,672 |
NHN Corp. (a) | 346,842 | | 37,026 |
TOTAL KOREA (SOUTH) | | 66,698 |
Luxembourg - 0.6% |
Reinet Investments SCA (a) | 29,552 | | 308 |
Reinet Investments SCA (a) | 186,332 | | 3,618 |
SES SA (A Shares) FDR unit | 2,399,068 | | 41,107 |
TOTAL LUXEMBOURG | | 45,033 |
Malaysia - 0.1% |
KNM Group Bhd | 32,198,300 | | 5,460 |
Mexico - 0.5% |
America Movil SAB de CV Series L sponsored ADR | 1,262,200 | | 39,052 |
Netherlands - 1.5% |
AMG Advanced Metallurgical Group NV (a)(d) | 585,100 | | 9,471 |
ASML Holding NV (Netherlands) | 485,800 | | 8,505 |
Gemalto NV (a) | 331,217 | | 9,280 |
Koninklijke KPN NV | 6,660,700 | | 93,804 |
TOTAL NETHERLANDS | | 121,060 |
Norway - 0.2% |
Pronova BioPharma ASA | 4,726,590 | | 12,279 |
Papua New Guinea - 0.3% |
Oil Search Ltd. | 6,566,347 | | 19,883 |
Russia - 0.4% |
OAO Gazprom sponsored ADR | 1,657,700 | | 33,900 |
Singapore - 0.1% |
Singapore Exchange Ltd. | 2,172,000 | | 7,775 |
Common Stocks - continued |
| Shares | | Value (000s) |
Spain - 3.9% |
Banco Santander SA | 3,311,500 | | $ 35,814 |
Grifols SA | 3,624,108 | | 72,123 |
Red Electrica Corporacion SA | 628,000 | | 27,526 |
Repsol YPF SA | 1,089,200 | | 20,712 |
Telefonica SA | 8,021,700 | | 148,521 |
TOTAL SPAIN | | 304,696 |
Sweden - 0.1% |
Modern Times Group MTG AB (B Shares) | 540,150 | | 11,588 |
Switzerland - 12.5% |
Actelion Ltd. (Reg.) (a) | 1,419,010 | | 74,947 |
BB BIOTECH AG | 354,261 | | 22,463 |
Credit Suisse Group (Reg.) | 1,149,050 | | 42,958 |
EFG International | 1,978,630 | | 42,586 |
Julius Baer Holding AG | 488,128 | | 19,087 |
Nestle SA (Reg.) | 6,009,533 | | 233,639 |
Novartis AG: | | | |
(Reg.) | 1,609,626 | | 81,684 |
sponsored ADR | 994,500 | | 50,710 |
Roche Holding AG (participation certificate) | 1,115,576 | | 170,565 |
SGS Societe Generale de Surveillance Holding SA (Reg.) | 25,313 | | 24,916 |
Sonova Holding AG | 574,683 | | 23,873 |
Syngenta AG (Switzerland) | 426,660 | | 79,740 |
Tecan Group AG | 212,300 | | 9,529 |
The Swatch Group AG (Bearer) | 75,432 | | 11,768 |
UBS AG (For. Reg.) | 516,022 | | 8,754 |
Zurich Financial Services AG (Reg.) | 389,534 | | 79,011 |
TOTAL SWITZERLAND | | 976,230 |
Thailand - 0.1% |
Total Access Communication PCL unit | 14,109,900 | | 10,085 |
United Kingdom - 22.5% |
AstraZeneca PLC (United Kingdom) | 1,559,200 | | 66,068 |
Autonomy Corp. PLC (a) | 1,365,900 | | 21,655 |
BAE Systems PLC | 8,539,409 | | 47,994 |
Barclays PLC | 3,933,200 | | 11,273 |
BG Group PLC | 2,944,100 | | 43,285 |
BG Group PLC sponsored ADR | 207,400 | | 15,534 |
BHP Billiton PLC | 6,691,800 | | 113,616 |
BP PLC | 6,979,400 | | 56,885 |
British American Tobacco PLC: | | | |
(United Kingdom) | 3,175,400 | | 87,088 |
Common Stocks - continued |
| Shares | | Value (000s) |
United Kingdom - continued |
British American Tobacco PLC: - continued | | | |
sponsored ADR | 404,500 | | $ 21,989 |
Capita Group PLC | 4,290,793 | | 44,331 |
Compass Group PLC | 4,055,000 | | 18,854 |
Diageo PLC | 1,514,500 | | 23,109 |
GlaxoSmithKline PLC sponsored ADR | 1,381,600 | | 53,468 |
HSBC Holdings PLC: | | | |
(Hong Kong) (Reg.) | 3,704,844 | | 44,100 |
(United Kingdom) (Reg.) | 12,259,500 | | 145,186 |
Imperial Tobacco Group PLC | 1,644,800 | | 44,078 |
Informa PLC | 7,983,600 | | 27,045 |
Man Group PLC | 10,947,800 | | 63,199 |
Misys PLC | 7,892,600 | | 14,131 |
Prudential PLC | 6,511,200 | | 32,704 |
Reckitt Benckiser Group PLC | 2,636,700 | | 111,518 |
Rio Tinto PLC (Reg.) | 1,712,500 | | 79,985 |
Royal Bank of Scotland Group PLC | 10,165,495 | | 11,196 |
Royal Dutch Shell PLC Class B | 7,883,059 | | 213,697 |
Shire PLC | 1,814,400 | | 23,859 |
SSL International PLC | 6,429,705 | | 43,420 |
Standard Chartered PLC (United Kingdom) | 990,000 | | 16,360 |
Unilever PLC | 3,552,700 | | 79,805 |
Vodafone Group PLC | 80,550,435 | | 154,937 |
William Morrison Supermarkets PLC | 6,595,100 | | 28,078 |
TOTAL UNITED KINGDOM | | 1,758,447 |
United States of America - 1.2% |
Macquarie Infrastructure Co. LLC | 131,000 | | 1,330 |
Philip Morris International, Inc. | 1,529,600 | | 66,492 |
Visa, Inc. | 440,500 | | 24,382 |
TOTAL UNITED STATES OF AMERICA | | 92,204 |
TOTAL COMMON STOCKS (Cost $9,659,419) | 7,076,515 |
Nonconvertible Preferred Stocks - 1.4% |
| | | |
Germany - 1.1% |
Fresenius AG (non-vtg.) | 1,371,100 | | 88,425 |
Nonconvertible Preferred Stocks - continued |
| Shares | | Value (000s) |
Italy - 0.3% |
Intesa Sanpaolo SpA | 6,761,102 | | $ 20,068 |
TOTAL NONCONVERTIBLE PREFERRED STOCKS (Cost $135,122) | 108,493 |
Government Obligations - 0.3% |
| Principal Amount (000s) | | |
United States of America - 0.3% |
U.S. Treasury Bills, yield at date of purchase 0.33% to 1.72% 12/4/08 to 1/29/09 (f)
(Cost $20,322) | | $ 20,350 | | 20,341 |
Money Market Funds - 8.5% |
| Shares | | |
Fidelity Cash Central Fund, 1.81% (b) | 645,326,349 | | 645,326 |
Fidelity Securities Lending Cash Central Fund, 2.67% (b)(c) | 20,061,695 | | 20,062 |
TOTAL MONEY MARKET FUNDS (Cost $665,388) | 665,388 |
TOTAL INVESTMENT PORTFOLIO - 100.9% (Cost $10,480,251) | | 7,870,737 |
NET OTHER ASSETS - (0.9)% | | (73,080) |
NET ASSETS - 100% | $ 7,797,657 |
Futures Contracts |
| Expiration Date | | Underlying Face Amount at Value
(000s) | | Unrealized Appreciation/
(Depreciation) (000s) |
Purchased |
Equity Index Contracts |
1,759 CME Nikkei 225 Index Contracts (Japan) | Dec. 2008 | | $ 78,583 | | $ (28,790) |
1,070 TOPIX 150 Index Contracts (Japan) | Dec. 2008 | | 92,755 | | (36,491) |
TOTAL EQUITY INDEX CONTRACTS | | $ 171,338 | | $ (65,281) |
|
The face value of futures purchased as a percentage of net assets - 2.2% |
Legend |
(a) Non-income producing |
(b) Affiliated fund that is available only to investment companies and other accounts managed by Fidelity Investments. The rate quoted is the annualized seven-day yield of the fund at period end. A complete unaudited listing of the fund's holdings as of its most recent quarter end is available upon request. |
(c) Investment made with cash collateral received from securities on loan. |
(d) Security or a portion of the security is on loan at period end. |
(e) Affiliated company |
(f) Security or a portion of the security was pledged to cover margin requirements for futures contracts. At the period end, the value of securities pledged amounted to $20,341,000. |
Affiliated Central Funds |
Information regarding fiscal year to date income earned by the Fund from investments in Fidelity Central Funds is as follows: |
Fund | Income earned
(Amounts in thousands) |
Fidelity Cash Central Fund | $ 24,831 |
Fidelity Securities Lending Cash Central Fund | 11,130 |
Total | $ 35,961 |
Other Affiliated Issuers |
An affiliated company is a company in which the fund has ownership of at least 5% of the voting securities. Fiscal year to date transactions with companies which are or were affiliates are as follows: |
Affiliates
(Amounts in thousands) | Value, beginning of period | Purchases | Sales Proceeds | Dividend Income | Value,
end of
period |
Aisi Realty Public Ltd. | $ 8,752 | $ - | $ - | $ - | $ 1,469 |
Renovo Group PLC | 42,523 | - | 6,236 | - | - |
Total | $ 51,275 | $ - | $ 6,236 | $ - | $ 1,469 |
Income Tax Information
At October 31, 2008, the fund had a capital loss carryforward of approximately $637,482,000 all of which will expire on October 31, 2016. |
See accompanying notes which are an integral part of the financial statements.
Annual Report
Statement of Assets and Liabilities
Amounts in thousands (except per-share amounts) | October 31, 2008 |
| | |
Assets | | |
Investment in securities, at value (including securities loaned of $19,297) - See accompanying schedule: Unaffiliated issuers (cost $9,808,248) | $ 7,203,880 | |
Fidelity Central Funds (cost $665,388) | 665,388 | |
Other affiliated issuers (cost $6,615) | 1,469 | |
Total Investments (cost $10,480,251) | | $ 7,870,737 |
Foreign currency held at value (cost $5,841) | | 5,690 |
Receivable for investments sold | | 66,423 |
Receivable for fund shares sold | | 14,159 |
Dividends receivable | | 25,197 |
Distributions receivable from Fidelity Central Funds | | 856 |
Other receivables | | 1,128 |
Total assets | | 7,984,190 |
| | |
Liabilities | | |
Payable for investments purchased | $ 141,169 | |
Payable for fund shares redeemed | 9,351 | |
Accrued management fee | 5,296 | |
Distribution fees payable | 155 | |
Payable for daily variation on futures contracts | 7,529 | |
Other affiliated payables | 2,276 | |
Other payables and accrued expenses | 695 | |
Collateral on securities loaned, at value | 20,062 | |
Total liabilities | | 186,533 |
| | |
Net Assets | | $ 7,797,657 |
Net Assets consist of: | | |
Paid in capital | | $ 10,988,479 |
Undistributed net investment income | | 120,184 |
Accumulated undistributed net realized gain (loss) on investments and foreign currency transactions | | (636,064) |
Net unrealized appreciation (depreciation) on investments and assets and liabilities in foreign currencies | | (2,674,942) |
Net Assets | | $ 7,797,657 |
See accompanying notes which are an integral part of the financial statements.
Annual Report
Statement of Assets and Liabilities - continued
Amounts in thousands (except per-share amounts) | October 31, 2008 |
| | |
Calculation of Maximum Offering Price
Class A:
Net Asset Value and redemption price per share ($379,564 ÷ 16,031.5 shares) | | $ 23.68 |
| | |
Maximum offering price per share (100/94.25 of $23.68) | | $ 25.12 |
Class T:
Net Asset Value and redemption price per share ($63,690 ÷ 2,711.8 shares) | | $ 23.49 |
| | |
Maximum offering price per share (100/96.50 of $23.49) | | $ 24.34 |
Class B:
Net Asset Value and offering price per share ($14,961 ÷ 643.5 shares) A | | $ 23.25 |
| | |
Class C:
Net Asset Value and offering price per share ($36,410 ÷ 1,562.3 shares) A | | $ 23.31 |
| | |
| | |
International Discovery:
Net Asset Value, offering price and redemption price per share ($6,998,759 ÷ 293,060.0 shares) | | $ 23.88 |
| | |
Class K:
Net Asset Value, offering price and redemption price per share ($145,192 ÷ 6,074.3 shares) | | $ 23.90 |
| | |
Institutional Class:
Net Asset Value, offering price and redemption price per share ($159,081 ÷ 6,654.3 shares) | | $ 23.91 |
A Redemption price per share is equal to net asset value less any applicable contingent deferred sales charge.
See accompanying notes which are an integral part of the financial statements.
Annual Report
Financial Statements - continued
Statement of Operations
Amounts in thousands | Year ended October 31, 2008 |
| | |
Investment Income | | |
Dividends | | $ 318,308 |
Interest | | 161 |
Income from Fidelity Central Funds | | 35,961 |
| | 354,430 |
Less foreign taxes withheld | | (27,021) |
Total income | | 327,409 |
| | |
Expenses | | |
Management fee
Basic fee | $ 90,977 | |
Performance adjustment | 13,226 | |
Transfer agent fees | 28,436 | |
Distribution fees | 2,431 | |
Accounting and security lending fees | 1,917 | |
Custodian fees and expenses | 2,341 | |
Independent trustees' compensation | 56 | |
Registration fees | 466 | |
Audit | 115 | |
Legal | 65 | |
Miscellaneous | 1,638 | |
Total expenses before reductions | 141,668 | |
Expense reductions | (5,009) | 136,659 |
Net investment income (loss) | | 190,750 |
Realized and Unrealized Gain (Loss) Net realized gain (loss) on: | | |
Investment securities: | | |
Unaffiliated issuers (net of foreign taxes of $366) | (569,251) | |
Other affiliated issuers | (20,894) | |
Foreign currency transactions | (36,433) | |
Futures contracts | (37,990) | |
Total net realized gain (loss) | | (664,568) |
Change in net unrealized appreciation (depreciation) on: Investment securities (net of decrease in deferred foreign taxes of $4,165) | (6,819,805) | |
Assets and liabilities in foreign currencies | (192) | |
Futures contracts | (68,439) | |
Total change in net unrealized appreciation (depreciation) | | (6,888,436) |
Net gain (loss) | | (7,553,004) |
Net increase (decrease) in net assets resulting from operations | | $ (7,362,254) |
See accompanying notes which are an integral part of the financial statements.
Annual Report
Statement of Changes in Net Assets
Amounts in thousands | Year ended
October 31,
2008 | Year ended
October 31,
2007 |
Increase (Decrease) in Net Assets | | |
Operations | | |
Net investment income (loss) | $ 190,750 | $ 144,458 |
Net realized gain (loss) | (664,568) | 608,100 |
Change in net unrealized appreciation (depreciation) | (6,888,436) | 2,677,967 |
Net increase (decrease) in net assets resulting
from operations | (7,362,254) | 3,430,525 |
Distributions to shareholders from net investment income | (129,574) | (85,862) |
Distributions to shareholders from net realized gain | (528,706) | (224,325) |
Total distributions | (658,280) | (310,187) |
Share transactions - net increase (decrease) | 1,069,130 | 3,385,409 |
Redemption fees | 709 | 502 |
Total increase (decrease) in net assets | (6,950,695) | 6,506,249 |
| | |
Net Assets | | |
Beginning of period | 14,748,352 | 8,242,103 |
End of period (including undistributed net investment income of $120,184 and undistributed net investment income of $137,292, respectively) | $ 7,797,657 | $ 14,748,352 |
See accompanying notes which are an integral part of the financial statements.
Annual Report
Financial Highlights - Class A
Years ended October 31, | 2008 | 2007 | 2006 | 2005 H |
Selected Per-Share Data | | | |
Net asset value, beginning of period | $ 47.34 | $ 36.47 | $ 30.57 | $ 27.41 |
Income from Investment
Operations | | | | |
Net investment income (loss) E | .46 | .44 | .42 | .28 |
Net realized and unrealized gain (loss) | (22.08) | 11.76 | 7.19 | 2.88 |
Total from investment operations | (21.62) | 12.20 | 7.61 | 3.16 |
Distributions from net investment income | (.37) | (.35) | (.31) | - |
Distributions from net realized gain | (1.67) | (.98) | (1.40) | - |
Total distributions | (2.04) | (1.33) | (1.71) | - |
Redemption fees added to paid in capital E,J | - | - | - | - |
Net asset value, end of period | $ 23.68 | $ 47.34 | $ 36.47 | $ 30.57 |
Total Return B,C,D | (47.65)% | 34.54% | 26.01% | 11.53% |
Ratios to Average Net Assets F,I | | | |
Expenses before reductions | 1.32% | 1.25% | 1.27% | 1.42% A |
Expenses net of fee waivers, if any | 1.32% | 1.25% | 1.27% | 1.42% A |
Expenses net of all reductions | 1.29% | 1.22% | 1.21% | 1.36% A |
Net investment income (loss) | 1.27% | 1.08% | 1.22% | 1.15% A |
Supplemental Data | | | |
Net assets, end of period (in millions) | $ 380 | $ 417 | $ 140 | $ 2 |
Portfolio turnover rate G | 79% | 56% | 56% | 75% |
A Annualized
B Total returns for periods of less than one year are not annualized.
C Total returns would have been lower had certain expenses not been reduced during the periods shown.
D Total returns do not include the effect of the sales charges.
E Calculated based on average shares outstanding during the period.
F Fees and expenses of the underlying Fidelity Central Funds are not included in the Fund's expense ratio. The Fund indirectly bears its proportionate share of the expenses of any underlying Fidelity Central Funds.
G Amount does not include the portfolio activity of any underlying Fidelity Central Funds.
H For the period January 6, 2005 (commencement of sale of shares) to October 31, 2005.
I Expense ratios reflect operating expenses of the class. Expenses before reductions do not reflect amounts reimbursed by the investment adviser or reductions from brokerage service arrangements or other expense offset arrangements and do not represent the amount paid by the class during periods when reimbursements or reductions occur. Expense ratios before reductions for start-up periods may not be representative of longer-term operating periods. Expenses net of fee waivers reflect expenses after reimbursement by the investment adviser but prior to reductions from brokerage service arrangements or other expense offset arrangements. Expenses net of all reductions represent the net expenses paid by the class.
J Amount represents less than $.01 per share.
See accompanying notes which are an integral part of the financial statements.
Annual Report
Financial Highlights - Class T
Years ended October 31, | 2008 | 2007 | 2006 | 2005 H |
Selected Per-Share Data | | | |
Net asset value, beginning of period | $ 47.06 | $ 36.30 | $ 30.49 | $ 27.41 |
Income from Investment
Operations | | | | |
Net investment income (loss) E | .33 | .29 | .27 | .20 |
Net realized and unrealized gain (loss) | (21.94) | 11.71 | 7.18 | 2.88 |
Total from investment operations | (21.61) | 12.00 | 7.45 | 3.08 |
Distributions from net investment income | (.29) | (.26) | (.24) | - |
Distributions from net realized gain | (1.67) | (.98) | (1.40) | - |
Total distributions | (1.96) | (1.24) | (1.64) | - |
Redemption fees added to paid in capital E,J | - | - | - | - |
Net asset value, end of period | $ 23.49 | $ 47.06 | $ 36.30 | $ 30.49 |
Total Return B,C,D | (47.84)% | 34.08% | 25.49% | 11.24% |
Ratios to Average Net Assets F,I | | | |
Expenses before reductions | 1.68% | 1.63% | 1.71% | 1.75% A |
Expenses net of fee waivers, if any | 1.68% | 1.63% | 1.71% | 1.75% A |
Expenses net of all reductions | 1.64% | 1.60% | 1.65% | 1.69% A |
Net investment income (loss) | .91% | .70% | .78% | .83% A |
Supplemental Data | | | |
Net assets, end of period (in millions) | $ 64 | $ 53 | $ 10 | $ 2 |
Portfolio turnover rate G | 79% | 56% | 56% | 75% |
A Annualized
B Total returns for periods of less than one year are not annualized.
C Total returns would have been lower had certain expenses not been reduced during the periods shown.
D Total returns do not include the effect of the sales charges.
E Calculated based on average shares outstanding during the period.
F Fees and expenses of the underlying Fidelity Central Funds are not included in the Fund's expense ratio. The Fund indirectly bears its proportionate share of the expenses of any underlying Fidelity Central Funds.
G Amount does not include the portfolio activity of any underlying Fidelity Central Funds.
H For the period January 6, 2005 (commencement of sale of shares) to October 31, 2005.
I Expense ratios reflect operating expenses of the class. Expenses before reductions do not reflect amounts reimbursed by the investment adviser or reductions from brokerage service arrangements or other expense offset arrangements and do not represent the amount paid by the class during periods when reimbursements or reductions occur. Expense ratios before reductions for start-up periods may not be representative of longer-term operating periods. Expenses net of fee waivers reflect expenses after reimbursement by the investment adviser but prior to reductions from brokerage service arrangements or other expense offset arrangements. Expenses net of all reductions represent the net expenses paid by the class.
J Amount represents less than $.01 per share.
See accompanying notes which are an integral part of the financial statements.
Annual Report
Financial Highlights - Class B
Years ended October 31, | 2008 | 2007 | 2006 | 2005 H |
Selected Per-Share Data | | | | |
Net asset value, beginning of period | $ 46.70 | $ 36.12 | $ 30.36 | $ 27.41 |
Income from Investment
Operations | | | | |
Net investment income (loss) E | .15 | .08 | .08 | .08 |
Net realized and unrealized gain (loss) | (21.77) | 11.64 | 7.19 | 2.87 |
Total from investment operations | (21.62) | 11.72 | 7.27 | 2.95 |
Distributions from net investment income | (.16) | (.16) | (.11) | - |
Distributions from net realized gain | (1.67) | (.98) | (1.40) | - |
Total distributions | (1.83) | (1.14) | (1.51) | - |
Redemption fees added to paid in capital E,J | - | - | - | - |
Net asset value, end of period | $ 23.25 | $ 46.70 | $ 36.12 | $ 30.36 |
Total Return B,C,D | (48.11)% | 33.37% | 24.91% | 10.76% |
Ratios to Average Net Assets F,I | | | | |
Expenses before reductions | 2.19% | 2.14% | 2.27% | 2.24% A |
Expenses net of fee waivers, if any | 2.19% | 2.14% | 2.25% | 2.24% A |
Expenses net of all reductions | 2.15% | 2.10% | 2.19% | 2.18% A |
Net investment income (loss) | .40% | .19% | .24% | .33% A |
Supplemental Data | | | | |
Net assets, end of period (in millions) | $ 15 | $ 17 | $ 4 | $ 1 |
Portfolio turnover rate G | 79% | 56% | 56% | 75% |
A Annualized
B Total returns for periods of less than one year are not annualized.
C Total returns would have been lower had certain expenses not been reduced during the periods shown.
D Total returns do not include the effect of the contingent deferred sales charge.
E Calculated based on average shares outstanding during the period.
F Fees and expenses of the underlying Fidelity Central Funds are not included in the Fund's expense ratio. The Fund indirectly bears its proportionate share of the expenses of any underlying Fidelity Central Funds.
G Amount does not include the portfolio activity of any underlying Fidelity Central Funds.
H For the period January 6, 2005 (commencement of sale of shares) to October 31, 2005.
I Expense ratios reflect operating expenses of the class. Expenses before reductions do not reflect amounts reimbursed by the investment adviser or reductions from brokerage service arrangements or other expense offset arrangements and do not represent the amount paid by the class during periods when reimbursements or reductions occur. Expense ratios before reductions for start-up periods may not be representative of longer-term operating periods. Expenses net of fee waivers reflect expenses after reimbursement by the investment adviser but prior to reductions from brokerage service arrangements or other expense offset arrangements. Expenses net of all reductions represent the net expenses paid by the class.
J Amount represents less than $.01 per share.
See accompanying notes which are an integral part of the financial statements.
Annual Report
Financial Highlights - Class C
Years ended October 31, | 2008 | 2007 | 2006 | 2005 H |
Selected Per-Share Data | | | |
Net asset value, beginning of period | $ 46.82 | $ 36.19 | $ 30.41 | $ 27.41 |
Income from Investment
Operations | | | | |
Net investment income (loss) E | .15 | .09 | .11 | .13 |
Net realized and unrealized gain (loss) | (21.82) | 11.66 | 7.19 | 2.87 |
Total from investment operations | (21.67) | 11.75 | 7.30 | 3.00 |
Distributions from net investment income | (.17) | (.14) | (.12) | - |
Distributions from net realized gain | (1.67) | (.98) | (1.40) | - |
Total distributions | (1.84) | (1.12) | (1.52) | - |
Redemption fees added to paid in capital E,J | - | - | - | - |
Net asset value, end of period | $ 23.31 | $ 46.82 | $ 36.19 | $ 30.41 |
Total Return B,C,D | (48.10)% | 33.38% | 24.97% | 10.94% |
Ratios to Average Net Assets F,I | | | | |
Expenses before reductions | 2.17% | 2.11% | 2.16% | 2.04% A |
Expenses net of fee waivers, if any | 2.17% | 2.11% | 2.16% | 2.04% A |
Expenses net of all reductions | 2.13% | 2.08% | 2.11% | 1.98% A |
Net investment income (loss) | .42% | .22% | .33% | .53% A |
Supplemental Data | | | |
Net assets, end of period (in millions) | $ 36 | $ 28 | $ 6 | $ 2 |
Portfolio turnover rate G | 79% | 56% | 56% | 75% |
A Annualized
B Total returns for periods of less than one year are not annualized.
C Total returns would have been lower had certain expenses not been reduced during the periods shown.
D Total returns do not include the effect of the contingent deferred sales charge.
E Calculated based on average shares outstanding during the period.
F Fees and expenses of the underlying Fidelity Central Funds are not included in the Fund's expense ratio. The Fund indirectly bears its proportionate share of the expenses of any underlying Fidelity Central Funds.
G Amount does not include the portfolio activity of any underlying Fidelity Central Funds.
H For the period January 6, 2005 (commencement of sale of shares) to October 31, 2005.
I Expense ratios reflect operating expenses of the class. Expenses before reductions do not reflect amounts reimbursed by the investment adviser or reductions from brokerage service arrangements or other expense offset arrangements and do not represent the amount paid by the class during periods when reimbursements or reductions occur. Expense ratios before reductions for start-up periods may not be representative of longer-term operating periods. Expenses net of fee waivers reflect expenses after reimbursement by the investment adviser but prior to reductions from brokerage service arrangements or other expense offset arrangements. Expenses net of all reductions represent the net expenses paid by the class.
J Amount represents less than $.01 per share.
See accompanying notes which are an integral part of the financial statements.
Annual Report
Financial Highlights - International Discovery
Years ended October 31, | 2008 | 2007 | 2006 | 2005 | 2004 |
Selected Per-Share Data | | | | | |
Net asset value, beginning of period | $ 47.68 | $ 36.67 | $ 30.65 | $ 25.31 | $ 21.87 |
Income from Investment Operations | | | | | |
Net investment income (loss) B | .57 | .53 | .48 | .37 | .22 |
Net realized and unrealized gain (loss) | (22.29) | 11.84 | 7.25 | 5.24 | 3.40 |
Total from investment operations | (21.72) | 12.37 | 7.73 | 5.61 | 3.62 |
Distributions from net investment income | (.41) | (.38) | (.31) | (.15) | (.18) |
Distributions from net realized gain | (1.67) | (.98) | (1.40) | (.12) | - |
Total distributions | (2.08) | (1.36) | (1.71) | (.27) | (.18) |
Redemption fees added to paid in capital B,F | - | - | - | - | - |
Net asset value, end of period | $ 23.88 | $ 47.68 | $ 36.67 | $ 30.65 | $ 25.31 |
Total Return A | (47.55)% | 34.85% | 26.34% | 22.29% | 16.65% |
Ratios to Average Net Assets C,E | | | | | |
Expenses before reductions | 1.09% | 1.04% | 1.09% | 1.08% | 1.10% |
Expenses net of fee waivers, if any | 1.09% | 1.04% | 1.08% | 1.07% | 1.10% |
Expenses net of all reductions | 1.05% | 1.00% | 1.03% | 1.01% | 1.06% |
Net investment income (loss) | 1.51% | 1.30% | 1.41% | 1.35% | .92% |
Supplemental Data | | | | | |
Net assets, end of period (in millions) | $ 6,999 | $ 14,176 | $ 8,054 | $ 3,949 | $ 2,193 |
Portfolio turnover rate D | 79% | 56% | 56% | 75% | 87% |
A Total returns would have been lower had certain expenses not been reduced during the periods shown.
B Calculated based on average shares outstanding during the period.
C Fees and expenses of the underlying Fidelity Central Funds are not included in the Fund's expense ratio. The Fund indirectly bears its proportionate share of the expenses of any underlying Fidelity Central Funds.
D Amount does not include the portfolio activity of any underlying Fidelity Central Funds.
E Expense ratios reflect operating expenses of the class. Expenses before reductions do not reflect amounts reimbursed by the investment adviser or reductions from brokerage service arrangements or other expense offset arrangements and do not represent the amount paid by the class during periods when reimbursements or reductions occur. Expenses net of fee waivers reflect expenses after reimbursement by the investment adviser but prior to reductions from brokerage service arrangements or other expense offset arrangements. Expenses net of all reductions represent the net expenses paid by the class.
F Amount represents less than $.01 per share.
See accompanying notes which are an integral part of the financial statements.
Annual Report
Financial Highlights - Class K
Year ended October 31, | 2008 G |
Selected Per-Share Data | |
Net asset value, beginning of period | $ 40.32 |
Income from Investment Operations | |
Net investment income (loss) D | .10 |
Net realized and unrealized gain (loss) | (16.52) |
Total from investment operations | (16.42) |
Redemption fees added to paid in capital D,I | - |
Net asset value, end of period | $ 23.90 |
Total Return B,C | (40.72)% |
Ratios to Average Net Assets E,H | |
Expenses before reductions | .93% A |
Expenses net of fee waivers, if any | .93% A |
Expenses net of all reductions | .89% A |
Net investment income (loss) | .83% A |
Supplemental Data | |
Net assets, end of period (in millions) | $ 145 |
Portfolio turnover rate F | 79% |
A Annualized
B Total returns for periods of less than one year are not annualized.
C Total returns would have been lower had certain expenses not been reduced during the periods shown.
D Calculated based on average shares outstanding during the period.
E Fees and expenses of the underlying Fidelity Central Funds are not included in the Fund's expense ratio. The Fund indirectly bears its proportionate share of the expenses of any underlying Fidelity Central Funds.
F Amount does not include the portfolio activity of any underlying Fidelity Central Funds.
G For the period May 9, 2008 (commencement of sale of shares) to October 31, 2008.
H Expense ratios reflect operating expenses of the class. Expenses before reductions do not reflect amounts reimbursed by the investment adviser or reductions from brokerage service arrangements or other expense offset arrangements and do not represent the amount paid by the class during periods when reimbursements or reductions occur. Expense ratios before reductions for start-up periods may not be representative of longer-term operating periods. Expenses net of fee waivers reflect expenses after reimbursement by the investment adviser but prior to reductions from brokerage service arrangements or other expense offset arrangements. Expenses net of all reductions represent the net expenses paid by the class.
I Amount represents less than $.01 per share.
See accompanying notes which are an integral part of the financial statements.
Annual Report
Financial Highlights - Institutional Class
Years ended October 31, | 2008 | 2007 | 2006 | 2005 G |
Selected Per-Share Data | | | | |
Net asset value, beginning of period | $ 47.73 | $ 36.71 | $ 30.68 | $ 27.41 |
Income from Investment
Operations | | | | |
Net investment income (loss) D | .53 | .55 | .51 | .38 |
Net realized and unrealized gain (loss) | (22.24) | 11.85 | 7.25 | 2.89 |
Total from investment operations | (21.71) | 12.40 | 7.76 | 3.27 |
Distributions from net investment income | (.44) | (.40) | (.33) | - |
Distributions from net realized gain | (1.67) | (.98) | (1.40) | - |
Total distributions | (2.11) | (1.38) | (1.73) | - |
Redemption fees added to paid in capital D,I | - | - | - | - |
Net asset value, end of period | $ 23.91 | $ 47.73 | $ 36.71 | $ 30.68 |
Total Return B,C | (47.51)% | 34.93% | 26.45% | 11.93% |
Ratios to Average Net Assets E,H | | | | |
Expenses before reductions | 1.05% | .97% | 1.00% | .97% A |
Expenses net of fee waivers, if any | 1.05% | .97% | 1.00% | .97% A |
Expenses net of all reductions | 1.01% | .94% | .95% | .90% A |
Net investment income (loss) | 1.54% | 1.36% | 1.49% | 1.60% A |
Supplemental Data | | | | |
Net assets, end of period (in millions) | $ 159 | $ 58 | $ 28 | $ 10 |
Portfolio turnover rate F | 79% | 56% | 56% | 75% |
A Annualized
B Total returns for periods of less than one year are not annualized.
C Total returns would have been lower had certain expenses not been reduced during the periods shown.
D Calculated based on average shares outstanding during the period.
E Fees and expenses of the underlying Fidelity Central Funds are not included in the Fund's expense ratio. The Fund indirectly bears its proportionate share of the expenses of any underlying Fidelity Central Funds.
F Amount does not include the portfolio activity of any underlying Fidelity Central Funds.
G For the period January 6, 2005 (commencement of sale of shares) to October 31, 2005.
H Expense ratios reflect operating expenses of the class. Expenses before reductions do not reflect amounts reimbursed by the investment adviser or reductions from brokerage service arrangements or other expense offset arrangements and do not represent the amount paid by the class during periods when reimbursements or reductions occur. Expense ratios before reductions for start-up periods may not be representative of longer-term operating periods. Expenses net of fee waivers reflect expenses after reimbursement by the investment adviser but prior to reductions from brokerage service arrangements or other expense offset arrangements. Expenses net of all reductions represent the net expenses paid by the class.
I Amount represents less than $.01 per share.
See accompanying notes which are an integral part of the financial statements.
Annual Report
Notes to Financial Statements
For the period ended October 31, 2008
(Amounts in thousands except ratios)
1. Organization.
Fidelity International Discovery Fund (the Fund) is a fund of Fidelity Investment Trust (the trust) and is authorized to issue an unlimited number of shares. The trust is registered under the Investment Company Act of 1940, as amended (the 1940 Act), as an open-end management investment company organized as a Massachusetts business trust. On January 17, 2008, the Board of Trustees of the Fund approved the creation of an additional class of shares. The Fund commenced sale of Class K shares on May 9, 2008. The Fund offers Class A, Class T, Class B, Class C, International Discovery, Class K and Institutional Class shares, each of which has equal rights as to assets and voting privileges. Each class has exclusive voting rights with respect to matters that affect that class. Class B shares will automatically convert to Class A shares after a holding period of seven years from the initial date of purchase. Investment income, realized and unrealized capital gains and losses, the common expenses of the Fund, and certain fund-level expense reductions, if any, are allocated on a pro-rata basis to each class based on the relative net assets of each class to the total net assets of the Fund. Each class differs with respect to transfer agent and distribution and service plan fees incurred. Certain expense reductions also differ by class. The Fund's investments in emerging markets can be subject to social, economic, regulatory, and political uncertainties and can be extremely volatile.
2. Investments in Fidelity Central Funds.
The Fund may invest in Fidelity Central Funds, which are open-end investment companies available only to other investment companies and accounts managed by Fidelity Management & Research Company (FMR) and its affiliates. The Fund's Schedule of Investments lists each of the Fidelity Central Funds held as of period end, if any, as an investment of the Fund, but does not include the underlying holdings of each Fidelity Central Fund. As an Investing Fund, the Fund indirectly bears its proportionate share of the expenses of the underlying Fidelity Central Funds.
The Money Market Central Funds seek preservation of capital and current income and are managed by Fidelity Investments Money Management, Inc. (FIMM), an affiliate of FMR.
A complete unaudited list of holdings for each Fidelity Central Fund is available upon request or at the SEC's web site at www.sec.gov. In addition, the financial statements of the Fidelity Central Funds, which are not covered by the Fund's Report of Independent Registered Public Accounting Firm, are available on the SEC's web site or upon request.
3. Significant Accounting Policies.
The financial statements have been prepared in conformity with accounting principles generally accepted in the United States of America, which require management to make
Annual Report
3. Significant Accounting Policies - continued
certain estimates and assumptions at the date of the financial statements. Actual results could differ from those estimates. The following summarizes the significant accounting policies of the Fund:
Security Valuation. Investments are valued as of 4:00 p.m. Eastern time on the last calendar day of the period. Wherever possible, the Fund uses independent pricing services approved by the Board of Trustees to value its investments.
Equity securities, including restricted securities, for which market quotations are readily available, are valued at the last reported sale price or official closing price as reported by an independent pricing service on the primary market or exchange on which they are traded. In the event there were no sales during the day or closing prices are not available, securities are valued at the last quoted bid price. Futures contracts are valued at the settlement price established each day by the board of trade or exchange on which they are traded. Investments in open-end mutual funds, including the Fidelity Central Funds, are valued at their closing net asset value each business day. Short-term securities with remaining maturities of sixty days or less for which quotations are not readily available are valued at amortized cost, which approximates value.
When current market prices or quotations are not readily available or reliable, valuations may be determined in good faith in accordance with procedures adopted by the Board of Trustees. Factors used in determining value may include significant market or security specific events, changes in interest rates and credit quality, and developments in foreign markets which are monitored by evaluating the performance of ADRs, futures contracts and exchange-traded funds. The frequency with which these procedures are used cannot be predicted and may be utilized to a significant extent. The value of securities used for net asset value (NAV) calculation under these procedures may differ from published prices for the same securities.
Foreign Currency. The Fund uses foreign currency contracts to facilitate transactions in foreign-denominated securities. Losses from these transactions may arise from changes in the value of the foreign currency or if the counterparties do not perform under the contracts' terms.
Foreign-denominated assets, including investment securities, and liabilities are translated into U.S. dollars at the exchange rate at period end. Purchases and sales of investment securities, income and dividends received and expenses denominated in foreign currencies are translated into U.S. dollars at the exchange rate in effect on the transaction date.
The effects of exchange rate fluctuations on investments are included with the net realized and unrealized gain (loss) on investment securities. Other foreign currency transactions resulting in realized and unrealized gain (loss) are disclosed separately.
Annual Report
Notes to Financial Statements - continued
(Amounts in thousands except ratios)
3. Significant Accounting Policies - continued
Investment Transactions and Income. For financial reporting purposes, the Fund's investment holdings and NAV include trades executed through the end of the last business day of the period. The NAV per share for processing shareholder transactions is calculated as of the close of business of the New York Stock Exchange (NYSE) normally 4:00 p.m. Eastern time and includes trades executed through the end of the prior business day. Gains and losses on securities sold are determined on the basis of identified cost and may include proceeds received from litigation. Dividend income is recorded on the ex-dividend date, except for certain dividends from foreign securities where the ex-dividend date may have passed, which are recorded as soon as the Fund is informed of the ex-dividend date. Non-cash dividends included in dividend income, if any, are recorded at the fair market value of the securities received. Distributions received on securities that represent a return of capital or capital gain are recorded as a reduction of cost of investments and/or as a realized gain. The Fund estimates the components of distributions received that may be considered return of capital distributions or capital gain distributions. Interest income and distributions from the Fidelity Central Funds are accrued as earned. Interest income includes coupon interest and amortization of premium and accretion of discount on debt securities. Investment income is recorded net of foreign taxes withheld where recovery of such taxes is uncertain.
Expenses. Most expenses of the trust can be directly attributed to a fund. Expenses which cannot be directly attributed are apportioned among each Fund in the trust. Expense estimates are accrued in the period to which they relate and adjustments are made when actual amounts are known.
Income Tax Information and Distributions to Shareholders. Each year, the Fund intends to qualify as a regulated investment company by distributing substantially all of its taxable income and realized gains under Subchapter M of the Internal Revenue Code and filing its U.S. federal tax return. As a result, no provision for income taxes is required. The Fund is subject to the provisions of FASB Interpretation No. 48, Accounting for Uncertainties in Income Taxes (FIN 48). FIN 48 sets forth a minimum threshold for financial statement recognition of the benefit of a tax position taken or expected to be taken in a tax return. The implementation of FIN 48 did not result in any unrecognized tax benefits in the accompanying financial statements. Each of the Fund's federal tax returns for the prior three fiscal years remains subject to examination by the Internal Revenue Service (IRS). Foreign taxes are provided for based on the Fund's understanding of the tax rules and rates that exist in the foreign markets in which it invests.
Distributions are recorded on the ex-dividend date. Income dividends and capital gain distributions are declared separately for each class. Income and capital gain distributions are determined in accordance with income tax regulations, which may differ from
Annual Report
3. Significant Accounting Policies - continued
Income Tax Information and Distributions to Shareholders - continued
generally accepted accounting principles. In addition, the Fund will claim a portion of the payment made to redeeming shareholders as a distribution for income tax purposes.
Capital accounts within the financial statements are adjusted for permanent book-tax differences. These adjustments have no impact on net assets or the results of operations. Temporary book-tax differences will reverse in a subsequent period.
Book-tax differences are primarily due to futures transactions, foreign currency transactions, certain foreign taxes, passive foreign investment companies (PFIC), market discount, deferred trustees compensation and losses deferred due to wash sales.
The tax-basis components of distributable earnings and the federal tax cost as of period end were as follows:
Unrealized appreciation | $ 370,565 |
Unrealized depreciation | (3,044,089) |
Net unrealized appreciation (depreciation) | (2,673,524) |
Undistributed ordinary income | 93,213 |
Capital loss carryforward | (637,482) |
| |
Cost for federal income tax purposes | $ 10,544,261 |
The tax character of distributions paid was as follows:
| October 31, 2008 | October 31, 2007 |
Ordinary Income | $ 164,399 | $ 145,377 |
Long-term Capital Gains | 493,881 | 164,810 |
Total | $ 658,280 | $ 310,187 |
Short-Term Trading (Redemption) Fees. Shares held in the Fund less than 30 days are subject to a redemption fee equal to 1.00% of the proceeds of the redeemed shares. All redemption fees, including any estimated redemption fees paid by FMR, are retained by the Fund and accounted for as an addition to paid in capital.
New Accounting Pronouncements. In September 2006, Statement of Financial Accounting Standards No. 157, Fair Value Measurements (SFAS 157), was issued and is effective for fiscal years beginning after November 15, 2007. SFAS 157 defines fair value, establishes a framework for measuring fair value and results in expanded disclosures about fair value measurements.
Annual Report
Notes to Financial Statements - continued
(Amounts in thousands except ratios)
3. Significant Accounting Policies - continued
New Accounting Pronouncements - continued
In addition, in March 2008, Statement of Financial Accounting Standards No. 161, Disclosures about Derivative Instruments and Hedging Activities (SFAS 161), was issued and is effective for reporting periods beginning after November 15, 2008. SFAS 161 requires enhanced disclosures to provide information about the reasons the Fund invests in derivative instruments, the accounting treatment and the effect derivatives have on financial performance.
4. Operating Policies.
Repurchase Agreements. FMR has received an Exemptive Order from the Securities and Exchange Commission (the SEC) which permits the Fund and other affiliated entities of FMR to transfer uninvested cash balances into joint trading accounts which are then invested in repurchase agreements. The Fund may also invest directly with institutions in repurchase agreements. Repurchase agreements are collateralized by government or non-government securities. Upon settlement date, collateral is held in segregated accounts with custodian banks and may be obtained in the event of a default of the counterparty. The Fund monitors, on a daily basis, the value of the collateral to ensure it is at least equal to the principal amount of the repurchase agreement (including accrued interest). In the event of a default by the counterparty, realization of the collateral proceeds could be delayed, during which time the value of the collateral may decline.
Futures Contracts. The Fund may use futures contracts to manage its exposure to the stock markets. Buying futures tends to increase a fund's exposure to the underlying instrument, while selling futures tends to decrease a fund's exposure to the underlying instrument or hedge other fund investments. Upon entering into a futures contract, a fund is required to deposit with a clearing broker, no later than the following business day, an amount ("initial margin") equal to a certain percentage of the face value of the contract. The initial margin may be in the form of cash or securities and is transferred to a segregated account on settlement date. Subsequent payments ("variation margin") are made or received by a fund depending on the daily fluctuations in the value of the futures contract and are accounted for as unrealized gains or losses. Realized gains (losses) are recorded upon the expiration or closing of the futures contract. Securities deposited to meet margin requirements are identified in the Schedule of Investments. Futures contracts involve, to varying degrees, risk of loss in excess of any futures variation margin reflected in the Statement of Assets and Liabilities. The underlying face amount at value of any open futures contracts at period end is shown in the Schedule of Investments under the caption "Futures Contracts." This amount reflects each contract's exposure to the underlying instrument at period end. Losses may arise from changes in the value of
Annual Report
4. Operating Policies - continued
Futures Contracts - continued
the underlying instruments or if the counterparties do not perform under the contract's terms.
5. Purchases and Sales of Investments.
Purchases and sales of securities other than short-term securities, aggregated $10,031,748 and $9,562,944, respectively.
6. Fees and Other Transactions with Affiliates.
Management Fee. FMR and its affiliates provide the Fund with investment management related services for which the Fund pays a monthly management fee. The management fee is the sum of an individual fund fee rate that is based on an annual rate of .45% of the Fund's average net assets and a group fee rate that averaged .26% during the period. The group fee rate is based upon the average net assets of all the mutual funds advised by FMR. The group fee rate decreases as assets under management increase and increases as assets under management decrease. In addition, the management fee is subject to a performance adjustment up to a maximum of ±.20% of the Fund's average net assets over a 36 month performance period). The upward or downward adjustment to the management fee is based on the relative investment performance of the retail class of the Fund, International Discovery as compared to an appropriate benchmark index. For the period, the total annual management fee rate, including the performance adjustment, was .81% of the Fund's average net assets.
Distribution and Service Plan. In accordance with Rule 12b-1 of the 1940 Act, the Fund has adopted separate Distribution and Service Plans for each class of shares. Certain classes pay Fidelity Distributors Corporation (FDC), an affiliate of FMR, separate Distribution and Service Fees, each of which is based on an annual percentage of each class' average net assets. In addition, FDC may pay financial intermediaries for selling shares of the Fund and providing shareholder support services. For the period, the Distribution and Service Fee rates and the total amounts paid to and retained by FDC were as follows:
| Distribution
Fee | Service
Fee | Paid to
FDC | Retained
by FDC |
Class A | 0% | .25% | $ 1,335 | $ 160 |
Class T | .25% | .25% | 393 | 3 |
Class B | .75% | .25% | 224 | 168 |
Class C | .75% | .25% | 479 | 189 |
| | | $ 2,431 | $ 520 |
Annual Report
Notes to Financial Statements - continued
(Amounts in thousands except ratios)
6. Fees and Other Transactions with Affiliates - continued
Sales Load. FDC receives a front-end sales charge of up to 5.75% for selling Class A shares, and 3.50% for selling Class T shares, some of which is paid to financial intermediaries for selling shares of the Fund. FDC receives the proceeds of contingent deferred sales charges levied on Class A, Class T, Class B, and Class C redemptions. These charges depend on the holding period. The deferred sales charges range from 5% to 1% for Class B, 1% for Class C, 1.00% to .50% for certain purchases of Class A shares and .25% for certain purchases of Class T shares.
For the period, sales charge amounts retained by FDC were as follows:
| Retained
by FDC |
Class A | $ 284 |
Class T | 46 |
Class B* | 36 |
Class C* | 14 |
| $ 380 |
* When Class B and Class C shares are initially sold, FDC pays commissions from its own resources to financial intermediaries through which the sales are made.
Transfer Agent Fees. Fidelity Investments Institutional Operations Company, Inc. (FIIOC), an affiliate of FMR, is the transfer, dividend disbursing and shareholder servicing agent for each class of the Fund. FIIOC receives account fees and asset-based fees that vary according to the account size and type of account of the shareholders of the respective classes of the Fund. FIIOC pays for typesetting, printing and mailing of shareholder reports, except proxy statements. Prior to January 1, 2008, Fidelity Service Company, Inc. (FSC) also an affiliate of FMR was the sub-transfer for International Discovery shares. For the period, the total transfer agent fees paid by each class were as follows:
| Amount | % of
Average
Net Assets |
Class A | $ 1,109 | .21 |
Class T | 248 | .31 |
Class B | 73 | .32 |
Class C | 146 | .30 |
International Discovery | 26,685 | .22 |
Class K | 8 | .05* |
Institutional Class | 167 | .18 |
| $ 28,436 | |
* Annualized
Annual Report
6. Fees and Other Transactions with Affiliates - continued
Accounting and Security Lending Fees. FSC maintains the Fund's accounting records. The accounting fee is based on the level of average net assets for the month. Under a separate contract, FSC administers the security lending program. The security lending fee is based on the number and duration of lending transactions.
Brokerage Commissions. The Fund placed a portion of its portfolio transactions with brokerage firms which are affiliates of the investment adviser. The commissions paid to these affiliated firms were $6 for the period.
7. Committed Line of Credit.
The Fund participates with other funds managed by FMR in a $4.2 billion credit facility (the "line of credit") to be utilized for temporary or emergency purposes to fund shareholder redemptions or for other short-term liquidity purposes. The Fund has agreed to pay commitment fees on its pro rata portion of the line of credit, which amounted to $26 and is reflected in Miscellaneous Expense on the Statement of Operations. During the period, there were no borrowings on this line of credit.
8. Security Lending.
The Fund lends portfolio securities from time to time in order to earn additional income. On the settlement date of the loan, the Fund receives collateral (in the form of U.S. Treasury obligations, letters of credit and/or cash) against the loaned securities and maintains collateral in an amount not less than 100% of the market value of the loaned securities during the period of the loan. The market value of the loaned securities is determined at the close of business of the Fund and any additional required collateral is delivered to the Fund on the next business day. If the borrower defaults on its obligation to return the securities loaned because of insolvency or other reasons, a fund could experience delays and costs in recovering the securities loaned or in gaining access to the collateral. Any cash collateral received is invested in the Fidelity Securities Lending Cash Central Fund. The value of loaned securities and cash collateral at period end are disclosed on the Fund's Statement of Assets and Liabilities. Security lending income represents the income earned on investing cash collateral, less fees and expenses associated with the loan, plus any premium payments that may be received on the loan of certain types of securities. Security lending income is presented in the Statement of Operations as a component of income from Fidelity Central Funds. Net income from lending portfolio securities during the period amounted to $11,130.
Annual Report
Notes to Financial Statements - continued
(Amounts in thousands except ratios)
9. Expense Reductions.
Many of the brokers with whom FMR places trades on behalf of the Fund provided services to the Fund in addition to trade execution. These services included payments of certain expenses on behalf of the Fund totaling $4,760 for the period. In addition, through arrangements with each class' transfer agent, credits realized as a result of uninvested cash balances were used to reduce the Fund's expenses. During the period, these credits reduced the Fund's custody expenses by $1. During the period, credits reduced each class' transfer agent expense as noted in the table below.
| Transfer Agent
expense reduction |
International Discovery | $ 248 |
10. Other.
The Fund's organizational documents provide former and current trustees and officers with a limited indemnification against liabilities arising in connection with the performance of their duties to the Fund. In the normal course of business, the Fund may also enter into contracts that provide general indemnifications. The Fund's maximum exposure under these arrangements is unknown as this would be dependent on future claims that may be made against the Fund. The risk of material loss from such claims is considered remote.
In December 2006, the Independent Trustees, with the assistance of independent counsel, completed an investigation regarding gifts, gratuities and business entertainment provided by certain brokers to certain individuals who were employed on FMR's domestic equity trading desk during the period 2002 to 2004. The Independent Trustees and FMR agreed that, despite the absence of proof that the Fidelity mutual funds experienced diminished execution quality as a result of the improper receipt of gifts and business entertainment, the conduct at issue was serious and was worthy of redress. Accordingly, the Independent Trustees requested, and FMR agreed to make, a payment of $42 million plus accrued interest, which equaled approximately $7.3 million, to certain Fidelity mutual funds.
In March 2008, the Trustees approved a method for allocating this payment among the funds and, in total, FMR paid the fund $5, which is recorded in the accompanying Statement of Operations.
In a related administrative order dated March 5, 2008, the U.S. Securities and Exchange Commission ("SEC") announced a settlement with FMR and FMR Co., Inc. (an affiliate of FMR) involving the SEC's regulatory rules for investment advisers and the improper receipt of gifts, gratuities and business entertainment. Without admitting or denying the SEC's findings, FMR agreed to pay an $8 million civil penalty to the United States Treasury.
Annual Report
11. Distributions to Shareholders.
Distributions to shareholders of each class were as follows:
Years ended October 31, | 2008 | 2007 |
From net investment income | | |
Class A | $ 3,599 | $ 1,387 |
Class T | 387 | 80 |
Class B | 67 | 21 |
Class C | 123 | 24 |
International Discovery | 124,823 | 84,038 |
Institutional Class | 575 | 312 |
Total | $ 129,574 | $ 85,862 |
From net realized gain | | |
Class A | $ 16,423 | $ 3,929 |
Class T | 2,244 | 302 |
Class B | 719 | 130 |
Class C | 1,185 | 170 |
International Discovery | 505,958 | 219,032 |
Institutional Class | 2,177 | 762 |
Total | $ 528,706 | $ 224,325 |
12. Share Transactions.
Transactions for each class of shares were as follows:
| Shares Years ended October 31, | Dollars Years ended October 31, |
| 2008 A | 2007 | 2008 A | 2007 |
Class A | | | | |
Shares sold | 13,337 | 5,675 | $ 505,827 | $ 234,633 |
Reinvestment of distributions | 252 | 63 | 11,025 | 2,271 |
Shares redeemed | (6,361) | (770) | (213,706) | (31,203) |
Net increase (decrease) | 7,228 | 4,968 | $ 303,146 | $ 205,701 |
Annual Report
Notes to Financial Statements - continued
(Amounts in thousands except ratios)
12. Share Transactions - continued
| Shares Years ended October 31, | Dollars Years ended October 31, |
| 2008 A | 2007 | 2008 A | 2007 |
Class T | | | | |
Shares sold | 2,322 | 1,031 | $ 87,236 | $ 42,252 |
Reinvestment of distributions | 59 | 10 | 2,571 | 371 |
Shares redeemed | (800) | (187) | (27,654) | (7,614) |
Net increase (decrease) | 1,581 | 854 | $ 62,153 | $ 35,009 |
Class B | | | | |
Shares sold | 487 | 293 | $ 18,856 | $ 11,952 |
Reinvestment of distributions | 17 | 4 | 721 | 136 |
Shares redeemed | (228) | (53) | (7,554) | (2,096) |
Net increase (decrease) | 276 | 244 | $ 12,023 | $ 9,992 |
Class C | | | | |
Shares sold | 1,350 | 481 | $ 51,762 | $ 19,749 |
Reinvestment of distributions | 25 | 4 | 1,076 | 139 |
Shares redeemed | (405) | (55) | (13,335) | (2,234) |
Net increase (decrease) | 970 | 430 | $ 39,503 | $ 17,654 |
International Discovery | | | | |
Shares sold | 98,885 | 133,089 | $ 3,784,869 | $ 5,367,776 |
Conversion to Class K | (6,197) | - | (182,264) | - |
Reinvestment of distributions | 13,646 | 7,929 | 600,976 | 289,550 |
Shares redeemed | (110,609) | (63,328) | (3,914,448) | (2,558,324) |
Net increase (decrease) | (4,275) | 77,690 | $ 289,133 | $ 3,099,002 |
Class K | | | | |
Shares sold | 215 | - | $ 6,017 | $ - |
Conversion from International Discovery | 6,197 | - | 182,264 | - |
Reinvestment of distributions | - | - | - | - |
Shares redeemed | (338) | - | (8,716) | - |
Net increase (decrease) | 6,074 | - | $ 179,565 | $ - |
Annual Report
12. Share Transactions - continued
| Shares Years ended October 31, | Dollars Years ended October 31, |
| 2008 A | 2007 | 2008 A | 2007 |
Institutional Class | | | | |
Shares sold | 7,551 | 538 | $ 243,799 | $ 22,351 |
Reinvestment of distributions | 42 | 19 | 1,852 | 700 |
Shares redeemed | (2,148) | (120) | (62,044) | (5,000) |
Net increase (decrease) | 5,445 | 437 | $ 183,607 | $ 18,051 |
A Share transactions for Class K are for the period May 9, 2008 (commencement of sale of shares) to October 31, 2008.
Annual Report
To the Trustees of Fidelity Investment Trust and the Shareholders of Fidelity International Discovery Fund:
In our opinion, the accompanying statement of assets and liabilities, including the schedule of investments, and the related statements of operations and of changes in net assets and the financial highlights present fairly, in all material respects, the financial position of Fidelity International Discovery Fund (a fund of Fidelity Investment Trust) at October 31, 2008, the results of its operations for the year then ended, the changes in its net assets for each of the two years in the period then ended and the financial highlights for each of the periods indicated, in conformity with accounting principles generally accepted in the United States of America. These financial statements and financial highlights (hereafter referred to as "financial statements") are the responsibility of the Fidelity International Discovery Fund's management. Our responsibility is to express an opinion on these financial statements based on our audits. We conducted our audits of these financial statements in accordance with the standards of the Public Company Accounting Oversight Board (United States). Those standards require that we plan and perform the audit to obtain reasonable assurance about whether the financial statements are free of material misstatement. An audit includes examining, on a test basis, evidence supporting the amounts and disclosures in the financial statements, assessing the accounting principles used and significant estimates made by management, and evaluating the overall financial statement presentation. We believe that our audits, which included confirmation of securities at October 31, 2008 by correspondence with the custodian and brokers, provide a reasonable basis for our opinion.
/s/ PricewaterhouseCoopers LLP
PricewaterhouseCoopers LLP
Boston, Massachusetts
December 23, 2008
Annual Report
The Trustees, Member of the Advisory Board, and executive officers of the trust and fund, as applicable, are listed below. The Board of Trustees governs the fund and is responsible for protecting the interests of shareholders. The Trustees are experienced executives who meet periodically throughout the year to oversee the fund's activities, review contractual arrangements with companies that provide services to the fund, and review the fund's performance. Except for Edward C. Johnson 3d and James C. Curvey, each of the Trustees oversees 220 funds advised by FMR or an affiliate. Messrs. Johnson and Curvey oversee 379 funds advised by FMR or an affiliate.
The Trustees hold office without limit in time except that (a) any Trustee may resign; (b) any Trustee may be removed by written instrument, signed by at least two-thirds of the number of Trustees prior to such removal; (c) any Trustee who requests to be retired or who has become incapacitated by illness or injury may be retired by written instrument signed by a majority of the other Trustees; and (d) any Trustee may be removed at any special meeting of shareholders by a two-thirds vote of the outstanding voting securities of the trust. Each Trustee who is not an interested person (as defined in the 1940 Act) (Independent Trustee), shall retire not later than the last day of the calendar year in which his or her 72nd birthday occurs. The Independent Trustees may waive this mandatory retirement age policy with respect to individual Trustees. The executive officers and Advisory Board Member hold office without limit in time, except that any officer and Advisory Board Member may resign or may be removed by a vote of a majority of the Trustees at any regular meeting or any special meeting of the Trustees. Except as indicated, each individual has held the office shown or other offices in the same company for the past five years.
The fund's Statement of Additional Information (SAI) includes more information about the Trustees. To request a free copy, call Fidelity at 1-877-208-0098.
Interested Trustees*:
Correspondence intended for each Trustee who is an interested person may be sent to Fidelity Investments, 82 Devonshire Street, Boston, Massachusetts 02109.
Name, Age; Principal Occupation |
Edward C. Johnson 3d (78) |
| Year of Election or Appointment: 1984 Mr. Johnson is Chairman of the Board of Trustees. Mr. Johnson serves as Chief Executive Officer, Chairman, and a Director of FMR LLC; Chairman and a Director of FMR; Chairman and a Director of Fidelity Research & Analysis Company (FRAC); Chairman and a Director of Fidelity Investments Money Management, Inc.; and Chairman and a Director of FMR Co., Inc. In addition, Mr. Johnson serves as Chairman and Director of FIL Limited. Previously, Mr. Johnson served as President of FMR LLC (2006-2007). |
James C. Curvey (73) |
| Year of Election or Appointment: 2007 Mr. Curvey also serves as Trustee (2007-present) of other investment companies advised by FMR. Mr. Curvey is a Director of FMR and FMR Co., Inc. (2007-present). Mr. Curvey is also Vice Chairman (2006-
present) and Director of FMR LLC. In addition, Mr. Curvey serves as an Overseer for the Boston Symphony Orchestra and a member of the Trustees of Villanova University. |
* Trustees have been determined to be "Interested Trustees" by virtue of, among other things, their affiliation with the trust or various entities under common control with FMR. FMR Corp. merged with and into FMR LLC on October 1, 2007. Any references to FMR LLC for prior periods are deemed to be references to the prior entity.
Independent Trustees:
Correspondence intended for each Independent Trustee (that is, the Trustees other than the Interested Trustees) may be sent to Fidelity Investments, P.O. Box 55235, Boston, Massachusetts 02205-5235.
Name, Age; Principal Occupation |
Dennis J. Dirks (60) |
| Year of Election or Appointment: 2005 Prior to his retirement in May 2003, Mr. Dirks was Chief Operating Officer and a member of the Board of The Depository Trust & Clearing Corporation (DTCC) (1999-2003). He also served as President, Chief Operating Officer, and Board member of The Depository Trust Company (DTC) (1999-2003) and President and Board member of the National Securities Clearing Corporation (NSCC) (1999-2003). In addition, Mr. Dirks served as a Trustee and a member of the Finance Committee of Manhattan College (2005-2008), and as Chief Executive Officer and Board member of the Government Securities Clearing Corporation (2001-2003) and Chief Executive Officer and Board member of the Mortgage-Backed Securities Clearing Corporation (2001-2003). Mr. Dirks also serves as a Trustee and a member of the Finance Committee of AHRC of Nassau County (2006-present). |
Alan J. Lacy (55) |
| Year of Election or Appointment: 2008 Mr. Lacy serves as Senior Adviser (2007-present) of Oak Hill Capital Partners, L.P. (a private equity firm). Mr. Lacy also served as Chief Executive Officer (2000-2005) and Vice Chairman (2005-2006) of Sears Holdings Corporation and Sears, Roebuck and Co. (retail). In addition, Mr. Lacy serves as a member of the Board of Directors of The Western Union Company (global money transfer, 2006-present) and Bristol-Myers Squibb (global pharmaceuticals, 2007-present). Mr. Lacy is a Trustee of the National Parks Conservation Association and The Field Museum of Natural History. |
Ned C. Lautenbach (64) |
| Year of Election or Appointment: 2000 Mr. Lautenbach is Chairman of the Independent Trustees (2006-present). Mr. Lautenbach is an Advisory Partner of Clayton, Dubilier & Rice, Inc. (private equity investment firm). Previously, Mr. Lautenbach was with the International Business Machines Corporation (IBM) from 1968 until his retirement in 1998. Mr. Lautenbach serves as a Director of Eaton Corporation (diversified industrial) as well as the Philharmonic Center for the Arts in Naples, Florida. He also is a member of the Board of Trustees of Fairfield University (2005-present), as well as a member of the Council on Foreign Relations. Previously, Mr. Lautenbach served as a Director of Sony Corporation (2006-2007). |
Joseph Mauriello (64) |
| Year of Election or Appointment: 2008 Prior to his retirement in January 2006, Mr. Mauriello served in numerous senior management positions including Deputy Chairman and Chief Operating Officer (2004-2005), and Vice Chairman of Financial Services (2002-2004) of KPMG LLP US (professional services firm, 1965-
2005). Mr. Mauriello currently serves as a member of the Board of Directors of XL Capital Ltd. (global insurance and re-insurance company, 2006-present) and of Arcadia Resources Inc. (health care services and products, 2007-present). He also served as a Director of the Hamilton Funds of the Bank of New York (2006-2007). |
Cornelia M. Small (64) |
| Year of Election or Appointment: 2005 Ms. Small is a member of the Investment Committee, and Chair (2008-present) and a member of the Board of Trustees of Smith College. Ms. Small also serves on the Investment Committee of the Berkshire Taconic Community Foundation (2008-present). Previously, Ms. Small served as Chairperson of the Investment Committee (2002-2008) of Smith College and as Co-Chair (2000-2003) of the Annual Fund for the Fletcher School of Law and Diplomacy. In addition, she served as Chief Investment Officer, Director of Global Equity Investments, and a member of the Board of Directors of Scudder, Stevens & Clark and Scudder Kemper Investments. |
William S. Stavropoulos (69) |
| Year of Election or Appointment: 2001 Mr. Stavropoulos is Chairman Emeritus of the Board of Directors of The Dow Chemical Company, where he previously served in numerous senior management positions, including President (1993-2000; 2002-
2003), CEO (1995-2000; 2002-2004), Chairman of the Executive Committee (2000-2006), and as a member of the Board of Directors (1990-2006). Currently, he is a Director of Teradata Corporation (data warehousing and technology solutions, 2008-present), Chemical Financial Corporation, Maersk Inc. (industrial conglomerate), Tyco International, Inc. (multinational manufacturing and services, 2007-present), and a member of the Advisory Board for Metalmark Capital (private equity investment firm, 2005-present). He is a special advisor to Clayton, Dubilier & Rice, Inc. (private equity investment). In addition, Mr. Stavropoulos is a member of the University of Notre Dame Advisory Council for the College of Science. |
David M. Thomas (59) |
| Year of Election or Appointment: 2008 Previously, Mr. Thomas served as Executive Chairman (2005-2006) and Chairman and Chief Executive Officer (2000-2005) of IMS Health, Inc. (pharmaceutical and healthcare information solutions). In addition, Mr. Thomas serves as a member of the Board of Directors of Fortune Brands, Inc. (consumer products holding company), and Interpublic Group of Companies, Inc. (marketing communication, 2004-present). |
Michael E. Wiley (58) |
| Year of Election or Appointment: 2008 Mr. Wiley also serves as a member of the Board of Trustees of the University of Tulsa (2000-2006; 2007-present). He serves as a Director of Tesoro Corporation (independent oil refiner and marketer, 2005-
present), and a Director of Bill Barrett Corporation (exploration and production company, 2005-present). In addition, he also serves as a Director of Post Oak Bank (privately-held bank, 2004-present). Previously, Mr. Wiley served as a Sr. Energy Advisor of Katzenbach Partners, LLC (consulting firm, 2006-2007), as an Advisory Director of Riverstone Holdings (private investment firm), Chairman, President, and CEO of Baker Hughes, Inc. (oilfield services company, 2000-2004), and as Director of Spinnaker Exploration Company (exploration and production company, 2001-2005). |
Advisory Board Member and Executive Officers**:
Correspondence intended for each executive officer and Mr. Lynch may be sent to Fidelity Investments, 82 Devonshire Street, Boston, Massachusetts 02109.
Name, Age; Principal Occupation |
Peter S. Lynch (64) |
| Year of Election or Appointment: 2003 Member of the Advisory Board of Fidelity's Equity and High Income Funds. Mr. Lynch is Vice Chairman and a Director of FMR, and Vice Chairman (2001-present) and a Director of FMR Co., Inc. Previously, Mr. Lynch served as a Trustee of the Fidelity funds (1990-2003). In addition, he serves as a Trustee of Boston College and as the Chairman of the Inner-City Scholarship Fund. Previously, Mr. Lynch served on the Special Olympics International Board of Directors (1997-2006). |
Kenneth B. Robins (39) |
| Year of Election or Appointment: 2008 President and Treasurer of Fidelity's Equity and High Income Funds. Mr. Robins is an employee of Fidelity Investments (2004-present). Before joining Fidelity Investments, Mr. Robins worked at KPMG LLP, where he was a partner in KPMG's department of professional practice (2002-2004). |
Walter C. Donovan (46) |
| Year of Election or Appointment: 2007 Vice President of Fidelity's Equity Funds. Mr. Donovan also serves as President of FMR and FMR Co., Inc., and Executive Vice President of Fidelity Investments Money Management, Inc. (2007-present). Previously, Mr. Donovan served as Executive Vice President of FMR and FMR Co., Inc. (2005-2007) and Senior Vice President of FMR (2003-2005) and FMR Co., Inc. (2004-2005). |
Eric M. Wetlaufer (46) |
| Year of Election or Appointment: 2006 Vice President of Fidelity's International Equity Funds. Mr. Wetlaufer also serves as Group Chief Investment Officer of FMR. Mr. Wetlaufer is Chairman, Chief Executive Officer, and President of Fidelity Management & Research (Hong Kong) Limited (2008-present); Chairman, Chief Executive Officer, President, and a Director of Fidelity Management & Research (Japan) Inc. (2008-present); Chairman and Chief Executive Officer (2007-present) and President and a Director (2006-present) of Fidelity Management & Research (U.K.) Inc. and President and a Director of Fidelity Research & Analysis Company (2006-present). Before joining Fidelity Investments in 2005, Mr. Wetlaufer was a partner in Oxhead Capital Management (2004-2005) and a Chief Investment Officer of Putnam Investments (1997-2003). |
Scott C. Goebel (40) |
| Year of Election or Appointment: 2008 Secretary and Chief Legal Officer (CLO) of the Fidelity funds. Mr. Goebel also serves as General Counsel, Secretary, and Senior Vice President of FMR (2008-present); Deputy General Counsel of FMR LLC; Chief Legal Secretary of Fidelity Management & Research (Hong Kong) Limited (2008-present) and Assistant Secretary of Fidelity Management & Research (Japan) Inc. (2008-present). Previously, Mr. Goebel served as Assistant Secretary of the Funds (2007-2008) and as Vice President and Secretary of Fidelity Distributors Corporation (FDC) (2005-2007). |
John B. McGinty, Jr. (46) |
| Year of Election or Appointment: 2008 Assistant Secretary of Fidelity's Equity and High Income Funds. Mr. McGinty is an employee of Fidelity Investments (2004-present). Mr. McGinty also serves as Senior Vice President, Secretary, and Chief Legal Officer of FDC (2007-present). Before joining Fidelity Investments, Mr. McGinty practiced law at Ropes & Gray, LLP. |
Holly C. Laurent (54) |
| Year of Election or Appointment: 2008 Anti-Money Laundering (AML) Officer of the Fidelity funds. Ms. Laurent is an employee of Fidelity Investments. Previously, Ms. Laurent was Senior Vice President and Head of Legal for Fidelity Business Services India Pvt. Ltd. (2006-2008), Senior Vice President, Deputy General Counsel and Group Head for FMR LLC (2005-2006). |
Christine Reynolds (50) |
| Year of Election or Appointment: 2008 Chief Financial Officer of the Fidelity funds. Ms. Reynolds became President of Fidelity Pricing and Cash Management Services (FPCMS) in August 2008. She served as Chief Operating Officer of FPCMS from 2007 through July 2008. Previously, Ms. Reynolds served as President, Treasurer, and Anti-Money Laundering officer of the Fidelity funds (2004-
2007). Before joining Fidelity Investments, Ms. Reynolds worked at PricewaterhouseCoopers LLP (PwC) (1980-2002), where she was an audit partner with PwC's investment management practice. |
Kenneth A. Rathgeber (61) |
| Year of Election or Appointment: 2004 Chief Compliance Officer of Fidelity's Equity and High Income Funds. Mr. Rathgeber is Chief Compliance Officer of Fidelity Management & Research (Hong Kong) Limited (2008-present), Fidelity Management & Research (Japan) Inc. (2008-present), FMR (2005-present), FMR Co., Inc. (2005-present), Fidelity Management & Research (U.K.) Inc. (2005-
present), Fidelity Research & Analysis Company (2005-present), Fidelity Investments Money Management, Inc. (2005-present), and Strategic Advisers, Inc. (2005-present). |
Bryan A. Mehrmann (47) |
| Year of Election or Appointment: 2005 Deputy Treasurer of the Fidelity funds. Mr. Mehrmann is an employee of Fidelity Investments. Previously, Mr. Mehrmann served as Vice President of Fidelity Investments Institutional Services Group (FIIS)/Fidelity Investments Institutional Operations Corporation, Inc. (FIIOC) Client Services (1998-2004). |
Adrien E. Deberghes (41) |
| Year of Election or Appointment: 2008 Deputy Treasurer of Fidelity's Equity and High Income Funds. Mr. Deberghes is an employee of Fidelity Investments (2008-present). Previously, Mr. Deberghes served as Senior Vice President of Mutual Fund Administration at State Street Corporation (2007-2008), Senior Director of Mutual Fund Administration at Investors Bank & Trust (2005-2007), and Director of Finance for Dunkin' Brands (2000-2005). |
Robert G. Byrnes (41) |
| Year of Election or Appointment: 2005 Assistant Treasurer of the Fidelity funds. Mr. Byrnes is an employee of Fidelity Investments (2005-present). Previously, Mr. Byrnes served as Vice President of Fidelity Pricing and Cash Management Services (FPCMS) (2003-2005). Before joining Fidelity Investments, Mr. Byrnes worked at Deutsche Asset Management where he served as Vice President of the Investment Operations Group (2000-2003). |
Peter L. Lydecker (54) |
| Year of Election or Appointment: 2004 Assistant Treasurer of the Fidelity funds. Mr. Lydecker is an employee of Fidelity Investments. |
Paul M. Murphy (61) |
| Year of Election or Appointment: 2007 Assistant Treasurer of the Fidelity funds. Mr. Murphy is an employee of Fidelity Investments (2007-present). Previously, Mr. Murphy served as Chief Financial Officer of the Fidelity Funds (2005-2006), Vice President and Associate General Counsel of FMR (2007), and Senior Vice President of Fidelity Pricing and Cash Management Services (FPCMS) (1994-2007). |
Gary W. Ryan (50) |
| Year of Election or Appointment: 2005 Assistant Treasurer of the Fidelity funds. Mr. Ryan is an employee of Fidelity Investments. Previously, Mr. Ryan served as Vice President of Fund Reporting in Fidelity Pricing and Cash Management Services (FPCMS) (1999-2005). |
** FMR Corp. merged with and into FMR LLC on October 1, 2007. Any references to FMR LLC for prior periods are deemed to be references to the prior entity.
Annual Report
Class A designates 95%; Class T designates 100%; Class B designates 100%; and Class C designates 100% of dividend distributed during the fiscal year as amounts which may be taken into account as a dividend for purposes of the maximum rate under section 1(h)(11) of the Internal Revenue Code.
The amounts per share which represent income derived from sources within, and taxes paid to, foreign countries or possessions of the United States are as follows:
| Pay Date | Income | Taxes |
Class A | 12/10/07 | $0.385 | $0.0646 |
Class T | 12/10/07 | $0.330 | $0.0646 |
Class B | 12/10/07 | $0.235 | $0.0646 |
Class C | 12/10/07 | $0.248 | $0.0646 |
The fund will notify shareholders in January 2009 of amounts for use in preparing 2008 income tax returns.
Annual Report
A special meeting of the fund's shareholders was held on April 16, 2008. The results of votes taken among shareholders on the proposals before them are reported below. Each vote reported represents one dollar of net asset value held on the record date for the meeting.
PROPOSAL 1 |
To elect a Board of Trustees.A |
| # of
Votes | % of
Votes |
James C. Curvey |
Affirmative | 44,485,656,811.55 | 94.702 |
Withheld | 2,488,551,854.62 | 5.298 |
TOTAL | 46,974,208,666.17 | 100.000 |
Dennis J. Dirks |
Affirmative | 44,706,671,638.31 | 95.173 |
Withheld | 2,267,537,027.86 | 4.827 |
TOTAL | 46,974,208,666.17 | 100.000 |
Edward C. Johnson 3d |
Affirmative | 44,294,881,638.16 | 94.296 |
Withheld | 2,679,327,028.01 | 5.704 |
TOTAL | 46,974,208,666.17 | 100.000 |
Alan J. Lacy |
Affirmative | 44,685,373,413.16 | 95.127 |
Withheld | 2,288,835,253.01 | 4.873 |
TOTAL | 46,974,208,666.17 | 100.000 |
Ned C. Lautenbach |
Affirmative | 44,634,541,379.41 | 95.019 |
Withheld | 2,339,667,286.76 | 4.981 |
TOTAL | 46,974,208,666.17 | 100.000 |
Joseph Mauriello |
Affirmative | 44,683,962,099.80 | 95.124 |
Withheld | 2,290,246,566.37 | 4.876 |
TOTAL | 46,974,208,666.17 | 100.000 |
Cornelia M. Small |
Affirmative | 44,671,688,375.36 | 95.098 |
Withheld | 2,302,520,290.81 | 4.902 |
TOTAL | 46,974,208,666.17 | 100.000 |
| # of
Votes | % of
Votes |
William S. Stavropoulos |
Affirmative | 44,465,262,087.61 | 94.659 |
Withheld | 2,508,946,578.56 | 5.341 |
TOTAL | 46,974,208,666.17 | 100.000 |
David M. Thomas |
Affirmative | 44,694,340,813.87 | 95.147 |
Withheld | 2,279,867,852.30 | 4.853 |
TOTAL | 46,974,208,666.17 | 100.000 |
Michael E. Wiley |
Affirmative | 44,686,513,174.78 | 95.130 |
Withheld | 2,287,695,491.39 | 4.870 |
TOTAL | 46,974,208,666.17 | 100.000 |
PROPOSAL 5 |
Shareholder proposal concerning "oversight procedures to screen out investments in companies that, in the judgement of the Board, substantially contribute to genocide, patterns of extraordinary and egregious violations of human rights, or crimes against humanity." |
| # of
Votes | % of
Votes |
Affirmative | 1,337,480,153.27 | 21.306 |
Against | 4,280,655,741.12 | 68.193 |
Abstain | 268,134,649.82 | 4.271 |
Broker
Non-Votes | 391,079,068.84 | 6.230 |
TOTAL | 6,277,349,613.05 | 100.000 |
A Denotes trust-wide proposal and voting results.
Semiannual Report
Proxy Voting Results
A special meeting of the fund's shareholders was held on December 13, 2007. The results of votes taken among shareholders on the proposals before them are reported below. Each vote reported represents one dollar of net asset value held on the record date for the meeting.
PROPOSAL 1 |
To amend the Declaration of Trust to reduce the required quorum for shareholder meetings.A |
| # of
Votes | % of
Votes |
Affirmative | 45,014,793,255.82 | 80.372 |
Against | 6,871,112,667.08 | 12.268 |
Abstain | 2,163,456,438.02 | 3.863 |
Broker
Non-Votes | 1,958,633,563.89 | 3.497 |
TOTAL | 56,007,995,924.81 | 100.000 |
PROPOSAL 2 |
To elect the nominees specified below as Trustees.A |
| # of
Votes | % of
Votes |
James C. Curvey |
Affirmative | 53,384,952,361.03 | 95.317 |
Withheld | 2,623,043,563.78 | 4.683 |
TOTAL | 56,007,995,924.81 | 100.000 |
Dennis J. Dirks |
Affirmative | 53,595,104,608.67 | 95.692 |
Withheld | 2,412,891,316.14 | 4.308 |
TOTAL | 56,007,995,924.81 | 100.000 |
Albert R. Gamper, Jr. |
Affirmative | 53,570,235,221.69 | 95.647 |
Withheld | 2,437,760,703.12 | 4.353 |
TOTAL | 56,007,995,924.81 | 100.000 |
George H. Heilmeier |
Affirmative | 53,166,350,588.50 | 94.926 |
Withheld | 2,841,645,336.31 | 5.074 |
TOTAL | 56,007,995,924.81 | 100.000 |
| # of
Votes | % of
Votes |
Edward C. Johnson 3d |
Affirmative | 53,230,508,654.93 | 95.041 |
Withheld | 2,777,487,269.88 | 4.959 |
TOTAL | 56,007,995,924.81 | 100.000 |
James H. Keyes |
Affirmative | 53,549,161,456.52 | 95.610 |
Withheld | 2,458,834,468.29 | 4.390 |
TOTAL | 56,007,995,924.81 | 100.000 |
Marie L. Knowles |
Affirmative | 53,543,925,066.86 | 95.601 |
Withheld | 2,464,070,857.95 | 4.399 |
TOTAL | 56,007,995,924.81 | 100.000 |
Ned C. Lautenbach |
Affirmative | 53,547,116,322.50 | 95.606 |
Withheld | 2,460,879,602.31 | 4.394 |
TOTAL | 56,007,995,924.81 | 100.000 |
Cornelia M. Small |
Affirmative | 53,564,793,514.25 | 95.638 |
Withheld | 2,443,202,410.56 | 4.362 |
TOTAL | 56,007,995,924.81 | 100.000 |
William S. Stavropoulos |
Affirmative | 53,426,544,502.76 | 95.391 |
Withheld | 2,581,451,422.05 | 4.609 |
TOTAL | 56,007,995,924.81 | 100.000 |
Kenneth L. Wolfe |
Affirmative | 53,229,881,790.63 | 95.040 |
Withheld | 2,778,114,134.18 | 4.960 |
TOTAL | 56,007,995,924.81 | 100.000 |
A Denotes trust-wide proposal and voting results.
Annual Report
Board Approval of Investment Advisory Contracts and Management Fees
Fidelity International Discovery Fund
Each year, typically in July, the Board of Trustees, including the Independent Trustees (together, the Board), votes on the renewal of the management contract and sub-advisory agreements (together, the Advisory Contracts) for the fund. The Board, assisted by the advice of fund counsel and Independent Trustees' counsel, requests and considers a broad range of information throughout the year.
The Board meets regularly and, acting directly and through its separate committees, requests and receives information concerning, and considers at each of its meetings factors that are relevant to, its annual consideration of the renewal of the fund's Advisory Contracts, including the services and support provided to the fund and its shareholders. At the time of the renewal, the Board had 12 standing committees, each composed of Independent Trustees with varying backgrounds, to which the Board has assigned specific subject matter responsibilities in order to enhance effective decision-making by the Board. Each committee has a written charter outlining the structure and purposes of the committee. The Board also meets as needed to consider matters specifically related to the Board's annual consideration of the renewal of Advisory Contracts.
At its July 2008 meeting, the Board of Trustees, including the Independent Trustees, unanimously determined to renew the fund's Advisory Contracts. In reaching its determination, the Board considered all factors it believed relevant, including (i) the nature, extent, and quality of the services to be provided to the fund and its shareholders (including the investment performance of the fund); (ii) the competitiveness of the fund's management fee and total expenses; (iii) the total costs of the services to be provided by and the profits to be realized by Fidelity from its relationship with the fund; (iv) the extent to which economies of scale would be realized as the fund grows; and (v) whether fee levels reflect these economies of scale, if any, for the benefit of fund shareholders. The Board also approved agreements with foreign sub-advisers Fidelity Management & Research (Japan) Inc. and Fidelity Management & Research (Hong Kong) Limited, as well as amendments to the fund's agreement with Fidelity Management & Research (U.K.) Inc.
In considering whether to renew the Advisory Contracts for the fund, the Board ultimately reached a determination, with the assistance of fund counsel and Independent Trustees' counsel and through the exercise of its business judgment, that the renewal of the Advisory Contracts and the compensation to be received by Fidelity under the management contract is consistent with Fidelity's fiduciary duty under applicable law. The Board's decision to renew the Advisory Contracts was not based on any single factor noted above, but rather was based on a comprehensive consideration of all the information provided to the Board at its meetings throughout the year. The Board, in reaching its determination to renew the Advisory Contracts, is aware that shareholders in the fund have a broad range of investment choices available to them, including a wide choice among mutual funds offered by competitors to Fidelity, and that the fund's shareholders, with the opportunity to review and weigh the disclosure provided by the fund in its prospectus and other public disclosures, have chosen to invest in this fund, managed by Fidelity.
Annual Report
Board Approval of Investment Advisory Contracts and
Management Fees - continued
Nature, Extent, and Quality of Services Provided. The Board considered staffing within the investment adviser, FMR, and the sub-advisers (together, the Investment Advisers), including the backgrounds of the fund's investment personnel and the fund's investment objective and discipline. The Independent Trustees also had discussions with senior management of Fidelity's investment operations and investment groups. The Board considered the structure of the portfolio manager compensation program and whether this structure provides appropriate incentives.
Resources Dedicated to Investment Management and Support Services. The Board reviewed the size, education, and experience of the Investment Advisers' investment staff, their use of technology, and the Investment Advisers' approach to recruiting, training, and retaining portfolio managers and other research, advisory, and management personnel. The Board noted that Fidelity's analysts have access to a variety of technological tools that enable them to perform both fundamental and quantitative analysis and to specialize in various disciplines. The Board considered Fidelity's extensive global research capabilities that enable the Investment Advisers to aggregate data from various sources in an effort to produce positive investment results. The Board also considered that Fidelity's portfolio managers and analysts have access to daily portfolio attribution that allows for monitoring of a fund's portfolio, as well as an electronic communication system that provides immediate real-time access to research concerning issuers and credit enhancers.
Shareholder and Administrative Services. The Board considered (i) the nature, extent, quality, and cost of advisory, administrative, distribution, and shareholder services performed by the Investment Advisers and their affiliates under the Advisory Contracts and under separate agreements covering transfer agency, pricing and bookkeeping, and securities lending services for the fund; (ii) the nature and extent of the Investment Advisers' supervision of third party service providers, principally custodians and subcustodians; and (iii) the resources devoted to, and the record of compliance with, the fund's compliance policies and procedures. The Board also reviewed the allocation of fund brokerage, including allocations to brokers affiliated with the Investment Advisers, the use of brokerage commissions to pay fund expenses, and the use of "soft" commission dollars to pay for research services. The Board further considered that Fidelity voluntarily pays for market data out of its own resources.
The Board noted that the growth of fund assets across the complex allows Fidelity to reinvest in the development of services designed to enhance the value or convenience of the Fidelity funds as investment vehicles. These services include 24-hour access to account information and market information through phone representatives and over the Internet, and investor education materials and asset allocation tools.
Annual Report
Investment in a Large Fund Family. The Board considered the benefits to shareholders of investing in a Fidelity fund, including the benefits of investing in a fund that is part of a large family of funds offering a variety of investment disciplines and providing for a large variety of mutual fund investor services. For example, fund shareholders are offered the privilege of exchanging shares of the fund for shares of other Fidelity funds, as set forth in the fund's prospectus, without paying a sales charge. The Board noted that Fidelity has taken a number of actions over the previous year that benefited particular funds, including (i) dedicating additional resources to investment research and to restructure the investment research teams; (ii) contractually agreeing to reduce the management fees on Fidelity's Institutional Money Market Funds and launching Class IV and Institutional Class of certain of these funds; (iii) reducing the transfer agent fees for the Fidelity Select Portfolios and Investor Class of the VIP funds; and (iv) launching Class K of 29 equity funds as a lower-fee class available to certain employer-sponsored retirement plans.
Investment Performance. The Board considered whether the fund has operated within its investment objective, as well as its record of compliance with its investment restrictions. It also reviewed the fund's absolute investment performance for each class, as well as the fund's relative investment performance for each class measured against (i) a broad-based securities market index, and (ii) a peer group of mutual funds deemed appropriate by the Board over multiple periods. The following charts considered by the Board show, over the one-, three-, and five-year periods ended December 31, 2007, as available, the cumulative total returns of Fidelity International Discovery (retail class) and Class B of the fund, the cumulative total returns of a broad-based securities market index ("benchmark"), and a range of cumulative total returns of a peer group of mutual funds identified by Morningstar, Inc. as having an investment style similar to that of the fund based on underlying portfolio holdings. The returns of Fidelity International Discovery (retail class) and Class B show the performance of the highest and lowest performing classes, respectively. (The fund did not offer Class K as of December 31, 2007.) The box within each chart shows the 25th percentile return (bottom of box) and the 75th percentile return (top of box) of the peer group. Returns shown above the box are in the first quartile and returns shown below the box are in the fourth quartile. The percentage beaten numbers noted below each chart correspond to the percentile box and represent the percentage of funds in the peer group whose performance was equal to or lower than that of the class indicated.
Annual Report
Board Approval of Investment Advisory Contracts and
Management Fees - continued
Fidelity International Discovery Fund

The Board reviewed the fund's relative investment performance against its peer group and stated that the performance of Fidelity International Discovery (retail class) of the fund was in the first quartile for all the periods shown. The Board also stated that the investment performance of Fidelity International Discovery (retail class) of the fund compared favorably to its benchmark for all the periods shown. The Board considered that the variations in performance among the fund's classes reflect the variations in class expenses, which result in lower performance for higher expense classes.
The Board also considered that the fund's management fee is subject to upward or downward adjustment depending upon whether, and to what extent, the fund's investment performance for the performance period exceeds, or is exceeded by, the record (over the same period) of a Board-approved performance adjustment index. The Board realizes that the performance adjustment provides FMR with a strong economic incentive to seek to achieve superior performance for the fund's shareholders and helps to more closely align the interests of FMR and the fund's shareholders.
The Board considered that FMR has taken steps to refocus and strengthen equity research, equity portfolio management, and compliance.
Based on its review, and giving particular weight to the nature and quality of the resources dedicated by the Investment Advisers to maintain and improve relative performance, the Board concluded that the nature, extent, and quality of the services provided to the fund will benefit the fund's shareholders, particularly in light of the Board's view that the fund's shareholders benefit from investing in a fund that is part of a large family of funds offering a variety of investment disciplines and services.
Annual Report
Competitiveness of Management Fee and Total Fund Expenses. The Board considered the fund's management fee and total expenses compared to "mapped groups" of competitive funds and classes. Fidelity creates "mapped groups" by combining similar Lipper investment objective categories that have comparable management fee characteristics. Combining Lipper investment objective categories aids the Board's management fee and total expense comparisons by broadening the competitive group used for comparison and by reducing the number of universes to which various Fidelity funds are compared. The Board also considered supplemental information about how the fund's management fee and total expenses ranked relative to groups based on Lipper classifications, which take into account a fund's market capitalization and style.
The Board considered two proprietary management fee comparisons for the 12-month periods shown in the chart below. The group of Lipper funds used by the Board for management fee comparisons is referred to below as the "Total Mapped Group." The Total Mapped Group comparison focuses on a fund's standing relative to the total universe of comparable funds available to investors, in terms of gross management fees before expense reimbursements or caps, and without giving effect to the fund's performance adjustment. "TMG %" represents the percentage of funds in the Total Mapped Group that had management fees that were lower than the fund's. For example, a TMG% of 14% means that 86% of the funds in the Total Mapped Group had higher management fees than the fund. The "Asset-Size Peer Group" (ASPG) comparison focuses on a fund's standing relative to non-Fidelity funds similar in size to the fund within the Total Mapped Group. The ASPG represents at least 15% of the funds in the Total Mapped Group with comparable asset size and management fee characteristics, subject to a minimum of 50 funds (or all funds in the Total Mapped Group if fewer than 50). Additional information, such as the ASPG quartile in which the fund's management fee ranked and the impact of the fund's performance adjustment, is also included in the chart and considered by the Board.
Annual Report
Board Approval of Investment Advisory Contracts and
Management Fees - continued
Fidelity International Discovery Fund

The Board noted that the fund's management fee ranked below the median of its Total Mapped Group and below the median of its ASPG for 2007. The Board also noted the effect of the fund's positive performance adjustment on the fund's management fee ranking. The Board noted that the performance adjustment for each year represents calculations for performance periods that differ from the periods shown in the performance charts above.
Based on its review, the Board concluded that the fund's management fee was fair and reasonable in light of the services that the fund receives and the other factors considered.
In its review of each class's total expenses, the Board considered the fund's management fee as well as other fund or class expenses, as applicable, such as transfer agent fees, pricing and bookkeeping fees, fund-paid 12b-1 fees, and custodial, legal, and audit fees. The Board also noted the effects of any waivers and reimbursements on fees and expenses, as well as the impact of the fund's performance adjustment. As part of its review, the Board also considered current and historical total expenses of each class of the fund compared to competitive fund median expenses. Each class of the fund is compared to those funds and classes in the Total Mapped Group (used by the Board for management fee comparisons) that have a similar sales load structure.
The Board noted that the total expenses of each of Class A, Class B, Class C, Institutional Class, and Fidelity International Discovery (retail class) ranked below its competitive median for 2007, and the total expenses of Class T ranked above its competitive median for 2007. The Board considered that the total expenses for Class T were above the median primarily because its 12b-1 fee is higher than the typical front-end load class. The Board noted that the fund offers multiple classes, each of which has a different sales load and 12b-1 fee structure, and that the multiple structures are intended to offer a range of pricing options for the intermediary market. The Board also noted that the total expenses of the classes vary primarily by the level of their 12b-1 fees, although differences in transfer agent fees may also cause expenses to vary from class to class.
Annual Report
In its review of total expenses, the Board also considered Fidelity fee structures and other information on clients that FMR and its affiliates service in other competitive markets, such as other mutual funds advised or subadvised by FMR or its affiliates, pension plan clients, and other institutional clients.
Based on its review, the Board concluded that the total expenses of each class of the fund were reasonable, although in one case above the median of the universe presented for comparison, in light of the services that the fund and its shareholders receive and the other factors considered.
Costs of the Services and Profitability. The Board considered the revenues earned and the expenses incurred by Fidelity in conducting the business of developing, marketing, distributing, managing, administering and servicing the fund and its shareholders. The Board also considered the level of Fidelity's profits in respect of all the Fidelity funds.
On an annual basis, FMR presents to the Board Fidelity's profitability for the fund. Fidelity calculates the profitability for each fund, as well as aggregate profitability for groups of Fidelity funds and all Fidelity funds, using a series of detailed revenue and cost allocation methodologies which originate with the audited books and records of Fidelity. The Audit Committee of the Board reviews any significant changes from the prior year's methodologies.
PricewaterhouseCoopers LLP (PwC), independent registered public accounting firm and auditor to Fidelity and certain Fidelity funds, has been engaged annually by the Board as part of the Board's assessment of the results of Fidelity's profitability analysis. PwC's engagement includes the review and assessment of Fidelity's methodologies used in determining the revenues and expenses attributable to Fidelity's mutual fund business, and completion of agreed-upon procedures surrounding the mathematical accuracy of fund profitability and its conformity to allocation methodologies. After considering PwC's reports issued under the engagement and information provided by Fidelity, the Board believes that while other allocation methods may also be reasonable, Fidelity's profitability methodologies are reasonable in all material respects.
The Board has also reviewed Fidelity's non-fund businesses and any fall-out benefits related to the mutual fund business as well as cases where Fidelity's affiliates may benefit from or be related to the fund's business.
Annual Report
Board Approval of Investment Advisory Contracts and
Management Fees - continued
The Board considered the costs of the services provided by and the profits realized by Fidelity in connection with the operation of the fund and determined that the amount of profit is a fair entrepreneurial profit for the management of the fund.
Economies of Scale. The Board considered whether there have been economies of scale in respect of the management of the Fidelity funds, whether the Fidelity funds (including the fund) have appropriately benefited from any such economies of scale, and whether there is potential for realization of any further economies of scale. The Board considered the extent to which the fund will benefit from economies of scale through increased services to the fund, through waivers or reimbursements, or through fee or expense reductions.
The Board recognized that the fund's management contract incorporates a "group fee" structure, which provides for lower group fee rates as total fund assets under FMR's management increase, and for higher group fee rates as total fund assets under FMR's management decrease. FMR determines the group fee rates based on a tiered asset "breakpoint" schedule. The Board considered that the group fee is designed to deliver the benefits of economies of scale to fund shareholders when total fund assets increase, even if assets of any particular fund are unchanged or have declined, because some portion of Fidelity's costs are attributable to services provided to all Fidelity funds, and all funds benefit if those costs can be allocated among more assets. The Board concluded that, given the group fee structure, fund shareholders will achieve a certain level of economies of scale as assets under FMR's management increase at the fund complex level, regardless of whether Fidelity achieves any such economies of scale.
The Board further concluded that any potential economies of scale are being shared between fund shareholders and Fidelity in an appropriate manner.
Additional Information Requested by the Board. In order to develop fully the factual basis for consideration of the Fidelity funds' Advisory Contracts, the Board requested and received additional information on certain topics, including (i) fund performance trends and actions to be taken by FMR to improve certain funds' overall performance; (ii) portfolio manager changes that have occurred during the past year; (iii) Fidelity's fund profitability methodology, the profitability of certain fund service providers, and profitability trends for certain funds; (iv) Fidelity's compensation structure for portfolio managers and key personnel, including its effects on fund profitability and the extent to which portfolio manager compensation is linked to fund performance; (v) Fidelity's fee structures and rationale for recommending different fees among categories of funds; and (vi) Fidelity's rationale for recommending which funds should have a performance adjustment component as part of their management fees.
Based on its evaluation of all of the conclusions noted above, and after considering all material factors, the Board ultimately concluded that the advisory fee structures are fair and reasonable, and that the fund's Advisory Contracts should be renewed.
Annual Report
Investment Adviser
Fidelity Management & Research Company
Boston, MA
Investment Sub-Advisers
FMR Co., Inc.
Fidelity Management & Research
(U.K.) Inc.
Fidelity Research & Analysis Company
FIL Investment Advisors
Fidelity Investments Japan Limited
FIL Advisors (U.K.) Limited
Fidelity Management & Research
(Hong Kong) Limited
Fidelity Management & Research
(Japan) Inc.
General Distributor
Fidelity Distributors Corporation
Boston, MA
Transfer and Service Agents
Fidelity Investments Institutional Operations Company, Inc.
Boston, MA
Fidelity Service Company, Inc.
Boston, MA
Custodian
The Northern Trust Company
Chicago, IL
AID-UANN-1208
1.806656.103
(Fidelity Investment logo)(registered trademark)
Fidelity Advisor
International Discovery
Fund - Institutional Class
Annual Report
October 31, 2008
Institutional Class is
a class of Fidelity®
International Discovery Fund
(2_fidelity_logos) (Registered_Trademark)
Contents
Chairman's Message | <Click Here> | Ned Johnson's message to shareholders. |
Performance | <Click Here> | How the fund has done over time. |
Management's Discussion | <Click Here> | The manager's review of fund performance, strategy and outlook. |
Shareholder Expense Example | <Click Here> | An example of shareholder expenses. |
Investment Changes | <Click Here> | A summary of major shifts in the fund's investments over the past six months. |
Investments | <Click Here> | A complete list of the fund's investments with their market values. |
Financial Statements | <Click Here> | Statements of assets and liabilities, operations, and changes in net assets, as well as financial highlights. |
Notes | <Click Here> | Notes to financial statements. |
Report of Independent Registered Public Accounting Firm | <Click Here> | |
Trustees and Officers | <Click Here> | |
Distributions | <Click Here> | |
Proxy Voting Results | <Click Here> | |
Board Approval of Investment Advisory Contracts and Management Fees | <Click Here> | |
To view a fund's proxy voting guidelines and proxy voting record for the 12-month period ended June 30, visit http://www.fidelity.com (search for "proxy voting guidelines") or visit the Securities and Exchange Commission's (SEC) web site at http://www.sec.gov. You may also call 1-877-208-0098 to request a free copy of the proxy voting guidelines.
Standard & Poor's, S&P and S&P 500 are registered service marks of The McGraw-Hill Companies, Inc. and have been licensed for use by Fidelity Distributors Corporation.
Other third party marks appearing herein are the property of their respective owners.
All other marks appearing herein are registered or unregistered trademarks or service marks of FMR LLC or an affiliated company.
Annual Report
This report and the financial statements contained herein are submitted for the general information of the shareholders of the fund. This report is not authorized for distribution to prospective investors in the fund unless preceded or accompanied by an effective prospectus.
A fund files its complete schedule of portfolio holdings with the SEC for the first and third quarters of each fiscal year on Form N-Q. Forms N-Q are available on the SEC's web site at http://www.sec.gov. A fund's Forms N-Q may be reviewed and copied at the SEC's Public Reference Room in Washington, DC. Information regarding the operation of the SEC's Public Reference Room may be obtained by calling 1-800-SEC-0330. For a complete list of a fund's portfolio holdings, view the fund's most recent holdings listing, semiannual report, or annual report on Fidelity's web site at http://www.fidelity.com or http://www.advisor.fidelity.com, as applicable.
NOT FDIC INSURED · MAY LOSE VALUE · NO BANK GUARANTEE
Neither the fund nor Fidelity Distributors Corporation is a bank.
Annual Report
(photo_of_Edward_C_Johnson_3d)
Dear Shareholder:
Turmoil has been the watchword for the world's securities markets in 2008, with domestic and international stocks down sharply amid the global credit squeeze. A flight to quality boosted returns for U.S. Treasuries, one of the few asset classes with positive results heading into the latter stages of the year. Financial markets are always unpredictable, but there are a number of time-tested principles that can put the historical odds in your favor.
One of the basic tenets is to invest for the long term. Over time, riding out the markets' inevitable ups and downs has proven much more effective than selling into panic or chasing the hottest trend. Even missing only a few of the markets' best days can significantly diminish investor returns. Patience also affords the benefits of compounding - of earning interest on additional income or reinvested dividends and capital gains. There are tax advantages and cost benefits to consider as well. The more you sell, the more taxes you pay, and the more you trade, the higher the costs. While staying the course doesn't eliminate risk, it can considerably lessen the effect of short-term declines.
You can further manage your investing risk through diversification. And today, more than ever, geographic diversification should be taken into account. Studies indicate that asset allocation is the single most important determinant of a portfolio's long-term success. The right mix of stocks, bonds and cash - aligned to your particular risk tolerance and investment objective - is very important. Age-appropriate rebalancing is also an essential aspect of asset allocation. For younger investors, an emphasis on equities - which historically have been the best-performing asset class over time - is encouraged. As investors near their specific goal, such as retirement or sending a child to college, consideration may be given to replacing volatile assets (e.g. common stocks) with more-stable fixed investments (bonds or savings plans).
A third investment principle - investing regularly - can help lower the average cost of your purchases. Investing a certain amount of money each month or quarter helps ensure you won't pay for all your shares at market highs. This strategy - known as dollar cost averaging - also reduces unconstructive "emotion" from investing, helping shareholders avoid selling weak performers just prior to an upswing, or chasing a hot performer just before a correction.
We invite you to contact us via the Internet, through our Investor Centers or over the phone. It is our privilege to provide you the information you need to make the investments that are right for you.
Sincerely,
/s/Edward C. Johnson 3d
Edward C. Johnson 3d
Annual Report
Average annual total return reflects the change in the value of an investment, assuming reinvestment of the class' dividend income and capital gains (the profits earned upon the sale of securities that have grown in value, if any) and assuming a constant rate of performance each year. The $10,000 table and the fund's returns do not reflect the deduction of taxes that a shareholder would pay on fund distributions or the redemption of fund shares. During periods of reimbursement by Fidelity, a fund's total return will be greater than it would be had the reimbursement not occurred. How a fund did yesterday is no guarantee of how it will do tomorrow.
Average Annual Total Returns
Periods ended October 31, 2008 | Past 1
year | Past 5
years | Past 10 years |
Institutional Class A, B | -47.51% | 5.04% | 6.02% |
A The initial offering of Institutional Class shares took place on January 6, 2005. Returns prior to January 6, 2005 are those of International Discovery, the original class of the fund.
B Prior to October 1, 2004, the fund operated under certain different investment policies. Accordingly, the fund's historical performance may not represent its current investment policies.
$10,000 Over 10 Years
Let's say hypothetically that $10,000 was invested in Fidelity Advisor International Discovery Fund - Institutional Class, a class of the fund, on October 31, 1998. The chart shows how the value of your investment would have changed, and also shows how the MSCI® EAFE® Index (Europe, Australasia, Far East) performed over the same period. The initial offering of Institutional Class took place on January 6, 2005. See above for additional information regarding the performance of Institutional Class.
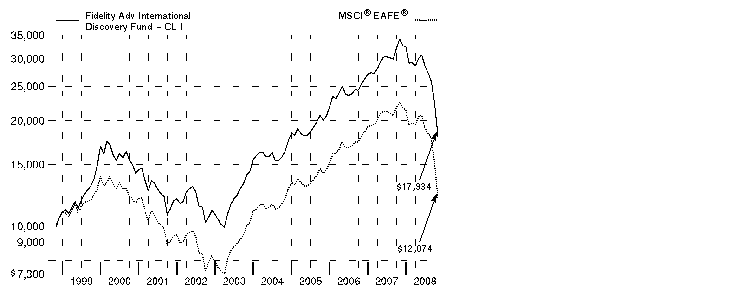
Annual Report
Comments from William Kennedy, Portfolio Manager of Fidelity Advisor International Discovery Fund
In a dramatic reversal of what had been a multiyear global growth story, international stocks fell long and hard during the 12 months ending October 31, 2008, especially so during the latter stages of the period and mostly as a result of fallout from the financial crisis that emanated from the United States. The viral spread of this financial contagion - which began in the U.S. subprime mortgage market, then seized up the credit markets, hobbled major financial institutions and eventually slowed economic growth worldwide - left virtually no corner of the globe untouched. Developed international equity markets - as gauged by the MSCI® Europe, Australasia, Far East (EAFE®) Index, which monitors established markets outside the U.S. and Canada - fell 46.54%, while the Standard & Poor's 500SM Index, a measure of U.S. stocks, dropped 36.10%. Among countries constituting at least 1% of the EAFE index, Switzerland had the "least worst" showing, falling roughly 32%, followed by Japan, where stocks slid by around 37%. Meanwhile, the weakest overall performance came from Belgium, where stocks slipped by nearly 70%.In the United Kingdom, the largest component of the index, equities were down almost 48%. Emerging markets were the weakest performers among the global economies, declining 56.22% as measured by the MSCI Emerging Markets Index.
For the 12 months ending October 31, 2008, the fund's Institutional Class shares returned -47.51%, which was just shy of the MSCI EAFE's return. Stock selection in Japan, where the yen was strong, detracted from performance. Stock selection in the energy, utilities and industrials sectors was also disappointing, as were currency impacts on our emerging markets holdings. The fund lost ground from not owning index component Volkswagen, the German car company, as a competitor bought shares that drove the stock price up. Other detractors included Babcock & Brown, an Australian infrastructure development company hurt by the credit crunch. It was no longer held at period end. An underweighting in BP, a British integrated oil company that held up well as energy prices declined, further undermined returns. On the upside, the fund benefited from a small cash position as well as country and sector weightings, including underweightings in financials and materials and an overweighting in health care. Top contributors included CSL, an Australian company with steady growth from its blood plasma and biotechnology businesses. Not owning Fortis, a Belgian diversified financials company in the index, also helped, as the company ran into funding difficulties.
The views expressed above reflect those of the portfolio manager(s) only through the end of the period as stated on the cover of this report and do not necessarily represent the views of Fidelity or any other person in the Fidelity organization. Any such views are subject to change at any time based upon market or other conditions and Fidelity disclaims any responsibility to update such views. These views may not be relied on as investment advice and, because investment decisions for a Fidelity fund are based on numerous factors, may not be relied on as an indication of trading intent on behalf of any Fidelity fund.
Annual Report
Shareholder Expense Example
As a shareholder of the Fund, you incur two types of costs: (1) transaction costs, including sales charges (loads) on redemptions of shares purchased prior to October 12, 1990, and redemption fees, and (2) ongoing costs, including management fees, distribution and/or service (12b-1) fees and other Fund expenses. This Example is intended to help you understand your ongoing costs (in dollars) of investing in the Fund and to compare these costs with the ongoing costs of investing in other mutual funds.
The actual expense Example is based on an investment of $1,000 invested at the beginning of the period and held for the entire period (May 1, 2008 to October 31, 2008) for the Class A, Class T, Class B, Class C, International Discovery and Institutional Class and for the entire period (May 9, 2008 to October 31, 2008) for Class K. The hypothetical expense Example is based on an investment of $1,000 invested for the one half year period (May 1, 2008 to October 31, 2008).
Actual Expenses
The first line of the accompanying table for each class of the Fund provides information about actual account values and actual expenses. You may use the information in this line, together with the amount you invested, to estimate the expenses that you paid over the period. Simply divide your account value by $1,000.00 (for example, an $8,600 account value divided by $1,000.00 = 8.6), then multiply the result by the number in the first line for a class of the Fund under the heading entitled "Expenses Paid During Period" to estimate the expenses you paid on your account during this period. A small balance maintenance fee of $12.00 that is charged once a year may apply for certain accounts with a value of less than $2,000. This fee is not included in the table below. If it was, the estimate of expenses you paid during the period would be higher, and your ending account value lower, by this amount. In addition, the Fund, as a shareholder in the underlying Fidelity Central Funds, will indirectly bear its pro rata share of the fees and expenses incurred by the underlying Fidelity Central Funds. These fees and expenses are not included in the Fund's annualized expense ratio used to calculate the expense estimate in the table below.
Hypothetical Example for Comparison Purposes
The second line of the accompanying table for each class of the Fund provides information about hypothetical account values and hypothetical expenses based on a Class' actual expense ratio and an assumed rate of return of 5% per year before expenses, which is not the Class' actual return. The hypothetical account values and expenses may not be used to estimate the actual ending account balance or expenses you paid for the period. You may use this information to compare the ongoing costs of investing in the Fund and other funds. To do so, compare this 5% hypothetical example with the 5% hypothetical examples that appear in the shareholder reports of the other funds. A small balance maintenance fee of $12.00 that is charged once a year may apply for certain accounts with a value of less than $2,000. This fee is not included in the table below. If it was, the estimate of expenses you paid during the period would be higher, and your ending account value lower, by this amount. In addition, the Fund, as a shareholder in the underlying Fidelity Central Funds, will indirectly bear its pro rata share of the fees and expenses incurred by the underlying Fidelity Central Funds. These fees and expenses are not included in the Fund's annualized expense ratio used to calculate the expense estimate in the table below.
Annual Report
Please note that the expenses shown in the table are meant to highlight your ongoing costs only and do not reflect any transaction costs. Therefore, the second line of the table is useful in comparing ongoing costs only, and will not help you determine the relative total costs of owning different funds. In addition, if these transactional costs were included, your costs would have been higher.
| Annualized Expense Ratio | Beginning
Account Value
May 1, 2008 | Ending
Account Value
October 31, 2008 | Expenses Paid
During Period |
Class A | 1.33% | | | |
Actual | | $ 1,000.00 | $ 594.40 | $ 5.33 B |
Hypothetical A | | $ 1,000.00 | $ 1,018.45 | $ 6.75 C |
Class T | 1.68% | | | |
Actual | | $ 1,000.00 | $ 593.30 | $ 6.73 B |
Hypothetical A | | $ 1,000.00 | $ 1,016.69 | $ 8.52 C |
Class B | 2.19% | | | |
Actual | | $ 1,000.00 | $ 591.80 | $ 8.76 B |
Hypothetical A | | $ 1,000.00 | $ 1,014.13 | $ 11.09 C |
Class C | 2.18% | | | |
Actual | | $ 1,000.00 | $ 591.90 | $ 8.72 B |
Hypothetical A | | $ 1,000.00 | $ 1,014.18 | $ 11.04 C |
International Discovery | 1.08% | | | |
Actual | | $ 1,000.00 | $ 594.90 | $ 4.33 B |
Hypothetical A | | $ 1,000.00 | $ 1,019.71 | $ 5.48 C |
Class K | .93% | | | |
Actual | | $ 1,000.00 | $ 592.80 | $ 3.56 B |
Hypothetical A | | $ 1,000.00 | $ 1,020.46 | $ 4.72 C |
Institutional Class | 1.06% | | | |
Actual | | $ 1,000.00 | $ 595.20 | $ 4.25 B |
Hypothetical A | | $ 1,000.00 | $ 1,019.81 | $ 5.38 C |
A 5% return per year before expenses
B Actual expenses are equal to each Class' annualized expense ratio (shown in the table below); multiplied by the average account value over the period, multiplied by 184/366 (to reflect the one-half year period) for Class A, Class T, Class B, Class C, International Discovery and Institutional Class and multiplied by 176/366 (to reflect the period May 9, 2008 to October 31, 2008) for Class K.
C Hypothetical expenses are equal to each Class' annualized expense ratio (shown in the table below); multiplied by the average account value over the period, multiplied by 184/366 (to reflect the one-half year period).
Annual Report
Investment Changes (Unaudited)
Geographic Diversification (% of fund's net assets) |
As of October 31, 2008 |
| United Kingdom 22.5% |
| Japan 16.0% |
| Switzerland 12.5% |
| Germany 12.1% |
| United States of America 6.9% |
| France 5.7% |
| Australia 5.0% |
| Spain 3.9% |
| Italy 2.0% |
| Other 13.4% |

Percentages are adjusted for the effect of futures contracts, if applicable. |
|
As of April 30, 2008 |
| United Kingdom 17.5% |
| Japan 15.4% |
| Germany 12.6% |
| Switzerland 8.0% |
| France 6.7% |
| Australia 5.4% |
| United States of America 4.2% |
| Spain 3.8% |
| Canada 3.0% |
| Other 23.4% |

Percentages are adjusted for the effect of futures contracts, if applicable. |
Asset Allocation |
| % of fund's
net assets | % of fund's net assets
6 months ago |
Stocks and Equity Futures | 94.3 | 96.3 |
Short-Term Investments and Net Other Assets | 5.7 | 3.7 |
Top Ten Stocks as of October 31, 2008 |
| % of fund's
net assets | % of fund's net assets
6 months ago |
Nestle SA (Reg.) (Switzerland, Food Products) | 3.0 | 1.8 |
Royal Dutch Shell PLC Class B (United Kingdom, Oil, Gas & Consumable Fuels) | 2.7 | 2.0 |
Roche Holding AG (participation certificate) (Switzerland, Pharmaceuticals) | 2.2 | 0.9 |
E.ON AG (Germany, Electric Utilities) | 2.2 | 2.0 |
CSL Ltd. (Australia, Biotechnology) | 2.1 | 1.7 |
Vodafone Group PLC (United Kingdom, Wireless Telecommunication Services) | 2.0 | 1.6 |
Telefonica SA (Spain, Diversified Telecommunication Services) | 1.9 | 1.6 |
HSBC Holdings PLC (United Kingdom) (Reg.) (United Kingdom, Commercial Banks) | 1.9 | 0.7 |
Toyota Motor Corp. (Japan, Automobiles) | 1.5 | 1.0 |
BHP Billiton PLC (United Kingdom, Metals & Mining) | 1.5 | 1.2 |
| 21.0 | |
Market Sectors as of October 31, 2008 |
| % of fund's
net assets | % of fund's net assets
6 months ago |
Financials | 19.8 | 20.2 |
Health Care | 15.8 | 9.2 |
Consumer Staples | 10.8 | 8.6 |
Telecommunication Services | 7.7 | 6.9 |
Energy | 7.5 | 9.4 |
Information Technology | 7.3 | 9.1 |
Consumer Discretionary | 6.7 | 7.2 |
Industrials | 5.9 | 9.9 |
Utilities | 5.5 | 6.0 |
Materials | 5.1 | 8.4 |
Annual Report
Investments October 31, 2008
Showing Percentage of Net Assets
Common Stocks - 90.7% |
| Shares | | Value (000s) |
Australia - 5.0% |
ABB Grain Ltd. | 1,694,386 | | $ 9,253 |
Commonwealth Bank of Australia | 1,505,851 | | 41,142 |
Computershare Ltd. | 7,275,075 | | 41,108 |
CSL Ltd. | 6,733,245 | | 163,665 |
National Australia Bank Ltd. | 2,188,189 | | 35,487 |
QBE Insurance Group Ltd. | 2,204,978 | | 37,599 |
Westpac Banking Corp. | 240,907 | | 3,304 |
Woolworths Ltd. | 3,270,417 | | 60,934 |
TOTAL AUSTRALIA | | 392,492 |
Belgium - 0.1% |
Hansen Transmission International NV | 6,191,000 | | 10,384 |
Brazil - 0.4% |
BM&F BOVESPA SA | 3,185,693 | | 8,464 |
Vivo Participacoes SA sponsored ADR | 2,046,100 | | 22,384 |
TOTAL BRAZIL | | 30,848 |
Canada - 1.6% |
Canadian Natural Resources Ltd. | 585,000 | | 29,507 |
Niko Resources Ltd. | 498,400 | | 21,824 |
Open Text Corp. (a)(d) | 1,858,400 | | 47,100 |
Petrobank Energy & Resources Ltd. (a) | 813,500 | | 15,517 |
Talisman Energy, Inc. | 1,185,900 | | 11,713 |
Timminco Ltd. (a) | 484,400 | | 2,732 |
TOTAL CANADA | | 128,393 |
Cayman Islands - 0.2% |
China Dongxiang Group Co. Ltd. | 49,139,000 | | 14,456 |
China - 0.3% |
ZTE Corp. (H Shares) | 9,367,280 | | 21,181 |
Cyprus - 0.0% |
Aisi Realty Public Ltd. (a)(e) | 10,023,000 | | 1,469 |
Czech Republic - 0.4% |
Ceske Energeticke Zavody AS | 726,800 | | 31,451 |
Denmark - 1.1% |
Novo Nordisk AS Series B | 1,562,200 | | 83,738 |
Finland - 0.9% |
Nokia Corp. sponsored ADR (d) | 4,627,100 | | 70,239 |
France - 5.7% |
Alstom SA | 1,018,312 | | 50,471 |
AXA SA | 1,784,766 | | 34,096 |
Common Stocks - continued |
| Shares | | Value (000s) |
France - continued |
BNP Paribas SA | 1,261,039 | | $ 91,049 |
Cap Gemini SA | 684,300 | | 22,048 |
CNP Assurances | 218,000 | | 17,566 |
Eutelsat Communications | 2,321,754 | | 49,832 |
GDF Suez | 1,614,778 | | 72,180 |
L'Air Liquide SA | 497,774 | | 42,955 |
LVMH Moet Hennessy - Louis Vuitton | 272,400 | | 18,127 |
Orpea (a)(d) | 560,828 | | 18,246 |
Sechilienne-Sidec | 182,432 | | 7,005 |
Societe Generale Series A | 441,320 | | 24,054 |
TOTAL FRANCE | | 447,629 |
Germany - 11.0% |
Allianz AG (Reg.) | 748,030 | | 55,980 |
Bayer AG | 551,600 | | 30,707 |
Bayer AG sponsored ADR | 237,840 | | 13,131 |
Beiersdorf AG | 90,350 | | 4,790 |
Daimler AG (Reg.) | 340,400 | | 11,771 |
Deutsche Bank AG | 507,100 | | 19,256 |
Deutsche Boerse AG | 267,325 | | 21,375 |
Deutsche Telekom AG (Reg.) | 4,103,000 | | 61,284 |
E.ON AG | 4,453,900 | | 170,392 |
Fresenius Medical Care AG | 808,400 | | 36,766 |
GEA Group AG | 1,773,100 | | 25,912 |
Gerresheimer AG | 1,207,200 | | 42,322 |
Linde AG | 550,793 | | 46,257 |
Muenchener Rueckversicherungs-Gesellschaft AG (Reg.) | 786,000 | | 104,322 |
Q-Cells AG (a)(d) | 365,515 | | 14,379 |
RWE AG | 1,232,900 | | 103,032 |
Siemens AG (Reg.) | 645,600 | | 38,688 |
SolarWorld AG (d) | 804,033 | | 20,264 |
Symrise AG | 1,793,000 | | 22,271 |
Wincor Nixdorf AG | 256,500 | | 11,222 |
TOTAL GERMANY | | 854,121 |
Greece - 0.3% |
Public Power Corp. of Greece | 1,609,345 | | 19,900 |
Hong Kong - 1.1% |
Cheung Kong Holdings Ltd. | 3,875,000 | | 37,206 |
China Unicom (Hong Kong) Ltd. | 13,364,000 | | 19,080 |
Hang Seng Bank Ltd. | 2,361,100 | | 29,460 |
TOTAL HONG KONG | | 85,746 |
Common Stocks - continued |
| Shares | | Value (000s) |
India - 0.8% |
Infosys Technologies Ltd. | 718,452 | | $ 20,942 |
Reliance Industries Ltd. | 409,023 | | 11,627 |
Satyam Computer Services Ltd. | 3,263,566 | | 20,633 |
Titan Industries Ltd. | 390,000 | | 8,175 |
TOTAL INDIA | | 61,377 |
Indonesia - 0.2% |
PT Bumi Resources Tbk | 47,032,000 | | 6,158 |
PT Indosat Tbk | 24,300,500 | | 11,764 |
TOTAL INDONESIA | | 17,922 |
Ireland - 0.3% |
Paddy Power PLC (Ireland) | 1,445,597 | | 24,647 |
Israel - 0.9% |
Nice Systems Ltd. sponsored ADR (a) | 918,700 | | 20,542 |
Teva Pharmaceutical Industries Ltd. sponsored ADR | 1,085,700 | | 46,555 |
TOTAL ISRAEL | | 67,097 |
Italy - 1.7% |
ENI SpA | 3,210,300 | | 76,624 |
Fiat SpA | 3,091,100 | | 24,567 |
Finmeccanica SpA | 788,864 | | 9,651 |
Finmeccanica SpA rights 11/7/08 (a) | 1,232,600 | | 524 |
Prysmian SpA | 1,016,400 | | 12,330 |
UniCredit SpA | 5,114,800 | | 12,515 |
TOTAL ITALY | | 136,211 |
Japan - 13.8% |
Aeon Mall Co. Ltd. | 1,073,500 | | 26,499 |
Asics Corp. | 3,914,000 | | 24,523 |
Canon Marketing Japan, Inc. | 2,296,500 | | 38,417 |
Canon, Inc. | 1,697,450 | | 59,394 |
Daiwa Securities Group, Inc. | 5,423,000 | | 30,658 |
East Japan Railway Co. | 10,753 | | 76,514 |
Konica Minolta Holdings, Inc. | 2,130,500 | | 13,991 |
Matsushita Electric Industrial Co. Ltd. | 4,011,000 | | 64,589 |
Mitsubishi Corp. | 3,196,500 | | 53,577 |
Mitsubishi UFJ Financial Group, Inc. | 16,855,700 | | 105,919 |
Mitsui & Co. Ltd. | 3,040,000 | | 29,455 |
Nintendo Co. Ltd. | 91,250 | | 28,470 |
Nippon Building Fund, Inc. | 2,590 | | 24,886 |
Nippon Telegraph & Telephone Corp. | 12,237 | | 49,933 |
Common Stocks - continued |
| Shares | | Value (000s) |
Japan - continued |
Nomura Holdings, Inc. | 9,963,700 | | $ 94,395 |
Promise Co. Ltd. | 1,379,000 | | 24,751 |
Rakuten, Inc. (d) | 46,965 | | 23,281 |
Ricoh Co. Ltd. | 3,390,000 | | 36,481 |
Seven & I Holdings Co. Ltd. | 1,143,400 | | 32,103 |
Sony Corp. sponsored ADR | 465,300 | | 10,814 |
Sony Financial Holdings, Inc. | 6,285 | | 20,440 |
Sumitomo Mitsui Financial Group, Inc. | 16,438 | | 65,894 |
Tokyo Electron Ltd. | 691,700 | | 23,063 |
Toyota Motor Corp. | 2,939,300 | | 114,777 |
TOTAL JAPAN | | 1,072,824 |
Korea (South) - 0.9% |
LG Household & Health Care Ltd. | 207,070 | | 29,672 |
NHN Corp. (a) | 346,842 | | 37,026 |
TOTAL KOREA (SOUTH) | | 66,698 |
Luxembourg - 0.6% |
Reinet Investments SCA (a) | 29,552 | | 308 |
Reinet Investments SCA (a) | 186,332 | | 3,618 |
SES SA (A Shares) FDR unit | 2,399,068 | | 41,107 |
TOTAL LUXEMBOURG | | 45,033 |
Malaysia - 0.1% |
KNM Group Bhd | 32,198,300 | | 5,460 |
Mexico - 0.5% |
America Movil SAB de CV Series L sponsored ADR | 1,262,200 | | 39,052 |
Netherlands - 1.5% |
AMG Advanced Metallurgical Group NV (a)(d) | 585,100 | | 9,471 |
ASML Holding NV (Netherlands) | 485,800 | | 8,505 |
Gemalto NV (a) | 331,217 | | 9,280 |
Koninklijke KPN NV | 6,660,700 | | 93,804 |
TOTAL NETHERLANDS | | 121,060 |
Norway - 0.2% |
Pronova BioPharma ASA | 4,726,590 | | 12,279 |
Papua New Guinea - 0.3% |
Oil Search Ltd. | 6,566,347 | | 19,883 |
Russia - 0.4% |
OAO Gazprom sponsored ADR | 1,657,700 | | 33,900 |
Singapore - 0.1% |
Singapore Exchange Ltd. | 2,172,000 | | 7,775 |
Common Stocks - continued |
| Shares | | Value (000s) |
Spain - 3.9% |
Banco Santander SA | 3,311,500 | | $ 35,814 |
Grifols SA | 3,624,108 | | 72,123 |
Red Electrica Corporacion SA | 628,000 | | 27,526 |
Repsol YPF SA | 1,089,200 | | 20,712 |
Telefonica SA | 8,021,700 | | 148,521 |
TOTAL SPAIN | | 304,696 |
Sweden - 0.1% |
Modern Times Group MTG AB (B Shares) | 540,150 | | 11,588 |
Switzerland - 12.5% |
Actelion Ltd. (Reg.) (a) | 1,419,010 | | 74,947 |
BB BIOTECH AG | 354,261 | | 22,463 |
Credit Suisse Group (Reg.) | 1,149,050 | | 42,958 |
EFG International | 1,978,630 | | 42,586 |
Julius Baer Holding AG | 488,128 | | 19,087 |
Nestle SA (Reg.) | 6,009,533 | | 233,639 |
Novartis AG: | | | |
(Reg.) | 1,609,626 | | 81,684 |
sponsored ADR | 994,500 | | 50,710 |
Roche Holding AG (participation certificate) | 1,115,576 | | 170,565 |
SGS Societe Generale de Surveillance Holding SA (Reg.) | 25,313 | | 24,916 |
Sonova Holding AG | 574,683 | | 23,873 |
Syngenta AG (Switzerland) | 426,660 | | 79,740 |
Tecan Group AG | 212,300 | | 9,529 |
The Swatch Group AG (Bearer) | 75,432 | | 11,768 |
UBS AG (For. Reg.) | 516,022 | | 8,754 |
Zurich Financial Services AG (Reg.) | 389,534 | | 79,011 |
TOTAL SWITZERLAND | | 976,230 |
Thailand - 0.1% |
Total Access Communication PCL unit | 14,109,900 | | 10,085 |
United Kingdom - 22.5% |
AstraZeneca PLC (United Kingdom) | 1,559,200 | | 66,068 |
Autonomy Corp. PLC (a) | 1,365,900 | | 21,655 |
BAE Systems PLC | 8,539,409 | | 47,994 |
Barclays PLC | 3,933,200 | | 11,273 |
BG Group PLC | 2,944,100 | | 43,285 |
BG Group PLC sponsored ADR | 207,400 | | 15,534 |
BHP Billiton PLC | 6,691,800 | | 113,616 |
BP PLC | 6,979,400 | | 56,885 |
British American Tobacco PLC: | | | |
(United Kingdom) | 3,175,400 | | 87,088 |
Common Stocks - continued |
| Shares | | Value (000s) |
United Kingdom - continued |
British American Tobacco PLC: - continued | | | |
sponsored ADR | 404,500 | | $ 21,989 |
Capita Group PLC | 4,290,793 | | 44,331 |
Compass Group PLC | 4,055,000 | | 18,854 |
Diageo PLC | 1,514,500 | | 23,109 |
GlaxoSmithKline PLC sponsored ADR | 1,381,600 | | 53,468 |
HSBC Holdings PLC: | | | |
(Hong Kong) (Reg.) | 3,704,844 | | 44,100 |
(United Kingdom) (Reg.) | 12,259,500 | | 145,186 |
Imperial Tobacco Group PLC | 1,644,800 | | 44,078 |
Informa PLC | 7,983,600 | | 27,045 |
Man Group PLC | 10,947,800 | | 63,199 |
Misys PLC | 7,892,600 | | 14,131 |
Prudential PLC | 6,511,200 | | 32,704 |
Reckitt Benckiser Group PLC | 2,636,700 | | 111,518 |
Rio Tinto PLC (Reg.) | 1,712,500 | | 79,985 |
Royal Bank of Scotland Group PLC | 10,165,495 | | 11,196 |
Royal Dutch Shell PLC Class B | 7,883,059 | | 213,697 |
Shire PLC | 1,814,400 | | 23,859 |
SSL International PLC | 6,429,705 | | 43,420 |
Standard Chartered PLC (United Kingdom) | 990,000 | | 16,360 |
Unilever PLC | 3,552,700 | | 79,805 |
Vodafone Group PLC | 80,550,435 | | 154,937 |
William Morrison Supermarkets PLC | 6,595,100 | | 28,078 |
TOTAL UNITED KINGDOM | | 1,758,447 |
United States of America - 1.2% |
Macquarie Infrastructure Co. LLC | 131,000 | | 1,330 |
Philip Morris International, Inc. | 1,529,600 | | 66,492 |
Visa, Inc. | 440,500 | | 24,382 |
TOTAL UNITED STATES OF AMERICA | | 92,204 |
TOTAL COMMON STOCKS (Cost $9,659,419) | 7,076,515 |
Nonconvertible Preferred Stocks - 1.4% |
| | | |
Germany - 1.1% |
Fresenius AG (non-vtg.) | 1,371,100 | | 88,425 |
Nonconvertible Preferred Stocks - continued |
| Shares | | Value (000s) |
Italy - 0.3% |
Intesa Sanpaolo SpA | 6,761,102 | | $ 20,068 |
TOTAL NONCONVERTIBLE PREFERRED STOCKS (Cost $135,122) | 108,493 |
Government Obligations - 0.3% |
| Principal Amount (000s) | | |
United States of America - 0.3% |
U.S. Treasury Bills, yield at date of purchase 0.33% to 1.72% 12/4/08 to 1/29/09 (f)
(Cost $20,322) | | $ 20,350 | | 20,341 |
Money Market Funds - 8.5% |
| Shares | | |
Fidelity Cash Central Fund, 1.81% (b) | 645,326,349 | | 645,326 |
Fidelity Securities Lending Cash Central Fund, 2.67% (b)(c) | 20,061,695 | | 20,062 |
TOTAL MONEY MARKET FUNDS (Cost $665,388) | 665,388 |
TOTAL INVESTMENT PORTFOLIO - 100.9% (Cost $10,480,251) | | 7,870,737 |
NET OTHER ASSETS - (0.9)% | | (73,080) |
NET ASSETS - 100% | $ 7,797,657 |
Futures Contracts |
| Expiration Date | | Underlying Face Amount at Value
(000s) | | Unrealized Appreciation/
(Depreciation) (000s) |
Purchased |
Equity Index Contracts |
1,759 CME Nikkei 225 Index Contracts (Japan) | Dec. 2008 | | $ 78,583 | | $ (28,790) |
1,070 TOPIX 150 Index Contracts (Japan) | Dec. 2008 | | 92,755 | | (36,491) |
TOTAL EQUITY INDEX CONTRACTS | | $ 171,338 | | $ (65,281) |
|
The face value of futures purchased as a percentage of net assets - 2.2% |
Legend |
(a) Non-income producing |
(b) Affiliated fund that is available only to investment companies and other accounts managed by Fidelity Investments. The rate quoted is the annualized seven-day yield of the fund at period end. A complete unaudited listing of the fund's holdings as of its most recent quarter end is available upon request. |
(c) Investment made with cash collateral received from securities on loan. |
(d) Security or a portion of the security is on loan at period end. |
(e) Affiliated company |
(f) Security or a portion of the security was pledged to cover margin requirements for futures contracts. At the period end, the value of securities pledged amounted to $20,341,000. |
Affiliated Central Funds |
Information regarding fiscal year to date income earned by the Fund from investments in Fidelity Central Funds is as follows: |
Fund | Income earned
(Amounts in thousands) |
Fidelity Cash Central Fund | $ 24,831 |
Fidelity Securities Lending Cash Central Fund | 11,130 |
Total | $ 35,961 |
Other Affiliated Issuers |
An affiliated company is a company in which the fund has ownership of at least 5% of the voting securities. Fiscal year to date transactions with companies which are or were affiliates are as follows: |
Affiliates
(Amounts in thousands) | Value, beginning of period | Purchases | Sales Proceeds | Dividend Income | Value,
end of
period |
Aisi Realty Public Ltd. | $ 8,752 | $ - | $ - | $ - | $ 1,469 |
Renovo Group PLC | 42,523 | - | 6,236 | - | - |
Total | $ 51,275 | $ - | $ 6,236 | $ - | $ 1,469 |
Income Tax Information
At October 31, 2008, the fund had a capital loss carryforward of approximately $637,482,000 all of which will expire on October 31, 2016. |
See accompanying notes which are an integral part of the financial statements.
Annual Report
Statement of Assets and Liabilities
Amounts in thousands (except per-share amounts) | October 31, 2008 |
| | |
Assets | | |
Investment in securities, at value (including securities loaned of $19,297) - See accompanying schedule: Unaffiliated issuers (cost $9,808,248) | $ 7,203,880 | |
Fidelity Central Funds (cost $665,388) | 665,388 | |
Other affiliated issuers (cost $6,615) | 1,469 | |
Total Investments (cost $10,480,251) | | $ 7,870,737 |
Foreign currency held at value (cost $5,841) | | 5,690 |
Receivable for investments sold | | 66,423 |
Receivable for fund shares sold | | 14,159 |
Dividends receivable | | 25,197 |
Distributions receivable from Fidelity Central Funds | | 856 |
Other receivables | | 1,128 |
Total assets | | 7,984,190 |
| | |
Liabilities | | |
Payable for investments purchased | $ 141,169 | |
Payable for fund shares redeemed | 9,351 | |
Accrued management fee | 5,296 | |
Distribution fees payable | 155 | |
Payable for daily variation on futures contracts | 7,529 | |
Other affiliated payables | 2,276 | |
Other payables and accrued expenses | 695 | |
Collateral on securities loaned, at value | 20,062 | |
Total liabilities | | 186,533 |
| | |
Net Assets | | $ 7,797,657 |
Net Assets consist of: | | |
Paid in capital | | $ 10,988,479 |
Undistributed net investment income | | 120,184 |
Accumulated undistributed net realized gain (loss) on investments and foreign currency transactions | | (636,064) |
Net unrealized appreciation (depreciation) on investments and assets and liabilities in foreign currencies | | (2,674,942) |
Net Assets | | $ 7,797,657 |
See accompanying notes which are an integral part of the financial statements.
Annual Report
Statement of Assets and Liabilities - continued
Amounts in thousands (except per-share amounts) | October 31, 2008 |
| | |
Calculation of Maximum Offering Price
Class A:
Net Asset Value and redemption price per share ($379,564 ÷ 16,031.5 shares) | | $ 23.68 |
| | |
Maximum offering price per share (100/94.25 of $23.68) | | $ 25.12 |
Class T:
Net Asset Value and redemption price per share ($63,690 ÷ 2,711.8 shares) | | $ 23.49 |
| | |
Maximum offering price per share (100/96.50 of $23.49) | | $ 24.34 |
Class B:
Net Asset Value and offering price per share ($14,961 ÷ 643.5 shares) A | | $ 23.25 |
| | |
Class C:
Net Asset Value and offering price per share ($36,410 ÷ 1,562.3 shares) A | | $ 23.31 |
| | |
| | |
International Discovery:
Net Asset Value, offering price and redemption price per share ($6,998,759 ÷ 293,060.0 shares) | | $ 23.88 |
| | |
Class K:
Net Asset Value, offering price and redemption price per share ($145,192 ÷ 6,074.3 shares) | | $ 23.90 |
| | |
Institutional Class:
Net Asset Value, offering price and redemption price per share ($159,081 ÷ 6,654.3 shares) | | $ 23.91 |
A Redemption price per share is equal to net asset value less any applicable contingent deferred sales charge.
See accompanying notes which are an integral part of the financial statements.
Annual Report
Financial Statements - continued
Statement of Operations
Amounts in thousands | Year ended October 31, 2008 |
| | |
Investment Income | | |
Dividends | | $ 318,308 |
Interest | | 161 |
Income from Fidelity Central Funds | | 35,961 |
| | 354,430 |
Less foreign taxes withheld | | (27,021) |
Total income | | 327,409 |
| | |
Expenses | | |
Management fee
Basic fee | $ 90,977 | |
Performance adjustment | 13,226 | |
Transfer agent fees | 28,436 | |
Distribution fees | 2,431 | |
Accounting and security lending fees | 1,917 | |
Custodian fees and expenses | 2,341 | |
Independent trustees' compensation | 56 | |
Registration fees | 466 | |
Audit | 115 | |
Legal | 65 | |
Miscellaneous | 1,638 | |
Total expenses before reductions | 141,668 | |
Expense reductions | (5,009) | 136,659 |
Net investment income (loss) | | 190,750 |
Realized and Unrealized Gain (Loss) Net realized gain (loss) on: | | |
Investment securities: | | |
Unaffiliated issuers (net of foreign taxes of $366) | (569,251) | |
Other affiliated issuers | (20,894) | |
Foreign currency transactions | (36,433) | |
Futures contracts | (37,990) | |
Total net realized gain (loss) | | (664,568) |
Change in net unrealized appreciation (depreciation) on: Investment securities (net of decrease in deferred foreign taxes of $4,165) | (6,819,805) | |
Assets and liabilities in foreign currencies | (192) | |
Futures contracts | (68,439) | |
Total change in net unrealized appreciation (depreciation) | | (6,888,436) |
Net gain (loss) | | (7,553,004) |
Net increase (decrease) in net assets resulting from operations | | $ (7,362,254) |
See accompanying notes which are an integral part of the financial statements.
Annual Report
Statement of Changes in Net Assets
Amounts in thousands | Year ended
October 31,
2008 | Year ended
October 31,
2007 |
Increase (Decrease) in Net Assets | | |
Operations | | |
Net investment income (loss) | $ 190,750 | $ 144,458 |
Net realized gain (loss) | (664,568) | 608,100 |
Change in net unrealized appreciation (depreciation) | (6,888,436) | 2,677,967 |
Net increase (decrease) in net assets resulting
from operations | (7,362,254) | 3,430,525 |
Distributions to shareholders from net investment income | (129,574) | (85,862) |
Distributions to shareholders from net realized gain | (528,706) | (224,325) |
Total distributions | (658,280) | (310,187) |
Share transactions - net increase (decrease) | 1,069,130 | 3,385,409 |
Redemption fees | 709 | 502 |
Total increase (decrease) in net assets | (6,950,695) | 6,506,249 |
| | |
Net Assets | | |
Beginning of period | 14,748,352 | 8,242,103 |
End of period (including undistributed net investment income of $120,184 and undistributed net investment income of $137,292, respectively) | $ 7,797,657 | $ 14,748,352 |
See accompanying notes which are an integral part of the financial statements.
Annual Report
Financial Highlights - Class A
Years ended October 31, | 2008 | 2007 | 2006 | 2005 H |
Selected Per-Share Data | | | |
Net asset value, beginning of period | $ 47.34 | $ 36.47 | $ 30.57 | $ 27.41 |
Income from Investment
Operations | | | | |
Net investment income (loss) E | .46 | .44 | .42 | .28 |
Net realized and unrealized gain (loss) | (22.08) | 11.76 | 7.19 | 2.88 |
Total from investment operations | (21.62) | 12.20 | 7.61 | 3.16 |
Distributions from net investment income | (.37) | (.35) | (.31) | - |
Distributions from net realized gain | (1.67) | (.98) | (1.40) | - |
Total distributions | (2.04) | (1.33) | (1.71) | - |
Redemption fees added to paid in capital E,J | - | - | - | - |
Net asset value, end of period | $ 23.68 | $ 47.34 | $ 36.47 | $ 30.57 |
Total Return B,C,D | (47.65)% | 34.54% | 26.01% | 11.53% |
Ratios to Average Net Assets F,I | | | |
Expenses before reductions | 1.32% | 1.25% | 1.27% | 1.42% A |
Expenses net of fee waivers, if any | 1.32% | 1.25% | 1.27% | 1.42% A |
Expenses net of all reductions | 1.29% | 1.22% | 1.21% | 1.36% A |
Net investment income (loss) | 1.27% | 1.08% | 1.22% | 1.15% A |
Supplemental Data | | | |
Net assets, end of period (in millions) | $ 380 | $ 417 | $ 140 | $ 2 |
Portfolio turnover rate G | 79% | 56% | 56% | 75% |
A Annualized
B Total returns for periods of less than one year are not annualized.
C Total returns would have been lower had certain expenses not been reduced during the periods shown.
D Total returns do not include the effect of the sales charges.
E Calculated based on average shares outstanding during the period.
F Fees and expenses of the underlying Fidelity Central Funds are not included in the Fund's expense ratio. The Fund indirectly bears its proportionate share of the expenses of any underlying Fidelity Central Funds.
G Amount does not include the portfolio activity of any underlying Fidelity Central Funds.
H For the period January 6, 2005 (commencement of sale of shares) to October 31, 2005.
I Expense ratios reflect operating expenses of the class. Expenses before reductions do not reflect amounts reimbursed by the investment adviser or reductions from brokerage service arrangements or other expense offset arrangements and do not represent the amount paid by the class during periods when reimbursements or reductions occur. Expense ratios before reductions for start-up periods may not be representative of longer-term operating periods. Expenses net of fee waivers reflect expenses after reimbursement by the investment adviser but prior to reductions from brokerage service arrangements or other expense offset arrangements. Expenses net of all reductions represent the net expenses paid by the class.
J Amount represents less than $.01 per share.
See accompanying notes which are an integral part of the financial statements.
Annual Report
Financial Highlights - Class T
Years ended October 31, | 2008 | 2007 | 2006 | 2005 H |
Selected Per-Share Data | | | |
Net asset value, beginning of period | $ 47.06 | $ 36.30 | $ 30.49 | $ 27.41 |
Income from Investment
Operations | | | | |
Net investment income (loss) E | .33 | .29 | .27 | .20 |
Net realized and unrealized gain (loss) | (21.94) | 11.71 | 7.18 | 2.88 |
Total from investment operations | (21.61) | 12.00 | 7.45 | 3.08 |
Distributions from net investment income | (.29) | (.26) | (.24) | - |
Distributions from net realized gain | (1.67) | (.98) | (1.40) | - |
Total distributions | (1.96) | (1.24) | (1.64) | - |
Redemption fees added to paid in capital E,J | - | - | - | - |
Net asset value, end of period | $ 23.49 | $ 47.06 | $ 36.30 | $ 30.49 |
Total Return B,C,D | (47.84)% | 34.08% | 25.49% | 11.24% |
Ratios to Average Net Assets F,I | | | |
Expenses before reductions | 1.68% | 1.63% | 1.71% | 1.75% A |
Expenses net of fee waivers, if any | 1.68% | 1.63% | 1.71% | 1.75% A |
Expenses net of all reductions | 1.64% | 1.60% | 1.65% | 1.69% A |
Net investment income (loss) | .91% | .70% | .78% | .83% A |
Supplemental Data | | | |
Net assets, end of period (in millions) | $ 64 | $ 53 | $ 10 | $ 2 |
Portfolio turnover rate G | 79% | 56% | 56% | 75% |
A Annualized
B Total returns for periods of less than one year are not annualized.
C Total returns would have been lower had certain expenses not been reduced during the periods shown.
D Total returns do not include the effect of the sales charges.
E Calculated based on average shares outstanding during the period.
F Fees and expenses of the underlying Fidelity Central Funds are not included in the Fund's expense ratio. The Fund indirectly bears its proportionate share of the expenses of any underlying Fidelity Central Funds.
G Amount does not include the portfolio activity of any underlying Fidelity Central Funds.
H For the period January 6, 2005 (commencement of sale of shares) to October 31, 2005.
I Expense ratios reflect operating expenses of the class. Expenses before reductions do not reflect amounts reimbursed by the investment adviser or reductions from brokerage service arrangements or other expense offset arrangements and do not represent the amount paid by the class during periods when reimbursements or reductions occur. Expense ratios before reductions for start-up periods may not be representative of longer-term operating periods. Expenses net of fee waivers reflect expenses after reimbursement by the investment adviser but prior to reductions from brokerage service arrangements or other expense offset arrangements. Expenses net of all reductions represent the net expenses paid by the class.
J Amount represents less than $.01 per share.
See accompanying notes which are an integral part of the financial statements.
Annual Report
Financial Highlights - Class B
Years ended October 31, | 2008 | 2007 | 2006 | 2005 H |
Selected Per-Share Data | | | | |
Net asset value, beginning of period | $ 46.70 | $ 36.12 | $ 30.36 | $ 27.41 |
Income from Investment
Operations | | | | |
Net investment income (loss) E | .15 | .08 | .08 | .08 |
Net realized and unrealized gain (loss) | (21.77) | 11.64 | 7.19 | 2.87 |
Total from investment operations | (21.62) | 11.72 | 7.27 | 2.95 |
Distributions from net investment income | (.16) | (.16) | (.11) | - |
Distributions from net realized gain | (1.67) | (.98) | (1.40) | - |
Total distributions | (1.83) | (1.14) | (1.51) | - |
Redemption fees added to paid in capital E,J | - | - | - | - |
Net asset value, end of period | $ 23.25 | $ 46.70 | $ 36.12 | $ 30.36 |
Total Return B,C,D | (48.11)% | 33.37% | 24.91% | 10.76% |
Ratios to Average Net Assets F,I | | | | |
Expenses before reductions | 2.19% | 2.14% | 2.27% | 2.24% A |
Expenses net of fee waivers, if any | 2.19% | 2.14% | 2.25% | 2.24% A |
Expenses net of all reductions | 2.15% | 2.10% | 2.19% | 2.18% A |
Net investment income (loss) | .40% | .19% | .24% | .33% A |
Supplemental Data | | | | |
Net assets, end of period (in millions) | $ 15 | $ 17 | $ 4 | $ 1 |
Portfolio turnover rate G | 79% | 56% | 56% | 75% |
A Annualized
B Total returns for periods of less than one year are not annualized.
C Total returns would have been lower had certain expenses not been reduced during the periods shown.
D Total returns do not include the effect of the contingent deferred sales charge.
E Calculated based on average shares outstanding during the period.
F Fees and expenses of the underlying Fidelity Central Funds are not included in the Fund's expense ratio. The Fund indirectly bears its proportionate share of the expenses of any underlying Fidelity Central Funds.
G Amount does not include the portfolio activity of any underlying Fidelity Central Funds.
H For the period January 6, 2005 (commencement of sale of shares) to October 31, 2005.
I Expense ratios reflect operating expenses of the class. Expenses before reductions do not reflect amounts reimbursed by the investment adviser or reductions from brokerage service arrangements or other expense offset arrangements and do not represent the amount paid by the class during periods when reimbursements or reductions occur. Expense ratios before reductions for start-up periods may not be representative of longer-term operating periods. Expenses net of fee waivers reflect expenses after reimbursement by the investment adviser but prior to reductions from brokerage service arrangements or other expense offset arrangements. Expenses net of all reductions represent the net expenses paid by the class.
J Amount represents less than $.01 per share.
See accompanying notes which are an integral part of the financial statements.
Annual Report
Financial Highlights - Class C
Years ended October 31, | 2008 | 2007 | 2006 | 2005 H |
Selected Per-Share Data | | | |
Net asset value, beginning of period | $ 46.82 | $ 36.19 | $ 30.41 | $ 27.41 |
Income from Investment
Operations | | | | |
Net investment income (loss) E | .15 | .09 | .11 | .13 |
Net realized and unrealized gain (loss) | (21.82) | 11.66 | 7.19 | 2.87 |
Total from investment operations | (21.67) | 11.75 | 7.30 | 3.00 |
Distributions from net investment income | (.17) | (.14) | (.12) | - |
Distributions from net realized gain | (1.67) | (.98) | (1.40) | - |
Total distributions | (1.84) | (1.12) | (1.52) | - |
Redemption fees added to paid in capital E,J | - | - | - | - |
Net asset value, end of period | $ 23.31 | $ 46.82 | $ 36.19 | $ 30.41 |
Total Return B,C,D | (48.10)% | 33.38% | 24.97% | 10.94% |
Ratios to Average Net Assets F,I | | | | |
Expenses before reductions | 2.17% | 2.11% | 2.16% | 2.04% A |
Expenses net of fee waivers, if any | 2.17% | 2.11% | 2.16% | 2.04% A |
Expenses net of all reductions | 2.13% | 2.08% | 2.11% | 1.98% A |
Net investment income (loss) | .42% | .22% | .33% | .53% A |
Supplemental Data | | | |
Net assets, end of period (in millions) | $ 36 | $ 28 | $ 6 | $ 2 |
Portfolio turnover rate G | 79% | 56% | 56% | 75% |
A Annualized
B Total returns for periods of less than one year are not annualized.
C Total returns would have been lower had certain expenses not been reduced during the periods shown.
D Total returns do not include the effect of the contingent deferred sales charge.
E Calculated based on average shares outstanding during the period.
F Fees and expenses of the underlying Fidelity Central Funds are not included in the Fund's expense ratio. The Fund indirectly bears its proportionate share of the expenses of any underlying Fidelity Central Funds.
G Amount does not include the portfolio activity of any underlying Fidelity Central Funds.
H For the period January 6, 2005 (commencement of sale of shares) to October 31, 2005.
I Expense ratios reflect operating expenses of the class. Expenses before reductions do not reflect amounts reimbursed by the investment adviser or reductions from brokerage service arrangements or other expense offset arrangements and do not represent the amount paid by the class during periods when reimbursements or reductions occur. Expense ratios before reductions for start-up periods may not be representative of longer-term operating periods. Expenses net of fee waivers reflect expenses after reimbursement by the investment adviser but prior to reductions from brokerage service arrangements or other expense offset arrangements. Expenses net of all reductions represent the net expenses paid by the class.
J Amount represents less than $.01 per share.
See accompanying notes which are an integral part of the financial statements.
Annual Report
Financial Highlights - International Discovery
Years ended October 31, | 2008 | 2007 | 2006 | 2005 | 2004 |
Selected Per-Share Data | | | | | |
Net asset value, beginning of period | $ 47.68 | $ 36.67 | $ 30.65 | $ 25.31 | $ 21.87 |
Income from Investment Operations | | | | | |
Net investment income (loss) B | .57 | .53 | .48 | .37 | .22 |
Net realized and unrealized gain (loss) | (22.29) | 11.84 | 7.25 | 5.24 | 3.40 |
Total from investment operations | (21.72) | 12.37 | 7.73 | 5.61 | 3.62 |
Distributions from net investment income | (.41) | (.38) | (.31) | (.15) | (.18) |
Distributions from net realized gain | (1.67) | (.98) | (1.40) | (.12) | - |
Total distributions | (2.08) | (1.36) | (1.71) | (.27) | (.18) |
Redemption fees added to paid in capital B,F | - | - | - | - | - |
Net asset value, end of period | $ 23.88 | $ 47.68 | $ 36.67 | $ 30.65 | $ 25.31 |
Total Return A | (47.55)% | 34.85% | 26.34% | 22.29% | 16.65% |
Ratios to Average Net Assets C,E | | | | | |
Expenses before reductions | 1.09% | 1.04% | 1.09% | 1.08% | 1.10% |
Expenses net of fee waivers, if any | 1.09% | 1.04% | 1.08% | 1.07% | 1.10% |
Expenses net of all reductions | 1.05% | 1.00% | 1.03% | 1.01% | 1.06% |
Net investment income (loss) | 1.51% | 1.30% | 1.41% | 1.35% | .92% |
Supplemental Data | | | | | |
Net assets, end of period (in millions) | $ 6,999 | $ 14,176 | $ 8,054 | $ 3,949 | $ 2,193 |
Portfolio turnover rate D | 79% | 56% | 56% | 75% | 87% |
A Total returns would have been lower had certain expenses not been reduced during the periods shown.
B Calculated based on average shares outstanding during the period.
C Fees and expenses of the underlying Fidelity Central Funds are not included in the Fund's expense ratio. The Fund indirectly bears its proportionate share of the expenses of any underlying Fidelity Central Funds.
D Amount does not include the portfolio activity of any underlying Fidelity Central Funds.
E Expense ratios reflect operating expenses of the class. Expenses before reductions do not reflect amounts reimbursed by the investment adviser or reductions from brokerage service arrangements or other expense offset arrangements and do not represent the amount paid by the class during periods when reimbursements or reductions occur. Expenses net of fee waivers reflect expenses after reimbursement by the investment adviser but prior to reductions from brokerage service arrangements or other expense offset arrangements. Expenses net of all reductions represent the net expenses paid by the class.
F Amount represents less than $.01 per share.
See accompanying notes which are an integral part of the financial statements.
Annual Report
Financial Highlights - Class K
Year ended October 31, | 2008 G |
Selected Per-Share Data | |
Net asset value, beginning of period | $ 40.32 |
Income from Investment Operations | |
Net investment income (loss) D | .10 |
Net realized and unrealized gain (loss) | (16.52) |
Total from investment operations | (16.42) |
Redemption fees added to paid in capital D,I | - |
Net asset value, end of period | $ 23.90 |
Total Return B,C | (40.72)% |
Ratios to Average Net Assets E,H | |
Expenses before reductions | .93% A |
Expenses net of fee waivers, if any | .93% A |
Expenses net of all reductions | .89% A |
Net investment income (loss) | .83% A |
Supplemental Data | |
Net assets, end of period (in millions) | $ 145 |
Portfolio turnover rate F | 79% |
A Annualized
B Total returns for periods of less than one year are not annualized.
C Total returns would have been lower had certain expenses not been reduced during the periods shown.
D Calculated based on average shares outstanding during the period.
E Fees and expenses of the underlying Fidelity Central Funds are not included in the Fund's expense ratio. The Fund indirectly bears its proportionate share of the expenses of any underlying Fidelity Central Funds.
F Amount does not include the portfolio activity of any underlying Fidelity Central Funds.
G For the period May 9, 2008 (commencement of sale of shares) to October 31, 2008.
H Expense ratios reflect operating expenses of the class. Expenses before reductions do not reflect amounts reimbursed by the investment adviser or reductions from brokerage service arrangements or other expense offset arrangements and do not represent the amount paid by the class during periods when reimbursements or reductions occur. Expense ratios before reductions for start-up periods may not be representative of longer-term operating periods. Expenses net of fee waivers reflect expenses after reimbursement by the investment adviser but prior to reductions from brokerage service arrangements or other expense offset arrangements. Expenses net of all reductions represent the net expenses paid by the class.
I Amount represents less than $.01 per share.
See accompanying notes which are an integral part of the financial statements.
Annual Report
Financial Highlights - Institutional Class
Years ended October 31, | 2008 | 2007 | 2006 | 2005 G |
Selected Per-Share Data | | | | |
Net asset value, beginning of period | $ 47.73 | $ 36.71 | $ 30.68 | $ 27.41 |
Income from Investment
Operations | | | | |
Net investment income (loss) D | .53 | .55 | .51 | .38 |
Net realized and unrealized gain (loss) | (22.24) | 11.85 | 7.25 | 2.89 |
Total from investment operations | (21.71) | 12.40 | 7.76 | 3.27 |
Distributions from net investment income | (.44) | (.40) | (.33) | - |
Distributions from net realized gain | (1.67) | (.98) | (1.40) | - |
Total distributions | (2.11) | (1.38) | (1.73) | - |
Redemption fees added to paid in capital D,I | - | - | - | - |
Net asset value, end of period | $ 23.91 | $ 47.73 | $ 36.71 | $ 30.68 |
Total Return B,C | (47.51)% | 34.93% | 26.45% | 11.93% |
Ratios to Average Net Assets E,H | | | | |
Expenses before reductions | 1.05% | .97% | 1.00% | .97% A |
Expenses net of fee waivers, if any | 1.05% | .97% | 1.00% | .97% A |
Expenses net of all reductions | 1.01% | .94% | .95% | .90% A |
Net investment income (loss) | 1.54% | 1.36% | 1.49% | 1.60% A |
Supplemental Data | | | | |
Net assets, end of period (in millions) | $ 159 | $ 58 | $ 28 | $ 10 |
Portfolio turnover rate F | 79% | 56% | 56% | 75% |
A Annualized
B Total returns for periods of less than one year are not annualized.
C Total returns would have been lower had certain expenses not been reduced during the periods shown.
D Calculated based on average shares outstanding during the period.
E Fees and expenses of the underlying Fidelity Central Funds are not included in the Fund's expense ratio. The Fund indirectly bears its proportionate share of the expenses of any underlying Fidelity Central Funds.
F Amount does not include the portfolio activity of any underlying Fidelity Central Funds.
G For the period January 6, 2005 (commencement of sale of shares) to October 31, 2005.
H Expense ratios reflect operating expenses of the class. Expenses before reductions do not reflect amounts reimbursed by the investment adviser or reductions from brokerage service arrangements or other expense offset arrangements and do not represent the amount paid by the class during periods when reimbursements or reductions occur. Expense ratios before reductions for start-up periods may not be representative of longer-term operating periods. Expenses net of fee waivers reflect expenses after reimbursement by the investment adviser but prior to reductions from brokerage service arrangements or other expense offset arrangements. Expenses net of all reductions represent the net expenses paid by the class.
I Amount represents less than $.01 per share.
See accompanying notes which are an integral part of the financial statements.
Annual Report
Notes to Financial Statements
For the period ended October 31, 2008
(Amounts in thousands except ratios)
1. Organization.
Fidelity International Discovery Fund (the Fund) is a fund of Fidelity Investment Trust (the trust) and is authorized to issue an unlimited number of shares. The trust is registered under the Investment Company Act of 1940, as amended (the 1940 Act), as an open-end management investment company organized as a Massachusetts business trust. On January 17, 2008, the Board of Trustees of the Fund approved the creation of an additional class of shares. The Fund commenced sale of Class K shares on May 9, 2008. The Fund offers Class A, Class T, Class B, Class C, International Discovery, Class K and Institutional Class shares, each of which has equal rights as to assets and voting privileges. Each class has exclusive voting rights with respect to matters that affect that class. Class B shares will automatically convert to Class A shares after a holding period of seven years from the initial date of purchase. Investment income, realized and unrealized capital gains and losses, the common expenses of the Fund, and certain fund-level expense reductions, if any, are allocated on a pro-rata basis to each class based on the relative net assets of each class to the total net assets of the Fund. Each class differs with respect to transfer agent and distribution and service plan fees incurred. Certain expense reductions also differ by class. The Fund's investments in emerging markets can be subject to social, economic, regulatory, and political uncertainties and can be extremely volatile.
2. Investments in Fidelity Central Funds.
The Fund may invest in Fidelity Central Funds, which are open-end investment companies available only to other investment companies and accounts managed by Fidelity Management & Research Company (FMR) and its affiliates. The Fund's Schedule of Investments lists each of the Fidelity Central Funds held as of period end, if any, as an investment of the Fund, but does not include the underlying holdings of each Fidelity Central Fund. As an Investing Fund, the Fund indirectly bears its proportionate share of the expenses of the underlying Fidelity Central Funds.
The Money Market Central Funds seek preservation of capital and current income and are managed by Fidelity Investments Money Management, Inc. (FIMM), an affiliate of FMR.
A complete unaudited list of holdings for each Fidelity Central Fund is available upon request or at the SEC's web site at www.sec.gov. In addition, the financial statements of the Fidelity Central Funds, which are not covered by the Fund's Report of Independent Registered Public Accounting Firm, are available on the SEC's web site or upon request.
3. Significant Accounting Policies.
The financial statements have been prepared in conformity with accounting principles generally accepted in the United States of America, which require management to make
Annual Report
3. Significant Accounting Policies - continued
certain estimates and assumptions at the date of the financial statements. Actual results could differ from those estimates. The following summarizes the significant accounting policies of the Fund:
Security Valuation. Investments are valued as of 4:00 p.m. Eastern time on the last calendar day of the period. Wherever possible, the Fund uses independent pricing services approved by the Board of Trustees to value its investments.
Equity securities, including restricted securities, for which market quotations are readily available, are valued at the last reported sale price or official closing price as reported by an independent pricing service on the primary market or exchange on which they are traded. In the event there were no sales during the day or closing prices are not available, securities are valued at the last quoted bid price. Futures contracts are valued at the settlement price established each day by the board of trade or exchange on which they are traded. Investments in open-end mutual funds, including the Fidelity Central Funds, are valued at their closing net asset value each business day. Short-term securities with remaining maturities of sixty days or less for which quotations are not readily available are valued at amortized cost, which approximates value.
When current market prices or quotations are not readily available or reliable, valuations may be determined in good faith in accordance with procedures adopted by the Board of Trustees. Factors used in determining value may include significant market or security specific events, changes in interest rates and credit quality, and developments in foreign markets which are monitored by evaluating the performance of ADRs, futures contracts and exchange-traded funds. The frequency with which these procedures are used cannot be predicted and may be utilized to a significant extent. The value of securities used for net asset value (NAV) calculation under these procedures may differ from published prices for the same securities.
Foreign Currency. The Fund uses foreign currency contracts to facilitate transactions in foreign-denominated securities. Losses from these transactions may arise from changes in the value of the foreign currency or if the counterparties do not perform under the contracts' terms.
Foreign-denominated assets, including investment securities, and liabilities are translated into U.S. dollars at the exchange rate at period end. Purchases and sales of investment securities, income and dividends received and expenses denominated in foreign currencies are translated into U.S. dollars at the exchange rate in effect on the transaction date.
The effects of exchange rate fluctuations on investments are included with the net realized and unrealized gain (loss) on investment securities. Other foreign currency transactions resulting in realized and unrealized gain (loss) are disclosed separately.
Annual Report
Notes to Financial Statements - continued
(Amounts in thousands except ratios)
3. Significant Accounting Policies - continued
Investment Transactions and Income. For financial reporting purposes, the Fund's investment holdings and NAV include trades executed through the end of the last business day of the period. The NAV per share for processing shareholder transactions is calculated as of the close of business of the New York Stock Exchange (NYSE) normally 4:00 p.m. Eastern time and includes trades executed through the end of the prior business day. Gains and losses on securities sold are determined on the basis of identified cost and may include proceeds received from litigation. Dividend income is recorded on the ex-dividend date, except for certain dividends from foreign securities where the ex-dividend date may have passed, which are recorded as soon as the Fund is informed of the ex-dividend date. Non-cash dividends included in dividend income, if any, are recorded at the fair market value of the securities received. Distributions received on securities that represent a return of capital or capital gain are recorded as a reduction of cost of investments and/or as a realized gain. The Fund estimates the components of distributions received that may be considered return of capital distributions or capital gain distributions. Interest income and distributions from the Fidelity Central Funds are accrued as earned. Interest income includes coupon interest and amortization of premium and accretion of discount on debt securities. Investment income is recorded net of foreign taxes withheld where recovery of such taxes is uncertain.
Expenses. Most expenses of the trust can be directly attributed to a fund. Expenses which cannot be directly attributed are apportioned among each Fund in the trust. Expense estimates are accrued in the period to which they relate and adjustments are made when actual amounts are known.
Income Tax Information and Distributions to Shareholders. Each year, the Fund intends to qualify as a regulated investment company by distributing substantially all of its taxable income and realized gains under Subchapter M of the Internal Revenue Code and filing its U.S. federal tax return. As a result, no provision for income taxes is required. The Fund is subject to the provisions of FASB Interpretation No. 48, Accounting for Uncertainties in Income Taxes (FIN 48). FIN 48 sets forth a minimum threshold for financial statement recognition of the benefit of a tax position taken or expected to be taken in a tax return. The implementation of FIN 48 did not result in any unrecognized tax benefits in the accompanying financial statements. Each of the Fund's federal tax returns for the prior three fiscal years remains subject to examination by the Internal Revenue Service (IRS). Foreign taxes are provided for based on the Fund's understanding of the tax rules and rates that exist in the foreign markets in which it invests.
Distributions are recorded on the ex-dividend date. Income dividends and capital gain distributions are declared separately for each class. Income and capital gain distributions are determined in accordance with income tax regulations, which may differ from
Annual Report
3. Significant Accounting Policies - continued
Income Tax Information and Distributions to Shareholders - continued
generally accepted accounting principles. In addition, the Fund will claim a portion of the payment made to redeeming shareholders as a distribution for income tax purposes.
Capital accounts within the financial statements are adjusted for permanent book-tax differences. These adjustments have no impact on net assets or the results of operations. Temporary book-tax differences will reverse in a subsequent period.
Book-tax differences are primarily due to futures transactions, foreign currency transactions, certain foreign taxes, passive foreign investment companies (PFIC), market discount, deferred trustees compensation and losses deferred due to wash sales.
The tax-basis components of distributable earnings and the federal tax cost as of period end were as follows:
Unrealized appreciation | $ 370,565 |
Unrealized depreciation | (3,044,089) |
Net unrealized appreciation (depreciation) | (2,673,524) |
Undistributed ordinary income | 93,213 |
Capital loss carryforward | (637,482) |
| |
Cost for federal income tax purposes | $ 10,544,261 |
The tax character of distributions paid was as follows:
| October 31, 2008 | October 31, 2007 |
Ordinary Income | $ 164,399 | $ 145,377 |
Long-term Capital Gains | 493,881 | 164,810 |
Total | $ 658,280 | $ 310,187 |
Short-Term Trading (Redemption) Fees. Shares held in the Fund less than 30 days are subject to a redemption fee equal to 1.00% of the proceeds of the redeemed shares. All redemption fees, including any estimated redemption fees paid by FMR, are retained by the Fund and accounted for as an addition to paid in capital.
New Accounting Pronouncements. In September 2006, Statement of Financial Accounting Standards No. 157, Fair Value Measurements (SFAS 157), was issued and is effective for fiscal years beginning after November 15, 2007. SFAS 157 defines fair value, establishes a framework for measuring fair value and results in expanded disclosures about fair value measurements.
Annual Report
Notes to Financial Statements - continued
(Amounts in thousands except ratios)
3. Significant Accounting Policies - continued
New Accounting Pronouncements - continued
In addition, in March 2008, Statement of Financial Accounting Standards No. 161, Disclosures about Derivative Instruments and Hedging Activities (SFAS 161), was issued and is effective for reporting periods beginning after November 15, 2008. SFAS 161 requires enhanced disclosures to provide information about the reasons the Fund invests in derivative instruments, the accounting treatment and the effect derivatives have on financial performance.
4. Operating Policies.
Repurchase Agreements. FMR has received an Exemptive Order from the Securities and Exchange Commission (the SEC) which permits the Fund and other affiliated entities of FMR to transfer uninvested cash balances into joint trading accounts which are then invested in repurchase agreements. The Fund may also invest directly with institutions in repurchase agreements. Repurchase agreements are collateralized by government or non-government securities. Upon settlement date, collateral is held in segregated accounts with custodian banks and may be obtained in the event of a default of the counterparty. The Fund monitors, on a daily basis, the value of the collateral to ensure it is at least equal to the principal amount of the repurchase agreement (including accrued interest). In the event of a default by the counterparty, realization of the collateral proceeds could be delayed, during which time the value of the collateral may decline.
Futures Contracts. The Fund may use futures contracts to manage its exposure to the stock markets. Buying futures tends to increase a fund's exposure to the underlying instrument, while selling futures tends to decrease a fund's exposure to the underlying instrument or hedge other fund investments. Upon entering into a futures contract, a fund is required to deposit with a clearing broker, no later than the following business day, an amount ("initial margin") equal to a certain percentage of the face value of the contract. The initial margin may be in the form of cash or securities and is transferred to a segregated account on settlement date. Subsequent payments ("variation margin") are made or received by a fund depending on the daily fluctuations in the value of the futures contract and are accounted for as unrealized gains or losses. Realized gains (losses) are recorded upon the expiration or closing of the futures contract. Securities deposited to meet margin requirements are identified in the Schedule of Investments. Futures contracts involve, to varying degrees, risk of loss in excess of any futures variation margin reflected in the Statement of Assets and Liabilities. The underlying face amount at value of any open futures contracts at period end is shown in the Schedule of Investments under the caption "Futures Contracts." This amount reflects each contract's exposure to the underlying instrument at period end. Losses may arise from changes in the value of the underlying instruments or if the counterparties do not perform under the contract's terms.
Annual Report
5. Purchases and Sales of Investments.
Purchases and sales of securities other than short-term securities, aggregated $10,031,748 and $9,562,944, respectively.
6. Fees and Other Transactions with Affiliates.
Management Fee. FMR and its affiliates provide the Fund with investment management related services for which the Fund pays a monthly management fee. The management fee is the sum of an individual fund fee rate that is based on an annual rate of .45% of the Fund's average net assets and a group fee rate that averaged .26% during the period. The group fee rate is based upon the average net assets of all the mutual funds advised by FMR. The group fee rate decreases as assets under management increase and increases as assets under management decrease. In addition, the management fee is subject to a performance adjustment up to a maximum of ±.20% of the Fund's average net assets over a 36 month performance period). The upward or downward adjustment to the management fee is based on the relative investment performance of the retail class of the Fund, International Discovery as compared to an appropriate benchmark index. For the period, the total annual management fee rate, including the performance adjustment, was .81% of the Fund's average net assets.
Distribution and Service Plan. In accordance with Rule 12b-1 of the 1940 Act, the Fund has adopted separate Distribution and Service Plans for each class of shares. Certain classes pay Fidelity Distributors Corporation (FDC), an affiliate of FMR, separate Distribution and Service Fees, each of which is based on an annual percentage of each class' average net assets. In addition, FDC may pay financial intermediaries for selling shares of the Fund and providing shareholder support services. For the period, the Distribution and Service Fee rates and the total amounts paid to and retained by FDC were as follows:
| Distribution
Fee | Service
Fee | Paid to
FDC | Retained
by FDC |
Class A | 0% | .25% | $ 1,335 | $ 160 |
Class T | .25% | .25% | 393 | 3 |
Class B | .75% | .25% | 224 | 168 |
Class C | .75% | .25% | 479 | 189 |
| | | $ 2,431 | $ 520 |
Annual Report
Notes to Financial Statements - continued
(Amounts in thousands except ratios)
6. Fees and Other Transactions with Affiliates - continued
Sales Load. FDC receives a front-end sales charge of up to 5.75% for selling Class A shares, and 3.50% for selling Class T shares, some of which is paid to financial intermediaries for selling shares of the Fund. FDC receives the proceeds of contingent deferred sales charges levied on Class A, Class T, Class B, and Class C redemptions. These charges depend on the holding period. The deferred sales charges range from 5% to 1% for Class B, 1% for Class C, 1.00% to .50% for certain purchases of Class A shares and .25% for certain purchases of Class T shares.
For the period, sales charge amounts retained by FDC were as follows:
| Retained
by FDC |
Class A | $ 284 |
Class T | 46 |
Class B* | 36 |
Class C* | 14 |
| $ 380 |
* When Class B and Class C shares are initially sold, FDC pays commissions from its own resources to financial intermediaries through which the sales are made.
Transfer Agent Fees. Fidelity Investments Institutional Operations Company, Inc. (FIIOC), an affiliate of FMR, is the transfer, dividend disbursing and shareholder servicing agent for each class of the Fund. FIIOC receives account fees and asset-based fees that vary according to the account size and type of account of the shareholders of the respective classes of the Fund. FIIOC pays for typesetting, printing and mailing of shareholder reports, except proxy statements. Prior to January 1, 2008, Fidelity Service Company, Inc. (FSC) also an affiliate of FMR was the sub-transfer for International Discovery shares. For the period, the total transfer agent fees paid by each class were as follows:
| Amount | % of
Average
Net Assets |
Class A | $ 1,109 | .21 |
Class T | 248 | .31 |
Class B | 73 | .32 |
Class C | 146 | .30 |
International Discovery | 26,685 | .22 |
Class K | 8 | .05* |
Institutional Class | 167 | .18 |
| $ 28,436 | |
* Annualized
Annual Report
6. Fees and Other Transactions with Affiliates - continued
Accounting and Security Lending Fees. FSC maintains the Fund's accounting records. The accounting fee is based on the level of average net assets for the month. Under a separate contract, FSC administers the security lending program. The security lending fee is based on the number and duration of lending transactions.
Brokerage Commissions. The Fund placed a portion of its portfolio transactions with brokerage firms which are affiliates of the investment adviser. The commissions paid to these affiliated firms were $6 for the period.
7. Committed Line of Credit.
The Fund participates with other funds managed by FMR in a $4.2 billion credit facility (the "line of credit") to be utilized for temporary or emergency purposes to fund shareholder redemptions or for other short-term liquidity purposes. The Fund has agreed to pay commitment fees on its pro rata portion of the line of credit, which amounted to $26 and is reflected in Miscellaneous Expense on the Statement of Operations. During the period, there were no borrowings on this line of credit.
8. Security Lending.
The Fund lends portfolio securities from time to time in order to earn additional income. On the settlement date of the loan, the Fund receives collateral (in the form of U.S. Treasury obligations, letters of credit and/or cash) against the loaned securities and maintains collateral in an amount not less than 100% of the market value of the loaned securities during the period of the loan. The market value of the loaned securities is determined at the close of business of the Fund and any additional required collateral is delivered to the Fund on the next business day. If the borrower defaults on its obligation to return the securities loaned because of insolvency or other reasons, a fund could experience delays and costs in recovering the securities loaned or in gaining access to the collateral. Any cash collateral received is invested in the Fidelity Securities Lending Cash Central Fund. The value of loaned securities and cash collateral at period end are disclosed on the Fund's Statement of Assets and Liabilities. Security lending income represents the income earned on investing cash collateral, less fees and expenses associated with the loan, plus any premium payments that may be received on the loan of certain types of securities. Security lending income is presented in the Statement of Operations as a component of income from Fidelity Central Funds. Net income from lending portfolio securities during the period amounted to $11,130.
Annual Report
Notes to Financial Statements - continued
(Amounts in thousands except ratios)
9. Expense Reductions.
Many of the brokers with whom FMR places trades on behalf of the Fund provided services to the Fund in addition to trade execution. These services included payments of certain expenses on behalf of the Fund totaling $4,760 for the period. In addition, through arrangements with each class' transfer agent, credits realized as a result of uninvested cash balances were used to reduce the Fund's expenses. During the period, these credits reduced the Fund's custody expenses by $1. During the period, credits reduced each class' transfer agent expense as noted in the table below.
| Transfer Agent
expense reduction |
International Discovery | $ 248 |
10. Other.
The Fund's organizational documents provide former and current trustees and officers with a limited indemnification against liabilities arising in connection with the performance of their duties to the Fund. In the normal course of business, the Fund may also enter into contracts that provide general indemnifications. The Fund's maximum exposure under these arrangements is unknown as this would be dependent on future claims that may be made against the Fund. The risk of material loss from such claims is considered remote.
In December 2006, the Independent Trustees, with the assistance of independent counsel, completed an investigation regarding gifts, gratuities and business entertainment provided by certain brokers to certain individuals who were employed on FMR's domestic equity trading desk during the period 2002 to 2004. The Independent Trustees and FMR agreed that, despite the absence of proof that the Fidelity mutual funds experienced diminished execution quality as a result of the improper receipt of gifts and business entertainment, the conduct at issue was serious and was worthy of redress. Accordingly, the Independent Trustees requested, and FMR agreed to make, a payment of $42 million plus accrued interest, which equaled approximately $7.3 million, to certain Fidelity mutual funds.
In March 2008, the Trustees approved a method for allocating this payment among the funds and, in total, FMR paid the fund $5, which is recorded in the accompanying Statement of Operations.
In a related administrative order dated March 5, 2008, the U.S. Securities and Exchange Commission ("SEC") announced a settlement with FMR and FMR Co., Inc. (an affiliate of FMR) involving the SEC's regulatory rules for investment advisers and the improper receipt of gifts, gratuities and business entertainment. Without admitting or denying the SEC's findings, FMR agreed to pay an $8 million civil penalty to the United States Treasury.
Annual Report
11. Distributions to Shareholders.
Distributions to shareholders of each class were as follows:
Years ended October 31, | 2008 | 2007 |
From net investment income | | |
Class A | $ 3,599 | $ 1,387 |
Class T | 387 | 80 |
Class B | 67 | 21 |
Class C | 123 | 24 |
International Discovery | 124,823 | 84,038 |
Institutional Class | 575 | 312 |
Total | $ 129,574 | $ 85,862 |
From net realized gain | | |
Class A | $ 16,423 | $ 3,929 |
Class T | 2,244 | 302 |
Class B | 719 | 130 |
Class C | 1,185 | 170 |
International Discovery | 505,958 | 219,032 |
Institutional Class | 2,177 | 762 |
Total | $ 528,706 | $ 224,325 |
12. Share Transactions.
Transactions for each class of shares were as follows:
| Shares Years ended October 31, | Dollars Years ended October 31, |
| 2008 A | 2007 | 2008 A | 2007 |
Class A | | | | |
Shares sold | 13,337 | 5,675 | $ 505,827 | $ 234,633 |
Reinvestment of distributions | 252 | 63 | 11,025 | 2,271 |
Shares redeemed | (6,361) | (770) | (213,706) | (31,203) |
Net increase (decrease) | 7,228 | 4,968 | $ 303,146 | $ 205,701 |
Annual Report
Notes to Financial Statements - continued
(Amounts in thousands except ratios)
12. Share Transactions - continued
| Shares Years ended October 31, | Dollars Years ended October 31, |
| 2008 A | 2007 | 2008 A | 2007 |
Class T | | | | |
Shares sold | 2,322 | 1,031 | $ 87,236 | $ 42,252 |
Reinvestment of distributions | 59 | 10 | 2,571 | 371 |
Shares redeemed | (800) | (187) | (27,654) | (7,614) |
Net increase (decrease) | 1,581 | 854 | $ 62,153 | $ 35,009 |
Class B | | | | |
Shares sold | 487 | 293 | $ 18,856 | $ 11,952 |
Reinvestment of distributions | 17 | 4 | 721 | 136 |
Shares redeemed | (228) | (53) | (7,554) | (2,096) |
Net increase (decrease) | 276 | 244 | $ 12,023 | $ 9,992 |
Class C | | | | |
Shares sold | 1,350 | 481 | $ 51,762 | $ 19,749 |
Reinvestment of distributions | 25 | 4 | 1,076 | 139 |
Shares redeemed | (405) | (55) | (13,335) | (2,234) |
Net increase (decrease) | 970 | 430 | $ 39,503 | $ 17,654 |
International Discovery | | | | |
Shares sold | 98,885 | 133,089 | $ 3,784,869 | $ 5,367,776 |
Conversion to Class K | (6,197) | - | (182,264) | - |
Reinvestment of distributions | 13,646 | 7,929 | 600,976 | 289,550 |
Shares redeemed | (110,609) | (63,328) | (3,914,448) | (2,558,324) |
Net increase (decrease) | (4,275) | 77,690 | $ 289,133 | $ 3,099,002 |
Class K | | | | |
Shares sold | 215 | - | $ 6,017 | $ - |
Conversion from International Discovery | 6,197 | - | 182,264 | - |
Reinvestment of distributions | - | - | - | - |
Shares redeemed | (338) | - | (8,716) | - |
Net increase (decrease) | 6,074 | - | $ 179,565 | $ - |
Annual Report
12. Share Transactions - continued
| Shares Years ended October 31, | Dollars Years ended October 31, |
| 2008 A | 2007 | 2008 A | 2007 |
Institutional Class | | | | |
Shares sold | 7,551 | 538 | $ 243,799 | $ 22,351 |
Reinvestment of distributions | 42 | 19 | 1,852 | 700 |
Shares redeemed | (2,148) | (120) | (62,044) | (5,000) |
Net increase (decrease) | 5,445 | 437 | $ 183,607 | $ 18,051 |
A Share transactions for Class K are for the period May 9, 2008 (commencement of sale of shares) to October 31, 2008.
Annual Report
To the Trustees of Fidelity Investment Trust and the Shareholders of Fidelity International Discovery Fund:
In our opinion, the accompanying statement of assets and liabilities, including the schedule of investments, and the related statements of operations and of changes in net assets and the financial highlights present fairly, in all material respects, the financial position of Fidelity International Discovery Fund (a fund of Fidelity Investment Trust) at October 31, 2008, the results of its operations for the year then ended, the changes in its net assets for each of the two years in the period then ended and the financial highlights for each of the periods indicated, in conformity with accounting principles generally accepted in the United States of America. These financial statements and financial highlights (hereafter referred to as "financial statements") are the responsibility of the Fidelity International Discovery Fund's management. Our responsibility is to express an opinion on these financial statements based on our audits. We conducted our audits of these financial statements in accordance with the standards of the Public Company Accounting Oversight Board (United States). Those standards require that we plan and perform the audit to obtain reasonable assurance about whether the financial statements are free of material misstatement. An audit includes examining, on a test basis, evidence supporting the amounts and disclosures in the financial statements, assessing the accounting principles used and significant estimates made by management, and evaluating the overall financial statement presentation. We believe that our audits, which included confirmation of securities at October 31, 2008 by correspondence with the custodian and brokers, provide a reasonable basis for our opinion.
/s/ PricewaterhouseCoopers LLP
PricewaterhouseCoopers LLP
Boston, Massachusetts
December 23, 2008
Annual Report
The Trustees, Member of the Advisory Board, and executive officers of the trust and fund, as applicable, are listed below. The Board of Trustees governs the fund and is responsible for protecting the interests of shareholders. The Trustees are experienced executives who meet periodically throughout the year to oversee the fund's activities, review contractual arrangements with companies that provide services to the fund, and review the fund's performance. Except for Edward C. Johnson 3d and James C. Curvey, each of the Trustees oversees 220 funds advised by FMR or an affiliate. Messrs. Johnson and Curvey oversee 379 funds advised by FMR or an affiliate.
The Trustees hold office without limit in time except that (a) any Trustee may resign; (b) any Trustee may be removed by written instrument, signed by at least two-thirds of the number of Trustees prior to such removal; (c) any Trustee who requests to be retired or who has become incapacitated by illness or injury may be retired by written instrument signed by a majority of the other Trustees; and (d) any Trustee may be removed at any special meeting of shareholders by a two-thirds vote of the outstanding voting securities of the trust. Each Trustee who is not an interested person (as defined in the 1940 Act) (Independent Trustee), shall retire not later than the last day of the calendar year in which his or her 72nd birthday occurs. The Independent Trustees may waive this mandatory retirement age policy with respect to individual Trustees. The executive officers and Advisory Board Member hold office without limit in time, except that any officer and Advisory Board Member may resign or may be removed by a vote of a majority of the Trustees at any regular meeting or any special meeting of the Trustees. Except as indicated, each individual has held the office shown or other offices in the same company for the past five years.
The fund's Statement of Additional Information (SAI) includes more information about the Trustees. To request a free copy, call Fidelity at 1-877-208-0098.
Interested Trustees*:
Correspondence intended for each Trustee who is an interested person may be sent to Fidelity Investments, 82 Devonshire Street, Boston, Massachusetts 02109.
Name, Age; Principal Occupation |
Edward C. Johnson 3d (78) |
| Year of Election or Appointment: 1984 Mr. Johnson is Chairman of the Board of Trustees. Mr. Johnson serves as Chief Executive Officer, Chairman, and a Director of FMR LLC; Chairman and a Director of FMR; Chairman and a Director of Fidelity Research & Analysis Company (FRAC); Chairman and a Director of Fidelity Investments Money Management, Inc.; and Chairman and a Director of FMR Co., Inc. In addition, Mr. Johnson serves as Chairman and Director of FIL Limited. Previously, Mr. Johnson served as President of FMR LLC (2006-2007). |
James C. Curvey (73) |
| Year of Election or Appointment: 2007 Mr. Curvey also serves as Trustee (2007-present) of other investment companies advised by FMR. Mr. Curvey is a Director of FMR and FMR Co., Inc. (2007-present). Mr. Curvey is also Vice Chairman (2006-
present) and Director of FMR LLC. In addition, Mr. Curvey serves as an Overseer for the Boston Symphony Orchestra and a member of the Trustees of Villanova University. |
* Trustees have been determined to be "Interested Trustees" by virtue of, among other things, their affiliation with the trust or various entities under common control with FMR. FMR Corp. merged with and into FMR LLC on October 1, 2007. Any references to FMR LLC for prior periods are deemed to be references to the prior entity.
Independent Trustees:
Correspondence intended for each Independent Trustee (that is, the Trustees other than the Interested Trustees) may be sent to Fidelity Investments, P.O. Box 55235, Boston, Massachusetts 02205-5235.
Name, Age; Principal Occupation |
Dennis J. Dirks (60) |
| Year of Election or Appointment: 2005 Prior to his retirement in May 2003, Mr. Dirks was Chief Operating Officer and a member of the Board of The Depository Trust & Clearing Corporation (DTCC) (1999-2003). He also served as President, Chief Operating Officer, and Board member of The Depository Trust Company (DTC) (1999-2003) and President and Board member of the National Securities Clearing Corporation (NSCC) (1999-2003). In addition, Mr. Dirks served as a Trustee and a member of the Finance Committee of Manhattan College (2005-2008), and as Chief Executive Officer and Board member of the Government Securities Clearing Corporation (2001-2003) and Chief Executive Officer and Board member of the Mortgage-Backed Securities Clearing Corporation (2001-2003). Mr. Dirks also serves as a Trustee and a member of the Finance Committee of AHRC of Nassau County (2006-present). |
Alan J. Lacy (55) |
| Year of Election or Appointment: 2008 Mr. Lacy serves as Senior Adviser (2007-present) of Oak Hill Capital Partners, L.P. (a private equity firm). Mr. Lacy also served as Chief Executive Officer (2000-2005) and Vice Chairman (2005-2006) of Sears Holdings Corporation and Sears, Roebuck and Co. (retail). In addition, Mr. Lacy serves as a member of the Board of Directors of The Western Union Company (global money transfer, 2006-present) and Bristol-Myers Squibb (global pharmaceuticals, 2007-present). Mr. Lacy is a Trustee of the National Parks Conservation Association and The Field Museum of Natural History. |
Ned C. Lautenbach (64) |
| Year of Election or Appointment: 2000 Mr. Lautenbach is Chairman of the Independent Trustees (2006-present). Mr. Lautenbach is an Advisory Partner of Clayton, Dubilier & Rice, Inc. (private equity investment firm). Previously, Mr. Lautenbach was with the International Business Machines Corporation (IBM) from 1968 until his retirement in 1998. Mr. Lautenbach serves as a Director of Eaton Corporation (diversified industrial) as well as the Philharmonic Center for the Arts in Naples, Florida. He also is a member of the Board of Trustees of Fairfield University (2005-present), as well as a member of the Council on Foreign Relations. Previously, Mr. Lautenbach served as a Director of Sony Corporation (2006-2007). |
Joseph Mauriello (64) |
| Year of Election or Appointment: 2008 Prior to his retirement in January 2006, Mr. Mauriello served in numerous senior management positions including Deputy Chairman and Chief Operating Officer (2004-2005), and Vice Chairman of Financial Services (2002-2004) of KPMG LLP US (professional services firm, 1965-
2005). Mr. Mauriello currently serves as a member of the Board of Directors of XL Capital Ltd. (global insurance and re-insurance company, 2006-present) and of Arcadia Resources Inc. (health care services and products, 2007-present). He also served as a Director of the Hamilton Funds of the Bank of New York (2006-2007). |
Cornelia M. Small (64) |
| Year of Election or Appointment: 2005 Ms. Small is a member of the Investment Committee, and Chair (2008-present) and a member of the Board of Trustees of Smith College. Ms. Small also serves on the Investment Committee of the Berkshire Taconic Community Foundation (2008-present). Previously, Ms. Small served as Chairperson of the Investment Committee (2002-2008) of Smith College and as Co-Chair (2000-2003) of the Annual Fund for the Fletcher School of Law and Diplomacy. In addition, she served as Chief Investment Officer, Director of Global Equity Investments, and a member of the Board of Directors of Scudder, Stevens & Clark and Scudder Kemper Investments. |
William S. Stavropoulos (69) |
| Year of Election or Appointment: 2001 Mr. Stavropoulos is Chairman Emeritus of the Board of Directors of The Dow Chemical Company, where he previously served in numerous senior management positions, including President (1993-2000; 2002-
2003), CEO (1995-2000; 2002-2004), Chairman of the Executive Committee (2000-2006), and as a member of the Board of Directors (1990-2006). Currently, he is a Director of Teradata Corporation (data warehousing and technology solutions, 2008-present), Chemical Financial Corporation, Maersk Inc. (industrial conglomerate), Tyco International, Inc. (multinational manufacturing and services, 2007-present), and a member of the Advisory Board for Metalmark Capital (private equity investment firm, 2005-present). He is a special advisor to Clayton, Dubilier & Rice, Inc. (private equity investment). In addition, Mr. Stavropoulos is a member of the University of Notre Dame Advisory Council for the College of Science. |
David M. Thomas (59) |
| Year of Election or Appointment: 2008 Previously, Mr. Thomas served as Executive Chairman (2005-2006) and Chairman and Chief Executive Officer (2000-2005) of IMS Health, Inc. (pharmaceutical and healthcare information solutions). In addition, Mr. Thomas serves as a member of the Board of Directors of Fortune Brands, Inc. (consumer products holding company), and Interpublic Group of Companies, Inc. (marketing communication, 2004-present). |
Michael E. Wiley (58) |
| Year of Election or Appointment: 2008 Mr. Wiley also serves as a member of the Board of Trustees of the University of Tulsa (2000-2006; 2007-present). He serves as a Director of Tesoro Corporation (independent oil refiner and marketer, 2005-
present), and a Director of Bill Barrett Corporation (exploration and production company, 2005-present). In addition, he also serves as a Director of Post Oak Bank (privately-held bank, 2004-present). Previously, Mr. Wiley served as a Sr. Energy Advisor of Katzenbach Partners, LLC (consulting firm, 2006-2007), as an Advisory Director of Riverstone Holdings (private investment firm), Chairman, President, and CEO of Baker Hughes, Inc. (oilfield services company, 2000-2004), and as Director of Spinnaker Exploration Company (exploration and production company, 2001-2005). |
Advisory Board Member and Executive Officers**:
Correspondence intended for each executive officer and Mr. Lynch may be sent to Fidelity Investments, 82 Devonshire Street, Boston, Massachusetts 02109.
Name, Age; Principal Occupation |
Peter S. Lynch (64) |
| Year of Election or Appointment: 2003 Member of the Advisory Board of Fidelity's Equity and High Income Funds. Mr. Lynch is Vice Chairman and a Director of FMR, and Vice Chairman (2001-present) and a Director of FMR Co., Inc. Previously, Mr. Lynch served as a Trustee of the Fidelity funds (1990-2003). In addition, he serves as a Trustee of Boston College and as the Chairman of the Inner-City Scholarship Fund. Previously, Mr. Lynch served on the Special Olympics International Board of Directors (1997-2006). |
Kenneth B. Robins (39) |
| Year of Election or Appointment: 2008 President and Treasurer of Fidelity's Equity and High Income Funds. Mr. Robins is an employee of Fidelity Investments (2004-present). Before joining Fidelity Investments, Mr. Robins worked at KPMG LLP, where he was a partner in KPMG's department of professional practice (2002-2004). |
Walter C. Donovan (46) |
| Year of Election or Appointment: 2007 Vice President of Fidelity's Equity Funds. Mr. Donovan also serves as President of FMR and FMR Co., Inc., and Executive Vice President of Fidelity Investments Money Management, Inc. (2007-present). Previously, Mr. Donovan served as Executive Vice President of FMR and FMR Co., Inc. (2005-2007) and Senior Vice President of FMR (2003-2005) and FMR Co., Inc. (2004-2005). |
Eric M. Wetlaufer (46) |
| Year of Election or Appointment: 2006 Vice President of Fidelity's International Equity Funds. Mr. Wetlaufer also serves as Group Chief Investment Officer of FMR. Mr. Wetlaufer is Chairman, Chief Executive Officer, and President of Fidelity Management & Research (Hong Kong) Limited (2008-present); Chairman, Chief Executive Officer, President, and a Director of Fidelity Management & Research (Japan) Inc. (2008-present); Chairman and Chief Executive Officer (2007-present) and President and a Director (2006-present) of Fidelity Management & Research (U.K.) Inc. and President and a Director of Fidelity Research & Analysis Company (2006-present). Before joining Fidelity Investments in 2005, Mr. Wetlaufer was a partner in Oxhead Capital Management (2004-2005) and a Chief Investment Officer of Putnam Investments (1997-2003). |
Scott C. Goebel (40) |
| Year of Election or Appointment: 2008 Secretary and Chief Legal Officer (CLO) of the Fidelity funds. Mr. Goebel also serves as General Counsel, Secretary, and Senior Vice President of FMR (2008-present); Deputy General Counsel of FMR LLC; Chief Legal Secretary of Fidelity Management & Research (Hong Kong) Limited (2008-present) and Assistant Secretary of Fidelity Management & Research (Japan) Inc. (2008-present). Previously, Mr. Goebel served as Assistant Secretary of the Funds (2007-2008) and as Vice President and Secretary of Fidelity Distributors Corporation (FDC) (2005-2007). |
John B. McGinty, Jr. (46) |
| Year of Election or Appointment: 2008 Assistant Secretary of Fidelity's Equity and High Income Funds. Mr. McGinty is an employee of Fidelity Investments (2004-present). Mr. McGinty also serves as Senior Vice President, Secretary, and Chief Legal Officer of FDC (2007-present). Before joining Fidelity Investments, Mr. McGinty practiced law at Ropes & Gray, LLP. |
Holly C. Laurent (54) |
| Year of Election or Appointment: 2008 Anti-Money Laundering (AML) Officer of the Fidelity funds. Ms. Laurent is an employee of Fidelity Investments. Previously, Ms. Laurent was Senior Vice President and Head of Legal for Fidelity Business Services India Pvt. Ltd. (2006-2008), Senior Vice President, Deputy General Counsel and Group Head for FMR LLC (2005-2006). |
Christine Reynolds (50) |
| Year of Election or Appointment: 2008 Chief Financial Officer of the Fidelity funds. Ms. Reynolds became President of Fidelity Pricing and Cash Management Services (FPCMS) in August 2008. She served as Chief Operating Officer of FPCMS from 2007 through July 2008. Previously, Ms. Reynolds served as President, Treasurer, and Anti-Money Laundering officer of the Fidelity funds (2004-
2007). Before joining Fidelity Investments, Ms. Reynolds worked at PricewaterhouseCoopers LLP (PwC) (1980-2002), where she was an audit partner with PwC's investment management practice. |
Kenneth A. Rathgeber (61) |
| Year of Election or Appointment: 2004 Chief Compliance Officer of Fidelity's Equity and High Income Funds. Mr. Rathgeber is Chief Compliance Officer of Fidelity Management & Research (Hong Kong) Limited (2008-present), Fidelity Management & Research (Japan) Inc. (2008-present), FMR (2005-present), FMR Co., Inc. (2005-present), Fidelity Management & Research (U.K.) Inc. (2005-
present), Fidelity Research & Analysis Company (2005-present), Fidelity Investments Money Management, Inc. (2005-present), and Strategic Advisers, Inc. (2005-present). |
Bryan A. Mehrmann (47) |
| Year of Election or Appointment: 2005 Deputy Treasurer of the Fidelity funds. Mr. Mehrmann is an employee of Fidelity Investments. Previously, Mr. Mehrmann served as Vice President of Fidelity Investments Institutional Services Group (FIIS)/Fidelity Investments Institutional Operations Corporation, Inc. (FIIOC) Client Services (1998-2004). |
Adrien E. Deberghes (41) |
| Year of Election or Appointment: 2008 Deputy Treasurer of Fidelity's Equity and High Income Funds. Mr. Deberghes is an employee of Fidelity Investments (2008-present). Previously, Mr. Deberghes served as Senior Vice President of Mutual Fund Administration at State Street Corporation (2007-2008), Senior Director of Mutual Fund Administration at Investors Bank & Trust (2005-2007), and Director of Finance for Dunkin' Brands (2000-2005). |
Robert G. Byrnes (41) |
| Year of Election or Appointment: 2005 Assistant Treasurer of the Fidelity funds. Mr. Byrnes is an employee of Fidelity Investments (2005-present). Previously, Mr. Byrnes served as Vice President of Fidelity Pricing and Cash Management Services (FPCMS) (2003-2005). Before joining Fidelity Investments, Mr. Byrnes worked at Deutsche Asset Management where he served as Vice President of the Investment Operations Group (2000-2003). |
Peter L. Lydecker (54) |
| Year of Election or Appointment: 2004 Assistant Treasurer of the Fidelity funds. Mr. Lydecker is an employee of Fidelity Investments. |
Paul M. Murphy (61) |
| Year of Election or Appointment: 2007 Assistant Treasurer of the Fidelity funds. Mr. Murphy is an employee of Fidelity Investments (2007-present). Previously, Mr. Murphy served as Chief Financial Officer of the Fidelity Funds (2005-2006), Vice President and Associate General Counsel of FMR (2007), and Senior Vice President of Fidelity Pricing and Cash Management Services (FPCMS) (1994-2007). |
Gary W. Ryan (50) |
| Year of Election or Appointment: 2005 Assistant Treasurer of the Fidelity funds. Mr. Ryan is an employee of Fidelity Investments. Previously, Mr. Ryan served as Vice President of Fund Reporting in Fidelity Pricing and Cash Management Services (FPCMS) (1999-2005). |
** FMR Corp. merged with and into FMR LLC on October 1, 2007. Any references to FMR LLC for prior periods are deemed to be references to the prior entity.
Annual Report
Institutional Class designates 83% of the dividend distributed during the fiscal year as amounts which may be taken into account as a dividend for purposes of the maximum rate under section 1(h)(11) of the Internal Revenue Code.
The amounts per share which represent income derived from sources within, and taxes paid to, foreign countries or possessions of the United States are as follows:
| Pay Date | Income | Taxes |
Institutional Class | 12/10/07 | $0.439 | $0.0646 |
The fund will notify shareholders in January 2009 of amounts for use in preparing 2008 income tax returns.
Annual Report
A special meeting of the fund's shareholders was held on April 16, 2008. The results of votes taken among shareholders on the proposals before them are reported below. Each vote reported represents one dollar of net asset value held on the record date for the meeting.
PROPOSAL 1 |
To elect a Board of Trustees.A |
| # of
Votes | % of
Votes |
James C. Curvey |
Affirmative | 44,485,656,811.55 | 94.702 |
Withheld | 2,488,551,854.62 | 5.298 |
TOTAL | 46,974,208,666.17 | 100.000 |
Dennis J. Dirks |
Affirmative | 44,706,671,638.31 | 95.173 |
Withheld | 2,267,537,027.86 | 4.827 |
TOTAL | 46,974,208,666.17 | 100.000 |
Edward C. Johnson 3d |
Affirmative | 44,294,881,638.16 | 94.296 |
Withheld | 2,679,327,028.01 | 5.704 |
TOTAL | 46,974,208,666.17 | 100.000 |
Alan J. Lacy |
Affirmative | 44,685,373,413.16 | 95.127 |
Withheld | 2,288,835,253.01 | 4.873 |
TOTAL | 46,974,208,666.17 | 100.000 |
Ned C. Lautenbach |
Affirmative | 44,634,541,379.41 | 95.019 |
Withheld | 2,339,667,286.76 | 4.981 |
TOTAL | 46,974,208,666.17 | 100.000 |
Joseph Mauriello |
Affirmative | 44,683,962,099.80 | 95.124 |
Withheld | 2,290,246,566.37 | 4.876 |
TOTAL | 46,974,208,666.17 | 100.000 |
Cornelia M. Small |
Affirmative | 44,671,688,375.36 | 95.098 |
Withheld | 2,302,520,290.81 | 4.902 |
TOTAL | 46,974,208,666.17 | 100.000 |
| # of
Votes | % of
Votes |
William S. Stavropoulos |
Affirmative | 44,465,262,087.61 | 94.659 |
Withheld | 2,508,946,578.56 | 5.341 |
TOTAL | 46,974,208,666.17 | 100.000 |
David M. Thomas |
Affirmative | 44,694,340,813.87 | 95.147 |
Withheld | 2,279,867,852.30 | 4.853 |
TOTAL | 46,974,208,666.17 | 100.000 |
Michael E. Wiley |
Affirmative | 44,686,513,174.78 | 95.130 |
Withheld | 2,287,695,491.39 | 4.870 |
TOTAL | 46,974,208,666.17 | 100.000 |
PROPOSAL 5 |
Shareholder proposal concerning "oversight procedures to screen out investments in companies that, in the judgement of the Board, substantially contribute to genocide, patterns of extraordinary and egregious violations of human rights, or crimes against humanity." |
| # of
Votes | % of
Votes |
Affirmative | 1,337,480,153.27 | 21.306 |
Against | 4,280,655,741.12 | 68.193 |
Abstain | 268,134,649.82 | 4.271 |
Broker
Non-Votes | 391,079,068.84 | 6.230 |
TOTAL | 6,277,349,613.05 | 100.000 |
A Denotes trust-wide proposal and voting results.
Annual Report
Proxy Voting Results
A special meeting of the fund's shareholders was held on December 13, 2007. The results of votes taken among shareholders on the proposals before them are reported below. Each vote reported represents one dollar of net asset value held on the record date for the meeting.
PROPOSAL 1 |
To amend the Declaration of Trust to reduce the required quorum for shareholder meetings.A |
| # of
Votes | % of
Votes |
Affirmative | 45,014,793,255.82 | 80.372 |
Against | 6,871,112,667.08 | 12.268 |
Abstain | 2,163,456,438.02 | 3.863 |
Broker
Non-Votes | 1,958,633,563.89 | 3.497 |
TOTAL | 56,007,995,924.81 | 100.000 |
PROPOSAL 2 |
To elect the nominees specified below as Trustees.A |
| # of
Votes | % of
Votes |
James C. Curvey |
Affirmative | 53,384,952,361.03 | 95.317 |
Withheld | 2,623,043,563.78 | 4.683 |
TOTAL | 56,007,995,924.81 | 100.000 |
Dennis J. Dirks |
Affirmative | 53,595,104,608.67 | 95.692 |
Withheld | 2,412,891,316.14 | 4.308 |
TOTAL | 56,007,995,924.81 | 100.000 |
Albert R. Gamper, Jr. |
Affirmative | 53,570,235,221.69 | 95.647 |
Withheld | 2,437,760,703.12 | 4.353 |
TOTAL | 56,007,995,924.81 | 100.000 |
George H. Heilmeier |
Affirmative | 53,166,350,588.50 | 94.926 |
Withheld | 2,841,645,336.31 | 5.074 |
TOTAL | 56,007,995,924.81 | 100.000 |
| # of
Votes | % of
Votes |
Edward C. Johnson 3d |
Affirmative | 53,230,508,654.93 | 95.041 |
Withheld | 2,777,487,269.88 | 4.959 |
TOTAL | 56,007,995,924.81 | 100.000 |
James H. Keyes |
Affirmative | 53,549,161,456.52 | 95.610 |
Withheld | 2,458,834,468.29 | 4.390 |
TOTAL | 56,007,995,924.81 | 100.000 |
Marie L. Knowles |
Affirmative | 53,543,925,066.86 | 95.601 |
Withheld | 2,464,070,857.95 | 4.399 |
TOTAL | 56,007,995,924.81 | 100.000 |
Ned C. Lautenbach |
Affirmative | 53,547,116,322.50 | 95.606 |
Withheld | 2,460,879,602.31 | 4.394 |
TOTAL | 56,007,995,924.81 | 100.000 |
Cornelia M. Small |
Affirmative | 53,564,793,514.25 | 95.638 |
Withheld | 2,443,202,410.56 | 4.362 |
TOTAL | 56,007,995,924.81 | 100.000 |
William S. Stavropoulos |
Affirmative | 53,426,544,502.76 | 95.391 |
Withheld | 2,581,451,422.05 | 4.609 |
TOTAL | 56,007,995,924.81 | 100.000 |
Kenneth L. Wolfe |
Affirmative | 53,229,881,790.63 | 95.040 |
Withheld | 2,778,114,134.18 | 4.960 |
TOTAL | 56,007,995,924.81 | 100.000 |
A Denotes trust-wide proposal and voting results.
Annual Report
Board Approval of Investment Advisory Contracts and Management Fees
Fidelity International Discovery Fund
Each year, typically in July, the Board of Trustees, including the Independent Trustees (together, the Board), votes on the renewal of the management contract and sub-advisory agreements (together, the Advisory Contracts) for the fund. The Board, assisted by the advice of fund counsel and Independent Trustees' counsel, requests and considers a broad range of information throughout the year.
The Board meets regularly and, acting directly and through its separate committees, requests and receives information concerning, and considers at each of its meetings factors that are relevant to, its annual consideration of the renewal of the fund's Advisory Contracts, including the services and support provided to the fund and its shareholders. At the time of the renewal, the Board had 12 standing committees, each composed of Independent Trustees with varying backgrounds, to which the Board has assigned specific subject matter responsibilities in order to enhance effective decision-making by the Board. Each committee has a written charter outlining the structure and purposes of the committee. The Board also meets as needed to consider matters specifically related to the Board's annual consideration of the renewal of Advisory Contracts.
At its July 2008 meeting, the Board of Trustees, including the Independent Trustees, unanimously determined to renew the fund's Advisory Contracts. In reaching its determination, the Board considered all factors it believed relevant, including (i) the nature, extent, and quality of the services to be provided to the fund and its shareholders (including the investment performance of the fund); (ii) the competitiveness of the fund's management fee and total expenses; (iii) the total costs of the services to be provided by and the profits to be realized by Fidelity from its relationship with the fund; (iv) the extent to which economies of scale would be realized as the fund grows; and (v) whether fee levels reflect these economies of scale, if any, for the benefit of fund shareholders. The Board also approved agreements with foreign sub-advisers Fidelity Management & Research (Japan) Inc. and Fidelity Management & Research (Hong Kong) Limited, as well as amendments to the fund's agreement with Fidelity Management & Research (U.K.) Inc.
In considering whether to renew the Advisory Contracts for the fund, the Board ultimately reached a determination, with the assistance of fund counsel and Independent Trustees' counsel and through the exercise of its business judgment, that the renewal of the Advisory Contracts and the compensation to be received by Fidelity under the management contract is consistent with Fidelity's fiduciary duty under applicable law. The Board's decision to renew the Advisory Contracts was not based on any single factor noted above, but rather was based on a comprehensive consideration of all the information provided to the Board at its meetings throughout the year. The Board, in reaching its determination to renew the Advisory Contracts, is aware that shareholders in the fund have a broad range of investment choices available to them, including a wide choice among mutual funds offered by competitors to Fidelity, and that the fund's shareholders, with the opportunity to review and weigh the disclosure provided by the fund in its prospectus and other public disclosures, have chosen to invest in this fund, managed by Fidelity.
Annual Report
Board Approval of Investment Advisory Contracts and
Management Fees - continued
Nature, Extent, and Quality of Services Provided. The Board considered staffing within the investment adviser, FMR, and the sub-advisers (together, the Investment Advisers), including the backgrounds of the fund's investment personnel and the fund's investment objective and discipline. The Independent Trustees also had discussions with senior management of Fidelity's investment operations and investment groups. The Board considered the structure of the portfolio manager compensation program and whether this structure provides appropriate incentives.
Resources Dedicated to Investment Management and Support Services. The Board reviewed the size, education, and experience of the Investment Advisers' investment staff, their use of technology, and the Investment Advisers' approach to recruiting, training, and retaining portfolio managers and other research, advisory, and management personnel. The Board noted that Fidelity's analysts have access to a variety of technological tools that enable them to perform both fundamental and quantitative analysis and to specialize in various disciplines. The Board considered Fidelity's extensive global research capabilities that enable the Investment Advisers to aggregate data from various sources in an effort to produce positive investment results. The Board also considered that Fidelity's portfolio managers and analysts have access to daily portfolio attribution that allows for monitoring of a fund's portfolio, as well as an electronic communication system that provides immediate real-time access to research concerning issuers and credit enhancers.
Shareholder and Administrative Services. The Board considered (i) the nature, extent, quality, and cost of advisory, administrative, distribution, and shareholder services performed by the Investment Advisers and their affiliates under the Advisory Contracts and under separate agreements covering transfer agency, pricing and bookkeeping, and securities lending services for the fund; (ii) the nature and extent of the Investment Advisers' supervision of third party service providers, principally custodians and subcustodians; and (iii) the resources devoted to, and the record of compliance with, the fund's compliance policies and procedures. The Board also reviewed the allocation of fund brokerage, including allocations to brokers affiliated with the Investment Advisers, the use of brokerage commissions to pay fund expenses, and the use of "soft" commission dollars to pay for research services. The Board further considered that Fidelity voluntarily pays for market data out of its own resources.
The Board noted that the growth of fund assets across the complex allows Fidelity to reinvest in the development of services designed to enhance the value or convenience of the Fidelity funds as investment vehicles. These services include 24-hour access to account information and market information through phone representatives and over the Internet, and investor education materials and asset allocation tools.
Annual Report
Investment in a Large Fund Family. The Board considered the benefits to shareholders of investing in a Fidelity fund, including the benefits of investing in a fund that is part of a large family of funds offering a variety of investment disciplines and providing for a large variety of mutual fund investor services. For example, fund shareholders are offered the privilege of exchanging shares of the fund for shares of other Fidelity funds, as set forth in the fund's prospectus, without paying a sales charge. The Board noted that Fidelity has taken a number of actions over the previous year that benefited particular funds, including (i) dedicating additional resources to investment research and to restructure the investment research teams; (ii) contractually agreeing to reduce the management fees on Fidelity's Institutional Money Market Funds and launching Class IV and Institutional Class of certain of these funds; (iii) reducing the transfer agent fees for the Fidelity Select Portfolios and Investor Class of the VIP funds; and (iv) launching Class K of 29 equity funds as a lower-fee class available to certain employer-sponsored retirement plans.
Investment Performance. The Board considered whether the fund has operated within its investment objective, as well as its record of compliance with its investment restrictions. It also reviewed the fund's absolute investment performance for each class, as well as the fund's relative investment performance for each class measured against (i) a broad-based securities market index, and (ii) a peer group of mutual funds deemed appropriate by the Board over multiple periods. The following charts considered by the Board show, over the one-, three-, and five-year periods ended December 31, 2007, as available, the cumulative total returns of Fidelity International Discovery (retail class) and Class B of the fund, the cumulative total returns of a broad-based securities market index ("benchmark"), and a range of cumulative total returns of a peer group of mutual funds identified by Morningstar, Inc. as having an investment style similar to that of the fund based on underlying portfolio holdings. The returns of Fidelity International Discovery (retail class) and Class B show the performance of the highest and lowest performing classes, respectively. (The fund did not offer Class K as of December 31, 2007.) The box within each chart shows the 25th percentile return (bottom of box) and the 75th percentile return (top of box) of the peer group. Returns shown above the box are in the first quartile and returns shown below the box are in the fourth quartile. The percentage beaten numbers noted below each chart correspond to the percentile box and represent the percentage of funds in the peer group whose performance was equal to or lower than that of the class indicated.
Annual Report
Board Approval of Investment Advisory Contracts and
Management Fees - continued
Fidelity International Discovery Fund

The Board reviewed the fund's relative investment performance against its peer group and stated that the performance of Fidelity International Discovery (retail class) of the fund was in the first quartile for all the periods shown. The Board also stated that the investment performance of Fidelity International Discovery (retail class) of the fund compared favorably to its benchmark for all the periods shown. The Board considered that the variations in performance among the fund's classes reflect the variations in class expenses, which result in lower performance for higher expense classes.
The Board also considered that the fund's management fee is subject to upward or downward adjustment depending upon whether, and to what extent, the fund's investment performance for the performance period exceeds, or is exceeded by, the record (over the same period) of a Board-approved performance adjustment index. The Board realizes that the performance adjustment provides FMR with a strong economic incentive to seek to achieve superior performance for the fund's shareholders and helps to more closely align the interests of FMR and the fund's shareholders.
The Board considered that FMR has taken steps to refocus and strengthen equity research, equity portfolio management, and compliance.
Based on its review, and giving particular weight to the nature and quality of the resources dedicated by the Investment Advisers to maintain and improve relative performance, the Board concluded that the nature, extent, and quality of the services provided to the fund will benefit the fund's shareholders, particularly in light of the Board's view that the fund's shareholders benefit from investing in a fund that is part of a large family of funds offering a variety of investment disciplines and services.
Annual Report
Competitiveness of Management Fee and Total Fund Expenses. The Board considered the fund's management fee and total expenses compared to "mapped groups" of competitive funds and classes. Fidelity creates "mapped groups" by combining similar Lipper investment objective categories that have comparable management fee characteristics. Combining Lipper investment objective categories aids the Board's management fee and total expense comparisons by broadening the competitive group used for comparison and by reducing the number of universes to which various Fidelity funds are compared. The Board also considered supplemental information about how the fund's management fee and total expenses ranked relative to groups based on Lipper classifications, which take into account a fund's market capitalization and style.
The Board considered two proprietary management fee comparisons for the 12-month periods shown in the chart below. The group of Lipper funds used by the Board for management fee comparisons is referred to below as the "Total Mapped Group." The Total Mapped Group comparison focuses on a fund's standing relative to the total universe of comparable funds available to investors, in terms of gross management fees before expense reimbursements or caps, and without giving effect to the fund's performance adjustment. "TMG %" represents the percentage of funds in the Total Mapped Group that had management fees that were lower than the fund's. For example, a TMG% of 14% means that 86% of the funds in the Total Mapped Group had higher management fees than the fund. The "Asset-Size Peer Group" (ASPG) comparison focuses on a fund's standing relative to non-Fidelity funds similar in size to the fund within the Total Mapped Group. The ASPG represents at least 15% of the funds in the Total Mapped Group with comparable asset size and management fee characteristics, subject to a minimum of 50 funds (or all funds in the Total Mapped Group if fewer than 50). Additional information, such as the ASPG quartile in which the fund's management fee ranked and the impact of the fund's performance adjustment, is also included in the chart and considered by the Board.
Annual Report
Board Approval of Investment Advisory Contracts and
Management Fees - continued
Fidelity International Discovery Fund

The Board noted that the fund's management fee ranked below the median of its Total Mapped Group and below the median of its ASPG for 2007. The Board also noted the effect of the fund's positive performance adjustment on the fund's management fee ranking. The Board noted that the performance adjustment for each year represents calculations for performance periods that differ from the periods shown in the performance charts above.
Based on its review, the Board concluded that the fund's management fee was fair and reasonable in light of the services that the fund receives and the other factors considered.
In its review of each class's total expenses, the Board considered the fund's management fee as well as other fund or class expenses, as applicable, such as transfer agent fees, pricing and bookkeeping fees, fund-paid 12b-1 fees, and custodial, legal, and audit fees. The Board also noted the effects of any waivers and reimbursements on fees and expenses, as well as the impact of the fund's performance adjustment. As part of its review, the Board also considered current and historical total expenses of each class of the fund compared to competitive fund median expenses. Each class of the fund is compared to those funds and classes in the Total Mapped Group (used by the Board for management fee comparisons) that have a similar sales load structure.
The Board noted that the total expenses of each of Class A, Class B, Class C, Institutional Class, and Fidelity International Discovery (retail class) ranked below its competitive median for 2007, and the total expenses of Class T ranked above its competitive median for 2007. The Board considered that the total expenses for Class T were above the median primarily because its 12b-1 fee is higher than the typical front-end load class. The Board noted that the fund offers multiple classes, each of which has a different sales load and 12b-1 fee structure, and that the multiple structures are intended to offer a range of pricing options for the intermediary market. The Board also noted that the total expenses of the classes vary primarily by the level of their 12b-1 fees, although differences in transfer agent fees may also cause expenses to vary from class to class.
Annual Report
In its review of total expenses, the Board also considered Fidelity fee structures and other information on clients that FMR and its affiliates service in other competitive markets, such as other mutual funds advised or subadvised by FMR or its affiliates, pension plan clients, and other institutional clients.
Based on its review, the Board concluded that the total expenses of each class of the fund were reasonable, although in one case above the median of the universe presented for comparison, in light of the services that the fund and its shareholders receive and the other factors considered.
Costs of the Services and Profitability. The Board considered the revenues earned and the expenses incurred by Fidelity in conducting the business of developing, marketing, distributing, managing, administering and servicing the fund and its shareholders. The Board also considered the level of Fidelity's profits in respect of all the Fidelity funds.
On an annual basis, FMR presents to the Board Fidelity's profitability for the fund. Fidelity calculates the profitability for each fund, as well as aggregate profitability for groups of Fidelity funds and all Fidelity funds, using a series of detailed revenue and cost allocation methodologies which originate with the audited books and records of Fidelity. The Audit Committee of the Board reviews any significant changes from the prior year's methodologies.
PricewaterhouseCoopers LLP (PwC), independent registered public accounting firm and auditor to Fidelity and certain Fidelity funds, has been engaged annually by the Board as part of the Board's assessment of the results of Fidelity's profitability analysis. PwC's engagement includes the review and assessment of Fidelity's methodologies used in determining the revenues and expenses attributable to Fidelity's mutual fund business, and completion of agreed-upon procedures surrounding the mathematical accuracy of fund profitability and its conformity to allocation methodologies. After considering PwC's reports issued under the engagement and information provided by Fidelity, the Board believes that while other allocation methods may also be reasonable, Fidelity's profitability methodologies are reasonable in all material respects.
The Board has also reviewed Fidelity's non-fund businesses and any fall-out benefits related to the mutual fund business as well as cases where Fidelity's affiliates may benefit from or be related to the fund's business.
Annual Report
Board Approval of Investment Advisory Contracts and
Management Fees - continued
The Board considered the costs of the services provided by and the profits realized by Fidelity in connection with the operation of the fund and determined that the amount of profit is a fair entrepreneurial profit for the management of the fund.
Economies of Scale. The Board considered whether there have been economies of scale in respect of the management of the Fidelity funds, whether the Fidelity funds (including the fund) have appropriately benefited from any such economies of scale, and whether there is potential for realization of any further economies of scale. The Board considered the extent to which the fund will benefit from economies of scale through increased services to the fund, through waivers or reimbursements, or through fee or expense reductions.
The Board recognized that the fund's management contract incorporates a "group fee" structure, which provides for lower group fee rates as total fund assets under FMR's management increase, and for higher group fee rates as total fund assets under FMR's management decrease. FMR determines the group fee rates based on a tiered asset "breakpoint" schedule. The Board considered that the group fee is designed to deliver the benefits of economies of scale to fund shareholders when total fund assets increase, even if assets of any particular fund are unchanged or have declined, because some portion of Fidelity's costs are attributable to services provided to all Fidelity funds, and all funds benefit if those costs can be allocated among more assets. The Board concluded that, given the group fee structure, fund shareholders will achieve a certain level of economies of scale as assets under FMR's management increase at the fund complex level, regardless of whether Fidelity achieves any such economies of scale.
The Board further concluded that any potential economies of scale are being shared between fund shareholders and Fidelity in an appropriate manner.
Additional Information Requested by the Board. In order to develop fully the factual basis for consideration of the Fidelity funds' Advisory Contracts, the Board requested and received additional information on certain topics, including (i) fund performance trends and actions to be taken by FMR to improve certain funds' overall performance; (ii) portfolio manager changes that have occurred during the past year; (iii) Fidelity's fund profitability methodology, the profitability of certain fund service providers, and profitability trends for certain funds; (iv) Fidelity's compensation structure for portfolio managers and key personnel, including its effects on fund profitability and the extent to which portfolio manager compensation is linked to fund performance; (v) Fidelity's fee structures and rationale for recommending different fees among categories of funds; and (vi) Fidelity's rationale for recommending which funds should have a performance adjustment component as part of their management fees.
Based on its evaluation of all of the conclusions noted above, and after considering all material factors, the Board ultimately concluded that the advisory fee structures are fair and reasonable, and that the fund's Advisory Contracts should be renewed.
Annual Report
Investment Adviser
Fidelity Management & Research Company
Boston, MA
Investment Sub-Advisers
FMR Co., Inc.
Fidelity Management & Research
(U.K.) Inc.
Fidelity Research & Analysis Company
FIL Investment Advisors
Fidelity Investments Japan Limited
FIL Advisors (U.K.) Limited
Fidelity Management & Research
(Hong Kong) Limited
Fidelity Management & Research
(Japan) Inc.
General Distributor
Fidelity Distributors Corporation
Boston, MA
Transfer and Service Agents
Fidelity Investments Institutional Operations Company, Inc.
Boston, MA
Fidelity Service Company, Inc.
Boston, MA
Custodian
The Northern Trust Company
Chicago, IL
AIDI-UANN-1208
1.806657.103
Fidelity®
Total International Equity Fund
and
Fidelity
International Growth Fund
Annual Report
October 31, 2008
(2_fidelity_logos) (Registered_Trademark)
Contents
To view a fund's proxy voting guidelines and proxy voting record for the 12-month period ended June 30, visit http://www.fidelity.com (search for "proxy voting guidelines") or visit the Securities and Exchange Commission's (SEC) web site at http://www.sec.gov. You may also call 1-800-544-8544 to request a free copy of the proxy voting guidelines.
Standard & Poor's, S&P and S&P 500 are registered service marks of The McGraw-Hill Companies, Inc. and have been licensed for use by Fidelity Distributors Corporation.
Other third party marks appearing herein are the property of their respective owners.
All other marks appearing herein are registered or unregistered trademarks or service marks of FMR LLC or an affiliated company.
Annual Report
This report and the financial statements contained herein are submitted for the general information of the shareholders of the funds. This report is not authorized for distribution to prospective investors in the funds unless preceded or accompanied by an effective prospectus.
A fund files its complete schedule of portfolio holdings with the SEC for the first and third quarters of each fiscal year on Form N-Q. Forms N-Q are available on the SEC's web site at http://www.sec.gov. A fund's Forms N-Q may be reviewed and copied at the SEC's Public Reference Room in Washington, DC. Information regarding the operation of the SEC's Public Reference Room may be obtained by calling 1-800-SEC-0330. For a complete list of a fund's portfolio holdings, view the most recent holdings listing, semiannual report, or annual report on Fidelity's web site at http://www.fidelity.com or http://www.advisor.fidelity.com, as applicable.
NOT FDIC INSURED · MAY LOSE VALUE · NO BANK GUARANTEE
Neither the fund nor Fidelity Distributors Corporation is a bank.
Annual Report
(photo_of_Edward_C_Johnson_3d)
Dear Shareholder:
Turmoil has been the watchword for the world's securities markets in 2008, with domestic and international stocks down sharply amid the global credit squeeze. A flight to quality boosted returns for U.S. Treasuries, one of the few asset classes with positive results heading into the latter stages of the year. Financial markets are always unpredictable, but there are a number of time-tested principles that can put the historical odds in your favor.
One of the basic tenets is to invest for the long term. Over time, riding out the markets' inevitable ups and downs has proven much more effective than selling into panic or chasing the hottest trend. Even missing only a few of the markets' best days can significantly diminish investor returns. Patience also affords the benefits of compounding - of earning interest on additional income or reinvested dividends and capital gains. There are tax advantages and cost benefits to consider as well. The more you sell, the more taxes you pay, and the more you trade, the higher the costs. While staying the course doesn't eliminate risk, it can considerably lessen the effect of short-term declines.
You can further manage your investing risk through diversification. And today, more than ever, geographic diversification should be taken into account. Studies indicate that asset allocation is the single most important determinant of a portfolio's long-term success. The right mix of stocks, bonds and cash - aligned to your particular risk tolerance and investment objective - is very important. Age-appropriate rebalancing is also an essential aspect of asset allocation. For younger investors, an emphasis on equities - which historically have been the best-performing asset class over time - is encouraged. As investors near their specific goal, such as retirement or sending a child to college, consideration may be given to replacing volatile assets (e.g. common stocks) with more-stable fixed investments (bonds or savings plans).
A third investment principle - investing regularly - can help lower the average cost of your purchases. Investing a certain amount of money each month or quarter helps ensure you won't pay for all your shares at market highs. This strategy - known as dollar cost averaging - also reduces unconstructive "emotion" from investing, helping shareholders avoid selling weak performers just prior to an upswing, or chasing a hot performer just before a correction.
We invite you to contact us via the Internet, through our Investor Centers or over the phone. It is our privilege to provide you the information you need to make the investments that are right for you.
Sincerely,
/s/Edward C. Johnson 3d
Edward C. Johnson 3d
Annual Report
Fidelity Total International Equity Fund
Performance: The Bottom Line
Average annual total return reflects the change in the value of an investment, assuming reinvestment of the fund's dividend income and capital gains (the profits earned upon the sale of securities that have grown in value, if any) and assuming a constant rate of performance each year. The $10,000 table and the fund's returns do not reflect the deduction of taxes that a shareholder would pay on fund distributions or the redemption of fund shares. During periods of reimbursement by Fidelity, a fund's total return will be greater than it would be had the reimbursement not occurred. How a fund did yesterday is no guarantee of how it will do tomorrow.
Average annual total returns take Total International Equity's cumulative total return and show you what would have happened if Total International Equity shares had performed at a constant rate each year. These numbers will be reported once the fund is a year old.
$10,000 Over Life of Fund
Let's say hypothetically that $10,000 was invested in Total International Equity, a class of the fund, on November 1, 2007, when the fund started. The chart shows how the value of your investment would have changed, and also shows how the MSCI® ACWISM (All Country World Index) ex-USA Index performed over the same period.

Annual Report
Fidelity Total International Equity Fund
Comments from George Stairs and Jed Weiss, Co-Lead Portfolio Managers of Fidelity® Total International Equity Fund
In a dramatic reversal of what had been a multiyear global growth story, international stocks fell long and hard during the 12 months ending October 31, 2008, especially so during the latter stages of the period and mostly as a result of fallout from the financial crisis that emanated from the United States. The viral spread of this financial contagion - which began in the U.S. subprime mortgage market, then seized up the credit markets, hobbled major financial institutions and eventually slowed economic growth worldwide - left virtually no corner of the globe untouched. Developed international equity markets - as gauged by the MSCI® Europe, Australasia, Far East (EAFE®) Index, which monitors established markets outside the U.S. and Canada - fell 46.54%, while the Standard & Poor's 500SM Index, a measure of U.S. stocks, dropped 36.10%. Among countries constituting at least 1% of the EAFE index, Switzerland had the "least worst" showing, falling roughly 32%, followed by Japan, where stocks slid by around 37%. Meanwhile, the weakest overall performance came from Belgium, where stocks slipped by nearly 70%. In the United Kingdom, the largest component of the index, equities were down almost 48%. Emerging markets were the weakest performers among the global economies, declining 56.22% as measured by the MSCI Emerging Markets Index.
For the period from its inception on November 1, 2007, through October 31, 2008, the fund's Retail Class shares fell 50.87%, versus a decline of 47.98% for the MSCI All Country World ex USA Index. We underperformed mainly due to unfavorable security selection, with the greatest damage coming from our picks in financials, consumer discretionary, energy and materials, which were among the weakest sectors of the global economy. The biggest relative detractors were German automaker Volkswagen, an index component we didn't own that had an extraordinary gain late in the period; European banking companies UniCredit, based in Italy, and HBOS, headquartered in Scotland; and Petroleum Geo-Services, a Norwegian energy services firm. The fund gained back some ground versus the index due to our decision to lengthen the fund's overexposure to the more-defensive areas of the index, while creating greater underweightings in the weakest sectors. Among holdings that contributed to the fund's relative performance were such defensively oriented stocks as Roche Holding, the giant Swiss drug maker; Nestle, a multinational packaged goods company also based in Switzerland; and Osaka Gas, a Japanese natural gas utility.
The views expressed above reflect those of the portfolio manager(s) only through the end of the period as stated on the cover of this report and do not necessarily represent the views of Fidelity or any other person in the Fidelity organization. Any such views are subject to change at any time based upon market or other conditions and Fidelity disclaims any responsibility to update such views. These views may not be relied on as investment advice and, because investment decisions for a Fidelity fund are based on numerous factors, may not be relied on as an indication of trading intent on behalf of any Fidelity fund.
Annual Report
Fidelity Total International Equity Fund
Shareholder Expense Example
As a shareholder of the Fund, you incur two types of costs: (1) transaction costs, including sales charges (loads) on purchase payments or redemption proceeds, redemption fees, and (2) ongoing costs, including management fees, distribution and/or service (12b-1) fees and other Fund expenses. This Example is intended to help you understand your ongoing costs (in dollars) of investing in the Fund and to compare these costs with the ongoing costs of investing in other mutual funds.
The Example is based on an investment of $1,000 invested at the beginning of the period and held for the entire period (May 1, 2008 to October 31, 2008).
Actual Expenses
The first line of the accompanying table for each class of the Fund provides information about actual account values and actual expenses. You may use the information in this line, together with the amount you invested, to estimate the expenses that you paid over the period. Simply divide your account value by $1,000.00 (for example, an $8,600 account value divided by $1,000.00 = 8.6), then multiply the result by the number in the first line for a class of the Fund under the heading entitled "Expenses Paid During Period" to estimate the expenses you paid on your account during this period. A small balance maintenance fee of $12.00 that is charged once a year may apply for certain accounts with a value of less than $2,000. This fee is not included in the table below. If it was, the estimate of expenses you paid during the period would be higher, and your ending account value lower, by this amount. In addition, the Fund, as a shareholder in the underlying Fidelity Central Funds, will indirectly bear its pro rata share of the fees and expenses incurred by the underlying Fidelity Central Funds. These fees and expenses are not included in the Fund's annualized expense ratio used to calculate the expense estimate in the table below.
Hypothetical Example for Comparison Purposes
The second line of the accompanying table for each class of the Fund provides information about hypothetical account values and hypothetical expenses based on a Class' actual expense ratio and an assumed rate of return of 5% per year before expenses, which is not the Class' actual return. The hypothetical account values and expenses may not be used to estimate the actual ending account balance or expenses you paid for the period. You may use this information to compare the ongoing costs of investing in the Fund and other funds. To do so, compare this 5% hypothetical example with the 5% hypothetical examples that appear in the shareholder reports of the other funds. A small balance maintenance fee of $12.00 that is charged once a year may apply for certain accounts with a value of less than $2,000. This fee is not included in the table below. If it was, the estimate of expenses you paid during the period would be higher, and your ending account value lower, by this amount. In addition, the Fund, as a shareholder in the underlying Fidelity Central Funds, will indirectly bear its pro rata share of the fees and expenses incurred by the underlying Fidelity Central Funds. These fees and expenses are not included in the Fund's annualized expense ratio used to calculate the expense estimate in the table below.
Annual Report
Fidelity Total International Equity Fund
Shareholder Expense Example - continued
Please note that the expenses shown in the table are meant to highlight your ongoing costs only and do not reflect any transaction costs. Therefore, the second line of the table is useful in comparing ongoing costs only, and will not help you determine the relative total costs of owning different funds. In addition, if these transactional costs were included, your costs would have been higher.
| Annualized Expense Ratio | Beginning
Account Value
May 1, 2008 | Ending
Account Value
October 31, 2008 | Expenses Paid
During Period*
May 1, 2008
to October 31, 2008 |
Class A | 1.50% | | | |
Actual | | $ 1,000.00 | $ 539.60 | $ 5.81 |
HypotheticalA | | $ 1,000.00 | $ 1,017.60 | $ 7.61 |
Class T | 1.75% | | | |
Actual | | $ 1,000.00 | $ 538.00 | $ 6.77 |
HypotheticalA | | $ 1,000.00 | $ 1,016.34 | $ 8.87 |
Class B | 2.25% | | | |
Actual | | $ 1,000.00 | $ 537.00 | $ 8.69 |
HypotheticalA | | $ 1,000.00 | $ 1,013.83 | $ 11.39 |
Class C | 2.25% | | | |
Actual | | $ 1,000.00 | $ 537.00 | $ 8.69 |
HypotheticalA | | $ 1,000.00 | $ 1,013.83 | $ 11.39 |
Total International Equity | 1.25% | | | |
Actual | | $ 1,000.00 | $ 540.20 | $ 4.84 |
HypotheticalA | | $ 1,000.00 | $ 1,018.85 | $ 6.34 |
Institutional Class | 1.25% | | | |
Actual | | $ 1,000.00 | $ 540.20 | $ 4.84 |
HypotheticalA | | $ 1,000.00 | $ 1,018.85 | $ 6.34 |
A 5% return per year before expenses
* Expenses are equal to each Class' annualized expense ratio, multiplied by the average account value over the period, multiplied by 184/366 (to reflect the one-half year period).
Annual Report
Fidelity Total International Equity Fund
Investment Changes (Unaudited)
Geographic Diversification (% of fund's net assets) |
As of October 31, 2008 |
| Japan 14.1% |
| United Kingdom 13.8% |
| Switzerland 11.0% |
| Germany 8.7% |
| France 7.2% |
| United States of America 6.9% |
| Australia 3.6% |
| Spain 3.1% |
| Italy 2.4% |
| Other 29.2% |

Percentages are adjusted for the effect of futures contracts, if applicable. |
As of April 30, 2008 |
| United Kingdom 14.5% |
| Japan 12.8% |
| Germany 8.7% |
| France 6.7% |
| Switzerland 6.7% |
| United States of America 6.0% |
| Spain 3.6% |
| Australia 3.5% |
| Brazil 3.4% |
| Other 34.1% |

Percentages are adjusted for the effect of futures contracts, if applicable. |
Asset Allocation as of October 31, 2008 |
| % of fund's
net assets | % of fund's net assets
6 months ago |
Stocks and Investment Companies | 98.4 | 98.2 |
Short-Term Investments and Net Other Assets | 1.6 | 1.8 |
Top Ten Stocks as of October 31, 2008 |
| % of fund's
net assets | % of fund's net assets
6 months ago |
Roche Holding AG (participation certificate) (Switzerland, Pharmaceuticals) | 3.5 | 2.0 |
Nestle SA (Reg.) (Switzerland, Food Products) | 3.4 | 1.9 |
E.ON AG (Germany, Electric Utilities) | 2.8 | 2.1 |
Royal Dutch Shell PLC Class A sponsored ADR (United Kingdom, Oil, Gas & Consumable Fuels) | 2.1 | 1.3 |
Toyota Motor Corp. (Japan, Automobiles) | 1.7 | 1.3 |
Telefonica SA sponsored ADR (Spain, Diversified Telecommunication Services) | 1.4 | 1.1 |
Novartis AG sponsored ADR (Switzerland, Pharmaceuticals) | 1.4 | 0.0 |
CSL Ltd. (Australia, Biotechnology) | 1.4 | 0.9 |
Muenchener Rueckversicherungs-Gesellschaft AG (Reg.) (Germany, Insurance) | 1.4 | 0.9 |
BAE Systems PLC (United Kingdom, Aerospace & Defense) | 1.3 | 0.8 |
| 20.4 | |
Market Sectors as of October 31, 2008 |
| % of fund's
net assets | % of fund's net assets
6 months ago |
Financials | 22.9 | 22.2 |
Consumer Staples | 12.9 | 9.2 |
Energy | 10.1 | 10.8 |
Health Care | 9.8 | 5.0 |
Industrials | 8.5 | 11.1 |
Information Technology | 7.9 | 10.4 |
Materials | 7.0 | 11.0 |
Telecommunication Services | 6.7 | 5.7 |
Consumer Discretionary | 6.6 | 7.1 |
Utilities | 6.0 | 5.1 |
Annual Report
Fidelity Total International Equity Fund
Investments October 31, 2008
Showing Percentage of Net Assets
Common Stocks - 97.9% |
| Shares | | Value |
Australia - 3.6% |
AMP Ltd. | 40,791 | | $ 148,301 |
CSL Ltd. | 22,484 | | 546,518 |
Macquarie Airports unit | 50,093 | | 71,204 |
Macquarie Group Ltd. | 3,701 | | 73,386 |
Macquarie Infrastructure Group unit | 69,883 | | 91,550 |
QBE Insurance Group Ltd. | 4,764 | | 81,236 |
Silex Systems Ltd. (a) | 10,000 | | 26,037 |
Sino Gold Mining Ltd. (a) | 4,504 | | 10,369 |
Woolworths Ltd. | 21,457 | | 399,784 |
TOTAL AUSTRALIA | | 1,448,385 |
Bahrain - 0.0% |
Gulf Finance House BSC GDR (b) | 400 | | 6,800 |
Belgium - 0.4% |
InBev SA | 3,600 | | 145,199 |
Bermuda - 0.5% |
China Solar Energy Holding Ltd. (a) | 140,000 | | 829 |
ChipMOS TECHNOLOGIES (Bermuda) Ltd. (a) | 6,000 | | 3,066 |
Credicorp Ltd. (NY Shares) | 500 | | 19,635 |
Global Digital Creations Holdings Ltd. (a) | 64,000 | | 734 |
Ports Design Ltd. | 47,500 | | 55,222 |
Seadrill Ltd. | 13,600 | | 130,941 |
West Siberian Resources Ltd. SDR (a) | 14,000 | | 5,661 |
TOTAL BERMUDA | | 216,088 |
Brazil - 2.3% |
America Latina Logistica SA unit | 3,700 | | 17,062 |
Anhanguera Educacional Participacoes SA unit | 1,418 | | 10,483 |
Banco Bradesco SA: | | | |
(PN) | 6,000 | | 68,894 |
(PN) sponsored ADR | 1,100 | | 12,870 |
Banco Daycoval SA (PN) | 5,400 | | 13,474 |
BM&F BOVESPA SA | 7,000 | | 18,598 |
Companhia Siderurgica Nacional SA (CSN) sponsored ADR | 1,300 | | 17,680 |
Companhia Vale do Rio Doce sponsored ADR | 9,800 | | 128,576 |
GVT Holding SA (a) | 900 | | 9,793 |
Medial Saude SA | 700 | | 2,199 |
MRV Engenharia e Participacoes SA | 1,300 | | 6,734 |
Net Servicos de Comunicacao SA sponsored ADR | 2,400 | | 15,696 |
Petroleo Brasileiro SA - Petrobras: | | | |
(PN) sponsored ADR (non-vtg.) | 3,100 | | 68,417 |
sponsored ADR | 12,500 | | 336,125 |
Common Stocks - continued |
| Shares | | Value |
Brazil - continued |
Redecard SA | 1,000 | | $ 10,863 |
Tele Norte Leste Participacoes SA sponsored ADR (non-vtg.) | 1,200 | | 16,296 |
Uniao de Bancos Brasileiros SA (Unibanco) GDR | 2,600 | | 164,008 |
Votorantim Celulose e Papel SA sponsored ADR (non-vtg.) | 700 | | 7,063 |
TOTAL BRAZIL | | 924,831 |
Canada - 1.7% |
Addax Petroleum, Inc. | 500 | | 7,464 |
Agnico-Eagle Mines Ltd. | 3,700 | | 102,058 |
Canadian Natural Resources Ltd. | 900 | | 45,396 |
First Quantum Minerals Ltd. | 3,700 | | 77,940 |
Goldcorp, Inc. | 8,100 | | 151,413 |
Harry Winston Diamond Corp. | 4,200 | | 40,927 |
Nexen, Inc. | 3,200 | | 50,794 |
Petrobank Energy & Resources Ltd. (a) | 3,700 | | 70,576 |
Potash Corp. of Saskatchewan, Inc. | 800 | | 68,208 |
Sino-Forest Corp. (a) | 700 | | 6,548 |
SouthGobi Energy Resources Ltd. (a) | 800 | | 5,573 |
Timminco Ltd. (a) | 10,000 | | 56,394 |
TOTAL CANADA | | 683,291 |
Cayman Islands - 2.0% |
AAC Acoustic Technology Holdings, Inc. (a) | 14,000 | | 7,299 |
AirMedia Group, Inc. ADR | 100 | | 588 |
Chaoda Modern Agriculture (Holdings) Ltd. | 188,900 | | 133,084 |
China Digital TV Holding Co. Ltd. ADR | 1,300 | | 7,787 |
China Dongxiang Group Co. Ltd. | 126,000 | | 37,068 |
China High Speed Transmission Equipment Group Co. Ltd. | 50,000 | | 39,638 |
Foxconn International Holdings Ltd. (a) | 23,000 | | 8,463 |
Himax Technologies, Inc. sponsored ADR | 30,300 | | 56,661 |
Intime Department Store Group Co. Ltd. | 64,000 | | 18,948 |
LDK Solar Co. Ltd. sponsored ADR (a) | 2,000 | | 36,320 |
SinoCom Software Group Ltd. | 154,000 | | 11,138 |
Subsea 7, Inc. (a) | 4,500 | | 35,770 |
The United Laboratories International Holdings Ltd. | 34,000 | | 8,071 |
Transocean, Inc. (a) | 4,420 | | 363,899 |
Xinao Gas Holdings Ltd. | 12,000 | | 10,459 |
Yingli Green Energy Holding Co. Ltd. ADR (a) | 3,900 | | 20,553 |
TOTAL CAYMAN ISLANDS | | 795,746 |
China - 1.6% |
China Communications Construction Co. Ltd. (H Shares) | 22,000 | | 15,583 |
China Construction Bank Corp. (H Shares) | 247,000 | | 122,531 |
Common Stocks - continued |
| Shares | | Value |
China - continued |
China Gas Holdings Ltd. | 104,000 | | $ 8,561 |
China Merchants Bank Co. Ltd. (H Shares) | 17,000 | | 26,045 |
China Nepstar Chain Drugstore Ltd. ADR | 100 | | 415 |
China Shenhua Energy Co. Ltd. (H Shares) | 10,500 | | 19,935 |
China South Locomotive & Rolling Stock Corp. Ltd. (H Shares) | 50,000 | | 18,101 |
China TechFaith Wireless Communication Technology Ltd. sponsored ADR (a) | 5,000 | | 4,450 |
China Yurun Food Group Ltd. | 16,000 | | 19,017 |
Dongfang Electric Corp. Ltd. | 6,000 | | 11,680 |
Focus Media Holding Ltd. ADR (a) | 2,500 | | 46,325 |
Global Bio-Chem Technology Group Co. Ltd. | 580,000 | | 80,833 |
Golden Eagle Retail Group Ltd. (H Shares) | 48,000 | | 25,096 |
Industrial & Commercial Bank of China | 189,000 | | 88,928 |
Nine Dragons Paper (Holdings) Ltd. | 118,000 | | 20,349 |
Ping An Insurance (Group) Co. of China, Ltd. (H Shares) | 6,000 | | 25,660 |
Shanda Interactive Entertainment Ltd. sponsored ADR (a) | 3,800 | | 105,070 |
ZTE Corp. (H Shares) | 3,800 | | 8,593 |
TOTAL CHINA | | 647,172 |
Cyprus - 0.2% |
Marfin Popular Bank Public Co. | 19,739 | | 66,858 |
XXI Century Investments Public Ltd. (a) | 1,000 | | 521 |
TOTAL CYPRUS | | 67,379 |
Czech Republic - 0.1% |
Ceske Energeticke Zavody AS | 500 | | 21,637 |
Komercni Banka AS | 200 | | 29,994 |
TOTAL CZECH REPUBLIC | | 51,631 |
Denmark - 0.6% |
Novo Nordisk AS Series B sponsored ADR | 2,700 | | 144,477 |
Vestas Wind Systems AS (a) | 2,460 | | 100,761 |
TOTAL DENMARK | | 245,238 |
Egypt - 0.1% |
Eastern Tobacco Co. | 500 | | 19,344 |
Telecom Egypt SAE | 4,500 | | 10,884 |
TOTAL EGYPT | | 30,228 |
Common Stocks - continued |
| Shares | | Value |
Finland - 0.9% |
Fortum Oyj | 1,600 | | $ 39,322 |
Nokia Corp. sponsored ADR | 20,600 | | 312,708 |
TOTAL FINLAND | | 352,030 |
France - 7.2% |
Accor SA | 1,500 | | 58,358 |
Alstom SA | 2,388 | | 118,358 |
Audika SA | 1,900 | | 44,302 |
AXA SA sponsored ADR | 25,100 | | 469,621 |
BNP Paribas SA | 5,300 | | 382,667 |
Compagnie de St. Gobain | 1,300 | | 50,163 |
Delachaux SA | 791 | | 43,505 |
GDF Suez | 8,981 | | 401,447 |
Groupe Danone | 2,736 | | 152,343 |
L'Air Liquide SA | 600 | | 51,777 |
Laurent-Perrier Group | 310 | | 25,133 |
Remy Cointreau SA | 1,151 | | 47,892 |
Renault SA | 1,000 | | 30,648 |
Societe Generale Series A | 600 | | 32,703 |
Total SA: | | | |
Series B | 4,700 | | 258,563 |
sponsored ADR | 8,800 | | 487,872 |
Unibail-Rodamco | 1,300 | | 194,980 |
TOTAL FRANCE | | 2,850,332 |
Germany - 8.6% |
Allianz AG sponsored ADR | 57,200 | | 433,576 |
BASF AG | 1,800 | | 60,527 |
Bayer AG | 2,200 | | 122,473 |
Daimler AG | 12,400 | | 427,800 |
E.ON AG | 28,900 | | 1,105,621 |
GEA Group AG | 4,000 | | 58,456 |
GFK AG | 2,400 | | 47,394 |
Linde AG | 900 | | 75,584 |
Muenchener Rueckversicherungs-Gesellschaft AG (Reg.) | 4,100 | | 544,173 |
RWE AG | 4,100 | | 342,633 |
Siemens AG sponsored ADR | 2,900 | | 174,435 |
Tognum AG | 3,100 | | 34,467 |
TOTAL GERMANY | | 3,427,139 |
Greece - 0.2% |
Public Power Corp. of Greece | 5,500 | | 68,008 |
Common Stocks - continued |
| Shares | | Value |
Hong Kong - 1.3% |
China Mobile (Hong Kong) Ltd. | 3,500 | | $ 30,811 |
China Mobile (Hong Kong) Ltd. sponsored ADR | 700 | | 30,723 |
China Overseas Land & Investment Ltd. | 44,000 | | 49,687 |
CNOOC Ltd. sponsored ADR | 560 | | 45,746 |
CNPC (Hong Kong) Ltd. | 40,000 | | 12,264 |
Hong Kong Exchanges & Clearing Ltd. | 6,600 | | 66,929 |
REXCAPITAL Financial Holdings Ltd. (a) | 475,000 | | 8,777 |
Swire Pacific Ltd. (A Shares) | 37,000 | | 260,580 |
TOTAL HONG KONG | | 505,517 |
India - 1.5% |
Axis Bank Ltd. GDR (Reg. S) | 2,700 | | 32,400 |
Bank of India | 4,775 | | 23,742 |
Bharat Heavy Electricals Ltd. | 716 | | 19,074 |
Bharti Airtel Ltd. (a) | 13,723 | | 185,812 |
Educomp Solutions Ltd. | 700 | | 32,749 |
Housing Development Finance Corp. Ltd. | 400 | | 14,559 |
Indian Overseas Bank | 15,780 | | 24,231 |
Infosys Technologies Ltd. | 530 | | 15,449 |
LANCO Infratech Ltd. | 20 | | 48 |
Larsen & Toubro Ltd. | 1,250 | | 20,894 |
Nagarjuna Construction Co. Ltd. | 50 | | 66 |
Pantaloon Retail India Ltd. | 3,418 | | 16,492 |
Piramal Healthcare Ltd. | 3,000 | | 13,734 |
Reliance Industries Ltd. GDR (Reg. S) (b) | 524 | | 29,868 |
Rural Electrification Corp. Ltd. | 130 | | 178 |
Satyam Computer Services Ltd. sponsored ADR | 8,700 | | 136,851 |
Sintex Industries Ltd. | 4,536 | | 13,800 |
Subex Ltd. (a) | 1,147 | | 837 |
Suzlon Energy Ltd. | 20,812 | | 18,866 |
Tata Power Co. Ltd. | 1,000 | | 14,273 |
TOTAL INDIA | | 613,923 |
Indonesia - 0.2% |
PT Bank Rakyat Indonesia Tbk | 64,000 | | 19,763 |
PT Bayan Resources Tbk | 128,500 | | 19,845 |
PT Bumi Resources Tbk | 129,500 | | 16,955 |
PT Perusahaan Gas Negara Tbk Series B | 102,000 | | 12,964 |
PT Telkomunikasi Indonesia Tbk Series B | 22,500 | | 11,361 |
TOTAL INDONESIA | | 80,888 |
Ireland - 0.7% |
Bank of Ireland | 15,800 | | 46,653 |
Common Stocks - continued |
| Shares | | Value |
Ireland - continued |
C&C Group PLC | 10,400 | | $ 15,128 |
CRH PLC sponsored ADR | 9,700 | | 205,252 |
Dragon Oil PLC (a) | 5,000 | | 12,935 |
TOTAL IRELAND | | 279,968 |
Israel - 1.2% |
BluePhoenix Solutions Ltd. (a) | 8,700 | | 23,316 |
Cellcom Israel Ltd. | 700 | | 20,622 |
ECtel Ltd. (a) | 9,100 | | 8,190 |
Israel Chemicals Ltd. | 11,900 | | 115,352 |
Leadcom Integrated Solutions (a) | 47,000 | | 4,376 |
Mellanox Technologies Ltd. (a) | 800 | | 6,208 |
Orckit Communications Ltd. (a) | 4,800 | | 19,008 |
Partner Communications Co. Ltd. ADR | 11,600 | | 216,688 |
RADWARE Ltd. (a) | 6,300 | | 39,753 |
Teva Pharmaceutical Industries Ltd. sponsored ADR | 300 | | 12,864 |
TOTAL ISRAEL | | 466,377 |
Italy - 2.1% |
ENI SpA sponsored ADR | 3,400 | | 163,370 |
Fiat SpA | 5,200 | | 41,328 |
Finmeccanica SpA | 7,900 | | 96,652 |
Impregilo SpA (a) | 21,600 | | 56,978 |
UniCredit SpA | 188,400 | | 460,963 |
TOTAL ITALY | | 819,291 |
Japan - 14.1% |
Aeon Co. Ltd. | 19,900 | | 190,813 |
Canon, Inc. | 1,400 | | 48,986 |
Denso Corp. | 8,200 | | 159,815 |
Dydo Drinco, Inc. | 800 | | 19,201 |
East Japan Railway Co. | 37 | | 263,279 |
Elpida Memory, Inc. (a) | 3,000 | | 15,993 |
Ibiden Co. Ltd. | 2,100 | | 39,282 |
Ichiyoshi Securities Co. Ltd. | 7,600 | | 60,855 |
JSR Corp. | 5,400 | | 60,908 |
Kobayashi Pharmaceutical Co. Ltd. | 2,100 | | 67,279 |
Konica Minolta Holdings, Inc. | 20,000 | | 131,340 |
Miraca Holdings, Inc. | 7,400 | | 119,332 |
Mitsubishi Estate Co. Ltd. | 3,000 | | 53,587 |
Mitsubishi UFJ Financial Group, Inc. sponsored ADR | 64,800 | | 406,296 |
Mitsui & Co. Ltd. | 50,000 | | 484,451 |
Nagaileben Co. Ltd. | 1,000 | | 19,855 |
Common Stocks - continued |
| Shares | | Value |
Japan - continued |
Nintendo Co. Ltd. | 700 | | $ 218,400 |
Nippon Building Fund, Inc. | 5 | | 48,043 |
Nomura Holdings, Inc. | 4,500 | | 42,632 |
Obic Co. Ltd. | 410 | | 50,182 |
ORIX Corp. | 2,990 | | 307,186 |
Osaka Gas Co. Ltd. | 94,000 | | 332,484 |
Osaka Securities Exchange Co. Ltd. | 10 | | 32,858 |
Ozeki Co. Ltd. | 200 | | 4,888 |
Promise Co. Ltd. | 9,850 | | 176,790 |
Rakuten, Inc. | 169 | | 83,775 |
SBI Holdings, Inc. | 400 | | 47,998 |
Seven & I Holdings Co. Ltd. | 2,000 | | 56,153 |
Shiseido Co. Ltd. | 5,000 | | 103,000 |
Sony Financial Holdings, Inc. | 34 | | 110,572 |
Sugi Holdings Co. Ltd. | 2,000 | | 48,095 |
Sumco Corp. | 3,720 | | 40,282 |
Sumitomo Corp. | 10,300 | | 90,615 |
Sumitomo Metal Industries Ltd. | 36,000 | | 92,585 |
Sumitomo Mitsui Financial Group, Inc. | 51 | | 204,442 |
Sumitomo Trust & Banking Co. Ltd. | 12,000 | | 55,570 |
Takeda Pharmaceutical Co. Ltd. | 2,500 | | 124,207 |
Tokuyama Corp. | 32,000 | | 162,045 |
Toyota Motor Corp. | 17,400 | | 679,451 |
Tsutsumi Jewelry Co. Ltd. | 2,800 | | 54,547 |
USS Co. Ltd. | 1,500 | | 91,871 |
Xebio Co. Ltd. | 6,600 | | 112,676 |
Yamada Denki Co. Ltd. | 1,390 | | 75,654 |
TOTAL JAPAN | | 5,588,273 |
Kazakhstan - 0.2% |
JSC Halyk Bank of Kazakhstan unit | 15,700 | | 66,725 |
Korea (South) - 0.8% |
Doosan Heavy Industries & Construction Co. Ltd. | 440 | | 19,450 |
Hyundai Industrial Development & Construction Co. | 5 | | 136 |
Hyunjin Materials Co. Ltd. | 1,002 | | 12,381 |
Jinsung T.E.C. Co. Ltd. | 2,098 | | 13,129 |
KB Financial Group, Inc. (a) | 1,515 | | 38,046 |
KT&G Corp. | 390 | | 25,108 |
LG Electronics, Inc. | 110 | | 8,238 |
MegaStudy Co. Ltd. | 100 | | 11,276 |
Meritz Fire & Marine Insurance Co. Ltd. | 3,410 | | 12,557 |
NHN Corp. (a) | 885 | | 94,475 |
Common Stocks - continued |
| Shares | | Value |
Korea (South) - continued |
Samsung Electronics Co. Ltd. | 90 | | $ 38,061 |
Shinhan Financial Group Co. Ltd. | 1,610 | | 39,290 |
Taewoong Co. Ltd. | 360 | | 17,585 |
TK Corp. | 7 | | 114 |
TOTAL KOREA (SOUTH) | | 329,846 |
Luxembourg - 0.1% |
Evraz Group SA GDR | 600 | | 9,240 |
MHP SA GDR (Reg. S) | 3,100 | | 12,400 |
Tenaris SA sponsored ADR | 700 | | 14,413 |
TOTAL LUXEMBOURG | | 36,053 |
Malaysia - 0.1% |
KNM Group Bhd | 70,000 | | 11,870 |
Public Bank Bhd | 10,000 | | 23,763 |
TOTAL MALAYSIA | | 35,633 |
Mauritius - 0.0% |
Golden Agri-Resources Ltd. | 85,000 | | 11,343 |
Mexico - 1.2% |
America Movil SAB de CV Series L sponsored ADR | 10,700 | | 331,058 |
Banco Compartamos SA de CV | 3,500 | | 5,946 |
Cemex SA de CV sponsored ADR | 2,200 | | 16,632 |
Fomento Economico Mexicano SA de CV sponsored ADR | 1,400 | | 35,406 |
Grupo Financiero Banorte SA de CV Series O | 11,339 | | 20,768 |
Wal-Mart de Mexico SA de CV Series V | 26,400 | | 70,919 |
TOTAL MEXICO | | 480,729 |
Netherlands - 2.3% |
AMG Advanced Metallurgical Group NV (a) | 2,150 | | 34,802 |
ASML Holding NV (NY Shares) | 15,600 | | 273,780 |
Gemalto NV (a) | 4,900 | | 137,285 |
Heineken NV (Bearer) | 2,200 | | 74,213 |
ING Groep NV sponsored ADR | 7,700 | | 71,687 |
Koninklijke KPN NV | 14,200 | | 199,981 |
QIAGEN NV (a) | 2,600 | | 37,076 |
Unilever NV (NY Shares) | 3,300 | | 79,365 |
TOTAL NETHERLANDS | | 908,189 |
Norway - 1.8% |
DnB Nor ASA | 21,700 | | 125,759 |
Orkla ASA (A Shares) | 37,800 | | 251,643 |
Petroleum Geo-Services ASA (a) | 21,100 | | 105,065 |
Common Stocks - continued |
| Shares | | Value |
Norway - continued |
Pronova BioPharma ASA | 41,400 | | $ 107,553 |
StatoilHydro ASA sponsored ADR | 5,700 | | 114,570 |
Telenor ASA | 800 | | 4,774 |
TOTAL NORWAY | | 709,364 |
Papua New Guinea - 0.2% |
Lihir Gold Ltd. (a) | 48,000 | | 59,862 |
Lihir Gold Ltd. sponsored ADR (a) | 2,500 | | 31,950 |
TOTAL PAPUA NEW GUINEA | | 91,812 |
Peru - 0.0% |
Compania de Minas Buenaventura SA sponsored ADR | 1,100 | | 13,904 |
Philippines - 0.5% |
Alliance Global Group, Inc. (a) | 310,000 | | 12,698 |
Jollibee Food Corp. | 46,900 | | 44,186 |
Philippine Long Distance Telephone Co. sponsored ADR | 3,100 | | 126,790 |
TOTAL PHILIPPINES | | 183,674 |
Poland - 0.1% |
Eurocash SA | 7,000 | | 21,521 |
Trakcja Polska SA | 7,900 | | 13,259 |
TOTAL POLAND | | 34,780 |
Russia - 1.2% |
Bank St. Petersburg OJSC | 7,100 | | 8,875 |
Mobile TeleSystems OJSC sponsored ADR | 600 | | 23,490 |
OAO Gazprom sponsored ADR | 14,080 | | 287,936 |
OAO NOVATEK (a) | 3,000 | | 8,100 |
OAO Raspadskaya | 5,100 | | 10,710 |
OJSC Rosneft unit | 5,700 | | 26,220 |
Sberbank (Savings Bank of the Russian Federation) GDR | 190 | | 34,849 |
Uralkali JSC | 6,400 | | 29,440 |
Vimpel Communications sponsored ADR | 2,600 | | 37,700 |
Wimm-Bill-Dann Foods OJSC sponsored ADR (a) | 500 | | 21,970 |
TOTAL RUSSIA | | 489,290 |
Singapore - 0.7% |
DBS Group Holdings Ltd. | 31,000 | | 236,638 |
Singapore Exchange Ltd. | 12,000 | | 42,953 |
Straits Asia Resources Ltd. | 7,000 | | 4,664 |
TOTAL SINGAPORE | | 284,255 |
Common Stocks - continued |
| Shares | | Value |
South Africa - 1.7% |
African Rainbow Minerals Ltd. | 7,763 | | $ 78,663 |
Aveng Ltd. | 100 | | 491 |
Bell Equipment Ltd. | 1 | | 1 |
Exxaro Resources Ltd. | 2,300 | | 15,161 |
Harmony Gold Mining Co. Ltd. sponsored ADR (a) | 2,500 | | 18,275 |
Impala Platinum Holdings Ltd. | 12,300 | | 127,029 |
Imperial Holdings Ltd. | 2,865 | | 16,111 |
MTN Group Ltd. | 29,203 | | 325,806 |
Murray & Roberts Holdings Ltd. | 2,505 | | 16,917 |
Northam Platinum Ltd. | 900 | | 2,810 |
Raubex Group Ltd. | 6,200 | | 16,024 |
Sasol Ltd. sponsored ADR | 400 | | 11,572 |
Truworths International Ltd. | 9,000 | | 30,537 |
TOTAL SOUTH AFRICA | | 659,397 |
Spain - 3.1% |
Banco Bilbao Vizcaya Argentaria SA sponsored ADR | 13,600 | | 157,760 |
Banco Santander SA | 18,900 | | 204,407 |
Grifols SA | 9,279 | | 184,659 |
Inditex SA | 2,200 | | 74,365 |
Prosegur Comp Securidad SA (Reg.) | 1,600 | | 45,455 |
Telefonica SA sponsored ADR | 10,000 | | 555,100 |
TOTAL SPAIN | | 1,221,746 |
Sweden - 0.9% |
H&M Hennes & Mauritz AB (B Shares) | 3,900 | | 139,825 |
Swedish Match Co. | 8,400 | | 116,627 |
Telefonaktiebolaget LM Ericsson (B Shares) | 14,800 | | 100,730 |
TOTAL SWEDEN | | 357,182 |
Switzerland - 11.0% |
ABB Ltd. sponsored ADR | 5,100 | | 67,065 |
Credit Suisse Group sponsored ADR | 2,000 | | 74,800 |
EFG International | 13,800 | | 297,017 |
Nestle SA (Reg.) | 35,079 | | 1,363,823 |
Novartis AG sponsored ADR | 10,800 | | 550,692 |
Roche Holding AG (participation certificate) | 9,148 | | 1,398,669 |
Sonova Holding AG | 3,319 | | 137,877 |
Swiss Life Holding AG | 1,049 | | 94,501 |
The Swatch Group AG (Reg.) | 1,684 | | 48,211 |
Zurich Financial Services AG (Reg.) | 1,669 | | 338,530 |
TOTAL SWITZERLAND | | 4,371,185 |
Common Stocks - continued |
| Shares | | Value |
Taiwan - 0.8% |
Acer, Inc. | 9,000 | | $ 11,719 |
Advanced Semiconductor Engineering, Inc. | 40,128 | | 17,086 |
China Steel Corp. | 31,810 | | 23,193 |
Everlight Electronics Co. Ltd. | 12,199 | | 18,492 |
First Financial Holding Co. Ltd. | 57,600 | | 27,154 |
HannStar Display Corp. | 376,248 | | 68,440 |
Hon Hai Precision Industry Co. Ltd. (Foxconn) | 39,100 | | 94,831 |
HTC Corp. | 2,600 | | 31,017 |
Innolux Display Corp. | 31,900 | | 23,743 |
Powertech Technology, Inc. | 5,500 | | 7,745 |
Taiwan Mobile Co. Ltd. | 7,000 | | 9,698 |
TOTAL TAIWAN | | 333,118 |
Thailand - 0.2% |
PTT Exploration & Production PCL (For. Reg.) | 7,100 | | 17,717 |
Siam Commercial Bank PCL (For. Reg.) | 28,000 | | 43,466 |
Total Access Communication PCL: | | | |
unit | 14,000 | | 10,006 |
(For. Reg.) | 8,600 | | 6,114 |
TOTAL THAILAND | | 77,303 |
Turkey - 0.8% |
Anadolu Efes Biracilik ve Malt Sanyii AS | 13,480 | | 113,530 |
Asya Katilim Bankasi AS | 77,200 | | 67,520 |
Bagfas Bandirma Gubre Fabrikalari AS | 150 | | 7,191 |
Enka Insaat ve Sanayi AS | 4,866 | | 18,127 |
Tupras-Turkiye Petrol Rafinerileri AS | 5,000 | | 63,166 |
Turkiye Garanti Bankasi AS (a) | 32,200 | | 52,570 |
Turkiye Vakiflar Bankasi TAO | 11,000 | | 10,618 |
TOTAL TURKEY | | 332,722 |
United Arab Emirates - 0.0% |
DP World Ltd. | 47 | | 16 |
United Kingdom - 13.8% |
Aegis Group PLC | 89,000 | | 93,785 |
Anglo American PLC (United Kingdom) | 3,942 | | 98,898 |
Autonomy Corp. PLC (a) | 8,400 | | 133,171 |
BAE Systems PLC | 88,900 | | 499,642 |
Barratt Developments PLC | 4,400 | | 5,477 |
BG Group PLC | 14,900 | | 219,062 |
BHP Billiton PLC | 2,800 | | 47,540 |
BHP Billiton PLC ADR | 9,100 | | 312,403 |
Common Stocks - continued |
| Shares | | Value |
United Kingdom - continued |
British American Tobacco PLC: | | | |
(United Kingdom) | 1,800 | | $ 49,367 |
sponsored ADR | 3,100 | | 168,516 |
Cairn Energy PLC (a) | 300 | | 7,771 |
Datacash Group PLC | 11,300 | | 39,343 |
easyJet PLC (a) | 19,800 | | 98,762 |
Eurasian Natural Resources Corp. PLC | 1,000 | | 5,001 |
HBOS PLC | 61,159 | | 100,131 |
HSBC Holdings PLC (United Kingdom) (Reg.) | 9,363 | | 110,884 |
Informa PLC | 14,700 | | 49,797 |
Man Group PLC | 50,375 | | 290,803 |
Max Petroleum PLC (a) | 76,100 | | 16,448 |
Misys PLC | 27,000 | | 48,340 |
National Grid PLC | 7,800 | | 87,857 |
Premier Foods PLC | 159,000 | | 70,493 |
Prudential PLC | 20,900 | | 104,975 |
Randgold Resources Ltd. sponsored ADR | 300 | | 9,303 |
Reckitt Benckiser Group PLC | 10,600 | | 448,323 |
Renovo Group PLC (a) | 143,700 | | 58,671 |
Rio Tinto PLC: | | | |
(Reg.) | 3,000 | | 140,119 |
sponsored ADR | 690 | | 128,250 |
Royal Bank of Scotland Group PLC | 123,466 | | 135,983 |
Royal Dutch Shell PLC Class A sponsored ADR | 15,200 | | 848,312 |
Serco Group PLC | 45,900 | | 273,694 |
Sibir Energy PLC (a) | 1,800 | | 7,162 |
Tesco PLC | 54,900 | | 300,766 |
Vodafone Group PLC | 40,300 | | 77,516 |
Vodafone Group PLC sponsored ADR | 19,500 | | 375,765 |
Xstrata PLC | 1,200 | | 20,523 |
TOTAL UNITED KINGDOM | | 5,482,853 |
United States of America - 5.3% |
Allergan, Inc. | 1,900 | | 75,373 |
Berkshire Hathaway, Inc. Class B (a) | 80 | | 307,200 |
Chiquita Brands International, Inc. (a) | 6,000 | | 81,900 |
Cypress Semiconductor Corp. (a) | 10,000 | | 50,100 |
FMC Technologies, Inc. (a) | 1,000 | | 34,990 |
Freeport-McMoRan Copper & Gold, Inc. Class B | 300 | | 8,730 |
Gilead Sciences, Inc. (a) | 3,600 | | 165,060 |
JPMorgan Chase & Co. | 3,000 | | 123,750 |
Juniper Networks, Inc. (a) | 11,500 | | 215,510 |
Common Stocks - continued |
| Shares | | Value |
United States of America - continued |
Lululemon Athletica, Inc. (a) | 300 | | $ 4,251 |
MasterCard, Inc. Class A | 700 | | 103,474 |
Mohawk Industries, Inc. (a) | 700 | | 33,866 |
Philip Morris International, Inc. | 7,000 | | 304,290 |
Pricesmart, Inc. | 7,095 | | 105,716 |
SanDisk Corp. (a) | 3,900 | | 34,671 |
Sunpower Corp. Class B (a) | 2,742 | | 81,191 |
Varian Semiconductor Equipment Associates, Inc. (a) | 2,800 | | 54,936 |
Visa, Inc. | 5,900 | | 326,565 |
TOTAL UNITED STATES OF AMERICA | | 2,111,573 |
TOTAL COMMON STOCKS (Cost $66,712,564) | 38,936,426 |
Nonconvertible Preferred Stocks - 0.5% |
| | | |
Brazil - 0.1% |
Usinas Siderurgicas de Minas Gerais SA - Usiminas (PN-A) (non-vtg.) | 1,150 | | 14,719 |
Germany - 0.1% |
ProSiebenSat.1 Media AG | 10,900 | | 32,899 |
Italy - 0.3% |
Fiat SpA (Risp) | 3,200 | | 14,504 |
Telecom Italia SpA (Risp) | 135,800 | | 114,279 |
TOTAL ITALY | | 128,783 |
TOTAL NONCONVERTIBLE PREFERRED STOCKS (Cost $443,113) | 176,401 |
Cash Equivalents - 2.8% |
| Maturity Amount | | Value |
Investments in repurchase agreements in a joint trading account at 0.14%, dated 10/31/08 due 11/3/08: | | | |
(Collateralized by U.S. Treasury Obligations) # | $ 29,000 | | $ 29,000 |
(Collateralized by U.S. Treasury Obligations) # | 1,081,012 | | 1,081,000 |
TOTAL CASH EQUIVALENTS (Cost $1,110,000) | 1,110,000 |
TOTAL INVESTMENT PORTFOLIO - 101.2% (Cost $68,265,677) | | 40,222,827 |
NET OTHER ASSETS - (1.2)% | | (460,584) |
NET ASSETS - 100% | $ 39,762,243 |
Legend |
(a) Non-income producing |
(b) Security exempt from registration under Rule 144A of the Securities Act of 1933. These securities may be resold in transactions exempt from registration, normally to qualified institutional buyers. At the end of the period, the value of these securities amounted to $36,668 or 0.1% of net assets. |
# Additional Information on each counterparty to the repurchase agreement is as follows: |
Repurchase Agreement / Counterparty | Value |
$29,000 due 11/03/08 at 0.14% |
BNP Paribas Securities Corp. | $ 1,954 |
Banc of America Securities LLC | 3,908 |
Barclays Capital, Inc. | 3,908 |
Deutsche Bank Securities, Inc. | $ 10,159 |
Morgan Stanley & Co., Inc. | 278 |
UBS Securities LLC | 8,793 |
| $ 29,000 |
$1,081,000 due 11/03/08 at 0.14% |
BNP Paribas Securities Corp. | $ 72,833 |
Banc of America Securities LLC | 145,666 |
Barclays Capital, Inc. | 145,666 |
Deutsche Bank Securities, Inc. | 378,731 |
Morgan Stanley & Co., Inc. | 10,355 |
UBS Securities LLC | 327,749 |
| $ 1,081,000 |
Affiliated Central Funds |
Information regarding fiscal year to date income earned by the Fund from investments in Fidelity Central Funds is as follows: |
Fund | Income earned |
Fidelity Securities Lending Cash Central Fund | $ 685 |
Income Tax Information |
At October 31, 2008, the fund had a capital loss carryforward of approximately $10,058,675 all of which will expire on October 31, 2016. |
See accompanying notes which are an integral part of the financial statements.
Annual Report
Fidelity Total International Equity Fund
Statement of Assets and Liabilities
| October 31, 2008 |
| | |
Assets | | |
Investment in securities, at value (including repurchase agreements of $1,110,000) -
See accompanying schedule: Unaffiliated issuers (cost $68,265,677) | | $ 40,222,827 |
Foreign currency held at value (cost $19,550) | | 19,610 |
Receivable for investments sold | | 420,878 |
Receivable for fund shares sold | | 48,897 |
Dividends receivable | | 137,659 |
Distributions receivable from Fidelity Central Funds | | 487 |
Receivable from investment adviser for expense reductions | | 60,634 |
Other receivables | | 2,568 |
Total assets | | 40,913,560 |
| | |
Liabilities | | |
Payable to custodian bank | $ 500,703 | |
Payable for investments purchased | 454,874 | |
Payable for fund shares redeemed | 65,416 | |
Accrued management fee | 24,662 | |
Distribution fees payable | 7,025 | |
Other affiliated payables | 13,587 | |
Other payables and accrued expenses | 85,050 | |
Total liabilities | | 1,151,317 |
| | |
Net Assets | | $ 39,762,243 |
Net Assets consist of: | | |
Paid in capital | | $ 77,832,504 |
Undistributed net investment income | | 796,810 |
Accumulated undistributed net realized gain (loss) on investments and foreign currency transactions | | (10,821,709) |
Net unrealized appreciation (depreciation) on investments and assets and liabilities in foreign currencies | | (28,045,362) |
Net Assets | | $ 39,762,243 |
See accompanying notes which are an integral part of the financial statements.
Annual Report
Fidelity Total International Equity Fund
Financial Statements - continued
Statement of Assets and Liabilities - continued
| October 31, 2008 |
| | |
Calculation of Maximum Offering Price
Class A:
Net Asset Value and redemption price per share
($5,944,308 ÷ 1,214,214 shares) | | $ 4.90 |
| | |
Maximum offering price per share (100/94.25 of $4.90) | | $ 5.20 |
Class T:
Net Asset Value and redemption price per share ($2,566,919 ÷ 525,601 shares) | | $ 4.88 |
| | |
Maximum offering price per share (100/96.50 of $4.88) | | $ 5.06 |
Class B:
Net Asset Value and offering price per share ($2,505,484 ÷ 515,596 shares)A | | $ 4.86 |
| | |
Class C:
Net Asset Value and offering price per share ($2,786,793 ÷ 573,503 shares)A | | $ 4.86 |
| | |
Total International Equity:
Net Asset Value, offering price and redemption price per share ($23,226,171 ÷ 4,734,729 shares) | | $ 4.91 |
| | |
Institutional Class:
Net Asset Value, offering price and redemption price per share ($2,732,568 ÷ 557,020 shares) | | $ 4.91 |
A Redemption price per share is equal to net asset value less any applicable contingent deferred sales charge.
See accompanying notes which are an integral part of the financial statements.
Annual Report
Statement of Operations
For the period November 1, 2007
(commencement of operations)
to October 31, 2008 |
| | |
Investment Income | | |
Dividends | | $ 1,864,250 |
Interest | | 50,882 |
Income from Fidelity Central Funds | | 685 |
| | 1,915,817 |
Less foreign taxes withheld | | (176,331) |
Total income | | 1,739,486 |
| | |
Expenses | | |
Management fee | $ 434,811 | |
Transfer agent fees | 140,800 | |
Distribution fees | 124,559 | |
Accounting and security lending fees | 31,886 | |
Custodian fees and expenses | 333,396 | |
Independent trustees' compensation | 250 | |
Registration fees | 134,079 | |
Audit | 76,578 | |
Legal | 2,967 | |
Miscellaneous | 2,464 | |
Total expenses before reductions | 1,281,790 | |
Expense reductions | (399,945) | 881,845 |
Net investment income (loss) | | 857,641 |
Realized and Unrealized Gain (Loss) Net realized gain (loss) on: | | |
Investment securities: | | |
Unaffiliated issuers | (10,808,092) | |
Foreign currency transactions | (58,619) | |
Total net realized gain (loss) | | (10,866,711) |
Change in net unrealized appreciation (depreciation) on: Investment securities | (28,043,005) | |
Assets and liabilities in foreign currencies | (2,357) | |
Total change in net unrealized appreciation (depreciation) | | (28,045,362) |
Net gain (loss) | | (38,912,073) |
Net increase (decrease) in net assets resulting from operations | | $ (38,054,432) |
See accompanying notes which are an integral part of the financial statements.
Annual Report
Fidelity Total International Equity Fund
Financial Statements - continued
Statement of Changes in Net Assets
| For the period
November 1, 2007
(commencement
of operations) to
October 31, 2008 |
Increase (Decrease) in Net Assets | |
Operations | |
Net investment income (loss) | $ 857,641 |
Net realized gain (loss) | (10,866,711) |
Change in net unrealized appreciation (depreciation) | (28,045,362) |
Net increase (decrease) in net assets resulting
from operations | (38,054,432) |
Distributions to shareholders from net investment income | (15,829) |
Share transactions - net increase (decrease) | 77,824,722 |
Redemption fees | 7,782 |
Total increase (decrease) in net assets | 39,762,243 |
| |
Net Assets | |
Beginning of period | - |
End of period (including undistributed net investment income of $796,810) | $ 39,762,243 |
See accompanying notes which are an integral part of the financial statements.
Annual Report
Financial Highlights - Class A
| For the period
November 1, 2007
(commencement
of operations) to
October 31, 2008 |
Selected Per-Share Data | |
Net asset value, beginning of period | $ 10.00 |
Income from Investment Operations | |
Net investment income (loss) C | .11 |
Net realized and unrealized gain (loss) | (5.21) |
Total from investment operations | (5.10) |
Redemption fees added to paid in capital C, E | - |
Net asset value, end of period | $ 4.90 |
Total Return A, B | (51.00)% |
Ratios to Average Net Assets D, G | |
Expenses before reductions | 2.00% |
Expenses net of fee waivers, if any | 1.50% |
Expenses net of all reductions | 1.48% |
Net investment income (loss) | 1.35% |
Supplemental Data | |
Net assets, end of period (000 omitted) | $ 5,944 |
Portfolio turnover rate F | 91% |
A Total returns would have been lower had certain expenses not been reduced during the periods shown.
B Total returns do not include the effect of the sales charges.
C Calculated based on average shares outstanding during the period.
D Expense ratios reflect operating expenses of the class. Expenses before reductions do not reflect amounts reimbursed by the investment adviser or reductions from brokerage service arrangements or other expense offset arrangements and do not represent the amount paid by the class during periods when reimbursements or reductions occur. Expense ratios before reductions for start-up periods may not be representative of longer-term operating periods. Expenses net of fee waivers reflect expenses after reimbursement by the investment adviser but prior to reductions from brokerage service arrangements or other expense offset arrangements. Expenses net of all reductions represent the net expenses paid by the class.
E Amount represents less than $.01 per share.
F Amount does not include the portfolio activity of any underlying Fidelity Central Funds.
G Fees and expenses of the underlying Fidelity Central Funds are not included in the Fund's expense ratio. The Fund indirectly bears its proportionate share of the expenses of any underlying Fidelity Central Funds.
See accompanying notes which are an integral part of the financial statements.
Annual Report
Financial Highlights - Class T
| For the period
November 1, 2007
(commencement
of operations) to
October 31, 2008 |
Selected Per-Share Data | |
Net asset value, beginning of period | $ 10.00 |
Income from Investment Operations | |
Net investment income (loss) C | .09 |
Net realized and unrealized gain (loss) | (5.21) |
Total from investment operations | (5.12) |
Redemption fees added to paid in capital C, E | - |
Net asset value, end of period | $ 4.88 |
Total Return A, B | (51.20)% |
Ratios to Average Net Assets D, G | |
Expenses before reductions | 2.42% |
Expenses net of fee waivers, if any | 1.75% |
Expenses net of all reductions | 1.73% |
Net investment income (loss) | 1.10% |
Supplemental Data | |
Net assets, end of period (000 omitted) | $ 2,567 |
Portfolio turnover rate F | 91% |
A Total returns would have been lower had certain expenses not been reduced during the periods shown.
B Total returns do not include the effect of the sales charges.
C Calculated based on average shares outstanding during the period.
D Expense ratios reflect operating expenses of the class. Expenses before reductions do not reflect amounts reimbursed by the investment adviser or reductions from brokerage service arrangements or other expense offset arrangements and do not represent the amount paid by the class during periods when reimbursements or reductions occur. Expense ratios before reductions for start-up periods may not be representative of longer-term operating periods. Expenses net of fee waivers reflect expenses after reimbursement by the investment adviser but prior to reductions from brokerage service arrangements or other expense offset arrangements. Expenses net of all reductions represent the net expenses paid by the class.
E Amount represents less than $.01 per share.
F Amount does not include the portfolio activity of any underlying Fidelity Central Funds.
G Fees and expenses of the underlying Fidelity Central Funds are not included in the Fund's expense ratio. The Fund indirectly bears its proportionate share of the expenses of any underlying Fidelity Central Funds.
See accompanying notes which are an integral part of the financial statements.
Annual Report
Financial Highlights - Class B
| For the period
November 1, 2007
(commencement
of operations) to
October 31, 2008 |
Selected Per-Share Data | |
Net asset value, beginning of period | $ 10.00 |
Income from Investment Operations | |
Net investment income (loss) C | .05 |
Net realized and unrealized gain (loss) | (5.19) |
Total from investment operations | (5.14) |
Redemption fees added to paid in capital C, E | - |
Net asset value, end of period | $ 4.86 |
Total Return A, B | (51.40)% |
Ratios to Average Net Assets D, G | |
Expenses before reductions | 2.92% |
Expenses net of fee waivers, if any | 2.25% |
Expenses net of all reductions | 2.24% |
Net investment income (loss) | .60% |
Supplemental Data | |
Net assets, end of period (000 omitted) | $ 2,505 |
Portfolio turnover rate F | 91% |
A Total returns would have been lower had certain expenses not been reduced during the periods shown.
B Total returns do not include the effect of the contingent deferred sales charge.
C Calculated based on average shares outstanding during the period.
D Expense ratios reflect operating expenses of the class. Expenses before reductions do not reflect amounts reimbursed by the investment adviser or reductions from brokerage service arrangements or other expense offset arrangements and do not represent the amount paid by the class during periods when reimbursements or reductions occur. Expense ratios before reductions for start-up periods may not be representative of longer-term operating periods. Expenses net of fee waivers reflect expenses after reimbursement by the investment adviser but prior to reductions from brokerage service arrangements or other expense offset arrangements. Expenses net of all reductions represent the net expenses paid by the class.
E Amount represents less than $.01 per share.
F Amount does not include the portfolio activity of any underlying Fidelity Central Funds.
G Fees and expenses of the underlying Fidelity Central Funds are not included in the Fund's expense ratio. The Fund indirectly bears its proportionate share of the expenses of any underlying Fidelity Central Funds.
See accompanying notes which are an integral part of the financial statements.
Annual Report
Financial Highlights - Class C
| For the period
November 1, 2007
(commencement
of operations) to
October 31, 2008 |
Selected Per-Share Data | |
Net asset value, beginning of period | $ 10.00 |
Income from Investment Operations | |
Net investment income (loss) C | .05 |
Net realized and unrealized gain (loss) | (5.19) |
Total from investment operations | (5.14) |
Redemption fees added to paid in capital C, E | - |
Net asset value, end of period | $ 4.86 |
Total Return A, B | (51.40)% |
Ratios to Average Net Assets D, G | |
Expenses before reductions | 2.92% |
Expenses net of fee waivers, if any | 2.25% |
Expenses net of all reductions | 2.23% |
Net investment income (loss) | .60% |
Supplemental Data | |
Net assets, end of period (000 omitted) | $ 2,787 |
Portfolio turnover rate F | 91% |
A Total returns would have been lower had certain expenses not been reduced during the periods shown.
B Total returns do not include the effect of the contingent deferred sales charge.
C Calculated based on average shares outstanding during the period.
D Expense ratios reflect operating expenses of the class. Expenses before reductions do not reflect amounts reimbursed by the investment adviser or reductions from brokerage service arrangements or other expense offset arrangements and do not represent the amount paid by the class during periods when reimbursements or reductions occur. Expense ratios before reductions for start-up periods may not be representative of longer-term operating periods. Expenses net of fee waivers reflect expenses after reimbursement by the investment adviser but prior to reductions from brokerage service arrangements or other expense offset arrangements. Expenses net of all reductions represent the net expenses paid by the class.
E Amount represents less than $.01 per share.
F Amount does not include the portfolio activity of any underlying Fidelity Central Funds.
G Fees and expenses of the underlying Fidelity Central Funds are not included in the Fund's expense ratio. The Fund indirectly bears its proportionate share of the expenses of any underlying Fidelity Central Funds.
See accompanying notes which are an integral part of the financial statements.
Annual Report
Financial Highlights - Total International Equity
| For the period
November 1, 2007
(commencement
of operations) to
October 31, 2008 |
Selected Per-Share Data | |
Net asset value, beginning of period | $ 10.00 |
Income from Investment Operations | |
Net investment income (loss) B | .13 |
Net realized and unrealized gain (loss) | (5.21) |
Total from investment operations | (5.08) |
Distributions from net investment income | (.01) |
Redemption fees added to paid in capital B, D | - |
Net asset value, end of period | $ 4.91 |
Total Return A | (50.87)% |
Ratios to Average Net Assets C, F | |
Expenses before reductions | 1.89% |
Expenses net of fee waivers, if any | 1.25% |
Expenses net of all reductions | 1.23% |
Net investment income (loss) | 1.60% |
Supplemental Data | |
Net assets, end of period (000 omitted) | $ 23,226 |
Portfolio turnover rate E | 91% |
A Total returns would have been lower had certain expenses not been reduced during the periods shown.
B Calculated based on average shares outstanding during the period.
C Expense ratios reflect operating expenses of the class. Expenses before reductions do not reflect amounts reimbursed by the investment adviser or reductions from brokerage service arrangements or other expense offset arrangements and do not represent the amount paid by the class during periods when reimbursements or reductions occur. Expense ratios before reductions for start-up periods may not be representative of longer-term operating periods. Expenses net of fee waivers reflect expenses after reimbursement by the investment adviser but prior to reductions from brokerage service arrangements or other expense offset arrangements. Expenses net of all reductions represent the net expenses paid by the class.
D Amount represents less than $.01 per share.
E Amount does not include the portfolio activity of any underlying Fidelity Central Funds.
F Fees and expenses of the underlying Fidelity Central Funds are not included in the Fund's expense ratio. The Fund indirectly bears its proportionate share of the expenses of any underlying Fidelity Central Funds.
See accompanying notes which are an integral part of the financial statements.
Annual Report
Financial Highlights - Institutional Class
| For the period
November 1, 2007
(commencement
of operations) to
October 31, 2008 |
Selected Per-Share Data | |
Net asset value, beginning of period | $ 10.00 |
Income from Investment Operations | |
Net investment income (loss) B | .13 |
Net realized and unrealized gain (loss) | (5.21) |
Total from investment operations | (5.08) |
Distributions from net investment income | (.01) |
Redemption fees added to paid in capital B, D | - |
Net asset value, end of period | $ 4.91 |
Total Return A | (50.87)% |
Ratios to Average Net Assets C, F | |
Expenses before reductions | 1.91% |
Expenses net of fee waivers, if any | 1.25% |
Expenses net of all reductions | 1.23% |
Net investment income (loss) | 1.60% |
Supplemental Data | |
Net assets, end of period (000 omitted) | $ 2,733 |
Portfolio turnover rate E | 91% |
A Total returns would have been lower had certain expenses not been reduced during the periods shown.
B Calculated based on average shares outstanding during the period.
C Expense ratios reflect operating expenses of the class. Expenses before reductions do not reflect amounts reimbursed by the investment adviser or reductions from brokerage service arrangements or other expense offset arrangements and do not represent the amount paid by the class during periods when reimbursements or reductions occur. Expense ratios before reductions for start-up periods may not be representative of longer-term operating periods. Expenses net of fee waivers reflect expenses after reimbursement by the investment adviser but prior to reductions from brokerage service arrangements or other expense offset arrangements. Expenses net of all reductions represent the net expenses paid by the class.
D Amount represents less than $.01 per share.
E Amount does not include the portfolio activity of any underlying Fidelity Central Funds.
F Fees and expenses of the underlying Fidelity Central Funds are not included in the Fund's expense ratio. The Fund indirectly bears its proportionate share of the expenses of any underlying Fidelity Central Funds.
See accompanying notes which are an integral part of the financial statements.
Annual Report
Fidelity Total International Equity Fund
Notes to Financial Statements
For the period ended October 31, 2008
1. Organization.
Fidelity Total International Equity Fund (the Fund) is a fund of Fidelity Investment Trust (the trust) and is authorized to issue an unlimited number of shares. The trust is registered under the Investment Company Act of 1940, as amended (the 1940 Act), as an open-end management investment company organized as a Massachusetts business trust. The Fund offers Class A, Class T, Class B, Class C, Total International Equity, and Institutional Class shares, each of which has equal rights as to assets and voting privileges. Each class has exclusive voting rights with respect to matters that affect that class. Class B shares will automatically convert to Class A shares after a holding period of seven years from the initial date of purchase. Investment income, realized and unrealized capital gains and losses, the common expenses of the Fund, and certain fund-level expense reductions, if any, are allocated on a pro rata basis to each class based on the relative net assets of each class to the total net assets of the Fund. Each class differs with respect to transfer agent and distribution and service plan fees incurred. Certain expense reductions also differ by class.The Fund's investments in emerging markets can be subject to social, economic, regulatory, and political uncertainties and can be extremely volatile.
2. Investments in Fidelity Central Funds.
The Fund may invest in Fidelity Central Funds, which are open-end investment companies available only to other investment companies and accounts managed by Fidelity Management & Research Company (FMR) and its affiliates. The Fund's Schedule of Investments lists each of the Fidelity Central Funds held as of period end, if any, as an investment of the Fund, but does not include the underlying holdings of each Fidelity Central Fund. As an Investing Fund, the Fund indirectly bears its proportionate share of the expenses of the underlying Fidelity Central Funds.
The Money Market Central Funds seek preservation of capital and current income and are managed by Fidelity Investments Money Management, Inc. (FIMM), an affiliate of FMR.
A complete unaudited list of holdings for each Fidelity Central Fund is available upon request or at the SEC's web site at www.sec.gov. In addition, the financial statements of the Fidelity Central Funds, which are not covered by the Fund's Report of Independent Registered Public Accounting Firm, are available on the SEC's web site or upon request.
3. Significant Accounting Policies.
The financial statements have been prepared in conformity with accounting principles generally accepted in the United States of America, which require management to make certain estimates and assumptions at the date of the financial statements. Actual results could differ from those estimates. The following summarizes the significant accounting policies of the Fund:
Annual Report
Fidelity Total International Equity Fund
Notes to Financial Statements - continued
3. Significant Accounting Policies - continued
Security Valuation. Investments are valued as of 4:00 p.m. Eastern time on the last calendar day of the period. Wherever possible, the Fund uses independent pricing services approved by the Board of Trustees to value its investments.
Equity securities, including restricted securities, for which market quotations are readily available, are valued at the last reported sale price or official closing price as reported by an independent pricing service on the primary market or exchange on which they are traded. In the event there were no sales during the day or closing prices are not available, securities are valued at the last quoted bid price. Investments in open-end mutual funds, including Fidelity Central Funds, are valued at their closing net asset value each business day. Short-term securities with remaining maturities of sixty days or less for which quotations are not readily available are valued at amortized cost, which approximates value.
When current market prices or quotations are not readily available or reliable, valuations may be determined in good faith in accordance with procedures adopted by the Board of Trustees. Factors used in determining value may include significant market or security specific events, changes in interest rates and credit quality, and developments in foreign markets which are monitored by evaluating the performance of ADRs, futures contracts and exchange-traded funds. The frequency with which these procedures are used cannot be predicted and may be utilized to a significant extent. The value of securities used for net asset value (NAV) calculation under these procedures may differ from published prices for the same securities.
Foreign Currency. The Fund uses foreign currency contracts to facilitate transactions in foreign-denominated securities. Losses from these transactions may arise from changes in the value of the foreign currency or if the counterparties do not perform under the contracts' terms.
Foreign-denominated assets, including investment securities, and liabilities are translated into U.S. dollars at the exchange rate at period end. Purchases and sales of investment securities, income and dividends received and expenses denominated in foreign currencies are translated into U.S. dollars at the exchange rate in effect on the transaction date.
The effects of exchange rate fluctuations on investments are included with the net realized and unrealized gain (loss) on investment securities. Other foreign currency transactions resulting in realized and unrealized gain (loss) are disclosed separately.
Annual Report
3. Significant Accounting Policies - continued
Investment Transactions and Income. For financial reporting purposes, the Fund's investment holdings and NAV include trades executed through the end of the last business day of the period. The NAV per share for processing shareholder transactions is calculated as of the close of business of the New York Stock Exchange (NYSE), normally 4:00 p.m. Eastern time and includes trades executed through the end of the prior business day. Gains and losses on securities sold are determined on the basis of identified cost. Dividend income is recorded on the ex-dividend date, except for certain dividends from foreign securities where the ex-dividend date may have passed, which are recorded as soon as the Fund is informed of the ex-dividend date. Non-cash dividends included in dividend income, if any, are recorded at the fair market value of the securities received. Interest income and distributions from the Fidelity Central Funds are accrued as earned. Interest income includes coupon interest and amortization of premium and accretion of discount on debt securities. Investment income is recorded net of foreign taxes withheld where recovery of such taxes is uncertain.
Expenses. Most expenses of the trust can be directly attributed to a fund. Expenses which cannot be directly attributed are apportioned among each Fund in the trust. Expense estimates are accrued in the period to which they relate and adjustments are made when actual amounts are known.
Income Tax Information and Distributions to Shareholders. Each year, the Fund intends to qualify as a regulated investment company by distributing substantially all of its taxable income and realized gains under Subchapter M of the Internal Revenue Code and filing its U.S. federal tax return. As a result, no provision for income taxes is required. The Fund is subject to the provisions of FASB Interpretation No. 48, Accounting for Uncertainties in Income Taxes (FIN 48). FIN 48 sets forth a minimum threshold for financial statement recognition of the benefit of a tax position taken or expected to be taken in a tax return. There are no unrecognized tax benefits in the accompanying financial statements in connection with the tax positions expected to be taken in the initial filing of the Fund's federal tax return. Foreign taxes are provided for based on the Fund's understanding of the tax rules and rates that exist in the foreign markets in which it invests.
Distributions are recorded on the ex-dividend date. Income dividends and capital gain distributions are declared separately for each class. Income and capital gain distributions are determined in accordance with income tax regulations, which may differ from generally accepted accounting principles.
Capital accounts within the financial statements are adjusted for permanent book-tax differences. These adjustments have no impact on net assets or the results of operations. Temporary book-tax differences will reverse in a subsequent period.
Annual Report
Fidelity Total International Equity Fund
Notes to Financial Statements - continued
3. Significant Accounting Policies - continued
Income Tax Information and Distributions to Shareholders - continued
Book-tax differences are primarily due to foreign currency transactions, passive foreign investment companies (PFIC), capital loss carryforwards and losses deferred due to wash sales.
The tax-basis components of distributable earnings and the federal tax cost as of period end were as follows:
Unrealized appreciation | $ 158,517 |
Unrealized depreciation | (28,966,751) |
Net unrealized appreciation (depreciation) | (28,808,234) |
Undistributed ordinary income | 796,810 |
Capital loss carryforward | (10,058,675) |
| |
Cost for federal income tax purposes | $ 69,031,061 |
The tax character of distributions paid was as follows:
| October 31, 2008 |
Ordinary Income | $ 15,829 |
Short-Term Trading (Redemption) Fees. Shares held in the Fund less than 30 days are subject to a redemption fee equal to 1.00% of the proceeds of the redeemed shares. All redemption fees, including any estimated redemption fees paid by FMR, are retained by the Fund and accounted for as an addition to paid in capital.
New Accounting Pronouncement. In September 2006, Statement of Financial Accounting Standards No. 157, Fair Value Measurements (SFAS 157), was issued and is effective for fiscal years beginning after November 15, 2007. SFAS 157 defines fair value, establishes a framework for measuring fair value and results in expanded disclosures about fair value measurements. The Fund will adopt the provisions of SFAS 157 effective for its fiscal year beginning November 1, 2008.
4. Operating Policies.
Repurchase Agreements. FMR has received an Exemptive Order from the Securities and Exchange Commission (the SEC) which permits the Fund and other affiliated entities of FMR to transfer uninvested cash balances into joint trading accounts which are then invested in repurchase agreements. The Fund may also invest directly with institutions in repurchase agreements. Repurchase agreements are collateralized by government or non-government securities. Upon settlement date, collateral is held in segregated accounts with custodian banks and may be obtained in the event of a default of the counterparty. The Fund monitors, on a daily basis, the value of the collateral to
Annual Report
4. Operating Policies - continued
Repurchase Agreements - continued
ensure it is at least equal to the principal amount of the repurchase agreement (including accrued interest). In the event of a default by the counterparty, realization of the collateral proceeds could be delayed, during which time the value of the collateral may decline.
Restricted Securities. The Fund may invest in securities that are subject to legal or contractual restrictions on resale. These securities generally may be resold in transactions exempt from registration or to the public if the securities are registered. Disposal of these securities may involve time-consuming negotiations and expense, and prompt sale at an acceptable price may be difficult. Information regarding restricted securities is included at the end of the Fund's Schedule of Investments.
5. Purchases and Sales of Investments.
Purchases and sales of securities, short-term securities, aggregated $130,088,576 and $52,054,096, respectively.
6. Fees and Other Transactions with Affiliates.
Management Fee. FMR and its affiliates provide the Fund with investment management related services for which the Fund pays a monthly management fee. The management fee is the sum of an individual fund fee rate that is based on an annual rate of .45% of the Fund's average net assets and a group fee rate that averaged .26% during the period. The group fee rate is based upon the average net assets of all the mutual funds advised by FMR. The group fee rate decreases as assets under management increase and increases as assets under management decrease. In addition, the management fee is subject to a performance adjustment (up to a maximum of ± .20% of the Fund's average net assets over the performance period). The upward or downward adjustment to the management fee is based on the investment performance of the Total International Equity Class as compared to an appropriate benchmark index. The Fund's performance period began on December 1, 2007 and subsequent months will be added until the performance period includes 36 months. The Fund's performance adjustment will take effect in November 2008. For the period, the total annual management fee rate was .71% of the Fund's average net assets.
Distribution and Service Plan. In accordance with Rule 12b-1 of the 1940 Act, the Fund has adopted separate Distribution and Service Plans for each class of shares. Certain classes pay Fidelity Distributors Corporation (FDC), an affiliate of FMR, separate Distribution and Service Fees, each of which is based on an annual percentage of each class' average net assets. In addition, FDC may pay financial intermediaries for selling shares of the Fund and providing shareholder support services. For the period,
Annual Report
Fidelity Total International Equity Fund
Notes to Financial Statements - continued
6. Fees and Other Transactions with Affiliates - continued
Distribution and Service Plan - continued
the Distribution and Service Fee rates and the total amounts paid to and retained by FDC were as follows:
| Distribution
Fee | Service
Fee | Paid to
FDC | Retained
by FDC |
Class A | -% | .25% | $ 17,319 | $ 11,412 |
Class T | .25% | .25% | 21,454 | 20,724 |
Class B | .75% | .25% | 42,037 | 41,866 |
Class C | .75% | .25% | 43,749 | 42,879 |
| | | $ 124,559 | $ 116,881 |
Sales Load. FDC receives a front-end sales charge of up to 5.75% for selling Class A shares, and 3.50% for selling Class T shares, some of which is paid to financial intermediaries for selling shares of the Fund. FDC receives the proceeds of contingent deferred sales charges levied on Class A, Class T, Class B, and Class C redemptions. These charges depend on the holding period. The deferred sales charges range from 5% to 1% for Class B, 1% for Class C, 1.00% to .50% for certain purchases of Class A shares and .25% for certain purchases of Class T shares.
For the period, sales charge amounts retained by FDC were as follows:
| Retained
by FDC |
Class A | $ 1,403 |
Class T | 263 |
Class B* | 267 |
Class C* | 220 |
| $ 2,153 |
* When Class B and Class C shares are initially sold, FDC pays commissions from its own resources to financial intermediaries through which the sales are made.
Transfer Agent Fees. Fidelity Investments Institutional Operations Company, Inc. (FIIOC), an affiliate of FMR, is the transfer, dividend disbursing and shareholder servicing agent for each class of the Fund. FIIOC receives account fees and asset-based fees that vary according to the account size and type of account of the shareholders of the respective classes of the Fund. FIIOC pays for typesetting, printing and mailing of
Annual Report
6. Fees and Other Transactions with Affiliates - continued
Transfer Agent Fees - continued
shareholder reports, except proxy statements. For the period, the total transfer agent fees paid by each class were as follows:
| Amount | % of
Average
Net Assets |
Class A | $ 11,710 | .17 |
Class T | 7,052 | .16 |
Class B | 6,840 | .16 |
Class C | 7,566 | .17 |
Total International Equity | 100,429 | .27 |
Institutional Class | 7,203 | .16 |
| $ 140,800 | |
Accounting and Security Lending Fees. Fidelity Service Company, Inc. (FSC), an affiliate of FMR, maintains the Fund's accounting records. The accounting fee is based on the level of average net assets for the month. Under a separate contract, FSC administers the security lending program. The security lending fee is based on the number and duration of lending transactions.
Brokerage Commissions. The Fund placed a portion of its portfolio transactions with brokerage firms which are affiliates of the investment adviser. The commissions paid to these affiliated firms were $1,684 for the period.
7. Committed Line of Credit.
The Fund participates with other funds managed by FMR in a $4.2 billion credit facility (the "line of credit") to be utilized for temporary or emergency purposes to fund shareholder redemptions or for other short-term liquidity purposes. The Fund has agreed to pay commitment fees on its pro rata portion of the line of credit, which amounted to $86 and is reflected in Miscellaneous Expense on the Statement of Operations. During the period, there were no borrowings on this line of credit.
8. Security Lending.
The Fund lends portfolio securities from time to time in order to earn additional income. On the settlement date of the loan, the Fund receives collateral (in the form of U.S. Treasury obligations, letters of credit and/or cash) against the loaned securities and maintains collateral in an amount not less than 100% of the market value of the loaned
Annual Report
Fidelity Total International Equity Fund
Notes to Financial Statements - continued
8. Security Lending - continued
securities during the period of the loan. The market value of the loaned securities is determined at the close of business of the Fund and any additional required collateral is delivered to the Fund on the next business day. If the borrower defaults on its obligation to return the securities loaned because of insolvency or other reasons, a fund could experience delays and costs in recovering the securities loaned or in gaining access to the collateral. Any cash collateral received is invested in the Fidelity Securities Lending Cash Central Fund. Security lending income represents the income earned on investing cash collateral, less fees and expenses associated with the loan, plus any premium payments that may be received on the loan of certain types of securities. Security lending income is presented in the Statement of Operations as a component of income from Fidelity Central Funds. Net income from lending portfolio securities during the period amounted to $685.
9. Expense Reductions.
FMR voluntarily agreed to reimburse each class to the extent annual operating expenses exceeded certain levels of average net assets as noted in the table below. Some expenses, for example interest expense, including commitment fees, are excluded from this reimbursement.
The following classes were in reimbursement during the period:
| Expense
Limitations | Reimbursement
from adviser |
Class A | 1.50% | $ 34,674 |
Class T | 1.75% | 28,711 |
Class B | 2.25% | 28,025 |
Class C | 2.25% | 29,021 |
Total International Equity | 1.25% | 239,225 |
Institutional Class | 1.25% | 28,855 |
| | $ 388,511 |
Many of the brokers with whom FMR places trades on behalf of the Fund provided services to the Fund in addition to trade execution. These services included payments of certain expenses on behalf of the Fund totaling $11,434 for the period.
Annual Report
10. Other.
The Fund's organizational documents provide former and current trustees and officers with a limited indemnification against liabilities arising in connection with the performance of their duties to the Fund. In the normal course of business, the Fund may also enter into contracts that provide general indemnifications. The Fund's maximum exposure under these arrangements is unknown as this would be dependent on future claims that may be made against the Fund. The risk of material loss from such claims is considered remote.
FMR or its affiliates were the owners of record of 32% of the total outstanding shares of the Fund.
During the period, Lehman Brothers Holdings, Inc. and certain of its affiliates (LBHI) sought protection under the insolvency laws of their jurisdictions of organization, including the United States, the United Kingdom and Japan. At the time LBHI's insolvency proceedings were instituted, the Fund had outstanding securities trades with counterparties affiliated with LBHI. As a result of the insolvency proceedings, LBHI is unable to fulfill its commitments and, in certain cases, the Fund may have terminated its trades and related agreements with the relevant entities and, where appropriate, is in the process of initiating claims for damages. FMR believes that the financial impact to the Fund relating to the terminated trades and agreements is immaterial.
11. Distributions to Shareholders.
Distributions to shareholders of each class were as follows:
| For the period
November 1, 2007
(commencement of operations) to
October 31, 2008 |
From net investment income | |
Total International Equity | $ 13,264 |
Institutional Class | 2,565 |
Total | $ 15,829 |
Annual Report
Fidelity Total International Equity Fund
Notes to Financial Statements - continued
12. Share Transactions.
Transactions for each class of shares were as follows:
| Shares | Dollars |
| For the period
November 1, 2007
(commencement of operations) to
October 31, 2008 | For the period
November 1, 2007
(commencement of operations) to
October 31, 2008 |
Class A | | |
Shares sold | 1,253,571 | $ 11,409,450 |
Shares redeemed | (39,357) | (262,908) |
Net increase (decrease) | 1,214,214 | $ 11,146,542 |
Class T | | |
Shares sold | 536,757 | $ 5,311,723 |
Shares redeemed | (11,156) | (95,096) |
Net increase (decrease) | 525,601 | $ 5,216,627 |
Class B | | |
Shares sold | 516,780 | $ 5,142,958 |
Shares redeemed | (1,184) | (8,679) |
Net increase (decrease) | 515,596 | $ 5,134,279 |
Class C | | |
Shares sold | 576,912 | $ 5,653,538 |
Shares redeemed | (3,409) | (27,077) |
Net increase (decrease) | 573,503 | $ 5,626,461 |
Total International Equity | | |
Shares sold | 7,339,025 | $ 65,416,828 |
Reinvestment of distributions | 1,313 | 12,459 |
Shares redeemed | (2,605,609) | (20,217,092) |
Net increase (decrease) | 4,734,729 | $ 45,212,195 |
Institutional Class | | |
Shares sold | 559,428 | $ 5,503,211 |
Reinvestment of distributions | 270 | 2,565 |
Shares redeemed | (2,678) | (17,158) |
Net increase (decrease) | 557,020 | $ 5,488,618 |
Annual Report
To the Trustees of Fidelity Investment Trust and Shareholders of Fidelity Total International Equity Fund:
We have audited the accompanying statement of assets and liabilities of Fidelity Total International Equity Fund (the Fund), a fund of Fidelity Investment Trust, including the schedule of investments, as of October 31, 2008, and the related statement of operations, the statement of changes in net assets and the financial highlights for the period from November 1, 2007 (Commencement of Operations) to October 31, 2008. These financial statements and financial highlights are the responsibility of the Fund's management. Our responsibility is to express an opinion on these financial statements and financial highlights based on our audit.
We conducted our audit in accordance with standards of the Public Company Accounting Oversight Board (United States). Those standards require that we plan and perform the audit to obtain reasonable assurance about whether the financial statements and financial highlights are free of material misstatement. The Fund is not required to have, nor were we engaged to perform, an audit of its internal control over financial reporting. Our audits included consideration of internal control over financial reporting as a basis for designing audit procedures that are appropriate in the circumstances, but not for the purpose of expressing an opinion on the effectiveness of the Fund's internal control over financial reporting. Accordingly, we express no such opinion. An audit also includes examining, on a test basis, evidence supporting the amounts and disclosures in the financial statements, assessing the accounting principles used and significant estimates made by management, as well as evaluating the overall financial statement presentation. Our procedures included confirmation of securities owned as of October 31, 2008, by correspondence with the custodians and brokers; where replies were not received from brokers, we performed other auditing procedures. We believe that our audit provides a reasonable basis for our opinion.
In our opinion, the financial statements and financial highlights referred to above present fairly, in all material respects, the financial position of Fidelity Total International Equity Fund as of October 31, 2008, the results of its operations, the changes in its net assets and its financial highlights for the period from November 1, 2007 (Commencement of Operations) to October 31, 2008, in conformity with accounting principles generally accepted in the United States of America.
/s/ Deloitte & Touche LLP
DELOITTE & TOUCHE LLP
Boston, Massachusetts
December 23, 2008
Annual Report
The fund designates 100% of the dividends distributed during the fiscal year as amounts which may be taken into account as a dividend for the purposes of the maximum rate under section 1(h)(11) of the Internal Revenue Code.
The fund will notify shareholders in January 2009 of amounts for use in preparing 2008 income tax returns.
Annual Report
Board Approval of Investment Advisory Contracts and Management Fees
Fidelity Total International Equity Fund
Each year, typically in July, the Board of Trustees, including the Independent Trustees (together, the Board), votes on the renewal of the management contract and sub-advisory agreements (together, the Advisory Contracts) for the fund. The Board, assisted by the advice of fund counsel and Independent Trustees' counsel, requests and considers a broad range of information throughout the year.
The Board meets regularly and, acting directly and through its separate committees, requests and receives information concerning, and considers at each of its meetings factors that are relevant to, its annual consideration of the renewal of the fund's Advisory Contracts, including the services and support provided to the fund and its shareholders. At the time of the renewal, the Board had 12 standing committees, each composed of Independent Trustees with varying backgrounds, to which the Board has assigned specific subject matter responsibilities in order to enhance effective decision-making by the Board. Each committee has a written charter outlining the structure and purposes of the committee. The Board also meets as needed to consider matters specifically related to the Board's annual consideration of the renewal of Advisory Contracts.
At its July 2008 meeting, the Board of Trustees, including the Independent Trustees, unanimously determined to renew the fund's Advisory Contracts. In reaching its determination, the Board considered all factors it believed relevant, including (i) the nature, extent, and quality of the services to be provided to the fund and its shareholders (including the investment performance of the fund); (ii) the competitiveness of the fund's management fee and total expenses; (iii) the total costs of the services to be provided by and the profits to be realized by Fidelity from its relationship with the fund; (iv) the extent to which economies of scale would be realized as the fund grows; and (v) whether fee levels reflect these economies of scale, if any, for the benefit of fund shareholders. The Board also approved agreements with foreign sub-advisers Fidelity Management & Research (Japan) Inc. and Fidelity Management & Research (Hong Kong) Limited, as well as amendments to the fund's agreement with Fidelity Management & Research (U.K.) Inc.
In considering whether to renew the Advisory Contracts for the fund, the Board ultimately reached a determination, with the assistance of fund counsel and Independent Trustees' counsel and through the exercise of its business judgment, that the renewal of the Advisory Contracts and the compensation to be received by Fidelity under the management contract is consistent with Fidelity's fiduciary duty under applicable law. The Board's decision to renew the Advisory Contracts was not based on any single factor noted above, but rather was based on a comprehensive consideration of all the information provided to the Board at its meetings throughout the year. The Board, in reaching its determination to renew the Advisory Contracts, is aware that shareholders in the fund have a broad range of investment choices available to them, including a wide choice among mutual funds offered by competitors to Fidelity, and that the fund's shareholders, with the opportunity to review and weigh the disclosure provided by the fund in its prospectus and other public disclosures, have chosen to invest in this fund, managed by Fidelity.
Annual Report
Board Approval of Investment Advisory Contracts and
Management Fees - continued
Nature, Extent, and Quality of Services Provided. The Board considered staffing within the investment adviser, FMR, and the sub-advisers (together, the Investment Advisers), including the backgrounds of the fund's investment personnel and the fund's investment objective and discipline. The Independent Trustees also had discussions with senior management of Fidelity's investment operations and investment groups. The Board considered the structure of the portfolio manager compensation program and whether this structure provides appropriate incentives.
Resources Dedicated to Investment Management and Support Services. The Board reviewed the size, education, and experience of the Investment Advisers' investment staff, their use of technology, and the Investment Advisers' approach to recruiting, training, and retaining portfolio managers and other research, advisory, and management personnel. The Board noted that Fidelity's analysts have access to a variety of technological tools that enable them to perform both fundamental and quantitative analysis and to specialize in various disciplines. The Board considered Fidelity's extensive global research capabilities that enable the Investment Advisers to aggregate data from various sources in an effort to produce positive investment results. The Board also considered that Fidelity's portfolio managers and analysts have access to daily portfolio attribution that allows for monitoring of a fund's portfolio, as well as an electronic communication system that provides immediate real-time access to research concerning issuers and credit enhancers.
Shareholder and Administrative Services. The Board considered (i) the nature, extent, quality, and cost of advisory, administrative, distribution, and shareholder services performed by the Investment Advisers and their affiliates under the Advisory Contracts and under separate agreements covering transfer agency, pricing and bookkeeping, fund-paid 12b-1 fees, and securities lending services for the fund; (ii) the nature and extent of the Investment Advisers' supervision of third party service providers, principally custodians and subcustodians; and (iii) the resources devoted to, and the record of compliance with, the fund's compliance policies and procedures. The Board also reviewed the allocation of fund brokerage, including allocations to brokers affiliated with the Investment Advisers, the use of brokerage commissions to pay fund expenses, and the use of "soft" commission dollars to pay for research services. The Board further considered that Fidelity voluntarily pays for market data out of its own resources.
The Board noted that the growth of fund assets across the complex allows Fidelity to reinvest in the development of services designed to enhance the value or convenience of the Fidelity funds as investment vehicles. These services include 24-hour access to account information and market information through phone representatives and over the Internet, and investor education materials and asset allocation tools.
Annual Report
Investment in a Large Fund Family. The Board considered the benefits to shareholders of investing in a Fidelity fund, including the benefits of investing in a fund that is part of a large family of funds offering a variety of investment disciplines and providing for a large variety of mutual fund investor services. For example, fund shareholders are offered the privilege of exchanging shares of the fund for shares of other Fidelity funds, as set forth in the fund's prospectus, without paying a sales charge. The Board noted that Fidelity has taken a number of actions over the previous year that benefited particular funds, including (i) dedicating additional resources to investment research and to restructure the investment research teams; (ii) contractually agreeing to reduce the management fees on Fidelity's Institutional Money Market Funds and launching Class IV and Institutional Class of certain of these funds; (iii) reducing the transfer agent fees for the Fidelity Select Portfolios and Investor Class of the VIP funds; and (iv) launching Class K of 29 equity funds as a lower-fee class available to certain employer-sponsored retirement plans.
Investment Performance. The Board considered whether the fund has operated within its investment objective, as well as its record of compliance with its investment restrictions. The Board noted that it is not possible to evaluate performance in any comprehensive fashion because the fund had been in operation for less than one calendar year. Once the fund has been in operation for at least one calendar year, the Board will review the fund's absolute investment performance for each class, as well as the fund's relative investment performance for each class measured against a broad-based securities market index and a peer group of mutual funds.
The Board considered that FMR has taken steps to refocus and strengthen equity research, equity portfolio management, and compliance.
Based on its review, and giving particular weight to the nature and quality of the resources dedicated by the Investment Advisers to maintain and improve relative performance, the Board concluded that the nature, extent, and quality of the services provided to the fund will benefit the fund's shareholders, particularly in light of the Board's view that the fund's shareholders benefit from investing in a fund that is part of a large family of funds offering a variety of investment disciplines and services.
Competitiveness of Management Fee and Total Fund Expenses. The Board considered the fund's management fee and total expenses compared to "mapped groups" of competitive funds and classes. Fidelity creates "mapped groups" by combining similar Lipper investment objective categories that have comparable management fee characteristics. Combining Lipper investment objective categories aids the Board's management fee and total expense comparisons by broadening the competitive group used for comparison and by reducing the number of universes to which various Fidelity funds are compared. The Board also considered supplemental information about how the fund's management fee and total expenses ranked relative to groups based on Lipper classifications, which take into account a fund's market capitalization and style.
Annual Report
Board Approval of Investment Advisory Contracts and
Management Fees - continued
The Board considered two proprietary management fee comparisons for the period of the fund's operations shown in the chart below. The group of Lipper funds used by the Board for management fee comparisons is referred to below as the "Total Mapped Group." The Total Mapped Group comparison focuses on a fund's standing relative to the total universe of comparable funds available to investors, in terms of gross management fees before expense reimbursements or caps. "TMG %" represents the percentage of funds in the Total Mapped Group that had management fees that were lower than the fund's. For example, a TMG % of 14% means that 86% of the funds in the Total Mapped Group had higher management fees than the fund. The "Asset-Size Peer Group" (ASPG) comparison focuses on a fund's standing relative to non-Fidelity funds similar in size to the fund within the Total Mapped Group. The ASPG represents at least 15% of the funds in the Total Mapped Group with comparable asset size and management fee characteristics, subject to a minimum of 50 funds (or all funds in the Total Mapped Group if fewer than 50). Additional information, such as the ASPG quartile in which the fund's management fee ranked, is also included in the chart and considered by the Board.
Fidelity Total International Equity Fund

The Board noted that the fund's management fee ranked below the median of its Total Mapped Group and below the median of its ASPG for the period.
Furthermore, the Board considered that the fund's management fee includes a performance adjustment component (that is, the fund's management fee will be subject to upward or downward adjustment depending upon whether, and to what extent, the fund's investment performance for the performance period exceeds, or is exceeded by, the record (over the same period) of a Board-approved performance adjustment index). The performance adjustment will take effect on November 1, 2008, after the period shown in the chart above.
Annual Report
Based on its review, the Board concluded that the fund's management fee was fair and reasonable in light of the services that the fund receives and the other factors considered.
In its review of each class's total expenses, the Board considered the fund's management fee as well as other fund or class expenses, as applicable, such as transfer agent fees, pricing and bookkeeping fees, fund-paid 12b-1 fees, and custodial, legal, and audit fees. The Board also noted the effects of any waivers and reimbursements on fees and expenses. As part of its review, the Board also considered current and historical total expenses of each class of the fund compared to competitive fund median expenses. Each class of the fund is compared to those funds and classes in the Total Mapped Group (used by the Board for management fee comparisons) that have a similar sales load structure.
The Board noted that the total expenses of each of Class A and Fidelity Total International Equity (retail class) ranked equal to its competitive median for the period and the total expenses of each of Class T, Class B, Class C, and Institutional Class ranked above its competitive median for the period. The Board considered that the total expenses of Class T were above the median primarily because its 12b-1 fee is higher than the typical front-end load class. The Board noted that the fund offers multiple classes, each of which has a different sales load and 12b-1 fee structure, and that the multiple structures are intended to offer a range of pricing options for the intermediary market. The Board also noted that the total expenses of the classes vary primarily by the level of their 12b-1 fees, although differences in transfer agent fees may also cause expenses to vary from class to class.
In its review of total expenses, the Board also considered Fidelity fee structures and other information on clients that FMR and its affiliates service in other competitive markets, such as other mutual funds advised or subadvised by FMR or its affiliates, pension plan clients, and other institutional clients.
Based on its review, the Board concluded that the total expenses of each class of the fund were reasonable, although in some cases above the median of the universe presented for comparison, in light of the services that the fund and its shareholders receive and the other factors considered.
Costs of the Services and Profitability. The Board considered the revenues earned and the expenses incurred by Fidelity in conducting the business of developing, marketing, distributing, managing, administering and servicing the fund and its shareholders. The Board also considered the level of Fidelity's profits in respect of all the Fidelity funds.
Annual Report
Board Approval of Investment Advisory Contracts and
Management Fees - continued
On an annual basis, FMR presents to the Board Fidelity's profitability for the fund. Fidelity calculates the profitability for each fund, as well as aggregate profitability for groups of Fidelity funds and all Fidelity funds, using a series of detailed revenue and cost allocation methodologies which originate with the audited books and records of Fidelity. The Audit Committee of the Board reviews any significant changes from the prior year's methodologies.
PricewaterhouseCoopers LLP (PwC), independent registered public accounting firm and auditor to Fidelity and certain Fidelity funds, has been engaged annually by the Board as part of the Board's assessment of the results of Fidelity's profitability analysis. PwC's engagement includes the review and assessment of Fidelity's methodologies used in determining the revenues and expenses attributable to Fidelity's mutual fund business, and completion of agreed-upon procedures surrounding the mathematical accuracy of fund profitability and its conformity to allocation methodologies. After considering PwC's reports issued under the engagement and information provided by Fidelity, the Board believes that while other allocation methods may also be reasonable, Fidelity's profitability methodologies are reasonable in all material respects.
The Board has also reviewed Fidelity's non-fund businesses and any fall-out benefits related to the mutual fund business as well as cases where Fidelity's affiliates may benefit from or be related to the fund's business.
The Board considered the costs of the services provided by and the profits realized by Fidelity in connection with the operation of the fund and determined that the amount of profit is a fair entrepreneurial profit for the management of the fund.
Economies of Scale. The Board considered whether there have been economies of scale in respect of the management of the Fidelity funds, whether the Fidelity funds (including the fund) have appropriately benefited from any such economies of scale, and whether there is potential for realization of any further economies of scale. The Board considered the extent to which the fund will benefit from economies of scale through increased services to the fund, through waivers or reimbursements, or through fee or expense reductions.
The Board recognized that the fund's management contract incorporates a "group fee" structure, which provides for lower group fee rates as total fund assets under FMR's management increase, and for higher group fee rates as total fund assets under FMR's management decrease. FMR determines the group fee rates based on a tiered asset "breakpoint" schedule. The Board considered that the group fee is designed to deliver the benefits of economies of scale to fund shareholders when total fund assets increase, even if assets of any particular fund are unchanged or have declined, because some portion of Fidelity's costs are attributable to services provided to all Fidelity funds, and all funds benefit if those costs can be allocated among more assets. The Board concluded that, given the group fee structure, fund shareholders will achieve a certain level of economies of scale as assets under FMR's management increase at the fund complex level, regardless of whether Fidelity achieves any such economies of scale.
Annual Report
The Board further concluded that any potential economies of scale are being shared between fund shareholders and Fidelity in an appropriate manner.
Additional Information Requested by the Board. In order to develop fully the factual basis for consideration of the Fidelity funds' Advisory Contracts, the Board requested and received additional information on certain topics, including (i) fund performance trends and actions to be taken by FMR to improve certain funds' overall performance; (ii) portfolio manager changes that have occurred during the past year; (iii) Fidelity's fund profitability methodology, the profitability of certain fund service providers, and profitability trends for certain funds; (iv) Fidelity's compensation structure for portfolio managers and key personnel, including its effects on fund profitability and the extent to which portfolio manager compensation is linked to fund performance; (v) Fidelity's fee structures and rationale for recommending different fees among categories of funds; and (vi) Fidelity's rationale for recommending which funds should have a performance adjustment component as part of their management fees.
Based on its evaluation of all of the conclusions noted above, and after considering all material factors, the Board ultimately concluded that the advisory fee structures are fair and reasonable, and that the fund's Advisory Contracts should be renewed.
Annual Report
Fidelity International Growth Fund
Performance: The Bottom Line
Average annual total return reflects the change in the value of an investment, assuming reinvestment of the fund's dividend income and capital gains (the profits earned upon the sale of securities that have grown in value, if any) and assuming a constant rate of performance each year. The $10,000 table and the fund's returns do not reflect the deduction of taxes that a shareholder would pay on fund distributions or the redemption of fund shares. During periods of reimbursement by Fidelity, a fund's total return will be greater than it would be had the reimbursement not occurred. How a fund did yesterday is no guarantee of how it will do tomorrow.
Average annual total returns take International Growth's cumulative total return and show you what would have happened if International Growth shares had performed at a constant rate each year. These numbers will be reported once the fund is a year old.
$10,000 Over Life of Fund
Let's say hypothetically that $10,000 was invested in International Growth, a class of the fund, on November 1, 2007, when the fund started. The chart shows how the value of your investment would have changed, and also shows how MSCI EAFE® (Europe, Australasia, Far East) Growth Index performed over the same period.
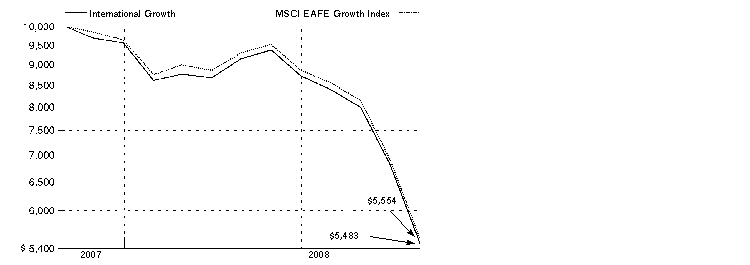
Annual Report
Fidelity International Growth Fund
Comments from Jed Weiss, Portfolio Manager of Fidelity® International Growth Fund
In a dramatic reversal of what had been a multiyear global growth story, international stocks fell long and hard during the 12 months ending October 31, 2008, especially so during the latter stages of the period and mostly as a result of fallout from the financial crisis that emanated from the United States. The viral spread of this financial contagion - which began in the U.S. subprime mortgage market, then seized up the credit markets, hobbled major financial institutions and eventually slowed economic growth worldwide - left virtually no corner of the globe untouched. Developed international equity markets - as gauged by the MSCI® Europe, Australasia, Far East (EAFE®) Index, which monitors established markets outside the U.S. and Canada - fell 46.54%, while the Standard & Poor's 500SM Index, a measure of U.S. stocks, dropped 36.10%. Among countries constituting at least 1% of the EAFE index, Switzerland had the "least worst" showing, falling roughly 32%, followed by Japan, where stocks slid by around 37%. Meanwhile, the weakest overall performance came from Belgium, where stocks slipped by nearly 70%. In the United Kingdom, the largest component of the index, equities were down almost 48%. Emerging markets were the weakest performers among the global economies, declining 56.22% as measured by the MSCI Emerging Markets Index.
For the period from the fund's inception on November 1, 2007, through October 31, 2008, the fund's Retail Class shares declined 45.17%, while the MSCI EAFE Growth Index fell 44.46%. The fund underperformed its benchmark partially due to unfavorable stock selection in the energy and information technology sectors. An overweighting and poor stock picks in diversified financials also detracted, as did not owning a position in German automaker Volkswagen, which had an extraordinary gain late in the period on heavy buying by a take-over suitor. Among other detracting factors were underweighted stakes in two solid-performing pharmaceuticals stocks - U.K.-based GlaxoSmithKline and Switzerland's Novartis - and an overweighted position in Singapore Exchange, a regional stock market. The fund was overweighted in consumer staples - especially in the food, beverage and tobacco group - and this defensive orientation helped, especially our sizable stake in Nestle, the Swiss multinational packaged goods company. Other contributors included Torishima Pump Manufacturing, a Japanese maker of pressure pumps used in desalination and power projects that I sold to take profits, and CSL Ltd., an Australian biopharmaceutical company that focuses on blood plasma products.
The views expressed above reflect those of the portfolio manager(s) only through the end of the period as stated on the cover of this report and do not necessarily represent the views of Fidelity or any other person in the Fidelity organization. Any such views are subject to change at any time based upon market or other conditions and Fidelity disclaims any responsibility to update such views. These views may not be relied on as investment advice and, because investment decisions for a Fidelity fund are based on numerous factors, may not be relied on as an indication of trading intent on behalf of any Fidelity fund.
Annual Report
Fidelity International Growth Fund
Shareholder Expense Example
As a shareholder of the Fund, you incur two types of costs: (1) transaction costs, including sales charges (loads) on purchase payments or redemption proceeds, redemption fees, and (2) ongoing costs, including management fees, distribution and/or service (12b-1) fees and other Fund expenses. This Example is intended to help you understand your ongoing costs (in dollars) of investing in the Fund and to compare these costs with the ongoing costs of investing in other mutual funds.
The Example is based on an investment of $1,000 invested at the beginning of the period and held for the entire period (May 1, 2008 to October 31, 2008).
Actual Expenses
The first line of the accompanying table for each class of the Fund provides information about actual account values and actual expenses. You may use the information in this line, together with the amount you invested, to estimate the expenses that you paid over the period. Simply divide your account value by $1,000.00 (for example, an $8,600 account value divided by $1,000.00 = 8.6), then multiply the result by the number in the first line for a class of the Fund under the heading entitled "Expenses Paid During Period" to estimate the expenses you paid on your account during this period. A small balance maintenance fee of $12.00 that is charged once a year may apply for certain accounts with a value of less than $2,000. This fee is not included in the table below. If it was, the estimate of expenses you paid during the period would be higher, and your ending account value lower, by this amount.
Hypothetical Example for Comparison Purposes
The second line of the accompanying table for each class of the Fund provides information about hypothetical account values and hypothetical expenses based on a Class' actual expense ratio and an assumed rate of return of 5% per year before expenses, which is not the Class' actual return. The hypothetical account values and expenses may not be used to estimate the actual ending account balance or expenses you paid for the period. You may use this information to compare the ongoing costs of investing in the Fund and other funds. To do so, compare this 5% hypothetical example with the 5% hypothetical examples that appear in the shareholder reports of the other funds. A small balance maintenance fee of $12.00 that is charged once a year may apply for certain accounts with a value of less than $2,000. This fee is not included in the table below. If it was, the estimate of expenses you paid during the period would be higher, and your ending account value lower, by this amount.
Please note that the expenses shown in the table are meant to highlight your ongoing costs only and do not reflect any transaction costs. Therefore, the second line of the table is useful in comparing ongoing costs only, and will not help you determine the relative total costs of owning different funds. In addition, if these transactional costs were included, your costs would have been higher.
Annual Report
| Annualized
Expense Ratio | Beginning
Account Value
May 1, 2008 | Ending
Account Value
October 31, 2008 | Expenses Paid
During Period*
May 1, 2008
to October 31, 2008 |
Class A | 1.50% | | | |
Actual | | $ 1,000.00 | $ 598.00 | $ 6.03 |
HypotheticalA | | $ 1,000.00 | $ 1,017.60 | $ 7.61 |
Class T | 1.75% | | | |
Actual | | $ 1,000.00 | $ 597.60 | $ 7.03 |
HypotheticalA | | $ 1,000.00 | $ 1,016.34 | $ 8.87 |
Class B | 2.25% | | | |
Actual | | $ 1,000.00 | $ 595.60 | $ 9.02 |
HypotheticalA | | $ 1,000.00 | $ 1,013.83 | $ 11.39 |
Class C | 2.25% | | | |
Actual | | $ 1,000.00 | $ 595.60 | $ 9.02 |
HypotheticalA | | $ 1,000.00 | $ 1,013.83 | $ 11.39 |
International Growth | 1.25% | | | |
Actual | | $ 1,000.00 | $ 599.60 | $ 5.03 |
HypotheticalA | | $ 1,000.00 | $ 1,018.85 | $ 6.34 |
Institutional Class | 1.25% | | | |
Actual | | $ 1,000.00 | $ 599.60 | $ 5.03 |
HypotheticalA | | $ 1,000.00 | $ 1,018.85 | $ 6.34 |
A 5% return per year before expenses
* Expenses are equal to each Class' annualized expense ratio, multiplied by the average account value over the period, multiplied by 184/366 (to reflect the one-half year period).
Annual Report
Fidelity International Growth Fund
Investment Changes (Unaudited)
Geographic Diversification (% of fund's net assets) |
As of October 31, 2008 |
| Switzerland 18.2% |
| United Kingdom 16.4% |
| United States of America 13.1% |
| Japan 10.2% |
| Australia 6.7% |
| Germany 5.9% |
| France 4.6% |
| Spain 3.8% |
| Netherlands 2.9% |
| Other 18.2% |

Percentages are adjusted for the effect of futures contracts, if applicable. |
As of April 30, 2008 |
| United Kingdom 18.6% |
| Switzerland 10.2% |
| United States of America 8.6% |
| Germany 8.6% |
| Japan 7.9% |
| France 7.0% |
| Australia 5.8% |
| Canada 3.9% |
| South Africa 3.8% |
| Other 25.6% |

Percentages are adjusted for the effect of futures contracts, if applicable. |
Asset Allocation as of October 31, 2008 |
| % of fund's
net assets | % of fund's net assets
6 months ago |
Stocks and Investment Companies | 99.1 | 99.6 |
Short-Term Investments and Net Other Assets | 0.9 | 0.4 |
Top Ten Stocks as of October 31, 2008 |
| % of fund's
net assets | % of fund's net assets
6 months ago |
Nestle SA (Reg.) (Switzerland, Food Products) | 7.7 | 4.5 |
Roche Holding AG (participation certificate) (Switzerland, Pharmaceuticals) | 4.8 | 2.3 |
Novartis AG sponsored ADR (Switzerland, Pharmaceuticals) | 3.6 | 0.0 |
CSL Ltd. (Australia, Biotechnology) | 3.6 | 2.3 |
E.ON AG (Germany, Electric Utilities) | 3.6 | 3.2 |
Reckitt Benckiser Group PLC (United Kingdom, Household Products) | 2.9 | 1.5 |
Mitsubishi UFJ Financial Group, Inc. sponsored ADR (Japan, Commercial Banks) | 2.7 | 0.0 |
Woolworths Ltd. (Australia, Food & Staples Retailing) | 2.6 | 1.2 |
BAE Systems PLC (United Kingdom, Aerospace & Defense) | 2.4 | 1.5 |
Visa, Inc. (United States of America, IT Services) | 2.1 | 0.8 |
| 36.0 | |
Market Sectors as of October 31, 2008 |
| % of fund's
net assets | % of fund's net assets
6 months ago |
Consumer Staples | 25.0 | 17.4 |
Health Care | 17.6 | 8.0 |
Financials | 12.2 | 9.2 |
Information Technology | 10.6 | 11.3 |
Industrials | 8.0 | 14.5 |
Materials | 7.3 | 15.7 |
Telecommunication Services | 7.1 | 6.6 |
Utilities | 5.1 | 5.0 |
Consumer Discretionary | 3.6 | 5.1 |
Energy | 2.6 | 4.9 |
Annual Report
Fidelity International Growth Fund
Investments October 31, 2008
Showing Percentage of Net Assets
Common Stocks - 99.1% |
| Shares | | Value |
Australia - 6.7% |
CSL Ltd. | 22,127 | | $ 537,841 |
QBE Insurance Group Ltd. | 4,688 | | 79,940 |
Woolworths Ltd. | 21,117 | | 393,449 |
TOTAL AUSTRALIA | | 1,011,230 |
Belgium - 1.0% |
InBev SA | 3,600 | | 145,199 |
Bermuda - 0.3% |
Ports Design Ltd. | 44,000 | | 51,153 |
Brazil - 1.1% |
BM&F BOVESPA SA | 6,800 | | 18,067 |
Companhia Vale do Rio Doce sponsored ADR | 3,000 | | 39,360 |
Petroleo Brasileiro SA - Petrobras sponsored ADR | 3,900 | | 104,871 |
TOTAL BRAZIL | | 162,298 |
Canada - 2.4% |
Agnico-Eagle Mines Ltd. | 3,600 | | 99,300 |
Goldcorp, Inc. | 8,000 | | 149,544 |
Harry Winston Diamond Corp. | 4,100 | | 39,953 |
Potash Corp. of Saskatchewan, Inc. | 800 | | 68,208 |
TOTAL CANADA | | 357,005 |
Cayman Islands - 0.2% |
China Dongxiang Group Co. Ltd. | 124,000 | | 36,480 |
Denmark - 1.5% |
Novo Nordisk AS Series B sponsored ADR | 2,700 | | 144,477 |
Vestas Wind Systems AS (a) | 1,960 | | 80,281 |
TOTAL DENMARK | | 224,758 |
Finland - 1.0% |
Nokia Corp. sponsored ADR | 10,000 | | 151,800 |
France - 4.6% |
Alstom SA | 2,310 | | 114,492 |
Audika SA | 1,900 | | 44,302 |
Delachaux SA | 709 | | 38,995 |
GDF Suez | 5,202 | | 232,527 |
Groupe Danone | 2,595 | | 144,492 |
L'Air Liquide SA | 600 | | 51,777 |
Laurent-Perrier Group | 290 | | 23,511 |
Remy Cointreau SA | 1,104 | | 45,937 |
TOTAL FRANCE | | 696,033 |
Common Stocks - continued |
| Shares | | Value |
Germany - 5.9% |
Bayer AG | 2,200 | | $ 122,473 |
E.ON AG | 14,000 | | 535,595 |
Linde AG | 800 | | 67,185 |
Siemens AG sponsored ADR | 2,800 | | 168,420 |
TOTAL GERMANY | | 893,673 |
Hong Kong - 0.4% |
Hong Kong Exchanges & Clearing Ltd. | 6,500 | | 65,915 |
India - 1.1% |
Bharti Airtel Ltd. (a) | 12,423 | | 168,210 |
Ireland - 0.3% |
CRH PLC sponsored ADR | 2,000 | | 42,320 |
Israel - 1.4% |
Partner Communications Co. Ltd. ADR | 11,400 | | 212,952 |
Japan - 10.2% |
Dydo Drinco, Inc. | 800 | | 19,201 |
East Japan Railway Co. | 8 | | 56,925 |
Kobayashi Pharmaceutical Co. Ltd. | 2,100 | | 67,279 |
Mitsubishi UFJ Financial Group, Inc. sponsored ADR | 63,600 | | 398,772 |
Nagaileben Co. Ltd. | 1,000 | | 19,855 |
Nintendo Co. Ltd. | 700 | | 218,400 |
Nippon Building Fund, Inc. | 5 | | 48,043 |
Osaka Securities Exchange Co. Ltd. | 9 | | 29,572 |
Ozeki Co. Ltd. | 200 | | 4,888 |
Promise Co. Ltd. | 5,750 | | 103,202 |
Seven & I Holdings Co. Ltd. | 2,000 | | 56,153 |
Shiseido Co. Ltd. | 5,000 | | 103,000 |
Sony Financial Holdings, Inc. | 33 | | 107,320 |
Sumitomo Mitsui Financial Group, Inc. | 39 | | 156,338 |
Tsutsumi Jewelry Co. Ltd. | 2,800 | | 54,547 |
USS Co. Ltd. | 1,470 | | 90,033 |
TOTAL JAPAN | | 1,533,528 |
Korea (South) - 0.5% |
NHN Corp. (a) | 660 | | 70,456 |
Mexico - 1.6% |
America Movil SAB de CV Series L sponsored ADR | 4,700 | | 145,418 |
Fomento Economico Mexicano SA de CV sponsored ADR | 1,300 | | 32,877 |
Wal-Mart de Mexico SA de CV Series V | 26,000 | | 69,845 |
TOTAL MEXICO | | 248,140 |
Common Stocks - continued |
| Shares | | Value |
Netherlands - 2.9% |
ASML Holding NV (NY Shares) | 15,400 | | $ 270,270 |
Koninklijke KPN NV | 3,500 | | 49,291 |
QIAGEN NV (a) | 2,600 | | 37,076 |
Unilever NV (NY Shares) | 3,200 | | 76,960 |
TOTAL NETHERLANDS | | 433,597 |
Papua New Guinea - 0.2% |
Lihir Gold Ltd. sponsored ADR (a) | 2,500 | | 31,950 |
Philippines - 0.2% |
Jollibee Food Corp. | 32,400 | | 30,525 |
Singapore - 0.3% |
Singapore Exchange Ltd. | 12,000 | | 42,953 |
South Africa - 1.9% |
African Rainbow Minerals Ltd. | 6,439 | | 65,247 |
MTN Group Ltd. | 19,500 | | 217,554 |
TOTAL SOUTH AFRICA | | 282,801 |
Spain - 3.8% |
Grifols SA | 9,132 | | 181,734 |
Inditex SA | 2,200 | | 74,365 |
Prosegur Comp Securidad SA (Reg.) | 1,500 | | 42,614 |
Telefonica SA sponsored ADR | 4,800 | | 266,448 |
TOTAL SPAIN | | 565,161 |
Sweden - 1.7% |
H&M Hennes & Mauritz AB (B Shares) | 3,800 | | 136,239 |
Swedish Match Co. | 8,400 | | 116,627 |
TOTAL SWEDEN | | 252,866 |
Switzerland - 18.2% |
ABB Ltd. sponsored ADR | 5,100 | | 67,065 |
Credit Suisse Group sponsored ADR | 2,000 | | 74,800 |
EFG International | 3,950 | | 85,016 |
Nestle SA (Reg.) | 29,808 | | 1,158,896 |
Novartis AG sponsored ADR | 10,600 | | 540,494 |
Roche Holding AG (participation certificate) | 4,695 | | 717,837 |
Sonova Holding AG | 1,177 | | 48,894 |
The Swatch Group AG (Reg.) | 1,651 | | 47,266 |
TOTAL SWITZERLAND | | 2,740,268 |
Turkey - 1.1% |
Anadolu Efes Biracilik ve Malt Sanyii AS | 10,800 | | 90,959 |
Common Stocks - continued |
| Shares | | Value |
Turkey - continued |
Asya Katilim Bankasi AS | 42,500 | | $ 37,171 |
Tupras-Turkiye Petrol Rafinerileri AS | 3,500 | | 44,216 |
TOTAL TURKEY | | 172,346 |
United Kingdom - 16.4% |
Autonomy Corp. PLC (a) | 8,300 | | 131,586 |
BAE Systems PLC | 64,600 | | 363,069 |
BG Group PLC | 14,700 | | 216,121 |
BHP Billiton PLC ADR | 9,000 | | 308,970 |
British American Tobacco PLC sponsored ADR | 3,000 | | 163,080 |
Datacash Group PLC | 11,200 | | 38,994 |
Man Group PLC | 27,737 | | 160,119 |
Reckitt Benckiser Group PLC | 10,400 | | 439,864 |
Rio Tinto PLC sponsored ADR | 750 | | 139,403 |
Serco Group PLC | 45,200 | | 269,520 |
Tesco PLC | 42,600 | | 233,381 |
TOTAL UNITED KINGDOM | | 2,464,107 |
United States of America - 12.2% |
Allergan, Inc. | 1,900 | | 75,373 |
Berkshire Hathaway, Inc. Class B (a) | 80 | | 307,200 |
FMC Technologies, Inc. (a) | 1,000 | | 34,990 |
Gilead Sciences, Inc. (a) | 3,500 | | 160,475 |
JPMorgan Chase & Co. | 3,000 | | 123,750 |
Juniper Networks, Inc. (a) | 11,200 | | 209,888 |
Lululemon Athletica, Inc. (a) | 300 | | 4,251 |
MasterCard, Inc. Class A | 700 | | 103,474 |
Mohawk Industries, Inc. (a) | 700 | | 33,866 |
Philip Morris International, Inc. | 6,900 | | 299,943 |
Pricesmart, Inc. | 6,905 | | 102,885 |
Varian Semiconductor Equipment Associates, Inc. (a) | 2,800 | | 54,936 |
Visa, Inc. | 5,800 | | 321,030 |
TOTAL UNITED STATES OF AMERICA | | 1,832,061 |
TOTAL COMMON STOCKS (Cost $21,022,747) | 14,919,785 |
Cash Equivalents - 1.4% |
| Maturity Amount | | Value |
Investments in repurchase agreements in a joint trading account at 0.14%, dated 10/31/08 due 11/3/08 (Collateralized by U.S. Treasury Obligations) #
(Cost $220,000) | $ 220,003 | | $ 220,000 |
TOTAL INVESTMENT PORTFOLIO - 100.5% (Cost $21,242,747) | | 15,139,785 |
NET OTHER ASSETS - (0.5)% | | (81,700) |
NET ASSETS - 100% | $ 15,058,085 |
Legend |
(a) Non-income producing |
# Additional Information on each counterparty to the repurchase agreement is as follows: |
Repurchase Agreement / Counterparty | Value |
$220,000 due 11/03/08 at 0.14% |
BNP Paribas Securities Corp. | $ 14,823 |
Banc of America Securities LLC | 29,645 |
Barclays Capital, Inc. | 29,645 |
Deutsche Bank Securities, Inc. | 77,078 |
Morgan Stanley & Co., Inc. | 2,107 |
UBS Securities LLC | 66,702 |
| $ 220,000 |
Affiliated Central Funds |
Information regarding fiscal year to date income earned by the Fund from investments in Fidelity Central Funds is as follows: |
Fund | Income earned |
Fidelity Securities Lending Cash Central Fund | $ 796 |
Income Tax Information |
At October 31, 2008, the fund had a capital loss carryforward of approximately $4,969,583 all of which will expire on October 31, 2016. |
See accompanying notes which are an integral part of the financial statements.
Annual Report
Fidelity International Growth Fund
Statement of Assets and Liabilities
| October 31, 2008 |
| | |
Assets | | |
Investment in securities, at value (including repurchase agreements of $220,000) - See accompanying schedule: Unaffiliated issuers (cost $21,242,747) | | $ 15,139,785 |
Cash | | 826 |
Receivable for investments sold | | 209,595 |
Receivable for fund shares sold | | 41,993 |
Dividends receivable | | 38,609 |
Distributions receivable from Fidelity Central Funds | | 556 |
Receivable from investment adviser for expense reductions | | 53,322 |
Other receivables | | 953 |
Total assets | | 15,485,639 |
| | |
Liabilities | | |
Payable for investments purchased | $ 301,583 | |
Payable for fund shares redeemed | 60,128 | |
Accrued management fee | 9,220 | |
Distribution fees payable | 1,501 | |
Other affiliated payables | 5,737 | |
Other payables and accrued expenses | 49,385 | |
Total liabilities | | 427,554 |
| | |
Net Assets | | $ 15,058,085 |
Net Assets consist of: | | |
Paid in capital | | $ 26,452,349 |
Undistributed net investment income | | 181,332 |
Accumulated undistributed net realized gain (loss) on investments and foreign currency transactions | | (5,470,327) |
Net unrealized appreciation (depreciation) on investments and assets and liabilities in foreign currencies | | (6,105,269) |
Net Assets | | $ 15,058,085 |
See accompanying notes which are an integral part of the financial statements.
Annual Report
Fidelity International Growth Fund
Financial Statements - continued
Statement of Assets and Liabilities - continued
| October 31, 2008 |
| | |
Calculation of Maximum Offering Price
Class A:
Net Asset Value and redemption price per share ($819,539 ÷ 149,987 shares) | | $ 5.46 |
| | |
Maximum offering price per share (100/94.25 of $5.46) | | $ 5.79 |
Class T:
Net Asset Value and redemption price per share ($507,240 ÷ 93,049 shares) | | $ 5.45 |
| | |
Maximum offering price per share (100/96.50 of $5.45) | | $ 5.65 |
Class B:
Net Asset Value and offering price per share
($642,349 ÷ 118,413 shares)A | | $ 5.42 |
| | |
Class C:
Net Asset Value and offering price per share
($683,961 ÷ 126,111 shares)A | | $ 5.42 |
| | |
International Growth:
Net Asset Value, offering price and redemption price per share ($11,883,653 ÷ 2,170,400 shares) | | $ 5.48 |
| | |
Institutional Class:
Net Asset Value, offering price and redemption price per share ($521,343 ÷ 95,209 shares) | | $ 5.48 |
A Redemption price per share is equal to net asset value less any applicable contingent deferred sales charge.
See accompanying notes which are an integral part of the financial statements.
Annual Report
Statement of Operations
For the period November 1, 2007
(commencement of operations)
to October 31, 2008 |
Investment Income | | |
Dividends | | $ 518,866 |
Interest | | 15,254 |
Income from Fidelity Central Funds | | 796 |
| | 534,916 |
Less foreign taxes withheld | | (45,586) |
Total income | | 489,330 |
| | |
Expenses | | |
Management fee | $ 151,935 | |
Transfer agent fees | 62,596 | |
Distribution fees | 24,223 | |
Accounting and security lending fees | 11,180 | |
Custodian fees and expenses | 112,910 | |
Independent trustees' compensation | 87 | |
Registration fees | 124,200 | |
Audit | 48,886 | |
Legal | 74 | |
Miscellaneous | 1,905 | |
Total expenses before reductions | 537,996 | |
Expense reductions | (249,208) | 288,788 |
Net investment income (loss) | | 200,542 |
Realized and Unrealized Gain (Loss) Net realized gain (loss) on: | | |
Investment securities: | | |
Unaffiliated issuers | (5,463,869) | |
Foreign currency transactions | (18,590) | |
Total net realized gain (loss) | | (5,482,459) |
Change in net unrealized appreciation (depreciation) on: Investment securities | (6,103,378) | |
Assets and liabilities in foreign currencies | (1,891) | |
Total change in net unrealized appreciation (depreciation) | | (6,105,269) |
Net gain (loss) | | (11,587,728) |
Net increase (decrease) in net assets resulting from operations | | $ (11,387,186) |
See accompanying notes which are an integral part of the financial statements.
Annual Report
Fidelity International Growth Fund
Financial Statements - continued
Statement of Changes in Net Assets
| For the period
November 1, 2007
(commencement of
operations) to
October 31, 2008 |
Increase (Decrease) in Net Assets | |
Operations | |
Net investment income (loss) | $ 200,542 |
Net realized gain (loss) | (5,482,459) |
Change in net unrealized appreciation (depreciation) | (6,105,269) |
Net increase (decrease) in net assets resulting
from operations | (11,387,186) |
Distributions to shareholders from net investment income | (7,494) |
Share transactions - net increase (decrease) | 26,448,569 |
Redemption fees | 4,196 |
Total increase (decrease) in net assets | 15,058,085 |
| |
Net Assets | |
Beginning of period | - |
End of period (including undistributed net investment income of $181,332) | $ 15,058,085 |
See accompanying notes which are an integral part of the financial statements.
Annual Report
Financial Highlights - Class A
| For the period
November 1, 2007
(commencement of operations) to
October 31, 2008 |
Selected Per-Share Data | |
Net asset value, beginning of period | $ 10.00 |
Income from Investment Operations | |
Net investment income (loss) C | .07 |
Net realized and unrealized gain (loss) | (4.61) |
Total from investment operations | (4.54) |
Redemption fees added to paid in capital C, E | - |
Net asset value, end of period | $ 5.46 |
Total Return A, B | (45.40)% |
Ratios to Average Net Assets D, G | |
Expenses before reductions | 2.88% |
Expenses net of fee waivers, if any | 1.50% |
Expenses net of all reductions | 1.48% |
Net investment income (loss) | .80% |
Supplemental Data | |
Net assets, end of period (000 omitted) | $ 820 |
Portfolio turnover rate F | 115% |
A Total returns would have been lower had certain expenses not been reduced during the periods shown.
B Total returns do not include the effect of the sales charges.
C Calculated based on average shares outstanding during the period.
D Expense ratios reflect operating expenses of the class. Expenses before reductions do not reflect amounts reimbursed by the investment adviser or reductions from brokerage service arrangements or other expense offset arrangements and do not represent the amount paid by the class during periods when reimbursements or reductions occur. Expense ratios before reductions for start-up periods may not be representative of longer-term operating periods. Expenses net of fee waivers reflect expenses after reimbursement by the investment adviser but prior to reductions from brokerage service arrangements or other expense offset arrangements. Expenses net of all reductions represent the net expenses paid by the class.
E Amount represents less than $.01 per share.
F Amount does not include the portfolio activity of any underlying Fidelity Central Funds.
G Fees and expenses of the underlying Fidelity Central Funds are not included in the Fund's expense ratio. The Fund indirectly bears its proportionate share of the expenses of any underlying Fidelity Central Funds.
See accompanying notes which are an integral part of the financial statements.
Annual Report
Financial Highlights - Class T
| For the period
November 1, 2007
(commencement of operations) to
October 31, 2008 |
Selected Per-Share Data | |
Net asset value, beginning of period | $ 10.00 |
Income from Investment Operations | |
Net investment income (loss) C | .05 |
Net realized and unrealized gain (loss) | (4.60) |
Total from investment operations | (4.55) |
Redemption fees added to paid in capital C, E | - |
Net asset value, end of period | $ 5.45 |
Total Return A, B | (45.50)% |
Ratios to Average Net Assets D, G | |
Expenses before reductions | 3.07% |
Expenses net of fee waivers, if any | 1.75% |
Expenses net of all reductions | 1.73% |
Net investment income (loss) | .55% |
Supplemental Data | |
Net assets, end of period (000 omitted) | $ 507 |
Portfolio turnover rate F | 115% |
A Total returns would have been lower had certain expenses not been reduced during the periods shown.
B Total returns do not include the effect of the sales charges.
C Calculated based on average shares outstanding during the period.
D Expense ratios reflect operating expenses of the class. Expenses before reductions do not reflect amounts reimbursed by the investment adviser or reductions from brokerage service arrangements or other expense offset arrangements and do not represent the amount paid by the class during periods when reimbursements or reductions occur. Expense ratios before reductions for start-up periods may not be representative of longer-term operating periods. Expenses net of fee waivers reflect expenses after reimbursement by the investment adviser but prior to reductions from brokerage service arrangements or other expense offset arrangements. Expenses net of all reductions represent the net expenses paid by the class.
E Amount represents less than $.01 per share.
F Amount does not include the portfolio activity of any underlying Fidelity Central Funds.
G Fees and expenses of the underlying Fidelity Central Funds are not included in the Fund's expense ratio. The Fund indirectly bears its proportionate share of the expenses of any underlying Fidelity Central Funds.
See accompanying notes which are an integral part of the financial statements.
Annual Report
Financial Highlights - Class B
| For the period
November 1, 2007
(commencement of operations) to
October 31, 2008 |
Selected Per-Share Data | |
Net asset value, beginning of period | $ 10.00 |
Income from Investment Operations | |
Net investment income (loss) C | - E |
Net realized and unrealized gain (loss) | (4.58) |
Total from investment operations | (4.58) |
Redemption fees added to paid in capital C, E | - |
Net asset value, end of period | $ 5.42 |
Total Return A, B | (45.80)% |
Ratios to Average Net Assets D, G | |
Expenses before reductions | 3.55% |
Expenses net of fee waivers, if any | 2.25% |
Expenses net of all reductions | 2.23% |
Net investment income (loss) | .05% |
Supplemental Data | |
Net assets, end of period (000 omitted) | $ 642 |
Portfolio turnover rate F | 115% |
A Total returns would have been lower had certain expenses not been reduced during the periods shown.
B Total returns do not include the effect of the contingent deferred sales charge.
C Calculated based on average shares outstanding during the period.
D Expense ratios reflect operating expenses of the class. Expenses before reductions do not reflect amounts reimbursed by the investment adviser or reductions from brokerage service arrangements or other expense offset arrangements and do not represent the amount paid by the class during periods when reimbursements or reductions occur. Expense ratios before reductions for start-up periods may not be representative of longer-term operating periods. Expenses net of fee waivers reflect expenses after reimbursement by the investment adviser but prior to reductions from brokerage service arrangements or other expense offset arrangements. Expenses net of all reductions represent the net expenses paid by the class.
E Amount represents less than $.01 per share.
F Amount does not include the portfolio activity of any underlying Fidelity Central Funds.
G Fees and expenses of the underlying Fidelity Central Funds are not included in the Fund's expense ratio. The Fund indirectly bears its proportionate share of the expenses of any underlying Fidelity Central Funds.
See accompanying notes which are an integral part of the financial statements.
Annual Report
Financial Highlights - Class C
| For the period
November 1, 2007
(commencement of operations) to
October 31, 2008 |
Selected Per-Share Data | |
Net asset value, beginning of period | $ 10.00 |
Income from Investment Operations | |
Net investment income (loss) C | - E |
Net realized and unrealized gain (loss) | (4.58) |
Total from investment operations | (4.58) |
Redemption fees added to paid in capital C, E | - |
Net asset value, end of period | $ 5.42 |
Total Return A, B | (45.80)% |
Ratios to Average Net Assets D, G | |
Expenses before reductions | 3.52% |
Expenses net of fee waivers, if any | 2.25% |
Expenses net of all reductions | 2.23% |
Net investment income (loss) | .05% |
Supplemental Data | |
Net assets, end of period (000 omitted) | $ 684 |
Portfolio turnover rate F | 115% |
A Total returns would have been lower had certain expenses not been reduced during the periods shown.
B Total returns do not include the effect of the contingent deferred sales charge.
C Calculated based on average shares outstanding during the period.
D Expense ratios reflect operating expenses of the class. Expenses before reductions do not reflect amounts reimbursed by the investment adviser or reductions from brokerage service arrangements or other expense offset arrangements and do not represent the amount paid by the class during periods when reimbursements or reductions occur. Expense ratios before reductions for start-up periods may not be representative of longer-term operating periods. Expenses net of fee waivers reflect expenses after reimbursement by the investment adviser but prior to reductions from brokerage service arrangements or other expense offset arrangements. Expenses net of all reductions represent the net expenses paid by the class.
E Amount represents less than $.01 per share.
F Amount does not include the portfolio activity of any underlying Fidelity Central Funds.
G Fees and expenses of the underlying Fidelity Central Funds are not included in the Fund's expense ratio. The Fund indirectly bears its proportionate share of the expenses of any underlying Fidelity Central Funds.
See accompanying notes which are an integral part of the financial statements.
Annual Report
Financial Highlights - International Growth
| For the period
November 1, 2007
(commencement of operations) to
October 31, 2008 |
Selected Per-Share Data | |
Net asset value, beginning of period | $ 10.00 |
Income from Investment Operations | |
Net investment income (loss) B | .09 |
Net realized and unrealized gain (loss) | (4.60) |
Total from investment operations | (4.51) |
Distributions from net investment income | (.01) |
Redemption fees added to paid in capital B, D | - |
Net asset value, end of period | $ 5.48 |
Total Return A | (45.17)% |
Ratios to Average Net Assets C, F | |
Expenses before reductions | 2.35% |
Expenses net of fee waivers, if any | 1.25% |
Expenses net of all reductions | 1.23% |
Net investment income (loss) | 1.05% |
Supplemental Data | |
Net assets, end of period (000 omitted) | $ 11,884 |
Portfolio turnover rate E | 115% |
A Total returns would have been lower had certain expenses not been reduced during the periods shown.
B Calculated based on average shares outstanding during the period.
C Expense ratios reflect operating expenses of the class. Expenses before reductions do not reflect amounts reimbursed by the investment adviser or reductions from brokerage service arrangements or other expense offset arrangements and do not represent the amount paid by the class during periods when reimbursements or reductions occur. Expense ratios before reductions for start-up periods may not be representative of longer-term operating periods. Expenses net of fee waivers reflect expenses after reimbursement by the investment adviser but prior to reductions from brokerage service arrangements or other expense offset arrangements. Expenses net of all reductions represent the net expenses paid by the class.
D Amount represents less than $.01 per share.
E Amount does not include the portfolio activity of any underlying Fidelity Central Funds.
F Fees and expenses of the underlying Fidelity Central Funds are not included in the Fund's expense ratio. The Fund indirectly bears its proportionate share of the expenses of any underlying Fidelity Central Funds.
See accompanying notes which are an integral part of the financial statements.
Annual Report
Financial Highlights - Institutional Class
| For the period
November 1, 2007
(commencement of operations) to
October 31, 2008 |
Selected Per-Share Data | |
Net asset value, beginning of period | $ 10.00 |
Income from Investment Operations | |
Net investment income (loss) B | .09 |
Net realized and unrealized gain (loss) | (4.60) |
Total from investment operations | (4.51) |
Distributions from net investment income | (.01) |
Redemption fees added to paid in capital B, D | - |
Net asset value, end of period | $ 5.48 |
Total Return A | (45.17)% |
Ratios to Average Net Assets C, F | |
Expenses before reductions | 2.56% |
Expenses net of fee waivers, if any | 1.25% |
Expenses net of all reductions | 1.23% |
Net investment income (loss) | 1.05% |
Supplemental Data | |
Net assets, end of period (000 omitted) | $ 521 |
Portfolio turnover rate E | 115% |
A Total returns would have been lower had certain expenses not been reduced during the periods shown.
B Calculated based on average shares outstanding during the period.
C Expense ratios reflect operating expenses of the class. Expenses before reductions do not reflect amounts reimbursed by the investment adviser or reductions from brokerage service arrangements or other expense offset arrangements and do not represent the amount paid by the class during periods when reimbursements or reductions occur. Expense ratios before reductions for start-up periods may not be representative of longer-term operating periods. Expenses net of fee waivers reflect expenses after reimbursement by the investment adviser but prior to reductions from brokerage service arrangements or other expense offset arrangements. Expenses net of all reductions represent the net expenses paid by the class.
D Amount represents less than $.01 per share.
E Amount does not include the portfolio activity of any underlying Fidelity Central Funds.
F Fees and expenses of the underlying Fidelity Central Funds are not included in the Fund's expense ratio. The Fund indirectly bears its proportionate share of the expenses of any underlying Fidelity Central Funds.
See accompanying notes which are an integral part of the financial statements.
Annual Report
Fidelity International Growth Fund
Notes to Financial Statements
For the period ended October 31, 2008
1. Organization.
Fidelity International Growth Fund (the Fund) is a fund of Fidelity Investment Trust (the trust) and is authorized to issue an unlimited number of shares. The trust is registered under the Investment Company Act of 1940, as amended (the 1940 Act), as an open-end management investment company organized as a Massachusetts business trust. The Fund offers Class A, Class T, Class B, Class C, International Growth and Institutional Class shares, each of which has equal rights as to assets and voting privileges. Each class has exclusive voting rights with respect to matters that affect that class. Class B shares will automatically convert to Class A shares after a holding period of seven years from the initial date of purchase. Investment income, realized and unrealized capital gains and losses, the common expenses of the Fund, and certain fund-level expense reductions, if any, are allocated on a pro rata basis to each class based on the relative net assets of each class to the total net assets of the Fund. Each class differs with respect to transfer agent and distribution and service plan fees incurred. Certain expense reductions also differ by class. The Fund's investments in emerging markets can be subject to social, economic, regulatory, and political uncertainties and can be extremely volatile.
2. Investments in Fidelity Central Funds.
The Fund may invest in Fidelity Central Funds, which are open-end investment companies available only to other investment companies and accounts managed by Fidelity Management & Research Company (FMR) and its affiliates. The Fund's Schedule of Investments lists each of the Fidelity Central Funds held as of period end, if any, as an investment of the Fund, but does not include the underlying holdings of each Fidelity Central Fund. As an Investing Fund, the Fund indirectly bears its proportionate share of the expenses of the underlying Fidelity Central Funds.
The Money Market Central Funds seek preservation of capital and current income and are managed by Fidelity Investments Money Management, Inc. (FIMM), an affiliate of FMR.
A complete unaudited list of holdings for each Fidelity Central Fund is available upon request or at the SEC's web site at www.sec.gov. In addition, the financial statements of the Fidelity Central Funds, which are not covered by the Fund's Report of Independent Registered Public Accounting Firm, are available on the SEC's web site or upon request.
3. Significant Accounting Policies.
The financial statements have been prepared in conformity with accounting principles generally accepted in the United States of America, which require management to make certain estimates and assumptions at the date of the financial statements. Actual results could differ from those estimates. The following summarizes the significant accounting policies of the Fund:
Annual Report
3. Significant Accounting Policies - continued
Security Valuation. Investments are valued as of 4:00 p.m. Eastern time on the last calendar day of the period. Wherever possible, the Fund uses independent pricing services approved by the Board of Trustees to value its investments.
Equity securities, including restricted securities, for which market quotations are readily available, are valued at the last reported sale price or official closing price as reported by an independent pricing service on the primary market or exchange on which they are traded. In the event there were no sales during the day or closing prices are not available, securities are valued at the last quoted bid price. Investments in open-end mutual funds, including Fidelity Central Funds, are valued at their closing net asset value each business day. Short-term securities with remaining maturities of sixty days or less for which quotations are not readily available are valued at amortized cost, which approximates value.
When current market prices or quotations are not readily available or reliable, valuations may be determined in good faith in accordance with procedures adopted by the Board of Trustees. Factors used in determining value may include significant market or security specific events, changes in interest rates and credit quality, and developments in foreign markets which are monitored by evaluating the performance of ADRs, futures contracts and exchange-traded funds. The frequency with which these procedures are used cannot be predicted and may be utilized to a significant extent. The value of securities used for net asset value (NAV) calculation under these procedures may differ from published prices for the same securities.
Foreign Currency. The Fund uses foreign currency contracts to facilitate transactions in foreign-denominated securities. Losses from these transactions may arise from changes in the value of the foreign currency or if the counterparties do not perform under the contracts' terms.
Foreign-denominated assets, including investment securities, and liabilities are translated into U.S. dollars at the exchange rate at period end. Purchases and sales of investment securities, income and dividends received and expenses denominated in foreign currencies are translated into U.S. dollars at the exchange rate in effect on the transaction date.
The effects of exchange rate fluctuations on investments are included with the net realized and unrealized gain (loss) on investment securities. Other foreign currency transactions resulting in realized and unrealized gain (loss) are disclosed separately.
Annual Report
Fidelity International Growth Fund
Notes to Financial Statements - continued
3. Significant Accounting Policies - continued
Investment Transactions and Income. For financial reporting purposes, the Fund's investment holdings and NAV include trades executed through the end of the last business day of the period. The NAV per share for processing shareholder transactions is calculated as of the close of business of the New York Stock Exchange (NYSE), normally 4:00 p.m. Eastern time and includes trades executed through the end of the prior business day. Gains and losses on securities sold are determined on the basis of identified cost. Dividend income is recorded on the ex-dividend date, except for certain dividends from foreign securities where the ex-dividend date may have passed, which are recorded as soon as the Fund is informed of the ex-dividend date. Non-cash dividends included in dividend income, if any, are recorded at the fair market value of the securities received. Interest income and distributions from the Fidelity Central Funds are accrued as earned. Interest income includes coupon interest and amortization of premium and accretion of discount on debt securities. Investment income is recorded net of foreign taxes withheld where recovery of such taxes is uncertain.
Expenses. Most expenses of the trust can be directly attributed to a fund. Expenses which cannot be directly attributed are apportioned among each Fund in the trust. Expense estimates are accrued in the period to which they relate and adjustments are made when actual amounts are known.
Income Tax Information and Distributions to Shareholders. Each year, the Fund intends to qualify as a regulated investment company by distributing substantially all of its taxable income and realized gains under Subchapter M of the Internal Revenue Code and filing its U.S. federal tax return. As a result, no provision for income taxes is required. The Fund is subject to the provisions of FASB Interpretation No. 48, Accounting for Uncertainties in Income Taxes (FIN 48). FIN 48 sets forth a minimum threshold for financial statement recognition of the benefit of a tax position taken or expected to be taken in a tax return. There are no unrecognized tax benefits in the accompanying financial statements in connection with the tax positions expected to be taken in the initial filing of the Fund's federal tax return. Foreign taxes are provided for based on the Fund's understanding of the tax rules and rates that exist in the foreign markets in which it invests.
Distributions are recorded on the ex-dividend date. Income dividends and capital gain distributions are declared separately for each class. Income and capital gain distributions are determined in accordance with income tax regulations, which may differ from generally accepted accounting principles.
Capital accounts within the financial statements are adjusted for permanent book-tax differences. These adjustments have no impact on net assets or the results of operations. Temporary book-tax differences will reverse in a subsequent period.
Annual Report
3. Significant Accounting Policies - continued
Income Tax Information and Distributions to Shareholders - continued
Book-tax differences are primarily due to foreign currency transactions, passive foreign investment companies (PFIC), capital loss carryforwards and losses deferred due to wash sales.
The tax-basis components of distributable earnings and the federal tax cost as of period end were as follows:
Unrealized appreciation | $ 109,388 |
Unrealized depreciation | (6,715,400) |
Net unrealized appreciation (depreciation) | (6,606,012) |
Undistributed ordinary income | 181,332 |
Capital loss carryforward | (4,969,583) |
| |
Cost for federal income tax purposes | $ 21,745,797 |
The tax character of distributions paid was as follows:
| October 31, 2008 |
Ordinary Income | $ 7,494 |
Short-Term Trading (Redemption) Fees. Shares held in the Fund less than 30 days are subject to a redemption fee equal to 1.00% of the proceeds of the redeemed shares. All redemption fees, including any estimated redemption fees paid by FMR, are retained by the Fund and accounted for as an addition to paid in capital.
New Accounting Pronouncement. In September 2006, Statement of Financial Accounting Standards No. 157, Fair Value Measurements (SFAS 157), was issued and is effective for fiscal years beginning after November 15, 2007. SFAS 157 defines fair value, establishes a framework for measuring fair value and results in expanded disclosures about fair value measurements. The Fund will adopt the provisions of SFAS 157 effective for its fiscal year beginning November 1, 2008.
4. Operating Policies.
Repurchase Agreements. FMR has received an Exemptive Order from the Securities and Exchange Commission (the SEC) which permits the Fund and other affiliated entities of FMR to transfer uninvested cash balances into joint trading accounts which are then invested in repurchase agreements. The Fund may also invest directly with institutions in repurchase agreements. Repurchase agreements are collateralized by government or non-government securities. Upon settlement date, collateral is held in segregated accounts with custodian banks and may be obtained in the event of a default
Annual Report
Fidelity International Growth Fund
Notes to Financial Statements - continued
4. Operating Policies - continued
Repurchase Agreements - continued
of the counterparty. The Fund monitors, on a daily basis, the value of the collateral to ensure it is at least equal to the principal amount of the repurchase agreement (including accrued interest). In the event of a default by the counterparty, realization of the collateral proceeds could be delayed, during which time the value of the collateral may decline.
5. Purchases and Sales of Investments.
Purchases and sales of securities short-term securities, aggregated $49,769,507 and $23,267,930, respectively.
6. Fees and Other Transactions with Affiliates.
Management Fee. FMR and its affiliates provide the Fund with investment management related services for which the Fund pays a monthly management fee. The management fee is the sum of an individual fund fee rate that is based on an annual rate of .45% of the Fund's average net assets and a group fee rate that averaged .26% during the period. The group fee rate is based upon the average net assets of all the mutual funds advised by FMR. The group fee rate decreases as assets under management increase and increases as assets under management decrease. In addition, the management fee is subject to a performance adjustment (up to a maximum of ± .20% of the Fund's average net assets over the performance period). The upward or downward adjustment to the management fee is based on the investment performance of the International Growth Class as compared to an appropriate benchmark index. The Fund's performance period began on December 1, 2007 and subsequent months will be added until the performance period includes 36 months. The Fund's performance adjustment will take effect in November 2008. For the period, the total annual management fee rate was .71% of the Fund's average net assets.
Distribution and Service Plan. In accordance with Rule 12b-1 of the 1940 Act, the Fund has adopted separate Distribution and Service Plans for each class of shares. Certain classes pay Fidelity Distributors Corporation (FDC), an affiliate of FMR, separate Distribution and Service Fees, each of which is based on an annual percentage of each class' average net assets. In addition, FDC may pay financial intermediaries for selling shares of the Fund and providing shareholder support services. For the period,
Annual Report
6. Fees and Other Transactions with Affiliates - continued
Distribution and Service Plan - continued
the Distribution and Service Fee rates and the total amounts paid to and retained by FDC were as follows:
| Distribution
Fee | Service
Fee | Paid to
FDC | Retained
by FDC |
Class A | -% | .25% | $ 2,271 | $ 1,733 |
Class T | .25% | .25% | 4,078 | 3,384 |
Class B | .75% | .25% | 8,803 | 8,289 |
Class C | .75% | .25% | 9,071 | 7,311 |
| | | $ 24,223 | $ 20,717 |
Sales Load. FDC receives a front-end sales charge of up to 5.75% for selling Class A shares, and 3.50% for selling Class T shares, some of which is paid to financial intermediaries for selling shares of the Fund. FDC receives the proceeds of contingent deferred sales charges levied on Class A, Class T, Class B, and Class C redemptions. These charges depend on the holding period. The deferred sales charges range from 5% to 1% for Class B, 1% for Class C, 1.00% to .50% for certain purchases of Class A shares and .25% for certain purchases of Class T shares.
For the period, sales charge amounts retained by FDC were as follows:
| Retained
by FDC |
Class A | $ 1,807 |
Class T | 290 |
Class B* | 923 |
| $ 3,020 |
* When Class B shares are initially sold, FDC pays commissions from its own resources to financial intermediaries through which the sales are made.
Transfer Agent Fees. Fidelity Investments Institutional Operations Company, Inc. (FIIOC), an affiliate of FMR, is the transfer, dividend disbursing and shareholder servicing agent for each class of the Fund. FIIOC receives account fees and asset-based fees that vary according to the account size and type of account of the shareholders of the respective classes of the Fund. FIIOC pays for typesetting, printing and mailing of
Annual Report
Fidelity International Growth Fund
Notes to Financial Statements - continued
6. Fees and Other Transactions with Affiliates - continued
Transfer Agent Fees - continued
shareholder reports, except proxy statements. For the period, the total transfer agent fees paid by each class were as follows:
| Amount | % of
Average
Net Assets |
Class A | $ 2,412 | .27 |
Class T | 1,573 | .19 |
Class B | 2,235 | .25 |
Class C | 2,280 | .25 |
International Growth | 52,882 | .31 |
Institutional Class | 1,214 | .16 |
| $ 62,596 | |
Accounting and Security Lending Fees. Fidelity Service Company, Inc. (FSC), an affiliate of FMR, maintains the Fund's accounting records. The accounting fee is based on the level of average net assets for the month. Under a separate contract, FSC administers the security lending program. The security lending fee is based on the number and duration of lending transactions.
Brokerage Commissions. The Fund placed a portion of its portfolio transactions with brokerage firms which are affiliates of the investment adviser. The commissions paid to these affiliated firms were $742 for the period.
7. Committed Line of Credit.
The Fund participates with other funds managed by FMR in a $4.2 billion credit facility (the "line of credit") to be utilized for temporary or emergency purposes to fund shareholder redemptions or for other short-term liquidity purposes. The Fund has agreed to pay commitment fees on its pro rata portion of the line of credit, which amounted to $31 and is reflected in Miscellaneous Expense on the Statement of Operations. During the period, there were no borrowings on this line of credit.
8. Security Lending.
The Fund lends portfolio securities from time to time in order to earn additional income. On the settlement date of the loan, the Fund receives collateral (in the form of U.S. Treasury obligations, letters of credit and/or cash) against the loaned securities and maintains collateral in an amount not less than 100% of the market value of the loaned securities during the period of the loan. The market value of the loaned securities is
Annual Report
8. Security Lending - continued
determined at the close of business of the Fund and any additional required collateral is delivered to the Fund on the next business day. If the borrower defaults on its obligation to return the securities loaned because of insolvency or other reasons, a fund could experience delays and costs in recovering the securities loaned or in gaining access to the collateral. Any cash collateral received is invested in the Fidelity Securities Lending Cash Central Fund. Security lending income represents the income earned on investing cash collateral, less fees and expenses associated with the loan, plus any premium payments that may be received on the loan of certain types of securities. Security lending income is presented in the Statement of Operations as a component of income from Fidelity Central Funds. Net income from lending portfolio securities during the period amounted to $796.
9. Expense Reductions.
FMR voluntarily agreed to reimburse each class to the extent annual operating expenses exceeded certain levels of average net assets as noted in the table below. Some expenses, for example interest expense, including commitment fees, are excluded from this reimbursement.
The following classes were in reimbursement during the period:
| Expense
Limitations | Reimbursement
from adviser |
Class A | 1.50% | $ 12,501 |
Class T | 1.75% | 10,738 |
Class B | 2.25% | 11,439 |
Class C | 2.25% | 11,520 |
International Growth | 1.25% | 188,565 |
Institutional Class | 1.25% | 10,170 |
| | $ 244,933 |
Many of the brokers with whom FMR places trades on behalf of the Fund provided services to the Fund in addition to trade execution. These services included payments of certain expenses on behalf of the Fund totaling $4,149 for the period. In addition, through arrangements with the Fund's custodian, credits realized as a result of uninvested cash balances were used to reduce the Fund's expenses. During the period, these credits reduced the Fund's custody expenses by $126.
Annual Report
Fidelity International Growth Fund
Notes to Financial Statements - continued
10. Other.
The Fund's organizational documents provide former and current trustees and officers with a limited indemnification against liabilities arising in connection with the performance of their duties to the Fund. In the normal course of business, the Fund may also enter into contracts that provide general indemnifications. The Fund's maximum exposure under these arrangements is unknown as this would be dependent on future claims that may be made against the Fund. The risk of material loss from such claims is considered remote.
FMR or its affiliates were the owners of record of 24% of the total outstanding shares of the Fund.
During the period, Lehman Brothers Holdings, Inc. and certain of its affiliates (LBHI) sought protection under the insolvency laws of their jurisdictions of organization, including the United States, the United Kingdom and Japan. At the time LBHI's insolvency proceedings were instituted, the Fund had outstanding securities trades with counterparties affiliated with LBHI. As a result of the insolvency proceedings, LBHI is unable to fulfill its commitments and, in certain cases, the Fund may have terminated its trades and related agreements with the relevant entities and, where appropriate, is in the process of initiating claims for damages. FMR believes that the financial impact to the Fund relating to the terminated trades and agreements is immaterial.
11. Distributions to Shareholders.
Distributions to shareholders of each class were as follows:
| For the period
November 1, 2007
(commencement of operations) to
October 31, 2008 |
From net investment income | |
International Growth | $ 7,036 |
Institutional Class | 458 |
Total | $ 7,494 |
Annual Report
12. Share Transactions.
Transactions for each class of shares were as follows:
| Shares | Dollars |
| For the period
November 1, 2007
(commencement of operations) to
October 31, 2008 | For the period
November 1, 2007
(commencement of operations) to
October 31, 2008 |
Class A | | |
Shares sold | 163,688 | $ 1,473,900 |
Shares redeemed | (13,701) | (105,944) |
Net increase (decrease) | 149,987 | $ 1,367,956 |
Class T | | |
Shares sold | 120,600 | $ 1,160,207 |
Shares redeemed | (27,551) | (234,209) |
Net increase (decrease) | 93,049 | $ 925,998 |
Class B | | |
Shares sold | 130,340 | $ 1,229,254 |
Shares redeemed | (11,927) | (88,741) |
Net increase (decrease) | 118,413 | $ 1,140,513 |
Class C | | |
Shares sold | 147,998 | $ 1,363,686 |
Shares redeemed | (21,887) | (174,264) |
Net increase (decrease) | 126,111 | $ 1,189,422 |
International Growth | | |
Shares sold | 3,641,791 | $ 32,862,391 |
Reinvestment of distributions | 663 | 6,366 |
Shares redeemed | (1,472,054) | (11,980,798) |
Net increase (decrease) | 2,170,400 | $ 20,887,959 |
Institutional Class | | |
Shares sold | 95,161 | $ 936,263 |
Reinvestment of distributions | 48 | 458 |
Net increase (decrease) | 95,209 | $ 936,721 |
Annual Report
To the Trustees of Fidelity Investment Trust and the Shareholders of Fidelity International Growth Fund:
In our opinion, the accompanying statement of assets and liabilities, including the schedule of investments, and the related statements of operations and of changes in net assets and the financial highlights present fairly, in all material respects, the financial position of Fidelity International Growth Fund (a fund of Fidelity Investment Trust) at October 31, 2008, the results of its operations for the period indicated, the changes in its net assets for the period indicated and the financial highlights for the period indicated, in conformity with accounting principles generally accepted in the United States of America. These financial statements and financial highlights (hereafter referred to as "financial statements") are the responsibility of the Fidelity International Growth Fund's management. Our responsibility is to express an opinion on these financial statements based on our audit. We conducted our audit of these financial statements in accordance with the standards of the Public Company Accounting Oversight Board (United States). Those standards require that we plan and perform the audit to obtain reasonable assurance about whether the financial statements are free of material misstatement. An audit includes examining, on a test basis, evidence supporting the amounts and disclosures in the financial statements, assessing the accounting principles used and significant estimates made by management, and evaluating the overall financial statement presentation. We believe that our audit, which included confirmation of securities at October 31, 2008 by correspondence with the custodian and brokers, provides a reasonable basis for our opinion.
/s/ PricewaterhouseCoopers LLP
PricewaterhouseCoopers LLP
Boston, Massachusetts
December 23, 2008
Annual Report
The fund designates 100% of the dividends distributed during the fiscal year as amounts which may be taken into account as a dividend for the purposes of the maximum rate under section 1(h)(11) of the Internal Revenue Code.
The fund will notify shareholders in January 2009 of amounts for use in preparing 2008 income tax returns.
Annual Report
Board Approval of Investment Advisory Contracts and Management Fees
Fidelity International Growth Fund
Each year, typically in July, the Board of Trustees, including the Independent Trustees (together, the Board), votes on the renewal of the management contract and sub-advisory agreements (together, the Advisory Contracts) for the fund. The Board, assisted by the advice of fund counsel and Independent Trustees' counsel, requests and considers a broad range of information throughout the year.
The Board meets regularly and, acting directly and through its separate committees, requests and receives information concerning, and considers at each of its meetings factors that are relevant to, its annual consideration of the renewal of the fund's Advisory Contracts, including the services and support provided to the fund and its shareholders. At the time of the renewal, the Board had 12 standing committees, each composed of Independent Trustees with varying backgrounds, to which the Board has assigned specific subject matter responsibilities in order to enhance effective decision-making by the Board. Each committee has a written charter outlining the structure and purposes of the committee. The Board also meets as needed to consider matters specifically related to the Board's annual consideration of the renewal of Advisory Contracts.
At its July 2008 meeting, the Board of Trustees, including the Independent Trustees, unanimously determined to renew the fund's Advisory Contracts. In reaching its determination, the Board considered all factors it believed relevant, including (i) the nature, extent, and quality of the services to be provided to the fund and its shareholders (including the investment performance of the fund); (ii) the competitiveness of the fund's management fee and total expenses; (iii) the total costs of the services to be provided by and the profits to be realized by Fidelity from its relationship with the fund; (iv) the extent to which economies of scale would be realized as the fund grows; and (v) whether fee levels reflect these economies of scale, if any, for the benefit of fund shareholders. The Board also approved agreements with foreign sub-advisers Fidelity Management & Research (Japan) Inc. and Fidelity Management & Research (Hong Kong) Limited, as well as amendments to the fund's agreement with Fidelity Management & Research (U.K.) Inc.
In considering whether to renew the Advisory Contracts for the fund, the Board ultimately reached a determination, with the assistance of fund counsel and Independent Trustees' counsel and through the exercise of its business judgment, that the renewal of the Advisory Contracts and the compensation to be received by Fidelity under the management contract is consistent with Fidelity's fiduciary duty under applicable law. The Board's decision to renew the Advisory Contracts was not based on any single factor noted above, but rather was based on a comprehensive consideration of all the information provided to the Board at its meetings throughout the year. The Board, in reaching its determination to renew the Advisory Contracts, is aware that shareholders in the fund have a broad range of investment choices available to them, including a wide choice among mutual funds offered by competitors to Fidelity, and that the fund's shareholders, with the opportunity to review and weigh the disclosure provided by the fund in its prospectus and other public disclosures, have chosen to invest in this fund, managed by Fidelity.
Annual Report
Board Approval of Investment Advisory Contracts and
Management Fees - continued
Nature, Extent, and Quality of Services Provided. The Board considered staffing within the investment adviser, FMR, and the sub-advisers (together, the Investment Advisers), including the backgrounds of the fund's investment personnel and the fund's investment objective and discipline. The Independent Trustees also had discussions with senior management of Fidelity's investment operations and investment groups. The Board considered the structure of the portfolio manager compensation program and whether this structure provides appropriate incentives.
Resources Dedicated to Investment Management and Support Services. The Board reviewed the size, education, and experience of the Investment Advisers' investment staff, their use of technology, and the Investment Advisers' approach to recruiting, training, and retaining portfolio managers and other research, advisory, and management personnel. The Board noted that Fidelity's analysts have access to a variety of technological tools that enable them to perform both fundamental and quantitative analysis and to specialize in various disciplines. The Board considered Fidelity's extensive global research capabilities that enable the Investment Advisers to aggregate data from various sources in an effort to produce positive investment results. The Board also considered that Fidelity's portfolio managers and analysts have access to daily portfolio attribution that allows for monitoring of a fund's portfolio, as well as an electronic communication system that provides immediate real-time access to research concerning issuers and credit enhancers.
Shareholder and Administrative Services. The Board considered (i) the nature, extent, quality, and cost of advisory, administrative, distribution, and shareholder services performed by the Investment Advisers and their affiliates under the Advisory Contracts and under separate agreements covering transfer agency, pricing and bookkeeping, and securities lending services for the fund; (ii) the nature and extent of the Investment Advisers' supervision of third party service providers, principally custodians and subcustodians; and (iii) the resources devoted to, and the record of compliance with, the fund's compliance policies and procedures. The Board also reviewed the allocation of fund brokerage, including allocations to brokers affiliated with the Investment Advisers, the use of brokerage commissions to pay fund expenses, and the use of "soft" commission dollars to pay for research services. The Board further considered that Fidelity voluntarily pays for market data out of its own resources.
The Board noted that the growth of fund assets across the complex allows Fidelity to reinvest in the development of services designed to enhance the value or convenience of the Fidelity funds as investment vehicles. These services include 24-hour access to account information and market information through phone representatives and over the Internet, and investor education materials and asset allocation tools.
Annual Report
Investment in a Large Fund Family. The Board considered the benefits to shareholders of investing in a Fidelity fund, including the benefits of investing in a fund that is part of a large family of funds offering a variety of investment disciplines and providing for a large variety of mutual fund investor services. For example, fund shareholders are offered the privilege of exchanging shares of the fund for shares of other Fidelity funds, as set forth in the fund's prospectus, without paying a sales charge. The Board noted that Fidelity has taken a number of actions over the previous year that benefited particular funds, including (i) dedicating additional resources to investment research and to restructure the investment research teams; (ii) contractually agreeing to reduce the management fees on Fidelity's Institutional Money Market Funds and launching Class IV and Institutional Class of certain of these funds; (iii) reducing the transfer agent fees for the Fidelity Select Portfolios and Investor Class of the VIP funds; and (iv) launching Class K of 29 equity funds as a lower-fee class available to certain employer-sponsored retirement plans.
Investment Performance. The Board considered whether the fund has operated within its investment objective, as well as its record of compliance with its investment restrictions. The Board noted that it is not possible to evaluate performance in any comprehensive fashion because the fund had been in operation for less than one calendar year. Once the fund has been in operation for at least one calendar year, the Board will review the fund's absolute investment performance for each class, as well as the fund's relative investment performance for each class measured against a broad-based securities market index and a peer group of mutual funds.
The Board considered that FMR has taken steps to refocus and strengthen equity research, equity portfolio management, and compliance.
Based on its review, and giving particular weight to the nature and quality of the resources dedicated by the Investment Advisers to maintain and improve relative performance, the Board concluded that the nature, extent, and quality of the services provided to the fund will benefit the fund's shareholders, particularly in light of the Board's view that the fund's shareholders benefit from investing in a fund that is part of a large family of funds offering a variety of investment disciplines and services.
Competitiveness of Management Fee and Total Fund Expenses. The Board considered the fund's management fee and total expenses compared to "mapped groups" of competitive funds and classes. Fidelity creates "mapped groups" by combining similar Lipper investment objective categories that have comparable management fee characteristics. Combining Lipper investment objective categories aids the Board's management fee and total expense comparisons by broadening the competitive group used for comparison and by reducing the number of universes to which various Fidelity funds are compared. The Board also considered supplemental information about how the fund's management fee and total expenses ranked relative to groups based on Lipper classifications, which take into account a fund's market capitalization and style.
Annual Report
Board Approval of Investment Advisory Contracts and
Management Fees - continued
The Board considered two proprietary management fee comparisons for the period of the fund's operations shown in the chart below. The group of Lipper funds used by the Board for management fee comparisons is referred to below as the "Total Mapped Group." The Total Mapped Group comparison focuses on a fund's standing relative to the total universe of comparable funds available to investors, in terms of gross management fees before expense reimbursements or caps. "TMG %" represents the percentage of funds in the Total Mapped Group that had management fees that were lower than the fund's. For example, a TMG % of 14% means that 86% of the funds in the Total Mapped Group had higher management fees than the fund. The "Asset-Size Peer Group" (ASPG) comparison focuses on a fund's standing relative to non-Fidelity funds similar in size to the fund within the Total Mapped Group. The ASPG represents at least 15% of the funds in the Total Mapped Group with comparable asset size and management fee characteristics, subject to a minimum of 50 funds (or all funds in the Total Mapped Group if fewer than 50). Additional information, such as the ASPG quartile in which the fund's management fee ranked, is also included in the chart and considered by the Board.
Fidelity International Growth Fund
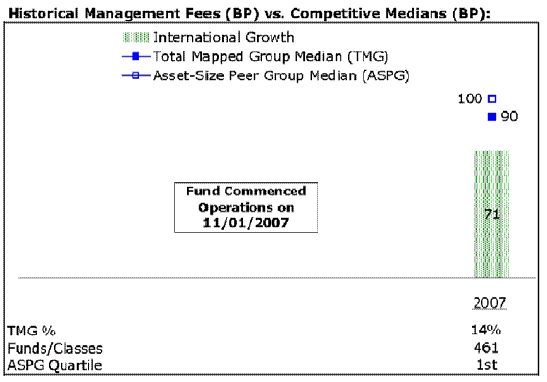
The Board noted that the fund's management fee ranked below the median of its Total Mapped Group and below the median of its ASPG for the period.
Furthermore, the Board considered that the fund's management fee includes a performance adjustment component (that is, the fund's management fee will be subject to upward or downward adjustment depending upon whether, and to what extent, the fund's investment performance for the performance period exceeds, or is exceeded by, the record (over the same period) of a Board-approved performance adjustment index). The performance period commenced on November 1, 2007. Starting with the twelfth month, the performance adjustment takes effect.
Annual Report
Based on its review, the Board concluded that the fund's management fee was fair and reasonable in light of the services that the fund receives and the other factors considered.
In its review of each class's total expenses, the Board considered the fund's management fee as well as other fund or class expenses, as applicable, such as transfer agent fees, pricing and bookkeeping fees, fund-paid 12b-1 fees, and custodial, legal, and audit fees. The Board also noted the effects of any waivers and reimbursements on fees and expenses. As part of its review, the Board also considered current and historical total expenses of each class of the fund compared to competitive fund median expenses. Each class of the fund is compared to those funds and classes in the Total Mapped Group (used by the Board for management fee comparisons) that have a similar sales load structure.
The Board noted that the total expenses of each of Class A and Fidelity International Growth (retail class) ranked equal to its competitive median for the period, and the total expenses of Class T, Class B, Class C, and Institutional Class ranked above its competitive median for the period. The Board noted that the fund offers multiple classes, each of which has a different sales load and 12b-1 fee structure, and that the multiple structures are intended to offer a range of pricing options for the intermediary market. The Board also noted that the total expenses of the classes vary primarily by the level of their 12b-1 fees, although differences in transfer agent fees may also cause expenses to vary from class to class.
In its review of total expenses, the Board also considered Fidelity fee structures and other information on clients that FMR and its affiliates service in other competitive markets, such as other mutual funds advised or subadvised by FMR or its affiliates, pension plan clients, and other institutional clients.
Based on its review, the Board concluded that the total expenses of each class of the fund were reasonable, although in some cases above the median of the universe presented for comparison, in light of the services that the fund and its shareholders receive and the other factors considered.
Costs of the Services and Profitability. The Board considered the revenues earned and the expenses incurred by Fidelity in conducting the business of developing, marketing, distributing, managing, administering and servicing the fund and its shareholders. The Board also considered the level of Fidelity's profits in respect of all the Fidelity funds.
Annual Report
Board Approval of Investment Advisory Contracts and
Management Fees - continued
On an annual basis, FMR presents to the Board Fidelity's profitability for the fund. Fidelity calculates the profitability for each fund, as well as aggregate profitability for groups of Fidelity funds and all Fidelity funds, using a series of detailed revenue and cost allocation methodologies which originate with the audited books and records of Fidelity. The Audit Committee of the Board reviews any significant changes from the prior year's methodologies.
PricewaterhouseCoopers LLP (PwC), independent registered public accounting firm and auditor to Fidelity and certain Fidelity funds, has been engaged annually by the Board as part of the Board's assessment of the results of Fidelity's profitability analysis. PwC's engagement includes the review and assessment of Fidelity's methodologies used in determining the revenues and expenses attributable to Fidelity's mutual fund business, and completion of agreed-upon procedures surrounding the mathematical accuracy of fund profitability and its conformity to allocation methodologies. After considering PwC's reports issued under the engagement and information provided by Fidelity, the Board believes that while other allocation methods may also be reasonable, Fidelity's profitability methodologies are reasonable in all material respects.
The Board has also reviewed Fidelity's non-fund businesses and any fall-out benefits related to the mutual fund business as well as cases where Fidelity's affiliates may benefit from or be related to the fund's business.
The Board considered the costs of the services provided by and the profits realized by Fidelity in connection with the operation of the fund and determined that the amount of profit is a fair entrepreneurial profit for the management of the fund.
Economies of Scale. The Board considered whether there have been economies of scale in respect of the management of the Fidelity funds, whether the Fidelity funds (including the fund) have appropriately benefited from any such economies of scale, and whether there is potential for realization of any further economies of scale. The Board considered the extent to which the fund will benefit from economies of scale through increased services to the fund, through waivers or reimbursements, or through fee or expense reductions.
The Board recognized that the fund's management contract incorporates a "group fee" structure, which provides for lower group fee rates as total fund assets under FMR's management increase, and for higher group fee rates as total fund assets under FMR's management decrease. FMR determines the group fee rates based on a tiered asset "breakpoint" schedule. The Board considered that the group fee is designed to deliver the benefits of economies of scale to fund shareholders when total fund assets increase, even if assets of any particular fund are unchanged or have declined, because some portion of Fidelity's costs are attributable to services provided to all Fidelity funds, and all funds benefit if those costs can be allocated among more assets. The Board concluded that, given the group fee structure, fund shareholders will achieve a certain level of economies of scale as assets under FMR's management increase at the fund complex level, regardless of whether Fidelity achieves any such economies of scale.
Annual Report
The Board further concluded that any potential economies of scale are being shared between fund shareholders and Fidelity in an appropriate manner.
Additional Information Requested by the Board. In order to develop fully the factual basis for consideration of the Fidelity funds' Advisory Contracts, the Board requested and received additional information on certain topics, including (i) fund performance trends and actions to be taken by FMR to improve certain funds' overall performance; (ii) portfolio manager changes that have occurred during the past year; (iii) Fidelity's fund profitability methodology, the profitability of certain fund service providers, and profitability trends for certain funds; (iv) Fidelity's compensation structure for portfolio managers and key personnel, including its effects on fund profitability and the extent to which portfolio manager compensation is linked to fund performance; (v) Fidelity's fee structures and rationale for recommending different fees among categories of funds; and (vi) Fidelity's rationale for recommending which funds should have a performance adjustment component as part of their management fees.
Based on its evaluation of all of the conclusions noted above, and after considering all material factors, the Board ultimately concluded that the advisory fee structures are fair and reasonable, and that the fund's Advisory Contracts should be renewed.
Annual Report
The Trustees, Member of the Advisory Board, and executive officers of the trust and funds, as applicable, are listed below. The Board of Trustees governs each fund and is responsible for protecting the interests of shareholders. The Trustees are experienced executives who meet periodically throughout the year to oversee each fund's activities, review contractual arrangements with companies that provide services to each fund, and review each fund's performance. Except for Edward C. Johnson 3d and James C. Curvey, each of the Trustees oversees 220 funds advised by FMR or an affiliate. Messrs. Johnson and Curvey oversee 379 funds advised by FMR or an affiliate.
The Trustees hold office without limit in time except that (a) any Trustee may resign; (b) any Trustee may be removed by written instrument, signed by at least two-thirds of the number of Trustees prior to such removal; (c) any Trustee who requests to be retired or who has become incapacitated by illness or injury may be retired by written instrument signed by a majority of the other Trustees; and (d) any Trustee may be removed at any special meeting of shareholders by a two-thirds vote of the outstanding voting securities of the trust. Each Trustee who is not an interested person (as defined in the 1940 Act) (Independent Trustee), shall retire not later than the last day of the calendar year in which his or her 72nd birthday occurs. The Independent Trustees may waive this mandatory retirement age policy with respect to individual Trustees. The executive officers and Advisory Board Member hold office without limit in time, except that any officer and Advisory Board Member may resign or may be removed by a vote of a majority of the Trustees at any regular meeting or any special meeting of the Trustees. Except as indicated, each individual has held the office shown or other offices in the same company for the past five years.
The funds' Statement of Additional Information (SAI) include more information about the Trustees. To request a free copy, call Fidelity at 1-800-544-8544.
Interested Trustees*:
Correspondence intended for each Trustee who is an interested person may be sent to Fidelity Investments, 82 Devonshire Street, Boston, Massachusetts 02109.
Name, Age; Principal Occupation |
Edward C. Johnson 3d (78) |
| Year of Election or Appointment: 1984 Mr. Johnson is Chairman of the Board of Trustees. Mr. Johnson serves as Chief Executive Officer, Chairman, and a Director of FMR LLC; Chairman and a Director of FMR; Chairman and a Director of Fidelity Research & Analysis Company (FRAC); Chairman and a Director of Fidelity Investments Money Management, Inc.; and Chairman and a Director of FMR Co., Inc. In addition, Mr. Johnson serves as Chairman and Director of FIL Limited. Previously, Mr. Johnson served as President of FMR LLC (2006-2007). |
James C. Curvey (73) |
| Year of Election or Appointment: 2007 Mr. Curvey also serves as Trustee (2007-present) of other investment companies advised by FMR. Mr. Curvey is a Director of FMR and FMR Co., Inc. (2007-present). Mr. Curvey is also Vice Chairman (2006-
present) and Director of FMR LLC. In addition, Mr. Curvey serves as an Overseer for the Boston Symphony Orchestra and a member of the Trustees of Villanova University. |
* Trustees have been determined to be "Interested Trustees" by virtue of, among other things, their affiliation with the trust or various entities under common control with FMR. FMR Corp. merged with and into FMR LLC on October 1, 2007. Any references to FMR LLC for prior periods are deemed to be references to the prior entity.
Independent Trustees:
Correspondence intended for each Independent Trustee (that is, the Trustees other than the Interested Trustees) may be sent to Fidelity Investments, P.O. Box 55235, Boston, Massachusetts 02205-5235.
Name, Age; Principal Occupation |
Dennis J. Dirks (60) |
| Year of Election or Appointment: 2005 Prior to his retirement in May 2003, Mr. Dirks was Chief Operating Officer and a member of the Board of The Depository Trust & Clearing Corporation (DTCC) (1999-2003). He also served as President, Chief Operating Officer, and Board member of The Depository Trust Company (DTC) (1999-2003) and President and Board member of the National Securities Clearing Corporation (NSCC) (1999-2003). In addition, Mr. Dirks served as a Trustee and a member of the Finance Committee of Manhattan College (2005-2008), and as Chief Executive Officer and Board member of the Government Securities Clearing Corporation (2001-2003) and Chief Executive Officer and Board member of the Mortgage-Backed Securities Clearing Corporation (2001-2003). Mr. Dirks also serves as a Trustee and a member of the Finance Committee of AHRC of Nassau County (2006-present). |
Alan J. Lacy (55) |
| Year of Election or Appointment: 2008 Mr. Lacy serves as Senior Adviser (2007-present) of Oak Hill Capital Partners, L.P. (a private equity firm). Mr. Lacy also served as Chief Executive Officer (2000-2005) and Vice Chairman (2005-2006) of Sears Holdings Corporation and Sears, Roebuck and Co. (retail). In addition, Mr. Lacy serves as a member of the Board of Directors of The Western Union Company (global money transfer, 2006-present) and Bristol-Myers Squibb (global pharmaceuticals, 2007-present). Mr. Lacy is a Trustee of the National Parks Conservation Association and The Field Museum of Natural History. |
Ned C. Lautenbach (64) |
| Year of Election or Appointment: 2000 Mr. Lautenbach is Chairman of the Independent Trustees (2006-present). Mr. Lautenbach is an Advisory Partner of Clayton, Dubilier & Rice, Inc. (private equity investment firm). Previously, Mr. Lautenbach was with the International Business Machines Corporation (IBM) from 1968 until his retirement in 1998. Mr. Lautenbach serves as a Director of Eaton Corporation (diversified industrial) as well as the Philharmonic Center for the Arts in Naples, Florida. He also is a member of the Board of Trustees of Fairfield University (2005-present), as well as a member of the Council on Foreign Relations. Previously, Mr. Lautenbach served as a Director of Sony Corporation (2006-2007). |
Joseph Mauriello (64) |
| Year of Election or Appointment: 2008 Prior to his retirement in January 2006, Mr. Mauriello served in numerous senior management positions including Deputy Chairman and Chief Operating Officer (2004-2005), and Vice Chairman of Financial Services (2002-2004) of KPMG LLP US (professional services firm, 1965-
2005). Mr. Mauriello currently serves as a member of the Board of Directors of XL Capital Ltd. (global insurance and re-insurance company, 2006-present) and of Arcadia Resources Inc. (health care services and products, 2007-present). He also served as a Director of the Hamilton Funds of the Bank of New York (2006-2007). |
Cornelia M. Small (64) |
| Year of Election or Appointment: 2005 Ms. Small is a member of the Investment Committee, and Chair (2008-present) and a member of the Board of Trustees of Smith College. Ms. Small also serves on the Investment Committee of the Berkshire Taconic Community Foundation (2008-present). Previously, Ms. Small served as Chairperson of the Investment Committee (2002-2008) of Smith College and as Co-Chair (2000-2003) of the Annual Fund for the Fletcher School of Law and Diplomacy. In addition, she served as Chief Investment Officer, Director of Global Equity Investments, and a member of the Board of Directors of Scudder, Stevens & Clark and Scudder Kemper Investments. |
William S. Stavropoulos (69) |
| Year of Election or Appointment: 2001 Mr. Stavropoulos is Chairman Emeritus of the Board of Directors of The Dow Chemical Company, where he previously served in numerous senior management positions, including President (1993-2000; 2002-
2003), CEO (1995-2000; 2002-2004), Chairman of the Executive Committee (2000-2006), and as a member of the Board of Directors (1990-2006). Currently, he is a Director of Teradata Corporation (data warehousing and technology solutions, 2008-present), Chemical Financial Corporation, Maersk Inc. (industrial conglomerate), Tyco International, Inc. (multinational manufacturing and services, 2007-present), and a member of the Advisory Board for Metalmark Capital (private equity investment firm, 2005-present). He is a special advisor to Clayton, Dubilier & Rice, Inc. (private equity investment). In addition, Mr. Stavropoulos is a member of the University of Notre Dame Advisory Council for the College of Science. |
David M. Thomas (59) |
| Year of Election or Appointment: 2008 Previously, Mr. Thomas served as Executive Chairman (2005-2006) and Chairman and Chief Executive Officer (2000-2005) of IMS Health, Inc. (pharmaceutical and healthcare information solutions). In addition, Mr. Thomas serves as a member of the Board of Directors of Fortune Brands, Inc. (consumer products holding company), and Interpublic Group of Companies, Inc. (marketing communication, 2004-present). |
Michael E. Wiley (58) |
| Year of Election or Appointment: 2008 Mr. Wiley also serves as a member of the Board of Trustees of the University of Tulsa (2000-2006; 2007-present). He serves as a Director of Tesoro Corporation (independent oil refiner and marketer, 2005-
present), and a Director of Bill Barrett Corporation (exploration and production company, 2005-present). In addition, he also serves as a Director of Post Oak Bank (privately-held bank, 2004-present). Previously, Mr. Wiley served as a Sr. Energy Advisor of Katzenbach Partners, LLC (consulting firm, 2006-2007), as an Advisory Director of Riverstone Holdings (private investment firm), Chairman, President, and CEO of Baker Hughes, Inc. (oilfield services company, 2000-2004), and as Director of Spinnaker Exploration Company (exploration and production company, 2001-2005). |
Advisory Board Member and Executive Officers**:
Correspondence intended for each executive officer and Mr. Lynch may be sent to Fidelity Investments, 82 Devonshire Street, Boston, Massachusetts 02109.
Name, Age; Principal Occupation |
Peter S. Lynch (64) |
| Year of Election or Appointment: 2003 Member of the Advisory Board of Fidelity's Equity and High Income Funds. Mr. Lynch is Vice Chairman and a Director of FMR, and Vice Chairman (2001-present) and a Director of FMR Co., Inc. Previously, Mr. Lynch served as a Trustee of the Fidelity funds (1990-2003). In addition, he serves as a Trustee of Boston College and as the Chairman of the Inner-City Scholarship Fund. Previously, Mr. Lynch served on the Special Olympics International Board of Directors (1997-2006). |
Kenneth B. Robins (39) |
| Year of Election or Appointment: 2008 President and Treasurer of Fidelity's Equity and High Income Funds. Mr. Robins is an employee of Fidelity Investments (2004-present). Before joining Fidelity Investments, Mr. Robins worked at KPMG LLP, where he was a partner in KPMG's department of professional practice (2002-2004). |
Walter C. Donovan (46) |
| Year of Election or Appointment: 2007 Vice President of Fidelity's Equity Funds. Mr. Donovan also serves as President of FMR and FMR Co., Inc., and Executive Vice President of Fidelity Investments Money Management, Inc. (2007-present). Previously, Mr. Donovan served as Executive Vice President of FMR and FMR Co., Inc. (2005-2007) and Senior Vice President of FMR (2003-2005) and FMR Co., Inc. (2004-2005). |
Eric M. Wetlaufer (46) |
| Year of Election or Appointment: 2006 Vice President of Fidelity's International Equity Funds. Mr. Wetlaufer also serves as Group Chief Investment Officer of FMR. Mr. Wetlaufer is Chairman, Chief Executive Officer, and President of Fidelity Management & Research (Hong Kong) Limited (2008-present); Chairman, Chief Executive Officer, President, and a Director of Fidelity Management & Research (Japan) Inc. (2008-present); Chairman and Chief Executive Officer (2007-present) and President and a Director (2006-present) of Fidelity Management & Research (U.K.) Inc. and President and a Director of Fidelity Research & Analysis Company (2006-present). Before joining Fidelity Investments in 2005, Mr. Wetlaufer was a partner in Oxhead Capital Management (2004-2005) and a Chief Investment Officer of Putnam Investments (1997-2003). |
Scott C. Goebel (40) |
| Year of Election or Appointment: 2008 Secretary and Chief Legal Officer (CLO) of the Fidelity funds. Mr. Goebel also serves as General Counsel, Secretary, and Senior Vice President of FMR (2008-present); Deputy General Counsel of FMR LLC; Chief Legal Secretary of Fidelity Management & Research (Hong Kong) Limited (2008-present) and Assistant Secretary of Fidelity Management & Research (Japan) Inc. (2008-present). Previously, Mr. Goebel served as Assistant Secretary of the Funds (2007-2008) and as Vice President and Secretary of Fidelity Distributors Corporation (FDC) (2005-2007). |
John B. McGinty, Jr. (46) |
| Year of Election or Appointment: 2008 Assistant Secretary of Fidelity's Equity and High Income Funds. Mr. McGinty is an employee of Fidelity Investments (2004-present). Mr. McGinty also serves as Senior Vice President, Secretary, and Chief Legal Officer of FDC (2007-present). Before joining Fidelity Investments, Mr. McGinty practiced law at Ropes & Gray, LLP. |
Holly C. Laurent (54) |
| Year of Election or Appointment: 2008 Anti-Money Laundering (AML) Officer of the Fidelity funds. Ms. Laurent is an employee of Fidelity Investments. Previously, Ms. Laurent was Senior Vice President and Head of Legal for Fidelity Business Services India Pvt. Ltd. (2006-2008), Senior Vice President, Deputy General Counsel and Group Head for FMR LLC (2005-2006). |
Christine Reynolds (50) |
| Year of Election or Appointment: 2008 Chief Financial Officer of the Fidelity funds. Ms. Reynolds became President of Fidelity Pricing and Cash Management Services (FPCMS) in August 2008. She served as Chief Operating Officer of FPCMS from 2007 through July 2008. Previously, Ms. Reynolds served as President, Treasurer, and Anti-Money Laundering officer of the Fidelity funds (2004-
2007). Before joining Fidelity Investments, Ms. Reynolds worked at PricewaterhouseCoopers LLP (PwC) (1980-2002), where she was an audit partner with PwC's investment management practice. |
Kenneth A. Rathgeber (61) |
| Year of Election or Appointment: 2004 Chief Compliance Officer of Fidelity's Equity and High Income Funds. Mr. Rathgeber is Chief Compliance Officer of Fidelity Management & Research (Hong Kong) Limited (2008-present), Fidelity Management & Research (Japan) Inc. (2008-present), FMR (2005-present), FMR Co., Inc. (2005-present), Fidelity Management & Research (U.K.) Inc. (2005-
present), Fidelity Research & Analysis Company (2005-present), Fidelity Investments Money Management, Inc. (2005-present), and Strategic Advisers, Inc. (2005-present). |
Bryan A. Mehrmann (47) |
| Year of Election or Appointment: 2005 Deputy Treasurer of the Fidelity funds. Mr. Mehrmann is an employee of Fidelity Investments. Previously, Mr. Mehrmann served as Vice President of Fidelity Investments Institutional Services Group (FIIS)/Fidelity Investments Institutional Operations Corporation, Inc. (FIIOC) Client Services (1998-2004). |
Adrien E. Deberghes (41) |
| Year of Election or Appointment: 2008 Deputy Treasurer of Fidelity's Equity and High Income Funds. Mr. Deberghes is an employee of Fidelity Investments (2008-present). Previously, Mr. Deberghes served as Senior Vice President of Mutual Fund Administration at State Street Corporation (2007-2008), Senior Director of Mutual Fund Administration at Investors Bank & Trust (2005-2007), and Director of Finance for Dunkin' Brands (2000-2005). |
Robert G. Byrnes (41) |
| Year of Election or Appointment: 2005 Assistant Treasurer of the Fidelity funds. Mr. Byrnes is an employee of Fidelity Investments (2005-present). Previously, Mr. Byrnes served as Vice President of Fidelity Pricing and Cash Management Services (FPCMS) (2003-2005). Before joining Fidelity Investments, Mr. Byrnes worked at Deutsche Asset Management where he served as Vice President of the Investment Operations Group (2000-2003). |
Peter L. Lydecker (54) |
| Year of Election or Appointment: 2004 Assistant Treasurer of the Fidelity funds. Mr. Lydecker is an employee of Fidelity Investments. |
Paul M. Murphy (61) |
| Year of Election or Appointment: 2007 Assistant Treasurer of the Fidelity funds. Mr. Murphy is an employee of Fidelity Investments (2007-present). Previously, Mr. Murphy served as Chief Financial Officer of the Fidelity Funds (2005-2006), Vice President and Associate General Counsel of FMR (2007), and Senior Vice President of Fidelity Pricing and Cash Management Services (FPCMS) (1994-2007). |
Gary W. Ryan (50) |
| Year of Election or Appointment: 2005 Assistant Treasurer of the Fidelity funds. Mr. Ryan is an employee of Fidelity Investments. Previously, Mr. Ryan served as Vice President of Fund Reporting in Fidelity Pricing and Cash Management Services (FPCMS) (1999-2005). |
** FMR Corp. merged with and into FMR LLC on October 1, 2007. Any references to FMR LLC for prior periods are deemed to be references to the prior entity.
Annual Report
A special meeting of each fund's shareholders was held on April 16, 2008. The results of votes taken among shareholders on the proposal before them are reported below. Each vote reported represents one dollar of net asset value held on the record date for the meeting.
PROPOSAL 1 |
To elect a Board of Trustees.A |
| # of
Votes | % of
Votes |
James C. Curvey |
Affirmative | 44,485,656,811.55 | 94.702 |
Withheld | 2,488,551,854.62 | 5.298 |
TOTAL | 46,974,208,666.17 | 100.000 |
Dennis J. Dirks |
Affirmative | 44,706,671,638.31 | 95.173 |
Withheld | 2,267,537,027.86 | 4.827 |
TOTAL | 46,974,208,666.17 | 100.000 |
Edward C. Johnson 3d |
Affirmative | 44,294,881,638.16 | 94.296 |
Withheld | 2,679,327,028.01 | 5.704 |
TOTAL | 46,974,208,666.17 | 100.000 |
Alan J. Lacy |
Affirmative | 44,685,373,413.16 | 95.127 |
Withheld | 2,288,835,253.01 | 4.873 |
TOTAL | 46,974,208,666.17 | 100.000 |
Ned C. Lautenbach |
Affirmative | 44,634,541,379.41 | 95.019 |
Withheld | 2,339,667,286.76 | 4.981 |
TOTAL | 46,974,208,666.17 | 100.000 |
Joseph Mauriello |
Affirmative | 44,683,962,099.80 | 95.124 |
Withheld | 2,290,246,566.37 | 4.876 |
TOTAL | 46,974,208,666.17 | 100.000 |
Cornelia M. Small |
Affirmative | 44,671,688,375.36 | 95.098 |
Withheld | 2,302,520,290.81 | 4.902 |
TOTAL | 46,974,208,666.17 | 100.000 |
| # of
Votes | % of
Votes |
William S. Stavropoulos |
Affirmative | 44,465,262,087.61 | 94.659 |
Withheld | 2,508,946,578.56 | 5.341 |
TOTAL | 46,974,208,666.17 | 100.000 |
David M. Thomas |
Affirmative | 44,694,340,813.87 | 95.147 |
Withheld | 2,279,867,852.30 | 4.853 |
TOTAL | 46,974,208,666.17 | 100.000 |
Michael E. Wiley |
Affirmative | 44,686,513,174.78 | 95.130 |
Withheld | 2,287,695,491.39 | 4.870 |
TOTAL | 46,974,208,666.17 | 100.000 |
A Denotes trust-wide proposal and voting results.
Annual Report
Managing Your Investments
Fidelity offers several ways to conveniently manage your personal investments via your telephone or PC. You can access your account information, conduct trades and research your investments 24 hours a day.
By Phone
Fidelity Automated Service Telephone provides a single toll-free number to access account balances, positions, quotes and trading. It's easy to navigate the service, and on your first call, the system will help you create a personal identification number (PIN) for security.
(phone_graphic)
Fidelity Automated
Service Telephone (FAST®)
1-800-544-5555
Press
For mutual fund and brokerage trading.
For quotes.*
For account balances and holdings.
To review orders and mutual
fund activity.
To change your PIN.
To speak to a Fidelity representative.
By PC
Fidelity's web site on the Internet provides a wide range of information, including daily financial news, fund performance, interactive planning tools and news about Fidelity products and services.
(computer_graphic)
Fidelity's Web Site
www.fidelity.com
* When you call the quotes line, please remember that a fund's yield and return will vary and, except for money market funds, share price will also vary. This means that you may have a gain or loss when you sell your shares. There is no assurance that money market funds will be able to maintain a stable $1 share price; an investment in a money market fund is not insured or guaranteed by the U.S. government. Total returns are historical and include changes in share price, reinvestment of dividends and capital gains, and the effects of any sales charges.
Annual Report
To Write Fidelity
We'll give your correspondence immediate attention and send you written confirmation upon completion of your request.
(letter_graphic)
Making Changes
To Your Account
(such as changing name, address, bank, etc.)
Fidelity Investments
P.O. Box 770001
Cincinnati, OH 45277-0002
(letter_graphic)
For Non-Retirement
Accounts
Buying shares
Fidelity Investments
P.O. Box 770001
Cincinnati, OH 45277-0003
Overnight Express
Fidelity Investments
Attn: Distribution Services
100 Crosby Parkway - KC1H
Covington, KY 41015
Selling shares
Fidelity Investments
P.O. Box 770001
Cincinnati, OH 45277-0035
Overnight Express
Fidelity Investments
Attn: Distribution Services
100 Crosby Parkway - KC1H
Covington, KY 41015
General Correspondence
Fidelity Investments
P.O. Box 500
Merrimack, NH 03054-0500
(letter_graphic)
For Retirement
Accounts
Buying shares
Fidelity Investments
P.O. Box 770001
Cincinnati, OH 45277-0003
Selling shares
Fidelity Investments
P.O. Box 770001
Cincinnati, OH 45277-0035
Overnight Express
Fidelity Investments
Attn: Distribution Services
100 Crosby Parkway - KC1H
Covington, KY 41015
General Correspondence
Fidelity Investments
P.O. Box 500
Merrimack, NH 03054-0500
Annual Report
Investment Adviser
Fidelity Management & Research Company
Boston, MA
Investment Sub-Advisers
FMR Co., Inc.
Fidelity Management & Research
(U.K.) Inc.
Fidelity Management & Research
(Hong Kong) Limited
Fidelity Management & Research
(Japan) Inc.
Fidelity Research & Analysis Company
FIL Investment Advisors
Fidelity Investments Japan Limited
FIL Investment Advisors (U.K.) Ltd.
General Distributor
Fidelity Distributors Corporation
Boston, MA
Transfer and Service Agent
Fidelity Investments Institutional
Operations Company, Inc.
Boston, MA
Fidelity Service Company, Inc.
Boston, MA
Custodian
State Street Bank and Trust Company
Quincy, MA
The Fidelity Telephone Connection
Mutual Fund 24-Hour Service
Exchanges/Redemptions
and Account Assistance 1-800-544-6666
Product Information 1-800-544-8888
Retirement Accounts 1-800-544-4774
(8 a.m. - 9 p.m.)
TDD Service 1-800-544-0118
for the deaf and hearing impaired
(9 a.m. - 9 p.m. Eastern time)
Fidelity Automated Service
Telephone (FAST®) 1-800-544-5555
Automated line for quickest service
IGF/TIE-UANN-1208
1.881355.100
(Fidelity Investment logo)(registered trademark)
Fidelity Advisor
International Growth
Fund - Class A, Class T, Class B
and Class C
Annual Report
October 31, 2008
Class A, Class T,
Class B, and Class C are
classes of Fidelity®
International Growth Fund
(2_fidelity_logos) (Registered_Trademark)
Contents
Chairman's Message | <Click Here> | Ned Johnson's message to shareholders. |
Performance | <Click Here> | How the fund has done over time. |
Management's Discussion | <Click Here> | The manager's review of fund performance, strategy and outlook. |
Shareholder Expense Example | <Click Here> | An example of shareholder expenses. |
Investment Changes | <Click Here> | A summary of major shifts in the fund's investments over the past six months. |
Investments | <Click Here> | A complete list of the fund's investments with their market values. |
Financial Statements | <Click Here> | Statements of assets and liabilities, operations, and changes in net assets, as well as financial highlights. |
Notes | <Click Here> | Notes to financial statements. |
Report of Independent Registered Public Accounting Firm | <Click Here> | |
Trustees and Officers | <Click Here> | |
Proxy Voting Results | <Click Here> | |
Board Approval of Investment Advisory Contracts and Management Fees | <Click Here> | |
To view a fund's proxy voting guidelines and proxy voting record for the 12-month period ended June 30, visit http://www.fidelity.com (search for "proxy voting guidelines") or visit the Securities and Exchange Commission's (SEC) web site at http://www.sec.gov. You may also call 1-877-208-0098 to request a free copy of the proxy voting guidelines.
Standard & Poor's, S&P and S&P 500 are registered service marks of The McGraw-Hill Companies, Inc. and have been licensed for use by Fidelity Distributors Corporation.
Other third party marks appearing herein are the property of their respective owners.
All other marks appearing herein are registered or unregistered trademarks or service marks of FMR LLC or an affiliated company.
Annual Report
This report and the financial statements contained herein are submitted for the general information of the shareholders of the fund. This report is not authorized for distribution to prospective investors in the fund unless preceded or accompanied by an effective prospectus.
A fund files its complete schedule of portfolio holdings with the SEC for the first and third quarters of each fiscal year on Form N-Q. Forms N-Q are available on the SEC's web site at http://www.sec.gov. A fund's Forms N-Q may be reviewed and copied at the SEC's Public Reference Room in Washington, DC. Information regarding the operation of the SEC's Public Reference Room may be obtained by calling 1-800-SEC-0330. For a complete list of a fund's portfolio holdings, view the most recent holdings listing, semiannual report, or annual report on Fidelity's web site at http://www.fidelity.com or http://www.advisor.fidelity.com, as applicable.
NOT FDIC INSURED · MAY LOSE VALUE · NO BANK GUARANTEE
Neither the fund nor Fidelity Distributors Corporation is a bank.
Annual Report
(photo_of_Edward_C_Johnson_3d)
Dear Shareholder:
Turmoil has been the watchword for the world's securities markets in 2008, with domestic and international stocks down sharply amid the global credit squeeze. A flight to quality boosted returns for U.S. Treasuries, one of the few asset classes with positive results heading into the latter stages of the year. Financial markets are always unpredictable, but there are a number of time-tested principles that can put the historical odds in your favor.
One of the basic tenets is to invest for the long term. Over time, riding out the markets' inevitable ups and downs has proven much more effective than selling into panic or chasing the hottest trend. Even missing only a few of the markets' best days can significantly diminish investor returns. Patience also affords the benefits of compounding - of earning interest on additional income or reinvested dividends and capital gains. There are tax advantages and cost benefits to consider as well. The more you sell, the more taxes you pay, and the more you trade, the higher the costs. While staying the course doesn't eliminate risk, it can considerably lessen the effect of short-term declines.
You can further manage your investing risk through diversification. And today, more than ever, geographic diversification should be taken into account. Studies indicate that asset allocation is the single most important determinant of a portfolio's long-term success. The right mix of stocks, bonds and cash - aligned to your particular risk tolerance and investment objective - is very important. Age-appropriate rebalancing is also an essential aspect of asset allocation. For younger investors, an emphasis on equities - which historically have been the best-performing asset class over time - is encouraged. As investors near their specific goal, such as retirement or sending a child to college, consideration may be given to replacing volatile assets (e.g. common stocks) with more-stable fixed investments (bonds or savings plans).
A third investment principle - investing regularly - can help lower the average cost of your purchases. Investing a certain amount of money each month or quarter helps ensure you won't pay for all your shares at market highs. This strategy - known as dollar cost averaging - also reduces unconstructive "emotion" from investing, helping shareholders avoid selling weak performers just prior to an upswing, or chasing a hot performer just before a correction.
We invite you to contact us via the Internet, through our Investor Centers or over the phone. It is our privilege to provide you the information you need to make the investments that are right for you.
Sincerely,
/s/Edward C. Johnson 3d
Edward C. Johnson 3d
Annual Report
Average annual total return reflects the change in the value of an investment, assuming reinvestment of the class' dividend income and capital gains (the profits earned upon the sale of securities that have grown in value, if any) and assuming a constant rate of performance each year. The $10,000 table and the fund's returns do not reflect the deduction of taxes that a shareholder would pay on fund distributions or the redemption of fund shares. During periods of reimbursement by Fidelity, a fund's total return will be greater than it would be had the reimbursement not occurred. How a fund did yesterday is no guarantee of how it will do tomorrow.
Average annual total returns take Fidelity Advisor International Growth's cumulative total return and show you what would have happened if Fidelity Advisor International Growth shares had performed at a constant rate each year. These numbers will be reported once the fund is a year old.
$10,000 Over Life of Fund
Let's say hypothetically that $10,000 was invested in Fidelity Advisor International Growth Fund - Class A on November 1, 2007, when the fund started, and the current 5.75% sales charge was paid. The chart shows how the value of your investment would have changed, and also shows how the MSCI® Europe, Australasia, Far East (MSCI EAFE®) Growth Index performed over the same period.
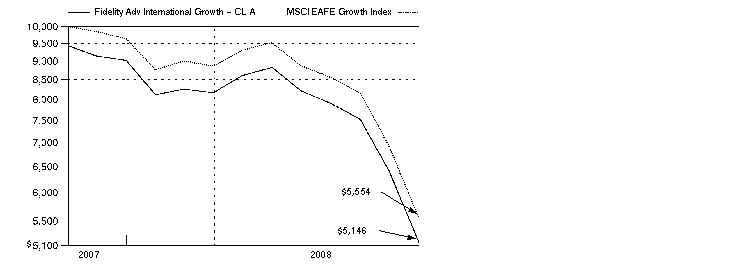
Annual Report
Comments from Jed Weiss, Portfolio Manager of Fidelity Advisor International Growth Fund
In a dramatic reversal of what had been a multiyear global growth story, international stocks fell long and hard during the 12 months ending October 31, 2008, especially so during the latter stages of the period and mostly as a result of fallout from the financial crisis that emanated from the United States. The viral spread of this financial contagion - which began in the U.S. subprime mortgage market, then seized up the credit markets, hobbled major financial institutions and eventually slowed economic growth worldwide - left virtually no corner of the globe untouched. Developed international equity markets - as gauged by the MSCI® Europe, Australasia, Far East (EAFE®) Index, which monitors established markets outside the U.S. and Canada - fell 46.54%, while the Standard & Poor's 500SM Index, a measure of U.S. stocks, dropped 36.10%. Among countries constituting at least 1% of the EAFE index, Switzerland had the "least worst" showing, falling roughly 32%, followed by Japan, where stocks slid by around 37%. Meanwhile, the weakest overall performance came from Belgium, where stocks slipped by nearly 70%. In the United Kingdom, the largest component of the index, equities were down almost 48%. Emerging markets were the weakest performers among the global economies, declining 56.22% as measured by the MSCI Emerging Markets Index.
For the period from their inception on November 1, 2007, through October 31, 2008, the fund's Class A, Class T, Class B and Class C shares fell 45.40%, 45.50%, 45.80% and 45.80%, respectively (excluding sales charges), while the MSCI EAFE Growth Index fell 44.46%. The fund underperformed its benchmark partially due to unfavorable stock selection in the energy and information technology sectors. An overweighting and poor stock picks in diversified financials also detracted, as did not owning a position in German automaker Volkswagen, which had an extraordinary gain late in the period on heavy buying by a take-over suitor. Among other detracting factors were underweighted stakes in two solid-performing pharmaceuticals stocks - U.K.-based GlaxoSmithKline and Switzerland's Novartis - and an overweighted position in Singapore Exchange, a regional stock market. The fund was overweighted in consumer staples - especially in the food, beverage and tobacco group - and this defensive orientation helped, especially our sizable stake in Nestle, the Swiss multinational packaged goods company. Other contributors included Torishima Pump Manufacturing, a Japanese maker of pressure pumps used in desalination and power projects that I sold to take profits, and CSL, Ltd., an Australian biopharmaceutical company that focuses on blood plasma products.
The views expressed above reflect those of the portfolio manager(s) only through the end of the period as stated on the cover of this report and do not necessarily represent the views of Fidelity or any other person in the Fidelity organization. Any such views are subject to change at any time based upon market or other conditions and Fidelity disclaims any responsibility to update such views. These views may not be relied on as investment advice and, because investment decisions for a Fidelity fund are based on numerous factors, may not be relied on as an indication of trading intent on behalf of any Fidelity fund.
Annual Report
Fidelity International Growth Fund
Shareholder Expense Example
As a shareholder of the Fund, you incur two types of costs: (1) transaction costs, including sales charges (loads) on purchase payments or redemption proceeds, redemption fees, and (2) ongoing costs, including management fees, distribution and/or service (12b-1) fees and other Fund expenses. This Example is intended to help you understand your ongoing costs (in dollars) of investing in the Fund and to compare these costs with the ongoing costs of investing in other mutual funds.
The Example is based on an investment of $1,000 invested at the beginning of the period and held for the entire period (May 1, 2008 to October 31, 2008).
Actual Expenses
The first line of the accompanying table for each class of the Fund provides information about actual account values and actual expenses. You may use the information in this line, together with the amount you invested, to estimate the expenses that you paid over the period. Simply divide your account value by $1,000.00 (for example, an $8,600 account value divided by $1,000.00 = 8.6), then multiply the result by the number in the first line for a class of the Fund under the heading entitled "Expenses Paid During Period" to estimate the expenses you paid on your account during this period. A small balance maintenance fee of $12.00 that is charged once a year may apply for certain accounts with a value of less than $2,000. This fee is not included in the table below. If it was, the estimate of expenses you paid during the period would be higher, and your ending account value lower, by this amount.
Hypothetical Example for Comparison Purposes
The second line of the accompanying table for each class of the Fund provides information about hypothetical account values and hypothetical expenses based on a Class' actual expense ratio and an assumed rate of return of 5% per year before expenses, which is not the Class' actual return. The hypothetical account values and expenses may not be used to estimate the actual ending account balance or expenses you paid for the period. You may use this information to compare the ongoing costs of investing in the Fund and other funds. To do so, compare this 5% hypothetical example with the 5% hypothetical examples that appear in the shareholder reports of the other funds. A small balance maintenance fee of $12.00 that is charged once a year may apply for certain accounts with a value of less than $2,000. This fee is not included in the table below. If it was, the estimate of expenses you paid during the period would be higher, and your ending account value lower, by this amount.
Please note that the expenses shown in the table are meant to highlight your ongoing costs only and do not reflect any transaction costs. Therefore, the second line of the table is useful in comparing ongoing costs only, and will not help you determine the relative total costs of owning different funds. In addition, if these transactional costs were included, your costs would have been higher.
Annual Report
Fidelity International Growth Fund
Shareholder Expense Example - continued
| Annualized
Expense Ratio | Beginning
Account Value
May 1, 2008 | Ending
Account Value
October 31, 2008 | Expenses Paid
During Period*
May 1, 2008
to October 31, 2008 |
Class A | 1.50% | | | |
Actual | | $ 1,000.00 | $ 598.00 | $ 6.03 |
HypotheticalA | | $ 1,000.00 | $ 1,017.60 | $ 7.61 |
Class T | 1.75% | | | |
Actual | | $ 1,000.00 | $ 597.60 | $ 7.03 |
HypotheticalA | | $ 1,000.00 | $ 1,016.34 | $ 8.87 |
Class B | 2.25% | | | |
Actual | | $ 1,000.00 | $ 595.60 | $ 9.02 |
HypotheticalA | | $ 1,000.00 | $ 1,013.83 | $ 11.39 |
Class C | 2.25% | | | |
Actual | | $ 1,000.00 | $ 595.60 | $ 9.02 |
HypotheticalA | | $ 1,000.00 | $ 1,013.83 | $ 11.39 |
International Growth | 1.25% | | | |
Actual | | $ 1,000.00 | $ 599.60 | $ 5.03 |
HypotheticalA | | $ 1,000.00 | $ 1,018.85 | $ 6.34 |
Institutional Class | 1.25% | | | |
Actual | | $ 1,000.00 | $ 599.60 | $ 5.03 |
HypotheticalA | | $ 1,000.00 | $ 1,018.85 | $ 6.34 |
A 5% return per year before expenses
* Expenses are equal to each Class' annualized expense ratio, multiplied by the average account value over the period, multiplied by 184/366 (to reflect the one-half year period).
Annual Report
Fidelity International Growth Fund
Investment Changes (Unaudited)
Geographic Diversification (% of fund's net assets) |
As of October 31, 2008 |
| Switzerland 18.2% |
| United Kingdom 16.4% |
| United States of America 13.1% |
| Japan 10.2% |
| Australia 6.7% |
| Germany 5.9% |
| France 4.6% |
| Spain 3.8% |
| Netherlands 2.9% |
| Other 18.2% |

Percentages are adjusted for the effect of futures contracts, if applicable. |
As of April 30, 2008 |
| United Kingdom 18.6% |
| Switzerland 10.2% |
| United States of America 8.6% |
| Germany 8.6% |
| Japan 7.9% |
| France 7.0% |
| Australia 5.8% |
| Canada 3.9% |
| South Africa 3.8% |
| Other 25.6% |

Percentages are adjusted for the effect of futures contracts, if applicable. |
Asset Allocation as of October 31, 2008 |
| % of fund's
net assets | % of fund's net assets
6 months ago |
Stocks and Investment Companies | 99.1 | 99.6 |
Short-Term Investments and Net Other Assets | 0.9 | 0.4 |
Top Ten Stocks as of October 31, 2008 |
| % of fund's
net assets | % of fund's net assets
6 months ago |
Nestle SA (Reg.) (Switzerland, Food Products) | 7.7 | 4.5 |
Roche Holding AG (participation certificate) (Switzerland, Pharmaceuticals) | 4.8 | 2.3 |
Novartis AG sponsored ADR (Switzerland, Pharmaceuticals) | 3.6 | 0.0 |
CSL Ltd. (Australia, Biotechnology) | 3.6 | 2.3 |
E.ON AG (Germany, Electric Utilities) | 3.6 | 3.2 |
Reckitt Benckiser Group PLC (United Kingdom, Household Products) | 2.9 | 1.5 |
Mitsubishi UFJ Financial Group, Inc. sponsored ADR (Japan, Commercial Banks) | 2.7 | 0.0 |
Woolworths Ltd. (Australia, Food & Staples Retailing) | 2.6 | 1.2 |
BAE Systems PLC (United Kingdom, Aerospace & Defense) | 2.4 | 1.5 |
Visa, Inc. (United States of America, IT Services) | 2.1 | 0.8 |
| 36.0 | |
Market Sectors as of October 31, 2008 |
| % of fund's
net assets | % of fund's net assets
6 months ago |
Consumer Staples | 25.0 | 17.4 |
Health Care | 17.6 | 8.0 |
Financials | 12.2 | 9.2 |
Information Technology | 10.6 | 11.3 |
Industrials | 8.0 | 14.5 |
Materials | 7.3 | 15.7 |
Telecommunication Services | 7.1 | 6.6 |
Utilities | 5.1 | 5.0 |
Consumer Discretionary | 3.6 | 5.1 |
Energy | 2.6 | 4.9 |
Annual Report
Fidelity International Growth Fund
Investments October 31, 2008
Showing Percentage of Net Assets
Common Stocks - 99.1% |
| Shares | | Value |
Australia - 6.7% |
CSL Ltd. | 22,127 | | $ 537,841 |
QBE Insurance Group Ltd. | 4,688 | | 79,940 |
Woolworths Ltd. | 21,117 | | 393,449 |
TOTAL AUSTRALIA | | 1,011,230 |
Belgium - 1.0% |
InBev SA | 3,600 | | 145,199 |
Bermuda - 0.3% |
Ports Design Ltd. | 44,000 | | 51,153 |
Brazil - 1.1% |
BM&F BOVESPA SA | 6,800 | | 18,067 |
Companhia Vale do Rio Doce sponsored ADR | 3,000 | | 39,360 |
Petroleo Brasileiro SA - Petrobras sponsored ADR | 3,900 | | 104,871 |
TOTAL BRAZIL | | 162,298 |
Canada - 2.4% |
Agnico-Eagle Mines Ltd. | 3,600 | | 99,300 |
Goldcorp, Inc. | 8,000 | | 149,544 |
Harry Winston Diamond Corp. | 4,100 | | 39,953 |
Potash Corp. of Saskatchewan, Inc. | 800 | | 68,208 |
TOTAL CANADA | | 357,005 |
Cayman Islands - 0.2% |
China Dongxiang Group Co. Ltd. | 124,000 | | 36,480 |
Denmark - 1.5% |
Novo Nordisk AS Series B sponsored ADR | 2,700 | | 144,477 |
Vestas Wind Systems AS (a) | 1,960 | | 80,281 |
TOTAL DENMARK | | 224,758 |
Finland - 1.0% |
Nokia Corp. sponsored ADR | 10,000 | | 151,800 |
France - 4.6% |
Alstom SA | 2,310 | | 114,492 |
Audika SA | 1,900 | | 44,302 |
Delachaux SA | 709 | | 38,995 |
GDF Suez | 5,202 | | 232,527 |
Groupe Danone | 2,595 | | 144,492 |
L'Air Liquide SA | 600 | | 51,777 |
Laurent-Perrier Group | 290 | | 23,511 |
Remy Cointreau SA | 1,104 | | 45,937 |
TOTAL FRANCE | | 696,033 |
Common Stocks - continued |
| Shares | | Value |
Germany - 5.9% |
Bayer AG | 2,200 | | $ 122,473 |
E.ON AG | 14,000 | | 535,595 |
Linde AG | 800 | | 67,185 |
Siemens AG sponsored ADR | 2,800 | | 168,420 |
TOTAL GERMANY | | 893,673 |
Hong Kong - 0.4% |
Hong Kong Exchanges & Clearing Ltd. | 6,500 | | 65,915 |
India - 1.1% |
Bharti Airtel Ltd. (a) | 12,423 | | 168,210 |
Ireland - 0.3% |
CRH PLC sponsored ADR | 2,000 | | 42,320 |
Israel - 1.4% |
Partner Communications Co. Ltd. ADR | 11,400 | | 212,952 |
Japan - 10.2% |
Dydo Drinco, Inc. | 800 | | 19,201 |
East Japan Railway Co. | 8 | | 56,925 |
Kobayashi Pharmaceutical Co. Ltd. | 2,100 | | 67,279 |
Mitsubishi UFJ Financial Group, Inc. sponsored ADR | 63,600 | | 398,772 |
Nagaileben Co. Ltd. | 1,000 | | 19,855 |
Nintendo Co. Ltd. | 700 | | 218,400 |
Nippon Building Fund, Inc. | 5 | | 48,043 |
Osaka Securities Exchange Co. Ltd. | 9 | | 29,572 |
Ozeki Co. Ltd. | 200 | | 4,888 |
Promise Co. Ltd. | 5,750 | | 103,202 |
Seven & I Holdings Co. Ltd. | 2,000 | | 56,153 |
Shiseido Co. Ltd. | 5,000 | | 103,000 |
Sony Financial Holdings, Inc. | 33 | | 107,320 |
Sumitomo Mitsui Financial Group, Inc. | 39 | | 156,338 |
Tsutsumi Jewelry Co. Ltd. | 2,800 | | 54,547 |
USS Co. Ltd. | 1,470 | | 90,033 |
TOTAL JAPAN | | 1,533,528 |
Korea (South) - 0.5% |
NHN Corp. (a) | 660 | | 70,456 |
Mexico - 1.6% |
America Movil SAB de CV Series L sponsored ADR | 4,700 | | 145,418 |
Fomento Economico Mexicano SA de CV sponsored ADR | 1,300 | | 32,877 |
Wal-Mart de Mexico SA de CV Series V | 26,000 | | 69,845 |
TOTAL MEXICO | | 248,140 |
Common Stocks - continued |
| Shares | | Value |
Netherlands - 2.9% |
ASML Holding NV (NY Shares) | 15,400 | | $ 270,270 |
Koninklijke KPN NV | 3,500 | | 49,291 |
QIAGEN NV (a) | 2,600 | | 37,076 |
Unilever NV (NY Shares) | 3,200 | | 76,960 |
TOTAL NETHERLANDS | | 433,597 |
Papua New Guinea - 0.2% |
Lihir Gold Ltd. sponsored ADR (a) | 2,500 | | 31,950 |
Philippines - 0.2% |
Jollibee Food Corp. | 32,400 | | 30,525 |
Singapore - 0.3% |
Singapore Exchange Ltd. | 12,000 | | 42,953 |
South Africa - 1.9% |
African Rainbow Minerals Ltd. | 6,439 | | 65,247 |
MTN Group Ltd. | 19,500 | | 217,554 |
TOTAL SOUTH AFRICA | | 282,801 |
Spain - 3.8% |
Grifols SA | 9,132 | | 181,734 |
Inditex SA | 2,200 | | 74,365 |
Prosegur Comp Securidad SA (Reg.) | 1,500 | | 42,614 |
Telefonica SA sponsored ADR | 4,800 | | 266,448 |
TOTAL SPAIN | | 565,161 |
Sweden - 1.7% |
H&M Hennes & Mauritz AB (B Shares) | 3,800 | | 136,239 |
Swedish Match Co. | 8,400 | | 116,627 |
TOTAL SWEDEN | | 252,866 |
Switzerland - 18.2% |
ABB Ltd. sponsored ADR | 5,100 | | 67,065 |
Credit Suisse Group sponsored ADR | 2,000 | | 74,800 |
EFG International | 3,950 | | 85,016 |
Nestle SA (Reg.) | 29,808 | | 1,158,896 |
Novartis AG sponsored ADR | 10,600 | | 540,494 |
Roche Holding AG (participation certificate) | 4,695 | | 717,837 |
Sonova Holding AG | 1,177 | | 48,894 |
The Swatch Group AG (Reg.) | 1,651 | | 47,266 |
TOTAL SWITZERLAND | | 2,740,268 |
Turkey - 1.1% |
Anadolu Efes Biracilik ve Malt Sanyii AS | 10,800 | | 90,959 |
Common Stocks - continued |
| Shares | | Value |
Turkey - continued |
Asya Katilim Bankasi AS | 42,500 | | $ 37,171 |
Tupras-Turkiye Petrol Rafinerileri AS | 3,500 | | 44,216 |
TOTAL TURKEY | | 172,346 |
United Kingdom - 16.4% |
Autonomy Corp. PLC (a) | 8,300 | | 131,586 |
BAE Systems PLC | 64,600 | | 363,069 |
BG Group PLC | 14,700 | | 216,121 |
BHP Billiton PLC ADR | 9,000 | | 308,970 |
British American Tobacco PLC sponsored ADR | 3,000 | | 163,080 |
Datacash Group PLC | 11,200 | | 38,994 |
Man Group PLC | 27,737 | | 160,119 |
Reckitt Benckiser Group PLC | 10,400 | | 439,864 |
Rio Tinto PLC sponsored ADR | 750 | | 139,403 |
Serco Group PLC | 45,200 | | 269,520 |
Tesco PLC | 42,600 | | 233,381 |
TOTAL UNITED KINGDOM | | 2,464,107 |
United States of America - 12.2% |
Allergan, Inc. | 1,900 | | 75,373 |
Berkshire Hathaway, Inc. Class B (a) | 80 | | 307,200 |
FMC Technologies, Inc. (a) | 1,000 | | 34,990 |
Gilead Sciences, Inc. (a) | 3,500 | | 160,475 |
JPMorgan Chase & Co. | 3,000 | | 123,750 |
Juniper Networks, Inc. (a) | 11,200 | | 209,888 |
Lululemon Athletica, Inc. (a) | 300 | | 4,251 |
MasterCard, Inc. Class A | 700 | | 103,474 |
Mohawk Industries, Inc. (a) | 700 | | 33,866 |
Philip Morris International, Inc. | 6,900 | | 299,943 |
Pricesmart, Inc. | 6,905 | | 102,885 |
Varian Semiconductor Equipment Associates, Inc. (a) | 2,800 | | 54,936 |
Visa, Inc. | 5,800 | | 321,030 |
TOTAL UNITED STATES OF AMERICA | | 1,832,061 |
TOTAL COMMON STOCKS (Cost $21,022,747) | 14,919,785 |
Cash Equivalents - 1.4% |
| Maturity Amount | | Value |
Investments in repurchase agreements in a joint trading account at 0.14%, dated 10/31/08 due 11/3/08 (Collateralized by U.S. Treasury Obligations) #
(Cost $220,000) | $ 220,003 | | $ 220,000 |
TOTAL INVESTMENT PORTFOLIO - 100.5% (Cost $21,242,747) | | 15,139,785 |
NET OTHER ASSETS - (0.5)% | | (81,700) |
NET ASSETS - 100% | $ 15,058,085 |
Legend |
(a) Non-income producing |
# Additional Information on each counterparty to the repurchase agreement is as follows: |
Repurchase Agreement / Counterparty | Value |
$220,000 due 11/03/08 at 0.14% |
BNP Paribas Securities Corp. | $ 14,823 |
Banc of America Securities LLC | 29,645 |
Barclays Capital, Inc. | 29,645 |
Deutsche Bank Securities, Inc. | 77,078 |
Morgan Stanley & Co., Inc. | 2,107 |
UBS Securities LLC | 66,702 |
| $ 220,000 |
Affiliated Central Funds |
Information regarding fiscal year to date income earned by the Fund from investments in Fidelity Central Funds is as follows: |
Fund | Income earned |
Fidelity Securities Lending Cash Central Fund | $ 796 |
Income Tax Information |
At October 31, 2008, the fund had a capital loss carryforward of approximately $4,969,583 all of which will expire on October 31, 2016. |
See accompanying notes which are an integral part of the financial statements.
Annual Report
Fidelity International Growth Fund
Statement of Assets and Liabilities
| October 31, 2008 |
| | |
Assets | | |
Investment in securities, at value (including repurchase agreements of $220,000) - See accompanying schedule: Unaffiliated issuers (cost $21,242,747) | | $ 15,139,785 |
Cash | | 826 |
Receivable for investments sold | | 209,595 |
Receivable for fund shares sold | | 41,993 |
Dividends receivable | | 38,609 |
Distributions receivable from Fidelity Central Funds | | 556 |
Receivable from investment adviser for expense reductions | | 53,322 |
Other receivables | | 953 |
Total assets | | 15,485,639 |
| | |
Liabilities | | |
Payable for investments purchased | $ 301,583 | |
Payable for fund shares redeemed | 60,128 | |
Accrued management fee | 9,220 | |
Distribution fees payable | 1,501 | |
Other affiliated payables | 5,737 | |
Other payables and accrued expenses | 49,385 | |
Total liabilities | | 427,554 |
| | |
Net Assets | | $ 15,058,085 |
Net Assets consist of: | | |
Paid in capital | | $ 26,452,349 |
Undistributed net investment income | | 181,332 |
Accumulated undistributed net realized gain (loss) on investments and foreign currency transactions | | (5,470,327) |
Net unrealized appreciation (depreciation) on investments and assets and liabilities in foreign currencies | | (6,105,269) |
Net Assets | | $ 15,058,085 |
See accompanying notes which are an integral part of the financial statements.
Annual Report
Statement of Assets and Liabilities - continued
| October 31, 2008 |
| | |
Calculation of Maximum Offering Price
Class A:
Net Asset Value and redemption price per share ($819,539 ÷ 149,987 shares) | | $ 5.46 |
| | |
Maximum offering price per share (100/94.25 of $5.46) | | $ 5.79 |
Class T:
Net Asset Value and redemption price per share ($507,240 ÷ 93,049 shares) | | $ 5.45 |
| | |
Maximum offering price per share (100/96.50 of $5.45) | | $ 5.65 |
Class B:
Net Asset Value and offering price per share
($642,349 ÷ 118,413 shares)A | | $ 5.42 |
| | |
Class C:
Net Asset Value and offering price per share
($683,961 ÷ 126,111 shares)A | | $ 5.42 |
| | |
International Growth:
Net Asset Value, offering price and redemption price per share ($11,883,653 ÷ 2,170,400 shares) | | $ 5.48 |
| | |
Institutional Class:
Net Asset Value, offering price and redemption price per share ($521,343 ÷ 95,209 shares) | | $ 5.48 |
A Redemption price per share is equal to net asset value less any applicable contingent deferred sales charge.
See accompanying notes which are an integral part of the financial statements.
Annual Report
Fidelity International Growth Fund
Financial Statements - continued
Statement of Operations
For the period November 1, 2007
(commencement of operations)
to October 31, 2008 |
Investment Income | | |
Dividends | | $ 518,866 |
Interest | | 15,254 |
Income from Fidelity Central Funds | | 796 |
| | 534,916 |
Less foreign taxes withheld | | (45,586) |
Total income | | 489,330 |
| | |
Expenses | | |
Management fee | $ 151,935 | |
Transfer agent fees | 62,596 | |
Distribution fees | 24,223 | |
Accounting and security lending fees | 11,180 | |
Custodian fees and expenses | 112,910 | |
Independent trustees' compensation | 87 | |
Registration fees | 124,200 | |
Audit | 48,886 | |
Legal | 74 | |
Miscellaneous | 1,905 | |
Total expenses before reductions | 537,996 | |
Expense reductions | (249,208) | 288,788 |
Net investment income (loss) | | 200,542 |
Realized and Unrealized Gain (Loss) Net realized gain (loss) on: | | |
Investment securities: | | |
Unaffiliated issuers | (5,463,869) | |
Foreign currency transactions | (18,590) | |
Total net realized gain (loss) | | (5,482,459) |
Change in net unrealized appreciation (depreciation) on: Investment securities | (6,103,378) | |
Assets and liabilities in foreign currencies | (1,891) | |
Total change in net unrealized appreciation (depreciation) | | (6,105,269) |
Net gain (loss) | | (11,587,728) |
Net increase (decrease) in net assets resulting from operations | | $ (11,387,186) |
See accompanying notes which are an integral part of the financial statements.
Annual Report
Statement of Changes in Net Assets
| For the period
November 1, 2007
(commencement of
operations) to
October 31, 2008 |
Increase (Decrease) in Net Assets | |
Operations | |
Net investment income (loss) | $ 200,542 |
Net realized gain (loss) | (5,482,459) |
Change in net unrealized appreciation (depreciation) | (6,105,269) |
Net increase (decrease) in net assets resulting
from operations | (11,387,186) |
Distributions to shareholders from net investment income | (7,494) |
Share transactions - net increase (decrease) | 26,448,569 |
Redemption fees | 4,196 |
Total increase (decrease) in net assets | 15,058,085 |
| |
Net Assets | |
Beginning of period | - |
End of period (including undistributed net investment income of $181,332) | $ 15,058,085 |
See accompanying notes which are an integral part of the financial statements.
Annual Report
Financial Highlights - Class A
| For the period
November 1, 2007
(commencement of operations) to
October 31, 2008 |
Selected Per-Share Data | |
Net asset value, beginning of period | $ 10.00 |
Income from Investment Operations | |
Net investment income (loss) C | .07 |
Net realized and unrealized gain (loss) | (4.61) |
Total from investment operations | (4.54) |
Redemption fees added to paid in capital C, E | - |
Net asset value, end of period | $ 5.46 |
Total Return A, B | (45.40)% |
Ratios to Average Net Assets D, G | |
Expenses before reductions | 2.88% |
Expenses net of fee waivers, if any | 1.50% |
Expenses net of all reductions | 1.48% |
Net investment income (loss) | .80% |
Supplemental Data | |
Net assets, end of period (000 omitted) | $ 820 |
Portfolio turnover rate F | 115% |
A Total returns would have been lower had certain expenses not been reduced during the periods shown.
B Total returns do not include the effect of the sales charges.
C Calculated based on average shares outstanding during the period.
D Expense ratios reflect operating expenses of the class. Expenses before reductions do not reflect amounts reimbursed by the investment adviser or reductions from brokerage service arrangements or other expense offset arrangements and do not represent the amount paid by the class during periods when reimbursements or reductions occur. Expense ratios before reductions for start-up periods may not be representative of longer-term operating periods. Expenses net of fee waivers reflect expenses after reimbursement by the investment adviser but prior to reductions from brokerage service arrangements or other expense offset arrangements. Expenses net of all reductions represent the net expenses paid by the class.
E Amount represents less than $.01 per share.
F Amount does not include the portfolio activity of any underlying Fidelity Central Funds.
G Fees and expenses of the underlying Fidelity Central Funds are not included in the Fund's expense ratio. The Fund indirectly bears its proportionate share of the expenses of any underlying Fidelity Central Funds.
See accompanying notes which are an integral part of the financial statements.
Annual Report
Financial Highlights - Class T
| For the period
November 1, 2007
(commencement of operations) to
October 31, 2008 |
Selected Per-Share Data | |
Net asset value, beginning of period | $ 10.00 |
Income from Investment Operations | |
Net investment income (loss) C | .05 |
Net realized and unrealized gain (loss) | (4.60) |
Total from investment operations | (4.55) |
Redemption fees added to paid in capital C, E | - |
Net asset value, end of period | $ 5.45 |
Total Return A, B | (45.50)% |
Ratios to Average Net Assets D, G | |
Expenses before reductions | 3.07% |
Expenses net of fee waivers, if any | 1.75% |
Expenses net of all reductions | 1.73% |
Net investment income (loss) | .55% |
Supplemental Data | |
Net assets, end of period (000 omitted) | $ 507 |
Portfolio turnover rate F | 115% |
A Total returns would have been lower had certain expenses not been reduced during the periods shown.
B Total returns do not include the effect of the sales charges.
C Calculated based on average shares outstanding during the period.
D Expense ratios reflect operating expenses of the class. Expenses before reductions do not reflect amounts reimbursed by the investment adviser or reductions from brokerage service arrangements or other expense offset arrangements and do not represent the amount paid by the class during periods when reimbursements or reductions occur. Expense ratios before reductions for start-up periods may not be representative of longer-term operating periods. Expenses net of fee waivers reflect expenses after reimbursement by the investment adviser but prior to reductions from brokerage service arrangements or other expense offset arrangements. Expenses net of all reductions represent the net expenses paid by the class.
E Amount represents less than $.01 per share.
F Amount does not include the portfolio activity of any underlying Fidelity Central Funds.
G Fees and expenses of the underlying Fidelity Central Funds are not included in the Fund's expense ratio. The Fund indirectly bears its proportionate share of the expenses of any underlying Fidelity Central Funds.
See accompanying notes which are an integral part of the financial statements.
Annual Report
Financial Highlights - Class B
| For the period
November 1, 2007
(commencement of operations) to
October 31, 2008 |
Selected Per-Share Data | |
Net asset value, beginning of period | $ 10.00 |
Income from Investment Operations | |
Net investment income (loss) C | - E |
Net realized and unrealized gain (loss) | (4.58) |
Total from investment operations | (4.58) |
Redemption fees added to paid in capital C, E | - |
Net asset value, end of period | $ 5.42 |
Total Return A, B | (45.80)% |
Ratios to Average Net Assets D, G | |
Expenses before reductions | 3.55% |
Expenses net of fee waivers, if any | 2.25% |
Expenses net of all reductions | 2.23% |
Net investment income (loss) | .05% |
Supplemental Data | |
Net assets, end of period (000 omitted) | $ 642 |
Portfolio turnover rate F | 115% |
A Total returns would have been lower had certain expenses not been reduced during the periods shown.
B Total returns do not include the effect of the contingent deferred sales charge.
C Calculated based on average shares outstanding during the period.
D Expense ratios reflect operating expenses of the class. Expenses before reductions do not reflect amounts reimbursed by the investment adviser or reductions from brokerage service arrangements or other expense offset arrangements and do not represent the amount paid by the class during periods when reimbursements or reductions occur. Expense ratios before reductions for start-up periods may not be representative of longer-term operating periods. Expenses net of fee waivers reflect expenses after reimbursement by the investment adviser but prior to reductions from brokerage service arrangements or other expense offset arrangements. Expenses net of all reductions represent the net expenses paid by the class.
E Amount represents less than $.01 per share.
F Amount does not include the portfolio activity of any underlying Fidelity Central Funds.
G Fees and expenses of the underlying Fidelity Central Funds are not included in the Fund's expense ratio. The Fund indirectly bears its proportionate share of the expenses of any underlying Fidelity Central Funds.
See accompanying notes which are an integral part of the financial statements.
Annual Report
Financial Highlights - Class C
| For the period
November 1, 2007
(commencement of operations) to
October 31, 2008 |
Selected Per-Share Data | |
Net asset value, beginning of period | $ 10.00 |
Income from Investment Operations | |
Net investment income (loss) C | - E |
Net realized and unrealized gain (loss) | (4.58) |
Total from investment operations | (4.58) |
Redemption fees added to paid in capital C, E | - |
Net asset value, end of period | $ 5.42 |
Total Return A, B | (45.80)% |
Ratios to Average Net Assets D, G | |
Expenses before reductions | 3.52% |
Expenses net of fee waivers, if any | 2.25% |
Expenses net of all reductions | 2.23% |
Net investment income (loss) | .05% |
Supplemental Data | |
Net assets, end of period (000 omitted) | $ 684 |
Portfolio turnover rate F | 115% |
A Total returns would have been lower had certain expenses not been reduced during the periods shown.
B Total returns do not include the effect of the contingent deferred sales charge.
C Calculated based on average shares outstanding during the period.
D Expense ratios reflect operating expenses of the class. Expenses before reductions do not reflect amounts reimbursed by the investment adviser or reductions from brokerage service arrangements or other expense offset arrangements and do not represent the amount paid by the class during periods when reimbursements or reductions occur. Expense ratios before reductions for start-up periods may not be representative of longer-term operating periods. Expenses net of fee waivers reflect expenses after reimbursement by the investment adviser but prior to reductions from brokerage service arrangements or other expense offset arrangements. Expenses net of all reductions represent the net expenses paid by the class.
E Amount represents less than $.01 per share.
F Amount does not include the portfolio activity of any underlying Fidelity Central Funds.
G Fees and expenses of the underlying Fidelity Central Funds are not included in the Fund's expense ratio. The Fund indirectly bears its proportionate share of the expenses of any underlying Fidelity Central Funds.
See accompanying notes which are an integral part of the financial statements.
Annual Report
Financial Highlights - International Growth
| For the period
November 1, 2007
(commencement of operations) to
October 31, 2008 |
Selected Per-Share Data | |
Net asset value, beginning of period | $ 10.00 |
Income from Investment Operations | |
Net investment income (loss) B | .09 |
Net realized and unrealized gain (loss) | (4.60) |
Total from investment operations | (4.51) |
Distributions from net investment income | (.01) |
Redemption fees added to paid in capital B, D | - |
Net asset value, end of period | $ 5.48 |
Total Return A | (45.17)% |
Ratios to Average Net Assets C, F | |
Expenses before reductions | 2.35% |
Expenses net of fee waivers, if any | 1.25% |
Expenses net of all reductions | 1.23% |
Net investment income (loss) | 1.05% |
Supplemental Data | |
Net assets, end of period (000 omitted) | $ 11,884 |
Portfolio turnover rate E | 115% |
A Total returns would have been lower had certain expenses not been reduced during the periods shown.
B Calculated based on average shares outstanding during the period.
C Expense ratios reflect operating expenses of the class. Expenses before reductions do not reflect amounts reimbursed by the investment adviser or reductions from brokerage service arrangements or other expense offset arrangements and do not represent the amount paid by the class during periods when reimbursements or reductions occur. Expense ratios before reductions for start-up periods may not be representative of longer-term operating periods. Expenses net of fee waivers reflect expenses after reimbursement by the investment adviser but prior to reductions from brokerage service arrangements or other expense offset arrangements. Expenses net of all reductions represent the net expenses paid by the class.
D Amount represents less than $.01 per share.
E Amount does not include the portfolio activity of any underlying Fidelity Central Funds.
F Fees and expenses of the underlying Fidelity Central Funds are not included in the Fund's expense ratio. The Fund indirectly bears its proportionate share of the expenses of any underlying Fidelity Central Funds.
See accompanying notes which are an integral part of the financial statements.
Annual Report
Financial Highlights - Institutional Class
| For the period
November 1, 2007
(commencement of operations) to
October 31, 2008 |
Selected Per-Share Data | |
Net asset value, beginning of period | $ 10.00 |
Income from Investment Operations | |
Net investment income (loss) B | .09 |
Net realized and unrealized gain (loss) | (4.60) |
Total from investment operations | (4.51) |
Distributions from net investment income | (.01) |
Redemption fees added to paid in capital B, D | - |
Net asset value, end of period | $ 5.48 |
Total Return A | (45.17)% |
Ratios to Average Net Assets C, F | |
Expenses before reductions | 2.56% |
Expenses net of fee waivers, if any | 1.25% |
Expenses net of all reductions | 1.23% |
Net investment income (loss) | 1.05% |
Supplemental Data | |
Net assets, end of period (000 omitted) | $ 521 |
Portfolio turnover rate E | 115% |
A Total returns would have been lower had certain expenses not been reduced during the periods shown.
B Calculated based on average shares outstanding during the period.
C Expense ratios reflect operating expenses of the class. Expenses before reductions do not reflect amounts reimbursed by the investment adviser or reductions from brokerage service arrangements or other expense offset arrangements and do not represent the amount paid by the class during periods when reimbursements or reductions occur. Expense ratios before reductions for start-up periods may not be representative of longer-term operating periods. Expenses net of fee waivers reflect expenses after reimbursement by the investment adviser but prior to reductions from brokerage service arrangements or other expense offset arrangements. Expenses net of all reductions represent the net expenses paid by the class.
D Amount represents less than $.01 per share.
E Amount does not include the portfolio activity of any underlying Fidelity Central Funds.
F Fees and expenses of the underlying Fidelity Central Funds are not included in the Fund's expense ratio. The Fund indirectly bears its proportionate share of the expenses of any underlying Fidelity Central Funds.
See accompanying notes which are an integral part of the financial statements.
Annual Report
Fidelity International Growth Fund
Notes to Financial Statements
For the period ended October 31, 2008
1. Organization.
Fidelity International Growth Fund (the Fund) is a fund of Fidelity Investment Trust (the trust) and is authorized to issue an unlimited number of shares. The trust is registered under the Investment Company Act of 1940, as amended (the 1940 Act), as an open-end management investment company organized as a Massachusetts business trust. The Fund offers Class A, Class T, Class B, Class C, International Growth and Institutional Class shares, each of which has equal rights as to assets and voting privileges. Each class has exclusive voting rights with respect to matters that affect that class. Class B shares will automatically convert to Class A shares after a holding period of seven years from the initial date of purchase. Investment income, realized and unrealized capital gains and losses, the common expenses of the Fund, and certain fund-level expense reductions, if any, are allocated on a pro rata basis to each class based on the relative net assets of each class to the total net assets of the Fund. Each class differs with respect to transfer agent and distribution and service plan fees incurred. Certain expense reductions also differ by class. The Fund's investments in emerging markets can be subject to social, economic, regulatory, and political uncertainties and can be extremely volatile.
2. Investments in Fidelity Central Funds.
The Fund may invest in Fidelity Central Funds, which are open-end investment companies available only to other investment companies and accounts managed by Fidelity Management & Research Company (FMR) and its affiliates. The Fund's Schedule of Investments lists each of the Fidelity Central Funds held as of period end, if any, as an investment of the Fund, but does not include the underlying holdings of each Fidelity Central Fund. As an Investing Fund, the Fund indirectly bears its proportionate share of the expenses of the underlying Fidelity Central Funds.
The Money Market Central Funds seek preservation of capital and current income and are managed by Fidelity Investments Money Management, Inc. (FIMM), an affiliate of FMR.
A complete unaudited list of holdings for each Fidelity Central Fund is available upon request or at the SEC's web site at www.sec.gov. In addition, the financial statements of the Fidelity Central Funds, which are not covered by the Fund's Report of Independent Registered Public Accounting Firm, are available on the SEC's web site or upon request.
3. Significant Accounting Policies.
The financial statements have been prepared in conformity with accounting principles generally accepted in the United States of America, which require management to make certain estimates and assumptions at the date of the financial statements. Actual results could differ from those estimates. The following summarizes the significant accounting policies of the Fund:
Annual Report
3. Significant Accounting Policies - continued
Security Valuation. Investments are valued as of 4:00 p.m. Eastern time on the last calendar day of the period. Wherever possible, the Fund uses independent pricing services approved by the Board of Trustees to value its investments.
Equity securities, including restricted securities, for which market quotations are readily available, are valued at the last reported sale price or official closing price as reported by an independent pricing service on the primary market or exchange on which they are traded. In the event there were no sales during the day or closing prices are not available, securities are valued at the last quoted bid price. Investments in open-end mutual funds, including Fidelity Central Funds, are valued at their closing net asset value each business day. Short-term securities with remaining maturities of sixty days or less for which quotations are not readily available are valued at amortized cost, which approximates value.
When current market prices or quotations are not readily available or reliable, valuations may be determined in good faith in accordance with procedures adopted by the Board of Trustees. Factors used in determining value may include significant market or security specific events, changes in interest rates and credit quality, and developments in foreign markets which are monitored by evaluating the performance of ADRs, futures contracts and exchange-traded funds. The frequency with which these procedures are used cannot be predicted and may be utilized to a significant extent. The value of securities used for net asset value (NAV) calculation under these procedures may differ from published prices for the same securities.
Foreign Currency. The Fund uses foreign currency contracts to facilitate transactions in foreign-denominated securities. Losses from these transactions may arise from changes in the value of the foreign currency or if the counterparties do not perform under the contracts' terms.
Foreign-denominated assets, including investment securities, and liabilities are translated into U.S. dollars at the exchange rate at period end. Purchases and sales of investment securities, income and dividends received and expenses denominated in foreign currencies are translated into U.S. dollars at the exchange rate in effect on the transaction date.
The effects of exchange rate fluctuations on investments are included with the net realized and unrealized gain (loss) on investment securities. Other foreign currency transactions resulting in realized and unrealized gain (loss) are disclosed separately.
Annual Report
Fidelity International Growth Fund
Notes to Financial Statements - continued
3. Significant Accounting Policies - continued
Investment Transactions and Income. For financial reporting purposes, the Fund's investment holdings and NAV include trades executed through the end of the last business day of the period. The NAV per share for processing shareholder transactions is calculated as of the close of business of the New York Stock Exchange (NYSE), normally 4:00 p.m. Eastern time and includes trades executed through the end of the prior business day. Gains and losses on securities sold are determined on the basis of identified cost. Dividend income is recorded on the ex-dividend date, except for certain dividends from foreign securities where the ex-dividend date may have passed, which are recorded as soon as the Fund is informed of the ex-dividend date. Non-cash dividends included in dividend income, if any, are recorded at the fair market value of the securities received. Interest income and distributions from the Fidelity Central Funds are accrued as earned. Interest income includes coupon interest and amortization of premium and accretion of discount on debt securities. Investment income is recorded net of foreign taxes withheld where recovery of such taxes is uncertain.
Expenses. Most expenses of the trust can be directly attributed to a fund. Expenses which cannot be directly attributed are apportioned among each Fund in the trust. Expense estimates are accrued in the period to which they relate and adjustments are made when actual amounts are known.
Income Tax Information and Distributions to Shareholders. Each year, the Fund intends to qualify as a regulated investment company by distributing substantially all of its taxable income and realized gains under Subchapter M of the Internal Revenue Code and filing its U.S. federal tax return. As a result, no provision for income taxes is required. The Fund is subject to the provisions of FASB Interpretation No. 48, Accounting for Uncertainties in Income Taxes (FIN 48). FIN 48 sets forth a minimum threshold for financial statement recognition of the benefit of a tax position taken or expected to be taken in a tax return. There are no unrecognized tax benefits in the accompanying financial statements in connection with the tax positions expected to be taken in the initial filing of the Fund's federal tax return. Foreign taxes are provided for based on the Fund's understanding of the tax rules and rates that exist in the foreign markets in which it invests.
Distributions are recorded on the ex-dividend date. Income dividends and capital gain distributions are declared separately for each class. Income and capital gain distributions are determined in accordance with income tax regulations, which may differ from generally accepted accounting principles.
Capital accounts within the financial statements are adjusted for permanent book-tax differences. These adjustments have no impact on net assets or the results of operations. Temporary book-tax differences will reverse in a subsequent period.
Annual Report
3. Significant Accounting Policies - continued
Income Tax Information and Distributions to Shareholders - continued
Book-tax differences are primarily due to foreign currency transactions, passive foreign investment companies (PFIC), capital loss carryforwards and losses deferred due to wash sales.
The tax-basis components of distributable earnings and the federal tax cost as of period end were as follows:
Unrealized appreciation | $ 109,388 |
Unrealized depreciation | (6,715,400) |
Net unrealized appreciation (depreciation) | (6,606,012) |
Undistributed ordinary income | 181,332 |
Capital loss carryforward | (4,969,583) |
| |
Cost for federal income tax purposes | $ 21,745,797 |
The tax character of distributions paid was as follows:
| October 31, 2008 |
Ordinary Income | $ 7,494 |
Short-Term Trading (Redemption) Fees. Shares held in the Fund less than 30 days are subject to a redemption fee equal to 1.00% of the proceeds of the redeemed shares. All redemption fees, including any estimated redemption fees paid by FMR, are retained by the Fund and accounted for as an addition to paid in capital.
New Accounting Pronouncement. In September 2006, Statement of Financial Accounting Standards No. 157, Fair Value Measurements (SFAS 157), was issued and is effective for fiscal years beginning after November 15, 2007. SFAS 157 defines fair value, establishes a framework for measuring fair value and results in expanded disclosures about fair value measurements. The Fund will adopt the provisions of SFAS 157 effective for its fiscal year beginning November 1, 2008.
4. Operating Policies.
Repurchase Agreements. FMR has received an Exemptive Order from the Securities and Exchange Commission (the SEC) which permits the Fund and other affiliated entities of FMR to transfer uninvested cash balances into joint trading accounts which are then invested in repurchase agreements. The Fund may also invest directly with institutions in repurchase agreements. Repurchase agreements are collateralized by government or non-government securities. Upon settlement date, collateral is held in segregated accounts with custodian banks and may be obtained in the event of a default
Annual Report
Fidelity International Growth Fund
Notes to Financial Statements - continued
4. Operating Policies - continued
Repurchase Agreements - continued
of the counterparty. The Fund monitors, on a daily basis, the value of the collateral to ensure it is at least equal to the principal amount of the repurchase agreement (including accrued interest). In the event of a default by the counterparty, realization of the collateral proceeds could be delayed, during which time the value of the collateral may decline.
5. Purchases and Sales of Investments.
Purchases and sales of securities short-term securities, aggregated $49,769,507 and $23,267,930, respectively.
6. Fees and Other Transactions with Affiliates.
Management Fee. FMR and its affiliates provide the Fund with investment management related services for which the Fund pays a monthly management fee. The management fee is the sum of an individual fund fee rate that is based on an annual rate of .45% of the Fund's average net assets and a group fee rate that averaged .26% during the period. The group fee rate is based upon the average net assets of all the mutual funds advised by FMR. The group fee rate decreases as assets under management increase and increases as assets under management decrease. In addition, the management fee is subject to a performance adjustment (up to a maximum of ± .20% of the Fund's average net assets over the performance period). The upward or downward adjustment to the management fee is based on the investment performance of the International Growth Class as compared to an appropriate benchmark index. The Fund's performance period began on December 1, 2007 and subsequent months will be added until the performance period includes 36 months. The Fund's performance adjustment will take effect in November 2008. For the period, the total annual management fee rate was .71% of the Fund's average net assets.
Distribution and Service Plan. In accordance with Rule 12b-1 of the 1940 Act, the Fund has adopted separate Distribution and Service Plans for each class of shares. Certain classes pay Fidelity Distributors Corporation (FDC), an affiliate of FMR, separate Distribution and Service Fees, each of which is based on an annual percentage of each class' average net assets. In addition, FDC may pay financial intermediaries for selling shares of the Fund and providing shareholder support services. For the period,
Annual Report
6. Fees and Other Transactions with Affiliates - continued
Distribution and Service Plan - continued
the Distribution and Service Fee rates and the total amounts paid to and retained by FDC were as follows:
| Distribution
Fee | Service
Fee | Paid to
FDC | Retained
by FDC |
Class A | -% | .25% | $ 2,271 | $ 1,733 |
Class T | .25% | .25% | 4,078 | 3,384 |
Class B | .75% | .25% | 8,803 | 8,289 |
Class C | .75% | .25% | 9,071 | 7,311 |
| | | $ 24,223 | $ 20,717 |
Sales Load. FDC receives a front-end sales charge of up to 5.75% for selling Class A shares, and 3.50% for selling Class T shares, some of which is paid to financial intermediaries for selling shares of the Fund. FDC receives the proceeds of contingent deferred sales charges levied on Class A, Class T, Class B, and Class C redemptions. These charges depend on the holding period. The deferred sales charges range from 5% to 1% for Class B, 1% for Class C, 1.00% to .50% for certain purchases of Class A shares and .25% for certain purchases of Class T shares.
For the period, sales charge amounts retained by FDC were as follows:
| Retained
by FDC |
Class A | $ 1,807 |
Class T | 290 |
Class B* | 923 |
| $ 3,020 |
* When Class B shares are initially sold, FDC pays commissions from its own resources to financial intermediaries through which the sales are made.
Transfer Agent Fees. Fidelity Investments Institutional Operations Company, Inc. (FIIOC), an affiliate of FMR, is the transfer, dividend disbursing and shareholder servicing agent for each class of the Fund. FIIOC receives account fees and asset-based fees that vary according to the account size and type of account of the shareholders of the respective classes of the Fund. FIIOC pays for typesetting, printing and mailing of
Annual Report
Fidelity International Growth Fund
Notes to Financial Statements - continued
6. Fees and Other Transactions with Affiliates - continued
Transfer Agent Fees - continued
shareholder reports, except proxy statements. For the period, the total transfer agent fees paid by each class were as follows:
| Amount | % of
Average
Net Assets |
Class A | $ 2,412 | .27 |
Class T | 1,573 | .19 |
Class B | 2,235 | .25 |
Class C | 2,280 | .25 |
International Growth | 52,882 | .31 |
Institutional Class | 1,214 | .16 |
| $ 62,596 | |
Accounting and Security Lending Fees. Fidelity Service Company, Inc. (FSC), an affiliate of FMR, maintains the Fund's accounting records. The accounting fee is based on the level of average net assets for the month. Under a separate contract, FSC administers the security lending program. The security lending fee is based on the number and duration of lending transactions.
Brokerage Commissions. The Fund placed a portion of its portfolio transactions with brokerage firms which are affiliates of the investment adviser. The commissions paid to these affiliated firms were $742 for the period.
7. Committed Line of Credit.
The Fund participates with other funds managed by FMR in a $4.2 billion credit facility (the "line of credit") to be utilized for temporary or emergency purposes to fund shareholder redemptions or for other short-term liquidity purposes. The Fund has agreed to pay commitment fees on its pro rata portion of the line of credit, which amounted to $31 and is reflected in Miscellaneous Expense on the Statement of Operations. During the period, there were no borrowings on this line of credit.
8. Security Lending.
The Fund lends portfolio securities from time to time in order to earn additional income. On the settlement date of the loan, the Fund receives collateral (in the form of U.S. Treasury obligations, letters of credit and/or cash) against the loaned securities and maintains collateral in an amount not less than 100% of the market value of the loaned securities during the period of the loan. The market value of the loaned securities is
Annual Report
8. Security Lending - continued
determined at the close of business of the Fund and any additional required collateral is delivered to the Fund on the next business day. If the borrower defaults on its obligation to return the securities loaned because of insolvency or other reasons, a fund could experience delays and costs in recovering the securities loaned or in gaining access to the collateral. Any cash collateral received is invested in the Fidelity Securities Lending Cash Central Fund. Security lending income represents the income earned on investing cash collateral, less fees and expenses associated with the loan, plus any premium payments that may be received on the loan of certain types of securities. Security lending income is presented in the Statement of Operations as a component of income from Fidelity Central Funds. Net income from lending portfolio securities during the period amounted to $796.
9. Expense Reductions.
FMR voluntarily agreed to reimburse each class to the extent annual operating expenses exceeded certain levels of average net assets as noted in the table below. Some expenses, for example interest expense, including commitment fees, are excluded from this reimbursement.
The following classes were in reimbursement during the period:
| Expense
Limitations | Reimbursement
from adviser |
Class A | 1.50% | $ 12,501 |
Class T | 1.75% | 10,738 |
Class B | 2.25% | 11,439 |
Class C | 2.25% | 11,520 |
International Growth | 1.25% | 188,565 |
Institutional Class | 1.25% | 10,170 |
| | $ 244,933 |
Many of the brokers with whom FMR places trades on behalf of the Fund provided services to the Fund in addition to trade execution. These services included payments of certain expenses on behalf of the Fund totaling $4,149 for the period. In addition, through arrangements with the Fund's custodian, credits realized as a result of uninvested cash balances were used to reduce the Fund's expenses. During the period, these credits reduced the Fund's custody expenses by $126.
Annual Report
Fidelity International Growth Fund
Notes to Financial Statements - continued
10. Other.
The Fund's organizational documents provide former and current trustees and officers with a limited indemnification against liabilities arising in connection with the performance of their duties to the Fund. In the normal course of business, the Fund may also enter into contracts that provide general indemnifications. The Fund's maximum exposure under these arrangements is unknown as this would be dependent on future claims that may be made against the Fund. The risk of material loss from such claims is considered remote.
FMR or its affiliates were the owners of record of 24% of the total outstanding shares of the Fund.
During the period, Lehman Brothers Holdings, Inc. and certain of its affiliates (LBHI) sought protection under the insolvency laws of their jurisdictions of organization, including the United States, the United Kingdom and Japan. At the time LBHI's insolvency proceedings were instituted, the Fund had outstanding securities trades with counterparties affiliated with LBHI. As a result of the insolvency proceedings, LBHI is unable to fulfill its commitments and, in certain cases, the Fund may have terminated its trades and related agreements with the relevant entities and, where appropriate, is in the process of initiating claims for damages. FMR believes that the financial impact to the Fund relating to the terminated trades and agreements is immaterial.
11. Distributions to Shareholders.
Distributions to shareholders of each class were as follows:
| For the period
November 1, 2007
(commencement of operations) to
October 31, 2008 |
From net investment income | |
International Growth | $ 7,036 |
Institutional Class | 458 |
Total | $ 7,494 |
Annual Report
12. Share Transactions.
Transactions for each class of shares were as follows:
| Shares | Dollars |
| For the period
November 1, 2007
(commencement of operations) to
October 31, 2008 | For the period
November 1, 2007
(commencement of operations) to
October 31, 2008 |
Class A | | |
Shares sold | 163,688 | $ 1,473,900 |
Shares redeemed | (13,701) | (105,944) |
Net increase (decrease) | 149,987 | $ 1,367,956 |
Class T | | |
Shares sold | 120,600 | $ 1,160,207 |
Shares redeemed | (27,551) | (234,209) |
Net increase (decrease) | 93,049 | $ 925,998 |
Class B | | |
Shares sold | 130,340 | $ 1,229,254 |
Shares redeemed | (11,927) | (88,741) |
Net increase (decrease) | 118,413 | $ 1,140,513 |
Class C | | |
Shares sold | 147,998 | $ 1,363,686 |
Shares redeemed | (21,887) | (174,264) |
Net increase (decrease) | 126,111 | $ 1,189,422 |
International Growth | | |
Shares sold | 3,641,791 | $ 32,862,391 |
Reinvestment of distributions | 663 | 6,366 |
Shares redeemed | (1,472,054) | (11,980,798) |
Net increase (decrease) | 2,170,400 | $ 20,887,959 |
Institutional Class | | |
Shares sold | 95,161 | $ 936,263 |
Reinvestment of distributions | 48 | 458 |
Net increase (decrease) | 95,209 | $ 936,721 |
Annual Report
To the Trustees of Fidelity Investment Trust and the Shareholders of Fidelity International Growth Fund:
In our opinion, the accompanying statement of assets and liabilities, including the schedule of investments, and the related statements of operations and of changes in net assets and the financial highlights present fairly, in all material respects, the financial position of Fidelity International Growth Fund (a fund of Fidelity Investment Trust) at October 31, 2008, the results of its operations for the period indicated, the changes in its net assets for the period indicated and the financial highlights for the period indicated, in conformity with accounting principles generally accepted in the United States of America. These financial statements and financial highlights (hereafter referred to as "financial statements") are the responsibility of the Fidelity International Growth Fund's management. Our responsibility is to express an opinion on these financial statements based on our audit. We conducted our audit of these financial statements in accordance with the standards of the Public Company Accounting Oversight Board (United States). Those standards require that we plan and perform the audit to obtain reasonable assurance about whether the financial statements are free of material misstatement. An audit includes examining, on a test basis, evidence supporting the amounts and disclosures in the financial statements, assessing the accounting principles used and significant estimates made by management, and evaluating the overall financial statement presentation. We believe that our audit, which included confirmation of securities at October 31, 2008 by correspondence with the custodian and brokers, provides a reasonable basis for our opinion.
/s/ PricewaterhouseCoopers LLP
PricewaterhouseCoopers LLP
Boston, Massachusetts
December 23, 2008
Annual Report
The Trustees, Member of the Advisory Board, and executive officers of the trust and fund, as applicable, are listed below. The Board of Trustees governs the fund and is responsible for protecting the interests of shareholders. The Trustees are experienced executives who meet periodically throughout the year to oversee the fund's activities, review contractual arrangements with companies that provide services to the fund, and review the fund's performance. Except for Edward C. Johnson 3d and James C. Curvey, each of the Trustees oversees 220 funds advised by FMR or an affiliate. Messrs. Johnson and Curvey oversee 379 funds advised by FMR or an affiliate.
The Trustees hold office without limit in time except that (a) any Trustee may resign; (b) any Trustee may be removed by written instrument, signed by at least two-thirds of the number of Trustees prior to such removal; (c) any Trustee who requests to be retired or who has become incapacitated by illness or injury may be retired by written instrument signed by a majority of the other Trustees; and (d) any Trustee may be removed at any special meeting of shareholders by a two-thirds vote of the outstanding voting securities of the trust. Each Trustee who is not an interested person (as defined in the 1940 Act) (Independent Trustee), shall retire not later than the last day of the calendar year in which his or her 72nd birthday occurs. The Independent Trustees may waive this mandatory retirement age policy with respect to individual Trustees. The executive officers and Advisory Board Member hold office without limit in time, except that any officer and Advisory Board Member may resign or may be removed by a vote of a majority of the Trustees at any regular meeting or any special meeting of the Trustees. Except as indicated, each individual has held the office shown or other offices in the same company for the past five years.
The fund's Statement of Additional Information (SAI) includes more information about the Trustees. To request a free copy, call Fidelity at 1-877-208-0098.
Interested Trustees*:
Correspondence intended for each Trustee who is an interested person may be sent to Fidelity Investments, 82 Devonshire Street, Boston, Massachusetts 02109.
Name, Age; Principal Occupation |
Edward C. Johnson 3d (78) |
| Year of Election or Appointment: 1984 Mr. Johnson is Chairman of the Board of Trustees. Mr. Johnson serves as Chief Executive Officer, Chairman, and a Director of FMR LLC; Chairman and a Director of FMR; Chairman and a Director of Fidelity Research & Analysis Company (FRAC); Chairman and a Director of Fidelity Investments Money Management, Inc.; and Chairman and a Director of FMR Co., Inc. In addition, Mr. Johnson serves as Chairman and Director of FIL Limited. Previously, Mr. Johnson served as President of FMR LLC (2006-2007). |
James C. Curvey (73) |
| Year of Election or Appointment: 2007 Mr. Curvey also serves as Trustee (2007-present) of other investment companies advised by FMR. Mr. Curvey is a Director of FMR and FMR Co., Inc. (2007-present). Mr. Curvey is also Vice Chairman (2006-
present) and Director of FMR LLC. In addition, Mr. Curvey serves as an Overseer for the Boston Symphony Orchestra and a member of the Trustees of Villanova University. |
* Trustees have been determined to be "Interested Trustees" by virtue of, among other things, their affiliation with the trust or various entities under common control with FMR. FMR Corp. merged with and into FMR LLC on October 1, 2007. Any references to FMR LLC for prior periods are deemed to be references to the prior entity.
Independent Trustees:
Correspondence intended for each Independent Trustee (that is, the Trustees other than the Interested Trustees) may be sent to Fidelity Investments, P.O. Box 55235, Boston, Massachusetts 02205-5235.
Name, Age; Principal Occupation |
Dennis J. Dirks (60) |
| Year of Election or Appointment: 2005 Prior to his retirement in May 2003, Mr. Dirks was Chief Operating Officer and a member of the Board of The Depository Trust & Clearing Corporation (DTCC) (1999-2003). He also served as President, Chief Operating Officer, and Board member of The Depository Trust Company (DTC) (1999-2003) and President and Board member of the National Securities Clearing Corporation (NSCC) (1999-2003). In addition, Mr. Dirks served as a Trustee and a member of the Finance Committee of Manhattan College (2005-2008), and as Chief Executive Officer and Board member of the Government Securities Clearing Corporation (2001-2003) and Chief Executive Officer and Board member of the Mortgage-Backed Securities Clearing Corporation (2001-2003). Mr. Dirks also serves as a Trustee and a member of the Finance Committee of AHRC of Nassau County (2006-present). |
Alan J. Lacy (55) |
| Year of Election or Appointment: 2008 Mr. Lacy serves as Senior Adviser (2007-present) of Oak Hill Capital Partners, L.P. (a private equity firm). Mr. Lacy also served as Chief Executive Officer (2000-2005) and Vice Chairman (2005-2006) of Sears Holdings Corporation and Sears, Roebuck and Co. (retail). In addition, Mr. Lacy serves as a member of the Board of Directors of The Western Union Company (global money transfer, 2006-present) and Bristol-Myers Squibb (global pharmaceuticals, 2007-present). Mr. Lacy is a Trustee of the National Parks Conservation Association and The Field Museum of Natural History. |
Ned C. Lautenbach (64) |
| Year of Election or Appointment: 2000 Mr. Lautenbach is Chairman of the Independent Trustees (2006-present). Mr. Lautenbach is an Advisory Partner of Clayton, Dubilier & Rice, Inc. (private equity investment firm). Previously, Mr. Lautenbach was with the International Business Machines Corporation (IBM) from 1968 until his retirement in 1998. Mr. Lautenbach serves as a Director of Eaton Corporation (diversified industrial) as well as the Philharmonic Center for the Arts in Naples, Florida. He also is a member of the Board of Trustees of Fairfield University (2005-present), as well as a member of the Council on Foreign Relations. Previously, Mr. Lautenbach served as a Director of Sony Corporation (2006-2007). |
Joseph Mauriello (64) |
| Year of Election or Appointment: 2008 Prior to his retirement in January 2006, Mr. Mauriello served in numerous senior management positions including Deputy Chairman and Chief Operating Officer (2004-2005), and Vice Chairman of Financial Services (2002-2004) of KPMG LLP US (professional services firm, 1965-
2005). Mr. Mauriello currently serves as a member of the Board of Directors of XL Capital Ltd. (global insurance and re-insurance company, 2006-present) and of Arcadia Resources Inc. (health care services and products, 2007-present). He also served as a Director of the Hamilton Funds of the Bank of New York (2006-2007). |
Cornelia M. Small (64) |
| Year of Election or Appointment: 2005 Ms. Small is a member of the Investment Committee, and Chair (2008-present) and a member of the Board of Trustees of Smith College. Ms. Small also serves on the Investment Committee of the Berkshire Taconic Community Foundation (2008-present). Previously, Ms. Small served as Chairperson of the Investment Committee (2002-2008) of Smith College and as Co-Chair (2000-2003) of the Annual Fund for the Fletcher School of Law and Diplomacy. In addition, she served as Chief Investment Officer, Director of Global Equity Investments, and a member of the Board of Directors of Scudder, Stevens & Clark and Scudder Kemper Investments. |
William S. Stavropoulos (69) |
| Year of Election or Appointment: 2001 Mr. Stavropoulos is Chairman Emeritus of the Board of Directors of The Dow Chemical Company, where he previously served in numerous senior management positions, including President (1993-2000; 2002-
2003), CEO (1995-2000; 2002-2004), Chairman of the Executive Committee (2000-2006), and as a member of the Board of Directors (1990-2006). Currently, he is a Director of Teradata Corporation (data warehousing and technology solutions, 2008-present), Chemical Financial Corporation, Maersk Inc. (industrial conglomerate), Tyco International, Inc. (multinational manufacturing and services, 2007-present), and a member of the Advisory Board for Metalmark Capital (private equity investment firm, 2005-present). He is a special advisor to Clayton, Dubilier & Rice, Inc. (private equity investment). In addition, Mr. Stavropoulos is a member of the University of Notre Dame Advisory Council for the College of Science. |
David M. Thomas (59) |
| Year of Election or Appointment: 2008 Previously, Mr. Thomas served as Executive Chairman (2005-2006) and Chairman and Chief Executive Officer (2000-2005) of IMS Health, Inc. (pharmaceutical and healthcare information solutions). In addition, Mr. Thomas serves as a member of the Board of Directors of Fortune Brands, Inc. (consumer products holding company), and Interpublic Group of Companies, Inc. (marketing communication, 2004-present). |
Michael E. Wiley (58) |
| Year of Election or Appointment: 2008 Mr. Wiley also serves as a member of the Board of Trustees of the University of Tulsa (2000-2006; 2007-present). He serves as a Director of Tesoro Corporation (independent oil refiner and marketer, 2005-
present), and a Director of Bill Barrett Corporation (exploration and production company, 2005-present). In addition, he also serves as a Director of Post Oak Bank (privately-held bank, 2004-present). Previously, Mr. Wiley served as a Sr. Energy Advisor of Katzenbach Partners, LLC (consulting firm, 2006-2007), as an Advisory Director of Riverstone Holdings (private investment firm), Chairman, President, and CEO of Baker Hughes, Inc. (oilfield services company, 2000-2004), and as Director of Spinnaker Exploration Company (exploration and production company, 2001-2005). |
Advisory Board Member and Executive Officers**:
Correspondence intended for each executive officer and Mr. Lynch may be sent to Fidelity Investments, 82 Devonshire Street, Boston, Massachusetts 02109.
Name, Age; Principal Occupation |
Peter S. Lynch (64) |
| Year of Election or Appointment: 2003 Member of the Advisory Board of Fidelity's Equity and High Income Funds. Mr. Lynch is Vice Chairman and a Director of FMR, and Vice Chairman (2001-present) and a Director of FMR Co., Inc. Previously, Mr. Lynch served as a Trustee of the Fidelity funds (1990-2003). In addition, he serves as a Trustee of Boston College and as the Chairman of the Inner-City Scholarship Fund. Previously, Mr. Lynch served on the Special Olympics International Board of Directors (1997-2006). |
Kenneth B. Robins (39) |
| Year of Election or Appointment: 2008 President and Treasurer of Fidelity's Equity and High Income Funds. Mr. Robins is an employee of Fidelity Investments (2004-present). Before joining Fidelity Investments, Mr. Robins worked at KPMG LLP, where he was a partner in KPMG's department of professional practice (2002-2004). |
Walter C. Donovan (46) |
| Year of Election or Appointment: 2007 Vice President of Fidelity's Equity Funds. Mr. Donovan also serves as President of FMR and FMR Co., Inc., and Executive Vice President of Fidelity Investments Money Management, Inc. (2007-present). Previously, Mr. Donovan served as Executive Vice President of FMR and FMR Co., Inc. (2005-2007) and Senior Vice President of FMR (2003-2005) and FMR Co., Inc. (2004-2005). |
Eric M. Wetlaufer (46) |
| Year of Election or Appointment: 2006 Vice President of Fidelity's International Equity Funds. Mr. Wetlaufer also serves as Group Chief Investment Officer of FMR. Mr. Wetlaufer is Chairman, Chief Executive Officer, and President of Fidelity Management & Research (Hong Kong) Limited (2008-present); Chairman, Chief Executive Officer, President, and a Director of Fidelity Management & Research (Japan) Inc. (2008-present); Chairman and Chief Executive Officer (2007-present) and President and a Director (2006-present) of Fidelity Management & Research (U.K.) Inc. and President and a Director of Fidelity Research & Analysis Company (2006-present). Before joining Fidelity Investments in 2005, Mr. Wetlaufer was a partner in Oxhead Capital Management (2004-2005) and a Chief Investment Officer of Putnam Investments (1997-2003). |
Scott C. Goebel (40) |
| Year of Election or Appointment: 2008 Secretary and Chief Legal Officer (CLO) of the Fidelity funds. Mr. Goebel also serves as General Counsel, Secretary, and Senior Vice President of FMR (2008-present); Deputy General Counsel of FMR LLC; Chief Legal Secretary of Fidelity Management & Research (Hong Kong) Limited (2008-present) and Assistant Secretary of Fidelity Management & Research (Japan) Inc. (2008-present). Previously, Mr. Goebel served as Assistant Secretary of the Funds (2007-2008) and as Vice President and Secretary of Fidelity Distributors Corporation (FDC) (2005-2007). |
John B. McGinty, Jr. (46) |
| Year of Election or Appointment: 2008 Assistant Secretary of Fidelity's Equity and High Income Funds. Mr. McGinty is an employee of Fidelity Investments (2004-present). Mr. McGinty also serves as Senior Vice President, Secretary, and Chief Legal Officer of FDC (2007-present). Before joining Fidelity Investments, Mr. McGinty practiced law at Ropes & Gray, LLP. |
Holly C. Laurent (54) |
| Year of Election or Appointment: 2008 Anti-Money Laundering (AML) Officer of the Fidelity funds. Ms. Laurent is an employee of Fidelity Investments. Previously, Ms. Laurent was Senior Vice President and Head of Legal for Fidelity Business Services India Pvt. Ltd. (2006-2008), Senior Vice President, Deputy General Counsel and Group Head for FMR LLC (2005-2006). |
Christine Reynolds (50) |
| Year of Election or Appointment: 2008 Chief Financial Officer of the Fidelity funds. Ms. Reynolds became President of Fidelity Pricing and Cash Management Services (FPCMS) in August 2008. She served as Chief Operating Officer of FPCMS from 2007 through July 2008. Previously, Ms. Reynolds served as President, Treasurer, and Anti-Money Laundering officer of the Fidelity funds (2004-
2007). Before joining Fidelity Investments, Ms. Reynolds worked at PricewaterhouseCoopers LLP (PwC) (1980-2002), where she was an audit partner with PwC's investment management practice. |
Kenneth A. Rathgeber (61) |
| Year of Election or Appointment: 2004 Chief Compliance Officer of Fidelity's Equity and High Income Funds. Mr. Rathgeber is Chief Compliance Officer of Fidelity Management & Research (Hong Kong) Limited (2008-present), Fidelity Management & Research (Japan) Inc. (2008-present), FMR (2005-present), FMR Co., Inc. (2005-present), Fidelity Management & Research (U.K.) Inc. (2005-
present), Fidelity Research & Analysis Company (2005-present), Fidelity Investments Money Management, Inc. (2005-present), and Strategic Advisers, Inc. (2005-present). |
Bryan A. Mehrmann (47) |
| Year of Election or Appointment: 2005 Deputy Treasurer of the Fidelity funds. Mr. Mehrmann is an employee of Fidelity Investments. Previously, Mr. Mehrmann served as Vice President of Fidelity Investments Institutional Services Group (FIIS)/Fidelity Investments Institutional Operations Corporation, Inc. (FIIOC) Client Services (1998-2004). |
Adrien E. Deberghes (41) |
| Year of Election or Appointment: 2008 Deputy Treasurer of Fidelity's Equity and High Income Funds. Mr. Deberghes is an employee of Fidelity Investments (2008-present). Previously, Mr. Deberghes served as Senior Vice President of Mutual Fund Administration at State Street Corporation (2007-2008), Senior Director of Mutual Fund Administration at Investors Bank & Trust (2005-2007), and Director of Finance for Dunkin' Brands (2000-2005). |
Robert G. Byrnes (41) |
| Year of Election or Appointment: 2005 Assistant Treasurer of the Fidelity funds. Mr. Byrnes is an employee of Fidelity Investments (2005-present). Previously, Mr. Byrnes served as Vice President of Fidelity Pricing and Cash Management Services (FPCMS) (2003-2005). Before joining Fidelity Investments, Mr. Byrnes worked at Deutsche Asset Management where he served as Vice President of the Investment Operations Group (2000-2003). |
Peter L. Lydecker (54) |
| Year of Election or Appointment: 2004 Assistant Treasurer of the Fidelity funds. Mr. Lydecker is an employee of Fidelity Investments. |
Paul M. Murphy (61) |
| Year of Election or Appointment: 2007 Assistant Treasurer of the Fidelity funds. Mr. Murphy is an employee of Fidelity Investments (2007-present). Previously, Mr. Murphy served as Chief Financial Officer of the Fidelity Funds (2005-2006), Vice President and Associate General Counsel of FMR (2007), and Senior Vice President of Fidelity Pricing and Cash Management Services (FPCMS) (1994-2007). |
Gary W. Ryan (50) |
| Year of Election or Appointment: 2005 Assistant Treasurer of the Fidelity funds. Mr. Ryan is an employee of Fidelity Investments. Previously, Mr. Ryan served as Vice President of Fund Reporting in Fidelity Pricing and Cash Management Services (FPCMS) (1999-2005). |
** FMR Corp. merged with and into FMR LLC on October 1, 2007. Any references to FMR LLC for prior periods are deemed to be references to the prior entity.
Annual Report
A special meeting of the fund's shareholders was held on April 16, 2008. The results of votes taken among shareholders on the proposal before them are reported below. Each vote reported represents one dollar of net asset value held on the record date for the meeting.
PROPOSAL 1 |
To elect a Board of Trustees.A |
| # of
Votes | % of
Votes |
James C. Curvey |
Affirmative | 44,485,656,811.55 | 94.702 |
Withheld | 2,488,551,854.62 | 5.298 |
TOTAL | 46,974,208,666.17 | 100.000 |
Dennis J. Dirks |
Affirmative | 44,706,671,638.31 | 95.173 |
Withheld | 2,267,537,027.86 | 4.827 |
TOTAL | 46,974,208,666.17 | 100.000 |
Edward C. Johnson 3d |
Affirmative | 44,294,881,638.16 | 94.296 |
Withheld | 2,679,327,028.01 | 5.704 |
TOTAL | 46,974,208,666.17 | 100.000 |
Alan J. Lacy |
Affirmative | 44,685,373,413.16 | 95.127 |
Withheld | 2,288,835,253.01 | 4.873 |
TOTAL | 46,974,208,666.17 | 100.000 |
Ned C. Lautenbach |
Affirmative | 44,634,541,379.41 | 95.019 |
Withheld | 2,339,667,286.76 | 4.981 |
TOTAL | 46,974,208,666.17 | 100.000 |
Joseph Mauriello |
Affirmative | 44,683,962,099.80 | 95.124 |
Withheld | 2,290,246,566.37 | 4.876 |
TOTAL | 46,974,208,666.17 | 100.000 |
Cornelia M. Small |
Affirmative | 44,671,688,375.36 | 95.098 |
Withheld | 2,302,520,290.81 | 4.902 |
TOTAL | 46,974,208,666.17 | 100.000 |
| # of
Votes | % of
Votes |
William S. Stavropoulos |
Affirmative | 44,465,262,087.61 | 94.659 |
Withheld | 2,508,946,578.56 | 5.341 |
TOTAL | 46,974,208,666.17 | 100.000 |
David M. Thomas |
Affirmative | 44,694,340,813.87 | 95.147 |
Withheld | 2,279,867,852.30 | 4.853 |
TOTAL | 46,974,208,666.17 | 100.000 |
Michael E. Wiley |
Affirmative | 44,686,513,174.78 | 95.130 |
Withheld | 2,287,695,491.39 | 4.870 |
TOTAL | 46,974,208,666.17 | 100.000 |
A Denotes trust-wide proposal and voting results.
Annual Report
Board Approval of Investment Advisory Contracts and Management Fees
Fidelity International Growth Fund
Each year, typically in July, the Board of Trustees, including the Independent Trustees (together, the Board), votes on the renewal of the management contract and sub-advisory agreements (together, the Advisory Contracts) for the fund. The Board, assisted by the advice of fund counsel and Independent Trustees' counsel, requests and considers a broad range of information throughout the year.
The Board meets regularly and, acting directly and through its separate committees, requests and receives information concerning, and considers at each of its meetings factors that are relevant to, its annual consideration of the renewal of the fund's Advisory Contracts, including the services and support provided to the fund and its shareholders. At the time of the renewal, the Board had 12 standing committees, each composed of Independent Trustees with varying backgrounds, to which the Board has assigned specific subject matter responsibilities in order to enhance effective decision-making by the Board. Each committee has a written charter outlining the structure and purposes of the committee. The Board also meets as needed to consider matters specifically related to the Board's annual consideration of the renewal of Advisory Contracts.
At its July 2008 meeting, the Board of Trustees, including the Independent Trustees, unanimously determined to renew the fund's Advisory Contracts. In reaching its determination, the Board considered all factors it believed relevant, including (i) the nature, extent, and quality of the services to be provided to the fund and its shareholders (including the investment performance of the fund); (ii) the competitiveness of the fund's management fee and total expenses; (iii) the total costs of the services to be provided by and the profits to be realized by Fidelity from its relationship with the fund; (iv) the extent to which economies of scale would be realized as the fund grows; and (v) whether fee levels reflect these economies of scale, if any, for the benefit of fund shareholders. The Board also approved agreements with foreign sub-advisers Fidelity Management & Research (Japan) Inc. and Fidelity Management & Research (Hong Kong) Limited, as well as amendments to the fund's agreement with Fidelity Management & Research (U.K.) Inc.
In considering whether to renew the Advisory Contracts for the fund, the Board ultimately reached a determination, with the assistance of fund counsel and Independent Trustees' counsel and through the exercise of its business judgment, that the renewal of the Advisory Contracts and the compensation to be received by Fidelity under the management contract is consistent with Fidelity's fiduciary duty under applicable law. The Board's decision to renew the Advisory Contracts was not based on any single factor noted above, but rather was based on a comprehensive consideration of all the information provided to the Board at its meetings throughout the year. The Board, in reaching its determination to renew the Advisory Contracts, is aware that shareholders in the fund have a broad range of investment choices available to them, including a wide choice among mutual funds offered by competitors to Fidelity, and that the fund's shareholders, with the opportunity to review and weigh the disclosure provided by the fund in its prospectus and other public disclosures, have chosen to invest in this fund, managed by Fidelity.
Annual Report
Nature, Extent, and Quality of Services Provided. The Board considered staffing within the investment adviser, FMR, and the sub-advisers (together, the Investment Advisers), including the backgrounds of the fund's investment personnel and the fund's investment objective and discipline. The Independent Trustees also had discussions with senior management of Fidelity's investment operations and investment groups. The Board considered the structure of the portfolio manager compensation program and whether this structure provides appropriate incentives.
Resources Dedicated to Investment Management and Support Services. The Board reviewed the size, education, and experience of the Investment Advisers' investment staff, their use of technology, and the Investment Advisers' approach to recruiting, training, and retaining portfolio managers and other research, advisory, and management personnel. The Board noted that Fidelity's analysts have access to a variety of technological tools that enable them to perform both fundamental and quantitative analysis and to specialize in various disciplines. The Board considered Fidelity's extensive global research capabilities that enable the Investment Advisers to aggregate data from various sources in an effort to produce positive investment results. The Board also considered that Fidelity's portfolio managers and analysts have access to daily portfolio attribution that allows for monitoring of a fund's portfolio, as well as an electronic communication system that provides immediate real-time access to research concerning issuers and credit enhancers.
Shareholder and Administrative Services. The Board considered (i) the nature, extent, quality, and cost of advisory, administrative, distribution, and shareholder services performed by the Investment Advisers and their affiliates under the Advisory Contracts and under separate agreements covering transfer agency, pricing and bookkeeping, and securities lending services for the fund; (ii) the nature and extent of the Investment Advisers' supervision of third party service providers, principally custodians and subcustodians; and (iii) the resources devoted to, and the record of compliance with, the fund's compliance policies and procedures. The Board also reviewed the allocation of fund brokerage, including allocations to brokers affiliated with the Investment Advisers, the use of brokerage commissions to pay fund expenses, and the use of "soft" commission dollars to pay for research services. The Board further considered that Fidelity voluntarily pays for market data out of its own resources.
The Board noted that the growth of fund assets across the complex allows Fidelity to reinvest in the development of services designed to enhance the value or convenience of the Fidelity funds as investment vehicles. These services include 24-hour access to account information and market information through phone representatives and over the Internet, and investor education materials and asset allocation tools.
Annual Report
Board Approval of Investment Advisory Contracts and
Management Fees - continued
Investment in a Large Fund Family. The Board considered the benefits to shareholders of investing in a Fidelity fund, including the benefits of investing in a fund that is part of a large family of funds offering a variety of investment disciplines and providing for a large variety of mutual fund investor services. For example, fund shareholders are offered the privilege of exchanging shares of the fund for shares of other Fidelity funds, as set forth in the fund's prospectus, without paying a sales charge. The Board noted that Fidelity has taken a number of actions over the previous year that benefited particular funds, including (i) dedicating additional resources to investment research and to restructure the investment research teams; (ii) contractually agreeing to reduce the management fees on Fidelity's Institutional Money Market Funds and launching Class IV and Institutional Class of certain of these funds; (iii) reducing the transfer agent fees for the Fidelity Select Portfolios and Investor Class of the VIP funds; and (iv) launching Class K of 29 equity funds as a lower-fee class available to certain employer-sponsored retirement plans.
Investment Performance. The Board considered whether the fund has operated within its investment objective, as well as its record of compliance with its investment restrictions. The Board noted that it is not possible to evaluate performance in any comprehensive fashion because the fund had been in operation for less than one calendar year. Once the fund has been in operation for at least one calendar year, the Board will review the fund's absolute investment performance for each class, as well as the fund's relative investment performance for each class measured against a broad-based securities market index and a peer group of mutual funds.
The Board considered that FMR has taken steps to refocus and strengthen equity research, equity portfolio management, and compliance.
Based on its review, and giving particular weight to the nature and quality of the resources dedicated by the Investment Advisers to maintain and improve relative performance, the Board concluded that the nature, extent, and quality of the services provided to the fund will benefit the fund's shareholders, particularly in light of the Board's view that the fund's shareholders benefit from investing in a fund that is part of a large family of funds offering a variety of investment disciplines and services.
Competitiveness of Management Fee and Total Fund Expenses. The Board considered the fund's management fee and total expenses compared to "mapped groups" of competitive funds and classes. Fidelity creates "mapped groups" by combining similar Lipper investment objective categories that have comparable management fee characteristics. Combining Lipper investment objective categories aids the Board's management fee and total expense comparisons by broadening the competitive group used for comparison and by reducing the number of universes to which various Fidelity funds are compared. The Board also considered supplemental information about how the fund's management fee and total expenses ranked relative to groups based on Lipper classifications, which take into account a fund's market capitalization and style.
Annual Report
The Board considered two proprietary management fee comparisons for the period of the fund's operations shown in the chart below. The group of Lipper funds used by the Board for management fee comparisons is referred to below as the "Total Mapped Group." The Total Mapped Group comparison focuses on a fund's standing relative to the total universe of comparable funds available to investors, in terms of gross management fees before expense reimbursements or caps. "TMG %" represents the percentage of funds in the Total Mapped Group that had management fees that were lower than the fund's. For example, a TMG % of 14% means that 86% of the funds in the Total Mapped Group had higher management fees than the fund. The "Asset-Size Peer Group" (ASPG) comparison focuses on a fund's standing relative to non-Fidelity funds similar in size to the fund within the Total Mapped Group. The ASPG represents at least 15% of the funds in the Total Mapped Group with comparable asset size and management fee characteristics, subject to a minimum of 50 funds (or all funds in the Total Mapped Group if fewer than 50). Additional information, such as the ASPG quartile in which the fund's management fee ranked, is also included in the chart and considered by the Board.
Fidelity International Growth Fund

The Board noted that the fund's management fee ranked below the median of its Total Mapped Group and below the median of its ASPG for the period.
Furthermore, the Board considered that the fund's management fee includes a performance adjustment component (that is, the fund's management fee will be subject to upward or downward adjustment depending upon whether, and to what extent, the fund's investment performance for the performance period exceeds, or is exceeded by, the record (over the same period) of a Board-approved performance adjustment index). The performance period commenced on November 1, 2007. Starting with the twelfth month, the performance adjustment takes effect.
Annual Report
Board Approval of Investment Advisory Contracts and
Management Fees - continued
Based on its review, the Board concluded that the fund's management fee was fair and reasonable in light of the services that the fund receives and the other factors considered.
In its review of each class's total expenses, the Board considered the fund's management fee as well as other fund or class expenses, as applicable, such as transfer agent fees, pricing and bookkeeping fees, fund-paid 12b-1 fees, and custodial, legal, and audit fees. The Board also noted the effects of any waivers and reimbursements on fees and expenses. As part of its review, the Board also considered current and historical total expenses of each class of the fund compared to competitive fund median expenses. Each class of the fund is compared to those funds and classes in the Total Mapped Group (used by the Board for management fee comparisons) that have a similar sales load structure.
The Board noted that the total expenses of each of Class A and Fidelity International Growth (retail class) ranked equal to its competitive median for the period, and the total expenses of Class T, Class B, Class C, and Institutional Class ranked above its competitive median for the period. The Board noted that the fund offers multiple classes, each of which has a different sales load and 12b-1 fee structure, and that the multiple structures are intended to offer a range of pricing options for the intermediary market. The Board also noted that the total expenses of the classes vary primarily by the level of their 12b-1 fees, although differences in transfer agent fees may also cause expenses to vary from class to class.
In its review of total expenses, the Board also considered Fidelity fee structures and other information on clients that FMR and its affiliates service in other competitive markets, such as other mutual funds advised or subadvised by FMR or its affiliates, pension plan clients, and other institutional clients.
Based on its review, the Board concluded that the total expenses of each class of the fund were reasonable, although in some cases above the median of the universe presented for comparison, in light of the services that the fund and its shareholders receive and the other factors considered.
Costs of the Services and Profitability. The Board considered the revenues earned and the expenses incurred by Fidelity in conducting the business of developing, marketing, distributing, managing, administering and servicing the fund and its shareholders. The Board also considered the level of Fidelity's profits in respect of all the Fidelity funds.
Annual Report
On an annual basis, FMR presents to the Board Fidelity's profitability for the fund. Fidelity calculates the profitability for each fund, as well as aggregate profitability for groups of Fidelity funds and all Fidelity funds, using a series of detailed revenue and cost allocation methodologies which originate with the audited books and records of Fidelity. The Audit Committee of the Board reviews any significant changes from the prior year's methodologies.
PricewaterhouseCoopers LLP (PwC), independent registered public accounting firm and auditor to Fidelity and certain Fidelity funds, has been engaged annually by the Board as part of the Board's assessment of the results of Fidelity's profitability analysis. PwC's engagement includes the review and assessment of Fidelity's methodologies used in determining the revenues and expenses attributable to Fidelity's mutual fund business, and completion of agreed-upon procedures surrounding the mathematical accuracy of fund profitability and its conformity to allocation methodologies. After considering PwC's reports issued under the engagement and information provided by Fidelity, the Board believes that while other allocation methods may also be reasonable, Fidelity's profitability methodologies are reasonable in all material respects.
The Board has also reviewed Fidelity's non-fund businesses and any fall-out benefits related to the mutual fund business as well as cases where Fidelity's affiliates may benefit from or be related to the fund's business.
The Board considered the costs of the services provided by and the profits realized by Fidelity in connection with the operation of the fund and determined that the amount of profit is a fair entrepreneurial profit for the management of the fund.
Economies of Scale. The Board considered whether there have been economies of scale in respect of the management of the Fidelity funds, whether the Fidelity funds (including the fund) have appropriately benefited from any such economies of scale, and whether there is potential for realization of any further economies of scale. The Board considered the extent to which the fund will benefit from economies of scale through increased services to the fund, through waivers or reimbursements, or through fee or expense reductions.
The Board recognized that the fund's management contract incorporates a "group fee" structure, which provides for lower group fee rates as total fund assets under FMR's management increase, and for higher group fee rates as total fund assets under FMR's management decrease. FMR determines the group fee rates based on a tiered asset "breakpoint" schedule. The Board considered that the group fee is designed to deliver the benefits of economies of scale to fund shareholders when total fund assets increase, even if assets of any particular fund are unchanged or have declined, because some portion of Fidelity's costs are attributable to services provided to all Fidelity funds, and all funds benefit if those costs can be allocated among more assets. The Board concluded that, given the group fee structure, fund shareholders will achieve a certain level of economies of scale as assets under FMR's management increase at the fund complex level, regardless of whether Fidelity achieves any such economies of scale.
Annual Report
Board Approval of Investment Advisory Contracts and
Management Fees - continued
The Board further concluded that any potential economies of scale are being shared between fund shareholders and Fidelity in an appropriate manner.
Additional Information Requested by the Board. In order to develop fully the factual basis for consideration of the Fidelity funds' Advisory Contracts, the Board requested and received additional information on certain topics, including (i) fund performance trends and actions to be taken by FMR to improve certain funds' overall performance; (ii) portfolio manager changes that have occurred during the past year; (iii) Fidelity's fund profitability methodology, the profitability of certain fund service providers, and profitability trends for certain funds; (iv) Fidelity's compensation structure for portfolio managers and key personnel, including its effects on fund profitability and the extent to which portfolio manager compensation is linked to fund performance; (v) Fidelity's fee structures and rationale for recommending different fees among categories of funds; and (vi) Fidelity's rationale for recommending which funds should have a performance adjustment component as part of their management fees.
Based on its evaluation of all of the conclusions noted above, and after considering all material factors, the Board ultimately concluded that the advisory fee structures are fair and reasonable, and that the fund's Advisory Contracts should be renewed.
Annual Report
Investment Adviser
Fidelity Management & Research Company
Boston, MA
Investment Sub-Advisers
FMR Co., Inc.
Fidelity Management & Research
(U.K.) Inc.
Fidelity Management & Research
(Hong Kong) Limited
Fidelity Management & Research
(Japan) Inc.
Fidelity Research & Analysis Company
FIL Investment Advisors
Fidelity Investments Japan Limited
FIL Investment Advisors (U.K.) Ltd.
General Distributor
Fidelity Distributors Corporation
Boston, MA
Transfer and Service Agents
Fidelity Investments Institutional Operations Company, Inc.
Boston, MA
Fidelity Service Company, Inc.
Boston, MA
Custodian
State Street Bank and Trust Company
Quincy, MA
AIGF-UANN-1208
1.853348.100
(Fidelity Investment logo)(registered trademark)
Fidelity Advisor
International Growth
Fund - Institutional Class
Annual Report
October 31, 2008
Institutional Class is
a class of Fidelity®
International Growth Fund
(2_fidelity_logos) (Registered_Trademark)
Contents
Chairman's Message | <Click Here> | Ned Johnson's message to shareholders. |
Performance | <Click Here> | How the fund has done over time. |
Management's Discussion | <Click Here> | The manager's review of fund performance, strategy and outlook. |
Shareholder Expense Example | <Click Here> | An example of shareholder expenses. |
Investment Changes | <Click Here> | A summary of major shifts in the fund's investments over the past six months. |
Investments | <Click Here> | A complete list of the fund's investments with their market values. |
Financial Statements | <Click Here> | Statements of assets and liabilities, operations, and changes in net assets, as well as financial highlights. |
Notes | <Click Here> | Notes to financial statements. |
Report of Independent Registered Public Accounting Firm | <Click Here> | |
Trustees and Officers | <Click Here> | |
Distributions | <Click Here> | |
Proxy Voting Results | <Click Here> | |
Board Approval of Investment Advisory Contracts and Management Fees | <Click Here> | |
To view a fund's proxy voting guidelines and proxy voting record for the 12-month period ended June 30, visit http://www.fidelity.com (search for "proxy voting guidelines") or visit the Securities and Exchange Commission's (SEC) web site at http://www.sec.gov. You may also call 1-877-208-0098 to request a free copy of the proxy voting guidelines.
Standard & Poor's, S&P and S&P 500 are registered service marks of The McGraw-Hill Companies, Inc. and have been licensed for use by Fidelity Distributors Corporation.
Other third party marks appearing herein are the property of their respective owners.
All other marks appearing herein are registered or unregistered trademarks or service marks of FMR LLC or an affiliated company.
Annual Report
This report and the financial statements contained herein are submitted for the general information of the shareholders of the fund. This report is not authorized for distribution to prospective investors in the fund unless preceded or accompanied by an effective prospectus.
A fund files its complete schedule of portfolio holdings with the SEC for the first and third quarters of each fiscal year on Form N-Q. Forms N-Q are available on the SEC's web site at http://www.sec.gov. A fund's Forms N-Q may be reviewed and copied at the SEC's Public Reference Room in Washington, DC. Information regarding the operation of the SEC's Public Reference Room may be obtained by calling 1-800-SEC-0330. For a complete list of a fund's portfolio holdings, view the most recent holdings listing, semiannual report, or annual report on Fidelity's web site at http://www.fidelity.com or http://www.advisor.fidelity.com, as applicable.
NOT FDIC INSURED · MAY LOSE VALUE · NO BANK GUARANTEE
Neither the fund nor Fidelity Distributors Corporation is a bank.
Annual Report
(photo_of_Edward_C_Johnson_3d)
Dear Shareholder:
Turmoil has been the watchword for the world's securities markets in 2008, with domestic and international stocks down sharply amid the global credit squeeze. A flight to quality boosted returns for U.S. Treasuries, one of the few asset classes with positive results heading into the latter stages of the year. Financial markets are always unpredictable, but there are a number of time-tested principles that can put the historical odds in your favor.
One of the basic tenets is to invest for the long term. Over time, riding out the markets' inevitable ups and downs has proven much more effective than selling into panic or chasing the hottest trend. Even missing only a few of the markets' best days can significantly diminish investor returns. Patience also affords the benefits of compounding - of earning interest on additional income or reinvested dividends and capital gains. There are tax advantages and cost benefits to consider as well. The more you sell, the more taxes you pay, and the more you trade, the higher the costs. While staying the course doesn't eliminate risk, it can considerably lessen the effect of short-term declines.
You can further manage your investing risk through diversification. And today, more than ever, geographic diversification should be taken into account. Studies indicate that asset allocation is the single most important determinant of a portfolio's long-term success. The right mix of stocks, bonds and cash - aligned to your particular risk tolerance and investment objective - is very important. Age-appropriate rebalancing is also an essential aspect of asset allocation. For younger investors, an emphasis on equities - which historically have been the best-performing asset class over time - is encouraged. As investors near their specific goal, such as retirement or sending a child to college, consideration may be given to replacing volatile assets (e.g. common stocks) with more-stable fixed investments (bonds or savings plans).
A third investment principle - investing regularly - can help lower the average cost of your purchases. Investing a certain amount of money each month or quarter helps ensure you won't pay for all your shares at market highs. This strategy - known as dollar cost averaging - also reduces unconstructive "emotion" from investing, helping shareholders avoid selling weak performers just prior to an upswing, or chasing a hot performer just before a correction.
We invite you to contact us via the Internet, through our Investor Centers or over the phone. It is our privilege to provide you the information you need to make the investments that are right for you.
Sincerely,
/s/Edward C. Johnson 3d
Edward C. Johnson 3d
Annual Report
Average annual total return reflects the change in the value of an investment, assuming reinvestment of the class' dividend income and capital gains (the profits earned upon the sale of securities that have grown in value, if any) and assuming a constant rate of performance each year. The $10,000 table and the fund's returns do not reflect the deduction of taxes that a shareholder would pay on fund distributions or the redemption of fund shares. During periods of reimbursement by Fidelity, a fund's total return will be greater than it would be had the reimbursement not occurred. How a fund did yesterday is no guarantee of how it will do tomorrow.
Average annual total returns take Fidelity Advisor International Growth's cumulative total return and show you what would have happened if Fidelity Advisor International Growth shares had performed at a constant rate each year. These numbers will be reported once the fund is a year old.
$10,000 Over Life of Fund
Let's say hypothetically that $10,000 was invested in Fidelity Advisor International Growth Fund - Institutional Class on November 1, 2007, when the fund started. The chart shows how the value of your investment would have changed, and also shows how the MSCI® Europe, Australasia, Far East (MSCI EAFE®) Growth Index performed over the same period.
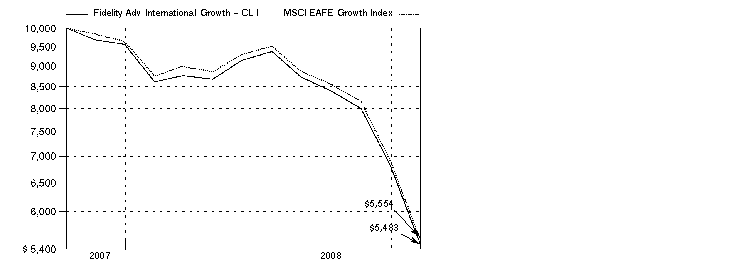
Annual Report
Comments from Jed Weiss, Portfolio Manager of Fidelity Advisor International Growth Fund
In a dramatic reversal of what had been a multiyear global growth story, international stocks fell long and hard during the 12 months ending October 31, 2008, especially so during the latter stages of the period and mostly as a result of fallout from the financial crisis that emanated from the United States. The viral spread of this financial contagion - which began in the U.S. subprime mortgage market, then seized up the credit markets, hobbled major financial institutions and eventually slowed economic growth worldwide - left virtually no corner of the globe untouched. Developed international equity markets - as gauged by the MSCI® Europe, Australasia, Far East (EAFE®) Index, which monitors established markets outside the U.S. and Canada - fell 46.54%, while the Standard & Poor's 500SM Index, a measure of U.S. stocks, dropped 36.10%. Among countries constituting at least 1% of the EAFE index, Switzerland had the "least worst" showing, falling roughly 32%, followed by Japan, where stocks slid by around 37%. Meanwhile, the weakest overall performance came from Belgium, where stocks slipped by nearly 70%. In the United Kingdom, the largest component of the index, equities were down almost 48%. Emerging markets were the weakest performers among the global economies, declining 56.22% as measured by the MSCI Emerging Markets Index.
For the period from their inception on November 1, 2007, through October 31, 2008, the fund's Institutional Class shares fell 45.17%, while the MSCI EAFE Growth Index fell 44.46%. The fund underperformed its benchmark partially due to unfavorable stock selection in the energy and information technology sectors. An overweighting and poor stock picks in diversified financials also detracted, as did not owning a position in German automaker Volkswagen, which had an extraordinary gain late in the period on heavy buying by a take-over suitor. Among other detracting factors were underweighted stakes in two solid-performing pharmaceuticals stocks - U.K.-based GlaxoSmithKline and Switzerland's Novartis - and an overweighted position in Singapore Exchange, a regional stock market. The fund was overweighted in consumer staples - especially in the food, beverage and tobacco group - and this defensive orientation helped, especially our sizable stake in Nestle, the Swiss multinational packaged goods company. Other contributors included Torishima Pump Manufacturing, a Japanese maker of pressure pumps used in desalination and power projects that I sold to take profits, and CSL, Ltd., an Australian biopharmaceutical company that focuses on blood plasma products.
The views expressed above reflect those of the portfolio manager(s) only through the end of the period as stated on the cover of this report and do not necessarily represent the views of Fidelity or any other person in the Fidelity organization. Any such views are subject to change at any time based upon market or other conditions and Fidelity disclaims any responsibility to update such views. These views may not be relied on as investment advice and, because investment decisions for a Fidelity fund are based on numerous factors, may not be relied on as an indication of trading intent on behalf of any Fidelity fund.
Annual Report
Fidelity International Growth Fund
Shareholder Expense Example
As a shareholder of the Fund, you incur two types of costs: (1) transaction costs, including sales charges (loads) on purchase payments or redemption proceeds, redemption fees, and (2) ongoing costs, including management fees, distribution and/or service (12b-1) fees and other Fund expenses. This Example is intended to help you understand your ongoing costs (in dollars) of investing in the Fund and to compare these costs with the ongoing costs of investing in other mutual funds.
The Example is based on an investment of $1,000 invested at the beginning of the period and held for the entire period (May 1, 2008 to October 31, 2008).
Actual Expenses
The first line of the accompanying table for each class of the Fund provides information about actual account values and actual expenses. You may use the information in this line, together with the amount you invested, to estimate the expenses that you paid over the period. Simply divide your account value by $1,000.00 (for example, an $8,600 account value divided by $1,000.00 = 8.6), then multiply the result by the number in the first line for a class of the Fund under the heading entitled "Expenses Paid During Period" to estimate the expenses you paid on your account during this period. A small balance maintenance fee of $12.00 that is charged once a year may apply for certain accounts with a value of less than $2,000. This fee is not included in the table below. If it was, the estimate of expenses you paid during the period would be higher, and your ending account value lower, by this amount.
Hypothetical Example for Comparison Purposes
The second line of the accompanying table for each class of the Fund provides information about hypothetical account values and hypothetical expenses based on a Class' actual expense ratio and an assumed rate of return of 5% per year before expenses, which is not the Class' actual return. The hypothetical account values and expenses may not be used to estimate the actual ending account balance or expenses you paid for the period. You may use this information to compare the ongoing costs of investing in the Fund and other funds. To do so, compare this 5% hypothetical example with the 5% hypothetical examples that appear in the shareholder reports of the other funds. A small balance maintenance fee of $12.00 that is charged once a year may apply for certain accounts with a value of less than $2,000. This fee is not included in the table below. If it was, the estimate of expenses you paid during the period would be higher, and your ending account value lower, by this amount.
Please note that the expenses shown in the table are meant to highlight your ongoing costs only and do not reflect any transaction costs. Therefore, the second line of the table is useful in comparing ongoing costs only, and will not help you determine the relative total costs of owning different funds. In addition, if these transactional costs were included, your costs would have been higher.
Annual Report
Fidelity International Growth Fund
Shareholder Expense Example - continued
| Annualized
Expense Ratio | Beginning
Account Value
May 1, 2008 | Ending
Account Value
October 31, 2008 | Expenses Paid
During Period*
May 1, 2008
to October 31, 2008 |
Class A | 1.50% | | | |
Actual | | $ 1,000.00 | $ 598.00 | $ 6.03 |
HypotheticalA | | $ 1,000.00 | $ 1,017.60 | $ 7.61 |
Class T | 1.75% | | | |
Actual | | $ 1,000.00 | $ 597.60 | $ 7.03 |
HypotheticalA | | $ 1,000.00 | $ 1,016.34 | $ 8.87 |
Class B | 2.25% | | | |
Actual | | $ 1,000.00 | $ 595.60 | $ 9.02 |
HypotheticalA | | $ 1,000.00 | $ 1,013.83 | $ 11.39 |
Class C | 2.25% | | | |
Actual | | $ 1,000.00 | $ 595.60 | $ 9.02 |
HypotheticalA | | $ 1,000.00 | $ 1,013.83 | $ 11.39 |
International Growth | 1.25% | | | |
Actual | | $ 1,000.00 | $ 599.60 | $ 5.03 |
HypotheticalA | | $ 1,000.00 | $ 1,018.85 | $ 6.34 |
Institutional Class | 1.25% | | | |
Actual | | $ 1,000.00 | $ 599.60 | $ 5.03 |
HypotheticalA | | $ 1,000.00 | $ 1,018.85 | $ 6.34 |
A 5% return per year before expenses
* Expenses are equal to each Class' annualized expense ratio, multiplied by the average account value over the period, multiplied by 184/366 (to reflect the one-half year period).
Annual Report
Fidelity International Growth Fund
Investment Changes (Unaudited)
Geographic Diversification (% of fund's net assets) |
As of October 31, 2008 |
| Switzerland 18.2% |
| United Kingdom 16.4% |
| United States of America 13.1% |
| Japan 10.2% |
| Australia 6.7% |
| Germany 5.9% |
| France 4.6% |
| Spain 3.8% |
| Netherlands 2.9% |
| Other 18.2% |

Percentages are adjusted for the effect of futures contracts, if applicable. |
As of April 30, 2008 |
| United Kingdom 18.6% |
| Switzerland 10.2% |
| United States of America 8.6% |
| Germany 8.6% |
| Japan 7.9% |
| France 7.0% |
| Australia 5.8% |
| Canada 3.9% |
| South Africa 3.8% |
| Other 25.6% |

Percentages are adjusted for the effect of futures contracts, if applicable. |
Asset Allocation as of October 31, 2008 |
| % of fund's
net assets | % of fund's net assets
6 months ago |
Stocks and Investment Companies | 99.1 | 99.6 |
Short-Term Investments and Net Other Assets | 0.9 | 0.4 |
Top Ten Stocks as of October 31, 2008 |
| % of fund's
net assets | % of fund's net assets
6 months ago |
Nestle SA (Reg.) (Switzerland, Food Products) | 7.7 | 4.5 |
Roche Holding AG (participation certificate) (Switzerland, Pharmaceuticals) | 4.8 | 2.3 |
Novartis AG sponsored ADR (Switzerland, Pharmaceuticals) | 3.6 | 0.0 |
CSL Ltd. (Australia, Biotechnology) | 3.6 | 2.3 |
E.ON AG (Germany, Electric Utilities) | 3.6 | 3.2 |
Reckitt Benckiser Group PLC (United Kingdom, Household Products) | 2.9 | 1.5 |
Mitsubishi UFJ Financial Group, Inc. sponsored ADR (Japan, Commercial Banks) | 2.7 | 0.0 |
Woolworths Ltd. (Australia, Food & Staples Retailing) | 2.6 | 1.2 |
BAE Systems PLC (United Kingdom, Aerospace & Defense) | 2.4 | 1.5 |
Visa, Inc. (United States of America, IT Services) | 2.1 | 0.8 |
| 36.0 | |
Market Sectors as of October 31, 2008 |
| % of fund's
net assets | % of fund's net assets
6 months ago |
Consumer Staples | 25.0 | 17.4 |
Health Care | 17.6 | 8.0 |
Financials | 12.2 | 9.2 |
Information Technology | 10.6 | 11.3 |
Industrials | 8.0 | 14.5 |
Materials | 7.3 | 15.7 |
Telecommunication Services | 7.1 | 6.6 |
Utilities | 5.1 | 5.0 |
Consumer Discretionary | 3.6 | 5.1 |
Energy | 2.6 | 4.9 |
Annual Report
Fidelity International Growth Fund
Investments October 31, 2008
Showing Percentage of Net Assets
Common Stocks - 99.1% |
| Shares | | Value |
Australia - 6.7% |
CSL Ltd. | 22,127 | | $ 537,841 |
QBE Insurance Group Ltd. | 4,688 | | 79,940 |
Woolworths Ltd. | 21,117 | | 393,449 |
TOTAL AUSTRALIA | | 1,011,230 |
Belgium - 1.0% |
InBev SA | 3,600 | | 145,199 |
Bermuda - 0.3% |
Ports Design Ltd. | 44,000 | | 51,153 |
Brazil - 1.1% |
BM&F BOVESPA SA | 6,800 | | 18,067 |
Companhia Vale do Rio Doce sponsored ADR | 3,000 | | 39,360 |
Petroleo Brasileiro SA - Petrobras sponsored ADR | 3,900 | | 104,871 |
TOTAL BRAZIL | | 162,298 |
Canada - 2.4% |
Agnico-Eagle Mines Ltd. | 3,600 | | 99,300 |
Goldcorp, Inc. | 8,000 | | 149,544 |
Harry Winston Diamond Corp. | 4,100 | | 39,953 |
Potash Corp. of Saskatchewan, Inc. | 800 | | 68,208 |
TOTAL CANADA | | 357,005 |
Cayman Islands - 0.2% |
China Dongxiang Group Co. Ltd. | 124,000 | | 36,480 |
Denmark - 1.5% |
Novo Nordisk AS Series B sponsored ADR | 2,700 | | 144,477 |
Vestas Wind Systems AS (a) | 1,960 | | 80,281 |
TOTAL DENMARK | | 224,758 |
Finland - 1.0% |
Nokia Corp. sponsored ADR | 10,000 | | 151,800 |
France - 4.6% |
Alstom SA | 2,310 | | 114,492 |
Audika SA | 1,900 | | 44,302 |
Delachaux SA | 709 | | 38,995 |
GDF Suez | 5,202 | | 232,527 |
Groupe Danone | 2,595 | | 144,492 |
L'Air Liquide SA | 600 | | 51,777 |
Laurent-Perrier Group | 290 | | 23,511 |
Remy Cointreau SA | 1,104 | | 45,937 |
TOTAL FRANCE | | 696,033 |
Common Stocks - continued |
| Shares | | Value |
Germany - 5.9% |
Bayer AG | 2,200 | | $ 122,473 |
E.ON AG | 14,000 | | 535,595 |
Linde AG | 800 | | 67,185 |
Siemens AG sponsored ADR | 2,800 | | 168,420 |
TOTAL GERMANY | | 893,673 |
Hong Kong - 0.4% |
Hong Kong Exchanges & Clearing Ltd. | 6,500 | | 65,915 |
India - 1.1% |
Bharti Airtel Ltd. (a) | 12,423 | | 168,210 |
Ireland - 0.3% |
CRH PLC sponsored ADR | 2,000 | | 42,320 |
Israel - 1.4% |
Partner Communications Co. Ltd. ADR | 11,400 | | 212,952 |
Japan - 10.2% |
Dydo Drinco, Inc. | 800 | | 19,201 |
East Japan Railway Co. | 8 | | 56,925 |
Kobayashi Pharmaceutical Co. Ltd. | 2,100 | | 67,279 |
Mitsubishi UFJ Financial Group, Inc. sponsored ADR | 63,600 | | 398,772 |
Nagaileben Co. Ltd. | 1,000 | | 19,855 |
Nintendo Co. Ltd. | 700 | | 218,400 |
Nippon Building Fund, Inc. | 5 | | 48,043 |
Osaka Securities Exchange Co. Ltd. | 9 | | 29,572 |
Ozeki Co. Ltd. | 200 | | 4,888 |
Promise Co. Ltd. | 5,750 | | 103,202 |
Seven & I Holdings Co. Ltd. | 2,000 | | 56,153 |
Shiseido Co. Ltd. | 5,000 | | 103,000 |
Sony Financial Holdings, Inc. | 33 | | 107,320 |
Sumitomo Mitsui Financial Group, Inc. | 39 | | 156,338 |
Tsutsumi Jewelry Co. Ltd. | 2,800 | | 54,547 |
USS Co. Ltd. | 1,470 | | 90,033 |
TOTAL JAPAN | | 1,533,528 |
Korea (South) - 0.5% |
NHN Corp. (a) | 660 | | 70,456 |
Mexico - 1.6% |
America Movil SAB de CV Series L sponsored ADR | 4,700 | | 145,418 |
Fomento Economico Mexicano SA de CV sponsored ADR | 1,300 | | 32,877 |
Wal-Mart de Mexico SA de CV Series V | 26,000 | | 69,845 |
TOTAL MEXICO | | 248,140 |
Common Stocks - continued |
| Shares | | Value |
Netherlands - 2.9% |
ASML Holding NV (NY Shares) | 15,400 | | $ 270,270 |
Koninklijke KPN NV | 3,500 | | 49,291 |
QIAGEN NV (a) | 2,600 | | 37,076 |
Unilever NV (NY Shares) | 3,200 | | 76,960 |
TOTAL NETHERLANDS | | 433,597 |
Papua New Guinea - 0.2% |
Lihir Gold Ltd. sponsored ADR (a) | 2,500 | | 31,950 |
Philippines - 0.2% |
Jollibee Food Corp. | 32,400 | | 30,525 |
Singapore - 0.3% |
Singapore Exchange Ltd. | 12,000 | | 42,953 |
South Africa - 1.9% |
African Rainbow Minerals Ltd. | 6,439 | | 65,247 |
MTN Group Ltd. | 19,500 | | 217,554 |
TOTAL SOUTH AFRICA | | 282,801 |
Spain - 3.8% |
Grifols SA | 9,132 | | 181,734 |
Inditex SA | 2,200 | | 74,365 |
Prosegur Comp Securidad SA (Reg.) | 1,500 | | 42,614 |
Telefonica SA sponsored ADR | 4,800 | | 266,448 |
TOTAL SPAIN | | 565,161 |
Sweden - 1.7% |
H&M Hennes & Mauritz AB (B Shares) | 3,800 | | 136,239 |
Swedish Match Co. | 8,400 | | 116,627 |
TOTAL SWEDEN | | 252,866 |
Switzerland - 18.2% |
ABB Ltd. sponsored ADR | 5,100 | | 67,065 |
Credit Suisse Group sponsored ADR | 2,000 | | 74,800 |
EFG International | 3,950 | | 85,016 |
Nestle SA (Reg.) | 29,808 | | 1,158,896 |
Novartis AG sponsored ADR | 10,600 | | 540,494 |
Roche Holding AG (participation certificate) | 4,695 | | 717,837 |
Sonova Holding AG | 1,177 | | 48,894 |
The Swatch Group AG (Reg.) | 1,651 | | 47,266 |
TOTAL SWITZERLAND | | 2,740,268 |
Turkey - 1.1% |
Anadolu Efes Biracilik ve Malt Sanyii AS | 10,800 | | 90,959 |
Common Stocks - continued |
| Shares | | Value |
Turkey - continued |
Asya Katilim Bankasi AS | 42,500 | | $ 37,171 |
Tupras-Turkiye Petrol Rafinerileri AS | 3,500 | | 44,216 |
TOTAL TURKEY | | 172,346 |
United Kingdom - 16.4% |
Autonomy Corp. PLC (a) | 8,300 | | 131,586 |
BAE Systems PLC | 64,600 | | 363,069 |
BG Group PLC | 14,700 | | 216,121 |
BHP Billiton PLC ADR | 9,000 | | 308,970 |
British American Tobacco PLC sponsored ADR | 3,000 | | 163,080 |
Datacash Group PLC | 11,200 | | 38,994 |
Man Group PLC | 27,737 | | 160,119 |
Reckitt Benckiser Group PLC | 10,400 | | 439,864 |
Rio Tinto PLC sponsored ADR | 750 | | 139,403 |
Serco Group PLC | 45,200 | | 269,520 |
Tesco PLC | 42,600 | | 233,381 |
TOTAL UNITED KINGDOM | | 2,464,107 |
United States of America - 12.2% |
Allergan, Inc. | 1,900 | | 75,373 |
Berkshire Hathaway, Inc. Class B (a) | 80 | | 307,200 |
FMC Technologies, Inc. (a) | 1,000 | | 34,990 |
Gilead Sciences, Inc. (a) | 3,500 | | 160,475 |
JPMorgan Chase & Co. | 3,000 | | 123,750 |
Juniper Networks, Inc. (a) | 11,200 | | 209,888 |
Lululemon Athletica, Inc. (a) | 300 | | 4,251 |
MasterCard, Inc. Class A | 700 | | 103,474 |
Mohawk Industries, Inc. (a) | 700 | | 33,866 |
Philip Morris International, Inc. | 6,900 | | 299,943 |
Pricesmart, Inc. | 6,905 | | 102,885 |
Varian Semiconductor Equipment Associates, Inc. (a) | 2,800 | | 54,936 |
Visa, Inc. | 5,800 | | 321,030 |
TOTAL UNITED STATES OF AMERICA | | 1,832,061 |
TOTAL COMMON STOCKS (Cost $21,022,747) | 14,919,785 |
Cash Equivalents - 1.4% |
| Maturity Amount | | Value |
Investments in repurchase agreements in a joint trading account at 0.14%, dated 10/31/08 due 11/3/08 (Collateralized by U.S. Treasury Obligations) #
(Cost $220,000) | $ 220,003 | | $ 220,000 |
TOTAL INVESTMENT PORTFOLIO - 100.5% (Cost $21,242,747) | | 15,139,785 |
NET OTHER ASSETS - (0.5)% | | (81,700) |
NET ASSETS - 100% | $ 15,058,085 |
Legend |
(a) Non-income producing |
# Additional Information on each counterparty to the repurchase agreement is as follows: |
Repurchase Agreement / Counterparty | Value |
$220,000 due 11/03/08 at 0.14% |
BNP Paribas Securities Corp. | $ 14,823 |
Banc of America Securities LLC | 29,645 |
Barclays Capital, Inc. | 29,645 |
Deutsche Bank Securities, Inc. | 77,078 |
Morgan Stanley & Co., Inc. | 2,107 |
UBS Securities LLC | 66,702 |
| $ 220,000 |
Affiliated Central Funds |
Information regarding fiscal year to date income earned by the Fund from investments in Fidelity Central Funds is as follows: |
Fund | Income earned |
Fidelity Securities Lending Cash Central Fund | $ 796 |
Income Tax Information |
At October 31, 2008, the fund had a capital loss carryforward of approximately $4,969,583 all of which will expire on October 31, 2016. |
See accompanying notes which are an integral part of the financial statements.
Annual Report
Fidelity International Growth Fund
Statement of Assets and Liabilities
| October 31, 2008 |
| | |
Assets | | |
Investment in securities, at value (including repurchase agreements of $220,000) - See accompanying schedule: Unaffiliated issuers (cost $21,242,747) | | $ 15,139,785 |
Cash | | 826 |
Receivable for investments sold | | 209,595 |
Receivable for fund shares sold | | 41,993 |
Dividends receivable | | 38,609 |
Distributions receivable from Fidelity Central Funds | | 556 |
Receivable from investment adviser for expense reductions | | 53,322 |
Other receivables | | 953 |
Total assets | | 15,485,639 |
| | |
Liabilities | | |
Payable for investments purchased | $ 301,583 | |
Payable for fund shares redeemed | 60,128 | |
Accrued management fee | 9,220 | |
Distribution fees payable | 1,501 | |
Other affiliated payables | 5,737 | |
Other payables and accrued expenses | 49,385 | |
Total liabilities | | 427,554 |
| | |
Net Assets | | $ 15,058,085 |
Net Assets consist of: | | |
Paid in capital | | $ 26,452,349 |
Undistributed net investment income | | 181,332 |
Accumulated undistributed net realized gain (loss) on investments and foreign currency transactions | | (5,470,327) |
Net unrealized appreciation (depreciation) on investments and assets and liabilities in foreign currencies | | (6,105,269) |
Net Assets | | $ 15,058,085 |
See accompanying notes which are an integral part of the financial statements.
Annual Report
Statement of Assets and Liabilities - continued
| October 31, 2008 |
| | |
Calculation of Maximum Offering Price
Class A:
Net Asset Value and redemption price per share ($819,539 ÷ 149,987 shares) | | $ 5.46 |
| | |
Maximum offering price per share (100/94.25 of $5.46) | | $ 5.79 |
Class T:
Net Asset Value and redemption price per share ($507,240 ÷ 93,049 shares) | | $ 5.45 |
| | |
Maximum offering price per share (100/96.50 of $5.45) | | $ 5.65 |
Class B:
Net Asset Value and offering price per share
($642,349 ÷ 118,413 shares)A | | $ 5.42 |
| | |
Class C:
Net Asset Value and offering price per share
($683,961 ÷ 126,111 shares)A | | $ 5.42 |
| | |
International Growth:
Net Asset Value, offering price and redemption price per share ($11,883,653 ÷ 2,170,400 shares) | | $ 5.48 |
| | |
Institutional Class:
Net Asset Value, offering price and redemption price per share ($521,343 ÷ 95,209 shares) | | $ 5.48 |
A Redemption price per share is equal to net asset value less any applicable contingent deferred sales charge.
See accompanying notes which are an integral part of the financial statements.
Annual Report
Fidelity International Growth Fund
Financial Statements - continued
Statement of Operations
For the period November 1, 2007
(commencement of operations)
to October 31, 2008 |
Investment Income | | |
Dividends | | $ 518,866 |
Interest | | 15,254 |
Income from Fidelity Central Funds | | 796 |
| | 534,916 |
Less foreign taxes withheld | | (45,586) |
Total income | | 489,330 |
| | |
Expenses | | |
Management fee | $ 151,935 | |
Transfer agent fees | 62,596 | |
Distribution fees | 24,223 | |
Accounting and security lending fees | 11,180 | |
Custodian fees and expenses | 112,910 | |
Independent trustees' compensation | 87 | |
Registration fees | 124,200 | |
Audit | 48,886 | |
Legal | 74 | |
Miscellaneous | 1,905 | |
Total expenses before reductions | 537,996 | |
Expense reductions | (249,208) | 288,788 |
Net investment income (loss) | | 200,542 |
Realized and Unrealized Gain (Loss) Net realized gain (loss) on: | | |
Investment securities: | | |
Unaffiliated issuers | (5,463,869) | |
Foreign currency transactions | (18,590) | |
Total net realized gain (loss) | | (5,482,459) |
Change in net unrealized appreciation (depreciation) on: Investment securities | (6,103,378) | |
Assets and liabilities in foreign currencies | (1,891) | |
Total change in net unrealized appreciation (depreciation) | | (6,105,269) |
Net gain (loss) | | (11,587,728) |
Net increase (decrease) in net assets resulting from operations | | $ (11,387,186) |
See accompanying notes which are an integral part of the financial statements.
Annual Report
Statement of Changes in Net Assets
| For the period
November 1, 2007
(commencement of
operations) to
October 31, 2008 |
Increase (Decrease) in Net Assets | |
Operations | |
Net investment income (loss) | $ 200,542 |
Net realized gain (loss) | (5,482,459) |
Change in net unrealized appreciation (depreciation) | (6,105,269) |
Net increase (decrease) in net assets resulting
from operations | (11,387,186) |
Distributions to shareholders from net investment income | (7,494) |
Share transactions - net increase (decrease) | 26,448,569 |
Redemption fees | 4,196 |
Total increase (decrease) in net assets | 15,058,085 |
| |
Net Assets | |
Beginning of period | - |
End of period (including undistributed net investment income of $181,332) | $ 15,058,085 |
See accompanying notes which are an integral part of the financial statements.
Annual Report
Financial Highlights - Class A
| For the period
November 1, 2007
(commencement of operations) to
October 31, 2008 |
Selected Per-Share Data | |
Net asset value, beginning of period | $ 10.00 |
Income from Investment Operations | |
Net investment income (loss) C | .07 |
Net realized and unrealized gain (loss) | (4.61) |
Total from investment operations | (4.54) |
Redemption fees added to paid in capital C, E | - |
Net asset value, end of period | $ 5.46 |
Total Return A, B | (45.40)% |
Ratios to Average Net Assets D, G | |
Expenses before reductions | 2.88% |
Expenses net of fee waivers, if any | 1.50% |
Expenses net of all reductions | 1.48% |
Net investment income (loss) | .80% |
Supplemental Data | |
Net assets, end of period (000 omitted) | $ 820 |
Portfolio turnover rate F | 115% |
A Total returns would have been lower had certain expenses not been reduced during the periods shown.
B Total returns do not include the effect of the sales charges.
C Calculated based on average shares outstanding during the period.
D Expense ratios reflect operating expenses of the class. Expenses before reductions do not reflect amounts reimbursed by the investment adviser or reductions from brokerage service arrangements or other expense offset arrangements and do not represent the amount paid by the class during periods when reimbursements or reductions occur. Expense ratios before reductions for start-up periods may not be representative of longer-term operating periods. Expenses net of fee waivers reflect expenses after reimbursement by the investment adviser but prior to reductions from brokerage service arrangements or other expense offset arrangements. Expenses net of all reductions represent the net expenses paid by the class.
E Amount represents less than $.01 per share.
F Amount does not include the portfolio activity of any underlying Fidelity Central Funds.
G Fees and expenses of the underlying Fidelity Central Funds are not included in the Fund's expense ratio. The Fund indirectly bears its proportionate share of the expenses of any underlying Fidelity Central Funds.
See accompanying notes which are an integral part of the financial statements.
Annual Report
Financial Highlights - Class T
| For the period
November 1, 2007
(commencement of operations) to
October 31, 2008 |
Selected Per-Share Data | |
Net asset value, beginning of period | $ 10.00 |
Income from Investment Operations | |
Net investment income (loss) C | .05 |
Net realized and unrealized gain (loss) | (4.60) |
Total from investment operations | (4.55) |
Redemption fees added to paid in capital C, E | - |
Net asset value, end of period | $ 5.45 |
Total Return A, B | (45.50)% |
Ratios to Average Net Assets D, G | |
Expenses before reductions | 3.07% |
Expenses net of fee waivers, if any | 1.75% |
Expenses net of all reductions | 1.73% |
Net investment income (loss) | .55% |
Supplemental Data | |
Net assets, end of period (000 omitted) | $ 507 |
Portfolio turnover rate F | 115% |
A Total returns would have been lower had certain expenses not been reduced during the periods shown.
B Total returns do not include the effect of the sales charges.
C Calculated based on average shares outstanding during the period.
D Expense ratios reflect operating expenses of the class. Expenses before reductions do not reflect amounts reimbursed by the investment adviser or reductions from brokerage service arrangements or other expense offset arrangements and do not represent the amount paid by the class during periods when reimbursements or reductions occur. Expense ratios before reductions for start-up periods may not be representative of longer-term operating periods. Expenses net of fee waivers reflect expenses after reimbursement by the investment adviser but prior to reductions from brokerage service arrangements or other expense offset arrangements. Expenses net of all reductions represent the net expenses paid by the class.
E Amount represents less than $.01 per share.
F Amount does not include the portfolio activity of any underlying Fidelity Central Funds.
G Fees and expenses of the underlying Fidelity Central Funds are not included in the Fund's expense ratio. The Fund indirectly bears its proportionate share of the expenses of any underlying Fidelity Central Funds.
See accompanying notes which are an integral part of the financial statements.
Annual Report
Financial Highlights - Class B
| For the period
November 1, 2007
(commencement of operations) to
October 31, 2008 |
Selected Per-Share Data | |
Net asset value, beginning of period | $ 10.00 |
Income from Investment Operations | |
Net investment income (loss) C | - E |
Net realized and unrealized gain (loss) | (4.58) |
Total from investment operations | (4.58) |
Redemption fees added to paid in capital C, E | - |
Net asset value, end of period | $ 5.42 |
Total Return A, B | (45.80)% |
Ratios to Average Net Assets D, G | |
Expenses before reductions | 3.55% |
Expenses net of fee waivers, if any | 2.25% |
Expenses net of all reductions | 2.23% |
Net investment income (loss) | .05% |
Supplemental Data | |
Net assets, end of period (000 omitted) | $ 642 |
Portfolio turnover rate F | 115% |
A Total returns would have been lower had certain expenses not been reduced during the periods shown.
B Total returns do not include the effect of the contingent deferred sales charge.
C Calculated based on average shares outstanding during the period.
D Expense ratios reflect operating expenses of the class. Expenses before reductions do not reflect amounts reimbursed by the investment adviser or reductions from brokerage service arrangements or other expense offset arrangements and do not represent the amount paid by the class during periods when reimbursements or reductions occur. Expense ratios before reductions for start-up periods may not be representative of longer-term operating periods. Expenses net of fee waivers reflect expenses after reimbursement by the investment adviser but prior to reductions from brokerage service arrangements or other expense offset arrangements. Expenses net of all reductions represent the net expenses paid by the class.
E Amount represents less than $.01 per share.
F Amount does not include the portfolio activity of any underlying Fidelity Central Funds.
G Fees and expenses of the underlying Fidelity Central Funds are not included in the Fund's expense ratio. The Fund indirectly bears its proportionate share of the expenses of any underlying Fidelity Central Funds.
See accompanying notes which are an integral part of the financial statements.
Annual Report
Financial Highlights - Class C
| For the period
November 1, 2007
(commencement of operations) to
October 31, 2008 |
Selected Per-Share Data | |
Net asset value, beginning of period | $ 10.00 |
Income from Investment Operations | |
Net investment income (loss) C | - E |
Net realized and unrealized gain (loss) | (4.58) |
Total from investment operations | (4.58) |
Redemption fees added to paid in capital C, E | - |
Net asset value, end of period | $ 5.42 |
Total Return A, B | (45.80)% |
Ratios to Average Net Assets D, G | |
Expenses before reductions | 3.52% |
Expenses net of fee waivers, if any | 2.25% |
Expenses net of all reductions | 2.23% |
Net investment income (loss) | .05% |
Supplemental Data | |
Net assets, end of period (000 omitted) | $ 684 |
Portfolio turnover rate F | 115% |
A Total returns would have been lower had certain expenses not been reduced during the periods shown.
B Total returns do not include the effect of the contingent deferred sales charge.
C Calculated based on average shares outstanding during the period.
D Expense ratios reflect operating expenses of the class. Expenses before reductions do not reflect amounts reimbursed by the investment adviser or reductions from brokerage service arrangements or other expense offset arrangements and do not represent the amount paid by the class during periods when reimbursements or reductions occur. Expense ratios before reductions for start-up periods may not be representative of longer-term operating periods. Expenses net of fee waivers reflect expenses after reimbursement by the investment adviser but prior to reductions from brokerage service arrangements or other expense offset arrangements. Expenses net of all reductions represent the net expenses paid by the class.
E Amount represents less than $.01 per share.
F Amount does not include the portfolio activity of any underlying Fidelity Central Funds.
G Fees and expenses of the underlying Fidelity Central Funds are not included in the Fund's expense ratio. The Fund indirectly bears its proportionate share of the expenses of any underlying Fidelity Central Funds.
See accompanying notes which are an integral part of the financial statements.
Annual Report
Financial Highlights - International Growth
| For the period
November 1, 2007
(commencement of operations) to
October 31, 2008 |
Selected Per-Share Data | |
Net asset value, beginning of period | $ 10.00 |
Income from Investment Operations | |
Net investment income (loss) B | .09 |
Net realized and unrealized gain (loss) | (4.60) |
Total from investment operations | (4.51) |
Distributions from net investment income | (.01) |
Redemption fees added to paid in capital B, D | - |
Net asset value, end of period | $ 5.48 |
Total Return A | (45.17)% |
Ratios to Average Net Assets C, F | |
Expenses before reductions | 2.35% |
Expenses net of fee waivers, if any | 1.25% |
Expenses net of all reductions | 1.23% |
Net investment income (loss) | 1.05% |
Supplemental Data | |
Net assets, end of period (000 omitted) | $ 11,884 |
Portfolio turnover rate E | 115% |
A Total returns would have been lower had certain expenses not been reduced during the periods shown.
B Calculated based on average shares outstanding during the period.
C Expense ratios reflect operating expenses of the class. Expenses before reductions do not reflect amounts reimbursed by the investment adviser or reductions from brokerage service arrangements or other expense offset arrangements and do not represent the amount paid by the class during periods when reimbursements or reductions occur. Expense ratios before reductions for start-up periods may not be representative of longer-term operating periods. Expenses net of fee waivers reflect expenses after reimbursement by the investment adviser but prior to reductions from brokerage service arrangements or other expense offset arrangements. Expenses net of all reductions represent the net expenses paid by the class.
D Amount represents less than $.01 per share.
E Amount does not include the portfolio activity of any underlying Fidelity Central Funds.
F Fees and expenses of the underlying Fidelity Central Funds are not included in the Fund's expense ratio. The Fund indirectly bears its proportionate share of the expenses of any underlying Fidelity Central Funds.
See accompanying notes which are an integral part of the financial statements.
Annual Report
Financial Highlights - Institutional Class
| For the period
November 1, 2007
(commencement of operations) to
October 31, 2008 |
Selected Per-Share Data | |
Net asset value, beginning of period | $ 10.00 |
Income from Investment Operations | |
Net investment income (loss) B | .09 |
Net realized and unrealized gain (loss) | (4.60) |
Total from investment operations | (4.51) |
Distributions from net investment income | (.01) |
Redemption fees added to paid in capital B, D | - |
Net asset value, end of period | $ 5.48 |
Total Return A | (45.17)% |
Ratios to Average Net Assets C, F | |
Expenses before reductions | 2.56% |
Expenses net of fee waivers, if any | 1.25% |
Expenses net of all reductions | 1.23% |
Net investment income (loss) | 1.05% |
Supplemental Data | |
Net assets, end of period (000 omitted) | $ 521 |
Portfolio turnover rate E | 115% |
A Total returns would have been lower had certain expenses not been reduced during the periods shown.
B Calculated based on average shares outstanding during the period.
C Expense ratios reflect operating expenses of the class. Expenses before reductions do not reflect amounts reimbursed by the investment adviser or reductions from brokerage service arrangements or other expense offset arrangements and do not represent the amount paid by the class during periods when reimbursements or reductions occur. Expense ratios before reductions for start-up periods may not be representative of longer-term operating periods. Expenses net of fee waivers reflect expenses after reimbursement by the investment adviser but prior to reductions from brokerage service arrangements or other expense offset arrangements. Expenses net of all reductions represent the net expenses paid by the class.
D Amount represents less than $.01 per share.
E Amount does not include the portfolio activity of any underlying Fidelity Central Funds.
F Fees and expenses of the underlying Fidelity Central Funds are not included in the Fund's expense ratio. The Fund indirectly bears its proportionate share of the expenses of any underlying Fidelity Central Funds.
See accompanying notes which are an integral part of the financial statements.
Annual Report
Fidelity International Growth Fund
Notes to Financial Statements
For the period ended October 31, 2008
1. Organization.
Fidelity International Growth Fund (the Fund) is a fund of Fidelity Investment Trust (the trust) and is authorized to issue an unlimited number of shares. The trust is registered under the Investment Company Act of 1940, as amended (the 1940 Act), as an open-end management investment company organized as a Massachusetts business trust. The Fund offers Class A, Class T, Class B, Class C, International Growth and Institutional Class shares, each of which has equal rights as to assets and voting privileges. Each class has exclusive voting rights with respect to matters that affect that class. Class B shares will automatically convert to Class A shares after a holding period of seven years from the initial date of purchase. Investment income, realized and unrealized capital gains and losses, the common expenses of the Fund, and certain fund-level expense reductions, if any, are allocated on a pro rata basis to each class based on the relative net assets of each class to the total net assets of the Fund. Each class differs with respect to transfer agent and distribution and service plan fees incurred. Certain expense reductions also differ by class. The Fund's investments in emerging markets can be subject to social, economic, regulatory, and political uncertainties and can be extremely volatile.
2. Investments in Fidelity Central Funds.
The Fund may invest in Fidelity Central Funds, which are open-end investment companies available only to other investment companies and accounts managed by Fidelity Management & Research Company (FMR) and its affiliates. The Fund's Schedule of Investments lists each of the Fidelity Central Funds held as of period end, if any, as an investment of the Fund, but does not include the underlying holdings of each Fidelity Central Fund. As an Investing Fund, the Fund indirectly bears its proportionate share of the expenses of the underlying Fidelity Central Funds.
The Money Market Central Funds seek preservation of capital and current income and are managed by Fidelity Investments Money Management, Inc. (FIMM), an affiliate of FMR.
A complete unaudited list of holdings for each Fidelity Central Fund is available upon request or at the SEC's web site at www.sec.gov. In addition, the financial statements of the Fidelity Central Funds, which are not covered by the Fund's Report of Independent Registered Public Accounting Firm, are available on the SEC's web site or upon request.
3. Significant Accounting Policies.
The financial statements have been prepared in conformity with accounting principles generally accepted in the United States of America, which require management to make certain estimates and assumptions at the date of the financial statements. Actual results could differ from those estimates. The following summarizes the significant accounting policies of the Fund:
Annual Report
3. Significant Accounting Policies - continued
Security Valuation. Investments are valued as of 4:00 p.m. Eastern time on the last calendar day of the period. Wherever possible, the Fund uses independent pricing services approved by the Board of Trustees to value its investments.
Equity securities, including restricted securities, for which market quotations are readily available, are valued at the last reported sale price or official closing price as reported by an independent pricing service on the primary market or exchange on which they are traded. In the event there were no sales during the day or closing prices are not available, securities are valued at the last quoted bid price. Investments in open-end mutual funds, including Fidelity Central Funds, are valued at their closing net asset value each business day. Short-term securities with remaining maturities of sixty days or less for which quotations are not readily available are valued at amortized cost, which approximates value.
When current market prices or quotations are not readily available or reliable, valuations may be determined in good faith in accordance with procedures adopted by the Board of Trustees. Factors used in determining value may include significant market or security specific events, changes in interest rates and credit quality, and developments in foreign markets which are monitored by evaluating the performance of ADRs, futures contracts and exchange-traded funds. The frequency with which these procedures are used cannot be predicted and may be utilized to a significant extent. The value of securities used for net asset value (NAV) calculation under these procedures may differ from published prices for the same securities.
Foreign Currency. The Fund uses foreign currency contracts to facilitate transactions in foreign-denominated securities. Losses from these transactions may arise from changes in the value of the foreign currency or if the counterparties do not perform under the contracts' terms.
Foreign-denominated assets, including investment securities, and liabilities are translated into U.S. dollars at the exchange rate at period end. Purchases and sales of investment securities, income and dividends received and expenses denominated in foreign currencies are translated into U.S. dollars at the exchange rate in effect on the transaction date.
The effects of exchange rate fluctuations on investments are included with the net realized and unrealized gain (loss) on investment securities. Other foreign currency transactions resulting in realized and unrealized gain (loss) are disclosed separately.
Annual Report
Fidelity International Growth Fund
Notes to Financial Statements - continued
3. Significant Accounting Policies - continued
Investment Transactions and Income. For financial reporting purposes, the Fund's investment holdings and NAV include trades executed through the end of the last business day of the period. The NAV per share for processing shareholder transactions is calculated as of the close of business of the New York Stock Exchange (NYSE), normally 4:00 p.m. Eastern time and includes trades executed through the end of the prior business day. Gains and losses on securities sold are determined on the basis of identified cost. Dividend income is recorded on the ex-dividend date, except for certain dividends from foreign securities where the ex-dividend date may have passed, which are recorded as soon as the Fund is informed of the ex-dividend date. Non-cash dividends included in dividend income, if any, are recorded at the fair market value of the securities received. Interest income and distributions from the Fidelity Central Funds are accrued as earned. Interest income includes coupon interest and amortization of premium and accretion of discount on debt securities. Investment income is recorded net of foreign taxes withheld where recovery of such taxes is uncertain.
Expenses. Most expenses of the trust can be directly attributed to a fund. Expenses which cannot be directly attributed are apportioned among each Fund in the trust. Expense estimates are accrued in the period to which they relate and adjustments are made when actual amounts are known.
Income Tax Information and Distributions to Shareholders. Each year, the Fund intends to qualify as a regulated investment company by distributing substantially all of its taxable income and realized gains under Subchapter M of the Internal Revenue Code and filing its U.S. federal tax return. As a result, no provision for income taxes is required. The Fund is subject to the provisions of FASB Interpretation No. 48, Accounting for Uncertainties in Income Taxes (FIN 48). FIN 48 sets forth a minimum threshold for financial statement recognition of the benefit of a tax position taken or expected to be taken in a tax return. There are no unrecognized tax benefits in the accompanying financial statements in connection with the tax positions expected to be taken in the initial filing of the Fund's federal tax return. Foreign taxes are provided for based on the Fund's understanding of the tax rules and rates that exist in the foreign markets in which it invests.
Distributions are recorded on the ex-dividend date. Income dividends and capital gain distributions are declared separately for each class. Income and capital gain distributions are determined in accordance with income tax regulations, which may differ from generally accepted accounting principles.
Capital accounts within the financial statements are adjusted for permanent book-tax differences. These adjustments have no impact on net assets or the results of operations. Temporary book-tax differences will reverse in a subsequent period.
Annual Report
3. Significant Accounting Policies - continued
Income Tax Information and Distributions to Shareholders - continued
Book-tax differences are primarily due to foreign currency transactions, passive foreign investment companies (PFIC), capital loss carryforwards and losses deferred due to wash sales.
The tax-basis components of distributable earnings and the federal tax cost as of period end were as follows:
Unrealized appreciation | $ 109,388 |
Unrealized depreciation | (6,715,400) |
Net unrealized appreciation (depreciation) | (6,606,012) |
Undistributed ordinary income | 181,332 |
Capital loss carryforward | (4,969,583) |
| |
Cost for federal income tax purposes | $ 21,745,797 |
The tax character of distributions paid was as follows:
| October 31, 2008 |
Ordinary Income | $ 7,494 |
Short-Term Trading (Redemption) Fees. Shares held in the Fund less than 30 days are subject to a redemption fee equal to 1.00% of the proceeds of the redeemed shares. All redemption fees, including any estimated redemption fees paid by FMR, are retained by the Fund and accounted for as an addition to paid in capital.
New Accounting Pronouncement. In September 2006, Statement of Financial Accounting Standards No. 157, Fair Value Measurements (SFAS 157), was issued and is effective for fiscal years beginning after November 15, 2007. SFAS 157 defines fair value, establishes a framework for measuring fair value and results in expanded disclosures about fair value measurements. The Fund will adopt the provisions of SFAS 157 effective for its fiscal year beginning November 1, 2008.
4. Operating Policies.
Repurchase Agreements. FMR has received an Exemptive Order from the Securities and Exchange Commission (the SEC) which permits the Fund and other affiliated entities of FMR to transfer uninvested cash balances into joint trading accounts which are then invested in repurchase agreements. The Fund may also invest directly with institutions in repurchase agreements. Repurchase agreements are collateralized by government or non-government securities. Upon settlement date, collateral is held in segregated accounts with custodian banks and may be obtained in the event of a default
Annual Report
Fidelity International Growth Fund
Notes to Financial Statements - continued
4. Operating Policies - continued
Repurchase Agreements - continued
of the counterparty. The Fund monitors, on a daily basis, the value of the collateral to ensure it is at least equal to the principal amount of the repurchase agreement (including accrued interest). In the event of a default by the counterparty, realization of the collateral proceeds could be delayed, during which time the value of the collateral may decline.
5. Purchases and Sales of Investments.
Purchases and sales of securities short-term securities, aggregated $49,769,507 and $23,267,930, respectively.
6. Fees and Other Transactions with Affiliates.
Management Fee. FMR and its affiliates provide the Fund with investment management related services for which the Fund pays a monthly management fee. The management fee is the sum of an individual fund fee rate that is based on an annual rate of .45% of the Fund's average net assets and a group fee rate that averaged .26% during the period. The group fee rate is based upon the average net assets of all the mutual funds advised by FMR. The group fee rate decreases as assets under management increase and increases as assets under management decrease. In addition, the management fee is subject to a performance adjustment (up to a maximum of ± .20% of the Fund's average net assets over the performance period). The upward or downward adjustment to the management fee is based on the investment performance of the International Growth Class as compared to an appropriate benchmark index. The Fund's performance period began on December 1, 2007 and subsequent months will be added until the performance period includes 36 months. The Fund's performance adjustment will take effect in November 2008. For the period, the total annual management fee rate was .71% of the Fund's average net assets.
Distribution and Service Plan. In accordance with Rule 12b-1 of the 1940 Act, the Fund has adopted separate Distribution and Service Plans for each class of shares. Certain classes pay Fidelity Distributors Corporation (FDC), an affiliate of FMR, separate Distribution and Service Fees, each of which is based on an annual percentage of each class' average net assets. In addition, FDC may pay financial intermediaries for selling shares of the Fund and providing shareholder support services. For the period,
Annual Report
6. Fees and Other Transactions with Affiliates - continued
Distribution and Service Plan - continued
the Distribution and Service Fee rates and the total amounts paid to and retained by FDC were as follows:
| Distribution
Fee | Service
Fee | Paid to
FDC | Retained
by FDC |
Class A | -% | .25% | $ 2,271 | $ 1,733 |
Class T | .25% | .25% | 4,078 | 3,384 |
Class B | .75% | .25% | 8,803 | 8,289 |
Class C | .75% | .25% | 9,071 | 7,311 |
| | | $ 24,223 | $ 20,717 |
Sales Load. FDC receives a front-end sales charge of up to 5.75% for selling Class A shares, and 3.50% for selling Class T shares, some of which is paid to financial intermediaries for selling shares of the Fund. FDC receives the proceeds of contingent deferred sales charges levied on Class A, Class T, Class B, and Class C redemptions. These charges depend on the holding period. The deferred sales charges range from 5% to 1% for Class B, 1% for Class C, 1.00% to .50% for certain purchases of Class A shares and .25% for certain purchases of Class T shares.
For the period, sales charge amounts retained by FDC were as follows:
| Retained
by FDC |
Class A | $ 1,807 |
Class T | 290 |
Class B* | 923 |
| $ 3,020 |
* When Class B shares are initially sold, FDC pays commissions from its own resources to financial intermediaries through which the sales are made.
Transfer Agent Fees. Fidelity Investments Institutional Operations Company, Inc. (FIIOC), an affiliate of FMR, is the transfer, dividend disbursing and shareholder servicing agent for each class of the Fund. FIIOC receives account fees and asset-based fees that vary according to the account size and type of account of the shareholders of the respective classes of the Fund. FIIOC pays for typesetting, printing and mailing of
Annual Report
Fidelity International Growth Fund
Notes to Financial Statements - continued
6. Fees and Other Transactions with Affiliates - continued
Transfer Agent Fees - continued
shareholder reports, except proxy statements. For the period, the total transfer agent fees paid by each class were as follows:
| Amount | % of
Average
Net Assets |
Class A | $ 2,412 | .27 |
Class T | 1,573 | .19 |
Class B | 2,235 | .25 |
Class C | 2,280 | .25 |
International Growth | 52,882 | .31 |
Institutional Class | 1,214 | .16 |
| $ 62,596 | |
Accounting and Security Lending Fees. Fidelity Service Company, Inc. (FSC), an affiliate of FMR, maintains the Fund's accounting records. The accounting fee is based on the level of average net assets for the month. Under a separate contract, FSC administers the security lending program. The security lending fee is based on the number and duration of lending transactions.
Brokerage Commissions. The Fund placed a portion of its portfolio transactions with brokerage firms which are affiliates of the investment adviser. The commissions paid to these affiliated firms were $742 for the period.
7. Committed Line of Credit.
The Fund participates with other funds managed by FMR in a $4.2 billion credit facility (the "line of credit") to be utilized for temporary or emergency purposes to fund shareholder redemptions or for other short-term liquidity purposes. The Fund has agreed to pay commitment fees on its pro rata portion of the line of credit, which amounted to $31 and is reflected in Miscellaneous Expense on the Statement of Operations. During the period, there were no borrowings on this line of credit.
8. Security Lending.
The Fund lends portfolio securities from time to time in order to earn additional income. On the settlement date of the loan, the Fund receives collateral (in the form of U.S. Treasury obligations, letters of credit and/or cash) against the loaned securities and maintains collateral in an amount not less than 100% of the market value of the loaned securities during the period of the loan. The market value of the loaned securities is
Annual Report
8. Security Lending - continued
determined at the close of business of the Fund and any additional required collateral is delivered to the Fund on the next business day. If the borrower defaults on its obligation to return the securities loaned because of insolvency or other reasons, a fund could experience delays and costs in recovering the securities loaned or in gaining access to the collateral. Any cash collateral received is invested in the Fidelity Securities Lending Cash Central Fund. Security lending income represents the income earned on investing cash collateral, less fees and expenses associated with the loan, plus any premium payments that may be received on the loan of certain types of securities. Security lending income is presented in the Statement of Operations as a component of income from Fidelity Central Funds. Net income from lending portfolio securities during the period amounted to $796.
9. Expense Reductions.
FMR voluntarily agreed to reimburse each class to the extent annual operating expenses exceeded certain levels of average net assets as noted in the table below. Some expenses, for example interest expense, including commitment fees, are excluded from this reimbursement.
The following classes were in reimbursement during the period:
| Expense
Limitations | Reimbursement
from adviser |
Class A | 1.50% | $ 12,501 |
Class T | 1.75% | 10,738 |
Class B | 2.25% | 11,439 |
Class C | 2.25% | 11,520 |
International Growth | 1.25% | 188,565 |
Institutional Class | 1.25% | 10,170 |
| | $ 244,933 |
Many of the brokers with whom FMR places trades on behalf of the Fund provided services to the Fund in addition to trade execution. These services included payments of certain expenses on behalf of the Fund totaling $4,149 for the period. In addition, through arrangements with the Fund's custodian, credits realized as a result of uninvested cash balances were used to reduce the Fund's expenses. During the period, these credits reduced the Fund's custody expenses by $126.
Annual Report
Fidelity International Growth Fund
Notes to Financial Statements - continued
10. Other.
The Fund's organizational documents provide former and current trustees and officers with a limited indemnification against liabilities arising in connection with the performance of their duties to the Fund. In the normal course of business, the Fund may also enter into contracts that provide general indemnifications. The Fund's maximum exposure under these arrangements is unknown as this would be dependent on future claims that may be made against the Fund. The risk of material loss from such claims is considered remote.
FMR or its affiliates were the owners of record of 24% of the total outstanding shares of the Fund.
During the period, Lehman Brothers Holdings, Inc. and certain of its affiliates (LBHI) sought protection under the insolvency laws of their jurisdictions of organization, including the United States, the United Kingdom and Japan. At the time LBHI's insolvency proceedings were instituted, the Fund had outstanding securities trades with counterparties affiliated with LBHI. As a result of the insolvency proceedings, LBHI is unable to fulfill its commitments and, in certain cases, the Fund may have terminated its trades and related agreements with the relevant entities and, where appropriate, is in the process of initiating claims for damages. FMR believes that the financial impact to the Fund relating to the terminated trades and agreements is immaterial.
11. Distributions to Shareholders.
Distributions to shareholders of each class were as follows:
| For the period
November 1, 2007
(commencement of operations) to
October 31, 2008 |
From net investment income | |
International Growth | $ 7,036 |
Institutional Class | 458 |
Total | $ 7,494 |
Annual Report
12. Share Transactions.
Transactions for each class of shares were as follows:
| Shares | Dollars |
| For the period
November 1, 2007
(commencement of operations) to
October 31, 2008 | For the period
November 1, 2007
(commencement of operations) to
October 31, 2008 |
Class A | | |
Shares sold | 163,688 | $ 1,473,900 |
Shares redeemed | (13,701) | (105,944) |
Net increase (decrease) | 149,987 | $ 1,367,956 |
Class T | | |
Shares sold | 120,600 | $ 1,160,207 |
Shares redeemed | (27,551) | (234,209) |
Net increase (decrease) | 93,049 | $ 925,998 |
Class B | | |
Shares sold | 130,340 | $ 1,229,254 |
Shares redeemed | (11,927) | (88,741) |
Net increase (decrease) | 118,413 | $ 1,140,513 |
Class C | | |
Shares sold | 147,998 | $ 1,363,686 |
Shares redeemed | (21,887) | (174,264) |
Net increase (decrease) | 126,111 | $ 1,189,422 |
International Growth | | |
Shares sold | 3,641,791 | $ 32,862,391 |
Reinvestment of distributions | 663 | 6,366 |
Shares redeemed | (1,472,054) | (11,980,798) |
Net increase (decrease) | 2,170,400 | $ 20,887,959 |
Institutional Class | | |
Shares sold | 95,161 | $ 936,263 |
Reinvestment of distributions | 48 | 458 |
Net increase (decrease) | 95,209 | $ 936,721 |
Annual Report
To the Trustees of Fidelity Investment Trust and the Shareholders of Fidelity International Growth Fund:
In our opinion, the accompanying statement of assets and liabilities, including the schedule of investments, and the related statements of operations and of changes in net assets and the financial highlights present fairly, in all material respects, the financial position of Fidelity International Growth Fund (a fund of Fidelity Investment Trust) at October 31, 2008, the results of its operations for the period indicated, the changes in its net assets for the period indicated and the financial highlights for the period indicated, in conformity with accounting principles generally accepted in the United States of America. These financial statements and financial highlights (hereafter referred to as "financial statements") are the responsibility of the Fidelity International Growth Fund's management. Our responsibility is to express an opinion on these financial statements based on our audit. We conducted our audit of these financial statements in accordance with the standards of the Public Company Accounting Oversight Board (United States). Those standards require that we plan and perform the audit to obtain reasonable assurance about whether the financial statements are free of material misstatement. An audit includes examining, on a test basis, evidence supporting the amounts and disclosures in the financial statements, assessing the accounting principles used and significant estimates made by management, and evaluating the overall financial statement presentation. We believe that our audit, which included confirmation of securities at October 31, 2008 by correspondence with the custodian and brokers, provides a reasonable basis for our opinion.
/s/ PricewaterhouseCoopers LLP
PricewaterhouseCoopers LLP
Boston, Massachusetts
December 23, 2008
Annual Report
The Trustees, Member of the Advisory Board, and executive officers of the trust and fund, as applicable, are listed below. The Board of Trustees governs the fund and is responsible for protecting the interests of shareholders. The Trustees are experienced executives who meet periodically throughout the year to oversee the fund's activities, review contractual arrangements with companies that provide services to the fund, and review the fund's performance. Except for Edward C. Johnson 3d and James C. Curvey, each of the Trustees oversees 220 funds advised by FMR or an affiliate. Messrs. Johnson and Curvey oversee 379 funds advised by FMR or an affiliate.
The Trustees hold office without limit in time except that (a) any Trustee may resign; (b) any Trustee may be removed by written instrument, signed by at least two-thirds of the number of Trustees prior to such removal; (c) any Trustee who requests to be retired or who has become incapacitated by illness or injury may be retired by written instrument signed by a majority of the other Trustees; and (d) any Trustee may be removed at any special meeting of shareholders by a two-thirds vote of the outstanding voting securities of the trust. Each Trustee who is not an interested person (as defined in the 1940 Act) (Independent Trustee), shall retire not later than the last day of the calendar year in which his or her 72nd birthday occurs. The Independent Trustees may waive this mandatory retirement age policy with respect to individual Trustees. The executive officers and Advisory Board Member hold office without limit in time, except that any officer and Advisory Board Member may resign or may be removed by a vote of a majority of the Trustees at any regular meeting or any special meeting of the Trustees. Except as indicated, each individual has held the office shown or other offices in the same company for the past five years.
The fund's Statement of Additional Information (SAI) includes more information about the Trustees. To request a free copy, call Fidelity at 1-877-208-0098.
Interested Trustees*:
Correspondence intended for each Trustee who is an interested person may be sent to Fidelity Investments, 82 Devonshire Street, Boston, Massachusetts 02109.
Name, Age; Principal Occupation |
Edward C. Johnson 3d (78) |
| Year of Election or Appointment: 1984 Mr. Johnson is Chairman of the Board of Trustees. Mr. Johnson serves as Chief Executive Officer, Chairman, and a Director of FMR LLC; Chairman and a Director of FMR; Chairman and a Director of Fidelity Research & Analysis Company (FRAC); Chairman and a Director of Fidelity Investments Money Management, Inc.; and Chairman and a Director of FMR Co., Inc. In addition, Mr. Johnson serves as Chairman and Director of FIL Limited. Previously, Mr. Johnson served as President of FMR LLC (2006-2007). |
James C. Curvey (73) |
| Year of Election or Appointment: 2007 Mr. Curvey also serves as Trustee (2007-present) of other investment companies advised by FMR. Mr. Curvey is a Director of FMR and FMR Co., Inc. (2007-present). Mr. Curvey is also Vice Chairman (2006-
present) and Director of FMR LLC. In addition, Mr. Curvey serves as an Overseer for the Boston Symphony Orchestra and a member of the Trustees of Villanova University. |
* Trustees have been determined to be "Interested Trustees" by virtue of, among other things, their affiliation with the trust or various entities under common control with FMR. FMR Corp. merged with and into FMR LLC on October 1, 2007. Any references to FMR LLC for prior periods are deemed to be references to the prior entity.
Independent Trustees:
Correspondence intended for each Independent Trustee (that is, the Trustees other than the Interested Trustees) may be sent to Fidelity Investments, P.O. Box 55235, Boston, Massachusetts 02205-5235.
Name, Age; Principal Occupation |
Dennis J. Dirks (60) |
| Year of Election or Appointment: 2005 Prior to his retirement in May 2003, Mr. Dirks was Chief Operating Officer and a member of the Board of The Depository Trust & Clearing Corporation (DTCC) (1999-2003). He also served as President, Chief Operating Officer, and Board member of The Depository Trust Company (DTC) (1999-2003) and President and Board member of the National Securities Clearing Corporation (NSCC) (1999-2003). In addition, Mr. Dirks served as a Trustee and a member of the Finance Committee of Manhattan College (2005-2008), and as Chief Executive Officer and Board member of the Government Securities Clearing Corporation (2001-2003) and Chief Executive Officer and Board member of the Mortgage-Backed Securities Clearing Corporation (2001-2003). Mr. Dirks also serves as a Trustee and a member of the Finance Committee of AHRC of Nassau County (2006-present). |
Alan J. Lacy (55) |
| Year of Election or Appointment: 2008 Mr. Lacy serves as Senior Adviser (2007-present) of Oak Hill Capital Partners, L.P. (a private equity firm). Mr. Lacy also served as Chief Executive Officer (2000-2005) and Vice Chairman (2005-2006) of Sears Holdings Corporation and Sears, Roebuck and Co. (retail). In addition, Mr. Lacy serves as a member of the Board of Directors of The Western Union Company (global money transfer, 2006-present) and Bristol-Myers Squibb (global pharmaceuticals, 2007-present). Mr. Lacy is a Trustee of the National Parks Conservation Association and The Field Museum of Natural History. |
Ned C. Lautenbach (64) |
| Year of Election or Appointment: 2000 Mr. Lautenbach is Chairman of the Independent Trustees (2006-present). Mr. Lautenbach is an Advisory Partner of Clayton, Dubilier & Rice, Inc. (private equity investment firm). Previously, Mr. Lautenbach was with the International Business Machines Corporation (IBM) from 1968 until his retirement in 1998. Mr. Lautenbach serves as a Director of Eaton Corporation (diversified industrial) as well as the Philharmonic Center for the Arts in Naples, Florida. He also is a member of the Board of Trustees of Fairfield University (2005-present), as well as a member of the Council on Foreign Relations. Previously, Mr. Lautenbach served as a Director of Sony Corporation (2006-2007). |
Joseph Mauriello (64) |
| Year of Election or Appointment: 2008 Prior to his retirement in January 2006, Mr. Mauriello served in numerous senior management positions including Deputy Chairman and Chief Operating Officer (2004-2005), and Vice Chairman of Financial Services (2002-2004) of KPMG LLP US (professional services firm, 1965-
2005). Mr. Mauriello currently serves as a member of the Board of Directors of XL Capital Ltd. (global insurance and re-insurance company, 2006-present) and of Arcadia Resources Inc. (health care services and products, 2007-present). He also served as a Director of the Hamilton Funds of the Bank of New York (2006-2007). |
Cornelia M. Small (64) |
| Year of Election or Appointment: 2005 Ms. Small is a member of the Investment Committee, and Chair (2008-present) and a member of the Board of Trustees of Smith College. Ms. Small also serves on the Investment Committee of the Berkshire Taconic Community Foundation (2008-present). Previously, Ms. Small served as Chairperson of the Investment Committee (2002-2008) of Smith College and as Co-Chair (2000-2003) of the Annual Fund for the Fletcher School of Law and Diplomacy. In addition, she served as Chief Investment Officer, Director of Global Equity Investments, and a member of the Board of Directors of Scudder, Stevens & Clark and Scudder Kemper Investments. |
William S. Stavropoulos (69) |
| Year of Election or Appointment: 2001 Mr. Stavropoulos is Chairman Emeritus of the Board of Directors of The Dow Chemical Company, where he previously served in numerous senior management positions, including President (1993-2000; 2002-
2003), CEO (1995-2000; 2002-2004), Chairman of the Executive Committee (2000-2006), and as a member of the Board of Directors (1990-2006). Currently, he is a Director of Teradata Corporation (data warehousing and technology solutions, 2008-present), Chemical Financial Corporation, Maersk Inc. (industrial conglomerate), Tyco International, Inc. (multinational manufacturing and services, 2007-present), and a member of the Advisory Board for Metalmark Capital (private equity investment firm, 2005-present). He is a special advisor to Clayton, Dubilier & Rice, Inc. (private equity investment). In addition, Mr. Stavropoulos is a member of the University of Notre Dame Advisory Council for the College of Science. |
David M. Thomas (59) |
| Year of Election or Appointment: 2008 Previously, Mr. Thomas served as Executive Chairman (2005-2006) and Chairman and Chief Executive Officer (2000-2005) of IMS Health, Inc. (pharmaceutical and healthcare information solutions). In addition, Mr. Thomas serves as a member of the Board of Directors of Fortune Brands, Inc. (consumer products holding company), and Interpublic Group of Companies, Inc. (marketing communication, 2004-present). |
Michael E. Wiley (58) |
| Year of Election or Appointment: 2008 Mr. Wiley also serves as a member of the Board of Trustees of the University of Tulsa (2000-2006; 2007-present). He serves as a Director of Tesoro Corporation (independent oil refiner and marketer, 2005-
present), and a Director of Bill Barrett Corporation (exploration and production company, 2005-present). In addition, he also serves as a Director of Post Oak Bank (privately-held bank, 2004-present). Previously, Mr. Wiley served as a Sr. Energy Advisor of Katzenbach Partners, LLC (consulting firm, 2006-2007), as an Advisory Director of Riverstone Holdings (private investment firm), Chairman, President, and CEO of Baker Hughes, Inc. (oilfield services company, 2000-2004), and as Director of Spinnaker Exploration Company (exploration and production company, 2001-2005). |
Advisory Board Member and Executive Officers**:
Correspondence intended for each executive officer and Mr. Lynch may be sent to Fidelity Investments, 82 Devonshire Street, Boston, Massachusetts 02109.
Name, Age; Principal Occupation |
Peter S. Lynch (64) |
| Year of Election or Appointment: 2003 Member of the Advisory Board of Fidelity's Equity and High Income Funds. Mr. Lynch is Vice Chairman and a Director of FMR, and Vice Chairman (2001-present) and a Director of FMR Co., Inc. Previously, Mr. Lynch served as a Trustee of the Fidelity funds (1990-2003). In addition, he serves as a Trustee of Boston College and as the Chairman of the Inner-City Scholarship Fund. Previously, Mr. Lynch served on the Special Olympics International Board of Directors (1997-2006). |
Kenneth B. Robins (39) |
| Year of Election or Appointment: 2008 President and Treasurer of Fidelity's Equity and High Income Funds. Mr. Robins is an employee of Fidelity Investments (2004-present). Before joining Fidelity Investments, Mr. Robins worked at KPMG LLP, where he was a partner in KPMG's department of professional practice (2002-2004). |
Walter C. Donovan (46) |
| Year of Election or Appointment: 2007 Vice President of Fidelity's Equity Funds. Mr. Donovan also serves as President of FMR and FMR Co., Inc., and Executive Vice President of Fidelity Investments Money Management, Inc. (2007-present). Previously, Mr. Donovan served as Executive Vice President of FMR and FMR Co., Inc. (2005-2007) and Senior Vice President of FMR (2003-2005) and FMR Co., Inc. (2004-2005). |
Eric M. Wetlaufer (46) |
| Year of Election or Appointment: 2006 Vice President of Fidelity's International Equity Funds. Mr. Wetlaufer also serves as Group Chief Investment Officer of FMR. Mr. Wetlaufer is Chairman, Chief Executive Officer, and President of Fidelity Management & Research (Hong Kong) Limited (2008-present); Chairman, Chief Executive Officer, President, and a Director of Fidelity Management & Research (Japan) Inc. (2008-present); Chairman and Chief Executive Officer (2007-present) and President and a Director (2006-present) of Fidelity Management & Research (U.K.) Inc. and President and a Director of Fidelity Research & Analysis Company (2006-present). Before joining Fidelity Investments in 2005, Mr. Wetlaufer was a partner in Oxhead Capital Management (2004-2005) and a Chief Investment Officer of Putnam Investments (1997-2003). |
Scott C. Goebel (40) |
| Year of Election or Appointment: 2008 Secretary and Chief Legal Officer (CLO) of the Fidelity funds. Mr. Goebel also serves as General Counsel, Secretary, and Senior Vice President of FMR (2008-present); Deputy General Counsel of FMR LLC; Chief Legal Secretary of Fidelity Management & Research (Hong Kong) Limited (2008-present) and Assistant Secretary of Fidelity Management & Research (Japan) Inc. (2008-present). Previously, Mr. Goebel served as Assistant Secretary of the Funds (2007-2008) and as Vice President and Secretary of Fidelity Distributors Corporation (FDC) (2005-2007). |
John B. McGinty, Jr. (46) |
| Year of Election or Appointment: 2008 Assistant Secretary of Fidelity's Equity and High Income Funds. Mr. McGinty is an employee of Fidelity Investments (2004-present). Mr. McGinty also serves as Senior Vice President, Secretary, and Chief Legal Officer of FDC (2007-present). Before joining Fidelity Investments, Mr. McGinty practiced law at Ropes & Gray, LLP. |
Holly C. Laurent (54) |
| Year of Election or Appointment: 2008 Anti-Money Laundering (AML) Officer of the Fidelity funds. Ms. Laurent is an employee of Fidelity Investments. Previously, Ms. Laurent was Senior Vice President and Head of Legal for Fidelity Business Services India Pvt. Ltd. (2006-2008), Senior Vice President, Deputy General Counsel and Group Head for FMR LLC (2005-2006). |
Christine Reynolds (50) |
| Year of Election or Appointment: 2008 Chief Financial Officer of the Fidelity funds. Ms. Reynolds became President of Fidelity Pricing and Cash Management Services (FPCMS) in August 2008. She served as Chief Operating Officer of FPCMS from 2007 through July 2008. Previously, Ms. Reynolds served as President, Treasurer, and Anti-Money Laundering officer of the Fidelity funds (2004-
2007). Before joining Fidelity Investments, Ms. Reynolds worked at PricewaterhouseCoopers LLP (PwC) (1980-2002), where she was an audit partner with PwC's investment management practice. |
Kenneth A. Rathgeber (61) |
| Year of Election or Appointment: 2004 Chief Compliance Officer of Fidelity's Equity and High Income Funds. Mr. Rathgeber is Chief Compliance Officer of Fidelity Management & Research (Hong Kong) Limited (2008-present), Fidelity Management & Research (Japan) Inc. (2008-present), FMR (2005-present), FMR Co., Inc. (2005-present), Fidelity Management & Research (U.K.) Inc. (2005-
present), Fidelity Research & Analysis Company (2005-present), Fidelity Investments Money Management, Inc. (2005-present), and Strategic Advisers, Inc. (2005-present). |
Bryan A. Mehrmann (47) |
| Year of Election or Appointment: 2005 Deputy Treasurer of the Fidelity funds. Mr. Mehrmann is an employee of Fidelity Investments. Previously, Mr. Mehrmann served as Vice President of Fidelity Investments Institutional Services Group (FIIS)/Fidelity Investments Institutional Operations Corporation, Inc. (FIIOC) Client Services (1998-2004). |
Adrien E. Deberghes (41) |
| Year of Election or Appointment: 2008 Deputy Treasurer of Fidelity's Equity and High Income Funds. Mr. Deberghes is an employee of Fidelity Investments (2008-present). Previously, Mr. Deberghes served as Senior Vice President of Mutual Fund Administration at State Street Corporation (2007-2008), Senior Director of Mutual Fund Administration at Investors Bank & Trust (2005-2007), and Director of Finance for Dunkin' Brands (2000-2005). |
Robert G. Byrnes (41) |
| Year of Election or Appointment: 2005 Assistant Treasurer of the Fidelity funds. Mr. Byrnes is an employee of Fidelity Investments (2005-present). Previously, Mr. Byrnes served as Vice President of Fidelity Pricing and Cash Management Services (FPCMS) (2003-2005). Before joining Fidelity Investments, Mr. Byrnes worked at Deutsche Asset Management where he served as Vice President of the Investment Operations Group (2000-2003). |
Peter L. Lydecker (54) |
| Year of Election or Appointment: 2004 Assistant Treasurer of the Fidelity funds. Mr. Lydecker is an employee of Fidelity Investments. |
Paul M. Murphy (61) |
| Year of Election or Appointment: 2007 Assistant Treasurer of the Fidelity funds. Mr. Murphy is an employee of Fidelity Investments (2007-present). Previously, Mr. Murphy served as Chief Financial Officer of the Fidelity Funds (2005-2006), Vice President and Associate General Counsel of FMR (2007), and Senior Vice President of Fidelity Pricing and Cash Management Services (FPCMS) (1994-2007). |
Gary W. Ryan (50) |
| Year of Election or Appointment: 2005 Assistant Treasurer of the Fidelity funds. Mr. Ryan is an employee of Fidelity Investments. Previously, Mr. Ryan served as Vice President of Fund Reporting in Fidelity Pricing and Cash Management Services (FPCMS) (1999-2005). |
** FMR Corp. merged with and into FMR LLC on October 1, 2007. Any references to FMR LLC for prior periods are deemed to be references to the prior entity.
Annual Report
Institutional Class designates 100% of the dividends distributed during the fiscal year as amounts which may be taken into account as a dividend for purposes of the maximum rate under section 1(h)(11) of the Internal Revenue Code.
The fund will notify shareholders in January 2009 of amounts for use in preparing 2008 income tax returns.
Annual Report
A special meeting of the fund's shareholders was held on April 16, 2008. The results of votes taken among shareholders on the proposal before them are reported below. Each vote reported represents one dollar of net asset value held on the record date for the meeting.
PROPOSAL 1 |
To elect a Board of Trustees.A |
| # of
Votes | % of
Votes |
James C. Curvey |
Affirmative | 44,485,656,811.55 | 94.702 |
Withheld | 2,488,551,854.62 | 5.298 |
TOTAL | 46,974,208,666.17 | 100.000 |
Dennis J. Dirks |
Affirmative | 44,706,671,638.31 | 95.173 |
Withheld | 2,267,537,027.86 | 4.827 |
TOTAL | 46,974,208,666.17 | 100.000 |
Edward C. Johnson 3d |
Affirmative | 44,294,881,638.16 | 94.296 |
Withheld | 2,679,327,028.01 | 5.704 |
TOTAL | 46,974,208,666.17 | 100.000 |
Alan J. Lacy |
Affirmative | 44,685,373,413.16 | 95.127 |
Withheld | 2,288,835,253.01 | 4.873 |
TOTAL | 46,974,208,666.17 | 100.000 |
Ned C. Lautenbach |
Affirmative | 44,634,541,379.41 | 95.019 |
Withheld | 2,339,667,286.76 | 4.981 |
TOTAL | 46,974,208,666.17 | 100.000 |
Joseph Mauriello |
Affirmative | 44,683,962,099.80 | 95.124 |
Withheld | 2,290,246,566.37 | 4.876 |
TOTAL | 46,974,208,666.17 | 100.000 |
Cornelia M. Small |
Affirmative | 44,671,688,375.36 | 95.098 |
Withheld | 2,302,520,290.81 | 4.902 |
TOTAL | 46,974,208,666.17 | 100.000 |
| # of
Votes | % of
Votes |
William S. Stavropoulos |
Affirmative | 44,465,262,087.61 | 94.659 |
Withheld | 2,508,946,578.56 | 5.341 |
TOTAL | 46,974,208,666.17 | 100.000 |
David M. Thomas |
Affirmative | 44,694,340,813.87 | 95.147 |
Withheld | 2,279,867,852.30 | 4.853 |
TOTAL | 46,974,208,666.17 | 100.000 |
Michael E. Wiley |
Affirmative | 44,686,513,174.78 | 95.130 |
Withheld | 2,287,695,491.39 | 4.870 |
TOTAL | 46,974,208,666.17 | 100.000 |
A Denotes trust-wide proposal and voting results.
Annual Report
Board Approval of Investment Advisory Contracts and Management Fees
Fidelity International Growth Fund
Each year, typically in July, the Board of Trustees, including the Independent Trustees (together, the Board), votes on the renewal of the management contract and sub-advisory agreements (together, the Advisory Contracts) for the fund. The Board, assisted by the advice of fund counsel and Independent Trustees' counsel, requests and considers a broad range of information throughout the year.
The Board meets regularly and, acting directly and through its separate committees, requests and receives information concerning, and considers at each of its meetings factors that are relevant to, its annual consideration of the renewal of the fund's Advisory Contracts, including the services and support provided to the fund and its shareholders. At the time of the renewal, the Board had 12 standing committees, each composed of Independent Trustees with varying backgrounds, to which the Board has assigned specific subject matter responsibilities in order to enhance effective decision-making by the Board. Each committee has a written charter outlining the structure and purposes of the committee. The Board also meets as needed to consider matters specifically related to the Board's annual consideration of the renewal of Advisory Contracts.
At its July 2008 meeting, the Board of Trustees, including the Independent Trustees, unanimously determined to renew the fund's Advisory Contracts. In reaching its determination, the Board considered all factors it believed relevant, including (i) the nature, extent, and quality of the services to be provided to the fund and its shareholders (including the investment performance of the fund); (ii) the competitiveness of the fund's management fee and total expenses; (iii) the total costs of the services to be provided by and the profits to be realized by Fidelity from its relationship with the fund; (iv) the extent to which economies of scale would be realized as the fund grows; and (v) whether fee levels reflect these economies of scale, if any, for the benefit of fund shareholders. The Board also approved agreements with foreign sub-advisers Fidelity Management & Research (Japan) Inc. and Fidelity Management & Research (Hong Kong) Limited, as well as amendments to the fund's agreement with Fidelity Management & Research (U.K.) Inc.
In considering whether to renew the Advisory Contracts for the fund, the Board ultimately reached a determination, with the assistance of fund counsel and Independent Trustees' counsel and through the exercise of its business judgment, that the renewal of the Advisory Contracts and the compensation to be received by Fidelity under the management contract is consistent with Fidelity's fiduciary duty under applicable law. The Board's decision to renew the Advisory Contracts was not based on any single factor noted above, but rather was based on a comprehensive consideration of all the information provided to the Board at its meetings throughout the year. The Board, in reaching its determination to renew the Advisory Contracts, is aware that shareholders in the fund have a broad range of investment choices available to them, including a wide choice among mutual funds offered by competitors to Fidelity, and that the fund's shareholders, with the opportunity to review and weigh the disclosure provided by the fund in its prospectus and other public disclosures, have chosen to invest in this fund, managed by Fidelity.
Annual Report
Board Approval of Investment Advisory Contracts and
Management Fees - continued
Nature, Extent, and Quality of Services Provided. The Board considered staffing within the investment adviser, FMR, and the sub-advisers (together, the Investment Advisers), including the backgrounds of the fund's investment personnel and the fund's investment objective and discipline. The Independent Trustees also had discussions with senior management of Fidelity's investment operations and investment groups. The Board considered the structure of the portfolio manager compensation program and whether this structure provides appropriate incentives.
Resources Dedicated to Investment Management and Support Services. The Board reviewed the size, education, and experience of the Investment Advisers' investment staff, their use of technology, and the Investment Advisers' approach to recruiting, training, and retaining portfolio managers and other research, advisory, and management personnel. The Board noted that Fidelity's analysts have access to a variety of technological tools that enable them to perform both fundamental and quantitative analysis and to specialize in various disciplines. The Board considered Fidelity's extensive global research capabilities that enable the Investment Advisers to aggregate data from various sources in an effort to produce positive investment results. The Board also considered that Fidelity's portfolio managers and analysts have access to daily portfolio attribution that allows for monitoring of a fund's portfolio, as well as an electronic communication system that provides immediate real-time access to research concerning issuers and credit enhancers.
Shareholder and Administrative Services. The Board considered (i) the nature, extent, quality, and cost of advisory, administrative, distribution, and shareholder services performed by the Investment Advisers and their affiliates under the Advisory Contracts and under separate agreements covering transfer agency, pricing and bookkeeping, and securities lending services for the fund; (ii) the nature and extent of the Investment Advisers' supervision of third party service providers, principally custodians and subcustodians; and (iii) the resources devoted to, and the record of compliance with, the fund's compliance policies and procedures. The Board also reviewed the allocation of fund brokerage, including allocations to brokers affiliated with the Investment Advisers, the use of brokerage commissions to pay fund expenses, and the use of "soft" commission dollars to pay for research services. The Board further considered that Fidelity voluntarily pays for market data out of its own resources.
The Board noted that the growth of fund assets across the complex allows Fidelity to reinvest in the development of services designed to enhance the value or convenience of the Fidelity funds as investment vehicles. These services include 24-hour access to account information and market information through phone representatives and over the Internet, and investor education materials and asset allocation tools.
Annual Report
Investment in a Large Fund Family. The Board considered the benefits to shareholders of investing in a Fidelity fund, including the benefits of investing in a fund that is part of a large family of funds offering a variety of investment disciplines and providing for a large variety of mutual fund investor services. For example, fund shareholders are offered the privilege of exchanging shares of the fund for shares of other Fidelity funds, as set forth in the fund's prospectus, without paying a sales charge. The Board noted that Fidelity has taken a number of actions over the previous year that benefited particular funds, including (i) dedicating additional resources to investment research and to restructure the investment research teams; (ii) contractually agreeing to reduce the management fees on Fidelity's Institutional Money Market Funds and launching Class IV and Institutional Class of certain of these funds; (iii) reducing the transfer agent fees for the Fidelity Select Portfolios and Investor Class of the VIP funds; and (iv) launching Class K of 29 equity funds as a lower-fee class available to certain employer-sponsored retirement plans.
Investment Performance. The Board considered whether the fund has operated within its investment objective, as well as its record of compliance with its investment restrictions. The Board noted that it is not possible to evaluate performance in any comprehensive fashion because the fund had been in operation for less than one calendar year. Once the fund has been in operation for at least one calendar year, the Board will review the fund's absolute investment performance for each class, as well as the fund's relative investment performance for each class measured against a broad-based securities market index and a peer group of mutual funds.
The Board considered that FMR has taken steps to refocus and strengthen equity research, equity portfolio management, and compliance.
Based on its review, and giving particular weight to the nature and quality of the resources dedicated by the Investment Advisers to maintain and improve relative performance, the Board concluded that the nature, extent, and quality of the services provided to the fund will benefit the fund's shareholders, particularly in light of the Board's view that the fund's shareholders benefit from investing in a fund that is part of a large family of funds offering a variety of investment disciplines and services.
Competitiveness of Management Fee and Total Fund Expenses. The Board considered the fund's management fee and total expenses compared to "mapped groups" of competitive funds and classes. Fidelity creates "mapped groups" by combining similar Lipper investment objective categories that have comparable management fee characteristics. Combining Lipper investment objective categories aids the Board's management fee and total expense comparisons by broadening the competitive group used for comparison and by reducing the number of universes to which various Fidelity funds are compared. The Board also considered supplemental information about how the fund's management fee and total expenses ranked relative to groups based on Lipper classifications, which take into account a fund's market capitalization and style.
Annual Report
Board Approval of Investment Advisory Contracts and
Management Fees - continued
The Board considered two proprietary management fee comparisons for the period of the fund's operations shown in the chart below. The group of Lipper funds used by the Board for management fee comparisons is referred to below as the "Total Mapped Group." The Total Mapped Group comparison focuses on a fund's standing relative to the total universe of comparable funds available to investors, in terms of gross management fees before expense reimbursements or caps. "TMG %" represents the percentage of funds in the Total Mapped Group that had management fees that were lower than the fund's. For example, a TMG % of 14% means that 86% of the funds in the Total Mapped Group had higher management fees than the fund. The "Asset-Size Peer Group" (ASPG) comparison focuses on a fund's standing relative to non-Fidelity funds similar in size to the fund within the Total Mapped Group. The ASPG represents at least 15% of the funds in the Total Mapped Group with comparable asset size and management fee characteristics, subject to a minimum of 50 funds (or all funds in the Total Mapped Group if fewer than 50). Additional information, such as the ASPG quartile in which the fund's management fee ranked, is also included in the chart and considered by the Board.
Fidelity International Growth Fund

The Board noted that the fund's management fee ranked below the median of its Total Mapped Group and below the median of its ASPG for the period.
Furthermore, the Board considered that the fund's management fee includes a performance adjustment component (that is, the fund's management fee will be subject to upward or downward adjustment depending upon whether, and to what extent, the fund's investment performance for the performance period exceeds, or is exceeded by, the record (over the same period) of a Board-approved performance adjustment index). The performance period commenced on November 1, 2007. Starting with the twelfth month, the performance adjustment takes effect.
Annual Report
Based on its review, the Board concluded that the fund's management fee was fair and reasonable in light of the services that the fund receives and the other factors considered.
In its review of each class's total expenses, the Board considered the fund's management fee as well as other fund or class expenses, as applicable, such as transfer agent fees, pricing and bookkeeping fees, fund-paid 12b-1 fees, and custodial, legal, and audit fees. The Board also noted the effects of any waivers and reimbursements on fees and expenses. As part of its review, the Board also considered current and historical total expenses of each class of the fund compared to competitive fund median expenses. Each class of the fund is compared to those funds and classes in the Total Mapped Group (used by the Board for management fee comparisons) that have a similar sales load structure.
The Board noted that the total expenses of each of Class A and Fidelity International Growth (retail class) ranked equal to its competitive median for the period, and the total expenses of Class T, Class B, Class C, and Institutional Class ranked above its competitive median for the period. The Board noted that the fund offers multiple classes, each of which has a different sales load and 12b-1 fee structure, and that the multiple structures are intended to offer a range of pricing options for the intermediary market. The Board also noted that the total expenses of the classes vary primarily by the level of their 12b-1 fees, although differences in transfer agent fees may also cause expenses to vary from class to class.
In its review of total expenses, the Board also considered Fidelity fee structures and other information on clients that FMR and its affiliates service in other competitive markets, such as other mutual funds advised or subadvised by FMR or its affiliates, pension plan clients, and other institutional clients.
Based on its review, the Board concluded that the total expenses of each class of the fund were reasonable, although in some cases above the median of the universe presented for comparison, in light of the services that the fund and its shareholders receive and the other factors considered.
Costs of the Services and Profitability. The Board considered the revenues earned and the expenses incurred by Fidelity in conducting the business of developing, marketing, distributing, managing, administering and servicing the fund and its shareholders. The Board also considered the level of Fidelity's profits in respect of all the Fidelity funds.
Annual Report
Board Approval of Investment Advisory Contracts and
Management Fees - continued
On an annual basis, FMR presents to the Board Fidelity's profitability for the fund. Fidelity calculates the profitability for each fund, as well as aggregate profitability for groups of Fidelity funds and all Fidelity funds, using a series of detailed revenue and cost allocation methodologies which originate with the audited books and records of Fidelity. The Audit Committee of the Board reviews any significant changes from the prior year's methodologies.
PricewaterhouseCoopers LLP (PwC), independent registered public accounting firm and auditor to Fidelity and certain Fidelity funds, has been engaged annually by the Board as part of the Board's assessment of the results of Fidelity's profitability analysis. PwC's engagement includes the review and assessment of Fidelity's methodologies used in determining the revenues and expenses attributable to Fidelity's mutual fund business, and completion of agreed-upon procedures surrounding the mathematical accuracy of fund profitability and its conformity to allocation methodologies. After considering PwC's reports issued under the engagement and information provided by Fidelity, the Board believes that while other allocation methods may also be reasonable, Fidelity's profitability methodologies are reasonable in all material respects.
The Board has also reviewed Fidelity's non-fund businesses and any fall-out benefits related to the mutual fund business as well as cases where Fidelity's affiliates may benefit from or be related to the fund's business.
The Board considered the costs of the services provided by and the profits realized by Fidelity in connection with the operation of the fund and determined that the amount of profit is a fair entrepreneurial profit for the management of the fund.
Economies of Scale. The Board considered whether there have been economies of scale in respect of the management of the Fidelity funds, whether the Fidelity funds (including the fund) have appropriately benefited from any such economies of scale, and whether there is potential for realization of any further economies of scale. The Board considered the extent to which the fund will benefit from economies of scale through increased services to the fund, through waivers or reimbursements, or through fee or expense reductions.
The Board recognized that the fund's management contract incorporates a "group fee" structure, which provides for lower group fee rates as total fund assets under FMR's management increase, and for higher group fee rates as total fund assets under FMR's management decrease. FMR determines the group fee rates based on a tiered asset "breakpoint" schedule. The Board considered that the group fee is designed to deliver the benefits of economies of scale to fund shareholders when total fund assets increase, even if assets of any particular fund are unchanged or have declined, because some portion of Fidelity's costs are attributable to services provided to all Fidelity funds, and all funds benefit if those costs can be allocated among more assets. The Board concluded that, given the group fee structure, fund shareholders will achieve a certain level of economies of scale as assets under FMR's management increase at the fund complex level, regardless of whether Fidelity achieves any such economies of scale.
Annual Report
The Board further concluded that any potential economies of scale are being shared between fund shareholders and Fidelity in an appropriate manner.
Additional Information Requested by the Board. In order to develop fully the factual basis for consideration of the Fidelity funds' Advisory Contracts, the Board requested and received additional information on certain topics, including (i) fund performance trends and actions to be taken by FMR to improve certain funds' overall performance; (ii) portfolio manager changes that have occurred during the past year; (iii) Fidelity's fund profitability methodology, the profitability of certain fund service providers, and profitability trends for certain funds; (iv) Fidelity's compensation structure for portfolio managers and key personnel, including its effects on fund profitability and the extent to which portfolio manager compensation is linked to fund performance; (v) Fidelity's fee structures and rationale for recommending different fees among categories of funds; and (vi) Fidelity's rationale for recommending which funds should have a performance adjustment component as part of their management fees.
Based on its evaluation of all of the conclusions noted above, and after considering all material factors, the Board ultimately concluded that the advisory fee structures are fair and reasonable, and that the fund's Advisory Contracts should be renewed.
Annual Report
Investment Adviser
Fidelity Management & Research Company
Boston, MA
Investment Sub-Advisers
FMR Co., Inc.
Fidelity Management & Research
(U.K.) Inc.
Fidelity Management & Research
(Hong Kong) Limited
Fidelity Management & Research
(Japan) Inc.
Fidelity Research & Analysis Company
FIL Investment Advisors
Fidelity Investments Japan Limited
FIL Investment Advisors (U.K.) Ltd.
General Distributor
Fidelity Distributors Corporation
Boston, MA
Transfer and Service Agents
Fidelity Investments Institutional Operations Company, Inc.
Boston, MA
Fidelity Service Company, Inc.
Boston, MA
Custodian
State Street Bank and Trust Company
Quincy, MA
AIGFI-UANN-1208
1.853341.100
(Fidelity Investment logo)(registered trademark)
Fidelity Advisor
Total International Equity
Fund - Class A, Class T, Class B
and Class C
Annual Report
October 31, 2008
Class A, Class T,
Class B, and Class C are
classes of Fidelity® Total
International Equity Fund
(2_fidelity_logos) (Registered_Trademark)
Contents
Chairman's Message | <Click Here> | Ned Johnson's message to shareholders. |
Performance | <Click Here> | How the fund has done over time. |
Management's Discussion | <Click Here> | The managers' review of fund performance, strategy and outlook. |
Shareholder Expense Example | <Click Here> | An example of shareholder expenses. |
Investment Changes | <Click Here> | A summary of major shifts in the fund's investments over the past six months. |
Investments | <Click Here> | A complete list of the fund's investments with their market values. |
Financial Statements | <Click Here> | Statements of assets and liabilities, operations, and changes in net assets, as well as financial highlights. |
Notes | <Click Here> | Notes to financial statements. |
Report of Independent Registered Public Accounting Firm | <Click Here> | |
Trustees and Officers | <Click Here> | |
Distributions | <Click Here> | |
Proxy Voting Results | <Click Here> | |
Board Approval of Investment Advisory Contracts and Management Fees | <Click Here> | |
To view a fund's proxy voting guidelines and proxy voting record for the 12-month period ended June 30, visit http://www.fidelity.com (search for "proxy voting guidelines") or visit the Securities and Exchange Commission's (SEC) web site at http://www.sec.gov. You may also call 1-877-208-0098 to request a free copy of the proxy voting guidelines.
Standard & Poor's, S&P and S&P 500 are registered service marks of The McGraw-Hill Companies, Inc. and have been licensed for use by Fidelity Distributors Corporation.
Other third party marks appearing herein are the property of their respective owners.
All other marks appearing herein are registered or unregistered trademarks or service marks of FMR LLC or an affiliated company.
Annual Report
This report and the financial statements contained herein are submitted for the general information of the shareholders of the fund. This report is not authorized for distribution to prospective investors in the fund unless preceded or accompanied by an effective prospectus.
A fund files its complete schedule of portfolio holdings with the SEC for the first and third quarters of each fiscal year on Form N-Q. Forms N-Q are available on the SEC's web site at http://www.sec.gov. A fund's Forms N-Q may be reviewed and copied at the SEC's Public Reference Room in Washington, DC. Information regarding the operation of the SEC's Public Reference Room may be obtained by calling 1-800-SEC-0330. For a complete list of a fund's portfolio holdings, view the most recent holdings listing, semiannual report, or annual report on Fidelity's web site at http://www.fidelity.com or http://www.advisor.fidelity.com, as applicable.
NOT FDIC INSURED · MAY LOSE VALUE · NO BANK GUARANTEE
Neither the fund nor Fidelity Distributors Corporation is a bank.
Annual Report
(photo_of_Edward_C_Johnson_3d)
Dear Shareholder:
Turmoil has been the watchword for the world's securities markets in 2008, with domestic and international stocks down sharply amid the global credit squeeze. A flight to quality boosted returns for U.S. Treasuries, one of the few asset classes with positive results heading into the latter stages of the year. Financial markets are always unpredictable, but there are a number of time-tested principles that can put the historical odds in your favor.
One of the basic tenets is to invest for the long term. Over time, riding out the markets' inevitable ups and downs has proven much more effective than selling into panic or chasing the hottest trend. Even missing only a few of the markets' best days can significantly diminish investor returns. Patience also affords the benefits of compounding - of earning interest on additional income or reinvested dividends and capital gains. There are tax advantages and cost benefits to consider as well. The more you sell, the more taxes you pay, and the more you trade, the higher the costs. While staying the course doesn't eliminate risk, it can considerably lessen the effect of short-term declines.
You can further manage your investing risk through diversification. And today, more than ever, geographic diversification should be taken into account. Studies indicate that asset allocation is the single most important determinant of a portfolio's long-term success. The right mix of stocks, bonds and cash - aligned to your particular risk tolerance and investment objective - is very important. Age-appropriate rebalancing is also an essential aspect of asset allocation. For younger investors, an emphasis on equities - which historically have been the best-performing asset class over time - is encouraged. As investors near their specific goal, such as retirement or sending a child to college, consideration may be given to replacing volatile assets (e.g. common stocks) with more-stable fixed investments (bonds or savings plans).
A third investment principle - investing regularly - can help lower the average cost of your purchases. Investing a certain amount of money each month or quarter helps ensure you won't pay for all your shares at market highs. This strategy - known as dollar cost averaging - also reduces unconstructive "emotion" from investing, helping shareholders avoid selling weak performers just prior to an upswing, or chasing a hot performer just before a correction.
We invite you to contact us via the Internet, through our Investor Centers or over the phone. It is our privilege to provide you the information you need to make the investments that are right for you.
Sincerely,
/s/Edward C. Johnson 3d
Edward C. Johnson 3d
Annual Report
Average annual total return reflects the change in the value of an investment, assuming reinvestment of the class' dividend income and capital gains (the profits earned upon the sale of securities that have grown in value, if any) and assuming a constant rate of performance each year. The $10,000 table and the fund's returns do not reflect the deduction of taxes that a shareholder would pay on fund distributions or the redemption of fund shares. During periods of reimbursement by Fidelity, a fund's total return will be greater than it would be had the reimbursement not occurred. How a fund did yesterday is no guarantee of how it will do tomorrow.
Average annual total returns take Fidelity Total International Equity Fund's cumulative total return and show you what would have happened if Fidelity Total International Equity Fund's shares had performed at a constant rate each year. These numbers will be reported once the fund is a year old.
$10,000 Over Life of Fund
Let's say hypothetically that $10,000 was invested in Fidelity® Advisor Total International Equity Fund - Class A on November 1, 2007, when the fund started, and the current 5.75% sales charge was paid. The chart shows how the value of your investment would have changed, and also shows how the MSCI® ACWISM (All Country World Index) ex USA Index performed over the same period.
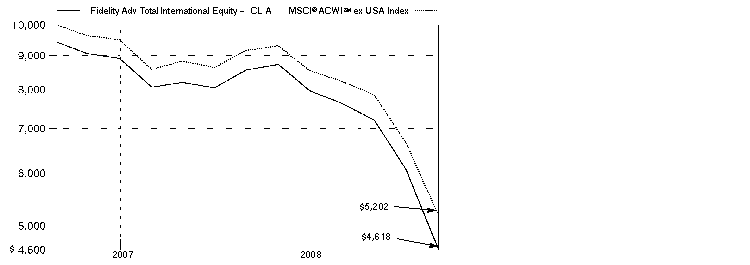
Annual Report
Comments from George Stairs and Jed Weiss, Co-Lead Portfolio Managers of Fidelity Advisor Total International Equity Fund
In a dramatic reversal of what had been a multiyear global growth story, international stocks fell long and hard during the 12 months ending October 31, 2008, especially so during the latter stages of the period and mostly as a result of fallout from the financial crisis that emanated from the United States. The viral spread of this financial contagion - which began in the U.S. subprime mortgage market, then seized up the credit markets, hobbled major financial institutions and eventually slowed economic growth worldwide - left virtually no corner of the globe untouched. Developed international equity markets - as gauged by the MSCI® Europe, Australasia, Far East (EAFE®) Index, which monitors established markets outside the U.S. and Canada - fell 46.54%, while the Standard & Poor's 500SM Index, a measure of U.S. stocks, dropped 36.10%. Among countries constituting at least 1% of the EAFE index, Switzerland had the "least worst" showing, falling roughly 32%, followed by Japan, where stocks slid by around 37%. Meanwhile, the weakest overall performance came from Belgium, where stocks slipped by nearly 70%. In the United Kingdom, the largest component of the index, equities were down almost 48%. Emerging markets were the weakest performers among the global economies, declining 56.22% as measured by the MSCI Emerging Markets Index.
For the period from their inception on November 1, 2007, through October 31, 2008, the fund's Class A, Class T, Class B and Class C shares fell 51.00%, 51.20%, 51.40% and 51.40%, respectively (excluding sales charges), versus a decline of 47.98% for the MSCI All Country World ex USA Index. We underperformed the index mainly due to unfavorable security selection, with the greatest damage coming from our picks in financials, consumer discretionary, energy and materials, which were among the weakest sectors of the global economy. The biggest relative detractors were German automaker Volkswagen, an index component we didn't own that had an extraordinary gain late in the period; European banking companies UniCredit, based in Italy, and HBOS, headquartered in Scotland; and Petroleum Geo-Services, a Norwegian energy services firm. The fund gained back some ground versus the index due to our decision to lengthen the fund's overexposure to the more-defensive areas of the index, while creating greater underweightings in the weakest sectors. Among holdings that contributed to the fund's relative performance were such defensively oriented stocks as Roche Holding, the giant Swiss drug maker; Nestle, a multinational packaged goods company also based in Switzerland; and Osaka Gas, a Japanese natural gas utility.
The views expressed above reflect those of the portfolio manager(s) only through the end of the period as stated on the cover of this report and do not necessarily represent the views of Fidelity or any other person in the Fidelity organization. Any such views are subject to change at any time based upon market or other conditions and Fidelity disclaims any responsibility to update such views. These views may not be relied on as investment advice and, because investment decisions for a Fidelity fund are based on numerous factors, may not be relied on as an indication of trading intent on behalf of any Fidelity fund.
Annual Report
Fidelity Total International Equity Fund
Shareholder Expense Example
As a shareholder of the Fund, you incur two types of costs: (1) transaction costs, including sales charges (loads) on purchase payments or redemption proceeds, redemption fees, and (2) ongoing costs, including management fees, distribution and/or service (12b-1) fees and other Fund expenses. This Example is intended to help you understand your ongoing costs (in dollars) of investing in the Fund and to compare these costs with the ongoing costs of investing in other mutual funds.
The Example is based on an investment of $1,000 invested at the beginning of the period and held for the entire period (May 1, 2008 to October 31, 2008).
Actual Expenses
The first line of the accompanying table for each class of the Fund provides information about actual account values and actual expenses. You may use the information in this line, together with the amount you invested, to estimate the expenses that you paid over the period. Simply divide your account value by $1,000.00 (for example, an $8,600 account value divided by $1,000.00 = 8.6), then multiply the result by the number in the first line for a class of the Fund under the heading entitled "Expenses Paid During Period" to estimate the expenses you paid on your account during this period. A small balance maintenance fee of $12.00 that is charged once a year may apply for certain accounts with a value of less than $2,000. This fee is not included in the table below. If it was, the estimate of expenses you paid during the period would be higher, and your ending account value lower, by this amount. In addition, the Fund, as a shareholder in the underlying Fidelity Central Funds, will indirectly bear its pro rata share of the fees and expenses incurred by the underlying Fidelity Central Funds. These fees and expenses are not included in the Fund's annualized expense ratio used to calculate the expense estimate in the table below.
Hypothetical Example for Comparison Purposes
The second line of the accompanying table for each class of the Fund provides information about hypothetical account values and hypothetical expenses based on a Class' actual expense ratio and an assumed rate of return of 5% per year before expenses, which is not the Class' actual return. The hypothetical account values and expenses may not be used to estimate the actual ending account balance or expenses you paid for the period. You may use this information to compare the ongoing costs of investing in the Fund and other funds. To do so, compare this 5% hypothetical example with the 5% hypothetical examples that appear in the shareholder reports of the other funds. A small balance maintenance fee of $12.00 that is charged once a year may apply for certain accounts with a value of less than $2,000. This fee is not included in the table below. If it was, the estimate of expenses you paid during the period would be higher, and your ending account value lower, by this amount. In addition, the Fund, as a shareholder in the underlying Fidelity Central Funds, will indirectly bear its pro rata share of the fees and expenses incurred by the underlying Fidelity Central Funds. These fees and expenses are not included in the Fund's annualized expense ratio used to calculate the expense estimate in the table below.
Annual Report
Fidelity Total International Equity Fund
Shareholder Expense Example - continued
Please note that the expenses shown in the table are meant to highlight your ongoing costs only and do not reflect any transaction costs. Therefore, the second line of the table is useful in comparing ongoing costs only, and will not help you determine the relative total costs of owning different funds. In addition, if these transactional costs were included, your costs would have been higher.
| Annualized Expense Ratio | Beginning
Account Value
May 1, 2008 | Ending
Account Value
October 31, 2008 | Expenses Paid
During Period*
May 1, 2008
to October 31, 2008 |
Class A | 1.50% | | | |
Actual | | $ 1,000.00 | $ 539.60 | $ 5.81 |
HypotheticalA | | $ 1,000.00 | $ 1,017.60 | $ 7.61 |
Class T | 1.75% | | | |
Actual | | $ 1,000.00 | $ 538.00 | $ 6.77 |
HypotheticalA | | $ 1,000.00 | $ 1,016.34 | $ 8.87 |
Class B | 2.25% | | | |
Actual | | $ 1,000.00 | $ 537.00 | $ 8.69 |
HypotheticalA | | $ 1,000.00 | $ 1,013.83 | $ 11.39 |
Class C | 2.25% | | | |
Actual | | $ 1,000.00 | $ 537.00 | $ 8.69 |
HypotheticalA | | $ 1,000.00 | $ 1,013.83 | $ 11.39 |
Total International Equity | 1.25% | | | |
Actual | | $ 1,000.00 | $ 540.20 | $ 4.84 |
HypotheticalA | | $ 1,000.00 | $ 1,018.85 | $ 6.34 |
Institutional Class | 1.25% | | | |
Actual | | $ 1,000.00 | $ 540.20 | $ 4.84 |
HypotheticalA | | $ 1,000.00 | $ 1,018.85 | $ 6.34 |
A 5% return per year before expenses
* Expenses are equal to each Class' annualized expense ratio, multiplied by the average account value over the period, multiplied by 184/366 (to reflect the one-half year period).
Annual Report
Fidelity Total International Equity Fund
Investment Changes (Unaudited)
Geographic Diversification (% of fund's net assets) |
As of October 31, 2008 |
| Japan 14.1% |
| United Kingdom 13.8% |
| Switzerland 11.0% |
| Germany 8.7% |
| France 7.2% |
| United States of America 6.9% |
| Australia 3.6% |
| Spain 3.1% |
| Italy 2.4% |
| Other 29.2% |

Percentages are adjusted for the effect of futures contracts, if applicable. |
As of April 30, 2008 |
| United Kingdom 14.5% |
| Japan 12.8% |
| Germany 8.7% |
| France 6.7% |
| Switzerland 6.7% |
| United States of America 6.0% |
| Spain 3.6% |
| Australia 3.5% |
| Brazil 3.4% |
| Other 34.1% |

Percentages are adjusted for the effect of futures contracts, if applicable. |
Asset Allocation as of October 31, 2008 |
| % of fund's
net assets | % of fund's net assets
6 months ago |
Stocks and Investment Companies | 98.4 | 98.2 |
Short-Term Investments and Net Other Assets | 1.6 | 1.8 |
Top Ten Stocks as of October 31, 2008 |
| % of fund's
net assets | % of fund's net assets
6 months ago |
Roche Holding AG (participation certificate) (Switzerland, Pharmaceuticals) | 3.5 | 2.0 |
Nestle SA (Reg.) (Switzerland, Food Products) | 3.4 | 1.9 |
E.ON AG (Germany, Electric Utilities) | 2.8 | 2.1 |
Royal Dutch Shell PLC Class A sponsored ADR (United Kingdom, Oil, Gas & Consumable Fuels) | 2.1 | 1.3 |
Toyota Motor Corp. (Japan, Automobiles) | 1.7 | 1.3 |
Telefonica SA sponsored ADR (Spain, Diversified Telecommunication Services) | 1.4 | 1.1 |
Novartis AG sponsored ADR (Switzerland, Pharmaceuticals) | 1.4 | 0.0 |
CSL Ltd. (Australia, Biotechnology) | 1.4 | 0.9 |
Muenchener Rueckversicherungs-Gesellschaft AG (Reg.) (Germany, Insurance) | 1.4 | 0.9 |
BAE Systems PLC (United Kingdom, Aerospace & Defense) | 1.3 | 0.8 |
| 20.4 | |
Market Sectors as of October 31, 2008 |
| % of fund's
net assets | % of fund's net assets
6 months ago |
Financials | 22.9 | 22.2 |
Consumer Staples | 12.9 | 9.2 |
Energy | 10.1 | 10.8 |
Health Care | 9.8 | 5.0 |
Industrials | 8.5 | 11.1 |
Information Technology | 7.9 | 10.4 |
Materials | 7.0 | 11.0 |
Telecommunication Services | 6.7 | 5.7 |
Consumer Discretionary | 6.6 | 7.1 |
Utilities | 6.0 | 5.1 |
Annual Report
Fidelity Total International Equity Fund
Investments October 31, 2008
Showing Percentage of Net Assets
Common Stocks - 97.9% |
| Shares | | Value |
Australia - 3.6% |
AMP Ltd. | 40,791 | | $ 148,301 |
CSL Ltd. | 22,484 | | 546,518 |
Macquarie Airports unit | 50,093 | | 71,204 |
Macquarie Group Ltd. | 3,701 | | 73,386 |
Macquarie Infrastructure Group unit | 69,883 | | 91,550 |
QBE Insurance Group Ltd. | 4,764 | | 81,236 |
Silex Systems Ltd. (a) | 10,000 | | 26,037 |
Sino Gold Mining Ltd. (a) | 4,504 | | 10,369 |
Woolworths Ltd. | 21,457 | | 399,784 |
TOTAL AUSTRALIA | | 1,448,385 |
Bahrain - 0.0% |
Gulf Finance House BSC GDR (b) | 400 | | 6,800 |
Belgium - 0.4% |
InBev SA | 3,600 | | 145,199 |
Bermuda - 0.5% |
China Solar Energy Holding Ltd. (a) | 140,000 | | 829 |
ChipMOS TECHNOLOGIES (Bermuda) Ltd. (a) | 6,000 | | 3,066 |
Credicorp Ltd. (NY Shares) | 500 | | 19,635 |
Global Digital Creations Holdings Ltd. (a) | 64,000 | | 734 |
Ports Design Ltd. | 47,500 | | 55,222 |
Seadrill Ltd. | 13,600 | | 130,941 |
West Siberian Resources Ltd. SDR (a) | 14,000 | | 5,661 |
TOTAL BERMUDA | | 216,088 |
Brazil - 2.3% |
America Latina Logistica SA unit | 3,700 | | 17,062 |
Anhanguera Educacional Participacoes SA unit | 1,418 | | 10,483 |
Banco Bradesco SA: | | | |
(PN) | 6,000 | | 68,894 |
(PN) sponsored ADR | 1,100 | | 12,870 |
Banco Daycoval SA (PN) | 5,400 | | 13,474 |
BM&F BOVESPA SA | 7,000 | | 18,598 |
Companhia Siderurgica Nacional SA (CSN) sponsored ADR | 1,300 | | 17,680 |
Companhia Vale do Rio Doce sponsored ADR | 9,800 | | 128,576 |
GVT Holding SA (a) | 900 | | 9,793 |
Medial Saude SA | 700 | | 2,199 |
MRV Engenharia e Participacoes SA | 1,300 | | 6,734 |
Net Servicos de Comunicacao SA sponsored ADR | 2,400 | | 15,696 |
Petroleo Brasileiro SA - Petrobras: | | | |
(PN) sponsored ADR (non-vtg.) | 3,100 | | 68,417 |
sponsored ADR | 12,500 | | 336,125 |
Common Stocks - continued |
| Shares | | Value |
Brazil - continued |
Redecard SA | 1,000 | | $ 10,863 |
Tele Norte Leste Participacoes SA sponsored ADR (non-vtg.) | 1,200 | | 16,296 |
Uniao de Bancos Brasileiros SA (Unibanco) GDR | 2,600 | | 164,008 |
Votorantim Celulose e Papel SA sponsored ADR (non-vtg.) | 700 | | 7,063 |
TOTAL BRAZIL | | 924,831 |
Canada - 1.7% |
Addax Petroleum, Inc. | 500 | | 7,464 |
Agnico-Eagle Mines Ltd. | 3,700 | | 102,058 |
Canadian Natural Resources Ltd. | 900 | | 45,396 |
First Quantum Minerals Ltd. | 3,700 | | 77,940 |
Goldcorp, Inc. | 8,100 | | 151,413 |
Harry Winston Diamond Corp. | 4,200 | | 40,927 |
Nexen, Inc. | 3,200 | | 50,794 |
Petrobank Energy & Resources Ltd. (a) | 3,700 | | 70,576 |
Potash Corp. of Saskatchewan, Inc. | 800 | | 68,208 |
Sino-Forest Corp. (a) | 700 | | 6,548 |
SouthGobi Energy Resources Ltd. (a) | 800 | | 5,573 |
Timminco Ltd. (a) | 10,000 | | 56,394 |
TOTAL CANADA | | 683,291 |
Cayman Islands - 2.0% |
AAC Acoustic Technology Holdings, Inc. (a) | 14,000 | | 7,299 |
AirMedia Group, Inc. ADR | 100 | | 588 |
Chaoda Modern Agriculture (Holdings) Ltd. | 188,900 | | 133,084 |
China Digital TV Holding Co. Ltd. ADR | 1,300 | | 7,787 |
China Dongxiang Group Co. Ltd. | 126,000 | | 37,068 |
China High Speed Transmission Equipment Group Co. Ltd. | 50,000 | | 39,638 |
Foxconn International Holdings Ltd. (a) | 23,000 | | 8,463 |
Himax Technologies, Inc. sponsored ADR | 30,300 | | 56,661 |
Intime Department Store Group Co. Ltd. | 64,000 | | 18,948 |
LDK Solar Co. Ltd. sponsored ADR (a) | 2,000 | | 36,320 |
SinoCom Software Group Ltd. | 154,000 | | 11,138 |
Subsea 7, Inc. (a) | 4,500 | | 35,770 |
The United Laboratories International Holdings Ltd. | 34,000 | | 8,071 |
Transocean, Inc. (a) | 4,420 | | 363,899 |
Xinao Gas Holdings Ltd. | 12,000 | | 10,459 |
Yingli Green Energy Holding Co. Ltd. ADR (a) | 3,900 | | 20,553 |
TOTAL CAYMAN ISLANDS | | 795,746 |
China - 1.6% |
China Communications Construction Co. Ltd. (H Shares) | 22,000 | | 15,583 |
China Construction Bank Corp. (H Shares) | 247,000 | | 122,531 |
Common Stocks - continued |
| Shares | | Value |
China - continued |
China Gas Holdings Ltd. | 104,000 | | $ 8,561 |
China Merchants Bank Co. Ltd. (H Shares) | 17,000 | | 26,045 |
China Nepstar Chain Drugstore Ltd. ADR | 100 | | 415 |
China Shenhua Energy Co. Ltd. (H Shares) | 10,500 | | 19,935 |
China South Locomotive & Rolling Stock Corp. Ltd. (H Shares) | 50,000 | | 18,101 |
China TechFaith Wireless Communication Technology Ltd. sponsored ADR (a) | 5,000 | | 4,450 |
China Yurun Food Group Ltd. | 16,000 | | 19,017 |
Dongfang Electric Corp. Ltd. | 6,000 | | 11,680 |
Focus Media Holding Ltd. ADR (a) | 2,500 | | 46,325 |
Global Bio-Chem Technology Group Co. Ltd. | 580,000 | | 80,833 |
Golden Eagle Retail Group Ltd. (H Shares) | 48,000 | | 25,096 |
Industrial & Commercial Bank of China | 189,000 | | 88,928 |
Nine Dragons Paper (Holdings) Ltd. | 118,000 | | 20,349 |
Ping An Insurance (Group) Co. of China, Ltd. (H Shares) | 6,000 | | 25,660 |
Shanda Interactive Entertainment Ltd. sponsored ADR (a) | 3,800 | | 105,070 |
ZTE Corp. (H Shares) | 3,800 | | 8,593 |
TOTAL CHINA | | 647,172 |
Cyprus - 0.2% |
Marfin Popular Bank Public Co. | 19,739 | | 66,858 |
XXI Century Investments Public Ltd. (a) | 1,000 | | 521 |
TOTAL CYPRUS | | 67,379 |
Czech Republic - 0.1% |
Ceske Energeticke Zavody AS | 500 | | 21,637 |
Komercni Banka AS | 200 | | 29,994 |
TOTAL CZECH REPUBLIC | | 51,631 |
Denmark - 0.6% |
Novo Nordisk AS Series B sponsored ADR | 2,700 | | 144,477 |
Vestas Wind Systems AS (a) | 2,460 | | 100,761 |
TOTAL DENMARK | | 245,238 |
Egypt - 0.1% |
Eastern Tobacco Co. | 500 | | 19,344 |
Telecom Egypt SAE | 4,500 | | 10,884 |
TOTAL EGYPT | | 30,228 |
Common Stocks - continued |
| Shares | | Value |
Finland - 0.9% |
Fortum Oyj | 1,600 | | $ 39,322 |
Nokia Corp. sponsored ADR | 20,600 | | 312,708 |
TOTAL FINLAND | | 352,030 |
France - 7.2% |
Accor SA | 1,500 | | 58,358 |
Alstom SA | 2,388 | | 118,358 |
Audika SA | 1,900 | | 44,302 |
AXA SA sponsored ADR | 25,100 | | 469,621 |
BNP Paribas SA | 5,300 | | 382,667 |
Compagnie de St. Gobain | 1,300 | | 50,163 |
Delachaux SA | 791 | | 43,505 |
GDF Suez | 8,981 | | 401,447 |
Groupe Danone | 2,736 | | 152,343 |
L'Air Liquide SA | 600 | | 51,777 |
Laurent-Perrier Group | 310 | | 25,133 |
Remy Cointreau SA | 1,151 | | 47,892 |
Renault SA | 1,000 | | 30,648 |
Societe Generale Series A | 600 | | 32,703 |
Total SA: | | | |
Series B | 4,700 | | 258,563 |
sponsored ADR | 8,800 | | 487,872 |
Unibail-Rodamco | 1,300 | | 194,980 |
TOTAL FRANCE | | 2,850,332 |
Germany - 8.6% |
Allianz AG sponsored ADR | 57,200 | | 433,576 |
BASF AG | 1,800 | | 60,527 |
Bayer AG | 2,200 | | 122,473 |
Daimler AG | 12,400 | | 427,800 |
E.ON AG | 28,900 | | 1,105,621 |
GEA Group AG | 4,000 | | 58,456 |
GFK AG | 2,400 | | 47,394 |
Linde AG | 900 | | 75,584 |
Muenchener Rueckversicherungs-Gesellschaft AG (Reg.) | 4,100 | | 544,173 |
RWE AG | 4,100 | | 342,633 |
Siemens AG sponsored ADR | 2,900 | | 174,435 |
Tognum AG | 3,100 | | 34,467 |
TOTAL GERMANY | | 3,427,139 |
Greece - 0.2% |
Public Power Corp. of Greece | 5,500 | | 68,008 |
Common Stocks - continued |
| Shares | | Value |
Hong Kong - 1.3% |
China Mobile (Hong Kong) Ltd. | 3,500 | | $ 30,811 |
China Mobile (Hong Kong) Ltd. sponsored ADR | 700 | | 30,723 |
China Overseas Land & Investment Ltd. | 44,000 | | 49,687 |
CNOOC Ltd. sponsored ADR | 560 | | 45,746 |
CNPC (Hong Kong) Ltd. | 40,000 | | 12,264 |
Hong Kong Exchanges & Clearing Ltd. | 6,600 | | 66,929 |
REXCAPITAL Financial Holdings Ltd. (a) | 475,000 | | 8,777 |
Swire Pacific Ltd. (A Shares) | 37,000 | | 260,580 |
TOTAL HONG KONG | | 505,517 |
India - 1.5% |
Axis Bank Ltd. GDR (Reg. S) | 2,700 | | 32,400 |
Bank of India | 4,775 | | 23,742 |
Bharat Heavy Electricals Ltd. | 716 | | 19,074 |
Bharti Airtel Ltd. (a) | 13,723 | | 185,812 |
Educomp Solutions Ltd. | 700 | | 32,749 |
Housing Development Finance Corp. Ltd. | 400 | | 14,559 |
Indian Overseas Bank | 15,780 | | 24,231 |
Infosys Technologies Ltd. | 530 | | 15,449 |
LANCO Infratech Ltd. | 20 | | 48 |
Larsen & Toubro Ltd. | 1,250 | | 20,894 |
Nagarjuna Construction Co. Ltd. | 50 | | 66 |
Pantaloon Retail India Ltd. | 3,418 | | 16,492 |
Piramal Healthcare Ltd. | 3,000 | | 13,734 |
Reliance Industries Ltd. GDR (Reg. S) (b) | 524 | | 29,868 |
Rural Electrification Corp. Ltd. | 130 | | 178 |
Satyam Computer Services Ltd. sponsored ADR | 8,700 | | 136,851 |
Sintex Industries Ltd. | 4,536 | | 13,800 |
Subex Ltd. (a) | 1,147 | | 837 |
Suzlon Energy Ltd. | 20,812 | | 18,866 |
Tata Power Co. Ltd. | 1,000 | | 14,273 |
TOTAL INDIA | | 613,923 |
Indonesia - 0.2% |
PT Bank Rakyat Indonesia Tbk | 64,000 | | 19,763 |
PT Bayan Resources Tbk | 128,500 | | 19,845 |
PT Bumi Resources Tbk | 129,500 | | 16,955 |
PT Perusahaan Gas Negara Tbk Series B | 102,000 | | 12,964 |
PT Telkomunikasi Indonesia Tbk Series B | 22,500 | | 11,361 |
TOTAL INDONESIA | | 80,888 |
Ireland - 0.7% |
Bank of Ireland | 15,800 | | 46,653 |
Common Stocks - continued |
| Shares | | Value |
Ireland - continued |
C&C Group PLC | 10,400 | | $ 15,128 |
CRH PLC sponsored ADR | 9,700 | | 205,252 |
Dragon Oil PLC (a) | 5,000 | | 12,935 |
TOTAL IRELAND | | 279,968 |
Israel - 1.2% |
BluePhoenix Solutions Ltd. (a) | 8,700 | | 23,316 |
Cellcom Israel Ltd. | 700 | | 20,622 |
ECtel Ltd. (a) | 9,100 | | 8,190 |
Israel Chemicals Ltd. | 11,900 | | 115,352 |
Leadcom Integrated Solutions (a) | 47,000 | | 4,376 |
Mellanox Technologies Ltd. (a) | 800 | | 6,208 |
Orckit Communications Ltd. (a) | 4,800 | | 19,008 |
Partner Communications Co. Ltd. ADR | 11,600 | | 216,688 |
RADWARE Ltd. (a) | 6,300 | | 39,753 |
Teva Pharmaceutical Industries Ltd. sponsored ADR | 300 | | 12,864 |
TOTAL ISRAEL | | 466,377 |
Italy - 2.1% |
ENI SpA sponsored ADR | 3,400 | | 163,370 |
Fiat SpA | 5,200 | | 41,328 |
Finmeccanica SpA | 7,900 | | 96,652 |
Impregilo SpA (a) | 21,600 | | 56,978 |
UniCredit SpA | 188,400 | | 460,963 |
TOTAL ITALY | | 819,291 |
Japan - 14.1% |
Aeon Co. Ltd. | 19,900 | | 190,813 |
Canon, Inc. | 1,400 | | 48,986 |
Denso Corp. | 8,200 | | 159,815 |
Dydo Drinco, Inc. | 800 | | 19,201 |
East Japan Railway Co. | 37 | | 263,279 |
Elpida Memory, Inc. (a) | 3,000 | | 15,993 |
Ibiden Co. Ltd. | 2,100 | | 39,282 |
Ichiyoshi Securities Co. Ltd. | 7,600 | | 60,855 |
JSR Corp. | 5,400 | | 60,908 |
Kobayashi Pharmaceutical Co. Ltd. | 2,100 | | 67,279 |
Konica Minolta Holdings, Inc. | 20,000 | | 131,340 |
Miraca Holdings, Inc. | 7,400 | | 119,332 |
Mitsubishi Estate Co. Ltd. | 3,000 | | 53,587 |
Mitsubishi UFJ Financial Group, Inc. sponsored ADR | 64,800 | | 406,296 |
Mitsui & Co. Ltd. | 50,000 | | 484,451 |
Nagaileben Co. Ltd. | 1,000 | | 19,855 |
Common Stocks - continued |
| Shares | | Value |
Japan - continued |
Nintendo Co. Ltd. | 700 | | $ 218,400 |
Nippon Building Fund, Inc. | 5 | | 48,043 |
Nomura Holdings, Inc. | 4,500 | | 42,632 |
Obic Co. Ltd. | 410 | | 50,182 |
ORIX Corp. | 2,990 | | 307,186 |
Osaka Gas Co. Ltd. | 94,000 | | 332,484 |
Osaka Securities Exchange Co. Ltd. | 10 | | 32,858 |
Ozeki Co. Ltd. | 200 | | 4,888 |
Promise Co. Ltd. | 9,850 | | 176,790 |
Rakuten, Inc. | 169 | | 83,775 |
SBI Holdings, Inc. | 400 | | 47,998 |
Seven & I Holdings Co. Ltd. | 2,000 | | 56,153 |
Shiseido Co. Ltd. | 5,000 | | 103,000 |
Sony Financial Holdings, Inc. | 34 | | 110,572 |
Sugi Holdings Co. Ltd. | 2,000 | | 48,095 |
Sumco Corp. | 3,720 | | 40,282 |
Sumitomo Corp. | 10,300 | | 90,615 |
Sumitomo Metal Industries Ltd. | 36,000 | | 92,585 |
Sumitomo Mitsui Financial Group, Inc. | 51 | | 204,442 |
Sumitomo Trust & Banking Co. Ltd. | 12,000 | | 55,570 |
Takeda Pharmaceutical Co. Ltd. | 2,500 | | 124,207 |
Tokuyama Corp. | 32,000 | | 162,045 |
Toyota Motor Corp. | 17,400 | | 679,451 |
Tsutsumi Jewelry Co. Ltd. | 2,800 | | 54,547 |
USS Co. Ltd. | 1,500 | | 91,871 |
Xebio Co. Ltd. | 6,600 | | 112,676 |
Yamada Denki Co. Ltd. | 1,390 | | 75,654 |
TOTAL JAPAN | | 5,588,273 |
Kazakhstan - 0.2% |
JSC Halyk Bank of Kazakhstan unit | 15,700 | | 66,725 |
Korea (South) - 0.8% |
Doosan Heavy Industries & Construction Co. Ltd. | 440 | | 19,450 |
Hyundai Industrial Development & Construction Co. | 5 | | 136 |
Hyunjin Materials Co. Ltd. | 1,002 | | 12,381 |
Jinsung T.E.C. Co. Ltd. | 2,098 | | 13,129 |
KB Financial Group, Inc. (a) | 1,515 | | 38,046 |
KT&G Corp. | 390 | | 25,108 |
LG Electronics, Inc. | 110 | | 8,238 |
MegaStudy Co. Ltd. | 100 | | 11,276 |
Meritz Fire & Marine Insurance Co. Ltd. | 3,410 | | 12,557 |
NHN Corp. (a) | 885 | | 94,475 |
Common Stocks - continued |
| Shares | | Value |
Korea (South) - continued |
Samsung Electronics Co. Ltd. | 90 | | $ 38,061 |
Shinhan Financial Group Co. Ltd. | 1,610 | | 39,290 |
Taewoong Co. Ltd. | 360 | | 17,585 |
TK Corp. | 7 | | 114 |
TOTAL KOREA (SOUTH) | | 329,846 |
Luxembourg - 0.1% |
Evraz Group SA GDR | 600 | | 9,240 |
MHP SA GDR (Reg. S) | 3,100 | | 12,400 |
Tenaris SA sponsored ADR | 700 | | 14,413 |
TOTAL LUXEMBOURG | | 36,053 |
Malaysia - 0.1% |
KNM Group Bhd | 70,000 | | 11,870 |
Public Bank Bhd | 10,000 | | 23,763 |
TOTAL MALAYSIA | | 35,633 |
Mauritius - 0.0% |
Golden Agri-Resources Ltd. | 85,000 | | 11,343 |
Mexico - 1.2% |
America Movil SAB de CV Series L sponsored ADR | 10,700 | | 331,058 |
Banco Compartamos SA de CV | 3,500 | | 5,946 |
Cemex SA de CV sponsored ADR | 2,200 | | 16,632 |
Fomento Economico Mexicano SA de CV sponsored ADR | 1,400 | | 35,406 |
Grupo Financiero Banorte SA de CV Series O | 11,339 | | 20,768 |
Wal-Mart de Mexico SA de CV Series V | 26,400 | | 70,919 |
TOTAL MEXICO | | 480,729 |
Netherlands - 2.3% |
AMG Advanced Metallurgical Group NV (a) | 2,150 | | 34,802 |
ASML Holding NV (NY Shares) | 15,600 | | 273,780 |
Gemalto NV (a) | 4,900 | | 137,285 |
Heineken NV (Bearer) | 2,200 | | 74,213 |
ING Groep NV sponsored ADR | 7,700 | | 71,687 |
Koninklijke KPN NV | 14,200 | | 199,981 |
QIAGEN NV (a) | 2,600 | | 37,076 |
Unilever NV (NY Shares) | 3,300 | | 79,365 |
TOTAL NETHERLANDS | | 908,189 |
Norway - 1.8% |
DnB Nor ASA | 21,700 | | 125,759 |
Orkla ASA (A Shares) | 37,800 | | 251,643 |
Petroleum Geo-Services ASA (a) | 21,100 | | 105,065 |
Common Stocks - continued |
| Shares | | Value |
Norway - continued |
Pronova BioPharma ASA | 41,400 | | $ 107,553 |
StatoilHydro ASA sponsored ADR | 5,700 | | 114,570 |
Telenor ASA | 800 | | 4,774 |
TOTAL NORWAY | | 709,364 |
Papua New Guinea - 0.2% |
Lihir Gold Ltd. (a) | 48,000 | | 59,862 |
Lihir Gold Ltd. sponsored ADR (a) | 2,500 | | 31,950 |
TOTAL PAPUA NEW GUINEA | | 91,812 |
Peru - 0.0% |
Compania de Minas Buenaventura SA sponsored ADR | 1,100 | | 13,904 |
Philippines - 0.5% |
Alliance Global Group, Inc. (a) | 310,000 | | 12,698 |
Jollibee Food Corp. | 46,900 | | 44,186 |
Philippine Long Distance Telephone Co. sponsored ADR | 3,100 | | 126,790 |
TOTAL PHILIPPINES | | 183,674 |
Poland - 0.1% |
Eurocash SA | 7,000 | | 21,521 |
Trakcja Polska SA | 7,900 | | 13,259 |
TOTAL POLAND | | 34,780 |
Russia - 1.2% |
Bank St. Petersburg OJSC | 7,100 | | 8,875 |
Mobile TeleSystems OJSC sponsored ADR | 600 | | 23,490 |
OAO Gazprom sponsored ADR | 14,080 | | 287,936 |
OAO NOVATEK (a) | 3,000 | | 8,100 |
OAO Raspadskaya | 5,100 | | 10,710 |
OJSC Rosneft unit | 5,700 | | 26,220 |
Sberbank (Savings Bank of the Russian Federation) GDR | 190 | | 34,849 |
Uralkali JSC | 6,400 | | 29,440 |
Vimpel Communications sponsored ADR | 2,600 | | 37,700 |
Wimm-Bill-Dann Foods OJSC sponsored ADR (a) | 500 | | 21,970 |
TOTAL RUSSIA | | 489,290 |
Singapore - 0.7% |
DBS Group Holdings Ltd. | 31,000 | | 236,638 |
Singapore Exchange Ltd. | 12,000 | | 42,953 |
Straits Asia Resources Ltd. | 7,000 | | 4,664 |
TOTAL SINGAPORE | | 284,255 |
Common Stocks - continued |
| Shares | | Value |
South Africa - 1.7% |
African Rainbow Minerals Ltd. | 7,763 | | $ 78,663 |
Aveng Ltd. | 100 | | 491 |
Bell Equipment Ltd. | 1 | | 1 |
Exxaro Resources Ltd. | 2,300 | | 15,161 |
Harmony Gold Mining Co. Ltd. sponsored ADR (a) | 2,500 | | 18,275 |
Impala Platinum Holdings Ltd. | 12,300 | | 127,029 |
Imperial Holdings Ltd. | 2,865 | | 16,111 |
MTN Group Ltd. | 29,203 | | 325,806 |
Murray & Roberts Holdings Ltd. | 2,505 | | 16,917 |
Northam Platinum Ltd. | 900 | | 2,810 |
Raubex Group Ltd. | 6,200 | | 16,024 |
Sasol Ltd. sponsored ADR | 400 | | 11,572 |
Truworths International Ltd. | 9,000 | | 30,537 |
TOTAL SOUTH AFRICA | | 659,397 |
Spain - 3.1% |
Banco Bilbao Vizcaya Argentaria SA sponsored ADR | 13,600 | | 157,760 |
Banco Santander SA | 18,900 | | 204,407 |
Grifols SA | 9,279 | | 184,659 |
Inditex SA | 2,200 | | 74,365 |
Prosegur Comp Securidad SA (Reg.) | 1,600 | | 45,455 |
Telefonica SA sponsored ADR | 10,000 | | 555,100 |
TOTAL SPAIN | | 1,221,746 |
Sweden - 0.9% |
H&M Hennes & Mauritz AB (B Shares) | 3,900 | | 139,825 |
Swedish Match Co. | 8,400 | | 116,627 |
Telefonaktiebolaget LM Ericsson (B Shares) | 14,800 | | 100,730 |
TOTAL SWEDEN | | 357,182 |
Switzerland - 11.0% |
ABB Ltd. sponsored ADR | 5,100 | | 67,065 |
Credit Suisse Group sponsored ADR | 2,000 | | 74,800 |
EFG International | 13,800 | | 297,017 |
Nestle SA (Reg.) | 35,079 | | 1,363,823 |
Novartis AG sponsored ADR | 10,800 | | 550,692 |
Roche Holding AG (participation certificate) | 9,148 | | 1,398,669 |
Sonova Holding AG | 3,319 | | 137,877 |
Swiss Life Holding AG | 1,049 | | 94,501 |
The Swatch Group AG (Reg.) | 1,684 | | 48,211 |
Zurich Financial Services AG (Reg.) | 1,669 | | 338,530 |
TOTAL SWITZERLAND | | 4,371,185 |
Common Stocks - continued |
| Shares | | Value |
Taiwan - 0.8% |
Acer, Inc. | 9,000 | | $ 11,719 |
Advanced Semiconductor Engineering, Inc. | 40,128 | | 17,086 |
China Steel Corp. | 31,810 | | 23,193 |
Everlight Electronics Co. Ltd. | 12,199 | | 18,492 |
First Financial Holding Co. Ltd. | 57,600 | | 27,154 |
HannStar Display Corp. | 376,248 | | 68,440 |
Hon Hai Precision Industry Co. Ltd. (Foxconn) | 39,100 | | 94,831 |
HTC Corp. | 2,600 | | 31,017 |
Innolux Display Corp. | 31,900 | | 23,743 |
Powertech Technology, Inc. | 5,500 | | 7,745 |
Taiwan Mobile Co. Ltd. | 7,000 | | 9,698 |
TOTAL TAIWAN | | 333,118 |
Thailand - 0.2% |
PTT Exploration & Production PCL (For. Reg.) | 7,100 | | 17,717 |
Siam Commercial Bank PCL (For. Reg.) | 28,000 | | 43,466 |
Total Access Communication PCL: | | | |
unit | 14,000 | | 10,006 |
(For. Reg.) | 8,600 | | 6,114 |
TOTAL THAILAND | | 77,303 |
Turkey - 0.8% |
Anadolu Efes Biracilik ve Malt Sanyii AS | 13,480 | | 113,530 |
Asya Katilim Bankasi AS | 77,200 | | 67,520 |
Bagfas Bandirma Gubre Fabrikalari AS | 150 | | 7,191 |
Enka Insaat ve Sanayi AS | 4,866 | | 18,127 |
Tupras-Turkiye Petrol Rafinerileri AS | 5,000 | | 63,166 |
Turkiye Garanti Bankasi AS (a) | 32,200 | | 52,570 |
Turkiye Vakiflar Bankasi TAO | 11,000 | | 10,618 |
TOTAL TURKEY | | 332,722 |
United Arab Emirates - 0.0% |
DP World Ltd. | 47 | | 16 |
United Kingdom - 13.8% |
Aegis Group PLC | 89,000 | | 93,785 |
Anglo American PLC (United Kingdom) | 3,942 | | 98,898 |
Autonomy Corp. PLC (a) | 8,400 | | 133,171 |
BAE Systems PLC | 88,900 | | 499,642 |
Barratt Developments PLC | 4,400 | | 5,477 |
BG Group PLC | 14,900 | | 219,062 |
BHP Billiton PLC | 2,800 | | 47,540 |
BHP Billiton PLC ADR | 9,100 | | 312,403 |
Common Stocks - continued |
| Shares | | Value |
United Kingdom - continued |
British American Tobacco PLC: | | | |
(United Kingdom) | 1,800 | | $ 49,367 |
sponsored ADR | 3,100 | | 168,516 |
Cairn Energy PLC (a) | 300 | | 7,771 |
Datacash Group PLC | 11,300 | | 39,343 |
easyJet PLC (a) | 19,800 | | 98,762 |
Eurasian Natural Resources Corp. PLC | 1,000 | | 5,001 |
HBOS PLC | 61,159 | | 100,131 |
HSBC Holdings PLC (United Kingdom) (Reg.) | 9,363 | | 110,884 |
Informa PLC | 14,700 | | 49,797 |
Man Group PLC | 50,375 | | 290,803 |
Max Petroleum PLC (a) | 76,100 | | 16,448 |
Misys PLC | 27,000 | | 48,340 |
National Grid PLC | 7,800 | | 87,857 |
Premier Foods PLC | 159,000 | | 70,493 |
Prudential PLC | 20,900 | | 104,975 |
Randgold Resources Ltd. sponsored ADR | 300 | | 9,303 |
Reckitt Benckiser Group PLC | 10,600 | | 448,323 |
Renovo Group PLC (a) | 143,700 | | 58,671 |
Rio Tinto PLC: | | | |
(Reg.) | 3,000 | | 140,119 |
sponsored ADR | 690 | | 128,250 |
Royal Bank of Scotland Group PLC | 123,466 | | 135,983 |
Royal Dutch Shell PLC Class A sponsored ADR | 15,200 | | 848,312 |
Serco Group PLC | 45,900 | | 273,694 |
Sibir Energy PLC (a) | 1,800 | | 7,162 |
Tesco PLC | 54,900 | | 300,766 |
Vodafone Group PLC | 40,300 | | 77,516 |
Vodafone Group PLC sponsored ADR | 19,500 | | 375,765 |
Xstrata PLC | 1,200 | | 20,523 |
TOTAL UNITED KINGDOM | | 5,482,853 |
United States of America - 5.3% |
Allergan, Inc. | 1,900 | | 75,373 |
Berkshire Hathaway, Inc. Class B (a) | 80 | | 307,200 |
Chiquita Brands International, Inc. (a) | 6,000 | | 81,900 |
Cypress Semiconductor Corp. (a) | 10,000 | | 50,100 |
FMC Technologies, Inc. (a) | 1,000 | | 34,990 |
Freeport-McMoRan Copper & Gold, Inc. Class B | 300 | | 8,730 |
Gilead Sciences, Inc. (a) | 3,600 | | 165,060 |
JPMorgan Chase & Co. | 3,000 | | 123,750 |
Juniper Networks, Inc. (a) | 11,500 | | 215,510 |
Common Stocks - continued |
| Shares | | Value |
United States of America - continued |
Lululemon Athletica, Inc. (a) | 300 | | $ 4,251 |
MasterCard, Inc. Class A | 700 | | 103,474 |
Mohawk Industries, Inc. (a) | 700 | | 33,866 |
Philip Morris International, Inc. | 7,000 | | 304,290 |
Pricesmart, Inc. | 7,095 | | 105,716 |
SanDisk Corp. (a) | 3,900 | | 34,671 |
Sunpower Corp. Class B (a) | 2,742 | | 81,191 |
Varian Semiconductor Equipment Associates, Inc. (a) | 2,800 | | 54,936 |
Visa, Inc. | 5,900 | | 326,565 |
TOTAL UNITED STATES OF AMERICA | | 2,111,573 |
TOTAL COMMON STOCKS (Cost $66,712,564) | 38,936,426 |
Nonconvertible Preferred Stocks - 0.5% |
| | | |
Brazil - 0.1% |
Usinas Siderurgicas de Minas Gerais SA - Usiminas (PN-A) (non-vtg.) | 1,150 | | 14,719 |
Germany - 0.1% |
ProSiebenSat.1 Media AG | 10,900 | | 32,899 |
Italy - 0.3% |
Fiat SpA (Risp) | 3,200 | | 14,504 |
Telecom Italia SpA (Risp) | 135,800 | | 114,279 |
TOTAL ITALY | | 128,783 |
TOTAL NONCONVERTIBLE PREFERRED STOCKS (Cost $443,113) | 176,401 |
Cash Equivalents - 2.8% |
| Maturity Amount | | Value |
Investments in repurchase agreements in a joint trading account at 0.14%, dated 10/31/08 due 11/3/08: | | | |
(Collateralized by U.S. Treasury Obligations) # | $ 29,000 | | $ 29,000 |
(Collateralized by U.S. Treasury Obligations) # | 1,081,012 | | 1,081,000 |
TOTAL CASH EQUIVALENTS (Cost $1,110,000) | 1,110,000 |
TOTAL INVESTMENT PORTFOLIO - 101.2% (Cost $68,265,677) | | 40,222,827 |
NET OTHER ASSETS - (1.2)% | | (460,584) |
NET ASSETS - 100% | $ 39,762,243 |
Legend |
(a) Non-income producing |
(b) Security exempt from registration under Rule 144A of the Securities Act of 1933. These securities may be resold in transactions exempt from registration, normally to qualified institutional buyers. At the end of the period, the value of these securities amounted to $36,668 or 0.1% of net assets. |
# Additional Information on each counterparty to the repurchase agreement is as follows: |
Repurchase Agreement / Counterparty | Value |
$29,000 due 11/03/08 at 0.14% |
BNP Paribas Securities Corp. | $ 1,954 |
Banc of America Securities LLC | 3,908 |
Barclays Capital, Inc. | 3,908 |
Deutsche Bank Securities, Inc. | $ 10,159 |
Morgan Stanley & Co., Inc. | 278 |
UBS Securities LLC | 8,793 |
| $ 29,000 |
$1,081,000 due 11/03/08 at 0.14% |
BNP Paribas Securities Corp. | $ 72,833 |
Banc of America Securities LLC | 145,666 |
Barclays Capital, Inc. | 145,666 |
Deutsche Bank Securities, Inc. | 378,731 |
Morgan Stanley & Co., Inc. | 10,355 |
UBS Securities LLC | 327,749 |
| $ 1,081,000 |
Affiliated Central Funds |
Information regarding fiscal year to date income earned by the Fund from investments in Fidelity Central Funds is as follows: |
Fund | Income earned |
Fidelity Securities Lending Cash Central Fund | $ 685 |
Income Tax Information |
At October 31, 2008, the fund had a capital loss carryforward of approximately $10,058,675 all of which will expire on October 31, 2016. |
See accompanying notes which are an integral part of the financial statements.
Annual Report
Fidelity Total International Equity Fund
Statement of Assets and Liabilities
| October 31, 2008 |
| | |
Assets | | |
Investment in securities, at value (including repurchase agreements of $1,110,000) -
See accompanying schedule: Unaffiliated issuers (cost $68,265,677) | | $ 40,222,827 |
Foreign currency held at value (cost $19,550) | | 19,610 |
Receivable for investments sold | | 420,878 |
Receivable for fund shares sold | | 48,897 |
Dividends receivable | | 137,659 |
Distributions receivable from Fidelity Central Funds | | 487 |
Receivable from investment adviser for expense reductions | | 60,634 |
Other receivables | | 2,568 |
Total assets | | 40,913,560 |
| | |
Liabilities | | |
Payable to custodian bank | $ 500,703 | |
Payable for investments purchased | 454,874 | |
Payable for fund shares redeemed | 65,416 | |
Accrued management fee | 24,662 | |
Distribution fees payable | 7,025 | |
Other affiliated payables | 13,587 | |
Other payables and accrued expenses | 85,050 | |
Total liabilities | | 1,151,317 |
| | |
Net Assets | | $ 39,762,243 |
Net Assets consist of: | | |
Paid in capital | | $ 77,832,504 |
Undistributed net investment income | | 796,810 |
Accumulated undistributed net realized gain (loss) on investments and foreign currency transactions | | (10,821,709) |
Net unrealized appreciation (depreciation) on investments and assets and liabilities in foreign currencies | | (28,045,362) |
Net Assets | | $ 39,762,243 |
See accompanying notes which are an integral part of the financial statements.
Annual Report
Fidelity Total International Equity Fund
Financial Statements - continued
Statement of Assets and Liabilities - continued
| October 31, 2008 |
| | |
Calculation of Maximum Offering Price
Class A:
Net Asset Value and redemption price per share
($5,944,308 ÷ 1,214,214 shares) | | $ 4.90 |
| | |
Maximum offering price per share (100/94.25 of $4.90) | | $ 5.20 |
Class T:
Net Asset Value and redemption price per share ($2,566,919 ÷ 525,601 shares) | | $ 4.88 |
| | |
Maximum offering price per share (100/96.50 of $4.88) | | $ 5.06 |
Class B:
Net Asset Value and offering price per share ($2,505,484 ÷ 515,596 shares)A | | $ 4.86 |
| | |
Class C:
Net Asset Value and offering price per share ($2,786,793 ÷ 573,503 shares)A | | $ 4.86 |
| | |
Total International Equity:
Net Asset Value, offering price and redemption price per share ($23,226,171 ÷ 4,734,729 shares) | | $ 4.91 |
| | |
Institutional Class:
Net Asset Value, offering price and redemption price per share ($2,732,568 ÷ 557,020 shares) | | $ 4.91 |
A Redemption price per share is equal to net asset value less any applicable contingent deferred sales charge.
See accompanying notes which are an integral part of the financial statements.
Annual Report
Statement of Operations
For the period November 1, 2007
(commencement of operations)
to October 31, 2008 |
| | |
Investment Income | | |
Dividends | | $ 1,864,250 |
Interest | | 50,882 |
Income from Fidelity Central Funds | | 685 |
| | 1,915,817 |
Less foreign taxes withheld | | (176,331) |
Total income | | 1,739,486 |
| | |
Expenses | | |
Management fee | $ 434,811 | |
Transfer agent fees | 140,800 | |
Distribution fees | 124,559 | |
Accounting and security lending fees | 31,886 | |
Custodian fees and expenses | 333,396 | |
Independent trustees' compensation | 250 | |
Registration fees | 134,079 | |
Audit | 76,578 | |
Legal | 2,967 | |
Miscellaneous | 2,464 | |
Total expenses before reductions | 1,281,790 | |
Expense reductions | (399,945) | 881,845 |
Net investment income (loss) | | 857,641 |
Realized and Unrealized Gain (Loss) Net realized gain (loss) on: | | |
Investment securities: | | |
Unaffiliated issuers | (10,808,092) | |
Foreign currency transactions | (58,619) | |
Total net realized gain (loss) | | (10,866,711) |
Change in net unrealized appreciation (depreciation) on: Investment securities | (28,043,005) | |
Assets and liabilities in foreign currencies | (2,357) | |
Total change in net unrealized appreciation (depreciation) | | (28,045,362) |
Net gain (loss) | | (38,912,073) |
Net increase (decrease) in net assets resulting from operations | | $ (38,054,432) |
See accompanying notes which are an integral part of the financial statements.
Annual Report
Fidelity Total International Equity Fund
Financial Statements - continued
Statement of Changes in Net Assets
| For the period
November 1, 2007
(commencement
of operations) to
October 31, 2008 |
Increase (Decrease) in Net Assets | |
Operations | |
Net investment income (loss) | $ 857,641 |
Net realized gain (loss) | (10,866,711) |
Change in net unrealized appreciation (depreciation) | (28,045,362) |
Net increase (decrease) in net assets resulting
from operations | (38,054,432) |
Distributions to shareholders from net investment income | (15,829) |
Share transactions - net increase (decrease) | 77,824,722 |
Redemption fees | 7,782 |
Total increase (decrease) in net assets | 39,762,243 |
| |
Net Assets | |
Beginning of period | - |
End of period (including undistributed net investment income of $796,810) | $ 39,762,243 |
See accompanying notes which are an integral part of the financial statements.
Annual Report
Financial Highlights - Class A
| For the period
November 1, 2007
(commencement
of operations) to
October 31, 2008 |
Selected Per-Share Data | |
Net asset value, beginning of period | $ 10.00 |
Income from Investment Operations | |
Net investment income (loss) C | .11 |
Net realized and unrealized gain (loss) | (5.21) |
Total from investment operations | (5.10) |
Redemption fees added to paid in capital C, E | - |
Net asset value, end of period | $ 4.90 |
Total Return A, B | (51.00)% |
Ratios to Average Net Assets D, G | |
Expenses before reductions | 2.00% |
Expenses net of fee waivers, if any | 1.50% |
Expenses net of all reductions | 1.48% |
Net investment income (loss) | 1.35% |
Supplemental Data | |
Net assets, end of period (000 omitted) | $ 5,944 |
Portfolio turnover rate F | 91% |
A Total returns would have been lower had certain expenses not been reduced during the periods shown.
B Total returns do not include the effect of the sales charges.
C Calculated based on average shares outstanding during the period.
D Expense ratios reflect operating expenses of the class. Expenses before reductions do not reflect amounts reimbursed by the investment adviser or reductions from brokerage service arrangements or other expense offset arrangements and do not represent the amount paid by the class during periods when reimbursements or reductions occur. Expense ratios before reductions for start-up periods may not be representative of longer-term operating periods. Expenses net of fee waivers reflect expenses after reimbursement by the investment adviser but prior to reductions from brokerage service arrangements or other expense offset arrangements. Expenses net of all reductions represent the net expenses paid by the class.
E Amount represents less than $.01 per share.
F Amount does not include the portfolio activity of any underlying Fidelity Central Funds.
G Fees and expenses of the underlying Fidelity Central Funds are not included in the Fund's expense ratio. The Fund indirectly bears its proportionate share of the expenses of any underlying Fidelity Central Funds.
See accompanying notes which are an integral part of the financial statements.
Annual Report
Financial Highlights - Class T
| For the period
November 1, 2007
(commencement
of operations) to
October 31, 2008 |
Selected Per-Share Data | |
Net asset value, beginning of period | $ 10.00 |
Income from Investment Operations | |
Net investment income (loss) C | .09 |
Net realized and unrealized gain (loss) | (5.21) |
Total from investment operations | (5.12) |
Redemption fees added to paid in capital C, E | - |
Net asset value, end of period | $ 4.88 |
Total Return A, B | (51.20)% |
Ratios to Average Net Assets D, G | |
Expenses before reductions | 2.42% |
Expenses net of fee waivers, if any | 1.75% |
Expenses net of all reductions | 1.73% |
Net investment income (loss) | 1.10% |
Supplemental Data | |
Net assets, end of period (000 omitted) | $ 2,567 |
Portfolio turnover rate F | 91% |
A Total returns would have been lower had certain expenses not been reduced during the periods shown.
B Total returns do not include the effect of the sales charges.
C Calculated based on average shares outstanding during the period.
D Expense ratios reflect operating expenses of the class. Expenses before reductions do not reflect amounts reimbursed by the investment adviser or reductions from brokerage service arrangements or other expense offset arrangements and do not represent the amount paid by the class during periods when reimbursements or reductions occur. Expense ratios before reductions for start-up periods may not be representative of longer-term operating periods. Expenses net of fee waivers reflect expenses after reimbursement by the investment adviser but prior to reductions from brokerage service arrangements or other expense offset arrangements. Expenses net of all reductions represent the net expenses paid by the class.
E Amount represents less than $.01 per share.
F Amount does not include the portfolio activity of any underlying Fidelity Central Funds.
G Fees and expenses of the underlying Fidelity Central Funds are not included in the Fund's expense ratio. The Fund indirectly bears its proportionate share of the expenses of any underlying Fidelity Central Funds.
See accompanying notes which are an integral part of the financial statements.
Annual Report
Financial Highlights - Class B
| For the period
November 1, 2007
(commencement
of operations) to
October 31, 2008 |
Selected Per-Share Data | |
Net asset value, beginning of period | $ 10.00 |
Income from Investment Operations | |
Net investment income (loss) C | .05 |
Net realized and unrealized gain (loss) | (5.19) |
Total from investment operations | (5.14) |
Redemption fees added to paid in capital C, E | - |
Net asset value, end of period | $ 4.86 |
Total Return A, B | (51.40)% |
Ratios to Average Net Assets D, G | |
Expenses before reductions | 2.92% |
Expenses net of fee waivers, if any | 2.25% |
Expenses net of all reductions | 2.24% |
Net investment income (loss) | .60% |
Supplemental Data | |
Net assets, end of period (000 omitted) | $ 2,505 |
Portfolio turnover rate F | 91% |
A Total returns would have been lower had certain expenses not been reduced during the periods shown.
B Total returns do not include the effect of the contingent deferred sales charge.
C Calculated based on average shares outstanding during the period.
D Expense ratios reflect operating expenses of the class. Expenses before reductions do not reflect amounts reimbursed by the investment adviser or reductions from brokerage service arrangements or other expense offset arrangements and do not represent the amount paid by the class during periods when reimbursements or reductions occur. Expense ratios before reductions for start-up periods may not be representative of longer-term operating periods. Expenses net of fee waivers reflect expenses after reimbursement by the investment adviser but prior to reductions from brokerage service arrangements or other expense offset arrangements. Expenses net of all reductions represent the net expenses paid by the class.
E Amount represents less than $.01 per share.
F Amount does not include the portfolio activity of any underlying Fidelity Central Funds.
G Fees and expenses of the underlying Fidelity Central Funds are not included in the Fund's expense ratio. The Fund indirectly bears its proportionate share of the expenses of any underlying Fidelity Central Funds.
See accompanying notes which are an integral part of the financial statements.
Annual Report
Financial Highlights - Class C
| For the period
November 1, 2007
(commencement
of operations) to
October 31, 2008 |
Selected Per-Share Data | |
Net asset value, beginning of period | $ 10.00 |
Income from Investment Operations | |
Net investment income (loss) C | .05 |
Net realized and unrealized gain (loss) | (5.19) |
Total from investment operations | (5.14) |
Redemption fees added to paid in capital C, E | - |
Net asset value, end of period | $ 4.86 |
Total Return A, B | (51.40)% |
Ratios to Average Net Assets D, G | |
Expenses before reductions | 2.92% |
Expenses net of fee waivers, if any | 2.25% |
Expenses net of all reductions | 2.23% |
Net investment income (loss) | .60% |
Supplemental Data | |
Net assets, end of period (000 omitted) | $ 2,787 |
Portfolio turnover rate F | 91% |
A Total returns would have been lower had certain expenses not been reduced during the periods shown.
B Total returns do not include the effect of the contingent deferred sales charge.
C Calculated based on average shares outstanding during the period.
D Expense ratios reflect operating expenses of the class. Expenses before reductions do not reflect amounts reimbursed by the investment adviser or reductions from brokerage service arrangements or other expense offset arrangements and do not represent the amount paid by the class during periods when reimbursements or reductions occur. Expense ratios before reductions for start-up periods may not be representative of longer-term operating periods. Expenses net of fee waivers reflect expenses after reimbursement by the investment adviser but prior to reductions from brokerage service arrangements or other expense offset arrangements. Expenses net of all reductions represent the net expenses paid by the class.
E Amount represents less than $.01 per share.
F Amount does not include the portfolio activity of any underlying Fidelity Central Funds.
G Fees and expenses of the underlying Fidelity Central Funds are not included in the Fund's expense ratio. The Fund indirectly bears its proportionate share of the expenses of any underlying Fidelity Central Funds.
See accompanying notes which are an integral part of the financial statements.
Annual Report
Financial Highlights - Total International Equity
| For the period
November 1, 2007
(commencement
of operations) to
October 31, 2008 |
Selected Per-Share Data | |
Net asset value, beginning of period | $ 10.00 |
Income from Investment Operations | |
Net investment income (loss) B | .13 |
Net realized and unrealized gain (loss) | (5.21) |
Total from investment operations | (5.08) |
Distributions from net investment income | (.01) |
Redemption fees added to paid in capital B, D | - |
Net asset value, end of period | $ 4.91 |
Total Return A | (50.87)% |
Ratios to Average Net Assets C, F | |
Expenses before reductions | 1.89% |
Expenses net of fee waivers, if any | 1.25% |
Expenses net of all reductions | 1.23% |
Net investment income (loss) | 1.60% |
Supplemental Data | |
Net assets, end of period (000 omitted) | $ 23,226 |
Portfolio turnover rate E | 91% |
A Total returns would have been lower had certain expenses not been reduced during the periods shown.
B Calculated based on average shares outstanding during the period.
C Expense ratios reflect operating expenses of the class. Expenses before reductions do not reflect amounts reimbursed by the investment adviser or reductions from brokerage service arrangements or other expense offset arrangements and do not represent the amount paid by the class during periods when reimbursements or reductions occur. Expense ratios before reductions for start-up periods may not be representative of longer-term operating periods. Expenses net of fee waivers reflect expenses after reimbursement by the investment adviser but prior to reductions from brokerage service arrangements or other expense offset arrangements. Expenses net of all reductions represent the net expenses paid by the class.
D Amount represents less than $.01 per share.
E Amount does not include the portfolio activity of any underlying Fidelity Central Funds.
F Fees and expenses of the underlying Fidelity Central Funds are not included in the Fund's expense ratio. The Fund indirectly bears its proportionate share of the expenses of any underlying Fidelity Central Funds.
See accompanying notes which are an integral part of the financial statements.
Annual Report
Financial Highlights - Institutional Class
| For the period
November 1, 2007
(commencement
of operations) to
October 31, 2008 |
Selected Per-Share Data | |
Net asset value, beginning of period | $ 10.00 |
Income from Investment Operations | |
Net investment income (loss) B | .13 |
Net realized and unrealized gain (loss) | (5.21) |
Total from investment operations | (5.08) |
Distributions from net investment income | (.01) |
Redemption fees added to paid in capital B, D | - |
Net asset value, end of period | $ 4.91 |
Total Return A | (50.87)% |
Ratios to Average Net Assets C, F | |
Expenses before reductions | 1.91% |
Expenses net of fee waivers, if any | 1.25% |
Expenses net of all reductions | 1.23% |
Net investment income (loss) | 1.60% |
Supplemental Data | |
Net assets, end of period (000 omitted) | $ 2,733 |
Portfolio turnover rate E | 91% |
A Total returns would have been lower had certain expenses not been reduced during the periods shown.
B Calculated based on average shares outstanding during the period.
C Expense ratios reflect operating expenses of the class. Expenses before reductions do not reflect amounts reimbursed by the investment adviser or reductions from brokerage service arrangements or other expense offset arrangements and do not represent the amount paid by the class during periods when reimbursements or reductions occur. Expense ratios before reductions for start-up periods may not be representative of longer-term operating periods. Expenses net of fee waivers reflect expenses after reimbursement by the investment adviser but prior to reductions from brokerage service arrangements or other expense offset arrangements. Expenses net of all reductions represent the net expenses paid by the class.
D Amount represents less than $.01 per share.
E Amount does not include the portfolio activity of any underlying Fidelity Central Funds.
F Fees and expenses of the underlying Fidelity Central Funds are not included in the Fund's expense ratio. The Fund indirectly bears its proportionate share of the expenses of any underlying Fidelity Central Funds.
See accompanying notes which are an integral part of the financial statements.
Annual Report
Fidelity Total International Equity Fund
Notes to Financial Statements
For the period ended October 31, 2008
1. Organization.
Fidelity Total International Equity Fund (the Fund) is a fund of Fidelity Investment Trust (the trust) and is authorized to issue an unlimited number of shares. The trust is registered under the Investment Company Act of 1940, as amended (the 1940 Act), as an open-end management investment company organized as a Massachusetts business trust. The Fund offers Class A, Class T, Class B, Class C, Total International Equity, and Institutional Class shares, each of which has equal rights as to assets and voting privileges. Each class has exclusive voting rights with respect to matters that affect that class. Class B shares will automatically convert to Class A shares after a holding period of seven years from the initial date of purchase. Investment income, realized and unrealized capital gains and losses, the common expenses of the Fund, and certain fund-level expense reductions, if any, are allocated on a pro rata basis to each class based on the relative net assets of each class to the total net assets of the Fund. Each class differs with respect to transfer agent and distribution and service plan fees incurred. Certain expense reductions also differ by class.The Fund's investments in emerging markets can be subject to social, economic, regulatory, and political uncertainties and can be extremely volatile.
2. Investments in Fidelity Central Funds.
The Fund may invest in Fidelity Central Funds, which are open-end investment companies available only to other investment companies and accounts managed by Fidelity Management & Research Company (FMR) and its affiliates. The Fund's Schedule of Investments lists each of the Fidelity Central Funds held as of period end, if any, as an investment of the Fund, but does not include the underlying holdings of each Fidelity Central Fund. As an Investing Fund, the Fund indirectly bears its proportionate share of the expenses of the underlying Fidelity Central Funds.
The Money Market Central Funds seek preservation of capital and current income and are managed by Fidelity Investments Money Management, Inc. (FIMM), an affiliate of FMR.
A complete unaudited list of holdings for each Fidelity Central Fund is available upon request or at the SEC's web site at www.sec.gov. In addition, the financial statements of the Fidelity Central Funds, which are not covered by the Fund's Report of Independent Registered Public Accounting Firm, are available on the SEC's web site or upon request.
3. Significant Accounting Policies.
The financial statements have been prepared in conformity with accounting principles generally accepted in the United States of America, which require management to make certain estimates and assumptions at the date of the financial statements. Actual results could differ from those estimates. The following summarizes the significant accounting policies of the Fund:
Annual Report
Fidelity Total International Equity Fund
Notes to Financial Statements - continued
3. Significant Accounting Policies - continued
Security Valuation. Investments are valued as of 4:00 p.m. Eastern time on the last calendar day of the period. Wherever possible, the Fund uses independent pricing services approved by the Board of Trustees to value its investments.
Equity securities, including restricted securities, for which market quotations are readily available, are valued at the last reported sale price or official closing price as reported by an independent pricing service on the primary market or exchange on which they are traded. In the event there were no sales during the day or closing prices are not available, securities are valued at the last quoted bid price. Investments in open-end mutual funds, including Fidelity Central Funds, are valued at their closing net asset value each business day. Short-term securities with remaining maturities of sixty days or less for which quotations are not readily available are valued at amortized cost, which approximates value.
When current market prices or quotations are not readily available or reliable, valuations may be determined in good faith in accordance with procedures adopted by the Board of Trustees. Factors used in determining value may include significant market or security specific events, changes in interest rates and credit quality, and developments in foreign markets which are monitored by evaluating the performance of ADRs, futures contracts and exchange-traded funds. The frequency with which these procedures are used cannot be predicted and may be utilized to a significant extent. The value of securities used for net asset value (NAV) calculation under these procedures may differ from published prices for the same securities.
Foreign Currency. The Fund uses foreign currency contracts to facilitate transactions in foreign-denominated securities. Losses from these transactions may arise from changes in the value of the foreign currency or if the counterparties do not perform under the contracts' terms.
Foreign-denominated assets, including investment securities, and liabilities are translated into U.S. dollars at the exchange rate at period end. Purchases and sales of investment securities, income and dividends received and expenses denominated in foreign currencies are translated into U.S. dollars at the exchange rate in effect on the transaction date.
The effects of exchange rate fluctuations on investments are included with the net realized and unrealized gain (loss) on investment securities. Other foreign currency transactions resulting in realized and unrealized gain (loss) are disclosed separately.
Annual Report
3. Significant Accounting Policies - continued
Investment Transactions and Income. For financial reporting purposes, the Fund's investment holdings and NAV include trades executed through the end of the last business day of the period. The NAV per share for processing shareholder transactions is calculated as of the close of business of the New York Stock Exchange (NYSE), normally 4:00 p.m. Eastern time and includes trades executed through the end of the prior business day. Gains and losses on securities sold are determined on the basis of identified cost. Dividend income is recorded on the ex-dividend date, except for certain dividends from foreign securities where the ex-dividend date may have passed, which are recorded as soon as the Fund is informed of the ex-dividend date. Non-cash dividends included in dividend income, if any, are recorded at the fair market value of the securities received. Interest income and distributions from the Fidelity Central Funds are accrued as earned. Interest income includes coupon interest and amortization of premium and accretion of discount on debt securities. Investment income is recorded net of foreign taxes withheld where recovery of such taxes is uncertain.
Expenses. Most expenses of the trust can be directly attributed to a fund. Expenses which cannot be directly attributed are apportioned among each Fund in the trust. Expense estimates are accrued in the period to which they relate and adjustments are made when actual amounts are known.
Income Tax Information and Distributions to Shareholders. Each year, the Fund intends to qualify as a regulated investment company by distributing substantially all of its taxable income and realized gains under Subchapter M of the Internal Revenue Code and filing its U.S. federal tax return. As a result, no provision for income taxes is required. The Fund is subject to the provisions of FASB Interpretation No. 48, Accounting for Uncertainties in Income Taxes (FIN 48). FIN 48 sets forth a minimum threshold for financial statement recognition of the benefit of a tax position taken or expected to be taken in a tax return. There are no unrecognized tax benefits in the accompanying financial statements in connection with the tax positions expected to be taken in the initial filing of the Fund's federal tax return. Foreign taxes are provided for based on the Fund's understanding of the tax rules and rates that exist in the foreign markets in which it invests.
Distributions are recorded on the ex-dividend date. Income dividends and capital gain distributions are declared separately for each class. Income and capital gain distributions are determined in accordance with income tax regulations, which may differ from generally accepted accounting principles.
Capital accounts within the financial statements are adjusted for permanent book-tax differences. These adjustments have no impact on net assets or the results of operations. Temporary book-tax differences will reverse in a subsequent period.
Annual Report
Fidelity Total International Equity Fund
Notes to Financial Statements - continued
3. Significant Accounting Policies - continued
Income Tax Information and Distributions to Shareholders - continued
Book-tax differences are primarily due to foreign currency transactions, passive foreign investment companies (PFIC), capital loss carryforwards and losses deferred due to wash sales.
The tax-basis components of distributable earnings and the federal tax cost as of period end were as follows:
Unrealized appreciation | $ 158,517 |
Unrealized depreciation | (28,966,751) |
Net unrealized appreciation (depreciation) | (28,808,234) |
Undistributed ordinary income | 796,810 |
Capital loss carryforward | (10,058,675) |
| |
Cost for federal income tax purposes | $ 69,031,061 |
The tax character of distributions paid was as follows:
| October 31, 2008 |
Ordinary Income | $ 15,829 |
Short-Term Trading (Redemption) Fees. Shares held in the Fund less than 30 days are subject to a redemption fee equal to 1.00% of the proceeds of the redeemed shares. All redemption fees, including any estimated redemption fees paid by FMR, are retained by the Fund and accounted for as an addition to paid in capital.
New Accounting Pronouncement. In September 2006, Statement of Financial Accounting Standards No. 157, Fair Value Measurements (SFAS 157), was issued and is effective for fiscal years beginning after November 15, 2007. SFAS 157 defines fair value, establishes a framework for measuring fair value and results in expanded disclosures about fair value measurements. The Fund will adopt the provisions of SFAS 157 effective for its fiscal year beginning November 1, 2008.
4. Operating Policies.
Repurchase Agreements. FMR has received an Exemptive Order from the Securities and Exchange Commission (the SEC) which permits the Fund and other affiliated entities of FMR to transfer uninvested cash balances into joint trading accounts which are then invested in repurchase agreements. The Fund may also invest directly with institutions in repurchase agreements. Repurchase agreements are collateralized by government or non-government securities. Upon settlement date, collateral is held in segregated accounts with custodian banks and may be obtained in the event of a default of the counterparty. The Fund monitors, on a daily basis, the value of the collateral to
Annual Report
4. Operating Policies - continued
Repurchase Agreements - continued
ensure it is at least equal to the principal amount of the repurchase agreement (including accrued interest). In the event of a default by the counterparty, realization of the collateral proceeds could be delayed, during which time the value of the collateral may decline.
Restricted Securities. The Fund may invest in securities that are subject to legal or contractual restrictions on resale. These securities generally may be resold in transactions exempt from registration or to the public if the securities are registered. Disposal of these securities may involve time-consuming negotiations and expense, and prompt sale at an acceptable price may be difficult. Information regarding restricted securities is included at the end of the Fund's Schedule of Investments.
5. Purchases and Sales of Investments.
Purchases and sales of securities, short-term securities, aggregated $130,088,576 and $52,054,096, respectively.
6. Fees and Other Transactions with Affiliates.
Management Fee. FMR and its affiliates provide the Fund with investment management related services for which the Fund pays a monthly management fee. The management fee is the sum of an individual fund fee rate that is based on an annual rate of .45% of the Fund's average net assets and a group fee rate that averaged .26% during the period. The group fee rate is based upon the average net assets of all the mutual funds advised by FMR. The group fee rate decreases as assets under management increase and increases as assets under management decrease. In addition, the management fee is subject to a performance adjustment (up to a maximum of ± .20% of the Fund's average net assets over the performance period). The upward or downward adjustment to the management fee is based on the investment performance of the Total International Equity Class as compared to an appropriate benchmark index. The Fund's performance period began on December 1, 2007 and subsequent months will be added until the performance period includes 36 months. The Fund's performance adjustment will take effect in November 2008. For the period, the total annual management fee rate was .71% of the Fund's average net assets.
Distribution and Service Plan. In accordance with Rule 12b-1 of the 1940 Act, the Fund has adopted separate Distribution and Service Plans for each class of shares. Certain classes pay Fidelity Distributors Corporation (FDC), an affiliate of FMR, separate Distribution and Service Fees, each of which is based on an annual percentage of each class' average net assets. In addition, FDC may pay financial intermediaries for selling shares of the Fund and providing shareholder support services. For the period,
Annual Report
Fidelity Total International Equity Fund
Notes to Financial Statements - continued
6. Fees and Other Transactions with Affiliates - continued
Distribution and Service Plan - continued
the Distribution and Service Fee rates and the total amounts paid to and retained by FDC were as follows:
| Distribution
Fee | Service
Fee | Paid to
FDC | Retained
by FDC |
Class A | -% | .25% | $ 17,319 | $ 11,412 |
Class T | .25% | .25% | 21,454 | 20,724 |
Class B | .75% | .25% | 42,037 | 41,866 |
Class C | .75% | .25% | 43,749 | 42,879 |
| | | $ 124,559 | $ 116,881 |
Sales Load. FDC receives a front-end sales charge of up to 5.75% for selling Class A shares, and 3.50% for selling Class T shares, some of which is paid to financial intermediaries for selling shares of the Fund. FDC receives the proceeds of contingent deferred sales charges levied on Class A, Class T, Class B, and Class C redemptions. These charges depend on the holding period. The deferred sales charges range from 5% to 1% for Class B, 1% for Class C, 1.00% to .50% for certain purchases of Class A shares and .25% for certain purchases of Class T shares.
For the period, sales charge amounts retained by FDC were as follows:
| Retained
by FDC |
Class A | $ 1,403 |
Class T | 263 |
Class B* | 267 |
Class C* | 220 |
| $ 2,153 |
* When Class B and Class C shares are initially sold, FDC pays commissions from its own resources to financial intermediaries through which the sales are made.
Transfer Agent Fees. Fidelity Investments Institutional Operations Company, Inc. (FIIOC), an affiliate of FMR, is the transfer, dividend disbursing and shareholder servicing agent for each class of the Fund. FIIOC receives account fees and asset-based fees that vary according to the account size and type of account of the shareholders of the respective classes of the Fund. FIIOC pays for typesetting, printing and mailing of
Annual Report
6. Fees and Other Transactions with Affiliates - continued
Transfer Agent Fees - continued
shareholder reports, except proxy statements. For the period, the total transfer agent fees paid by each class were as follows:
| Amount | % of
Average
Net Assets |
Class A | $ 11,710 | .17 |
Class T | 7,052 | .16 |
Class B | 6,840 | .16 |
Class C | 7,566 | .17 |
Total International Equity | 100,429 | .27 |
Institutional Class | 7,203 | .16 |
| $ 140,800 | |
Accounting and Security Lending Fees. Fidelity Service Company, Inc. (FSC), an affiliate of FMR, maintains the Fund's accounting records. The accounting fee is based on the level of average net assets for the month. Under a separate contract, FSC administers the security lending program. The security lending fee is based on the number and duration of lending transactions.
Brokerage Commissions. The Fund placed a portion of its portfolio transactions with brokerage firms which are affiliates of the investment adviser. The commissions paid to these affiliated firms were $1,684 for the period.
7. Committed Line of Credit.
The Fund participates with other funds managed by FMR in a $4.2 billion credit facility (the "line of credit") to be utilized for temporary or emergency purposes to fund shareholder redemptions or for other short-term liquidity purposes. The Fund has agreed to pay commitment fees on its pro rata portion of the line of credit, which amounted to $86 and is reflected in Miscellaneous Expense on the Statement of Operations. During the period, there were no borrowings on this line of credit.
8. Security Lending.
The Fund lends portfolio securities from time to time in order to earn additional income. On the settlement date of the loan, the Fund receives collateral (in the form of U.S. Treasury obligations, letters of credit and/or cash) against the loaned securities and maintains collateral in an amount not less than 100% of the market value of the loaned
Annual Report
Fidelity Total International Equity Fund
Notes to Financial Statements - continued
8. Security Lending - continued
securities during the period of the loan. The market value of the loaned securities is determined at the close of business of the Fund and any additional required collateral is delivered to the Fund on the next business day. If the borrower defaults on its obligation to return the securities loaned because of insolvency or other reasons, a fund could experience delays and costs in recovering the securities loaned or in gaining access to the collateral. Any cash collateral received is invested in the Fidelity Securities Lending Cash Central Fund. Security lending income represents the income earned on investing cash collateral, less fees and expenses associated with the loan, plus any premium payments that may be received on the loan of certain types of securities. Security lending income is presented in the Statement of Operations as a component of income from Fidelity Central Funds. Net income from lending portfolio securities during the period amounted to $685.
9. Expense Reductions.
FMR voluntarily agreed to reimburse each class to the extent annual operating expenses exceeded certain levels of average net assets as noted in the table below. Some expenses, for example interest expense, including commitment fees, are excluded from this reimbursement.
The following classes were in reimbursement during the period:
| Expense
Limitations | Reimbursement
from adviser |
Class A | 1.50% | $ 34,674 |
Class T | 1.75% | 28,711 |
Class B | 2.25% | 28,025 |
Class C | 2.25% | 29,021 |
Total International Equity | 1.25% | 239,225 |
Institutional Class | 1.25% | 28,855 |
| | $ 388,511 |
Many of the brokers with whom FMR places trades on behalf of the Fund provided services to the Fund in addition to trade execution. These services included payments of certain expenses on behalf of the Fund totaling $11,434 for the period.
Annual Report
10. Other.
The Fund's organizational documents provide former and current trustees and officers with a limited indemnification against liabilities arising in connection with the performance of their duties to the Fund. In the normal course of business, the Fund may also enter into contracts that provide general indemnifications. The Fund's maximum exposure under these arrangements is unknown as this would be dependent on future claims that may be made against the Fund. The risk of material loss from such claims is considered remote.
FMR or its affiliates were the owners of record of 32% of the total outstanding shares of the Fund.
During the period, Lehman Brothers Holdings, Inc. and certain of its affiliates (LBHI) sought protection under the insolvency laws of their jurisdictions of organization, including the United States, the United Kingdom and Japan. At the time LBHI's insolvency proceedings were instituted, the Fund had outstanding securities trades with counterparties affiliated with LBHI. As a result of the insolvency proceedings, LBHI is unable to fulfill its commitments and, in certain cases, the Fund may have terminated its trades and related agreements with the relevant entities and, where appropriate, is in the process of initiating claims for damages. FMR believes that the financial impact to the Fund relating to the terminated trades and agreements is immaterial.
11. Distributions to Shareholders.
Distributions to shareholders of each class were as follows:
| For the period
November 1, 2007
(commencement of operations) to
October 31, 2008 |
From net investment income | |
Total International Equity | $ 13,264 |
Institutional Class | 2,565 |
Total | $ 15,829 |
Annual Report
Fidelity Total International Equity Fund
Notes to Financial Statements - continued
12. Share Transactions.
Transactions for each class of shares were as follows:
| Shares | Dollars |
| For the period
November 1, 2007
(commencement of operations) to
October 31, 2008 | For the period
November 1, 2007
(commencement of operations) to
October 31, 2008 |
Class A | | |
Shares sold | 1,253,571 | $ 11,409,450 |
Shares redeemed | (39,357) | (262,908) |
Net increase (decrease) | 1,214,214 | $ 11,146,542 |
Class T | | |
Shares sold | 536,757 | $ 5,311,723 |
Shares redeemed | (11,156) | (95,096) |
Net increase (decrease) | 525,601 | $ 5,216,627 |
Class B | | |
Shares sold | 516,780 | $ 5,142,958 |
Shares redeemed | (1,184) | (8,679) |
Net increase (decrease) | 515,596 | $ 5,134,279 |
Class C | | |
Shares sold | 576,912 | $ 5,653,538 |
Shares redeemed | (3,409) | (27,077) |
Net increase (decrease) | 573,503 | $ 5,626,461 |
Total International Equity | | |
Shares sold | 7,339,025 | $ 65,416,828 |
Reinvestment of distributions | 1,313 | 12,459 |
Shares redeemed | (2,605,609) | (20,217,092) |
Net increase (decrease) | 4,734,729 | $ 45,212,195 |
Institutional Class | | |
Shares sold | 559,428 | $ 5,503,211 |
Reinvestment of distributions | 270 | 2,565 |
Shares redeemed | (2,678) | (17,158) |
Net increase (decrease) | 557,020 | $ 5,488,618 |
Annual Report
To the Trustees of Fidelity Investment Trust and Shareholders of Fidelity Total International Equity Fund:
We have audited the accompanying statement of assets and liabilities of Fidelity Total International Equity Fund (the Fund), a fund of Fidelity Investment Trust, including the schedule of investments, as of October 31, 2008, and the related statement of operations, the statement of changes in net assets and the financial highlights for the period from November 1, 2007 (Commencement of Operations) to October 31, 2008. These financial statements and financial highlights are the responsibility of the Fund's management. Our responsibility is to express an opinion on these financial statements and financial highlights based on our audit.
We conducted our audit in accordance with standards of the Public Company Accounting Oversight Board (United States). Those standards require that we plan and perform the audit to obtain reasonable assurance about whether the financial statements and financial highlights are free of material misstatement. The Fund is not required to have, nor were we engaged to perform, an audit of its internal control over financial reporting. Our audits included consideration of internal control over financial reporting as a basis for designing audit procedures that are appropriate in the circumstances, but not for the purpose of expressing an opinion on the effectiveness of the Fund's internal control over financial reporting. Accordingly, we express no such opinion. An audit also includes examining, on a test basis, evidence supporting the amounts and disclosures in the financial statements, assessing the accounting principles used and significant estimates made by management, as well as evaluating the overall financial statement presentation. Our procedures included confirmation of securities owned as of October 31, 2008, by correspondence with the custodians and brokers; where replies were not received from brokers, we performed other auditing procedures. We believe that our audit provides a reasonable basis for our opinion.
In our opinion, the financial statements and financial highlights referred to above present fairly, in all material respects, the financial position of Fidelity Total International Equity Fund as of October 31, 2008, the results of its operations, the changes in its net assets and its financial highlights for the period from November 1, 2007 (Commencement of Operations) to October 31, 2008, in conformity with accounting principles generally accepted in the United States of America.
/s/ Deloitte & Touche LLP
DELOITTE & TOUCHE LLP
Boston, Massachusetts
December 23, 2008
Annual Report
The Trustees, Member of the Advisory Board, and executive officers of the trust and fund, as applicable, are listed below. The Board of Trustees governs the fund and is responsible for protecting the interests of shareholders. The Trustees are experienced executives who meet periodically throughout the year to oversee the fund's activities, review contractual arrangements with companies that provide services to the fund, and review the fund's performance. Except for Edward C. Johnson 3d and James C. Curvey, each of the Trustees oversees 220 funds advised by FMR or an affiliate. Messrs. Johnson and Curvey oversee 379 funds advised by FMR or an affiliate.
The Trustees hold office without limit in time except that (a) any Trustee may resign; (b) any Trustee may be removed by written instrument, signed by at least two-thirds of the number of Trustees prior to such removal; (c) any Trustee who requests to be retired or who has become incapacitated by illness or injury may be retired by written instrument signed by a majority of the other Trustees; and (d) any Trustee may be removed at any special meeting of shareholders by a two-thirds vote of the outstanding voting securities of the trust. Each Trustee who is not an interested person (as defined in the 1940 Act) (Independent Trustee), shall retire not later than the last day of the calendar year in which his or her 72nd birthday occurs. The Independent Trustees may waive this mandatory retirement age policy with respect to individual Trustees. The executive officers and Advisory Board Member hold office without limit in time, except that any officer and Advisory Board Member may resign or may be removed by a vote of a majority of the Trustees at any regular meeting or any special meeting of the Trustees. Except as indicated, each individual has held the office shown or other offices in the same company for the past five years.
The fund's Statement of Additional Information (SAI) includes more information about the Trustees. To request a free copy, call Fidelity at 1-877-208-0098.
Interested Trustees*:
Correspondence intended for each Trustee who is an interested person may be sent to Fidelity Investments, 82 Devonshire Street, Boston, Massachusetts 02109.
Name, Age; Principal Occupation |
Edward C. Johnson 3d (78) |
| Year of Election or Appointment: 1984 Mr. Johnson is Chairman of the Board of Trustees. Mr. Johnson serves as Chief Executive Officer, Chairman, and a Director of FMR LLC; Chairman and a Director of FMR; Chairman and a Director of Fidelity Research & Analysis Company (FRAC); Chairman and a Director of Fidelity Investments Money Management, Inc.; and Chairman and a Director of FMR Co., Inc. In addition, Mr. Johnson serves as Chairman and Director of FIL Limited. Previously, Mr. Johnson served as President of FMR LLC (2006-2007). |
James C. Curvey (73) |
| Year of Election or Appointment: 2007 Mr. Curvey also serves as Trustee (2007-present) of other investment companies advised by FMR. Mr. Curvey is a Director of FMR and FMR Co., Inc. (2007-present). Mr. Curvey is also Vice Chairman (2006-
present) and Director of FMR LLC. In addition, Mr. Curvey serves as an Overseer for the Boston Symphony Orchestra and a member of the Trustees of Villanova University. |
* Trustees have been determined to be "Interested Trustees" by virtue of, among other things, their affiliation with the trust or various entities under common control with FMR. FMR Corp. merged with and into FMR LLC on October 1, 2007. Any references to FMR LLC for prior periods are deemed to be references to the prior entity.
Independent Trustees:
Correspondence intended for each Independent Trustee (that is, the Trustees other than the Interested Trustees) may be sent to Fidelity Investments, P.O. Box 55235, Boston, Massachusetts 02205-5235.
Name, Age; Principal Occupation |
Dennis J. Dirks (60) |
| Year of Election or Appointment: 2005 Prior to his retirement in May 2003, Mr. Dirks was Chief Operating Officer and a member of the Board of The Depository Trust & Clearing Corporation (DTCC) (1999-2003). He also served as President, Chief Operating Officer, and Board member of The Depository Trust Company (DTC) (1999-2003) and President and Board member of the National Securities Clearing Corporation (NSCC) (1999-2003). In addition, Mr. Dirks served as a Trustee and a member of the Finance Committee of Manhattan College (2005-2008), and as Chief Executive Officer and Board member of the Government Securities Clearing Corporation (2001-2003) and Chief Executive Officer and Board member of the Mortgage-Backed Securities Clearing Corporation (2001-2003). Mr. Dirks also serves as a Trustee and a member of the Finance Committee of AHRC of Nassau County (2006-present). |
Alan J. Lacy (55) |
| Year of Election or Appointment: 2008 Mr. Lacy serves as Senior Adviser (2007-present) of Oak Hill Capital Partners, L.P. (a private equity firm). Mr. Lacy also served as Chief Executive Officer (2000-2005) and Vice Chairman (2005-2006) of Sears Holdings Corporation and Sears, Roebuck and Co. (retail). In addition, Mr. Lacy serves as a member of the Board of Directors of The Western Union Company (global money transfer, 2006-present) and Bristol-Myers Squibb (global pharmaceuticals, 2007-present). Mr. Lacy is a Trustee of the National Parks Conservation Association and The Field Museum of Natural History. |
Ned C. Lautenbach (64) |
| Year of Election or Appointment: 2000 Mr. Lautenbach is Chairman of the Independent Trustees (2006-present). Mr. Lautenbach is an Advisory Partner of Clayton, Dubilier & Rice, Inc. (private equity investment firm). Previously, Mr. Lautenbach was with the International Business Machines Corporation (IBM) from 1968 until his retirement in 1998. Mr. Lautenbach serves as a Director of Eaton Corporation (diversified industrial) as well as the Philharmonic Center for the Arts in Naples, Florida. He also is a member of the Board of Trustees of Fairfield University (2005-present), as well as a member of the Council on Foreign Relations. Previously, Mr. Lautenbach served as a Director of Sony Corporation (2006-2007). |
Joseph Mauriello (64) |
| Year of Election or Appointment: 2008 Prior to his retirement in January 2006, Mr. Mauriello served in numerous senior management positions including Deputy Chairman and Chief Operating Officer (2004-2005), and Vice Chairman of Financial Services (2002-2004) of KPMG LLP US (professional services firm, 1965-
2005). Mr. Mauriello currently serves as a member of the Board of Directors of XL Capital Ltd. (global insurance and re-insurance company, 2006-present) and of Arcadia Resources Inc. (health care services and products, 2007-present). He also served as a Director of the Hamilton Funds of the Bank of New York (2006-2007). |
Cornelia M. Small (64) |
| Year of Election or Appointment: 2005 Ms. Small is a member of the Investment Committee, and Chair (2008-present) and a member of the Board of Trustees of Smith College. Ms. Small also serves on the Investment Committee of the Berkshire Taconic Community Foundation (2008-present). Previously, Ms. Small served as Chairperson of the Investment Committee (2002-2008) of Smith College and as Co-Chair (2000-2003) of the Annual Fund for the Fletcher School of Law and Diplomacy. In addition, she served as Chief Investment Officer, Director of Global Equity Investments, and a member of the Board of Directors of Scudder, Stevens & Clark and Scudder Kemper Investments. |
William S. Stavropoulos (69) |
| Year of Election or Appointment: 2001 Mr. Stavropoulos is Chairman Emeritus of the Board of Directors of The Dow Chemical Company, where he previously served in numerous senior management positions, including President (1993-2000; 2002-
2003), CEO (1995-2000; 2002-2004), Chairman of the Executive Committee (2000-2006), and as a member of the Board of Directors (1990-2006). Currently, he is a Director of Teradata Corporation (data warehousing and technology solutions, 2008-present), Chemical Financial Corporation, Maersk Inc. (industrial conglomerate), Tyco International, Inc. (multinational manufacturing and services, 2007-present), and a member of the Advisory Board for Metalmark Capital (private equity investment firm, 2005-present). He is a special advisor to Clayton, Dubilier & Rice, Inc. (private equity investment). In addition, Mr. Stavropoulos is a member of the University of Notre Dame Advisory Council for the College of Science. |
David M. Thomas (59) |
| Year of Election or Appointment: 2008 Previously, Mr. Thomas served as Executive Chairman (2005-2006) and Chairman and Chief Executive Officer (2000-2005) of IMS Health, Inc. (pharmaceutical and healthcare information solutions). In addition, Mr. Thomas serves as a member of the Board of Directors of Fortune Brands, Inc. (consumer products holding company), and Interpublic Group of Companies, Inc. (marketing communication, 2004-present). |
Michael E. Wiley (58) |
| Year of Election or Appointment: 2008 Mr. Wiley also serves as a member of the Board of Trustees of the University of Tulsa (2000-2006; 2007-present). He serves as a Director of Tesoro Corporation (independent oil refiner and marketer, 2005-
present), and a Director of Bill Barrett Corporation (exploration and production company, 2005-present). In addition, he also serves as a Director of Post Oak Bank (privately-held bank, 2004-present). Previously, Mr. Wiley served as a Sr. Energy Advisor of Katzenbach Partners, LLC (consulting firm, 2006-2007), as an Advisory Director of Riverstone Holdings (private investment firm), Chairman, President, and CEO of Baker Hughes, Inc. (oilfield services company, 2000-2004), and as Director of Spinnaker Exploration Company (exploration and production company, 2001-2005). |
Advisory Board Member and Executive Officers**:
Correspondence intended for each executive officer and Mr. Lynch may be sent to Fidelity Investments, 82 Devonshire Street, Boston, Massachusetts 02109.
Name, Age; Principal Occupation |
Peter S. Lynch (64) |
| Year of Election or Appointment: 2003 Member of the Advisory Board of Fidelity's Equity and High Income Funds. Mr. Lynch is Vice Chairman and a Director of FMR, and Vice Chairman (2001-present) and a Director of FMR Co., Inc. Previously, Mr. Lynch served as a Trustee of the Fidelity funds (1990-2003). In addition, he serves as a Trustee of Boston College and as the Chairman of the Inner-City Scholarship Fund. Previously, Mr. Lynch served on the Special Olympics International Board of Directors (1997-2006). |
Kenneth B. Robins (39) |
| Year of Election or Appointment: 2008 President and Treasurer of Fidelity's Equity and High Income Funds. Mr. Robins is an employee of Fidelity Investments (2004-present). Before joining Fidelity Investments, Mr. Robins worked at KPMG LLP, where he was a partner in KPMG's department of professional practice (2002-2004). |
Walter C. Donovan (46) |
| Year of Election or Appointment: 2007 Vice President of Fidelity's Equity Funds. Mr. Donovan also serves as President of FMR and FMR Co., Inc., and Executive Vice President of Fidelity Investments Money Management, Inc. (2007-present). Previously, Mr. Donovan served as Executive Vice President of FMR and FMR Co., Inc. (2005-2007) and Senior Vice President of FMR (2003-2005) and FMR Co., Inc. (2004-2005). |
Eric M. Wetlaufer (46) |
| Year of Election or Appointment: 2006 Vice President of Fidelity's International Equity Funds. Mr. Wetlaufer also serves as Group Chief Investment Officer of FMR. Mr. Wetlaufer is Chairman, Chief Executive Officer, and President of Fidelity Management & Research (Hong Kong) Limited (2008-present); Chairman, Chief Executive Officer, President, and a Director of Fidelity Management & Research (Japan) Inc. (2008-present); Chairman and Chief Executive Officer (2007-present) and President and a Director (2006-present) of Fidelity Management & Research (U.K.) Inc. and President and a Director of Fidelity Research & Analysis Company (2006-present). Before joining Fidelity Investments in 2005, Mr. Wetlaufer was a partner in Oxhead Capital Management (2004-2005) and a Chief Investment Officer of Putnam Investments (1997-2003). |
Scott C. Goebel (40) |
| Year of Election or Appointment: 2008 Secretary and Chief Legal Officer (CLO) of the Fidelity funds. Mr. Goebel also serves as General Counsel, Secretary, and Senior Vice President of FMR (2008-present); Deputy General Counsel of FMR LLC; Chief Legal Secretary of Fidelity Management & Research (Hong Kong) Limited (2008-present) and Assistant Secretary of Fidelity Management & Research (Japan) Inc. (2008-present). Previously, Mr. Goebel served as Assistant Secretary of the Funds (2007-2008) and as Vice President and Secretary of Fidelity Distributors Corporation (FDC) (2005-2007). |
John B. McGinty, Jr. (46) |
| Year of Election or Appointment: 2008 Assistant Secretary of Fidelity's Equity and High Income Funds. Mr. McGinty is an employee of Fidelity Investments (2004-present). Mr. McGinty also serves as Senior Vice President, Secretary, and Chief Legal Officer of FDC (2007-present). Before joining Fidelity Investments, Mr. McGinty practiced law at Ropes & Gray, LLP. |
Holly C. Laurent (54) |
| Year of Election or Appointment: 2008 Anti-Money Laundering (AML) Officer of the Fidelity funds. Ms. Laurent is an employee of Fidelity Investments. Previously, Ms. Laurent was Senior Vice President and Head of Legal for Fidelity Business Services India Pvt. Ltd. (2006-2008), Senior Vice President, Deputy General Counsel and Group Head for FMR LLC (2005-2006). |
Christine Reynolds (50) |
| Year of Election or Appointment: 2008 Chief Financial Officer of the Fidelity funds. Ms. Reynolds became President of Fidelity Pricing and Cash Management Services (FPCMS) in August 2008. She served as Chief Operating Officer of FPCMS from 2007 through July 2008. Previously, Ms. Reynolds served as President, Treasurer, and Anti-Money Laundering officer of the Fidelity funds (2004-
2007). Before joining Fidelity Investments, Ms. Reynolds worked at PricewaterhouseCoopers LLP (PwC) (1980-2002), where she was an audit partner with PwC's investment management practice. |
Kenneth A. Rathgeber (61) |
| Year of Election or Appointment: 2004 Chief Compliance Officer of Fidelity's Equity and High Income Funds. Mr. Rathgeber is Chief Compliance Officer of Fidelity Management & Research (Hong Kong) Limited (2008-present), Fidelity Management & Research (Japan) Inc. (2008-present), FMR (2005-present), FMR Co., Inc. (2005-present), Fidelity Management & Research (U.K.) Inc. (2005-
present), Fidelity Research & Analysis Company (2005-present), Fidelity Investments Money Management, Inc. (2005-present), and Strategic Advisers, Inc. (2005-present). |
Bryan A. Mehrmann (47) |
| Year of Election or Appointment: 2005 Deputy Treasurer of the Fidelity funds. Mr. Mehrmann is an employee of Fidelity Investments. Previously, Mr. Mehrmann served as Vice President of Fidelity Investments Institutional Services Group (FIIS)/Fidelity Investments Institutional Operations Corporation, Inc. (FIIOC) Client Services (1998-2004). |
Adrien E. Deberghes (41) |
| Year of Election or Appointment: 2008 Deputy Treasurer of Fidelity's Equity and High Income Funds. Mr. Deberghes is an employee of Fidelity Investments (2008-present). Previously, Mr. Deberghes served as Senior Vice President of Mutual Fund Administration at State Street Corporation (2007-2008), Senior Director of Mutual Fund Administration at Investors Bank & Trust (2005-2007), and Director of Finance for Dunkin' Brands (2000-2005). |
Robert G. Byrnes (41) |
| Year of Election or Appointment: 2005 Assistant Treasurer of the Fidelity funds. Mr. Byrnes is an employee of Fidelity Investments (2005-present). Previously, Mr. Byrnes served as Vice President of Fidelity Pricing and Cash Management Services (FPCMS) (2003-2005). Before joining Fidelity Investments, Mr. Byrnes worked at Deutsche Asset Management where he served as Vice President of the Investment Operations Group (2000-2003). |
Peter L. Lydecker (54) |
| Year of Election or Appointment: 2004 Assistant Treasurer of the Fidelity funds. Mr. Lydecker is an employee of Fidelity Investments. |
Paul M. Murphy (61) |
| Year of Election or Appointment: 2007 Assistant Treasurer of the Fidelity funds. Mr. Murphy is an employee of Fidelity Investments (2007-present). Previously, Mr. Murphy served as Chief Financial Officer of the Fidelity Funds (2005-2006), Vice President and Associate General Counsel of FMR (2007), and Senior Vice President of Fidelity Pricing and Cash Management Services (FPCMS) (1994-2007). |
Gary W. Ryan (50) |
| Year of Election or Appointment: 2005 Assistant Treasurer of the Fidelity funds. Mr. Ryan is an employee of Fidelity Investments. Previously, Mr. Ryan served as Vice President of Fund Reporting in Fidelity Pricing and Cash Management Services (FPCMS) (1999-2005). |
** FMR Corp. merged with and into FMR LLC on October 1, 2007. Any references to FMR LLC for prior periods are deemed to be references to the prior entity.
Annual Report
Class A, Class T, Class B, and Class C designate 100% of the dividends distributed during the fiscal year as amounts which may be taken into account as a dividend for purposes of the maximum rate under section 1(h)(11) of the Internal Revenue Code.
The fund will notify shareholders in January 2009 of amounts for use in preparing 2008 income tax returns.
Annual Report
A special meeting of the fund's shareholders was held on April 16, 2008. The results of votes taken among shareholders on the proposal before them are reported below. Each vote reported represents one dollar of net asset value held on the record date for the meeting.
PROPOSAL 1 |
To elect a Board of Trustees.A |
| # of
Votes | % of
Votes |
James C. Curvey |
Affirmative | 44,485,656,811.55 | 94.702 |
Withheld | 2,488,551,854.62 | 5.298 |
TOTAL | 46,974,208,666.17 | 100.000 |
Dennis J. Dirks |
Affirmative | 44,706,671,638.31 | 95.173 |
Withheld | 2,267,537,027.86 | 4.827 |
TOTAL | 46,974,208,666.17 | 100.000 |
Edward C. Johnson 3d |
Affirmative | 44,294,881,638.16 | 94.296 |
Withheld | 2,679,327,028.01 | 5.704 |
TOTAL | 46,974,208,666.17 | 100.000 |
Alan J. Lacy |
Affirmative | 44,685,373,413.16 | 95.127 |
Withheld | 2,288,835,253.01 | 4.873 |
TOTAL | 46,974,208,666.17 | 100.000 |
Ned C. Lautenbach |
Affirmative | 44,634,541,379.41 | 95.019 |
Withheld | 2,339,667,286.76 | 4.981 |
TOTAL | 46,974,208,666.17 | 100.000 |
Joseph Mauriello |
Affirmative | 44,683,962,099.80 | 95.124 |
Withheld | 2,290,246,566.37 | 4.876 |
TOTAL | 46,974,208,666.17 | 100.000 |
| # of
Votes | % of
Votes |
Cornelia M. Small |
Affirmative | 44,671,688,375.36 | 95.098 |
Withheld | 2,302,520,290.81 | 4.902 |
TOTAL | 46,974,208,666.17 | 100.000 |
William S. Stavropoulos |
Affirmative | 44,465,262,087.61 | 94.659 |
Withheld | 2,508,946,578.56 | 5.341 |
TOTAL | 46,974,208,666.17 | 100.000 |
David M. Thomas |
Affirmative | 44,694,340,813.87 | 95.147 |
Withheld | 2,279,867,852.30 | 4.853 |
TOTAL | 46,974,208,666.17 | 100.000 |
Michael E. Wiley |
Affirmative | 44,686,513,174.78 | 95.130 |
Withheld | 2,287,695,491.39 | 4.870 |
TOTAL | 46,974,208,666.17 | 100.000 |
A Denotes trust-wide proposal and voting results.
Annual Report
Board Approval of Investment Advisory Contracts and Management Fees
Fidelity Total International Equity Fund
Each year, typically in July, the Board of Trustees, including the Independent Trustees (together, the Board), votes on the renewal of the management contract and sub-advisory agreements (together, the Advisory Contracts) for the fund. The Board, assisted by the advice of fund counsel and Independent Trustees' counsel, requests and considers a broad range of information throughout the year.
The Board meets regularly and, acting directly and through its separate committees, requests and receives information concerning, and considers at each of its meetings factors that are relevant to, its annual consideration of the renewal of the fund's Advisory Contracts, including the services and support provided to the fund and its shareholders. At the time of the renewal, the Board had 12 standing committees, each composed of Independent Trustees with varying backgrounds, to which the Board has assigned specific subject matter responsibilities in order to enhance effective decision-making by the Board. Each committee has a written charter outlining the structure and purposes of the committee. The Board also meets as needed to consider matters specifically related to the Board's annual consideration of the renewal of Advisory Contracts.
At its July 2008 meeting, the Board of Trustees, including the Independent Trustees, unanimously determined to renew the fund's Advisory Contracts. In reaching its determination, the Board considered all factors it believed relevant, including (i) the nature, extent, and quality of the services to be provided to the fund and its shareholders (including the investment performance of the fund); (ii) the competitiveness of the fund's management fee and total expenses; (iii) the total costs of the services to be provided by and the profits to be realized by Fidelity from its relationship with the fund; (iv) the extent to which economies of scale would be realized as the fund grows; and (v) whether fee levels reflect these economies of scale, if any, for the benefit of fund shareholders. The Board also approved agreements with foreign sub-advisers Fidelity Management & Research (Japan) Inc. and Fidelity Management & Research (Hong Kong) Limited, as well as amendments to the fund's agreement with Fidelity Management & Research (U.K.) Inc.
In considering whether to renew the Advisory Contracts for the fund, the Board ultimately reached a determination, with the assistance of fund counsel and Independent Trustees' counsel and through the exercise of its business judgment, that the renewal of the Advisory Contracts and the compensation to be received by Fidelity under the management contract is consistent with Fidelity's fiduciary duty under applicable law. The Board's decision to renew the Advisory Contracts was not based on any single factor noted above, but rather was based on a comprehensive consideration of all the information provided to the Board at its meetings throughout the year. The Board, in reaching its determination to renew the Advisory Contracts, is aware that shareholders in the fund have a broad range of investment choices available to them, including a wide choice among mutual funds offered by competitors to Fidelity, and that the fund's shareholders, with the opportunity to review and weigh the disclosure provided by the fund in its prospectus and other public disclosures, have chosen to invest in this fund, managed by Fidelity.
Annual Report
Board Approval of Investment Advisory Contracts and
Management Fees - continued
Nature, Extent, and Quality of Services Provided. The Board considered staffing within the investment adviser, FMR, and the sub-advisers (together, the Investment Advisers), including the backgrounds of the fund's investment personnel and the fund's investment objective and discipline. The Independent Trustees also had discussions with senior management of Fidelity's investment operations and investment groups. The Board considered the structure of the portfolio manager compensation program and whether this structure provides appropriate incentives.
Resources Dedicated to Investment Management and Support Services. The Board reviewed the size, education, and experience of the Investment Advisers' investment staff, their use of technology, and the Investment Advisers' approach to recruiting, training, and retaining portfolio managers and other research, advisory, and management personnel. The Board noted that Fidelity's analysts have access to a variety of technological tools that enable them to perform both fundamental and quantitative analysis and to specialize in various disciplines. The Board considered Fidelity's extensive global research capabilities that enable the Investment Advisers to aggregate data from various sources in an effort to produce positive investment results. The Board also considered that Fidelity's portfolio managers and analysts have access to daily portfolio attribution that allows for monitoring of a fund's portfolio, as well as an electronic communication system that provides immediate real-time access to research concerning issuers and credit enhancers.
Shareholder and Administrative Services. The Board considered (i) the nature, extent, quality, and cost of advisory, administrative, distribution, and shareholder services performed by the Investment Advisers and their affiliates under the Advisory Contracts and under separate agreements covering transfer agency, pricing and bookkeeping, fund-paid 12b-1 fees, and securities lending services for the fund; (ii) the nature and extent of the Investment Advisers' supervision of third party service providers, principally custodians and subcustodians; and (iii) the resources devoted to, and the record of compliance with, the fund's compliance policies and procedures. The Board also reviewed the allocation of fund brokerage, including allocations to brokers affiliated with the Investment Advisers, the use of brokerage commissions to pay fund expenses, and the use of "soft" commission dollars to pay for research services. The Board further considered that Fidelity voluntarily pays for market data out of its own resources.
The Board noted that the growth of fund assets across the complex allows Fidelity to reinvest in the development of services designed to enhance the value or convenience of the Fidelity funds as investment vehicles. These services include 24-hour access to account information and market information through phone representatives and over the Internet, and investor education materials and asset allocation tools.
Annual Report
Investment in a Large Fund Family. The Board considered the benefits to shareholders of investing in a Fidelity fund, including the benefits of investing in a fund that is part of a large family of funds offering a variety of investment disciplines and providing for a large variety of mutual fund investor services. For example, fund shareholders are offered the privilege of exchanging shares of the fund for shares of other Fidelity funds, as set forth in the fund's prospectus, without paying a sales charge. The Board noted that Fidelity has taken a number of actions over the previous year that benefited particular funds, including (i) dedicating additional resources to investment research and to restructure the investment research teams; (ii) contractually agreeing to reduce the management fees on Fidelity's Institutional Money Market Funds and launching Class IV and Institutional Class of certain of these funds; (iii) reducing the transfer agent fees for the Fidelity Select Portfolios and Investor Class of the VIP funds; and (iv) launching Class K of 29 equity funds as a lower-fee class available to certain employer-sponsored retirement plans.
Investment Performance. The Board considered whether the fund has operated within its investment objective, as well as its record of compliance with its investment restrictions. The Board noted that it is not possible to evaluate performance in any comprehensive fashion because the fund had been in operation for less than one calendar year. Once the fund has been in operation for at least one calendar year, the Board will review the fund's absolute investment performance for each class, as well as the fund's relative investment performance for each class measured against a broad-based securities market index and a peer group of mutual funds.
The Board considered that FMR has taken steps to refocus and strengthen equity research, equity portfolio management, and compliance.
Based on its review, and giving particular weight to the nature and quality of the resources dedicated by the Investment Advisers to maintain and improve relative performance, the Board concluded that the nature, extent, and quality of the services provided to the fund will benefit the fund's shareholders, particularly in light of the Board's view that the fund's shareholders benefit from investing in a fund that is part of a large family of funds offering a variety of investment disciplines and services.
Competitiveness of Management Fee and Total Fund Expenses. The Board considered the fund's management fee and total expenses compared to "mapped groups" of competitive funds and classes. Fidelity creates "mapped groups" by combining similar Lipper investment objective categories that have comparable management fee characteristics. Combining Lipper investment objective categories aids the Board's management fee and total expense comparisons by broadening the competitive group used for comparison and by reducing the number of universes to which various Fidelity funds are compared. The Board also considered supplemental information about how the fund's management fee and total expenses ranked relative to groups based on Lipper classifications, which take into account a fund's market capitalization and style.
Annual Report
Board Approval of Investment Advisory Contracts and
Management Fees - continued
The Board considered two proprietary management fee comparisons for the period of the fund's operations shown in the chart below. The group of Lipper funds used by the Board for management fee comparisons is referred to below as the "Total Mapped Group." The Total Mapped Group comparison focuses on a fund's standing relative to the total universe of comparable funds available to investors, in terms of gross management fees before expense reimbursements or caps. "TMG %" represents the percentage of funds in the Total Mapped Group that had management fees that were lower than the fund's. For example, a TMG % of 14% means that 86% of the funds in the Total Mapped Group had higher management fees than the fund. The "Asset-Size Peer Group" (ASPG) comparison focuses on a fund's standing relative to non-Fidelity funds similar in size to the fund within the Total Mapped Group. The ASPG represents at least 15% of the funds in the Total Mapped Group with comparable asset size and management fee characteristics, subject to a minimum of 50 funds (or all funds in the Total Mapped Group if fewer than 50). Additional information, such as the ASPG quartile in which the fund's management fee ranked, is also included in the chart and considered by the Board.
Fidelity Total International Equity Fund
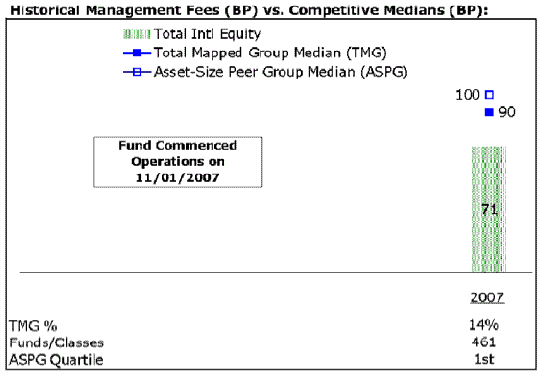
The Board noted that the fund's management fee ranked below the median of its Total Mapped Group and below the median of its ASPG for the period.
Furthermore, the Board considered that the fund's management fee includes a performance adjustment component (that is, the fund's management fee will be subject to upward or downward adjustment depending upon whether, and to what extent, the fund's investment performance for the performance period exceeds, or is exceeded by, the record (over the same period) of a Board-approved performance adjustment index). The performance adjustment will take effect on November 1, 2008, after the period shown in the chart above.
Annual Report
Based on its review, the Board concluded that the fund's management fee was fair and reasonable in light of the services that the fund receives and the other factors considered.
In its review of each class's total expenses, the Board considered the fund's management fee as well as other fund or class expenses, as applicable, such as transfer agent fees, pricing and bookkeeping fees, fund-paid 12b-1 fees, and custodial, legal, and audit fees. The Board also noted the effects of any waivers and reimbursements on fees and expenses. As part of its review, the Board also considered current and historical total expenses of each class of the fund compared to competitive fund median expenses. Each class of the fund is compared to those funds and classes in the Total Mapped Group (used by the Board for management fee comparisons) that have a similar sales load structure.
The Board noted that the total expenses of each of Class A and Fidelity Total International Equity (retail class) ranked equal to its competitive median for the period and the total expenses of each of Class T, Class B, Class C, and Institutional Class ranked above its competitive median for the period. The Board considered that the total expenses of Class T were above the median primarily because its 12b-1 fee is higher than the typical front-end load class. The Board noted that the fund offers multiple classes, each of which has a different sales load and 12b-1 fee structure, and that the multiple structures are intended to offer a range of pricing options for the intermediary market. The Board also noted that the total expenses of the classes vary primarily by the level of their 12b-1 fees, although differences in transfer agent fees may also cause expenses to vary from class to class.
In its review of total expenses, the Board also considered Fidelity fee structures and other information on clients that FMR and its affiliates service in other competitive markets, such as other mutual funds advised or subadvised by FMR or its affiliates, pension plan clients, and other institutional clients.
Based on its review, the Board concluded that the total expenses of each class of the fund were reasonable, although in some cases above the median of the universe presented for comparison, in light of the services that the fund and its shareholders receive and the other factors considered.
Costs of the Services and Profitability. The Board considered the revenues earned and the expenses incurred by Fidelity in conducting the business of developing, marketing, distributing, managing, administering and servicing the fund and its shareholders. The Board also considered the level of Fidelity's profits in respect of all the Fidelity funds.
Annual Report
Board Approval of Investment Advisory Contracts and
Management Fees - continued
On an annual basis, FMR presents to the Board Fidelity's profitability for the fund. Fidelity calculates the profitability for each fund, as well as aggregate profitability for groups of Fidelity funds and all Fidelity funds, using a series of detailed revenue and cost allocation methodologies which originate with the audited books and records of Fidelity. The Audit Committee of the Board reviews any significant changes from the prior year's methodologies.
PricewaterhouseCoopers LLP (PwC), independent registered public accounting firm and auditor to Fidelity and certain Fidelity funds, has been engaged annually by the Board as part of the Board's assessment of the results of Fidelity's profitability analysis. PwC's engagement includes the review and assessment of Fidelity's methodologies used in determining the revenues and expenses attributable to Fidelity's mutual fund business, and completion of agreed-upon procedures surrounding the mathematical accuracy of fund profitability and its conformity to allocation methodologies. After considering PwC's reports issued under the engagement and information provided by Fidelity, the Board believes that while other allocation methods may also be reasonable, Fidelity's profitability methodologies are reasonable in all material respects.
The Board has also reviewed Fidelity's non-fund businesses and any fall-out benefits related to the mutual fund business as well as cases where Fidelity's affiliates may benefit from or be related to the fund's business.
The Board considered the costs of the services provided by and the profits realized by Fidelity in connection with the operation of the fund and determined that the amount of profit is a fair entrepreneurial profit for the management of the fund.
Economies of Scale. The Board considered whether there have been economies of scale in respect of the management of the Fidelity funds, whether the Fidelity funds (including the fund) have appropriately benefited from any such economies of scale, and whether there is potential for realization of any further economies of scale. The Board considered the extent to which the fund will benefit from economies of scale through increased services to the fund, through waivers or reimbursements, or through fee or expense reductions.
The Board recognized that the fund's management contract incorporates a "group fee" structure, which provides for lower group fee rates as total fund assets under FMR's management increase, and for higher group fee rates as total fund assets under FMR's management decrease. FMR determines the group fee rates based on a tiered asset "breakpoint" schedule. The Board considered that the group fee is designed to deliver the benefits of economies of scale to fund shareholders when total fund assets increase, even if assets of any particular fund are unchanged or have declined, because some portion of Fidelity's costs are attributable to services provided to all Fidelity funds, and all funds benefit if those costs can be allocated among more assets. The Board concluded that, given the group fee structure, fund shareholders will achieve a certain level of economies of scale as assets under FMR's management increase at the fund complex level, regardless of whether Fidelity achieves any such economies of scale.
Annual Report
The Board further concluded that any potential economies of scale are being shared between fund shareholders and Fidelity in an appropriate manner.
Additional Information Requested by the Board. In order to develop fully the factual basis for consideration of the Fidelity funds' Advisory Contracts, the Board requested and received additional information on certain topics, including (i) fund performance trends and actions to be taken by FMR to improve certain funds' overall performance; (ii) portfolio manager changes that have occurred during the past year; (iii) Fidelity's fund profitability methodology, the profitability of certain fund service providers, and profitability trends for certain funds; (iv) Fidelity's compensation structure for portfolio managers and key personnel, including its effects on fund profitability and the extent to which portfolio manager compensation is linked to fund performance; (v) Fidelity's fee structures and rationale for recommending different fees among categories of funds; and (vi) Fidelity's rationale for recommending which funds should have a performance adjustment component as part of their management fees.
Based on its evaluation of all of the conclusions noted above, and after considering all material factors, the Board ultimately concluded that the advisory fee structures are fair and reasonable, and that the fund's Advisory Contracts should be renewed.
Annual Report
Investment Adviser
Fidelity Management & Research Company
Boston, MA
Investment Sub-Advisers
FMR Co., Inc.
Fidelity Management & Research
(U.K.) Inc.
Fidelity Research & Analysis Company
FIL Investment Advisors
Fidelity Investments Japan Limited
FIL Investment Advisors
(U.K.) Ltd.
Fidelity Management & Research
(Hong Kong) Limited
Fidelity Management & Research
(Japan) Inc.
General Distributor
Fidelity Distributors Corporation
Boston, MA
Transfer and Service Agents
Fidelity Investments Institutional Operations Company, Inc.
Boston, MA
Fidelity Service Company, Inc.
Boston, MA
Custodian
State Street Bank & Trust Company
Quincy, MA
ATIE-UANN-1208
1.853363.100
(Fidelity Investment logo)(registered trademark)
Fidelity Advisor
Total International Equity
Fund - Institutional Class
Annual Report
October 31, 2008
Institutional Class is
a class of Fidelity®
Total International Equity Fund
(2_fidelity_logos) (Registered_Trademark)
Contents
Chairman's Message | <Click Here> | Ned Johnson's message to shareholders. |
Performance | <Click Here> | How the fund has done over time. |
Management's Discussion | <Click Here> | The managers' review of fund performance, strategy and outlook. |
Shareholder Expense Example | <Click Here> | An example of shareholder expenses. |
Investment Changes | <Click Here> | A summary of major shifts in the fund's investments over the past six months. |
Investments | <Click Here> | A complete list of the fund's investments with their market values. |
Financial Statements | <Click Here> | Statements of assets and liabilities, operations, and changes in net assets, as well as financial highlights. |
Notes | <Click Here> | Notes to financial statements. |
Report of Independent Registered Public Accounting Firm | <Click Here> | |
Trustees and Officers | <Click Here> | |
Distributions | <Click Here> | |
Proxy Voting Results | <Click Here> | |
Board Approval of Investment Advisory Contracts and Management Fees | <Click Here> | |
To view a fund's proxy voting guidelines and proxy voting record for the 12-month period ended June 30, visit http://www.fidelity.com (search for "proxy voting guidelines") or visit the Securities and Exchange Commission's (SEC) web site at http://www.sec.gov. You may also call 1-800-544-8544 to request a free copy of the proxy voting guidelines.
Standard & Poor's, S&P and S&P 500 are registered service marks of The McGraw-Hill Companies, Inc. and have been licensed for use by Fidelity Distributors Corporation.
Other third party marks appearing herein are the property of their respective owners.
All other marks appearing herein are registered or unregistered trademarks or service marks of FMR LLC or an affiliated company.
Annual Report
This report and the financial statements contained herein are submitted for the general information of the shareholders of the fund. This report is not authorized for distribution to prospective investors in the fund unless preceded or accompanied by an effective prospectus.
A fund files its complete schedule of portfolio holdings with the SEC for the first and third quarters of each fiscal year on Form N-Q. Forms N-Q are available on the SEC's web site at http://www.sec.gov. A fund's Forms N-Q may be reviewed and copied at the SEC's Public Reference Room in Washington, DC. Information regarding the operation of the SEC's Public Reference Room may be obtained by calling 1-800-SEC-0330. For a complete list of a fund's portfolio holdings, view the most recent holdings listing, semiannual report, or annual report on Fidelity's web site at http://www.fidelity.com or http://www.advisor.fidelity.com, as applicable.
NOT FDIC INSURED · MAY LOSE VALUE · NO BANK GUARANTEE
Neither the fund nor Fidelity Distributors Corporation is a bank.
Annual Report
(photo_of_Edward_C_Johnson_3d)
Dear Shareholder:
Turmoil has been the watchword for the world's securities markets in 2008, with domestic and international stocks down sharply amid the global credit squeeze. A flight to quality boosted returns for U.S. Treasuries, one of the few asset classes with positive results heading into the latter stages of the year. Financial markets are always unpredictable, but there are a number of time-tested principles that can put the historical odds in your favor.
One of the basic tenets is to invest for the long term. Over time, riding out the markets' inevitable ups and downs has proven much more effective than selling into panic or chasing the hottest trend. Even missing only a few of the markets' best days can significantly diminish investor returns. Patience also affords the benefits of compounding - of earning interest on additional income or reinvested dividends and capital gains. There are tax advantages and cost benefits to consider as well. The more you sell, the more taxes you pay, and the more you trade, the higher the costs. While staying the course doesn't eliminate risk, it can considerably lessen the effect of short-term declines.
You can further manage your investing risk through diversification. And today, more than ever, geographic diversification should be taken into account. Studies indicate that asset allocation is the single most important determinant of a portfolio's long-term success. The right mix of stocks, bonds and cash - aligned to your particular risk tolerance and investment objective - is very important. Age-appropriate rebalancing is also an essential aspect of asset allocation. For younger investors, an emphasis on equities - which historically have been the best-performing asset class over time - is encouraged. As investors near their specific goal, such as retirement or sending a child to college, consideration may be given to replacing volatile assets (e.g. common stocks) with more-stable fixed investments (bonds or savings plans).
A third investment principle - investing regularly - can help lower the average cost of your purchases. Investing a certain amount of money each month or quarter helps ensure you won't pay for all your shares at market highs. This strategy - known as dollar cost averaging - also reduces unconstructive "emotion" from investing, helping shareholders avoid selling weak performers just prior to an upswing, or chasing a hot performer just before a correction.
We invite you to contact us via the Internet, through our Investor Centers or over the phone. It is our privilege to provide you the information you need to make the investments that are right for you.
Sincerely,
/s/Edward C. Johnson 3d
Edward C. Johnson 3d
Annual Report
Average annual total return reflects the change in the value of an investment, assuming reinvestment of the class' dividend income and capital gains (the profits earned upon the sale of securities that have grown in value, if any) and assuming a constant rate of performance each year. The $10,000 table and the fund's returns do not reflect the deduction of taxes that a shareholder would pay on fund distributions or the redemption of fund shares. During periods of reimbursement by Fidelity, a fund's total return will be greater than it would be had the reimbursement not occurred. How a fund did yesterday is no guarantee of how it will do tomorrow.
Average annual total returns take Fidelity Total International Equity Fund's cumulative total return and show you what would have happened if Fidelity Total International Equity Fund's shares had performed at a constant rate each year. These numbers will be reported once the fund is a year old.
$10,000 Over Life of Fund
Let's say hypothetically that $10,000 was invested in Fidelity® Advisor Total International Equity Fund - Institutional Class on November 1, 2007, when the fund started. The chart shows how the value of your investment would have changed, and also shows how the MSCI® ACWISM (All Country World Index) ex USA Index performed over the same period.
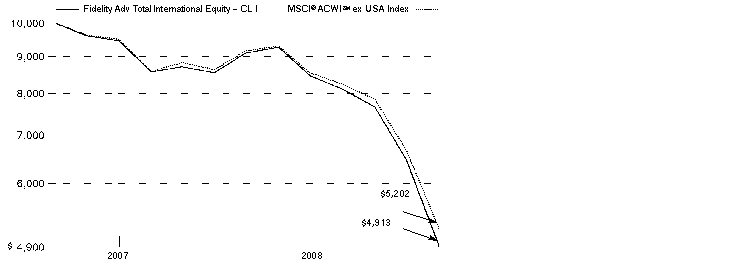
Annual Report
Comments from George Stairs and Jed Weiss, Co-Lead Portfolio Managers of Fidelity Advisor Total International Equity Fund
In a dramatic reversal of what had been a multiyear global growth story, international stocks fell long and hard during the 12 months ending October 31, 2008, especially so during the latter stages of the period and mostly as a result of fallout from the financial crisis that emanated from the United States. The viral spread of this financial contagion - which began in the U.S. subprime mortgage market, then seized up the credit markets, hobbled major financial institutions and eventually slowed economic growth worldwide - left virtually no corner of the globe untouched. Developed international equity markets - as gauged by the MSCI® Europe, Australasia, Far East (EAFE®) Index, which monitors established markets outside the U.S. and Canada - fell 46.54%, while the Standard & Poor's 500SM Index, a measure of U.S. stocks, dropped 36.10%. Among countries constituting at least 1% of the EAFE index, Switzerland had the "least worst" showing, falling roughly 32%, followed by Japan, where stocks slid by around 37%. Meanwhile, the weakest overall performance came from Belgium, where stocks slipped by nearly 70%. In the United Kingdom, the largest component of the index, equities were down almost 48%. Emerging markets were the weakest performers among the global economies, declining 56.22% as measured by the MSCI Emerging Markets Index.
For the period from their inception on November 1, 2007, through October 31, 2008, the fund's Institutional Class shares fell 50.87%, versus a decline of 47.98% for the MSCI All Country World ex USA Index. We underperformed the index mainly due to unfavorable security selection, with the greatest damage coming from our picks in financials, consumer discretionary, energy and materials, which were among the weakest sectors of the global economy. The biggest relative detractors were German automaker Volkswagen, an index component we didn't own that had an extraordinary gain late in the period; European banking companies UniCredit, based in Italy, and HBOS, headquartered in Scotland; and Petroleum Geo-Services, a Norwegian energy services firm. The fund gained back some ground versus the index due to our decision to lengthen the fund's overexposure to the more-defensive areas of the index, while creating greater underweightings in the weakest sectors. Among holdings that contributed to the fund's relative performance were such defensively oriented stocks as Roche Holding, the giant Swiss drug maker; Nestle, a multinational packaged goods company also based in Switzerland; and Osaka Gas, a Japanese natural gas utility.
The views expressed above reflect those of the portfolio manager(s) only through the end of the period as stated on the cover of this report and do not necessarily represent the views of Fidelity or any other person in the Fidelity organization. Any such views are subject to change at any time based upon market or other conditions and Fidelity disclaims any responsibility to update such views. These views may not be relied on as investment advice and, because investment decisions for a Fidelity fund are based on numerous factors, may not be relied on as an indication of trading intent on behalf of any Fidelity fund.
Annual Report
Fidelity Total International Equity Fund
Shareholder Expense Example
As a shareholder of the Fund, you incur two types of costs: (1) transaction costs, including sales charges (loads) on purchase payments or redemption proceeds, redemption fees, and (2) ongoing costs, including management fees, distribution and/or service (12b-1) fees and other Fund expenses. This Example is intended to help you understand your ongoing costs (in dollars) of investing in the Fund and to compare these costs with the ongoing costs of investing in other mutual funds.
The Example is based on an investment of $1,000 invested at the beginning of the period and held for the entire period (May 1, 2008 to October 31, 2008).
Actual Expenses
The first line of the accompanying table for each class of the Fund provides information about actual account values and actual expenses. You may use the information in this line, together with the amount you invested, to estimate the expenses that you paid over the period. Simply divide your account value by $1,000.00 (for example, an $8,600 account value divided by $1,000.00 = 8.6), then multiply the result by the number in the first line for a class of the Fund under the heading entitled "Expenses Paid During Period" to estimate the expenses you paid on your account during this period. A small balance maintenance fee of $12.00 that is charged once a year may apply for certain accounts with a value of less than $2,000. This fee is not included in the table below. If it was, the estimate of expenses you paid during the period would be higher, and your ending account value lower, by this amount. In addition, the Fund, as a shareholder in the underlying Fidelity Central Funds, will indirectly bear its pro rata share of the fees and expenses incurred by the underlying Fidelity Central Funds. These fees and expenses are not included in the Fund's annualized expense ratio used to calculate the expense estimate in the table below.
Hypothetical Example for Comparison Purposes
The second line of the accompanying table for each class of the Fund provides information about hypothetical account values and hypothetical expenses based on a Class' actual expense ratio and an assumed rate of return of 5% per year before expenses, which is not the Class' actual return. The hypothetical account values and expenses may not be used to estimate the actual ending account balance or expenses you paid for the period. You may use this information to compare the ongoing costs of investing in the Fund and other funds. To do so, compare this 5% hypothetical example with the 5% hypothetical examples that appear in the shareholder reports of the other funds. A small balance maintenance fee of $12.00 that is charged once a year may apply for certain accounts with a value of less than $2,000. This fee is not included in the table below. If it was, the estimate of expenses you paid during the period would be higher, and your ending account value lower, by this amount. In addition, the Fund, as a shareholder in the underlying Fidelity Central Funds, will indirectly bear its pro rata share of the fees and expenses incurred by the underlying Fidelity Central Funds. These fees and expenses are not included in the Fund's annualized expense ratio used to calculate the expense estimate in the table below.
Annual Report
Fidelity Total International Equity Fund
Shareholder Expense Example - continued
Please note that the expenses shown in the table are meant to highlight your ongoing costs only and do not reflect any transaction costs. Therefore, the second line of the table is useful in comparing ongoing costs only, and will not help you determine the relative total costs of owning different funds. In addition, if these transactional costs were included, your costs would have been higher.
| Annualized Expense Ratio | Beginning
Account Value
May 1, 2008 | Ending
Account Value
October 31, 2008 | Expenses Paid
During Period*
May 1, 2008
to October 31, 2008 |
Class A | 1.50% | | | |
Actual | | $ 1,000.00 | $ 539.60 | $ 5.81 |
HypotheticalA | | $ 1,000.00 | $ 1,017.60 | $ 7.61 |
Class T | 1.75% | | | |
Actual | | $ 1,000.00 | $ 538.00 | $ 6.77 |
HypotheticalA | | $ 1,000.00 | $ 1,016.34 | $ 8.87 |
Class B | 2.25% | | | |
Actual | | $ 1,000.00 | $ 537.00 | $ 8.69 |
HypotheticalA | | $ 1,000.00 | $ 1,013.83 | $ 11.39 |
Class C | 2.25% | | | |
Actual | | $ 1,000.00 | $ 537.00 | $ 8.69 |
HypotheticalA | | $ 1,000.00 | $ 1,013.83 | $ 11.39 |
Total International Equity | 1.25% | | | |
Actual | | $ 1,000.00 | $ 540.20 | $ 4.84 |
HypotheticalA | | $ 1,000.00 | $ 1,018.85 | $ 6.34 |
Institutional Class | 1.25% | | | |
Actual | | $ 1,000.00 | $ 540.20 | $ 4.84 |
HypotheticalA | | $ 1,000.00 | $ 1,018.85 | $ 6.34 |
A 5% return per year before expenses
* Expenses are equal to each Class' annualized expense ratio, multiplied by the average account value over the period, multiplied by 184/366 (to reflect the one-half year period).
Annual Report
Fidelity Total International Equity Fund
Investment Changes (Unaudited)
Geographic Diversification (% of fund's net assets) |
As of October 31, 2008 |
| Japan 14.1% |
| United Kingdom 13.8% |
| Switzerland 11.0% |
| Germany 8.7% |
| France 7.2% |
| United States of America 6.9% |
| Australia 3.6% |
| Spain 3.1% |
| Italy 2.4% |
| Other 29.2% |

Percentages are adjusted for the effect of futures contracts, if applicable. |
As of April 30, 2008 |
| United Kingdom 14.5% |
| Japan 12.8% |
| Germany 8.7% |
| France 6.7% |
| Switzerland 6.7% |
| United States of America 6.0% |
| Spain 3.6% |
| Australia 3.5% |
| Brazil 3.4% |
| Other 34.1% |

Percentages are adjusted for the effect of futures contracts, if applicable. |
Asset Allocation as of October 31, 2008 |
| % of fund's
net assets | % of fund's net assets
6 months ago |
Stocks and Investment Companies | 98.4 | 98.2 |
Short-Term Investments and Net Other Assets | 1.6 | 1.8 |
Top Ten Stocks as of October 31, 2008 |
| % of fund's
net assets | % of fund's net assets
6 months ago |
Roche Holding AG (participation certificate) (Switzerland, Pharmaceuticals) | 3.5 | 2.0 |
Nestle SA (Reg.) (Switzerland, Food Products) | 3.4 | 1.9 |
E.ON AG (Germany, Electric Utilities) | 2.8 | 2.1 |
Royal Dutch Shell PLC Class A sponsored ADR (United Kingdom, Oil, Gas & Consumable Fuels) | 2.1 | 1.3 |
Toyota Motor Corp. (Japan, Automobiles) | 1.7 | 1.3 |
Telefonica SA sponsored ADR (Spain, Diversified Telecommunication Services) | 1.4 | 1.1 |
Novartis AG sponsored ADR (Switzerland, Pharmaceuticals) | 1.4 | 0.0 |
CSL Ltd. (Australia, Biotechnology) | 1.4 | 0.9 |
Muenchener Rueckversicherungs-Gesellschaft AG (Reg.) (Germany, Insurance) | 1.4 | 0.9 |
BAE Systems PLC (United Kingdom, Aerospace & Defense) | 1.3 | 0.8 |
| 20.4 | |
Market Sectors as of October 31, 2008 |
| % of fund's
net assets | % of fund's net assets
6 months ago |
Financials | 22.9 | 22.2 |
Consumer Staples | 12.9 | 9.2 |
Energy | 10.1 | 10.8 |
Health Care | 9.8 | 5.0 |
Industrials | 8.5 | 11.1 |
Information Technology | 7.9 | 10.4 |
Materials | 7.0 | 11.0 |
Telecommunication Services | 6.7 | 5.7 |
Consumer Discretionary | 6.6 | 7.1 |
Utilities | 6.0 | 5.1 |
Annual Report
Fidelity Total International Equity Fund
Investments October 31, 2008
Showing Percentage of Net Assets
Common Stocks - 97.9% |
| Shares | | Value |
Australia - 3.6% |
AMP Ltd. | 40,791 | | $ 148,301 |
CSL Ltd. | 22,484 | | 546,518 |
Macquarie Airports unit | 50,093 | | 71,204 |
Macquarie Group Ltd. | 3,701 | | 73,386 |
Macquarie Infrastructure Group unit | 69,883 | | 91,550 |
QBE Insurance Group Ltd. | 4,764 | | 81,236 |
Silex Systems Ltd. (a) | 10,000 | | 26,037 |
Sino Gold Mining Ltd. (a) | 4,504 | | 10,369 |
Woolworths Ltd. | 21,457 | | 399,784 |
TOTAL AUSTRALIA | | 1,448,385 |
Bahrain - 0.0% |
Gulf Finance House BSC GDR (b) | 400 | | 6,800 |
Belgium - 0.4% |
InBev SA | 3,600 | | 145,199 |
Bermuda - 0.5% |
China Solar Energy Holding Ltd. (a) | 140,000 | | 829 |
ChipMOS TECHNOLOGIES (Bermuda) Ltd. (a) | 6,000 | | 3,066 |
Credicorp Ltd. (NY Shares) | 500 | | 19,635 |
Global Digital Creations Holdings Ltd. (a) | 64,000 | | 734 |
Ports Design Ltd. | 47,500 | | 55,222 |
Seadrill Ltd. | 13,600 | | 130,941 |
West Siberian Resources Ltd. SDR (a) | 14,000 | | 5,661 |
TOTAL BERMUDA | | 216,088 |
Brazil - 2.3% |
America Latina Logistica SA unit | 3,700 | | 17,062 |
Anhanguera Educacional Participacoes SA unit | 1,418 | | 10,483 |
Banco Bradesco SA: | | | |
(PN) | 6,000 | | 68,894 |
(PN) sponsored ADR | 1,100 | | 12,870 |
Banco Daycoval SA (PN) | 5,400 | | 13,474 |
BM&F BOVESPA SA | 7,000 | | 18,598 |
Companhia Siderurgica Nacional SA (CSN) sponsored ADR | 1,300 | | 17,680 |
Companhia Vale do Rio Doce sponsored ADR | 9,800 | | 128,576 |
GVT Holding SA (a) | 900 | | 9,793 |
Medial Saude SA | 700 | | 2,199 |
MRV Engenharia e Participacoes SA | 1,300 | | 6,734 |
Net Servicos de Comunicacao SA sponsored ADR | 2,400 | | 15,696 |
Petroleo Brasileiro SA - Petrobras: | | | |
(PN) sponsored ADR (non-vtg.) | 3,100 | | 68,417 |
sponsored ADR | 12,500 | | 336,125 |
Common Stocks - continued |
| Shares | | Value |
Brazil - continued |
Redecard SA | 1,000 | | $ 10,863 |
Tele Norte Leste Participacoes SA sponsored ADR (non-vtg.) | 1,200 | | 16,296 |
Uniao de Bancos Brasileiros SA (Unibanco) GDR | 2,600 | | 164,008 |
Votorantim Celulose e Papel SA sponsored ADR (non-vtg.) | 700 | | 7,063 |
TOTAL BRAZIL | | 924,831 |
Canada - 1.7% |
Addax Petroleum, Inc. | 500 | | 7,464 |
Agnico-Eagle Mines Ltd. | 3,700 | | 102,058 |
Canadian Natural Resources Ltd. | 900 | | 45,396 |
First Quantum Minerals Ltd. | 3,700 | | 77,940 |
Goldcorp, Inc. | 8,100 | | 151,413 |
Harry Winston Diamond Corp. | 4,200 | | 40,927 |
Nexen, Inc. | 3,200 | | 50,794 |
Petrobank Energy & Resources Ltd. (a) | 3,700 | | 70,576 |
Potash Corp. of Saskatchewan, Inc. | 800 | | 68,208 |
Sino-Forest Corp. (a) | 700 | | 6,548 |
SouthGobi Energy Resources Ltd. (a) | 800 | | 5,573 |
Timminco Ltd. (a) | 10,000 | | 56,394 |
TOTAL CANADA | | 683,291 |
Cayman Islands - 2.0% |
AAC Acoustic Technology Holdings, Inc. (a) | 14,000 | | 7,299 |
AirMedia Group, Inc. ADR | 100 | | 588 |
Chaoda Modern Agriculture (Holdings) Ltd. | 188,900 | | 133,084 |
China Digital TV Holding Co. Ltd. ADR | 1,300 | | 7,787 |
China Dongxiang Group Co. Ltd. | 126,000 | | 37,068 |
China High Speed Transmission Equipment Group Co. Ltd. | 50,000 | | 39,638 |
Foxconn International Holdings Ltd. (a) | 23,000 | | 8,463 |
Himax Technologies, Inc. sponsored ADR | 30,300 | | 56,661 |
Intime Department Store Group Co. Ltd. | 64,000 | | 18,948 |
LDK Solar Co. Ltd. sponsored ADR (a) | 2,000 | | 36,320 |
SinoCom Software Group Ltd. | 154,000 | | 11,138 |
Subsea 7, Inc. (a) | 4,500 | | 35,770 |
The United Laboratories International Holdings Ltd. | 34,000 | | 8,071 |
Transocean, Inc. (a) | 4,420 | | 363,899 |
Xinao Gas Holdings Ltd. | 12,000 | | 10,459 |
Yingli Green Energy Holding Co. Ltd. ADR (a) | 3,900 | | 20,553 |
TOTAL CAYMAN ISLANDS | | 795,746 |
China - 1.6% |
China Communications Construction Co. Ltd. (H Shares) | 22,000 | | 15,583 |
China Construction Bank Corp. (H Shares) | 247,000 | | 122,531 |
Common Stocks - continued |
| Shares | | Value |
China - continued |
China Gas Holdings Ltd. | 104,000 | | $ 8,561 |
China Merchants Bank Co. Ltd. (H Shares) | 17,000 | | 26,045 |
China Nepstar Chain Drugstore Ltd. ADR | 100 | | 415 |
China Shenhua Energy Co. Ltd. (H Shares) | 10,500 | | 19,935 |
China South Locomotive & Rolling Stock Corp. Ltd. (H Shares) | 50,000 | | 18,101 |
China TechFaith Wireless Communication Technology Ltd. sponsored ADR (a) | 5,000 | | 4,450 |
China Yurun Food Group Ltd. | 16,000 | | 19,017 |
Dongfang Electric Corp. Ltd. | 6,000 | | 11,680 |
Focus Media Holding Ltd. ADR (a) | 2,500 | | 46,325 |
Global Bio-Chem Technology Group Co. Ltd. | 580,000 | | 80,833 |
Golden Eagle Retail Group Ltd. (H Shares) | 48,000 | | 25,096 |
Industrial & Commercial Bank of China | 189,000 | | 88,928 |
Nine Dragons Paper (Holdings) Ltd. | 118,000 | | 20,349 |
Ping An Insurance (Group) Co. of China, Ltd. (H Shares) | 6,000 | | 25,660 |
Shanda Interactive Entertainment Ltd. sponsored ADR (a) | 3,800 | | 105,070 |
ZTE Corp. (H Shares) | 3,800 | | 8,593 |
TOTAL CHINA | | 647,172 |
Cyprus - 0.2% |
Marfin Popular Bank Public Co. | 19,739 | | 66,858 |
XXI Century Investments Public Ltd. (a) | 1,000 | | 521 |
TOTAL CYPRUS | | 67,379 |
Czech Republic - 0.1% |
Ceske Energeticke Zavody AS | 500 | | 21,637 |
Komercni Banka AS | 200 | | 29,994 |
TOTAL CZECH REPUBLIC | | 51,631 |
Denmark - 0.6% |
Novo Nordisk AS Series B sponsored ADR | 2,700 | | 144,477 |
Vestas Wind Systems AS (a) | 2,460 | | 100,761 |
TOTAL DENMARK | | 245,238 |
Egypt - 0.1% |
Eastern Tobacco Co. | 500 | | 19,344 |
Telecom Egypt SAE | 4,500 | | 10,884 |
TOTAL EGYPT | | 30,228 |
Common Stocks - continued |
| Shares | | Value |
Finland - 0.9% |
Fortum Oyj | 1,600 | | $ 39,322 |
Nokia Corp. sponsored ADR | 20,600 | | 312,708 |
TOTAL FINLAND | | 352,030 |
France - 7.2% |
Accor SA | 1,500 | | 58,358 |
Alstom SA | 2,388 | | 118,358 |
Audika SA | 1,900 | | 44,302 |
AXA SA sponsored ADR | 25,100 | | 469,621 |
BNP Paribas SA | 5,300 | | 382,667 |
Compagnie de St. Gobain | 1,300 | | 50,163 |
Delachaux SA | 791 | | 43,505 |
GDF Suez | 8,981 | | 401,447 |
Groupe Danone | 2,736 | | 152,343 |
L'Air Liquide SA | 600 | | 51,777 |
Laurent-Perrier Group | 310 | | 25,133 |
Remy Cointreau SA | 1,151 | | 47,892 |
Renault SA | 1,000 | | 30,648 |
Societe Generale Series A | 600 | | 32,703 |
Total SA: | | | |
Series B | 4,700 | | 258,563 |
sponsored ADR | 8,800 | | 487,872 |
Unibail-Rodamco | 1,300 | | 194,980 |
TOTAL FRANCE | | 2,850,332 |
Germany - 8.6% |
Allianz AG sponsored ADR | 57,200 | | 433,576 |
BASF AG | 1,800 | | 60,527 |
Bayer AG | 2,200 | | 122,473 |
Daimler AG | 12,400 | | 427,800 |
E.ON AG | 28,900 | | 1,105,621 |
GEA Group AG | 4,000 | | 58,456 |
GFK AG | 2,400 | | 47,394 |
Linde AG | 900 | | 75,584 |
Muenchener Rueckversicherungs-Gesellschaft AG (Reg.) | 4,100 | | 544,173 |
RWE AG | 4,100 | | 342,633 |
Siemens AG sponsored ADR | 2,900 | | 174,435 |
Tognum AG | 3,100 | | 34,467 |
TOTAL GERMANY | | 3,427,139 |
Greece - 0.2% |
Public Power Corp. of Greece | 5,500 | | 68,008 |
Common Stocks - continued |
| Shares | | Value |
Hong Kong - 1.3% |
China Mobile (Hong Kong) Ltd. | 3,500 | | $ 30,811 |
China Mobile (Hong Kong) Ltd. sponsored ADR | 700 | | 30,723 |
China Overseas Land & Investment Ltd. | 44,000 | | 49,687 |
CNOOC Ltd. sponsored ADR | 560 | | 45,746 |
CNPC (Hong Kong) Ltd. | 40,000 | | 12,264 |
Hong Kong Exchanges & Clearing Ltd. | 6,600 | | 66,929 |
REXCAPITAL Financial Holdings Ltd. (a) | 475,000 | | 8,777 |
Swire Pacific Ltd. (A Shares) | 37,000 | | 260,580 |
TOTAL HONG KONG | | 505,517 |
India - 1.5% |
Axis Bank Ltd. GDR (Reg. S) | 2,700 | | 32,400 |
Bank of India | 4,775 | | 23,742 |
Bharat Heavy Electricals Ltd. | 716 | | 19,074 |
Bharti Airtel Ltd. (a) | 13,723 | | 185,812 |
Educomp Solutions Ltd. | 700 | | 32,749 |
Housing Development Finance Corp. Ltd. | 400 | | 14,559 |
Indian Overseas Bank | 15,780 | | 24,231 |
Infosys Technologies Ltd. | 530 | | 15,449 |
LANCO Infratech Ltd. | 20 | | 48 |
Larsen & Toubro Ltd. | 1,250 | | 20,894 |
Nagarjuna Construction Co. Ltd. | 50 | | 66 |
Pantaloon Retail India Ltd. | 3,418 | | 16,492 |
Piramal Healthcare Ltd. | 3,000 | | 13,734 |
Reliance Industries Ltd. GDR (Reg. S) (b) | 524 | | 29,868 |
Rural Electrification Corp. Ltd. | 130 | | 178 |
Satyam Computer Services Ltd. sponsored ADR | 8,700 | | 136,851 |
Sintex Industries Ltd. | 4,536 | | 13,800 |
Subex Ltd. (a) | 1,147 | | 837 |
Suzlon Energy Ltd. | 20,812 | | 18,866 |
Tata Power Co. Ltd. | 1,000 | | 14,273 |
TOTAL INDIA | | 613,923 |
Indonesia - 0.2% |
PT Bank Rakyat Indonesia Tbk | 64,000 | | 19,763 |
PT Bayan Resources Tbk | 128,500 | | 19,845 |
PT Bumi Resources Tbk | 129,500 | | 16,955 |
PT Perusahaan Gas Negara Tbk Series B | 102,000 | | 12,964 |
PT Telkomunikasi Indonesia Tbk Series B | 22,500 | | 11,361 |
TOTAL INDONESIA | | 80,888 |
Ireland - 0.7% |
Bank of Ireland | 15,800 | | 46,653 |
Common Stocks - continued |
| Shares | | Value |
Ireland - continued |
C&C Group PLC | 10,400 | | $ 15,128 |
CRH PLC sponsored ADR | 9,700 | | 205,252 |
Dragon Oil PLC (a) | 5,000 | | 12,935 |
TOTAL IRELAND | | 279,968 |
Israel - 1.2% |
BluePhoenix Solutions Ltd. (a) | 8,700 | | 23,316 |
Cellcom Israel Ltd. | 700 | | 20,622 |
ECtel Ltd. (a) | 9,100 | | 8,190 |
Israel Chemicals Ltd. | 11,900 | | 115,352 |
Leadcom Integrated Solutions (a) | 47,000 | | 4,376 |
Mellanox Technologies Ltd. (a) | 800 | | 6,208 |
Orckit Communications Ltd. (a) | 4,800 | | 19,008 |
Partner Communications Co. Ltd. ADR | 11,600 | | 216,688 |
RADWARE Ltd. (a) | 6,300 | | 39,753 |
Teva Pharmaceutical Industries Ltd. sponsored ADR | 300 | | 12,864 |
TOTAL ISRAEL | | 466,377 |
Italy - 2.1% |
ENI SpA sponsored ADR | 3,400 | | 163,370 |
Fiat SpA | 5,200 | | 41,328 |
Finmeccanica SpA | 7,900 | | 96,652 |
Impregilo SpA (a) | 21,600 | | 56,978 |
UniCredit SpA | 188,400 | | 460,963 |
TOTAL ITALY | | 819,291 |
Japan - 14.1% |
Aeon Co. Ltd. | 19,900 | | 190,813 |
Canon, Inc. | 1,400 | | 48,986 |
Denso Corp. | 8,200 | | 159,815 |
Dydo Drinco, Inc. | 800 | | 19,201 |
East Japan Railway Co. | 37 | | 263,279 |
Elpida Memory, Inc. (a) | 3,000 | | 15,993 |
Ibiden Co. Ltd. | 2,100 | | 39,282 |
Ichiyoshi Securities Co. Ltd. | 7,600 | | 60,855 |
JSR Corp. | 5,400 | | 60,908 |
Kobayashi Pharmaceutical Co. Ltd. | 2,100 | | 67,279 |
Konica Minolta Holdings, Inc. | 20,000 | | 131,340 |
Miraca Holdings, Inc. | 7,400 | | 119,332 |
Mitsubishi Estate Co. Ltd. | 3,000 | | 53,587 |
Mitsubishi UFJ Financial Group, Inc. sponsored ADR | 64,800 | | 406,296 |
Mitsui & Co. Ltd. | 50,000 | | 484,451 |
Nagaileben Co. Ltd. | 1,000 | | 19,855 |
Common Stocks - continued |
| Shares | | Value |
Japan - continued |
Nintendo Co. Ltd. | 700 | | $ 218,400 |
Nippon Building Fund, Inc. | 5 | | 48,043 |
Nomura Holdings, Inc. | 4,500 | | 42,632 |
Obic Co. Ltd. | 410 | | 50,182 |
ORIX Corp. | 2,990 | | 307,186 |
Osaka Gas Co. Ltd. | 94,000 | | 332,484 |
Osaka Securities Exchange Co. Ltd. | 10 | | 32,858 |
Ozeki Co. Ltd. | 200 | | 4,888 |
Promise Co. Ltd. | 9,850 | | 176,790 |
Rakuten, Inc. | 169 | | 83,775 |
SBI Holdings, Inc. | 400 | | 47,998 |
Seven & I Holdings Co. Ltd. | 2,000 | | 56,153 |
Shiseido Co. Ltd. | 5,000 | | 103,000 |
Sony Financial Holdings, Inc. | 34 | | 110,572 |
Sugi Holdings Co. Ltd. | 2,000 | | 48,095 |
Sumco Corp. | 3,720 | | 40,282 |
Sumitomo Corp. | 10,300 | | 90,615 |
Sumitomo Metal Industries Ltd. | 36,000 | | 92,585 |
Sumitomo Mitsui Financial Group, Inc. | 51 | | 204,442 |
Sumitomo Trust & Banking Co. Ltd. | 12,000 | | 55,570 |
Takeda Pharmaceutical Co. Ltd. | 2,500 | | 124,207 |
Tokuyama Corp. | 32,000 | | 162,045 |
Toyota Motor Corp. | 17,400 | | 679,451 |
Tsutsumi Jewelry Co. Ltd. | 2,800 | | 54,547 |
USS Co. Ltd. | 1,500 | | 91,871 |
Xebio Co. Ltd. | 6,600 | | 112,676 |
Yamada Denki Co. Ltd. | 1,390 | | 75,654 |
TOTAL JAPAN | | 5,588,273 |
Kazakhstan - 0.2% |
JSC Halyk Bank of Kazakhstan unit | 15,700 | | 66,725 |
Korea (South) - 0.8% |
Doosan Heavy Industries & Construction Co. Ltd. | 440 | | 19,450 |
Hyundai Industrial Development & Construction Co. | 5 | | 136 |
Hyunjin Materials Co. Ltd. | 1,002 | | 12,381 |
Jinsung T.E.C. Co. Ltd. | 2,098 | | 13,129 |
KB Financial Group, Inc. (a) | 1,515 | | 38,046 |
KT&G Corp. | 390 | | 25,108 |
LG Electronics, Inc. | 110 | | 8,238 |
MegaStudy Co. Ltd. | 100 | | 11,276 |
Meritz Fire & Marine Insurance Co. Ltd. | 3,410 | | 12,557 |
NHN Corp. (a) | 885 | | 94,475 |
Common Stocks - continued |
| Shares | | Value |
Korea (South) - continued |
Samsung Electronics Co. Ltd. | 90 | | $ 38,061 |
Shinhan Financial Group Co. Ltd. | 1,610 | | 39,290 |
Taewoong Co. Ltd. | 360 | | 17,585 |
TK Corp. | 7 | | 114 |
TOTAL KOREA (SOUTH) | | 329,846 |
Luxembourg - 0.1% |
Evraz Group SA GDR | 600 | | 9,240 |
MHP SA GDR (Reg. S) | 3,100 | | 12,400 |
Tenaris SA sponsored ADR | 700 | | 14,413 |
TOTAL LUXEMBOURG | | 36,053 |
Malaysia - 0.1% |
KNM Group Bhd | 70,000 | | 11,870 |
Public Bank Bhd | 10,000 | | 23,763 |
TOTAL MALAYSIA | | 35,633 |
Mauritius - 0.0% |
Golden Agri-Resources Ltd. | 85,000 | | 11,343 |
Mexico - 1.2% |
America Movil SAB de CV Series L sponsored ADR | 10,700 | | 331,058 |
Banco Compartamos SA de CV | 3,500 | | 5,946 |
Cemex SA de CV sponsored ADR | 2,200 | | 16,632 |
Fomento Economico Mexicano SA de CV sponsored ADR | 1,400 | | 35,406 |
Grupo Financiero Banorte SA de CV Series O | 11,339 | | 20,768 |
Wal-Mart de Mexico SA de CV Series V | 26,400 | | 70,919 |
TOTAL MEXICO | | 480,729 |
Netherlands - 2.3% |
AMG Advanced Metallurgical Group NV (a) | 2,150 | | 34,802 |
ASML Holding NV (NY Shares) | 15,600 | | 273,780 |
Gemalto NV (a) | 4,900 | | 137,285 |
Heineken NV (Bearer) | 2,200 | | 74,213 |
ING Groep NV sponsored ADR | 7,700 | | 71,687 |
Koninklijke KPN NV | 14,200 | | 199,981 |
QIAGEN NV (a) | 2,600 | | 37,076 |
Unilever NV (NY Shares) | 3,300 | | 79,365 |
TOTAL NETHERLANDS | | 908,189 |
Norway - 1.8% |
DnB Nor ASA | 21,700 | | 125,759 |
Orkla ASA (A Shares) | 37,800 | | 251,643 |
Petroleum Geo-Services ASA (a) | 21,100 | | 105,065 |
Common Stocks - continued |
| Shares | | Value |
Norway - continued |
Pronova BioPharma ASA | 41,400 | | $ 107,553 |
StatoilHydro ASA sponsored ADR | 5,700 | | 114,570 |
Telenor ASA | 800 | | 4,774 |
TOTAL NORWAY | | 709,364 |
Papua New Guinea - 0.2% |
Lihir Gold Ltd. (a) | 48,000 | | 59,862 |
Lihir Gold Ltd. sponsored ADR (a) | 2,500 | | 31,950 |
TOTAL PAPUA NEW GUINEA | | 91,812 |
Peru - 0.0% |
Compania de Minas Buenaventura SA sponsored ADR | 1,100 | | 13,904 |
Philippines - 0.5% |
Alliance Global Group, Inc. (a) | 310,000 | | 12,698 |
Jollibee Food Corp. | 46,900 | | 44,186 |
Philippine Long Distance Telephone Co. sponsored ADR | 3,100 | | 126,790 |
TOTAL PHILIPPINES | | 183,674 |
Poland - 0.1% |
Eurocash SA | 7,000 | | 21,521 |
Trakcja Polska SA | 7,900 | | 13,259 |
TOTAL POLAND | | 34,780 |
Russia - 1.2% |
Bank St. Petersburg OJSC | 7,100 | | 8,875 |
Mobile TeleSystems OJSC sponsored ADR | 600 | | 23,490 |
OAO Gazprom sponsored ADR | 14,080 | | 287,936 |
OAO NOVATEK (a) | 3,000 | | 8,100 |
OAO Raspadskaya | 5,100 | | 10,710 |
OJSC Rosneft unit | 5,700 | | 26,220 |
Sberbank (Savings Bank of the Russian Federation) GDR | 190 | | 34,849 |
Uralkali JSC | 6,400 | | 29,440 |
Vimpel Communications sponsored ADR | 2,600 | | 37,700 |
Wimm-Bill-Dann Foods OJSC sponsored ADR (a) | 500 | | 21,970 |
TOTAL RUSSIA | | 489,290 |
Singapore - 0.7% |
DBS Group Holdings Ltd. | 31,000 | | 236,638 |
Singapore Exchange Ltd. | 12,000 | | 42,953 |
Straits Asia Resources Ltd. | 7,000 | | 4,664 |
TOTAL SINGAPORE | | 284,255 |
Common Stocks - continued |
| Shares | | Value |
South Africa - 1.7% |
African Rainbow Minerals Ltd. | 7,763 | | $ 78,663 |
Aveng Ltd. | 100 | | 491 |
Bell Equipment Ltd. | 1 | | 1 |
Exxaro Resources Ltd. | 2,300 | | 15,161 |
Harmony Gold Mining Co. Ltd. sponsored ADR (a) | 2,500 | | 18,275 |
Impala Platinum Holdings Ltd. | 12,300 | | 127,029 |
Imperial Holdings Ltd. | 2,865 | | 16,111 |
MTN Group Ltd. | 29,203 | | 325,806 |
Murray & Roberts Holdings Ltd. | 2,505 | | 16,917 |
Northam Platinum Ltd. | 900 | | 2,810 |
Raubex Group Ltd. | 6,200 | | 16,024 |
Sasol Ltd. sponsored ADR | 400 | | 11,572 |
Truworths International Ltd. | 9,000 | | 30,537 |
TOTAL SOUTH AFRICA | | 659,397 |
Spain - 3.1% |
Banco Bilbao Vizcaya Argentaria SA sponsored ADR | 13,600 | | 157,760 |
Banco Santander SA | 18,900 | | 204,407 |
Grifols SA | 9,279 | | 184,659 |
Inditex SA | 2,200 | | 74,365 |
Prosegur Comp Securidad SA (Reg.) | 1,600 | | 45,455 |
Telefonica SA sponsored ADR | 10,000 | | 555,100 |
TOTAL SPAIN | | 1,221,746 |
Sweden - 0.9% |
H&M Hennes & Mauritz AB (B Shares) | 3,900 | | 139,825 |
Swedish Match Co. | 8,400 | | 116,627 |
Telefonaktiebolaget LM Ericsson (B Shares) | 14,800 | | 100,730 |
TOTAL SWEDEN | | 357,182 |
Switzerland - 11.0% |
ABB Ltd. sponsored ADR | 5,100 | | 67,065 |
Credit Suisse Group sponsored ADR | 2,000 | | 74,800 |
EFG International | 13,800 | | 297,017 |
Nestle SA (Reg.) | 35,079 | | 1,363,823 |
Novartis AG sponsored ADR | 10,800 | | 550,692 |
Roche Holding AG (participation certificate) | 9,148 | | 1,398,669 |
Sonova Holding AG | 3,319 | | 137,877 |
Swiss Life Holding AG | 1,049 | | 94,501 |
The Swatch Group AG (Reg.) | 1,684 | | 48,211 |
Zurich Financial Services AG (Reg.) | 1,669 | | 338,530 |
TOTAL SWITZERLAND | | 4,371,185 |
Common Stocks - continued |
| Shares | | Value |
Taiwan - 0.8% |
Acer, Inc. | 9,000 | | $ 11,719 |
Advanced Semiconductor Engineering, Inc. | 40,128 | | 17,086 |
China Steel Corp. | 31,810 | | 23,193 |
Everlight Electronics Co. Ltd. | 12,199 | | 18,492 |
First Financial Holding Co. Ltd. | 57,600 | | 27,154 |
HannStar Display Corp. | 376,248 | | 68,440 |
Hon Hai Precision Industry Co. Ltd. (Foxconn) | 39,100 | | 94,831 |
HTC Corp. | 2,600 | | 31,017 |
Innolux Display Corp. | 31,900 | | 23,743 |
Powertech Technology, Inc. | 5,500 | | 7,745 |
Taiwan Mobile Co. Ltd. | 7,000 | | 9,698 |
TOTAL TAIWAN | | 333,118 |
Thailand - 0.2% |
PTT Exploration & Production PCL (For. Reg.) | 7,100 | | 17,717 |
Siam Commercial Bank PCL (For. Reg.) | 28,000 | | 43,466 |
Total Access Communication PCL: | | | |
unit | 14,000 | | 10,006 |
(For. Reg.) | 8,600 | | 6,114 |
TOTAL THAILAND | | 77,303 |
Turkey - 0.8% |
Anadolu Efes Biracilik ve Malt Sanyii AS | 13,480 | | 113,530 |
Asya Katilim Bankasi AS | 77,200 | | 67,520 |
Bagfas Bandirma Gubre Fabrikalari AS | 150 | | 7,191 |
Enka Insaat ve Sanayi AS | 4,866 | | 18,127 |
Tupras-Turkiye Petrol Rafinerileri AS | 5,000 | | 63,166 |
Turkiye Garanti Bankasi AS (a) | 32,200 | | 52,570 |
Turkiye Vakiflar Bankasi TAO | 11,000 | | 10,618 |
TOTAL TURKEY | | 332,722 |
United Arab Emirates - 0.0% |
DP World Ltd. | 47 | | 16 |
United Kingdom - 13.8% |
Aegis Group PLC | 89,000 | | 93,785 |
Anglo American PLC (United Kingdom) | 3,942 | | 98,898 |
Autonomy Corp. PLC (a) | 8,400 | | 133,171 |
BAE Systems PLC | 88,900 | | 499,642 |
Barratt Developments PLC | 4,400 | | 5,477 |
BG Group PLC | 14,900 | | 219,062 |
BHP Billiton PLC | 2,800 | | 47,540 |
BHP Billiton PLC ADR | 9,100 | | 312,403 |
Common Stocks - continued |
| Shares | | Value |
United Kingdom - continued |
British American Tobacco PLC: | | | |
(United Kingdom) | 1,800 | | $ 49,367 |
sponsored ADR | 3,100 | | 168,516 |
Cairn Energy PLC (a) | 300 | | 7,771 |
Datacash Group PLC | 11,300 | | 39,343 |
easyJet PLC (a) | 19,800 | | 98,762 |
Eurasian Natural Resources Corp. PLC | 1,000 | | 5,001 |
HBOS PLC | 61,159 | | 100,131 |
HSBC Holdings PLC (United Kingdom) (Reg.) | 9,363 | | 110,884 |
Informa PLC | 14,700 | | 49,797 |
Man Group PLC | 50,375 | | 290,803 |
Max Petroleum PLC (a) | 76,100 | | 16,448 |
Misys PLC | 27,000 | | 48,340 |
National Grid PLC | 7,800 | | 87,857 |
Premier Foods PLC | 159,000 | | 70,493 |
Prudential PLC | 20,900 | | 104,975 |
Randgold Resources Ltd. sponsored ADR | 300 | | 9,303 |
Reckitt Benckiser Group PLC | 10,600 | | 448,323 |
Renovo Group PLC (a) | 143,700 | | 58,671 |
Rio Tinto PLC: | | | |
(Reg.) | 3,000 | | 140,119 |
sponsored ADR | 690 | | 128,250 |
Royal Bank of Scotland Group PLC | 123,466 | | 135,983 |
Royal Dutch Shell PLC Class A sponsored ADR | 15,200 | | 848,312 |
Serco Group PLC | 45,900 | | 273,694 |
Sibir Energy PLC (a) | 1,800 | | 7,162 |
Tesco PLC | 54,900 | | 300,766 |
Vodafone Group PLC | 40,300 | | 77,516 |
Vodafone Group PLC sponsored ADR | 19,500 | | 375,765 |
Xstrata PLC | 1,200 | | 20,523 |
TOTAL UNITED KINGDOM | | 5,482,853 |
United States of America - 5.3% |
Allergan, Inc. | 1,900 | | 75,373 |
Berkshire Hathaway, Inc. Class B (a) | 80 | | 307,200 |
Chiquita Brands International, Inc. (a) | 6,000 | | 81,900 |
Cypress Semiconductor Corp. (a) | 10,000 | | 50,100 |
FMC Technologies, Inc. (a) | 1,000 | | 34,990 |
Freeport-McMoRan Copper & Gold, Inc. Class B | 300 | | 8,730 |
Gilead Sciences, Inc. (a) | 3,600 | | 165,060 |
JPMorgan Chase & Co. | 3,000 | | 123,750 |
Juniper Networks, Inc. (a) | 11,500 | | 215,510 |
Common Stocks - continued |
| Shares | | Value |
United States of America - continued |
Lululemon Athletica, Inc. (a) | 300 | | $ 4,251 |
MasterCard, Inc. Class A | 700 | | 103,474 |
Mohawk Industries, Inc. (a) | 700 | | 33,866 |
Philip Morris International, Inc. | 7,000 | | 304,290 |
Pricesmart, Inc. | 7,095 | | 105,716 |
SanDisk Corp. (a) | 3,900 | | 34,671 |
Sunpower Corp. Class B (a) | 2,742 | | 81,191 |
Varian Semiconductor Equipment Associates, Inc. (a) | 2,800 | | 54,936 |
Visa, Inc. | 5,900 | | 326,565 |
TOTAL UNITED STATES OF AMERICA | | 2,111,573 |
TOTAL COMMON STOCKS (Cost $66,712,564) | 38,936,426 |
Nonconvertible Preferred Stocks - 0.5% |
| | | |
Brazil - 0.1% |
Usinas Siderurgicas de Minas Gerais SA - Usiminas (PN-A) (non-vtg.) | 1,150 | | 14,719 |
Germany - 0.1% |
ProSiebenSat.1 Media AG | 10,900 | | 32,899 |
Italy - 0.3% |
Fiat SpA (Risp) | 3,200 | | 14,504 |
Telecom Italia SpA (Risp) | 135,800 | | 114,279 |
TOTAL ITALY | | 128,783 |
TOTAL NONCONVERTIBLE PREFERRED STOCKS (Cost $443,113) | 176,401 |
Cash Equivalents - 2.8% |
| Maturity Amount | | Value |
Investments in repurchase agreements in a joint trading account at 0.14%, dated 10/31/08 due 11/3/08: | | | |
(Collateralized by U.S. Treasury Obligations) # | $ 29,000 | | $ 29,000 |
(Collateralized by U.S. Treasury Obligations) # | 1,081,012 | | 1,081,000 |
TOTAL CASH EQUIVALENTS (Cost $1,110,000) | 1,110,000 |
TOTAL INVESTMENT PORTFOLIO - 101.2% (Cost $68,265,677) | | 40,222,827 |
NET OTHER ASSETS - (1.2)% | | (460,584) |
NET ASSETS - 100% | $ 39,762,243 |
Legend |
(a) Non-income producing |
(b) Security exempt from registration under Rule 144A of the Securities Act of 1933. These securities may be resold in transactions exempt from registration, normally to qualified institutional buyers. At the end of the period, the value of these securities amounted to $36,668 or 0.1% of net assets. |
# Additional Information on each counterparty to the repurchase agreement is as follows: |
Repurchase Agreement / Counterparty | Value |
$29,000 due 11/03/08 at 0.14% |
BNP Paribas Securities Corp. | $ 1,954 |
Banc of America Securities LLC | 3,908 |
Barclays Capital, Inc. | 3,908 |
Repurchase Agreement / Counterparty | Value |
Deutsche Bank Securities, Inc. | $ 10,159 |
Morgan Stanley & Co., Inc. | 278 |
UBS Securities LLC | 8,793 |
| $ 29,000 |
$1,081,000 due 11/03/08 at 0.14% |
BNP Paribas Securities Corp. | $ 72,833 |
Banc of America Securities LLC | 145,666 |
Barclays Capital, Inc. | 145,666 |
Deutsche Bank Securities, Inc. | 378,731 |
Morgan Stanley & Co., Inc. | 10,355 |
UBS Securities LLC | 327,749 |
| $ 1,081,000 |
Affiliated Central Funds |
Information regarding fiscal year to date income earned by the Fund from investments in Fidelity Central Funds is as follows: |
Fund | Income earned |
Fidelity Securities Lending Cash Central Fund | $ 685 |
Income Tax Information |
At October 31, 2008, the fund had a capital loss carryforward of approximately $10,058,675 all of which will expire on October 31, 2016. |
See accompanying notes which are an integral part of the financial statements.
Annual Report
Fidelity Total International Equity Fund
Statement of Assets and Liabilities
| October 31, 2008 |
| | |
Assets | | |
Investment in securities, at value (including repurchase agreements of $1,110,000) -
See accompanying schedule: Unaffiliated issuers (cost $68,265,677) | | $ 40,222,827 |
Foreign currency held at value (cost $19,550) | | 19,610 |
Receivable for investments sold | | 420,878 |
Receivable for fund shares sold | | 48,897 |
Dividends receivable | | 137,659 |
Distributions receivable from Fidelity Central Funds | | 487 |
Receivable from investment adviser for expense reductions | | 60,634 |
Other receivables | | 2,568 |
Total assets | | 40,913,560 |
| | |
Liabilities | | |
Payable to custodian bank | $ 500,703 | |
Payable for investments purchased | 454,874 | |
Payable for fund shares redeemed | 65,416 | |
Accrued management fee | 24,662 | |
Distribution fees payable | 7,025 | |
Other affiliated payables | 13,587 | |
Other payables and accrued expenses | 85,050 | |
Total liabilities | | 1,151,317 |
| | |
Net Assets | | $ 39,762,243 |
Net Assets consist of: | | |
Paid in capital | | $ 77,832,504 |
Undistributed net investment income | | 796,810 |
Accumulated undistributed net realized gain (loss) on investments and foreign currency transactions | | (10,821,709) |
Net unrealized appreciation (depreciation) on investments and assets and liabilities in foreign currencies | | (28,045,362) |
Net Assets | | $ 39,762,243 |
See accompanying notes which are an integral part of the financial statements.
Annual Report
Fidelity Total International Equity Fund
Financial Statements - continued
Statement of Assets and Liabilities - continued
| October 31, 2008 |
| | |
Calculation of Maximum Offering Price
Class A:
Net Asset Value and redemption price per share
($5,944,308 ÷ 1,214,214 shares) | | $ 4.90 |
| | |
Maximum offering price per share (100/94.25 of $4.90) | | $ 5.20 |
Class T:
Net Asset Value and redemption price per share ($2,566,919 ÷ 525,601 shares) | | $ 4.88 |
| | |
Maximum offering price per share (100/96.50 of $4.88) | | $ 5.06 |
Class B:
Net Asset Value and offering price per share ($2,505,484 ÷ 515,596 shares)A | | $ 4.86 |
| | |
Class C:
Net Asset Value and offering price per share ($2,786,793 ÷ 573,503 shares)A | | $ 4.86 |
| | |
Total International Equity:
Net Asset Value, offering price and redemption price per share ($23,226,171 ÷ 4,734,729 shares) | | $ 4.91 |
| | |
Institutional Class:
Net Asset Value, offering price and redemption price per share ($2,732,568 ÷ 557,020 shares) | | $ 4.91 |
A Redemption price per share is equal to net asset value less any applicable contingent deferred sales charge.
See accompanying notes which are an integral part of the financial statements.
Annual Report
Statement of Operations
For the period November 1, 2007
(commencement of operations)
to October 31, 2008 |
| | |
Investment Income | | |
Dividends | | $ 1,864,250 |
Interest | | 50,882 |
Income from Fidelity Central Funds | | 685 |
| | 1,915,817 |
Less foreign taxes withheld | | (176,331) |
Total income | | 1,739,486 |
| | |
Expenses | | |
Management fee | $ 434,811 | |
Transfer agent fees | 140,800 | |
Distribution fees | 124,559 | |
Accounting and security lending fees | 31,886 | |
Custodian fees and expenses | 333,396 | |
Independent trustees' compensation | 250 | |
Registration fees | 134,079 | |
Audit | 76,578 | |
Legal | 2,967 | |
Miscellaneous | 2,464 | |
Total expenses before reductions | 1,281,790 | |
Expense reductions | (399,945) | 881,845 |
Net investment income (loss) | | 857,641 |
Realized and Unrealized Gain (Loss) Net realized gain (loss) on: | | |
Investment securities: | | |
Unaffiliated issuers | (10,808,092) | |
Foreign currency transactions | (58,619) | |
Total net realized gain (loss) | | (10,866,711) |
Change in net unrealized appreciation (depreciation) on: Investment securities | (28,043,005) | |
Assets and liabilities in foreign currencies | (2,357) | |
Total change in net unrealized appreciation (depreciation) | | (28,045,362) |
Net gain (loss) | | (38,912,073) |
Net increase (decrease) in net assets resulting from operations | | $ (38,054,432) |
See accompanying notes which are an integral part of the financial statements.
Annual Report
Fidelity Total International Equity Fund
Financial Statements - continued
Statement of Changes in Net Assets
| For the period
November 1, 2007
(commencement
of operations) to
October 31, 2008 |
Increase (Decrease) in Net Assets | |
Operations | |
Net investment income (loss) | $ 857,641 |
Net realized gain (loss) | (10,866,711) |
Change in net unrealized appreciation (depreciation) | (28,045,362) |
Net increase (decrease) in net assets resulting
from operations | (38,054,432) |
Distributions to shareholders from net investment income | (15,829) |
Share transactions - net increase (decrease) | 77,824,722 |
Redemption fees | 7,782 |
Total increase (decrease) in net assets | 39,762,243 |
| |
Net Assets | |
Beginning of period | - |
End of period (including undistributed net investment income of $796,810) | $ 39,762,243 |
See accompanying notes which are an integral part of the financial statements.
Annual Report
Financial Highlights - Class A
| For the period
November 1, 2007
(commencement
of operations) to
October 31, 2008 |
Selected Per-Share Data | |
Net asset value, beginning of period | $ 10.00 |
Income from Investment Operations | |
Net investment income (loss) C | .11 |
Net realized and unrealized gain (loss) | (5.21) |
Total from investment operations | (5.10) |
Redemption fees added to paid in capital C, E | - |
Net asset value, end of period | $ 4.90 |
Total Return A, B | (51.00)% |
Ratios to Average Net Assets D, G | |
Expenses before reductions | 2.00% |
Expenses net of fee waivers, if any | 1.50% |
Expenses net of all reductions | 1.48% |
Net investment income (loss) | 1.35% |
Supplemental Data | |
Net assets, end of period (000 omitted) | $ 5,944 |
Portfolio turnover rate F | 91% |
A Total returns would have been lower had certain expenses not been reduced during the periods shown.
B Total returns do not include the effect of the sales charges.
C Calculated based on average shares outstanding during the period.
D Expense ratios reflect operating expenses of the class. Expenses before reductions do not reflect amounts reimbursed by the investment adviser or reductions from brokerage service arrangements or other expense offset arrangements and do not represent the amount paid by the class during periods when reimbursements or reductions occur. Expense ratios before reductions for start-up periods may not be representative of longer-term operating periods. Expenses net of fee waivers reflect expenses after reimbursement by the investment adviser but prior to reductions from brokerage service arrangements or other expense offset arrangements. Expenses net of all reductions represent the net expenses paid by the class.
E Amount represents less than $.01 per share.
F Amount does not include the portfolio activity of any underlying Fidelity Central Funds.
G Fees and expenses of the underlying Fidelity Central Funds are not included in the Fund's expense ratio. The Fund indirectly bears its proportionate share of the expenses of any underlying Fidelity Central Funds.
See accompanying notes which are an integral part of the financial statements.
Annual Report
Financial Highlights - Class T
| For the period
November 1, 2007
(commencement
of operations) to
October 31, 2008 |
Selected Per-Share Data | |
Net asset value, beginning of period | $ 10.00 |
Income from Investment Operations | |
Net investment income (loss) C | .09 |
Net realized and unrealized gain (loss) | (5.21) |
Total from investment operations | (5.12) |
Redemption fees added to paid in capital C, E | - |
Net asset value, end of period | $ 4.88 |
Total Return A, B | (51.20)% |
Ratios to Average Net Assets D, G | |
Expenses before reductions | 2.42% |
Expenses net of fee waivers, if any | 1.75% |
Expenses net of all reductions | 1.73% |
Net investment income (loss) | 1.10% |
Supplemental Data | |
Net assets, end of period (000 omitted) | $ 2,567 |
Portfolio turnover rate F | 91% |
A Total returns would have been lower had certain expenses not been reduced during the periods shown.
B Total returns do not include the effect of the sales charges.
C Calculated based on average shares outstanding during the period.
D Expense ratios reflect operating expenses of the class. Expenses before reductions do not reflect amounts reimbursed by the investment adviser or reductions from brokerage service arrangements or other expense offset arrangements and do not represent the amount paid by the class during periods when reimbursements or reductions occur. Expense ratios before reductions for start-up periods may not be representative of longer-term operating periods. Expenses net of fee waivers reflect expenses after reimbursement by the investment adviser but prior to reductions from brokerage service arrangements or other expense offset arrangements. Expenses net of all reductions represent the net expenses paid by the class.
E Amount represents less than $.01 per share.
F Amount does not include the portfolio activity of any underlying Fidelity Central Funds.
G Fees and expenses of the underlying Fidelity Central Funds are not included in the Fund's expense ratio. The Fund indirectly bears its proportionate share of the expenses of any underlying Fidelity Central Funds.
See accompanying notes which are an integral part of the financial statements.
Annual Report
Financial Highlights - Class B
| For the period
November 1, 2007
(commencement
of operations) to
October 31, 2008 |
Selected Per-Share Data | |
Net asset value, beginning of period | $ 10.00 |
Income from Investment Operations | |
Net investment income (loss) C | .05 |
Net realized and unrealized gain (loss) | (5.19) |
Total from investment operations | (5.14) |
Redemption fees added to paid in capital C, E | - |
Net asset value, end of period | $ 4.86 |
Total Return A, B | (51.40)% |
Ratios to Average Net Assets D, G | |
Expenses before reductions | 2.92% |
Expenses net of fee waivers, if any | 2.25% |
Expenses net of all reductions | 2.24% |
Net investment income (loss) | .60% |
Supplemental Data | |
Net assets, end of period (000 omitted) | $ 2,505 |
Portfolio turnover rate F | 91% |
A Total returns would have been lower had certain expenses not been reduced during the periods shown.
B Total returns do not include the effect of the contingent deferred sales charge.
C Calculated based on average shares outstanding during the period.
D Expense ratios reflect operating expenses of the class. Expenses before reductions do not reflect amounts reimbursed by the investment adviser or reductions from brokerage service arrangements or other expense offset arrangements and do not represent the amount paid by the class during periods when reimbursements or reductions occur. Expense ratios before reductions for start-up periods may not be representative of longer-term operating periods. Expenses net of fee waivers reflect expenses after reimbursement by the investment adviser but prior to reductions from brokerage service arrangements or other expense offset arrangements. Expenses net of all reductions represent the net expenses paid by the class.
E Amount represents less than $.01 per share.
F Amount does not include the portfolio activity of any underlying Fidelity Central Funds.
G Fees and expenses of the underlying Fidelity Central Funds are not included in the Fund's expense ratio. The Fund indirectly bears its proportionate share of the expenses of any underlying Fidelity Central Funds.
See accompanying notes which are an integral part of the financial statements.
Annual Report
Financial Highlights - Class C
| For the period
November 1, 2007
(commencement
of operations) to
October 31, 2008 |
Selected Per-Share Data | |
Net asset value, beginning of period | $ 10.00 |
Income from Investment Operations | |
Net investment income (loss) C | .05 |
Net realized and unrealized gain (loss) | (5.19) |
Total from investment operations | (5.14) |
Redemption fees added to paid in capital C, E | - |
Net asset value, end of period | $ 4.86 |
Total Return A, B | (51.40)% |
Ratios to Average Net Assets D, G | |
Expenses before reductions | 2.92% |
Expenses net of fee waivers, if any | 2.25% |
Expenses net of all reductions | 2.23% |
Net investment income (loss) | .60% |
Supplemental Data | |
Net assets, end of period (000 omitted) | $ 2,787 |
Portfolio turnover rate F | 91% |
A Total returns would have been lower had certain expenses not been reduced during the periods shown.
B Total returns do not include the effect of the contingent deferred sales charge.
C Calculated based on average shares outstanding during the period.
D Expense ratios reflect operating expenses of the class. Expenses before reductions do not reflect amounts reimbursed by the investment adviser or reductions from brokerage service arrangements or other expense offset arrangements and do not represent the amount paid by the class during periods when reimbursements or reductions occur. Expense ratios before reductions for start-up periods may not be representative of longer-term operating periods. Expenses net of fee waivers reflect expenses after reimbursement by the investment adviser but prior to reductions from brokerage service arrangements or other expense offset arrangements. Expenses net of all reductions represent the net expenses paid by the class.
E Amount represents less than $.01 per share.
F Amount does not include the portfolio activity of any underlying Fidelity Central Funds.
G Fees and expenses of the underlying Fidelity Central Funds are not included in the Fund's expense ratio. The Fund indirectly bears its proportionate share of the expenses of any underlying Fidelity Central Funds.
See accompanying notes which are an integral part of the financial statements.
Annual Report
Financial Highlights - Total International Equity
| For the period
November 1, 2007
(commencement
of operations) to
October 31, 2008 |
Selected Per-Share Data | |
Net asset value, beginning of period | $ 10.00 |
Income from Investment Operations | |
Net investment income (loss) B | .13 |
Net realized and unrealized gain (loss) | (5.21) |
Total from investment operations | (5.08) |
Distributions from net investment income | (.01) |
Redemption fees added to paid in capital B, D | - |
Net asset value, end of period | $ 4.91 |
Total Return A | (50.87)% |
Ratios to Average Net Assets C, F | |
Expenses before reductions | 1.89% |
Expenses net of fee waivers, if any | 1.25% |
Expenses net of all reductions | 1.23% |
Net investment income (loss) | 1.60% |
Supplemental Data | |
Net assets, end of period (000 omitted) | $ 23,226 |
Portfolio turnover rate E | 91% |
A Total returns would have been lower had certain expenses not been reduced during the periods shown.
B Calculated based on average shares outstanding during the period.
C Expense ratios reflect operating expenses of the class. Expenses before reductions do not reflect amounts reimbursed by the investment adviser or reductions from brokerage service arrangements or other expense offset arrangements and do not represent the amount paid by the class during periods when reimbursements or reductions occur. Expense ratios before reductions for start-up periods may not be representative of longer-term operating periods. Expenses net of fee waivers reflect expenses after reimbursement by the investment adviser but prior to reductions from brokerage service arrangements or other expense offset arrangements. Expenses net of all reductions represent the net expenses paid by the class.
D Amount represents less than $.01 per share.
E Amount does not include the portfolio activity of any underlying Fidelity Central Funds.
F Fees and expenses of the underlying Fidelity Central Funds are not included in the Fund's expense ratio. The Fund indirectly bears its proportionate share of the expenses of any underlying Fidelity Central Funds.
See accompanying notes which are an integral part of the financial statements.
Annual Report
Financial Highlights - Institutional Class
| For the period
November 1, 2007
(commencement
of operations) to
October 31, 2008 |
Selected Per-Share Data | |
Net asset value, beginning of period | $ 10.00 |
Income from Investment Operations | |
Net investment income (loss) B | .13 |
Net realized and unrealized gain (loss) | (5.21) |
Total from investment operations | (5.08) |
Distributions from net investment income | (.01) |
Redemption fees added to paid in capital B, D | - |
Net asset value, end of period | $ 4.91 |
Total Return A | (50.87)% |
Ratios to Average Net Assets C, F | |
Expenses before reductions | 1.91% |
Expenses net of fee waivers, if any | 1.25% |
Expenses net of all reductions | 1.23% |
Net investment income (loss) | 1.60% |
Supplemental Data | |
Net assets, end of period (000 omitted) | $ 2,733 |
Portfolio turnover rate E | 91% |
A Total returns would have been lower had certain expenses not been reduced during the periods shown.
B Calculated based on average shares outstanding during the period.
C Expense ratios reflect operating expenses of the class. Expenses before reductions do not reflect amounts reimbursed by the investment adviser or reductions from brokerage service arrangements or other expense offset arrangements and do not represent the amount paid by the class during periods when reimbursements or reductions occur. Expense ratios before reductions for start-up periods may not be representative of longer-term operating periods. Expenses net of fee waivers reflect expenses after reimbursement by the investment adviser but prior to reductions from brokerage service arrangements or other expense offset arrangements. Expenses net of all reductions represent the net expenses paid by the class.
D Amount represents less than $.01 per share.
E Amount does not include the portfolio activity of any underlying Fidelity Central Funds.
F Fees and expenses of the underlying Fidelity Central Funds are not included in the Fund's expense ratio. The Fund indirectly bears its proportionate share of the expenses of any underlying Fidelity Central Funds.
See accompanying notes which are an integral part of the financial statements.
Annual Report
Fidelity Total International Equity Fund
Notes to Financial Statements
For the period ended October 31, 2008
1. Organization.
Fidelity Total International Equity Fund (the Fund) is a fund of Fidelity Investment Trust (the trust) and is authorized to issue an unlimited number of shares. The trust is registered under the Investment Company Act of 1940, as amended (the 1940 Act), as an open-end management investment company organized as a Massachusetts business trust. The Fund offers Class A, Class T, Class B, Class C, Total International Equity, and Institutional Class shares, each of which has equal rights as to assets and voting privileges. Each class has exclusive voting rights with respect to matters that affect that class. Class B shares will automatically convert to Class A shares after a holding period of seven years from the initial date of purchase. Investment income, realized and unrealized capital gains and losses, the common expenses of the Fund, and certain fund-level expense reductions, if any, are allocated on a pro rata basis to each class based on the relative net assets of each class to the total net assets of the Fund. Each class differs with respect to transfer agent and distribution and service plan fees incurred. Certain expense reductions also differ by class.The Fund's investments in emerging markets can be subject to social, economic, regulatory, and political uncertainties and can be extremely volatile.
2. Investments in Fidelity Central Funds.
The Fund may invest in Fidelity Central Funds, which are open-end investment companies available only to other investment companies and accounts managed by Fidelity Management & Research Company (FMR) and its affiliates. The Fund's Schedule of Investments lists each of the Fidelity Central Funds held as of period end, if any, as an investment of the Fund, but does not include the underlying holdings of each Fidelity Central Fund. As an Investing Fund, the Fund indirectly bears its proportionate share of the expenses of the underlying Fidelity Central Funds.
The Money Market Central Funds seek preservation of capital and current income and are managed by Fidelity Investments Money Management, Inc. (FIMM), an affiliate of FMR.
A complete unaudited list of holdings for each Fidelity Central Fund is available upon request or at the SEC's web site at www.sec.gov. In addition, the financial statements of the Fidelity Central Funds, which are not covered by the Fund's Report of Independent Registered Public Accounting Firm, are available on the SEC's web site or upon request.
3. Significant Accounting Policies.
The financial statements have been prepared in conformity with accounting principles generally accepted in the United States of America, which require management to make certain estimates and assumptions at the date of the financial statements. Actual results could differ from those estimates. The following summarizes the significant accounting policies of the Fund:
Annual Report
Fidelity Total International Equity Fund
Notes to Financial Statements - continued
3. Significant Accounting Policies - continued
Security Valuation. Investments are valued as of 4:00 p.m. Eastern time on the last calendar day of the period. Wherever possible, the Fund uses independent pricing services approved by the Board of Trustees to value its investments.
Equity securities, including restricted securities, for which market quotations are readily available, are valued at the last reported sale price or official closing price as reported by an independent pricing service on the primary market or exchange on which they are traded. In the event there were no sales during the day or closing prices are not available, securities are valued at the last quoted bid price. Investments in open-end mutual funds, including Fidelity Central Funds, are valued at their closing net asset value each business day. Short-term securities with remaining maturities of sixty days or less for which quotations are not readily available are valued at amortized cost, which approximates value.
When current market prices or quotations are not readily available or reliable, valuations may be determined in good faith in accordance with procedures adopted by the Board of Trustees. Factors used in determining value may include significant market or security specific events, changes in interest rates and credit quality, and developments in foreign markets which are monitored by evaluating the performance of ADRs, futures contracts and exchange-traded funds. The frequency with which these procedures are used cannot be predicted and may be utilized to a significant extent. The value of securities used for net asset value (NAV) calculation under these procedures may differ from published prices for the same securities.
Foreign Currency. The Fund uses foreign currency contracts to facilitate transactions in foreign-denominated securities. Losses from these transactions may arise from changes in the value of the foreign currency or if the counterparties do not perform under the contracts' terms.
Foreign-denominated assets, including investment securities, and liabilities are translated into U.S. dollars at the exchange rate at period end. Purchases and sales of investment securities, income and dividends received and expenses denominated in foreign currencies are translated into U.S. dollars at the exchange rate in effect on the transaction date.
The effects of exchange rate fluctuations on investments are included with the net realized and unrealized gain (loss) on investment securities. Other foreign currency transactions resulting in realized and unrealized gain (loss) are disclosed separately.
Annual Report
3. Significant Accounting Policies - continued
Investment Transactions and Income. For financial reporting purposes, the Fund's investment holdings and NAV include trades executed through the end of the last business day of the period. The NAV per share for processing shareholder transactions is calculated as of the close of business of the New York Stock Exchange (NYSE), normally 4:00 p.m. Eastern time and includes trades executed through the end of the prior business day. Gains and losses on securities sold are determined on the basis of identified cost. Dividend income is recorded on the ex-dividend date, except for certain dividends from foreign securities where the ex-dividend date may have passed, which are recorded as soon as the Fund is informed of the ex-dividend date. Non-cash dividends included in dividend income, if any, are recorded at the fair market value of the securities received. Interest income and distributions from the Fidelity Central Funds are accrued as earned. Interest income includes coupon interest and amortization of premium and accretion of discount on debt securities. Investment income is recorded net of foreign taxes withheld where recovery of such taxes is uncertain.
Expenses. Most expenses of the trust can be directly attributed to a fund. Expenses which cannot be directly attributed are apportioned among each Fund in the trust. Expense estimates are accrued in the period to which they relate and adjustments are made when actual amounts are known.
Income Tax Information and Distributions to Shareholders. Each year, the Fund intends to qualify as a regulated investment company by distributing substantially all of its taxable income and realized gains under Subchapter M of the Internal Revenue Code and filing its U.S. federal tax return. As a result, no provision for income taxes is required. The Fund is subject to the provisions of FASB Interpretation No. 48, Accounting for Uncertainties in Income Taxes (FIN 48). FIN 48 sets forth a minimum threshold for financial statement recognition of the benefit of a tax position taken or expected to be taken in a tax return. There are no unrecognized tax benefits in the accompanying financial statements in connection with the tax positions expected to be taken in the initial filing of the Fund's federal tax return. Foreign taxes are provided for based on the Fund's understanding of the tax rules and rates that exist in the foreign markets in which it invests.
Distributions are recorded on the ex-dividend date. Income dividends and capital gain distributions are declared separately for each class. Income and capital gain distributions are determined in accordance with income tax regulations, which may differ from generally accepted accounting principles.
Capital accounts within the financial statements are adjusted for permanent book-tax differences. These adjustments have no impact on net assets or the results of operations. Temporary book-tax differences will reverse in a subsequent period.
Annual Report
Fidelity Total International Equity Fund
Notes to Financial Statements - continued
3. Significant Accounting Policies - continued
Income Tax Information and Distributions to Shareholders - continued
Book-tax differences are primarily due to foreign currency transactions, passive foreign investment companies (PFIC), capital loss carryforwards and losses deferred due to wash sales.
The tax-basis components of distributable earnings and the federal tax cost as of period end were as follows:
Unrealized appreciation | $ 158,517 |
Unrealized depreciation | (28,966,751) |
Net unrealized appreciation (depreciation) | (28,808,234) |
Undistributed ordinary income | 796,810 |
Capital loss carryforward | (10,058,675) |
| |
Cost for federal income tax purposes | $ 69,031,061 |
The tax character of distributions paid was as follows:
| October 31, 2008 |
Ordinary Income | $ 15,829 |
Short-Term Trading (Redemption) Fees. Shares held in the Fund less than 30 days are subject to a redemption fee equal to 1.00% of the proceeds of the redeemed shares. All redemption fees, including any estimated redemption fees paid by FMR, are retained by the Fund and accounted for as an addition to paid in capital.
New Accounting Pronouncement. In September 2006, Statement of Financial Accounting Standards No. 157, Fair Value Measurements (SFAS 157), was issued and is effective for fiscal years beginning after November 15, 2007. SFAS 157 defines fair value, establishes a framework for measuring fair value and results in expanded disclosures about fair value measurements. The Fund will adopt the provisions of SFAS 157 effective for its fiscal year beginning November 1, 2008.
4. Operating Policies.
Repurchase Agreements. FMR has received an Exemptive Order from the Securities and Exchange Commission (the SEC) which permits the Fund and other affiliated entities of FMR to transfer uninvested cash balances into joint trading accounts which are then invested in repurchase agreements. The Fund may also invest directly with institutions in repurchase agreements. Repurchase agreements are collateralized by government or non-government securities. Upon settlement date, collateral is held in segregated accounts with custodian banks and may be obtained in the event of a default of the counterparty. The Fund monitors, on a daily basis, the value of the collateral to
Annual Report
4. Operating Policies - continued
Repurchase Agreements - continued
ensure it is at least equal to the principal amount of the repurchase agreement (including accrued interest). In the event of a default by the counterparty, realization of the collateral proceeds could be delayed, during which time the value of the collateral may decline.
Restricted Securities. The Fund may invest in securities that are subject to legal or contractual restrictions on resale. These securities generally may be resold in transactions exempt from registration or to the public if the securities are registered. Disposal of these securities may involve time-consuming negotiations and expense, and prompt sale at an acceptable price may be difficult. Information regarding restricted securities is included at the end of the Fund's Schedule of Investments.
5. Purchases and Sales of Investments.
Purchases and sales of securities, short-term securities, aggregated $130,088,576 and $52,054,096, respectively.
6. Fees and Other Transactions with Affiliates.
Management Fee. FMR and its affiliates provide the Fund with investment management related services for which the Fund pays a monthly management fee. The management fee is the sum of an individual fund fee rate that is based on an annual rate of .45% of the Fund's average net assets and a group fee rate that averaged .26% during the period. The group fee rate is based upon the average net assets of all the mutual funds advised by FMR. The group fee rate decreases as assets under management increase and increases as assets under management decrease. In addition, the management fee is subject to a performance adjustment (up to a maximum of ± .20% of the Fund's average net assets over the performance period). The upward or downward adjustment to the management fee is based on the investment performance of the Total International Equity Class as compared to an appropriate benchmark index. The Fund's performance period began on December 1, 2007 and subsequent months will be added until the performance period includes 36 months. The Fund's performance adjustment will take effect in November 2008. For the period, the total annual management fee rate was .71% of the Fund's average net assets.
Distribution and Service Plan. In accordance with Rule 12b-1 of the 1940 Act, the Fund has adopted separate Distribution and Service Plans for each class of shares. Certain classes pay Fidelity Distributors Corporation (FDC), an affiliate of FMR, separate Distribution and Service Fees, each of which is based on an annual percentage of each class' average net assets. In addition, FDC may pay financial intermediaries for selling shares of the Fund and providing shareholder support services. For the period,
Annual Report
Fidelity Total International Equity Fund
Notes to Financial Statements - continued
6. Fees and Other Transactions with Affiliates - continued
Distribution and Service Plan - continued
the Distribution and Service Fee rates and the total amounts paid to and retained by FDC were as follows:
| Distribution
Fee | Service
Fee | Paid to
FDC | Retained
by FDC |
Class A | -% | .25% | $ 17,319 | $ 11,412 |
Class T | .25% | .25% | 21,454 | 20,724 |
Class B | .75% | .25% | 42,037 | 41,866 |
Class C | .75% | .25% | 43,749 | 42,879 |
| | | $ 124,559 | $ 116,881 |
Sales Load. FDC receives a front-end sales charge of up to 5.75% for selling Class A shares, and 3.50% for selling Class T shares, some of which is paid to financial intermediaries for selling shares of the Fund. FDC receives the proceeds of contingent deferred sales charges levied on Class A, Class T, Class B, and Class C redemptions. These charges depend on the holding period. The deferred sales charges range from 5% to 1% for Class B, 1% for Class C, 1.00% to .50% for certain purchases of Class A shares and .25% for certain purchases of Class T shares.
For the period, sales charge amounts retained by FDC were as follows:
| Retained
by FDC |
Class A | $ 1,403 |
Class T | 263 |
Class B* | 267 |
Class C* | 220 |
| $ 2,153 |
* When Class B and Class C shares are initially sold, FDC pays commissions from its own resources to financial intermediaries through which the sales
are made.
Transfer Agent Fees. Fidelity Investments Institutional Operations Company, Inc. (FIIOC), an affiliate of FMR, is the transfer, dividend disbursing and shareholder servicing agent for each class of the Fund. FIIOC receives account fees and asset-based fees that vary according to the account size and type of account of the shareholders of the respective classes of the Fund. FIIOC pays for typesetting, printing and mailing of
Annual Report
6. Fees and Other Transactions with Affiliates - continued
Transfer Agent Fees - continued
shareholder reports, except proxy statements. For the period, the total transfer agent fees paid by each class were as follows:
| Amount | % of
Average
Net Assets |
Class A | $ 11,710 | .17 |
Class T | 7,052 | .16 |
Class B | 6,840 | .16 |
Class C | 7,566 | .17 |
Total International Equity | 100,429 | .27 |
Institutional Class | 7,203 | .16 |
| $ 140,800 | |
Accounting and Security Lending Fees. Fidelity Service Company, Inc. (FSC), an affiliate of FMR, maintains the Fund's accounting records. The accounting fee is based on the level of average net assets for the month. Under a separate contract, FSC administers the security lending program. The security lending fee is based on the number and duration of lending transactions.
Brokerage Commissions. The Fund placed a portion of its portfolio transactions with brokerage firms which are affiliates of the investment adviser. The commissions paid to these affiliated firms were $1,684 for the period.
7. Committed Line of Credit.
The Fund participates with other funds managed by FMR in a $4.2 billion credit facility (the "line of credit") to be utilized for temporary or emergency purposes to fund shareholder redemptions or for other short-term liquidity purposes. The Fund has agreed to pay commitment fees on its pro rata portion of the line of credit, which amounted to $86 and is reflected in Miscellaneous Expense on the Statement of Operations. During the period, there were no borrowings on this line of credit.
8. Security Lending.
The Fund lends portfolio securities from time to time in order to earn additional income. On the settlement date of the loan, the Fund receives collateral (in the form of U.S. Treasury obligations, letters of credit and/or cash) against the loaned securities and maintains collateral in an amount not less than 100% of the market value of the loaned
Annual Report
Fidelity Total International Equity Fund
Notes to Financial Statements - continued
8. Security Lending - continued
securities during the period of the loan. The market value of the loaned securities is determined at the close of business of the Fund and any additional required collateral is delivered to the Fund on the next business day. If the borrower defaults on its obligation to return the securities loaned because of insolvency or other reasons, a fund could experience delays and costs in recovering the securities loaned or in gaining access to the collateral. Any cash collateral received is invested in the Fidelity Securities Lending Cash Central Fund. Security lending income represents the income earned on investing cash collateral, less fees and expenses associated with the loan, plus any premium payments that may be received on the loan of certain types of securities. Security lending income is presented in the Statement of Operations as a component of income from Fidelity Central Funds. Net income from lending portfolio securities during the period amounted to $685.
9. Expense Reductions.
FMR voluntarily agreed to reimburse each class to the extent annual operating expenses exceeded certain levels of average net assets as noted in the table below. Some expenses, for example interest expense, including commitment fees, are excluded from this reimbursement.
The following classes were in reimbursement during the period:
| Expense
Limitations | Reimbursement
from adviser |
Class A | 1.50% | $ 34,674 |
Class T | 1.75% | 28,711 |
Class B | 2.25% | 28,025 |
Class C | 2.25% | 29,021 |
Total International Equity | 1.25% | 239,225 |
Institutional Class | 1.25% | 28,855 |
| | $ 388,511 |
Many of the brokers with whom FMR places trades on behalf of the Fund provided services to the Fund in addition to trade execution. These services included payments of certain expenses on behalf of the Fund totaling $11,434 for the period.
Annual Report
10. Other.
The Fund's organizational documents provide former and current trustees and officers with a limited indemnification against liabilities arising in connection with the performance of their duties to the Fund. In the normal course of business, the Fund may also enter into contracts that provide general indemnifications. The Fund's maximum exposure under these arrangements is unknown as this would be dependent on future claims that may be made against the Fund. The risk of material loss from such claims is considered remote.
FMR or its affiliates were the owners of record of 32% of the total outstanding shares of the Fund.
During the period, Lehman Brothers Holdings, Inc. and certain of its affiliates (LBHI) sought protection under the insolvency laws of their jurisdictions of organization, including the United States, the United Kingdom and Japan. At the time LBHI's insolvency proceedings were instituted, the Fund had outstanding securities trades with counterparties affiliated with LBHI. As a result of the insolvency proceedings, LBHI is unable to fulfill its commitments and, in certain cases, the Fund may have terminated its trades and related agreements with the relevant entities and, where appropriate, is in the process of initiating claims for damages. FMR believes that the financial impact to the Fund relating to the terminated trades and agreements is immaterial.
11. Distributions to Shareholders.
Distributions to shareholders of each class were as follows:
| For the period
November 1, 2007
(commencement of operations) to
October 31, 2008 |
From net investment income | |
Total International Equity | $ 13,264 |
Institutional Class | 2,565 |
Total | $ 15,829 |
Annual Report
Fidelity Total International Equity Fund
Notes to Financial Statements - continued
12. Share Transactions.
Transactions for each class of shares were as follows:
| Shares | Dollars |
| For the period
November 1, 2007
(commencement of operations) to
October 31, 2008 | For the period
November 1, 2007
(commencement of operations) to
October 31, 2008 |
Class A | | |
Shares sold | 1,253,571 | $ 11,409,450 |
Shares redeemed | (39,357) | (262,908) |
Net increase (decrease) | 1,214,214 | $ 11,146,542 |
Class T | | |
Shares sold | 536,757 | $ 5,311,723 |
Shares redeemed | (11,156) | (95,096) |
Net increase (decrease) | 525,601 | $ 5,216,627 |
Class B | | |
Shares sold | 516,780 | $ 5,142,958 |
Shares redeemed | (1,184) | (8,679) |
Net increase (decrease) | 515,596 | $ 5,134,279 |
Class C | | |
Shares sold | 576,912 | $ 5,653,538 |
Shares redeemed | (3,409) | (27,077) |
Net increase (decrease) | 573,503 | $ 5,626,461 |
Total International Equity | | |
Shares sold | 7,339,025 | $ 65,416,828 |
Reinvestment of distributions | 1,313 | 12,459 |
Shares redeemed | (2,605,609) | (20,217,092) |
Net increase (decrease) | 4,734,729 | $ 45,212,195 |
Institutional Class | | |
Shares sold | 559,428 | $ 5,503,211 |
Reinvestment of distributions | 270 | 2,565 |
Shares redeemed | (2,678) | (17,158) |
Net increase (decrease) | 557,020 | $ 5,488,618 |
Annual Report
To the Trustees of Fidelity Investment Trust and Shareholders of Fidelity Total International Equity Fund:
We have audited the accompanying statement of assets and liabilities of Fidelity Total International Equity Fund (the Fund), a fund of Fidelity Investment Trust, including the schedule of investments, as of October 31, 2008, and the related statement of operations, the statement of changes in net assets and the financial highlights for the period from November 1, 2007 (Commencement of Operations) to October 31, 2008. These financial statements and financial highlights are the responsibility of the Fund's management. Our responsibility is to express an opinion on these financial statements and financial highlights based on our audit.
We conducted our audit in accordance with standards of the Public Company Accounting Oversight Board (United States). Those standards require that we plan and perform the audit to obtain reasonable assurance about whether the financial statements and financial highlights are free of material misstatement. The Fund is not required to have, nor were we engaged to perform, an audit of its internal control over financial reporting. Our audits included consideration of internal control over financial reporting as a basis for designing audit procedures that are appropriate in the circumstances, but not for the purpose of expressing an opinion on the effectiveness of the Fund's internal control over financial reporting. Accordingly, we express no such opinion. An audit also includes examining, on a test basis, evidence supporting the amounts and disclosures in the financial statements, assessing the accounting principles used and significant estimates made by management, as well as evaluating the overall financial statement presentation. Our procedures included confirmation of securities owned as of October 31, 2008, by correspondence with the custodians and brokers; where replies were not received from brokers, we performed other auditing procedures. We believe that our audit provides a reasonable basis for our opinion.
In our opinion, the financial statements and financial highlights referred to above present fairly, in all material respects, the financial position of Fidelity Total International Equity Fund as of October 31, 2008, the results of its operations, the changes in its net assets and its financial highlights for the period from November 1, 2007 (Commencement of Operations) to October 31, 2008, in conformity with accounting principles generally accepted in the United States of America.
/s/ Deloitte & Touche LLP
DELOITTE & TOUCHE LLP
Boston, Massachusetts
December 23, 2008
Annual Report
The Trustees, Member of the Advisory Board, and executive officers of the trust and fund, as applicable, are listed below. The Board of Trustees governs the fund and is responsible for protecting the interests of shareholders. The Trustees are experienced executives who meet periodically throughout the year to oversee the fund's activities, review contractual arrangements with companies that provide services to the fund, and review the fund's performance. Except for Edward C. Johnson 3d and James C. Curvey, each of the Trustees oversees 220 funds advised by FMR or an affiliate. Messrs. Johnson and Curvey oversee 379 funds advised by FMR or an affiliate.
The Trustees hold office without limit in time except that (a) any Trustee may resign; (b) any Trustee may be removed by written instrument, signed by at least two-thirds of the number of Trustees prior to such removal; (c) any Trustee who requests to be retired or who has become incapacitated by illness or injury may be retired by written instrument signed by a majority of the other Trustees; and (d) any Trustee may be removed at any special meeting of shareholders by a two-thirds vote of the outstanding voting securities of the trust. Each Trustee who is not an interested person (as defined in the 1940 Act) (Independent Trustee), shall retire not later than the last day of the calendar year in which his or her 72nd birthday occurs. The Independent Trustees may waive this mandatory retirement age policy with respect to individual Trustees. The executive officers and Advisory Board Member hold office without limit in time, except that any officer and Advisory Board Member may resign or may be removed by a vote of a majority of the Trustees at any regular meeting or any special meeting of the Trustees. Except as indicated, each individual has held the office shown or other offices in the same company for the past five years.
The fund's Statement of Additional Information (SAI) includes more information about the Trustees. To request a free copy, call Fidelity at 1-877-208-0098.
Interested Trustees*:
Correspondence intended for each Trustee who is an interested person may be sent to Fidelity Investments, 82 Devonshire Street, Boston, Massachusetts 02109.
Name, Age; Principal Occupation |
Edward C. Johnson 3d (78) |
| Year of Election or Appointment: 1984 Mr. Johnson is Chairman of the Board of Trustees. Mr. Johnson serves as Chief Executive Officer, Chairman, and a Director of FMR LLC; Chairman and a Director of FMR; Chairman and a Director of Fidelity Research & Analysis Company (FRAC); Chairman and a Director of Fidelity Investments Money Management, Inc.; and Chairman and a Director of FMR Co., Inc. In addition, Mr. Johnson serves as Chairman and Director of FIL Limited. Previously, Mr. Johnson served as President of FMR LLC (2006-2007). |
James C. Curvey (73) |
| Year of Election or Appointment: 2007 Mr. Curvey also serves as Trustee (2007-present) of other investment companies advised by FMR. Mr. Curvey is a Director of FMR and FMR Co., Inc. (2007-present). Mr. Curvey is also Vice Chairman (2006-
present) and Director of FMR LLC. In addition, Mr. Curvey serves as an Overseer for the Boston Symphony Orchestra and a member of the Trustees of Villanova University. |
* Trustees have been determined to be "Interested Trustees" by virtue of, among other things, their affiliation with the trust or various entities under common control with FMR. FMR Corp. merged with and into FMR LLC on October 1, 2007. Any references to FMR LLC for prior periods are deemed to be references to the prior entity.
Independent Trustees:
Correspondence intended for each Independent Trustee (that is, the Trustees other than the Interested Trustees) may be sent to Fidelity Investments, P.O. Box 55235, Boston, Massachusetts 02205-5235.
Name, Age; Principal Occupation |
Dennis J. Dirks (60) |
| Year of Election or Appointment: 2005 Prior to his retirement in May 2003, Mr. Dirks was Chief Operating Officer and a member of the Board of The Depository Trust & Clearing Corporation (DTCC) (1999-2003). He also served as President, Chief Operating Officer, and Board member of The Depository Trust Company (DTC) (1999-2003) and President and Board member of the National Securities Clearing Corporation (NSCC) (1999-2003). In addition, Mr. Dirks served as a Trustee and a member of the Finance Committee of Manhattan College (2005-2008), and as Chief Executive Officer and Board member of the Government Securities Clearing Corporation (2001-2003) and Chief Executive Officer and Board member of the Mortgage-Backed Securities Clearing Corporation (2001-2003). Mr. Dirks also serves as a Trustee and a member of the Finance Committee of AHRC of Nassau County (2006-present). |
Alan J. Lacy (55) |
| Year of Election or Appointment: 2008 Mr. Lacy serves as Senior Adviser (2007-present) of Oak Hill Capital Partners, L.P. (a private equity firm). Mr. Lacy also served as Chief Executive Officer (2000-2005) and Vice Chairman (2005-2006) of Sears Holdings Corporation and Sears, Roebuck and Co. (retail). In addition, Mr. Lacy serves as a member of the Board of Directors of The Western Union Company (global money transfer, 2006-present) and Bristol-Myers Squibb (global pharmaceuticals, 2007-present). Mr. Lacy is a Trustee of the National Parks Conservation Association and The Field Museum of Natural History. |
Ned C. Lautenbach (64) |
| Year of Election or Appointment: 2000 Mr. Lautenbach is Chairman of the Independent Trustees (2006-present). Mr. Lautenbach is an Advisory Partner of Clayton, Dubilier & Rice, Inc. (private equity investment firm). Previously, Mr. Lautenbach was with the International Business Machines Corporation (IBM) from 1968 until his retirement in 1998. Mr. Lautenbach serves as a Director of Eaton Corporation (diversified industrial) as well as the Philharmonic Center for the Arts in Naples, Florida. He also is a member of the Board of Trustees of Fairfield University (2005-present), as well as a member of the Council on Foreign Relations. Previously, Mr. Lautenbach served as a Director of Sony Corporation (2006-2007). |
Joseph Mauriello (64) |
| Year of Election or Appointment: 2008 Prior to his retirement in January 2006, Mr. Mauriello served in numerous senior management positions including Deputy Chairman and Chief Operating Officer (2004-2005), and Vice Chairman of Financial Services (2002-2004) of KPMG LLP US (professional services firm, 1965-
2005). Mr. Mauriello currently serves as a member of the Board of Directors of XL Capital Ltd. (global insurance and re-insurance company, 2006-present) and of Arcadia Resources Inc. (health care services and products, 2007-present). He also served as a Director of the Hamilton Funds of the Bank of New York (2006-2007). |
Cornelia M. Small (64) |
| Year of Election or Appointment: 2005 Ms. Small is a member of the Investment Committee, and Chair (2008-present) and a member of the Board of Trustees of Smith College. Ms. Small also serves on the Investment Committee of the Berkshire Taconic Community Foundation (2008-present). Previously, Ms. Small served as Chairperson of the Investment Committee (2002-2008) of Smith College and as Co-Chair (2000-2003) of the Annual Fund for the Fletcher School of Law and Diplomacy. In addition, she served as Chief Investment Officer, Director of Global Equity Investments, and a member of the Board of Directors of Scudder, Stevens & Clark and Scudder Kemper Investments. |
William S. Stavropoulos (69) |
| Year of Election or Appointment: 2001 Mr. Stavropoulos is Chairman Emeritus of the Board of Directors of The Dow Chemical Company, where he previously served in numerous senior management positions, including President (1993-2000; 2002-
2003), CEO (1995-2000; 2002-2004), Chairman of the Executive Committee (2000-2006), and as a member of the Board of Directors (1990-2006). Currently, he is a Director of Teradata Corporation (data warehousing and technology solutions, 2008-present), Chemical Financial Corporation, Maersk Inc. (industrial conglomerate), Tyco International, Inc. (multinational manufacturing and services, 2007-present), and a member of the Advisory Board for Metalmark Capital (private equity investment firm, 2005-present). He is a special advisor to Clayton, Dubilier & Rice, Inc. (private equity investment). In addition, Mr. Stavropoulos is a member of the University of Notre Dame Advisory Council for the College of Science. |
David M. Thomas (59) |
| Year of Election or Appointment: 2008 Previously, Mr. Thomas served as Executive Chairman (2005-2006) and Chairman and Chief Executive Officer (2000-2005) of IMS Health, Inc. (pharmaceutical and healthcare information solutions). In addition, Mr. Thomas serves as a member of the Board of Directors of Fortune Brands, Inc. (consumer products holding company), and Interpublic Group of Companies, Inc. (marketing communication, 2004-present). |
Michael E. Wiley (58) |
| Year of Election or Appointment: 2008 Mr. Wiley also serves as a member of the Board of Trustees of the University of Tulsa (2000-2006; 2007-present). He serves as a Director of Tesoro Corporation (independent oil refiner and marketer, 2005-
present), and a Director of Bill Barrett Corporation (exploration and production company, 2005-present). In addition, he also serves as a Director of Post Oak Bank (privately-held bank, 2004-present). Previously, Mr. Wiley served as a Sr. Energy Advisor of Katzenbach Partners, LLC (consulting firm, 2006-2007), as an Advisory Director of Riverstone Holdings (private investment firm), Chairman, President, and CEO of Baker Hughes, Inc. (oilfield services company, 2000-2004), and as Director of Spinnaker Exploration Company (exploration and production company, 2001-2005). |
Advisory Board Member and Executive Officers**:
Correspondence intended for each executive officer and Mr. Lynch may be sent to Fidelity Investments, 82 Devonshire Street, Boston, Massachusetts 02109.
Name, Age; Principal Occupation |
Peter S. Lynch (64) |
| Year of Election or Appointment: 2003 Member of the Advisory Board of Fidelity's Equity and High Income Funds. Mr. Lynch is Vice Chairman and a Director of FMR, and Vice Chairman (2001-present) and a Director of FMR Co., Inc. Previously, Mr. Lynch served as a Trustee of the Fidelity funds (1990-2003). In addition, he serves as a Trustee of Boston College and as the Chairman of the Inner-City Scholarship Fund. Previously, Mr. Lynch served on the Special Olympics International Board of Directors (1997-2006). |
Kenneth B. Robins (39) |
| Year of Election or Appointment: 2008 President and Treasurer of Fidelity's Equity and High Income Funds. Mr. Robins is an employee of Fidelity Investments (2004-present). Before joining Fidelity Investments, Mr. Robins worked at KPMG LLP, where he was a partner in KPMG's department of professional practice (2002-2004). |
Walter C. Donovan (46) |
| Year of Election or Appointment: 2007 Vice President of Fidelity's Equity Funds. Mr. Donovan also serves as President of FMR and FMR Co., Inc., and Executive Vice President of Fidelity Investments Money Management, Inc. (2007-present). Previously, Mr. Donovan served as Executive Vice President of FMR and FMR Co., Inc. (2005-2007) and Senior Vice President of FMR (2003-2005) and FMR Co., Inc. (2004-2005). |
Eric M. Wetlaufer (46) |
| Year of Election or Appointment: 2006 Vice President of Fidelity's International Equity Funds. Mr. Wetlaufer also serves as Group Chief Investment Officer of FMR. Mr. Wetlaufer is Chairman, Chief Executive Officer, and President of Fidelity Management & Research (Hong Kong) Limited (2008-present); Chairman, Chief Executive Officer, President, and a Director of Fidelity Management & Research (Japan) Inc. (2008-present); Chairman and Chief Executive Officer (2007-present) and President and a Director (2006-present) of Fidelity Management & Research (U.K.) Inc. and President and a Director of Fidelity Research & Analysis Company (2006-present). Before joining Fidelity Investments in 2005, Mr. Wetlaufer was a partner in Oxhead Capital Management (2004-2005) and a Chief Investment Officer of Putnam Investments (1997-2003). |
Scott C. Goebel (40) |
| Year of Election or Appointment: 2008 Secretary and Chief Legal Officer (CLO) of the Fidelity funds. Mr. Goebel also serves as General Counsel, Secretary, and Senior Vice President of FMR (2008-present); Deputy General Counsel of FMR LLC; Chief Legal Secretary of Fidelity Management & Research (Hong Kong) Limited (2008-present) and Assistant Secretary of Fidelity Management & Research (Japan) Inc. (2008-present). Previously, Mr. Goebel served as Assistant Secretary of the Funds (2007-2008) and as Vice President and Secretary of Fidelity Distributors Corporation (FDC) (2005-2007). |
John B. McGinty, Jr. (46) |
| Year of Election or Appointment: 2008 Assistant Secretary of Fidelity's Equity and High Income Funds. Mr. McGinty is an employee of Fidelity Investments (2004-present). Mr. McGinty also serves as Senior Vice President, Secretary, and Chief Legal Officer of FDC (2007-present). Before joining Fidelity Investments, Mr. McGinty practiced law at Ropes & Gray, LLP. |
Holly C. Laurent (54) |
| Year of Election or Appointment: 2008 Anti-Money Laundering (AML) Officer of the Fidelity funds. Ms. Laurent is an employee of Fidelity Investments. Previously, Ms. Laurent was Senior Vice President and Head of Legal for Fidelity Business Services India Pvt. Ltd. (2006-2008), Senior Vice President, Deputy General Counsel and Group Head for FMR LLC (2005-2006). |
Christine Reynolds (50) |
| Year of Election or Appointment: 2008 Chief Financial Officer of the Fidelity funds. Ms. Reynolds became President of Fidelity Pricing and Cash Management Services (FPCMS) in August 2008. She served as Chief Operating Officer of FPCMS from 2007 through July 2008. Previously, Ms. Reynolds served as President, Treasurer, and Anti-Money Laundering officer of the Fidelity funds (2004-
2007). Before joining Fidelity Investments, Ms. Reynolds worked at PricewaterhouseCoopers LLP (PwC) (1980-2002), where she was an audit partner with PwC's investment management practice. |
Kenneth A. Rathgeber (61) |
| Year of Election or Appointment: 2004 Chief Compliance Officer of Fidelity's Equity and High Income Funds. Mr. Rathgeber is Chief Compliance Officer of Fidelity Management & Research (Hong Kong) Limited (2008-present), Fidelity Management & Research (Japan) Inc. (2008-present), FMR (2005-present), FMR Co., Inc. (2005-present), Fidelity Management & Research (U.K.) Inc. (2005-
present), Fidelity Research & Analysis Company (2005-present), Fidelity Investments Money Management, Inc. (2005-present), and Strategic Advisers, Inc. (2005-present). |
Bryan A. Mehrmann (47) |
| Year of Election or Appointment: 2005 Deputy Treasurer of the Fidelity funds. Mr. Mehrmann is an employee of Fidelity Investments. Previously, Mr. Mehrmann served as Vice President of Fidelity Investments Institutional Services Group (FIIS)/Fidelity Investments Institutional Operations Corporation, Inc. (FIIOC) Client Services (1998-2004). |
Adrien E. Deberghes (41) |
| Year of Election or Appointment: 2008 Deputy Treasurer of Fidelity's Equity and High Income Funds. Mr. Deberghes is an employee of Fidelity Investments (2008-present). Previously, Mr. Deberghes served as Senior Vice President of Mutual Fund Administration at State Street Corporation (2007-2008), Senior Director of Mutual Fund Administration at Investors Bank & Trust (2005-2007), and Director of Finance for Dunkin' Brands (2000-2005). |
Robert G. Byrnes (41) |
| Year of Election or Appointment: 2005 Assistant Treasurer of the Fidelity funds. Mr. Byrnes is an employee of Fidelity Investments (2005-present). Previously, Mr. Byrnes served as Vice President of Fidelity Pricing and Cash Management Services (FPCMS) (2003-2005). Before joining Fidelity Investments, Mr. Byrnes worked at Deutsche Asset Management where he served as Vice President of the Investment Operations Group (2000-2003). |
Peter L. Lydecker (54) |
| Year of Election or Appointment: 2004 Assistant Treasurer of the Fidelity funds. Mr. Lydecker is an employee of Fidelity Investments. |
Paul M. Murphy (61) |
| Year of Election or Appointment: 2007 Assistant Treasurer of the Fidelity funds. Mr. Murphy is an employee of Fidelity Investments (2007-present). Previously, Mr. Murphy served as Chief Financial Officer of the Fidelity Funds (2005-2006), Vice President and Associate General Counsel of FMR (2007), and Senior Vice President of Fidelity Pricing and Cash Management Services (FPCMS) (1994-2007). |
Gary W. Ryan (50) |
| Year of Election or Appointment: 2005 Assistant Treasurer of the Fidelity funds. Mr. Ryan is an employee of Fidelity Investments. Previously, Mr. Ryan served as Vice President of Fund Reporting in Fidelity Pricing and Cash Management Services (FPCMS) (1999-2005). |
** FMR Corp. merged with and into FMR LLC on October 1, 2007. Any references to FMR LLC for prior periods are deemed to be references to the prior entity.
Annual Report
Institutional Class designates 100% of the dividends distributed during the fiscal year as amounts which may be taken into account as a dividend for purposes of the maximum rate under section 1(h)(11) of the Internal Revenue Code.
The fund will notify shareholders in January 2009 of amounts for use in preparing 2008 income tax returns.
Annual Report
A special meeting of the fund's shareholders was held on April 16, 2008. The results of votes taken among shareholders on the proposal before them are reported below. Each vote reported represents one dollar of net asset value held on the record date for the meeting.
PROPOSAL 1 |
To elect a Board of Trustees.A |
| # of
Votes | % of
Votes |
James C. Curvey |
Affirmative | 44,485,656,811.55 | 94.702 |
Withheld | 2,488,551,854.62 | 5.298 |
TOTAL | 46,974,208,666.17 | 100.000 |
Dennis J. Dirks |
Affirmative | 44,706,671,638.31 | 95.173 |
Withheld | 2,267,537,027.86 | 4.827 |
TOTAL | 46,974,208,666.17 | 100.000 |
Edward C. Johnson 3d |
Affirmative | 44,294,881,638.16 | 94.296 |
Withheld | 2,679,327,028.01 | 5.704 |
TOTAL | 46,974,208,666.17 | 100.000 |
Alan J. Lacy |
Affirmative | 44,685,373,413.16 | 95.127 |
Withheld | 2,288,835,253.01 | 4.873 |
TOTAL | 46,974,208,666.17 | 100.000 |
Ned C. Lautenbach |
Affirmative | 44,634,541,379.41 | 95.019 |
Withheld | 2,339,667,286.76 | 4.981 |
TOTAL | 46,974,208,666.17 | 100.000 |
Joseph Mauriello |
Affirmative | 44,683,962,099.80 | 95.124 |
Withheld | 2,290,246,566.37 | 4.876 |
TOTAL | 46,974,208,666.17 | 100.000 |
| # of
Votes | % of
Votes |
Cornelia M. Small |
Affirmative | 44,671,688,375.36 | 95.098 |
Withheld | 2,302,520,290.81 | 4.902 |
TOTAL | 46,974,208,666.17 | 100.000 |
William S. Stavropoulos |
Affirmative | 44,465,262,087.61 | 94.659 |
Withheld | 2,508,946,578.56 | 5.341 |
TOTAL | 46,974,208,666.17 | 100.000 |
David M. Thomas |
Affirmative | 44,694,340,813.87 | 95.147 |
Withheld | 2,279,867,852.30 | 4.853 |
TOTAL | 46,974,208,666.17 | 100.000 |
Michael E. Wiley |
Affirmative | 44,686,513,174.78 | 95.130 |
Withheld | 2,287,695,491.39 | 4.870 |
TOTAL | 46,974,208,666.17 | 100.000 |
A Denotes trust-wide proposal and voting results.
Annual Report
Board Approval of Investment Advisory Contracts and Management Fees
Fidelity Total International Equity Fund
Each year, typically in July, the Board of Trustees, including the Independent Trustees (together, the Board), votes on the renewal of the management contract and sub-advisory agreements (together, the Advisory Contracts) for the fund. The Board, assisted by the advice of fund counsel and Independent Trustees' counsel, requests and considers a broad range of information throughout the year.
The Board meets regularly and, acting directly and through its separate committees, requests and receives information concerning, and considers at each of its meetings factors that are relevant to, its annual consideration of the renewal of the fund's Advisory Contracts, including the services and support provided to the fund and its shareholders. At the time of the renewal, the Board had 12 standing committees, each composed of Independent Trustees with varying backgrounds, to which the Board has assigned specific subject matter responsibilities in order to enhance effective decision-making by the Board. Each committee has a written charter outlining the structure and purposes of the committee. The Board also meets as needed to consider matters specifically related to the Board's annual consideration of the renewal of Advisory Contracts.
At its July 2008 meeting, the Board of Trustees, including the Independent Trustees, unanimously determined to renew the fund's Advisory Contracts. In reaching its determination, the Board considered all factors it believed relevant, including (i) the nature, extent, and quality of the services to be provided to the fund and its shareholders (including the investment performance of the fund); (ii) the competitiveness of the fund's management fee and total expenses; (iii) the total costs of the services to be provided by and the profits to be realized by Fidelity from its relationship with the fund; (iv) the extent to which economies of scale would be realized as the fund grows; and (v) whether fee levels reflect these economies of scale, if any, for the benefit of fund shareholders. The Board also approved agreements with foreign sub-advisers Fidelity Management & Research (Japan) Inc. and Fidelity Management & Research (Hong Kong) Limited, as well as amendments to the fund's agreement with Fidelity Management & Research (U.K.) Inc.
In considering whether to renew the Advisory Contracts for the fund, the Board ultimately reached a determination, with the assistance of fund counsel and Independent Trustees' counsel and through the exercise of its business judgment, that the renewal of the Advisory Contracts and the compensation to be received by Fidelity under the management contract is consistent with Fidelity's fiduciary duty under applicable law. The Board's decision to renew the Advisory Contracts was not based on any single factor noted above, but rather was based on a comprehensive consideration of all the information provided to the Board at its meetings throughout the year. The Board, in reaching its determination to renew the Advisory Contracts, is aware that shareholders in the fund have a broad range of investment choices available to them, including a wide choice among mutual funds offered by competitors to Fidelity, and that the fund's shareholders, with the opportunity to review and weigh the disclosure provided by the fund in its prospectus and other public disclosures, have chosen to invest in this fund, managed by Fidelity.
Annual Report
Board Approval of Investment Advisory Contracts and
Management Fees - continued
Nature, Extent, and Quality of Services Provided. The Board considered staffing within the investment adviser, FMR, and the sub-advisers (together, the Investment Advisers), including the backgrounds of the fund's investment personnel and the fund's investment objective and discipline. The Independent Trustees also had discussions with senior management of Fidelity's investment operations and investment groups. The Board considered the structure of the portfolio manager compensation program and whether this structure provides appropriate incentives.
Resources Dedicated to Investment Management and Support Services. The Board reviewed the size, education, and experience of the Investment Advisers' investment staff, their use of technology, and the Investment Advisers' approach to recruiting, training, and retaining portfolio managers and other research, advisory, and management personnel. The Board noted that Fidelity's analysts have access to a variety of technological tools that enable them to perform both fundamental and quantitative analysis and to specialize in various disciplines. The Board considered Fidelity's extensive global research capabilities that enable the Investment Advisers to aggregate data from various sources in an effort to produce positive investment results. The Board also considered that Fidelity's portfolio managers and analysts have access to daily portfolio attribution that allows for monitoring of a fund's portfolio, as well as an electronic communication system that provides immediate real-time access to research concerning issuers and credit enhancers.
Shareholder and Administrative Services. The Board considered (i) the nature, extent, quality, and cost of advisory, administrative, distribution, and shareholder services performed by the Investment Advisers and their affiliates under the Advisory Contracts and under separate agreements covering transfer agency, pricing and bookkeeping, fund-paid 12b-1 fees, and securities lending services for the fund; (ii) the nature and extent of the Investment Advisers' supervision of third party service providers, principally custodians and subcustodians; and (iii) the resources devoted to, and the record of compliance with, the fund's compliance policies and procedures. The Board also reviewed the allocation of fund brokerage, including allocations to brokers affiliated with the Investment Advisers, the use of brokerage commissions to pay fund expenses, and the use of "soft" commission dollars to pay for research services. The Board further considered that Fidelity voluntarily pays for market data out of its own resources.
The Board noted that the growth of fund assets across the complex allows Fidelity to reinvest in the development of services designed to enhance the value or convenience of the Fidelity funds as investment vehicles. These services include 24-hour access to account information and market information through phone representatives and over the Internet, and investor education materials and asset allocation tools.
Annual Report
Investment in a Large Fund Family. The Board considered the benefits to shareholders of investing in a Fidelity fund, including the benefits of investing in a fund that is part of a large family of funds offering a variety of investment disciplines and providing for a large variety of mutual fund investor services. For example, fund shareholders are offered the privilege of exchanging shares of the fund for shares of other Fidelity funds, as set forth in the fund's prospectus, without paying a sales charge. The Board noted that Fidelity has taken a number of actions over the previous year that benefited particular funds, including (i) dedicating additional resources to investment research and to restructure the investment research teams; (ii) contractually agreeing to reduce the management fees on Fidelity's Institutional Money Market Funds and launching Class IV and Institutional Class of certain of these funds; (iii) reducing the transfer agent fees for the Fidelity Select Portfolios and Investor Class of the VIP funds; and (iv) launching Class K of 29 equity funds as a lower-fee class available to certain employer-sponsored retirement plans.
Investment Performance. The Board considered whether the fund has operated within its investment objective, as well as its record of compliance with its investment restrictions. The Board noted that it is not possible to evaluate performance in any comprehensive fashion because the fund had been in operation for less than one calendar year. Once the fund has been in operation for at least one calendar year, the Board will review the fund's absolute investment performance for each class, as well as the fund's relative investment performance for each class measured against a broad-based securities market index and a peer group of mutual funds.
The Board considered that FMR has taken steps to refocus and strengthen equity research, equity portfolio management, and compliance.
Based on its review, and giving particular weight to the nature and quality of the resources dedicated by the Investment Advisers to maintain and improve relative performance, the Board concluded that the nature, extent, and quality of the services provided to the fund will benefit the fund's shareholders, particularly in light of the Board's view that the fund's shareholders benefit from investing in a fund that is part of a large family of funds offering a variety of investment disciplines and services.
Competitiveness of Management Fee and Total Fund Expenses. The Board considered the fund's management fee and total expenses compared to "mapped groups" of competitive funds and classes. Fidelity creates "mapped groups" by combining similar Lipper investment objective categories that have comparable management fee characteristics. Combining Lipper investment objective categories aids the Board's management fee and total expense comparisons by broadening the competitive group used for comparison and by reducing the number of universes to which various Fidelity funds are compared. The Board also considered supplemental information about how the fund's management fee and total expenses ranked relative to groups based on Lipper classifications, which take into account a fund's market capitalization and style.
Annual Report
Board Approval of Investment Advisory Contracts and
Management Fees - continued
The Board considered two proprietary management fee comparisons for the period of the fund's operations shown in the chart below. The group of Lipper funds used by the Board for management fee comparisons is referred to below as the "Total Mapped Group." The Total Mapped Group comparison focuses on a fund's standing relative to the total universe of comparable funds available to investors, in terms of gross management fees before expense reimbursements or caps. "TMG %" represents the percentage of funds in the Total Mapped Group that had management fees that were lower than the fund's. For example, a TMG % of 14% means that 86% of the funds in the Total Mapped Group had higher management fees than the fund. The "Asset-Size Peer Group" (ASPG) comparison focuses on a fund's standing relative to non-Fidelity funds similar in size to the fund within the Total Mapped Group. The ASPG represents at least 15% of the funds in the Total Mapped Group with comparable asset size and management fee characteristics, subject to a minimum of 50 funds (or all funds in the Total Mapped Group if fewer than 50). Additional information, such as the ASPG quartile in which the fund's management fee ranked, is also included in the chart and considered by the Board.
Fidelity Total International Equity Fund

The Board noted that the fund's management fee ranked below the median of its Total Mapped Group and below the median of its ASPG for the period.
Furthermore, the Board considered that the fund's management fee includes a performance adjustment component (that is, the fund's management fee will be subject to upward or downward adjustment depending upon whether, and to what extent, the fund's investment performance for the performance period exceeds, or is exceeded by, the record (over the same period) of a Board-approved performance adjustment index). The performance adjustment will take effect on November 1, 2008, after the period shown in the chart above.
Annual Report
Based on its review, the Board concluded that the fund's management fee was fair and reasonable in light of the services that the fund receives and the other factors considered.
In its review of each class's total expenses, the Board considered the fund's management fee as well as other fund or class expenses, as applicable, such as transfer agent fees, pricing and bookkeeping fees, fund-paid 12b-1 fees, and custodial, legal, and audit fees. The Board also noted the effects of any waivers and reimbursements on fees and expenses. As part of its review, the Board also considered current and historical total expenses of each class of the fund compared to competitive fund median expenses. Each class of the fund is compared to those funds and classes in the Total Mapped Group (used by the Board for management fee comparisons) that have a similar sales load structure.
The Board noted that the total expenses of each of Class A and Fidelity Total International Equity (retail class) ranked equal to its competitive median for the period and the total expenses of each of Class T, Class B, Class C, and Institutional Class ranked above its competitive median for the period. The Board considered that the total expenses of Class T were above the median primarily because its 12b-1 fee is higher than the typical front-end load class. The Board noted that the fund offers multiple classes, each of which has a different sales load and 12b-1 fee structure, and that the multiple structures are intended to offer a range of pricing options for the intermediary market. The Board also noted that the total expenses of the classes vary primarily by the level of their 12b-1 fees, although differences in transfer agent fees may also cause expenses to vary from class to class.
In its review of total expenses, the Board also considered Fidelity fee structures and other information on clients that FMR and its affiliates service in other competitive markets, such as other mutual funds advised or subadvised by FMR or its affiliates, pension plan clients, and other institutional clients.
Based on its review, the Board concluded that the total expenses of each class of the fund were reasonable, although in some cases above the median of the universe presented for comparison, in light of the services that the fund and its shareholders receive and the other factors considered.
Costs of the Services and Profitability. The Board considered the revenues earned and the expenses incurred by Fidelity in conducting the business of developing, marketing, distributing, managing, administering and servicing the fund and its shareholders. The Board also considered the level of Fidelity's profits in respect of all the Fidelity funds.
Annual Report
Board Approval of Investment Advisory Contracts and
Management Fees - continued
On an annual basis, FMR presents to the Board Fidelity's profitability for the fund. Fidelity calculates the profitability for each fund, as well as aggregate profitability for groups of Fidelity funds and all Fidelity funds, using a series of detailed revenue and cost allocation methodologies which originate with the audited books and records of Fidelity. The Audit Committee of the Board reviews any significant changes from the prior year's methodologies.
PricewaterhouseCoopers LLP (PwC), independent registered public accounting firm and auditor to Fidelity and certain Fidelity funds, has been engaged annually by the Board as part of the Board's assessment of the results of Fidelity's profitability analysis. PwC's engagement includes the review and assessment of Fidelity's methodologies used in determining the revenues and expenses attributable to Fidelity's mutual fund business, and completion of agreed-upon procedures surrounding the mathematical accuracy of fund profitability and its conformity to allocation methodologies. After considering PwC's reports issued under the engagement and information provided by Fidelity, the Board believes that while other allocation methods may also be reasonable, Fidelity's profitability methodologies are reasonable in all material respects.
The Board has also reviewed Fidelity's non-fund businesses and any fall-out benefits related to the mutual fund business as well as cases where Fidelity's affiliates may benefit from or be related to the fund's business.
The Board considered the costs of the services provided by and the profits realized by Fidelity in connection with the operation of the fund and determined that the amount of profit is a fair entrepreneurial profit for the management of the fund.
Economies of Scale. The Board considered whether there have been economies of scale in respect of the management of the Fidelity funds, whether the Fidelity funds (including the fund) have appropriately benefited from any such economies of scale, and whether there is potential for realization of any further economies of scale. The Board considered the extent to which the fund will benefit from economies of scale through increased services to the fund, through waivers or reimbursements, or through fee or expense reductions.
The Board recognized that the fund's management contract incorporates a "group fee" structure, which provides for lower group fee rates as total fund assets under FMR's management increase, and for higher group fee rates as total fund assets under FMR's management decrease. FMR determines the group fee rates based on a tiered asset "breakpoint" schedule. The Board considered that the group fee is designed to deliver the benefits of economies of scale to fund shareholders when total fund assets increase, even if assets of any particular fund are unchanged or have declined, because some portion of Fidelity's costs are attributable to services provided to all Fidelity funds, and all funds benefit if those costs can be allocated among more assets. The Board concluded that, given the group fee structure, fund shareholders will achieve a certain level of economies of scale as assets under FMR's management increase at the fund complex level, regardless of whether Fidelity achieves any such economies of scale.
Annual Report
The Board further concluded that any potential economies of scale are being shared between fund shareholders and Fidelity in an appropriate manner.
Additional Information Requested by the Board. In order to develop fully the factual basis for consideration of the Fidelity funds' Advisory Contracts, the Board requested and received additional information on certain topics, including (i) fund performance trends and actions to be taken by FMR to improve certain funds' overall performance; (ii) portfolio manager changes that have occurred during the past year; (iii) Fidelity's fund profitability methodology, the profitability of certain fund service providers, and profitability trends for certain funds; (iv) Fidelity's compensation structure for portfolio managers and key personnel, including its effects on fund profitability and the extent to which portfolio manager compensation is linked to fund performance; (v) Fidelity's fee structures and rationale for recommending different fees among categories of funds; and (vi) Fidelity's rationale for recommending which funds should have a performance adjustment component as part of their management fees.
Based on its evaluation of all of the conclusions noted above, and after considering all material factors, the Board ultimately concluded that the advisory fee structures are fair and reasonable, and that the fund's Advisory Contracts should be renewed.
Annual Report
Investment Adviser
Fidelity Management & Research Company
Boston, MA
Investment Sub-Advisers
FMR Co., Inc.
Fidelity Management & Research
(U.K.) Inc.
Fidelity Research & Analysis Company
FIL Investment Advisors
Fidelity Investments Japan Limited
FIL Investment Advisors
(U.K.) Ltd.
Fidelity Management & Research
(Hong Kong) Inc.
Fidelity Management & Research
(Japan) Inc.
General Distributor
Fidelity Distributors Corporation
Boston, MA
Transfer and Service Agents
Fidelity Investments Institutional Operations Company, Inc.
Boston, MA
Fidelity Service Company, Inc.
Boston, MA
Custodian
State Street Bank & Trust Company
Quincy, MA
ATIEI-UANN-1208
1.853356.100
Fidelity®
International Small Cap
Fund
Annual Report
October 31, 2008
(2_fidelity_logos) (Registered_Trademark)
Contents
Chairman's Message | <Click Here> | Ned Johnson's message to shareholders. |
Performance | <Click Here> | How the fund has done over time. |
Managements' Discussion | <Click Here> | The managers' review of fund performance, strategy and outlook. |
Shareholder Expense Example | <Click Here> | An example of shareholder expenses. |
Investment Changes | <Click Here> | A summary of major shifts in the fund's investments over the past six months. |
Investments | <Click Here> | A complete list of the fund's investments with their market values. |
Financial Statements | <Click Here> | Statements of assets and liabilities, operations, and changes in net assets, as well as financial highlights. |
Notes | <Click Here> | Notes to financial statements. |
Report of Independent Registered Public Accounting Firm | <Click Here> | |
Trustees and Officers | <Click Here> | |
Distributions | <Click Here> | |
Proxy Voting Results | <Click Here> | |
Board Approval of Investment Advisory Contracts and Management Fees | <Click Here> | |
To view a fund's proxy voting guidelines and proxy voting record for the 12-month period ended June 30, visit http://www.fidelity.com (search for "proxy voting guidelines") or visit the Securities and Exchange Commission's (SEC) web site at http://www.sec.gov. You may also call 1-800-544-8544 to request a free copy of the proxy voting guidelines.
Standard & Poor's, S&P and S&P 500 are registered service marks of The McGraw-Hill Companies, Inc. and have been licensed for use by Fidelity Distributors Corporation.
Other third party marks appearing herein are the property of their respective owners.
All other marks appearing herein are registered or unregistered trademarks or service marks of FMR LLC or an affiliated company.
Annual Report
This report and the financial statements contained herein are submitted for the general information of the shareholders of the fund. This report is not authorized for distribution to prospective investors in the fund unless preceded or accompanied by an effective prospectus.
A fund files its complete schedule of portfolio holdings with the SEC for the first and third quarters of each fiscal year on Form N-Q. Forms N-Q are available on the SEC's web site at http://www.sec.gov. A fund's Forms N-Q may be reviewed and copied at the SEC's Public Reference Room in Washington, DC. Information regarding the operation of the SEC's Public Reference Room may be obtained by calling 1-800-SEC-0330. For a complete list of a fund's portfolio holdings, view the most recent holdings listing, semiannual report, or annual report on Fidelity's web site at http://www.fidelity.com or http://www.advisor.fidelity.com, as applicable.
NOT FDIC INSURED · MAY LOSE VALUE · NO BANK GUARANTEE
Neither the fund nor Fidelity Distributors Corporation is a bank.
Annual Report
(photo_of_Edward_C_Johnson_3d)
Dear Shareholder:
Turmoil has been the watchword for the world's securities markets in 2008, with domestic and international stocks down sharply amid the global credit squeeze. A flight to quality boosted returns for U.S. Treasuries, one of the few asset classes with positive results heading into the latter stages of the year. Financial markets are always unpredictable, but there are a number of time-tested principles that can put the historical odds in your favor.
One of the basic tenets is to invest for the long term. Over time, riding out the markets' inevitable ups and downs has proven much more effective than selling into panic or chasing the hottest trend. Even missing only a few of the markets' best days can significantly diminish investor returns. Patience also affords the benefits of compounding - of earning interest on additional income or reinvested dividends and capital gains. There are tax advantages and cost benefits to consider as well. The more you sell, the more taxes you pay, and the more you trade, the higher the costs. While staying the course doesn't eliminate risk, it can considerably lessen the effect of short-term declines.
You can further manage your investing risk through diversification. And today, more than ever, geographic diversification should be taken into account. Studies indicate that asset allocation is the single most important determinant of a portfolio's long-term success. The right mix of stocks, bonds and cash - aligned to your particular risk tolerance and investment objective - is very important. Age-appropriate rebalancing is also an essential aspect of asset allocation. For younger investors, an emphasis on equities - which historically have been the best-performing asset class over time - is encouraged. As investors near their specific goal, such as retirement or sending a child to college, consideration may be given to replacing volatile assets (e.g. common stocks) with more-stable fixed investments (bonds or savings plans).
A third investment principle - investing regularly - can help lower the average cost of your purchases. Investing a certain amount of money each month or quarter helps ensure you won't pay for all your shares at market highs. This strategy - known as dollar cost averaging - also reduces unconstructive "emotion" from investing, helping shareholders avoid selling weak performers just prior to an upswing, or chasing a hot performer just before a correction.
We invite you to contact us via the Internet, through our Investor Centers or over the phone. It is our privilege to provide you the information you need to make the investments that are right for you.
Sincerely,
/s/Edward C. Johnson 3d
Edward C. Johnson 3d
Annual Report
Average annual total return reflects the change in the value of an investment, assuming reinvestment of the class' dividend income and capital gains (the profits earned upon the sale of securities that have grown in value, if any) and assuming a constant rate of performance each year. The $10,000 table and the fund's returns do not reflect the deduction of taxes that a shareholder would pay on fund distributions or the redemption of fund shares. During periods of reimbursement by Fidelity, a fund's total return will be greater than it would be had the reimbursement not occurred. How a fund did yesterday is no guarantee of how it will do tomorrow.
Average Annual Total Returns
Periods ended October 31, 2008 | Past 1
year | Past 5
years | Life of
fund A |
International Small Cap | -53.25% | 3.91% | 13.32% |
A From September 18, 2002.
$10,000 Over Life of Fund
Let's say hypothetically that $10,000 was invested in International Small Cap, a class of the fund, on September 18, 2002, when the fund started. The chart shows how the value of your investment would have changed, and also shows how the MSCI® EAFE® Small Cap Index performed over the same period.
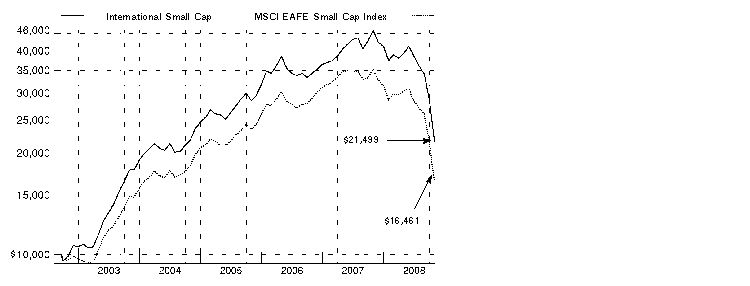
Annual Report
Comments from Colin Stone, Noriko Takahashi and Wilson Wong, Co-Portfolio Managers of Fidelity® International Small Cap Fund
International stocks fell hard during the 12 months ending October 31, 2008, especially during the latter stages of the period and mostly as a result of fallout from the financial crisis in the United States. The viral spread of this financial contagion - which began in the U.S. subprime mortgage market, then seized up the credit markets, hobbled major financial institutions and eventually slowed economic growth worldwide - left virtually no corner of the globe untouched. Developed international equity markets - as gauged by the MSCI® Europe, Australasia, Far East (EAFE®) Index, which monitors established markets outside the U.S. and Canada - fell 46.54%, while the Standard & Poor's 500SM Index, a measure of U.S. stocks, dropped 36.10%. Among countries constituting at least 1% of the EAFE index, Switzerland had the "least worst" showing, falling roughly 32%, followed by Japan, where stocks slid by around 37%. The weakest overall performance came from Belgium, where stocks slipped by nearly 70%. In the United Kingdom, the largest component of the index, equities were down almost 48%. Emerging markets declined 56.22%, as measured by the MSCI Emerging Markets Index.
During the year, the fund's Retail Class shares returned -53.25%, versus -53.46% for the MSCI Europe, Australasia, Far East Small Cap Index. Stock selection was helpful in Germany and Canada. Conversely, our picks in Japan and Australia hurt. On a sector basis, stock and market selection in health care and materials helped, as did our cash stake, while poor picks in information technology, consumer discretionary, industrials and financials detracted. The Asia-Pacific ex Japan subportfolio beat its benchmark. Contributors included Australia's Incitec Pivot, which benefited from high fertilizer prices earlier in the period and which we sold. An out-of-benchmark stake in Oil Search - based in Papua New Guinea - helped as well. Detractors included Queensland Gas Company, an Australian holding that we sold. The Europe/Middle East/Africa subportfolio edged its benchmark. Western Canadian Coal profited from higher coal prices and was sold from the fund. Swiss biopharmaceutical company Actelion also added value, while U.K.-headquartered Phorm, a global digital technology company, detracted. The three stocks just mentioned were out-of-index holdings. The Japanese subportfolio trailed its benchmark. Crystal electronic parts maker Nihon Dempa Kogyo - which we sold - and auto parts manufacturer Nippon Seiki detracted. Tsumura, an herbal medicine company, contributed.
The views expressed above reflect those of the portfolio manager(s) only through the end of the period as stated on the cover of this report and do not necessarily represent the views of Fidelity or any other person in the Fidelity organization. Any such views are subject to change at any time based upon market or other conditions and Fidelity disclaims any responsibility to update such views. These views may not be relied on as investment advice and, because investment decisions for a Fidelity fund are based on numerous factors, may not be relied on as an indication of trading intent on behalf of any Fidelity fund.
Annual Report
Shareholder Expense Example
As a shareholder of the Fund, you incur two types of costs: (1) transaction costs, including sales charges (loads) on purchase payments or redemption proceeds, redemption fees, and (2) ongoing costs, including management fees, distribution and/or service (12b-1) fees and other Fund expenses. This Example is intended to help you understand your ongoing costs (in dollars) of investing in the Fund and to compare these costs with the ongoing costs of investing in other mutual funds.
The Example is based on an investment of $1,000 invested at the beginning of the period and held for the entire period (May 1, 2008 to October 31, 2008).
Actual Expenses
The first line of the accompanying table for each class of the Fund provides information about actual account values and actual expenses. You may use the information in this line, together with the amount you invested, to estimate the expenses that you paid over the period. Simply divide your account value by $1,000.00 (for example, an $8,600 account value divided by $1,000.00 = 8.6), then multiply the result by the number in the first line for a class of the Fund under the heading entitled "Expenses Paid During Period" to estimate the expenses you paid on your account during this period. A small balance maintenance fee of $12.00 that is charged once a year may apply for certain accounts with a value of less than $2,000. This fee is not included in the table below. If it was, the estimate of expenses you paid during the period would be higher, and your ending account value lower, by this amount. In addition, the Fund, as a shareholder in the underlying Fidelity Central Funds, will indirectly bear its pro rata share of the fees and expenses incurred by the underlying Fidelity Central Funds. These fees and expenses are not included in the Fund's annualized expense ratio used to calculate the expense estimate in the table below.
Hypothetical Example for Comparison Purposes
The second line of the accompanying table for each class of the Fund provides information about hypothetical account values and hypothetical expenses based on a Class' actual expense ratio and an assumed rate of return of 5% per year before expenses, which is not the Class' actual return. The hypothetical account values and expenses may not be used to estimate the actual ending account balance or expenses you paid for the period. You may use this information to compare the ongoing costs of investing in the Fund and other funds. To do so, compare this 5% hypothetical example with the 5% hypothetical examples that appear in the shareholder reports of the other funds. A small balance maintenance fee of $12.00 that is charged once a year may apply for certain accounts with a value of less than $2,000. This fee is not included in the table below. If it was, the estimate of expenses you paid during the period would be higher, and your ending account value lower, by this amount. In addition, the Fund, as a shareholder in the underlying Fidelity Central Funds, will indirectly bear its pro rata share of the fees and expenses incurred by the underlying Fidelity Central Funds. These fees and expenses are not included in the Fund's annualized expense ratio used to calculate the expense estimate in the table below.
Annual Report
Please note that the expenses shown in the table are meant to highlight your ongoing costs only and do not reflect any transaction costs. Therefore, the second line of the table is useful in comparing ongoing costs only, and will not help you determine the relative total costs of owning different funds. In addition, if these transactional costs were included, your costs would have been higher.
| Annualized
Expense Ratio | Beginning
Account Value
May 1, 2008 | Ending
Account Value
October 31, 2008 | Expenses Paid
During Period*
May 1, 2008 to October 31, 2008 |
Class A | 1.65% | | | |
Actual | | $ 1,000.00 | $ 546.80 | $ 6.42 |
HypotheticalA | | $ 1,000.00 | $ 1,016.84 | $ 8.36 |
Class T | 1.90% | | | |
Actual | | $ 1,000.00 | $ 546.40 | $ 7.39 |
HypotheticalA | | $ 1,000.00 | $ 1,015.58 | $ 9.63 |
Class B | 2.40% | | | |
Actual | | $ 1,000.00 | $ 545.20 | $ 9.32 |
HypotheticalA | | $ 1,000.00 | $ 1,013.07 | $ 12.14 |
Class C | 2.40% | | | |
Actual | | $ 1,000.00 | $ 545.20 | $ 9.32 |
HypotheticalA | | $ 1,000.00 | $ 1,013.07 | $ 12.14 |
International Small Cap | 1.52% | | | |
Actual | | $ 1,000.00 | $ 547.60 | $ 5.91 |
HypotheticalA | | $ 1,000.00 | $ 1,017.50 | $ 7.71 |
Institutional Class | 1.40% | | | |
Actual | | $ 1,000.00 | $ 547.70 | $ 5.45 |
HypotheticalA | | $ 1,000.00 | $ 1,018.10 | $ 7.10 |
A 5% return per year before expenses
* Expenses are equal to each Class' annualized expense ratio, multiplied by the average account value over the period, multiplied by 184/366 (to reflect the one-half year period).
Annual Report
Investment Changes (Unaudited)
Geographic Diversification (% of fund's net assets) |
As of October 31, 2008 |
| Japan 32.3% |
| United Kingdom 19.7% |
| United States of America 8.3% |
| Australia 7.6% |
| Germany 6.5% |
| France 5.3% |
| Switzerland 2.6% |
| Sweden 1.7% |
| Spain 1.7% |
| Other 14.3% |

Percentages are adjusted for the effect of futures contracts, if applicable. |
As of April 30, 2008 |
| Japan 29.8% |
| United Kingdom 17.0% |
| Australia 10.5% |
| United States of America 7.3% |
| Canada 3.8% |
| Germany 3.2% |
| France 2.8% |
| Sweden 2.4% |
| Bermuda 2.3% |
| Other 20.9% |

Percentages are adjusted for the effect of futures contracts, if applicable. |
Asset Allocation |
| % of fund's
net assets | % of fund's net assets
6 months ago |
Stocks and Investment Companies | 92.5 | 95.0 |
Bonds | 0.0 | 0.4 |
Short-Term Investments and Net Other Assets | 7.5 | 4.6 |
Top Ten Stocks as of October 31, 2008 |
| % of fund's
net assets | % of fund's net assets
6 months ago |
Actelion Ltd. (Reg.) (Switzerland, Biotechnology) | 1.7 | 1.1 |
Biotest AG (non-vtg.) (Germany, Biotechnology) | 1.5 | 0.0 |
ASOS PLC (United Kingdom, Internet & Catalog Retail) | 1.3 | 0.0 |
Seven Bank Ltd. (Japan, Commercial Banks) | 1.0 | 0.0 |
Grifols SA (Spain, Biotechnology) | 1.0 | 0.7 |
Xchanging PLC (United Kingdom, IT Services) | 1.0 | 0.6 |
Datacash Group PLC (United Kingdom, IT Services) | 1.0 | 0.7 |
Fresenius Medical Care AG (Germany, Health Care Providers & Services) | 0.9 | 0.5 |
Autonomy Corp. PLC (United Kingdom, Software) | 0.9 | 0.6 |
SHO-BOND Holdings Co. Ltd. (Japan, Construction & Engineering) | 0.8 | 0.0 |
| 11.1 | |
Market Sectors as of October 31, 2008 |
| % of fund's
net assets | % of fund's net assets
6 months ago |
Health Care | 19.4 | 8.8 |
Industrials | 14.8 | 14.9 |
Consumer Discretionary | 14.8 | 17.0 |
Information Technology | 12.8 | 12.1 |
Financials | 9.1 | 7.2 |
Materials | 6.4 | 19.4 |
Energy | 6.0 | 8.3 |
Consumer Staples | 5.1 | 6.9 |
Utilities | 2.6 | 0.3 |
Telecommunication Services | 1.3 | 0.5 |
Annual Report
Investments October 31, 2008
Showing Percentage of Net Assets
Common Stocks - 90.8% |
| Shares | | Value (000s) |
Australia - 7.6% |
AGL Energy Ltd. | 41,046 | | $ 385 |
Allied Gold Ltd. (a) | 1,000,000 | | 143 |
Allied Gold Ltd. (United Kingdom) (a) | 5,974,800 | | 904 |
Ansell Ltd. | 468,802 | | 3,942 |
APA Group unit | 1,269,996 | | 2,474 |
Bradken Ltd. | 84,197 | | 278 |
Centamin Egypt Ltd. (a) | 8,016,301 | | 3,471 |
Centennial Coal Co. Ltd. | 905,473 | | 2,128 |
Charter Hall Group unit | 393,821 | | 117 |
Coal of Africa Ltd. (a) | 2,057,900 | | 1,685 |
CopperCo Ltd. (a) | 3,342,244 | | 219 |
David Jones Ltd. | 1,228,763 | | 2,529 |
DUET Group | 1,515,279 | | 2,417 |
International Ferro Metals | 993,881 | | 570 |
Invocare Ltd. | 35,429 | | 115 |
Iress Market Technology Ltd. | 210,229 | | 653 |
JB Hi-Fi Ltd. (d) | 246,857 | | 1,448 |
Macquarie Airports unit | 520,928 | | 740 |
Metcash Ltd. | 884,235 | | 2,385 |
Monto Minerals Ltd. (a) | 8,206,552 | | 0 |
Monto Minerals Ltd. warrants 5/25/09 (a) | 1,485,934 | | 0 |
Navitas Ltd. | 1,655,222 | | 2,335 |
Northern Iron Ltd. | 614,455 | | 307 |
Nufarm Ltd. | 144,837 | | 1,048 |
SAI Global Ltd. | 345,535 | | 564 |
Seek Ltd. (d) | 428,872 | | 948 |
SP AusNet unit | 3,634,154 | | 2,677 |
Spark Infrastructure Group unit (f) | 1,942,854 | | 1,898 |
Tassal Group Ltd. | 3,261,040 | | 3,800 |
Tattersall's Ltd. | 485,563 | | 813 |
Tianshan Goldfields Ltd. (a) | 744,712 | | 34 |
Tianshan Goldfields Ltd. (United Kingdom) (a) | 200,000 | | 9 |
United Group Ltd. | 280,367 | | 1,778 |
WorleyParsons Ltd. | 30,013 | | 301 |
Wotif.com Holdings Ltd. | 340,639 | | 784 |
TOTAL AUSTRALIA | | 43,899 |
Belgium - 0.1% |
Hansen Transmission International NV | 500,100 | | 839 |
Bermuda - 1.2% |
Oakley Capital Investments Ltd. (a) | 1,458,000 | | 1,508 |
Peace Mark Holdings Ltd. | 788,000 | | 0 |
Common Stocks - continued |
| Shares | | Value (000s) |
Bermuda - continued |
Ports Design Ltd. | 118,500 | | $ 138 |
PureCircle Ltd. | 616,000 | | 1,359 |
Seadrill Ltd. | 133,600 | | 1,286 |
Vtech Holdings Ltd. | 622,000 | | 2,317 |
Zambezi Resources Ltd.: | | | |
CDI (a) | 2,184,593 | | 80 |
warrants 8/31/09 (a) | 108,686 | | 1 |
TOTAL BERMUDA | | 6,689 |
British Virgin Islands - 1.0% |
Albidon Ltd. unit (a) | 1,469,000 | | 455 |
Kalahari Energy (g) | 1,451,000 | | 1,814 |
Playtech Ltd. (d) | 672,400 | | 3,745 |
TOTAL BRITISH VIRGIN ISLANDS | | 6,014 |
Canada - 1.0% |
AirSea Lines (g) | 1,893,338 | | 362 |
AirSea Lines warrants 8/4/11 (a)(g) | 1,862,300 | | 0 |
Aquiline Resources, Inc. (a) | 125,900 | | 108 |
European Goldfields Ltd. (a) | 966,800 | | 1,211 |
Red Back Mining, Inc. (a) | 742,600 | | 2,919 |
Rock Well Petroleum, Inc. (g) | 770,400 | | 125 |
Starfield Resources, Inc. (a) | 4,328,075 | | 933 |
TOTAL CANADA | | 5,658 |
Cayman Islands - 1.1% |
International Consolidated Minerals, Inc. (a) | 852,927 | | 868 |
New Oriental Education & Technology Group, Inc. sponsored ADR (a) | 28,000 | | 1,791 |
New World Department Store China Ltd. | 3,079,000 | | 1,706 |
Orchid Developments Group Ltd. (a) | 1,211,000 | | 1,607 |
Stella International Holdings Ltd. | 134,000 | | 113 |
TOTAL CAYMAN ISLANDS | | 6,085 |
China - 0.2% |
Baidu.com, Inc. sponsored ADR (a) | 2,400 | | 494 |
Yantai Changyu Pioneer Wine Co. (B Shares) | 254,510 | | 791 |
TOTAL CHINA | | 1,285 |
Common Stocks - continued |
| Shares | | Value (000s) |
Cyprus - 1.0% |
Buried Hill Energy (Cyprus) PCL (g) | 1,947,000 | | $ 4,906 |
Mirland Development Corp. PLC (a) | 800,700 | | 1,033 |
TOTAL CYPRUS | | 5,939 |
Denmark - 0.6% |
Vestas Wind Systems AS (a) | 83,500 | | 3,420 |
Egypt - 0.2% |
Talaat Moustafa Group Holding | 1,669,700 | | 1,101 |
Finland - 0.5% |
Nokian Tyres Ltd. | 222,740 | | 2,912 |
France - 5.3% |
Adenclassifieds SA (a) | 26,500 | | 540 |
Altamir Amboise | 311,100 | | 1,247 |
ALTEN (a)(d) | 48,200 | | 1,215 |
April Group | 84,200 | | 3,054 |
Audika SA | 108,200 | | 2,523 |
Boursorama (a) | 165,300 | | 1,206 |
Delachaux SA (d) | 55,900 | | 3,075 |
Devoteam SA | 41,900 | | 753 |
Iliad Group SA | 46,600 | | 3,685 |
Laurent-Perrier Group | 8,460 | | 686 |
LeGuide.com SA (a) | 96,800 | | 1,589 |
Maisons France Confort | 48,000 | | 830 |
Meetic (a)(d) | 236,186 | | 3,330 |
SeLoger.com (a)(d) | 139,000 | | 2,606 |
SR Teleperformance SA | 109,300 | | 2,359 |
Vilmorin & Cie (d) | 18,910 | | 1,848 |
TOTAL FRANCE | | 30,546 |
Germany - 5.0% |
Biotest AG | 1,902 | | 140 |
CTS Eventim AG | 68,800 | | 1,737 |
Delticom AG | 53,200 | | 2,676 |
Fresenius Medical Care AG | 115,410 | | 5,249 |
Gerresheimer AG | 91,400 | | 3,204 |
KROMI Logistik AG (a) | 126,500 | | 684 |
Q-Cells AG (a)(d) | 73,100 | | 2,876 |
Rational AG | 27,500 | | 2,865 |
SMA Solar Technology AG | 55,500 | | 2,506 |
Solarvalue AG | 96,800 | | 90 |
STRATEC Biomedical Systems AG | 53,265 | | 900 |
United Internet AG | 345,300 | | 3,118 |
Common Stocks - continued |
| Shares | | Value (000s) |
Germany - continued |
Vossloh AG | 16,900 | | $ 1,306 |
Wirecard AG | 277,950 | | 1,628 |
TOTAL GERMANY | | 28,979 |
Greece - 0.6% |
Babis Vovos International Technical SA (a) | 132,000 | | 2,474 |
Jumbo SA | 84,900 | | 862 |
TOTAL GREECE | | 3,336 |
Hong Kong - 0.7% |
Cafe de Coral Holdings Ltd. | 1,094,000 | | 1,719 |
Champion (REIT) | 1,652,000 | | 397 |
First Pacific Co. Ltd. | 1,686,000 | | 681 |
Melco International Development Ltd. | 914,000 | | 164 |
Midland Holdings Ltd. | 624,000 | | 260 |
Prosperity (REIT) | 1,329,000 | | 143 |
Sa Sa International Holdings Ltd. | 2,010,000 | | 307 |
Shaw Brothers (Hong Kong) Ltd. | 93,000 | | 101 |
Texwinca Holdings Ltd. | 1,022,000 | | 478 |
TOTAL HONG KONG | | 4,250 |
Indonesia - 0.1% |
PT Bumi Resources Tbk | 2,782,000 | | 364 |
Ireland - 0.2% |
Kenmare Resources PLC (a) | 1,165,900 | | 292 |
Kenmare Resources PLC warrants 7/23/09 (a) | 1,712,500 | | 84 |
Paddy Power PLC (Ireland) | 54,700 | | 933 |
Vimio PLC (a) | 867,300 | | 0 |
TOTAL IRELAND | | 1,309 |
Italy - 0.3% |
Seldovia Native Association, Inc. (SNAI) (a)(d) | 351,590 | | 1,052 |
Teleunit SpA (a)(e) | 12,312,258 | | 458 |
TOTAL ITALY | | 1,510 |
Japan - 32.3% |
Aioi Insurance Co. Ltd. | 235,000 | | 965 |
Air Water, Inc. | 436,000 | | 4,105 |
Airport Facilities Co. Ltd. | 186,700 | | 1,012 |
Alpen Co. Ltd. | 125,700 | | 2,186 |
ARCS Co. Ltd. | 137,800 | | 1,963 |
Arnest One Corp. (d) | 293,900 | | 379 |
C. Uyemura & Co. Ltd. | 59,100 | | 1,679 |
Common Stocks - continued |
| Shares | | Value (000s) |
Japan - continued |
Chiba Bank Ltd. | 256,000 | | $ 1,265 |
Coca-Cola West Japan Co. Ltd. | 90,700 | | 1,819 |
COMSYS Holdings Corp. | 147,000 | | 1,051 |
Create SD Co. Ltd. | 52,700 | | 807 |
Culture Convenience Club Co. Ltd. (d) | 149,700 | | 992 |
Daicel Chemical Industries Ltd. | 588,000 | | 2,120 |
Daihen Corp. (d) | 1,132,000 | | 2,639 |
Daikin Industries Ltd. | 40,700 | | 915 |
Dainippon Screen Manufacturing Co. Ltd. | 336,000 | | 716 |
Daiseki Co. Ltd. | 98,830 | | 2,251 |
Daito Gyorui Co. Ltd. | 13,000 | | 14 |
Don Quijote Co. Ltd. | 113,200 | | 2,053 |
eAccess Ltd. (d) | 3,211 | | 1,493 |
EPS Co. Ltd. | 979 | | 4,100 |
FamilyMart Co. Ltd. | 88,000 | | 3,486 |
Ferrotec Corp. | 93,700 | | 1,037 |
FreeBit Co., Ltd. (a)(d) | 259 | | 1,059 |
Furuno Electric Co. Ltd. | 193,400 | | 1,147 |
Green Hospital Supply, Inc. (a)(d) | 2,215 | | 755 |
Hamamatsu Photonics KK | 68,500 | | 1,520 |
Hisaka Works Ltd. | 81,000 | | 934 |
Hisamitsu Pharmaceutical Co., Inc. | 37,100 | | 1,546 |
Hitachi Construction Machinery Co. Ltd. (d) | 79,800 | | 926 |
Hitachi Metals Ltd. | 105,000 | | 789 |
Hitachi Transport System Ltd. | 80,700 | | 1,079 |
Hokuto Corp. | 97,500 | | 2,582 |
Ichirokudo Co. Ltd. (a) | 822 | | 397 |
Ichiyoshi Securities Co. Ltd. | 185,300 | | 1,484 |
Iino Kaiun Kaisha Ltd. (d) | 315,600 | | 1,613 |
Inpex Corp. | 447 | | 2,595 |
Itochu Corp. | 339,000 | | 1,791 |
Japan Asia Investment Co. Ltd. (d) | 805,000 | | 611 |
JFE Shoji Holdings, Inc. | 272,000 | | 859 |
Jupiter Telecommunications Co. | 3,036 | | 2,050 |
Kakaku.com, Inc. (d) | 1,216 | | 3,577 |
Kinki Sharyo Co. Ltd. (d) | 234,000 | | 862 |
Kuraray Co. Ltd. | 370,500 | | 2,835 |
McDonald's Holdings Co. (Japan) Ltd. | 108,500 | | 1,657 |
Meiko Electronics Co. Ltd. | 94,200 | | 1,066 |
Mitsubishi UFJ Lease & Finance Co. Ltd. | 118,280 | | 2,832 |
Nabtesco Corp. | 145,000 | | 884 |
Namco Bandai Holdings, Inc. | 414,000 | | 4,257 |
Common Stocks - continued |
| Shares | | Value (000s) |
Japan - continued |
Nihon Kohden Corp. | 206,100 | | $ 3,481 |
Nihon M&A Center, Inc. (d) | 291 | | 1,122 |
Nihon Nohyaku Co. Ltd. (d) | 361,000 | | 1,958 |
Nikon Corp. | 124,000 | | 1,747 |
Nippon Seiki Co. Ltd. | 229,000 | | 1,516 |
Nissha Printing Co. Ltd. (d) | 12,900 | | 717 |
NOF Corp. | 384,000 | | 1,101 |
NS Solutions Corp. | 97,400 | | 1,184 |
Obara Corp. | 50 | | 0 |
Oenon Holdings, Inc. | 663,000 | | 1,761 |
Oiles Corp. | 48 | | 1 |
Onward Holdings Co. Ltd. | 76,000 | | 556 |
ORIX JREIT, Inc. | 733 | | 3,360 |
Otsuka Corp. | 46,500 | | 2,339 |
Pigeon Corp. (d) | 80,500 | | 2,339 |
Point, Inc. | 85,540 | | 4,201 |
R-Tech Ueno Ltd. (d) | 70 | | 409 |
Rengo Co. Ltd. (d) | 649,000 | | 3,309 |
Resona Holdings, Inc. (d) | 1,125 | | 1,180 |
Rohto Pharmaceutical Co. Ltd. | 309,000 | | 3,503 |
Roland DG Corp. (d) | 53,600 | | 668 |
Saizeriya Co. Ltd. (d) | 270,400 | | 4,033 |
Sankyu, Inc. | 913,000 | | 2,877 |
Santen Pharmaceutical Co. Ltd. | 128,000 | | 3,273 |
Sato Corp. | 351,000 | | 3,508 |
Sec Carbon Ltd. | 126,000 | | 413 |
Sega Sammy Holdings, Inc. (d) | 299,300 | | 2,263 |
Sekisui Chemical Co. Ltd. | 216,000 | | 1,262 |
Seven Bank Ltd. | 1,972 | | 5,680 |
Shimadzu Corp. | 395,000 | | 2,703 |
Shin Nippon Biomedical Laboratories Ltd. (d) | 154,000 | | 1,976 |
Shin-Kobe Electric Machinery Co. Ltd. (d) | 173,000 | | 835 |
Shinohara Systems of Construction Co. Ltd. | 268 | | 61 |
SHO-BOND Holdings Co. Ltd. | 274,800 | | 4,909 |
So-net M3, Inc. (d) | 925 | | 3,128 |
Sony Financial Holdings, Inc. | 441 | | 1,434 |
SRI Sports Ltd. | 1,058 | | 890 |
Stanley Electric Co. Ltd. | 215,800 | | 2,713 |
Start Today Co. Ltd. (d) | 426 | | 833 |
Sumitomo Rubber Industries Ltd. | 129,500 | | 1,142 |
Sysmex Corp. | 62,100 | | 1,929 |
T&D Holdings, Inc. | 24,450 | | 934 |
Common Stocks - continued |
| Shares | | Value (000s) |
Japan - continued |
Taikisha Ltd. | 275,400 | | $ 3,931 |
Takeei Corp. (d) | 87,100 | | 750 |
The Suruga Bank Ltd. | 150,000 | | 1,412 |
Tocalo Co. Ltd. | 61,800 | | 597 |
Toho Pharmaceutical Co. Ltd. | 34,000 | | 365 |
Tohoku Electric Power Co., Inc. | 43,800 | | 984 |
Tokai Carbon Co. Ltd. | 78,000 | | 409 |
Tokyo Gas Co. Ltd. | 235,000 | | 1,010 |
Toyo Suisan Kaisha Ltd. | 164,000 | | 4,228 |
Tsumura & Co. | 170,100 | | 4,353 |
USJ Co. Ltd. | 4,057 | | 1,677 |
Works Applications Co. Ltd. | 2,985 | | 1,834 |
TOTAL JAPAN | | 185,552 |
Korea (South) - 0.1% |
Taewoong Co. Ltd. | 8,436 | | 412 |
Luxembourg - 0.3% |
GlobeOp Financial Services SA | 741,785 | | 1,853 |
Malaysia - 0.1% |
Top Glove Corp. Bhd | 380,700 | | 408 |
Netherlands - 1.5% |
Brunel International NV | 96,600 | | 1,249 |
Cryo-Save Group NV | 679,500 | | 307 |
Gemalto NV (a) | 77,100 | | 2,160 |
QIAGEN NV (a) | 282,300 | | 4,144 |
SMARTRAC NV (a) | 49,800 | | 671 |
TOTAL NETHERLANDS | | 8,531 |
New Zealand - 0.4% |
Fisher & Paykel Healthcare Corp. | 877,173 | | 1,521 |
The Warehouse Group Ltd. | 401,934 | | 934 |
TOTAL NEW ZEALAND | | 2,455 |
Norway - 1.1% |
IMAREX NOS ASA (a) | 169,600 | | 1,532 |
Norwegian Property ASA | 400,590 | | 597 |
Revus Energy ASA (a) | 261,800 | | 4,014 |
TOTAL NORWAY | | 6,143 |
Common Stocks - continued |
| Shares | | Value (000s) |
Papua New Guinea - 0.5% |
Lihir Gold Ltd. (a) | 750,837 | | $ 936 |
Oil Search Ltd. | 553,039 | | 1,675 |
TOTAL PAPUA NEW GUINEA | | 2,611 |
Singapore - 1.2% |
MobileOne Ltd. | 609,000 | | 542 |
Raffles Medical Group Ltd. | 2,607,000 | | 1,165 |
Singapore Post Ltd. | 1,313,000 | | 630 |
SMRT Corp. Ltd. | 3,369,000 | | 3,549 |
Suntec (REIT) | 1,498,000 | | 717 |
TOTAL SINGAPORE | | 6,603 |
Spain - 1.7% |
Grifols SA | 280,872 | | 5,590 |
Laboratorios Almirall SA | 159,700 | | 1,415 |
Laboratorios Farmaceuticos ROVI SA | 305,800 | | 2,735 |
TOTAL SPAIN | | 9,740 |
Sweden - 1.7% |
Countermine Technologies AB warrants 3/1/10 (a) | 1,085,197 | | 69 |
Elekta AB (B Shares) | 332,800 | | 4,208 |
Intrum Justitia AB | 235,600 | | 2,327 |
Modern Times Group MTG AB (B Shares) | 54,310 | | 1,165 |
Q-Med AB | 207,100 | | 852 |
RNB RETAIL AND BRANDS AB (d) | 274,351 | | 147 |
XCounter AB (a) | 1,108,000 | | 992 |
TOTAL SWEDEN | | 9,760 |
Switzerland - 2.6% |
Actelion Ltd. (Reg.) (a) | 186,820 | | 9,860 |
Arpida Ltd. (a) | 135 | | 1 |
Basilea Pharmaceutica AG (a) | 13,960 | | 1,893 |
Cytos Biotechnology AG (a) | 30,781 | | 932 |
VZ Holding AG | 48,110 | | 1,975 |
TOTAL SWITZERLAND | | 14,661 |
Taiwan - 0.1% |
Sinyi Realty, Inc. | 694,645 | | 769 |
Thailand - 0.2% |
Advanced Info Service PCL (For. Reg.) | 391,200 | | 829 |
Total Access Communication PCL | 897,500 | | 543 |
TOTAL THAILAND | | 1,372 |
Common Stocks - continued |
| Shares | | Value (000s) |
United Kingdom - 19.5% |
Abcam PLC | 354,600 | | $ 2,590 |
ACP Capital Ltd. | 265,625 | | 68 |
Advanced Fluid Connections PLC (a) | 7,009,687 | | 0 |
Afren PLC (a) | 2,379,850 | | 1,826 |
Antisoma PLC (a) | 3,747,300 | | 1,151 |
Appian Technology PLC warrants 7/11/09 (a)(g) | 479,045 | | 0 |
Ark Therapeutics Group PLC (a) | 789,321 | | 534 |
ASOS PLC (a)(d) | 1,784,800 | | 7,491 |
Autonomy Corp. PLC (a) | 330,900 | | 5,246 |
Axis Shield PLC (a) | 502,500 | | 2,396 |
Axon Group PLC | 412,200 | | 4,207 |
Blackstar Investors PLC (a) | 169,235 | | 162 |
Blinkx PLC (a) | 2,063,000 | | 617 |
Bond International Software PLC | 583,666 | | 483 |
Cadogan Petroleum PLC | 1,406,300 | | 1,895 |
Camco International Ltd. (a) | 1,183,202 | | 670 |
Carluccio's PLC | 633,800 | | 761 |
Celsis International PLC (a) | 443,648 | | 996 |
Centurion Electronics PLC (a)(e) | 748,299 | | 0 |
Ceres Power Holdings PLC (a)(d) | 469,300 | | 515 |
China Goldmines PLC (a) | 590,953 | | 341 |
Clerkenwell Ventures PLC (a) | 2,023,000 | | 945 |
Clipper Windpower PLC (a) | 168,400 | | 583 |
Concateno PLC (a) | 1,990,000 | | 2,952 |
Connaught PLC | 385,900 | | 2,131 |
Corac Group PLC (a) | 3,979,104 | | 2,152 |
Craneware PLC | 865,000 | | 2,965 |
CustomVis PLC (a)(e) | 14,020,636 | | 201 |
CVS Group PLC | 374,200 | | 879 |
Dana Petroleum PLC (a) | 208,800 | | 3,359 |
Datacash Group PLC | 1,568,980 | | 5,463 |
Eclipse Energy Co. Ltd. (g) | 102,000 | | 2,956 |
European Nickel PLC (a) | 3,872,700 | | 161 |
Faroe Petroleum PLC (a) | 262,500 | | 289 |
GoIndustry-DoveBid PLC (a) | 1,466,500 | | 155 |
IBS Group Holding Ltd. GDR (Reg. S) | 311,000 | | 1,344 |
Ideal Shopping Direct PLC | 234,592 | | 166 |
IG Group Holdings PLC | 1,008,089 | | 4,709 |
Inova Holding PLC (a) | 1,443,461 | | 0 |
Intec Telecom Systems PLC (a) | 1,837,268 | | 785 |
Jubilee Platinum PLC (a) | 1,657,843 | | 383 |
Keronite PLC (g) | 13,620,267 | | 1,315 |
Common Stocks - continued |
| Shares | | Value (000s) |
United Kingdom - continued |
Landround PLC warrants 12/11/09 (a)(g) | 166,666 | | $ 0 |
Marwyn Value Investors II Ltd. (a) | 1,670,000 | | 1,033 |
Max Petroleum PLC (a)(d) | 2,509,220 | | 542 |
Michael Page International PLC | 686,419 | | 2,223 |
NCC Group Ltd. | 288,215 | | 1,629 |
Nviro Cleantech PLC (a) | 2,175,000 | | 978 |
Powerleague Group PLC | 786,200 | | 352 |
Pureprofile Media PLC (g) | 1,108,572 | | 669 |
Pursuit Dynamics PLC (a)(d) | 804,239 | | 1,058 |
Redhall Group PLC | 370,000 | | 1,088 |
Regenersis PLC (a) | 815,000 | | 962 |
Renewable Energy Generation Ltd. | 1,762,500 | | 2,294 |
RGI International Ltd. (a) | 337,500 | | 184 |
Romag Holdings PLC | 542,000 | | 1,035 |
Royalblue Group PLC | 299,842 | | 2,770 |
Salamander Energy PLC (a) | 272,400 | | 756 |
SDL PLC (a) | 1,230,962 | | 4,826 |
Serco Group PLC | 480,699 | | 2,866 |
Silverdell PLC (a) | 921,000 | | 379 |
Sinclair Pharma PLC (a) | 1,888,371 | | 599 |
Sphere Medical Holding PLC (g) | 420,000 | | 1,149 |
SR Pharma PLC (a) | 2,889,000 | | 802 |
Stem Cell Sciences PLC (a) | 400,000 | | 68 |
SubSea Resources PLC warrants 11/4/09 (a) | 1,805,625 | | 0 |
Synergy Health PLC (d) | 418,515 | | 2,537 |
TMO Biotec (g) | 1,000,000 | | 1,118 |
Toledo Mining Corp. PLC (a) | 625,864 | | 185 |
Triple Plate Junction PLC (a) | 1,162,400 | | 54 |
Ukrproduct Group Ltd. | 988,000 | | 284 |
Unite Group PLC | 379,010 | | 920 |
Valiant Petroleum PLC | 160,000 | | 923 |
Vectura Group PLC (a) | 1,011,260 | | 770 |
Wellstream Holdings PLC | 248,600 | | 1,735 |
Xchanging PLC | 1,557,400 | | 5,547 |
York Pharma PLC (a) | 837,600 | | 243 |
YouGov PLC (a) | 1,865,154 | | 2,345 |
Zenergy Power PLC (a) | 761,280 | | 1,206 |
ZincOx Resources PLC (a) | 570,100 | | 310 |
TOTAL UNITED KINGDOM | | 112,281 |
United States of America - 0.8% |
CTC Media, Inc. (a) | 336,700 | | 2,492 |
Common Stocks - continued |
| Shares | | Value (000s) |
United States of America - continued |
Cyberview Technology, Inc. (a)(e) | 996,527 | | $ 0 |
Frontera Resources Corp. (a) | 1,157,200 | | 802 |
Frontier Mining Ltd. (a) | 6,056,000 | | 148 |
Phorm, Inc. | 251,500 | | 763 |
TyraTech, Inc. (a) | 191,500 | | 133 |
XL TechGroup, Inc. (a) | 1,329,250 | | 0 |
TOTAL UNITED STATES OF AMERICA | | 4,338 |
TOTAL COMMON STOCKS (Cost $810,643) | 521,624 |
Nonconvertible Preferred Stocks - 1.5% |
| | | |
Germany - 1.5% |
Biotest AG (non-vtg.)
(Cost $11,136) | 136,500 | | 8,451 |
Investment Companies - 0.2% |
| | | |
United Kingdom - 0.2% |
Brookwell Ltd. (e)
(Cost $3,644) | 1,856,210 | | 1,451 |
Money Market Funds - 12.9% |
| | | |
Fidelity Cash Central Fund, 1.81% (b) | 42,315,053 | | 42,315 |
Fidelity Securities Lending Cash Central Fund, 2.67% (b)(c) | 31,582,427 | | 31,582 |
TOTAL MONEY MARKET FUNDS (Cost $73,897) | 73,897 |
TOTAL INVESTMENT PORTFOLIO - 105.4% (Cost $899,320) | | 605,423 |
NET OTHER ASSETS - (5.4)% | | (30,973) |
NET ASSETS - 100% | $ 574,450 |
Legend |
(a) Non-income producing |
(b) Affiliated fund that is available only to investment companies and other accounts managed by Fidelity Investments. The rate quoted is the annualized seven-day yield of the fund at period end. A complete unaudited listing of the fund's holdings as of its most recent quarter end is available upon request. |
(c) Investment made with cash collateral received from securities on loan. |
(d) Security or a portion of the security is on loan at period end. |
(e) Affiliated company |
(f) Security exempt from registration under Rule 144A of the Securities Act of 1933. These securities may be resold in transactions exempt from registration, normally to qualified institutional buyers. At the end of the period, the value of these securities amounted to $1,898,000 or 0.3% of net assets. |
(g) Restricted securities - Investment in securities not registered under the Securities Act of 1933 (excluding 144A issues). At the end of the period, the value of restricted securities (excluding 144A issues) amounted to $14,415,000 or 2.5% of net assets. |
Additional information on each holding is as follows: |
Security | Acquisition Date | Acquisition Cost (000s) |
AirSea Lines | 8/4/06 | $ 1,199 |
AirSea Lines warrants 8/4/11 | 8/4/06 | $ 0 |
Appian Technology PLC warrants 7/11/09 | 2/18/05 | $ 0 |
Buried Hill Energy (Cyprus) PCL | 8/18/06 | $ 2,142 |
Eclipse Energy Co. Ltd. | 4/28/05 | $ 1,459 |
Kalahari Energy | 9/1/06 | $ 1,814 |
Keronite PLC | 8/16/06 | $ 1,549 |
Landround PLC warrants 12/11/09 | 12/12/06 | $ 0 |
Pureprofile Media PLC | 5/3/05 - 1/11/06 | $ 1,173 |
Rock Well Petroleum, Inc. | 4/13/06 | $ 1,004 |
Sphere Medical Holding PLC | 8/27/08 | $ 1,310 |
TMO Biotec | 10/27/05 | $ 535 |
Affiliated Central Funds |
Information regarding fiscal year to date income earned by the Fund from investments in Fidelity Central Funds is as follows: |
Fund | Income earned
(Amounts in thousands) |
Fidelity Cash Central Fund | $ 1,569 |
Fidelity Securities Lending Cash Central Fund | 1,694 |
Total | $ 3,263 |
Other Affiliated Issuers |
An affiliated company is a company in which the fund has ownership of at least 5% of the voting securities. Fiscal year to date transactions with companies which are or were affiliates are as follows: |
Affiliate
(Amounts in thousands) | Value, beginning of period | Purchases | Sales Proceeds | Dividend Income | Value,
end of
period |
ADVFN PLC | $ 2,066 | $ - | $ 1,489 | $ - | $ - |
Allied Gold Ltd. | 12,802 | 3,513 | 9,185 | - | - |
Allied Gold Ltd. (United Kingdom) | 410 | 2,249 | 6,735 | - | - |
BioCare Solutions PLC | 1,260 | - | 73 | - | - |
Brookwell Ltd. | - | 3,644 | - | - | 1,451 |
Capital-XX Ltd. | 3,105 | 736 | 1,321 | - | - |
Centurion Electronics PLC | 89 | - | - | - | - |
Corac Group PLC | 5,414 | - | 767 | - | - |
CustomVis PLC | 591 | 421 | 8 | - | 201 |
Cyberview Technology, Inc. | 3,802 | - | - | - | - |
Frontier Mining Ltd. | 1,619 | - | 35 | - | - |
Healthcare Enterprise Group PLC | 373 | - | 274 | - | - |
Hydrodec Group PLC | 3,795 | - | 9,368 | - | - |
Impact Holdings PLC | 650 | - | 188 | - | - |
Motivcom PLC | 5,545 | - | 2,303 | 49 | - |
Phorm, Inc. | 28,335 | - | 5,912 | - | - |
Skywest Airlines Ltd. | 4,437 | - | 3,480 | 222 | - |
SPI Lasers PLC | 3,778 | - | 1,986 | - | - |
Sylvania Resources Ltd. | 25,111 | 640 | 6,598 | - | - |
Sylvania Resources Ltd. (United Kingdom) | 13,425 | 818 | 27,147 | - | - |
Tanzanite One Ltd. | 8,937 | - | 4,053 | 410 | - |
Teleunit SpA | 1,025 | - | 26 | - | 458 |
Visual Defence, Inc. | 1,503 | - | 509 | - | - |
Total | $ 128,072 | $ 12,021 | $ 81,457 | $ 681 | $ 2,110 |
Income Tax Information |
At October 31, 2008, the fund had a capital loss carryforward of approximately $28,799,000 all of which will expire on October 31, 2016. |
See accompanying notes which are an integral part of the financial statements.
Annual Report
Statement of Assets and Liabilities
Amounts in thousands (except per-share amounts) | October 31, 2008 |
Assets | | |
Investment in securities, at value (including securities loaned of $29,883) - See accompanying schedule: Unaffiliated issuers (cost $809,370) | $ 529,416 | |
Fidelity Central Funds (cost $73,897) | 73,897 | |
Other affiliated issuers (cost $16,053) | 2,110 | |
Total Investments (cost $899,320) | | $ 605,423 |
Foreign currency held at value (cost $821) | | 822 |
Receivable for investments sold | | 6,696 |
Receivable for fund shares sold | | 862 |
Dividends receivable | | 2,108 |
Distributions receivable from Fidelity Central Funds | | 136 |
Receivable from investment adviser for expense reductions | | 24 |
Other receivables | | 245 |
Total assets | | 616,316 |
| | |
Liabilities | | |
Payable for investments purchased | $ 8,143 | |
Payable for fund shares redeemed | 1,075 | |
Accrued management fee | 618 | |
Distribution fees payable | 17 | |
Other affiliated payables | 223 | |
Other payables and accrued expenses | 208 | |
Collateral on securities loaned, at value | 31,582 | |
Total liabilities | | 41,866 |
| | |
Net Assets | | $ 574,450 |
Net Assets consist of: | | |
Paid in capital | | $ 905,604 |
Accumulated undistributed net realized gain (loss) on investments and foreign currency transactions | | (37,825) |
Net unrealized appreciation (depreciation) on investments and assets and liabilities in foreign currencies | | (293,329) |
Net Assets | | $ 574,450 |
See accompanying notes which are an integral part of the financial statements.
Annual Report
Statement of Assets and Liabilities - continued
Amounts in thousands (except per-share amounts) | October 31, 2008 |
Calculation of Maximum Offering Price Class A: Net Asset Value and redemption price per share ($13,561 ÷ 1,138.35 shares) | | $ 11.91 |
| | |
Maximum offering price per share (100/94.25 of $11.91) | | $ 12.64 |
Class T:
Net Asset Value and redemption price per share ($13,493 ÷ 1,139.44 shares) | | $ 11.84 |
| | |
Maximum offering price per share (100/96.50 of $11.84) | | $ 12.27 |
Class B:
Net Asset Value and offering price per share ($3,230 ÷ 277.28 shares)A | | $ 11.65 |
| | |
Class C:
Net Asset Value and offering price per share ($5,658 ÷ 483.62 shares)A | | $ 11.70 |
| | |
| | |
International Small Cap:
Net Asset Value, offering price and redemption price per share ($536,291 ÷ 44,591.13 shares) | | $ 12.03 |
| | |
Institutional Class:
Net Asset Value, offering price and redemption price per share ($2,217 ÷ 184.55 shares) | | $ 12.01 |
A Redemption price per share is equal to net asset value less any applicable contingent deferred sales charge.
See accompanying notes which are an integral part of the financial statements.
Annual Report
Financial Statements - continued
Statement of Operations
Amounts in thousands | Year ended October 31, 2008 |
Investment Income | | |
Dividends (including $681 earned from other affiliated issuers) | | $ 17,101 |
Interest | | 348 |
Income from Fidelity Central Funds (including $1,694 from security lending) | | 3,263 |
| | 20,712 |
Less foreign taxes withheld | | (1,152) |
Total income | | 19,560 |
| | |
Expenses | | |
Management fee
Basic fee | $ 10,529 | |
Performance adjustment | 3,402 | |
Transfer agent fees | 2,880 | |
Distribution fees | 416 | |
Accounting and security lending fees | 577 | |
Custodian fees and expenses | 465 | |
Independent trustees' compensation | 6 | |
Registration fees | 84 | |
Audit | 136 | |
Legal | 7 | |
Miscellaneous | 207 | |
Total expenses before reductions | 18,709 | |
Expense reductions | (736) | 17,973 |
Net investment income (loss) | | 1,587 |
Realized and Unrealized Gain (Loss) Net realized gain (loss) on: | | |
Investment securities: | | |
Unaffiliated issuers (net of foreign taxes of $741) | 6,591 | |
Other affiliated issuers | 3,373 | |
Foreign currency transactions | (1,386) | |
Total net realized gain (loss) | | 8,578 |
Change in net unrealized appreciation (depreciation) on: Investment securities (net of decrease in deferred foreign taxes of $751) | (799,901) | |
Assets and liabilities in foreign currencies | 414 | |
Total change in net unrealized appreciation (depreciation) | | (799,487) |
Net gain (loss) | | (790,909) |
Net increase (decrease) in net assets resulting from operations | | $ (789,322) |
See accompanying notes which are an integral part of the financial statements.
Annual Report
Statement of Changes in Net Assets
Amounts in thousands | Year ended
October 31,
2008 | Year ended
October 31,
2007 |
Increase (Decrease) in Net Assets | | |
Operations | | |
Net investment income (loss) | $ 1,587 | $ 7,040 |
Net realized gain (loss) | 8,578 | 289,903 |
Change in net unrealized appreciation (depreciation) | (799,487) | 201,775 |
Net increase (decrease) in net assets resulting
from operations | (789,322) | 498,718 |
Distributions to shareholders from net investment income | (6,293) | (3,787) |
Distributions to shareholders from net realized gain | (288,048) | (351,004) |
Total distributions | (294,341) | (354,791) |
Share transactions - net increase (decrease) | (123,774) | (298,912) |
Redemption fees | 146 | 245 |
Total increase (decrease) in net assets | (1,207,291) | (154,740) |
| | |
Net Assets | | |
Beginning of period | 1,781,741 | 1,936,481 |
End of period (including undistributed net investment income of $0 and $7,171, respectively) | $ 574,450 | $ 1,781,741 |
See accompanying notes which are an integral part of the financial statements.
Annual Report
Financial Highlights - Class A
Years ended October 31, | 2008 | 2007 | 2006 | 2005 | 2004 |
Selected Per-Share Data | | | | | |
Net asset value, beginning of period | $ 31.14 | $ 28.79 | $ 26.69 | $ 21.25 | $ 17.69 |
Income from Investment
Operations | | | | |
Net investment income (loss) C | - G | .03 | (.02) | .05 | .02 |
Net realized and unrealized gain (loss) | (14.03) | 7.97 | 5.05 | 6.16 | 3.83 |
Total from investment operations | (14.03) | 8.00 | 5.03 | 6.21 | 3.85 |
Distributions from net investment income | (.03) | - | (.05) | (.02) | (.02) |
Distributions from net realized gain | (5.18) | (5.65) | (2.89) | (.77) | (.31) |
Total distributions | (5.20) H | (5.65) | (2.94) | (.79) | (.33) |
Redemption fees added to paid in capital C | - G | - G | .01 | .02 | .04 |
Net asset value, end of period | $ 11.91 | $ 31.14 | $ 28.79 | $ 26.69 | $ 21.25 |
Total Return A, B | (53.35)% | 33.43% | 20.22% | 30.16% | 22.36% |
Ratios to Average Net Assets D, F | | | | |
Expenses before reductions | 1.82% | 1.53% | 1.64% | 1.66% | 1.71% |
Expenses net of fee waivers, if any | 1.65% | 1.53% | 1.64% | 1.66% | 1.71% |
Expenses net of all reductions | 1.60% | 1.49% | 1.58% | 1.63% | 1.69% |
Net investment income (loss) | -% I | .10% | (.08)% | .21% | .09% |
Supplemental Data | | | | | |
Net assets, end of period (in millions) | $ 14 | $ 39 | $ 37 | $ 35 | $ 13 |
Portfolio turnover rate E | 113% | 70% | 84% | 79% | 77% |
A Total returns would have been lower had certain expenses not been reduced during the periods shown.
B Total returns do not include the effect of the sales charges.
C Calculated based on average shares outstanding during the period.
D Fees and expenses of the underlying Fidelity Central Funds are not included in the Fund's expense ratio. The Fund indirectly bears its proportionate share of the expenses of any underlying Fidelity Central Funds.
E Amount does not include the portfolio activity of any underlying Fidelity Central Funds.
F Expense ratios reflect operating expenses of the class. Expenses before reductions do not reflect amounts reimbursed by the investment adviser or reductions from brokerage service arrangements or other expense offset arrangements and do not represent the amount paid by the class during periods when reimbursements or reductions occur. Expenses net of fee waivers reflect expenses after reimbursement by the investment adviser but prior to reductions from brokerage service arrangements or other expense offset arrangements. Expenses net of all reductions represent the net expenses paid by the class.
G Amount represents less than $.01 per share.
H Total distributions of $5.20 per share is comprised of distributions from net investment income of $.026 and distributions from net realized gain of $5.176 per share.
I Amount represents less than .01%.
See accompanying notes which are an integral part of the financial statements.
Annual Report
Financial Highlights - Class T
Years ended October 31, | 2008 | 2007 | 2006 | 2005 | 2004 |
Selected Per-Share Data | | | | | |
Net asset value, beginning of period | $ 30.96 | $ 28.64 | $ 26.57 | $ 21.20 | $ 17.68 |
Income from Investment Operations | | | | | |
Net investment income (loss) C | (.05) | (.04) | (.09) | (.01) | (.03) |
Net realized and unrealized gain (loss) | (13.95) | 7.93 | 5.03 | 6.12 | 3.83 |
Total from investment operations | (14.00) | 7.89 | 4.94 | 6.11 | 3.80 |
Distributions from net investment income | - | - | - | - | (.01) |
Distributions from net realized gain | (5.12) | (5.57) | (2.88) | (.76) | (.31) |
Total distributions | (5.12) | (5.57) | (2.88) | (.76) | (.32) |
Redemption fees added to paid in capital C | - G | - G | .01 | .02 | .04 |
Net asset value, end of period | $ 11.84 | $ 30.96 | $ 28.64 | $ 26.57 | $ 21.20 |
Total Return A, B | (53.46)% | 33.07% | 19.93% | 29.72% | 22.07% |
Ratios to Average Net Assets D, F | | | | | |
Expenses before reductions | 2.07% | 1.77% | 1.89% | 1.92% | 1.94% |
Expenses net of fee waivers, if any | 1.90% | 1.77% | 1.89% | 1.91% | 1.94% |
Expenses net of all reductions | 1.86% | 1.73% | 1.83% | 1.88% | 1.92% |
Net investment income (loss) | (.25)% | (.14)% | (.32)% | (.04)% | (.14)% |
Supplemental Data | | | | | |
Net assets, end of period (in millions) | $ 13 | $ 41 | $ 42 | $ 42 | $ 15 |
Portfolio turnover rate E | 113% | 70% | 84% | 79% | 77% |
A Total returns would have been lower had certain expenses not been reduced during the periods shown.
B Total returns do not include the effect of the sales charges.
C Calculated based on average shares outstanding during the period.
D Fees and expenses of the underlying Fidelity Central Funds are not included in the Fund's expense ratio. The Fund indirectly bears its proportionate share of the expenses of any underlying Fidelity Central Funds.
E Amount does not include the portfolio activity of any underlying Fidelity Central Funds.
F Expense ratios reflect operating expenses of the class. Expenses before reductions do not reflect amounts reimbursed by the investment adviser or reductions from brokerage service arrangements or other expense offset arrangements and do not represent the amount paid by the class during periods when reimbursements or reductions occur. Expenses net of fee waivers reflect expenses after reimbursement by the investment adviser but prior to reductions from brokerage service arrangements or other expense offset arrangements. Expenses net of all reductions represent the net expenses paid by the class.
G Amount represents less than $.01 per share.
See accompanying notes which are an integral part of the financial statements.
Annual Report
Financial Highlights - Class B
Years ended October 31, | 2008 | 2007 | 2006 | 2005 | 2004 |
Selected Per-Share Data | | | | | |
Net asset value, beginning of period | $ 30.49 | $ 28.26 | $ 26.24 | $ 20.99 | $ 17.62 |
Income from Investment Operations | | | | | |
Net investment income (loss) C | (.16) | (.18) | (.24) | (.14) | (.16) |
Net realized and unrealized gain (loss) | (13.73) | 7.82 | 4.98 | 6.08 | 3.80 |
Total from investment operations | (13.89) | 7.64 | 4.74 | 5.94 | 3.64 |
Distributions from net realized gain | (4.95) | (5.41) | (2.73) | (.71) | (.31) |
Redemption fees added to paid in capital C | - G | - G | .01 | .02 | .04 |
Net asset value, end of period | $ 11.65 | $ 30.49 | $ 28.26 | $ 26.24 | $ 20.99 |
Total Return A, B | (53.68)% | 32.38% | 19.28% | 29.13% | 21.21% |
Ratios to Average Net Assets D, F | | | | | |
Expenses before reductions | 2.58% | 2.30% | 2.48% | 2.49% | 2.63% |
Expenses net of fee waivers, if any | 2.40% | 2.30% | 2.40% | 2.43% | 2.63% |
Expenses net of all reductions | 2.36% | 2.26% | 2.34% | 2.40% | 2.60% |
Net investment income (loss) | (.75)% | (.66)% | (.84)% | (.56)% | (.83)% |
Supplemental Data | | | | | |
Net assets, end of period (in millions) | $ 3 | $ 11 | $ 11 | $ 13 | $ 5 |
Portfolio turnover rate E | 113% | 70% | 84% | 79% | 77% |
A Total returns would have been lower had certain expenses not been reduced during the periods shown.
B Total returns do not include the effect of the contingent deferred sales charge.
C Calculated based on average shares outstanding during the period.
D Fees and expenses of the underlying Fidelity Central Funds are not included in the Fund's expense ratio. The Fund indirectly bears its proportionate share of the expenses of any underlying Fidelity Central Funds.
E Amount does not include the portfolio activity of any underlying Fidelity Central Funds.
F Expense ratios reflect operating expenses of the class. Expenses before reductions do not reflect amounts reimbursed by the investment adviser or reductions from brokerage service arrangements or other expense offset arrangements and do not represent the amount paid by the class during periods when reimbursements or reductions occur. Expenses net of fee waivers reflect expenses after reimbursement by the investment adviser but prior to reductions from brokerage service arrangements or other expense offset arrangements. Expenses net of all reductions represent the net expenses paid by the class.
G Amount represents less than $.01 per share.
See accompanying notes which are an integral part of the financial statements.
Annual Report
Financial Highlights - Class C
Years ended October 31, | 2008 | 2007 | 2006 | 2005 | 2004 |
Selected Per-Share Data | | | | | |
Net asset value, beginning of period | $ 30.62 | $ 28.33 | $ 26.31 | $ 21.04 | $ 17.64 |
Income from Investment Operations | | | | | |
Net investment income (loss) C | (.16) | (.17) | (.23) | (.13) | (.12) |
Net realized and unrealized gain (loss) | (13.78) | 7.85 | 4.99 | 6.10 | 3.80 |
Total from investment operations | (13.94) | 7.68 | 4.76 | 5.97 | 3.68 |
Distributions from net investment income | - | - | - | - | (.01) |
Distributions from net realized gain | (4.98) | (5.39) | (2.75) | (.72) | (.31) |
Total distributions | (4.98) | (5.39) | (2.75) | (.72) | (.32) |
Redemption fees added to paid in capital C | - G | - G | .01 | .02 | .04 |
Net asset value, end of period | $ 11.70 | $ 30.62 | $ 28.33 | $ 26.31 | $ 21.04 |
Total Return A, B | (53.67)% | 32.39% | 19.34% | 29.22% | 21.43% |
Ratios to Average Net Assets D, F | | | | | |
Expenses before reductions | 2.57% | 2.26% | 2.38% | 2.41% | 2.43% |
Expenses net of fee waivers, if any | 2.40% | 2.26% | 2.38% | 2.41% | 2.43% |
Expenses net of all reductions | 2.36% | 2.22% | 2.32% | 2.38% | 2.40% |
Net investment income (loss) | (.76)% | (.62)% | (.81)% | (.54)% | (.62)% |
Supplemental Data | | | | | |
Net assets, end of period (in millions) | $ 6 | $ 20 | $ 21 | $ 25 | $ 9 |
Portfolio turnover rate E | 113% | 70% | 84% | 79% | 77% |
A Total returns would have been lower had certain expenses not been reduced during the periods shown.
B Total returns do not include the effect of the contingent deferred sales charge.
C Calculated based on average shares outstanding during the period.
D Fees and expenses of the underlying Fidelity Central Funds are not included in the Fund's expense ratio. The Fund indirectly bears its proportionate share of the expenses of any underlying Fidelity Central Funds.
E Amount does not include the portfolio activity of any underlying Fidelity Central Funds.
F Expense ratios reflect operating expenses of the class. Expenses before reductions do not reflect amounts reimbursed by the investment adviser or reductions from brokerage service arrangements or other expense offset arrangements and do not represent the amount paid by the class during periods when reimbursements or reductions occur. Expenses net of fee waivers reflect expenses after reimbursement by the investment adviser but prior to reductions from brokerage service arrangements or other expense offset arrangements. Expenses net of all reductions represent the net expenses paid by the class.
G Amount represents less than $.01 per share.
See accompanying notes which are an integral part of the financial statements.
Annual Report
Financial Highlights - International Small Cap
Years ended October 31, | 2008 | 2007 | 2006 | 2005 | 2004 |
Selected Per-Share Data | | | | | |
Net asset value, beginning of period | $ 31.44 | $ 29.03 | $ 26.89 | $ 21.36 | $ 17.71 |
Income from Investment Operations | | | | | |
Net investment income (loss) B | .03 | .12 | .08 | .15 | .10 |
Net realized and unrealized gain (loss) | (14.14) | 8.03 | 5.08 | 6.19 | 3.84 |
Total from investment operations | (14.11) | 8.15 | 5.16 | 6.34 | 3.94 |
Distributions from net investment income | (.12) | (.07) | (.14) | (.06) | (.02) |
Distributions from net realized gain | (5.18) | (5.67) | (2.89) | (.77) | (.31) |
Total distributions | (5.30)G | (5.74) | (3.03) | (.83) | (.33) |
Redemption fees added to paid in capital B | -F | -F | .01 | .02 | .04 |
Net asset value, end of period | $ 12.03 | $ 31.44 | $ 29.03 | $ 26.89 | $ 21.36 |
Total ReturnA | (53.25)% | 33.82% | 20.65% | 30.67% | 22.84% |
Ratios to Average Net AssetsC, E | | | | | |
Expenses before reductions | 1.49% | 1.19% | 1.28% | 1.28% | 1.30% |
Expenses net of fee waivers, if any | 1.49% | 1.19% | 1.28% | 1.28% | 1.30% |
Expenses net of all reductions | 1.44% | 1.15% | 1.22% | 1.25% | 1.28% |
Net investment income (loss) | .16% | .45% | .29% | .59% | .50% |
Supplemental Data | | | | | |
Net assets, end of period (in millions) | $ 536 | $ 1,664 | $ 1,816 | $ 2,090 | $ 1,091 |
Portfolio turnover rateD | 113% | 70% | 84% | 79% | 77% |
A Total returns would have been lower had certain expenses not been reduced during the periods shown.
B Calculated based on average shares outstanding during the period.
C Fees and expenses of the underlying Fidelity Central Funds are not included in the Fund's expense ratio. The Fund indirectly bears its proportionate share of the expenses of any underlying Fidelity Central Funds.
D Amount does not include the portfolio activity of any underlying Fidelity Central Funds.
E Expense ratios reflect operating expenses of the class. Expenses before reductions do not reflect amounts reimbursed by the investment adviser or reductions from brokerage service arrangements or other expense offset arrangements and do not represent the amount paid by the class during periods when reimbursements or reductions occur. Expenses net of fee waivers reflect expenses after reimbursement by the investment adviser but prior to reductions from brokerage service arrangements or other expense offset arrangements. Expenses net of all reductions represent the net expenses paid by the class.
F Amount represents less than $.01 per share.
G Total distributions of $5.30 per share is comprised of distributions from net investment income of $.120 and distributions from net realized gain of $5.176 per share.
See accompanying notes which are an integral part of the financial statements.
Annual Report
Financial Highlights - Institutional Class
Years ended October 31, | 2008 | 2007 | 2006 | 2005 | 2004 |
Selected Per-Share Data | | | | | |
Net asset value, beginning of period | $ 31.38 | $ 28.99 | $ 26.86 | $ 21.36 | $ 17.72 |
Income from Investment Operations | | | | | |
Net investment income (loss) B | .05 | .12 | .08 | .14 | .10 |
Net realized and unrealized gain (loss) | (14.12) | 8.01 | 5.07 | 6.18 | 3.84 |
Total from investment operations | (14.07) | 8.13 | 5.15 | 6.32 | 3.94 |
Distributions from net investment income | (.12) | (.07) | (.14) | (.07) | (.03) |
Distributions from net realized gain | (5.18) | (5.67) | (2.89) | (.77) | (.31) |
Total distributions | (5.30) G | (5.74) | (3.03) | (.84) | (.34) |
Redemption fees added to paid in capital B | - F | - F | .01 | .02 | .04 |
Net asset value, end of period | $ 12.01 | $ 31.38 | $ 28.99 | $ 26.86 | $ 21.36 |
Total Return A | (53.22)% | 33.84% | 20.65% | 30.59% | 22.84% |
Ratios to Average Net Assets C, E | | | | | |
Expenses before reductions | 1.49% | 1.18% | 1.29% | 1.30% | 1.32% |
Expenses net of fee waivers, if any | 1.40% | 1.18% | 1.29% | 1.30% | 1.32% |
Expenses net of all reductions | 1.35% | 1.14% | 1.23% | 1.27% | 1.29% |
Net investment income (loss) | .25% | .45% | .28% | .57% | .49% |
Supplemental Data | | | | | |
Net assets, end of period (in millions) | $ 2 | $ 8 | $ 9 | $ 7 | $ 3 |
Portfolio turnover rate D | 113% | 70% | 84% | 79% | 77% |
A Total returns would have been lower had certain expenses not been reduced during the periods shown.
B Calculated based on average shares outstanding during the period.
C Fees and expenses of the underlying Fidelity Central Funds are not included in the Fund's expense ratio. The Fund indirectly bears its proportionate share of the expenses of any underlying Fidelity Central Funds.
D Amount does not include the portfolio activity of any underlying Fidelity Central Funds.
E Expense ratios reflect operating expenses of the class. Expenses before reductions do not reflect amounts reimbursed by the investment adviser or reductions from brokerage service arrangements or other expense offset arrangements and do not represent the amount paid by the class during periods when reimbursements or reductions occur. Expenses net of fee waivers reflect expenses after reimbursement by the investment adviser but prior to reductions from brokerage service arrangements or other expense offset arrangements. Expenses net of all reductions represent the net expenses paid by the class.
F Amount represents less than $.01 per share.
G Total distributions of $5.30 per share is comprised of distributions from net investment income of $.120 and distributions from net realized gain of $5.176 per share.
See accompanying notes which are an integral part of the financial statements.
Annual Report
Notes to Financial Statements
For the period ended October 31, 2008
(Amounts in thousands except ratios)
1. Organization.
Fidelity International Small Cap Fund (the Fund) is a fund of Fidelity Investment Trust (the trust) and is authorized to issue an unlimited number of shares. The Fund is currently closed to most new accounts. The trust is registered under the Investment Company Act of 1940, as amended (the 1940 Act), as an open-end management investment company organized as a Massachusetts business trust.
The Fund offers Class A, Class T, Class B, Class C, International Small Cap and Institutional Class shares, each of which has equal rights as to assets and voting privileges. Each class has exclusive voting rights with respect to matters that affect that class. Class B shares will automatically convert to Class A shares after a holding period of seven years from the initial date of purchase. Investment income, realized and unrealized capital gains and losses, the common expenses of the Fund, and certain fund-level expense reductions, if any, are allocated on a pro rata basis to each class based on the relative net assets of each class to the total net assets of the Fund. Each class differs with respect to transfer agent and distribution and service plan fees incurred. Certain expense reductions also differ by class.
2. Investments in Fidelity Central Funds.
The Fund may invest in Fidelity Central Funds, which are open-end investment companies available only to other investment companies and accounts managed by Fidelity Management & Research Company (FMR) and its affiliates. The Fund's Schedule of Investments lists each of the Fidelity Central Funds held as of period end, if any, as an investment of the Fund, but does not include the underlying holdings of each Fidelity Central Fund. As an Investing Fund, the Fund indirectly bears its proportionate share of the expenses of the underlying Fidelity Central Funds.
The Money Market Central Funds seek preservation of capital and current income and are managed by Fidelity Investments Money Management, Inc. (FIMM), an affiliate of FMR.
A complete unaudited list of holdings for each Fidelity Central Fund is available upon request or at the SEC's web site at www.sec.gov. In addition, the financial statements of the Fidelity Central Funds are available on the SEC's web site or upon request.
3. Significant Accounting Policies.
The financial statements have been prepared in conformity with accounting principles generally accepted in the United States of America, which require management to make certain estimates and assumptions at the date of the financial statements. Actual results could differ from those estimates. The following summarizes the significant accounting policies of the Fund:
Annual Report
3. Significant Accounting Policies - continued
Security Valuation. Investments are valued as of 4:00 p.m. Eastern time on the last calendar day of the period. Wherever possible, the Fund uses independent pricing services approved by the Board of Trustees to value its investments.
Equity securities, including restricted securities, for which market quotations are readily available, are valued at the last reported sale price or official closing price as reported by an independent pricing service on the primary market or exchange on which they are traded. In the event there were no sales during the day or closing prices are not available, securities are valued at the last quoted bid price. Investments in open-end mutual funds including the Fidelity Central Funds, are valued at their closing net asset value each business day. Short-term securities with remaining maturities of sixty days or less for which quotations are not readily available are valued at amortized cost, which approximates value.
When current market prices or quotations are not readily available or reliable, valuations may be determined in good faith in accordance with procedures adopted by the Board of Trustees. Factors used in determining value may include significant market or security specific events, changes in interest rates and credit quality, and developments in foreign markets which are monitored by evaluating the performance of ADRs, futures contracts and exchange-traded funds. The frequency with which these procedures are used cannot be predicted and may be utilized to a significant extent. The value of securities used for net asset value (NAV) calculation under these procedures may differ from published prices for the same securities.
Foreign Currency. The Fund uses foreign currency contracts to facilitate transactions in foreign-denominated securities. Losses from these transactions may arise from changes in the value of the foreign currency or if the counterparties do not perform under the contracts' terms.
Foreign-denominated assets, including investment securities, and liabilities are translated into U.S. dollars at the exchange rate at period end. Purchases and sales of investment securities, income and dividends received and expenses denominated in foreign currencies are translated into U.S. dollars at the exchange rate in effect on the transaction date.
The effects of exchange rate fluctuations on investments are included with the net realized and unrealized gain (loss) on investment securities. Other foreign currency transactions resulting in realized and unrealized gain (loss) are disclosed separately.
Annual Report
Notes to Financial Statements - continued
(Amounts in thousands except ratios)
3. Significant Accounting Policies - continued
Investment Transactions and Income. For financial reporting purposes, the Fund's investment holdings and NAV include trades executed through the end of the last business day of the period. The NAV per share for processing shareholder transactions is calculated as of the close of business of the New York Stock Exchange (NYSE), normally 4:00 p.m. Eastern time and includes trades executed through the end of the prior business day. Gains and losses on securities sold are determined on the basis of identified cost. Dividend income is recorded on the ex-dividend date, except for certain dividends from foreign securities where the ex-dividend date may have passed, which are recorded as soon as the Fund is informed of the ex-dividend date. Non-cash dividends included in dividend income, if any, are recorded at the fair market value of the securities received. Distributions received on securities that represent a return of capital or capital gain are recorded as a reduction of cost of investments and/or as a realized gain. The Fund estimates the components of distributions received that may be considered return of capital distributions or capital gain distributions. Interest income and distributions from the Fidelity Central Funds are accrued as earned. Interest income includes coupon interest and amortization of premium and accretion of discount on debt securities. Investment income is recorded net of foreign taxes withheld where recovery of such taxes is uncertain.
Expenses. Most expenses of the trust can be directly attributed to a fund. Expenses which cannot be directly attributed are apportioned among each Fund in the trust. Expense estimates are accrued in the period to which they relate and adjustments are made when actual amounts are known.
Income Tax Information and Distributions to Shareholders. Each year, the Fund intends to qualify as a regulated investment company by distributing substantially all of its taxable income and realized gains under Subchapter M of the Internal Revenue Code and filing its U.S. federal tax return. As a result, no provision for income taxes is required. The Fund is subject to the provisions of FASB Interpretation No. 48, Accounting for Uncertainties in Income Taxes (FIN 48). FIN 48 sets forth a minimum threshold for financial statement recognition of the benefit of a tax position taken or expected to be taken in a tax return. The implementation of FIN 48 did not result in any unrecognized tax benefits in the accompanying financial statements. Each of the Fund's federal tax returns for the prior three fiscal years remains subject to examination by the Internal Revenue Service (IRS). Foreign taxes are provided for based on the Fund's understanding of the tax rules and rates that exist in the foreign markets in which it invests.
Distributions are recorded on the ex-dividend date. Income dividends and capital gain distributions are declared separately for each class. Income and capital gain distributions are determined in accordance with income tax regulations, which may differ from generally accepted accounting principles.
Annual Report
3. Significant Accounting Policies - continued
Income Tax Information and Distributions to Shareholders - continued
Capital accounts within the financial statements are adjusted for permanent book-tax differences. These adjustments have no impact on net assets or the results of operations. Temporary book-tax differences will reverse in a subsequent period.
Book-tax differences are primarily due to, foreign currency transactions, certain foreign taxes, passive foreign investments companies (PFIC), capital loss carryforwards and losses deferred due to wash sales.
The tax-basis components of distributable earnings and the federal tax cost as of period end were as follows:
Unrealized appreciation | $ 29,805 |
Unrealized depreciation | (332,161) |
Net unrealized appreciation (depreciation) | (302,356) |
Capital loss carryforward | (28,799) |
| |
Cost for federal income tax purposes | $ 907,779 |
The tax character of distributions paid was as follows:
| October 31, 2008 | October 31, 2007 |
Ordinary Income | $ 73,752 | $ 43,869 |
Long-term Capital Gains | 220,589 | 310,922 |
Total | $ 294,341 | $ 354,791 |
Short-Term Trading (Redemption) Fees. Shares held in the Fund less than 90 days are subject to a redemption fee equal to 2.00% of the proceeds of the redeemed shares. All redemption fees, including any estimated redemption fees paid by FMR, are retained by the Fund and accounted for as an addition to paid in capital.
New Accounting Pronouncement. In September 2006, Statement of Financial Accounting Standards No. 157, Fair Value Measurements (SFAS 157), was issued and is effective for fiscal years beginning after November 15, 2007. SFAS 157 defines fair value, establishes a framework for measuring fair value and results in expanded disclosures about fair value measurements.
4. Operating Policies.
Repurchase Agreements. FMR has received an Exemptive Order from the Securities and Exchange Commission (the SEC) which permits the Fund and other affiliated entities of FMR to transfer uninvested cash balances into joint trading accounts which are then invested in repurchase agreements. The Fund may also invest directly with institutions in repurchase agreements. Repurchase agreements are collateralized by
Annual Report
Notes to Financial Statements - continued
(Amounts in thousands except ratios)
4. Operating Policies - continued
Repurchase Agreements - continued
government or non-government securities. Upon settlement date, collateral is held in segregated accounts with custodian banks and may be obtained in the event of a default of the counterparty. The Fund monitors, on a daily basis, the value of the collateral to ensure it is at least equal to the principal amount of the repurchase agreement (including accrued interest). In the event of a default by the counterparty, realization of the collateral proceeds could be delayed, during which time the value of the collateral may decline.
Restricted Securities. The Fund may invest in securities that are subject to legal or contractual restrictions on resale. These securities generally may be resold in transactions exempt from registration or to the public if the securities are registered. Disposal of these securities may involve time-consuming negotiations and expense, and prompt sale at an acceptable price may be difficult. Information regarding restricted securities is included at the end of the Fund's Schedule of Investments.
5. Purchases and Sales of Investments.
Purchases and sales of securities, other short-term securities, aggregated $1,347,283 and $1,736,784, respectively.
6. Fees and Other Transactions with Affiliates.
Management Fee. FMR and its affiliates provide the Fund with investment management related services for which the Fund pays a monthly management fee. The management fee is the sum of an individual fund fee rate that is based on an annual rate of .60% of the Fund's average net assets and a group fee rate that averaged .26% during the period. The group fee rate is based upon the average net assets of all the mutual funds advised by FMR. The group fee rate decreases as assets under management increase and increases as assets under management decrease. In addition, the management fee is subject to a performance adjustment (up to a maximum of ± .20% of the Fund's average net assets over a 36 month performance period). The upward or downward adjustment to the management fee is based on the relative investment performance of the retail class of the Fund, International Small Cap as compared to an appropriate benchmark index. For the period, the total annual management fee rate, including the performance adjustment, was 1.14% of the Fund's average net assets.
Distribution and Service Plan. In accordance with Rule 12b-1 of the 1940 Act, the Fund has adopted separate Distribution and Service Plans for each class of shares. Certain classes pay Fidelity Distributors Corporation (FDC), an affiliate of FMR, separate Distribution and Service Fees, each of which is based on an annual percentage of each class' average net assets. In addition, FDC may pay financial intermediaries for selling shares of the Fund and providing shareholder support services.
Annual Report
6. Fees and Other Transactions with Affiliates - continued
Distribution and Service Plan - continued
For the period, the Distribution and Service Fee rates and the total amounts paid to and retained by FDC were as follows:
| Distribution
Fee | Service
Fee | Paid to
FDC | Retained
by FDC |
Class A | 0% | .25% | $ 67 | $ 3 |
Class T | .25% | .25% | 143 | 1 |
Class B | .75% | .25% | 71 | 54 |
Class C | .75% | .25% | 135 | 4 |
| | | $ 416 | $ 62 |
Sales Load. FDC receives a front-end sales charge of up to 5.75% for selling Class A shares, and 3.50% for selling Class T shares, some of which is paid to financial intermediaries for selling shares of the Fund. FDC receives the proceeds of contingent deferred sales charges levied on Class A, Class T, Class B, and Class C redemptions. These charges depend on the holding period. The deferred sales charges range from 5% to 1% for Class B, 1% for Class C, 1.00% to .50% for certain purchases of Class A shares and .25% for certain purchases of Class T shares.
For the period, sales charge amounts retained by FDC were as follows:
| Retained
by FDC |
Class A | $ 2 |
Class T | 2 |
Class B* | 12 |
Class C* | 2 |
| $ 18 |
* When Class B and Class C shares are initially sold, FDC pays commissions from its own resources to financial intermediaries through which the sales are made.
Transfer Agent Fees. Fidelity Investments Institutional Operations Company, Inc. (FIIOC), an affiliate of FMR, is the transfer, dividend disbursing and shareholder servicing agent for each class of the Fund. FIIOC receives account fees and asset-based fees that vary according to the account size and type of account of the shareholders of the respective classes of the Fund. FIIOC pays for typesetting, printing and mailing of shareholder reports, except proxy statements. Prior to January 1, 2008, Fidelity Service Company, Inc. (FSC), also an affiliate of FMR, was the transfer agent for International Small Cap shares.
Annual Report
Notes to Financial Statements - continued
(Amounts in thousands except ratios)
6. Fees and Other Transactions with Affiliates - continued
Transfer Agent Fees - continued
For the period, each class paid the following transfer agent fees:
| Amount | % of
Average
Net Assets |
Class A | $ 82 | .31 |
Class T | 88 | .31 |
Class B | 22 | .31 |
Class C | 41 | .30 |
International Small Cap | 2,636 | .23 |
Institutional Class | 11 | .22 |
| $ 2,880 | |
Accounting and Security Lending Fees. FSC, an affiliate of FMR, maintains the Fund's accounting records. The accounting fee is based on the level of average net assets for the month. Under a separate contract, FSC administers the security lending program. The security lending fee is based on the number and duration of lending transactions.
Brokerage Commissions. The Fund placed a portion of its portfolio transactions with brokerage firms which are affiliates of the investment adviser. The commissions paid to these affiliated firms were $1 for the period.
7. Committed Line of Credit.
The Fund participates with other funds managed by FMR in a $4.2 billion credit facility (the "line of credit") to be utilized for temporary or emergency purposes to fund shareholder redemptions or for other short-term liquidity purposes. The Fund has agreed to pay commitment fees on its pro rata portion of the line of credit, which amounted to $3 and is reflected in Miscellaneous Expense on the Statement of Operations. During the period, there were no borrowings on this line of credit.
8. Security Lending.
The Fund lends portfolio securities from time to time in order to earn additional income. On the settlement date of the loan, the Fund receives collateral (in the form of U.S. Treasury obligations, letters of credit and/or cash) against the loaned securities and maintains collateral in an amount not less than 100% of the market value of the loaned securities during the period of the loan. The market value of the loaned securities is determined at the close of business of the Fund and any additional required collateral is delivered to the Fund on the next business day. If the borrower defaults on its obligation to return the securities loaned because of insolvency or other reasons, a fund could
Annual Report
8. Security Lending - continued
experience delays and costs in recovering the securities loaned or in gaining access to the collateral. Any cash collateral received is invested in the Fidelity Securities Lending Cash Central Fund. The value of loaned securities and cash collateral at period end are disclosed on the Fund's Statement of Assets and Liabilities. Security lending income represents the income earned on investing cash collateral, less fees and expenses associated with the loan, plus any premium payments that may be received on the loan of certain types of securities. Security lending income is presented in the Statement of Operations as a component of income from Fidelity Central Funds.
9. Expense Reductions.
FMR voluntarily agreed to reimburse each class to the extent annual operating expenses exceeded certain levels of average net assets as noted in the table below. Some expenses, for example interest expense, including commitment fees, are excluded from this reimbursement.
The following classes were in reimbursement during the period:
| Expense
Limitations | Reimbursement
from adviser |
Class A | 1.65% | $ 45 |
Class T | 1.90% | 48 |
Class B | 2.40% | 13 |
Class C | 2.40% | 22 |
Institutional Class | 1.40% | 4 |
| | $ 132 |
Many of the brokers with whom FMR places trades on behalf of the Fund provided services to the Fund in addition to trade execution. These services included payments of certain expenses on behalf of the Fund totaling $591 for the period. In addition, through arrangements with the Fund's custodian and each class' transfer agent, credits realized as a result of uninvested cash balances were used to reduce the Fund's expenses. During the period, credits reduced each class' transfer agent expense as noted in the table below.
| Transfer Agent
expense reduction |
International Small Cap | $ 13 |
Annual Report
Notes to Financial Statements - continued
(Amounts in thousands except ratios)
10. Other.
The Fund's organizational documents provide former and current trustees and officers with a limited indemnification against liabilities arising in connection with the performance of their duties to the Fund. In the normal course of business, the Fund may also enter into contracts that provide general indemnifications. The Fund's maximum exposure under these arrangements is unknown as this would be dependent on future claims that may be made against the Fund. The risk of material loss from such claims is considered remote.
In December 2006, the Independent Trustees, with the assistance of independent counsel, completed an investigation regarding gifts, gratuities and business entertainment provided by certain brokers to certain individuals who were employed on FMR's domestic equity trading desk during the period 2002 to 2004. The Independent Trustees and FMR agreed that, despite the absence of proof that the Fidelity mutual funds experienced diminished execution quality as a result of the improper receipt of gifts and business entertainment, the conduct at issue was serious and was worthy of redress. Accordingly, the Independent Trustees requested, and FMR agreed to make, a payment of $42 million plus accrued interest, which equaled approximately $7.3 million, to certain Fidelity mutual funds.
In March 2008, the Trustees approved a method for allocating this payment among the funds and, in total, FMR paid the fund $1, which is recorded in the accompanying Statement of Operations.
In a related administrative order dated March 5, 2008, the U.S. Securities and Exchange Commission ("SEC") announced a settlement with FMR and FMR Co., Inc. (an affiliate of FMR) involving the SEC's regulatory rules for investment advisers and the improper receipt of gifts, gratuities and business entertainment. Without admitting or denying the SEC's findings, FMR agreed to pay an $8 million civil penalty to the United States Treasury.
11. Distributions to Shareholders.
Distributions to shareholders of each class were as follows:
Years ended October 31, | 2008 | 2007 |
From net investment income | | |
Class A | $ 32 | $ - |
International Small Cap | 6,232 | 3,765 |
Institutional Class | 29 | 22 |
Total | $ 6,293 | $ 3,787 |
Annual Report
11. Distributions to Shareholders - continued
Distributions to shareholders of each class were as follows:
Years ended October 31, | 2008 | 2007 |
From net realized gain | | |
Class A | $ 6,370 | $ 6,864 |
Class T | 6,691 | 7,706 |
Class B | 1,698 | 2,092 |
Class C | 3,224 | 3,882 |
International Small Cap | 268,817 | 328,782 |
Institutional Class | 1,248 | 1,678 |
Total | $ 288,048 | $ 351,004 |
12. Share Transactions.
Transactions for each class of shares were as follows:
| Shares | Dollars |
Years ended October 31, | 2008 | 2007 | 2008 | 2007 |
Class A | | | | |
Shares sold | 288 | 268 | $ 6,010 | $ 7,316 |
Reinvestment of distributions | 250 | 252 | 5,922 | 6,096 |
Shares redeemed | (639) | (556) | (12,839) | (14,980) |
Net increase (decrease) | (101) | (36) | $ (907) | $ (1,568) |
Class T | | | | |
Shares sold | 197 | 226 | $ 4,234 | $ 6,120 |
Reinvestment of distributions | 267 | 297 | 6,298 | 7,166 |
Shares redeemed | (643) | (671) | (12,849) | (17,855) |
Net increase (decrease) | (179) | (148) | $ (2,317) | $ (4,569) |
Class B | | | | |
Shares sold | 15 | 19 | $ 298 | $ 519 |
Reinvestment of distributions | 66 | 79 | 1,550 | 1,892 |
Shares redeemed | (155) | (149) | (3,078) | (3,957) |
Net increase (decrease) | (74) | (51) | $ (1,230) | $ (1,546) |
Class C | | | | |
Shares sold | 43 | 56 | $ 916 | $ 1,462 |
Reinvestment of distributions | 110 | 124 | 2,587 | 2,967 |
Shares redeemed | (325) | (277) | (6,282) | (7,298) |
Net increase (decrease) | (172) | (97) | $ (2,779) | $ (2,869) |
Annual Report
Notes to Financial Statements - continued
(Amounts in thousands except ratios)
12. Share Transactions - continued
Transactions for each class of shares were as follows:
| Shares | Dollars |
Years ended October 31, | 2008 | 2007 | 2008 | 2007 |
International Small Cap | | | | |
Shares sold | 6,448 | 7,028 | $ 135,999 | $ 194,115 |
Reinvestment of distributions | 10,463 | 12,767 | 249,850 | 311,000 |
Shares redeemed | (25,232) | (29,445) | (501,269) | (791,655) |
Net increase (decrease) | (8,321) | (9,650) | $ (115,420) | $ (286,540) |
Institutional Class | | | | |
Shares sold | 51 | 47 | $ 1,128 | $ 1,226 |
Reinvestment of distributions | 31 | 39 | 750 | 938 |
Shares redeemed | (145) | (150) | (2,999) | (3,984) |
Net increase (decrease) | (63) | (64) | $ (1,121) | $ (1,820) |
Annual Report
To the Trustees of Fidelity Investment Trust and Shareholders of Fidelity International Small Cap Fund:
We have audited the accompanying statement of assets and liabilities of Fidelity International Small Cap Fund (the Fund), a fund of Fidelity Investment Trust, including the schedule of investments, as of October 31, 2008, and the related statement of operations for the year then ended, the statement of changes in net assets for each of the two years in the period then ended, and the financial highlights for each of the five years in the period then ended. These financial statements and financial highlights are the responsibility of the Fund's management. Our responsibility is to express an opinion on these financial statements and financial highlights based on our audits.
We conducted our audits in accordance with standards of the Public Company Accounting Oversight Board (United States). Those standards require that we plan and perform the audit to obtain reasonable assurance about whether the financial statements and financial highlights are free of material misstatement. The Fund is not required to have, nor were we engaged to perform, an audit of its internal control over financial reporting. Our audits included consideration of internal control over financial reporting as a basis for designing audit procedures that are appropriate in the circumstances, but not for the purpose of expressing an opinion on the effectiveness of the Fund's internal control over financial reporting. Accordingly, we express no such opinion. An audit also includes examining, on a test basis, evidence supporting the amounts and disclosures in the financial statements, assessing the accounting principles used and significant estimates made by management, as well as evaluating the overall financial statement presentation. Our procedures included confirmation of securities owned as of October 31, 2008, by correspondence with the custodians and brokers; where replies were not received from brokers, we performed other auditing procedures. We believe that our audits provide a reasonable basis for our opinion.
In our opinion, the financial statements and financial highlights referred to above present fairly, in all material respects, the financial position of Fidelity International Small Cap Fund as of October 31, 2008, the results of its operations for the year then ended, the changes in its net assets for each of the two years in the period then ended, and its financial highlights for each of the five years in the period then ended, in conformity with accounting principles generally accepted in the United States of America.
/s/ Deloitte & Touche LLP
DELOITTE & TOUCHE LLP
Boston, Massachusetts
December 23, 2008
Annual Report
The Trustees, Member of the Advisory Board, and executive officers of the trust and fund, as applicable, are listed below. The Board of Trustees governs the fund and is responsible for protecting the interests of shareholders. The Trustees are experienced executives who meet periodically throughout the year to oversee the fund's activities, review contractual arrangements with companies that provide services to the fund, and review the fund's performance. Except for Edward C. Johnson and James C. Curvey, each of the Trustees oversees 220 funds advised by FMR or an affiliate. Messrs. Johnson and Curvey oversee 379 funds advised by FMR or an affiliate.
The Trustees hold office without limit in time except that (a) any Trustee may resign; (b) any Trustee may be removed by written instrument, signed by at least two-thirds of the number of Trustees prior to such removal; (c) any Trustee who requests to be retired or who has become incapacitated by illness or injury may be retired by written instrument signed by a majority of the other Trustees; and (d) any Trustee may be removed at any special meeting of shareholders by a two-thirds vote of the outstanding voting securities of the trust. Each Trustee who is not an interested person (as defined in the 1940 Act) (Independent Trustee), shall retire not later than the last day of the calendar year in which his or her 72nd birthday occurs. The Independent Trustees may waive this mandatory retirement age policy with respect to individual Trustees. The executive officers and Advisory Board Member hold office without limit in time, except that any officer and Advisory Board Member may resign or may be removed by a vote of a majority of the Trustees at any regular meeting or any special meeting of the Trustees. Except as indicated, each individual has held the office shown or other offices in the same company for the past five years.
The fund's Statement of Additional Information (SAI) includes more information about the Trustees. To request a free copy, call Fidelity at 1-800-544-8544.
Interested Trustees*:
Correspondence intended for each Trustee who is an interested person may be sent to Fidelity Investments, 82 Devonshire Street, Boston, Massachusetts 02109.
Name, Age; Principal Occupation |
Edward C. Johnson 3d (78) |
| Year of Election or Appointment: 1984 Mr. Johnson is Chairman of the Board of Trustees. Mr. Johnson serves as Chief Executive Officer, Chairman, and a Director of FMR LLC; Chairman and a Director of FMR; Chairman and a Director of Fidelity Research & Analysis Company (FRAC); Chairman and a Director of Fidelity Investments Money Management, Inc.; and Chairman and a Director of FMR Co., Inc. In addition, Mr. Johnson serves as Chairman and Director of FIL Limited. Previously, Mr. Johnson served as President of FMR LLC (2006-2007). |
James C. Curvey (73) |
| Year of Election or Appointment: 2007 Mr. Curvey also serves as Trustee (2007-present) of other investment companies advised by FMR. Mr. Curvey is a Director of FMR and FMR Co., Inc. (2007-present). Mr. Curvey is also Vice Chairman (2006-
present) and Director of FMR LLC. In addition, Mr. Curvey serves as an Overseer for the Boston Symphony Orchestra and a member of the Trustees of Villanova University. |
* Trustees have been determined to be "Interested Trustees" by virtue of, among other things, their affiliation with the trust or various entities under common control with FMR. FMR Corp. merged with and into FMR LLC on October 1, 2007. Any references to FMR LLC for prior periods are deemed to be references to the prior entity.
Independent Trustees:
Correspondence intended for each Independent Trustee (that is, the Trustees other than the Interested Trustees) may be sent to Fidelity Investments, P.O. Box 55235, Boston, Massachusetts 02205-5235.
Name, Age; Principal Occupation |
Dennis J. Dirks (60) |
| Year of Election or Appointment: 2005 Prior to his retirement in May 2003, Mr. Dirks was Chief Operating Officer and a member of the Board of The Depository Trust & Clearing Corporation (DTCC) (1999-2003). He also served as President, Chief Operating Officer, and Board member of The Depository Trust Company (DTC) (1999-2003) and President and Board member of the National Securities Clearing Corporation (NSCC) (1999-2003). In addition, Mr. Dirks served as a Trustee and a member of the Finance Committee of Manhattan College (2005-2008), and as Chief Executive Officer and Board member of the Government Securities Clearing Corporation (2001-2003) and Chief Executive Officer and Board member of the Mortgage-Backed Securities Clearing Corporation (2001-2003). Mr. Dirks also serves as a Trustee and a member of the Finance Committee of AHRC of Nassau County (2006-present). |
Alan J. Lacy (55) |
| Year of Election or Appointment: 2008 Mr. Lacy serves as Senior Adviser (2007-present) of Oak Hill Capital Partners, L.P. (a private equity firm). Mr. Lacy also served as Chief Executive Officer (2000-2005) and Vice Chairman (2005-2006) of Sears Holdings Corporation and Sears, Roebuck and Co. (retail). In addition, Mr. Lacy serves as a member of the Board of Directors of The Western Union Company (global money transfer, 2006-present) and Bristol-Myers Squibb (global pharmaceuticals, 2007-present). Mr. Lacy is a Trustee of the National Parks Conservation Association and The Field Museum of Natural History. |
Ned C. Lautenbach (64) |
| Year of Election or Appointment: 2000 Mr. Lautenbach is Chairman of the Independent Trustees (2006-present). Mr. Lautenbach is an Advisory Partner of Clayton, Dubilier & Rice, Inc. (private equity investment firm). Previously, Mr. Lautenbach was with the International Business Machines Corporation (IBM) from 1968 until his retirement in 1998. Mr. Lautenbach serves as a Director of Eaton Corporation (diversified industrial) as well as the Philharmonic Center for the Arts in Naples, Florida. He also is a member of the Board of Trustees of Fairfield University (2005-present), as well as a member of the Council on Foreign Relations. Previously, Mr. Lautenbach served as a Director of Sony Corporation (2006-2007). |
Joseph Mauriello (64) |
| Year of Election or Appointment: 2008 Prior to his retirement in January 2006, Mr. Mauriello served in numerous senior management positions including Deputy Chairman and Chief Operating Officer (2004-2005), and Vice Chairman of Financial Services (2002-2004) of KPMG LLP US (professional services firm, 1965-2005). Mr. Mauriello currently serves as a member of the Board of Directors of XL Capital Ltd. (global insurance and re-insurance company, 2006-
present) and of Arcadia Resources Inc. (health care services and products, 2007-present). He also served as a Director of the Hamilton Funds of the Bank of New York (2006-2007). |
Cornelia M. Small (64) |
| Year of Election or Appointment: 2005 Ms. Small is a member of the Investment Committee, and Chair (2008-present) and a member of the Board of Trustees of Smith College. Ms. Small also serves on the Investment Committee of the Berkshire Taconic Community Foundation (2008-present). Previously, Ms. Small served as Chairperson of the Investment Committee (2002-2008) of Smith College and as Co-Chair (2000-2003) of the Annual Fund for the Fletcher School of Law and Diplomacy. In addition, she served as Chief Investment Officer, Director of Global Equity Investments, and a member of the Board of Directors of Scudder, Stevens & Clark and Scudder Kemper Investments. |
William S. Stavropoulos (69) |
| Year of Election or Appointment: 2001 Mr. Stavropoulos is Chairman Emeritus of the Board of Directors of The Dow Chemical Company, where he previously served in numerous senior management positions, including President (1993-2000; 2002-
2003), CEO (1995-2000; 2002-2004), Chairman of the Executive Committee (2000-2006), and as a member of the Board of Directors (1990-2006). Currently, he is a Director of Teradata Corporation (data warehousing and technology solutions, 2008-present), Chemical Financial Corporation, Maersk Inc. (industrial conglomerate), Tyco International, Inc. (multinational manufacturing and services, 2007-present), and a member of the Advisory Board for Metalmark Capital (private equity investment firm, 2005-present). He is a special advisor to Clayton, Dubilier & Rice, Inc. (private equity investment). In addition, Mr. Stavropoulos is a member of the University of Notre Dame Advisory Council for the College of Science. |
David M. Thomas (59) |
| Year of Election or Appointment: 2008 Previously, Mr. Thomas served as Executive Chairman (2005-2006) and Chairman and Chief Executive Officer (2000-2005) of IMS Health, Inc. (pharmaceutical and healthcare information solutions). In addition, Mr. Thomas serves as a member of the Board of Directors of Fortune Brands, Inc. (consumer products holding company), and Interpublic Group of Companies, Inc. (marketing communication, 2004-present). |
Michael E. Wiley (58) |
| Year of Election or Appointment: 2008 Mr. Wiley also serves as a member of the Board of Trustees of the University of Tulsa (2000-2006; 2007-present). He serves as a Director of Tesoro Corporation (independent oil refiner and marketer, 2005-present), and a Director of Bill Barrett Corporation (exploration and production company, 2005-present). In addition, he also serves as a Director of Post Oak Bank (privately-held bank, 2004-present). Previously, Mr. Wiley served as a Sr. Energy Advisor of Katzenbach Partners, LLC (consulting firm, 2006-2007), as an Advisory Director of Riverstone Holdings (private investment firm), Chairman, President, and CEO of Baker Hughes, Inc. (oilfield services company, 2000-2004), and as Director of Spinnaker Exploration Company (exploration and production company, 2001-2005). |
Advisory Board Member and Executive Officers**:
Correspondence intended for each executive officer and Mr. Lynch may be sent to Fidelity Investments, 82 Devonshire Street, Boston, Massachusetts 02109.
Name, Age; Principal Occupation |
Peter S. Lynch (64) |
| Year of Election or Appointment: 2003 Member of the Advisory Board of Fidelity's Equity and High Income Funds. Mr. Lynch is Vice Chairman and a Director of FMR, and Vice Chairman (2001-present) and a Director of FMR Co., Inc. Previously, Mr. Lynch served as a Trustee of the Fidelity funds (1990-2003). In addition, he serves as a Trustee of Boston College and as the Chairman of the Inner-City Scholarship Fund. Previously, Mr. Lynch served on the Special Olympics International Board of Directors (1997-2006). |
Kenneth B. Robins (39) |
| Year of Election or Appointment: 2008 President and Treasurer of Fidelity's Equity and High Income Funds. Mr. Robins is an employee of Fidelity Investments (2004-present). Before joining Fidelity Investments, Mr. Robins worked at KPMG LLP, where he was a partner in KPMG's department of professional practice (2002-2004). |
Walter C. Donovan (46) |
| Year of Election or Appointment: 2007 Vice President of Fidelity's Equity Funds. Mr. Donovan also serves as President of FMR and FMR Co., Inc., and Executive Vice President of Fidelity Investments Money Management, Inc. (2007-present). Previously, Mr. Donovan served as Executive Vice President of FMR and FMR Co., Inc. (2005-2007) and Senior Vice President of FMR (2003-2005) and FMR Co., Inc. (2004-2005). |
Eric M. Wetlaufer (46) |
| Year of Election or Appointment: 2006 Vice President of Fidelity's International Equity Funds. Mr. Wetlaufer also serves as Group Chief Investment Officer of FMR. Mr. Wetlaufer is Chairman, Chief Executive Officer, and President of Fidelity Management & Research (Hong Kong) Limited (2008-present); Chairman, Chief Executive Officer, President, and a Director of Fidelity Management & Research (Japan) Inc. (2008-present); Chairman and Chief Executive Officer (2007-present) and President and a Director (2006-present) of Fidelity Management & Research (U.K.) Inc. and President and a Director of Fidelity Research & Analysis Company (2006-present). Before joining Fidelity Investments in 2005, Mr. Wetlaufer was a partner in Oxhead Capital Management (2004-2005) and a Chief Investment Officer of Putnam Investments (1997-2003). |
Scott C. Goebel (40) |
| Year of Election or Appointment: 2008 Secretary and Chief Legal Officer (CLO) of the Fidelity funds. Mr. Goebel also serves as General Counsel, Secretary, and Senior Vice President of FMR (2008-present); Deputy General Counsel of FMR LLC; Chief Legal Secretary of Fidelity Management & Research (Hong Kong) Limited (2008-present) and Assistant Secretary of Fidelity Management & Research (Japan) Inc. (2008-present). Previously, Mr. Goebel served as Assistant Secretary of the Funds (2007-2008) and as Vice President and Secretary of Fidelity Distributors Corporation (FDC) (2005-2007). |
John B. McGinty, Jr. (46) |
| Year of Election or Appointment: 2008 Assistant Secretary of Fidelity's Equity and High Income Funds. Mr. McGinty is an employee of Fidelity Investments (2004-present). Mr. McGinty also serves as Senior Vice President, Secretary, and Chief Legal Officer of FDC (2007-present). Before joining Fidelity Investments, Mr. McGinty practiced law at Ropes & Gray, LLP. |
Holly C. Laurent (54) |
| Year of Election or Appointment: 2008 Anti-Money Laundering (AML) Officer of the Fidelity funds. Ms. Laurent is an employee of Fidelity Investments. Previously, Ms. Laurent was Senior Vice President and Head of Legal for Fidelity Business Services India Pvt. Ltd. (2006-2008), Senior Vice President, Deputy General Counsel and Group Head for FMR LLC (2005-2006). |
Christine Reynolds (50) |
| Year of Election or Appointment: 2008 Chief Financial Officer of the Fidelity funds. Ms. Reynolds became President of Fidelity Pricing and Cash Management Services (FPCMS) in August 2008. She served as Chief Operating Officer of FPCMS from 2007 through July 2008. Previously, Ms. Reynolds served as President, Treasurer, and Anti-Money Laundering Officer of the Fidelity funds (2004-2007). Before joining Fidelity Investments, Ms. Reynolds worked at PricewaterhouseCoopers LLP (PwC) (1980-2002), where she was an audit partner with PwC's investment management practice. |
Kenneth A. Rathgeber (61) |
| Year of Election or Appointment: 2004 Chief Compliance Officer of Fidelity's Equity and High Income Funds. Mr. Rathgeber is Chief Compliance Officer of Fidelity Management & Research (Hong Kong) Limited (2008-present), Fidelity Management & Research (Japan) Inc. (2008-present), FMR (2005-present), FMR Co., Inc. (2005-present), Fidelity Management & Research (U.K.) Inc. (2005-
present), Fidelity Research & Analysis Company (2005-present), Fidelity Investments Money Management, Inc. (2005-present), and Strategic Advisers, Inc. (2005-present). |
Bryan A. Mehrmann (47) |
| Year of Election or Appointment: 2005 Deputy Treasurer of the Fidelity funds. Mr. Mehrmann is an employee of Fidelity Investments. Previously, Mr. Mehrmann served as Vice President of Fidelity Investments Institutional Services Group (FIIS)/Fidelity Investments Institutional Operations Corporation, Inc. (FIIOC) Client Services (1998-2004). |
Adrien E. Deberghes (41) |
| Year of Election or Appointment: 2008 Deputy Treasurer of Fidelity's Equity and High Income Funds. Mr. Deberghes is an employee of Fidelity Investments (2008-present). Previously, Mr. Deberghes served as Senior Vice President of Mutual Fund Administration at State Street Corporation (2007-2008), Senior Director of Mutual Fund Administration at Investors Bank & Trust (2005-2007), and Director of Finance for Dunkin' Brands (2000-2005). |
Robert G. Byrnes (41) |
| Year of Election or Appointment: 2005 Assistant Treasurer of the Fidelity funds. Mr. Byrnes is an employee of Fidelity Investments (2005-present). Previously, Mr. Byrnes served as Vice President of Fidelity Pricing and Cash Management Services (FPCMS) (2003-2005). Before joining Fidelity Investments, Mr. Byrnes worked at Deutsche Asset Management where he served as Vice President of the Investment Operations Group (2000-2003). |
Peter L. Lydecker (54) |
| Year of Election or Appointment: 2004 Assistant Treasurer of the Fidelity funds. Mr. Lydecker is an employee of Fidelity Investments. |
Paul M. Murphy (61) |
| Year of Election or Appointment: 2007 Assistant Treasurer of the Fidelity funds. Mr. Murphy is an employee of Fidelity Investments (2007-present). Previously, Mr. Murphy served as Chief Financial Officer of the Fidelity Funds (2005-2006), Vice President and Associate General Counsel of FMR (2007), and Senior Vice President of Fidelity Pricing and Cash Management Services (FPCMS) (1994-2007). |
Gary W. Ryan (50) |
| Year of Election or Appointment: 2005 Assistant Treasurer of the Fidelity funds. Mr. Ryan is an employee of Fidelity Investments. Previously, Mr. Ryan served as Vice President of Fund Reporting in Fidelity Pricing and Cash Management Services (FPCMS) (1999-2005). |
** FMR Corp. merged with and into FMR LLC on October 1, 2007. Any references to FMR LLC for prior periods are deemed to be references to the prior entity.
Annual Report
The fund designates 21% of the dividends distributed during the fiscal year as amounts which may be taken into account as a dividend for the purposes of the maximum rate under section 1(h)(11) of the Internal Revenue Code.
The amounts per share which represent income derived from sources within, and taxes paid to, foreign countries or possessions of the United States are $0.326 and $0.0222 for the dividend paid December 10, 2007.
The fund will notify shareholders in January 2009 of amounts for use in preparing 2008 income tax returns.
Annual Report
A special meeting of the fund's shareholders was held on December 13, 2007. The results of votes taken among shareholders on the proposals before them are reported below. Each vote reported represents one dollar of net asset value held on the record date for the meeting.
PROPOSAL 1 |
To amend the Declaration of Trust to reduce the required quorum for shareholder meetings.A |
| # of
Votes | % of
Votes |
Affirmative | 45,014,793,255.82 | 80.372 |
Against | 6,871,112,667.08 | 12.268 |
Abstain | 2,163,456,438.02 | 3.863 |
Broker
Non-Votes | 1,958,633,563.89 | 3.497 |
TOTAL | 56,007,995,924.81 | 100.000 |
PROPOSAL 2 |
To elect the nominees specified below as Trustees.A |
| # of
Votes | % of
Votes |
James C. Curvey |
Affirmative | 53,384,952,361.03 | 95.317 |
Withheld | 2,623,043,563.78 | 4.683 |
TOTAL | 56,007,995,924.81 | 100.000 |
Dennis J. Dirks |
Affirmative | 53,595,104,608.67 | 95.692 |
Withheld | 2,412,891,316.14 | 4.308 |
TOTAL | 56,007,995,924.81 | 100.000 |
Albert R. Gamper, Jr. |
Affirmative | 53,570,235,221.69 | 95.647 |
Withheld | 2,437,760,703.12 | 4.353 |
TOTAL | 56,007,995,924.81 | 100.000 |
George H. Heilmeier |
Affirmative | 53,166,350,588.50 | 94.926 |
Withheld | 2,841,645,336.31 | 5.074 |
TOTAL | 56,007,995,924.81 | 100.000 |
| # of
Votes | % of
Votes |
Edward C. Johnson 3d |
Affirmative | 53,230,508,654.93 | 95.041 |
Withheld | 2,777,487,269.88 | 4.959 |
TOTAL | 56,007,995,924.81 | 100.000 |
James H. Keyes |
Affirmative | 53,549,161,456.52 | 95.610 |
Withheld | 2,458,834,468.29 | 4.390 |
TOTAL | 56,007,995,924.81 | 100.000 |
Marie L. Knowles |
Affirmative | 53,543,925,066.86 | 95.601 |
Withheld | 2,464,070,857.95 | 4.399 |
TOTAL | 56,007,995,924.81 | 100.000 |
Ned C. Lautenbach |
Affirmative | 53,547,116,322.50 | 95.606 |
Withheld | 2,460,879,602.31 | 4.394 |
TOTAL | 56,007,995,924.81 | 100.000 |
Cornelia M. Small |
Affirmative | 53,564,793,514.25 | 95.638 |
Withheld | 2,443,202,410.56 | 4.362 |
TOTAL | 56,007,995,924.81 | 100.000 |
William S. Stavropoulos |
Affirmative | 53,426,544,502.76 | 95.391 |
Withheld | 2,581,451,422.05 | 4.609 |
TOTAL | 56,007,995,924.81 | 100.000 |
Kenneth L. Wolfe |
Affirmative | 53,229,881,790.63 | 95.040 |
Withheld | 2,778,114,134.18 | 4.960 |
TOTAL | 56,007,995,924.81 | 100.000 |
A Denotes trust-wide proposal and voting results.
Annual Report
Proxy Voting Results
A special meeting of the fund's shareholders was held on April 16, 2008. The results of votes taken among shareholders on the proposal before them are reported below. Each vote reported represents one dollar of net asset value held on the record date for the meeting.
PROPOSAL 1 |
To elect a Board of Trustees.A |
| # of
Votes | % of
Votes |
James C. Curvey |
Affirmative | 44,485,656,811.55 | 94.702 |
Withheld | 2,488,551,854.62 | 5.298 |
TOTAL | 46,974,208,666.17 | 100.000 |
Dennis J. Dirks |
Affirmative | 44,706,671,638.31 | 95.173 |
Withheld | 2,267,537,027.86 | 4.827 |
TOTAL | 46,974,208,666.17 | 100.000 |
Edward C. Johnson 3d |
Affirmative | 44,294,881,638.16 | 94.296 |
Withheld | 2,679,327,028.01 | 5.704 |
TOTAL | 46,974,208,666.17 | 100.000 |
Alan J. Lacy |
Affirmative | 44,685,373,413.16 | 95.127 |
Withheld | 2,288,835,253.01 | 4.873 |
TOTAL | 46,974,208,666.17 | 100.000 |
Ned C. Lautenbach |
Affirmative | 44,634,541,379.41 | 95.019 |
Withheld | 2,339,667,286.76 | 4.981 |
TOTAL | 46,974,208,666.17 | 100.000 |
Joseph Mauriello |
Affirmative | 44,683,962,099.80 | 95.124 |
Withheld | 2,290,246,566.37 | 4.876 |
TOTAL | 46,974,208,666.17 | 100.000 |
Cornelia M. Small |
Affirmative | 44,671,688,375.36 | 95.098 |
Withheld | 2,302,520,290.81 | 4.902 |
TOTAL | 46,974,208,666.17 | 100.000 |
| # of
Votes | % of
Votes |
William S. Stavropoulos |
Affirmative | 44,465,262,087.61 | 94.659 |
Withheld | 2,508,946,578.56 | 5.341 |
TOTAL | 46,974,208,666.17 | 100.000 |
David M. Thomas |
Affirmative | 44,694,340,813.87 | 95.147 |
Withheld | 2,279,867,852.30 | 4.853 |
TOTAL | 46,974,208,666.17 | 100.000 |
Michael E. Wiley |
Affirmative | 44,686,513,174.78 | 95.130 |
Withheld | 2,287,695,491.39 | 4.870 |
TOTAL | 46,974,208,666.17 | 100.000 |
A Denotes trust-wide proposal and voting results.
Annual Report
Board Approval of Investment Advisory Contracts and Management Fees
Fidelity International Small Cap Fund
Each year, typically in July, the Board of Trustees, including the Independent Trustees (together, the Board), votes on the renewal of the management contract and sub-advisory agreements (together, the Advisory Contracts) for the fund. The Board, assisted by the advice of fund counsel and Independent Trustees' counsel, requests and considers a broad range of information throughout the year.
The Board meets regularly and, acting directly and through its separate committees, requests and receives information concerning, and considers at each of its meetings factors that are relevant to, its annual consideration of the renewal of the fund's Advisory Contracts, including the services and support provided to the fund and its shareholders. At the time of the renewal, the Board had 12 standing committees, each composed of Independent Trustees with varying backgrounds, to which the Board has assigned specific subject matter responsibilities in order to enhance effective decision-making by the Board. Each committee has a written charter outlining the structure and purposes of the committee. The Board also meets as needed to consider matters specifically related to the Board's annual consideration of the renewal of Advisory Contracts.
At its July 2008 meeting, the Board of Trustees, including the Independent Trustees, unanimously determined to renew the fund's Advisory Contracts. In reaching its determination, the Board considered all factors it believed relevant, including (i) the nature, extent, and quality of the services to be provided to the fund and its shareholders (including the investment performance of the fund); (ii) the competitiveness of the fund's management fee and total expenses; (iii) the total costs of the services to be provided by and the profits to be realized by Fidelity from its relationship with the fund; (iv) the extent to which economies of scale would be realized as the fund grows; and (v) whether fee levels reflect these economies of scale, if any, for the benefit of fund shareholders. The Board also approved agreements with foreign sub-advisers Fidelity Management & Research (Japan) Inc. and Fidelity Management & Research (Hong Kong) Limited, as well as amendments to the fund's agreement with Fidelity Management & Research (U.K.) Inc.
In considering whether to renew the Advisory Contracts for the fund, the Board ultimately reached a determination, with the assistance of fund counsel and Independent Trustees' counsel and through the exercise of its business judgment, that the renewal of the Advisory Contracts and the compensation to be received by Fidelity under the management contract is consistent with Fidelity's fiduciary duty under applicable law. The Board's decision to renew the Advisory Contracts was not based on any single factor noted above, but rather was based on a comprehensive consideration of all the information provided to the Board at its meetings throughout the year. The Board, in reaching its determination to renew the Advisory Contracts, is aware that shareholders in the fund have a broad range of investment choices available to them, including a wide choice among mutual funds offered by competitors to Fidelity, and that the fund's shareholders, with the opportunity to review and weigh the disclosure provided by the fund in its prospectus and other public disclosures, have chosen to invest in this fund, managed by Fidelity.
Annual Report
Nature, Extent, and Quality of Services Provided. The Board considered staffing within the investment adviser, FMR, and the sub-advisers (together, the Investment Advisers), including the backgrounds of the fund's investment personnel and the fund's investment objective and discipline. The Independent Trustees also had discussions with senior management of Fidelity's investment operations and investment groups. The Board considered the structure of the portfolio manager compensation program and whether this structure provides appropriate incentives.
Resources Dedicated to Investment Management and Support Services. The Board reviewed the size, education, and experience of the Investment Advisers' investment staff, their use of technology, and the Investment Advisers' approach to recruiting, training, and retaining portfolio managers and other research, advisory, and management personnel. The Board noted that Fidelity's analysts have access to a variety of technological tools that enable them to perform both fundamental and quantitative analysis and to specialize in various disciplines. The Board considered Fidelity's extensive global research capabilities that enable the Investment Advisers to aggregate data from various sources in an effort to produce positive investment results. The Board also considered that Fidelity's portfolio managers and analysts have access to daily portfolio attribution that allows for monitoring of a fund's portfolio, as well as an electronic communication system that provides immediate real-time access to research concerning issuers and credit enhancers.
Shareholder and Administrative Services. The Board considered (i) the nature, extent, quality, and cost of advisory, administrative, distribution, and shareholder services performed by the Investment Advisers and their affiliates under the Advisory Contracts and under separate agreements covering transfer agency, pricing and bookkeeping, and securities lending services for the fund; (ii) the nature and extent of the Investment Advisers' supervision of third party service providers, principally custodians and subcustodians; and (iii) the resources devoted to, and the record of compliance with, the fund's compliance policies and procedures. The Board also reviewed the allocation of fund brokerage, including allocations to brokers affiliated with the Investment Advisers, the use of brokerage commissions to pay fund expenses, and the use of "soft" commission dollars to pay for research services. The Board further considered that Fidelity voluntarily pays for market data out of its own resources.
The Board noted that the growth of fund assets across the complex allows Fidelity to reinvest in the development of services designed to enhance the value or convenience of the Fidelity funds as investment vehicles. These services include 24-hour access to account information and market information through phone representatives and over the Internet, and investor education materials and asset allocation tools.
Annual Report
Board Approval of Investment Advisory Contracts and
Management Fees - continued
Investment in a Large Fund Family. The Board considered the benefits to shareholders of investing in a Fidelity fund, including the benefits of investing in a fund that is part of a large family of funds offering a variety of investment disciplines and providing for a large variety of mutual fund investor services. For example, fund shareholders are offered the privilege of exchanging shares of the fund for shares of other Fidelity funds, as set forth in the fund's prospectus, without paying a sales charge. The Board noted that, Fidelity has taken a number of actions over the previous year that benefited particular funds, including (i) dedicating additional resources to investment research and to restructure the investment research teams; (ii) contractually agreeing to reduce the management fees on Fidelity's Institutional Money Market Funds and launching Class IV and Institutional Class of certain of these funds; (iii) reducing the transfer agent fees for the Fidelity Select Portfolios and Investor Class of the VIP funds; and (iv) launching Class K of 29 equity funds as a lower-fee class available to certain employer-sponsored retirement plans.
Investment Performance. The Board considered whether the fund has operated within its investment objective, as well as its record of compliance with its investment restrictions. It also reviewed the fund's absolute investment performance for each class, as well as the fund's relative investment performance for each class measured against (i) a broad-based securities market index, and (ii) a peer group of mutual funds deemed appropriate by the Board over multiple periods. The following charts considered by the Board show, over the one-, three-, and five-year periods ended December 31, 2007, as available, the cumulative total returns of Fidelity International Small Cap (retail class) and Class B of the fund, the cumulative total returns of a broad-based securities market index ("benchmark"), and a range of cumulative total returns of a peer group of mutual funds identified by Lipper Inc. as having an investment objective similar to that of the fund. The returns of Fidelity International Small Cap (retail class) and Class B show the performance of the highest and lowest performing classes, respectively (based on three-year performance). The box within each chart shows the 25th percentile return (bottom of box) and the 75th percentile return (top of box) of the peer group. Returns shown above the box are in the first quartile and returns shown below the box are in the fourth quartile. The percentage beaten numbers noted below each chart correspond to the percentile box and represent the percentage of funds in the peer group whose performance was equal to or lower than that of the class indicated.
Annual Report
Fidelity International Small Cap Fund

The Board reviewed the fund's relative investment performance against its peer group and stated that the performance of Fidelity International Small Cap (retail class) of the fund was in the second quartile for the one- and three-year periods and the first quartile for the five-year period. The Board also stated that the investment performance of Fidelity International Small Cap (retail class) of the fund compared favorably to its benchmark for all the periods shown. The Board considered that the variations in performance among the fund's classes reflect the variations in class expenses, which result in lower performance for higher expense classes.
The Board also considered that the fund's management fee is subject to upward or downward adjustment depending upon whether, and to what extent, the fund's investment performance for the performance period exceeds, or is exceeded by, the record (over the same period) of a Board-approved performance adjustment index. The Board realizes that the performance adjustment provides FMR with a strong economic incentive to seek to achieve superior performance for the fund's shareholders and helps to more closely align the interests of FMR and the fund's shareholders.
The Board considered that FMR has taken steps to refocus and strengthen equity research, equity portfolio management, and compliance.
Based on its review, and giving particular weight to the nature and quality of the resources dedicated by the Investment Advisers to maintain and improve relative performance, the Board concluded that the nature, extent, and quality of the services provided to the fund will benefit the fund's shareholders, particularly in light of the Board's view that the fund's shareholders benefit from investing in a fund that is part of a large family of funds offering a variety of investment disciplines and services.
Annual Report
Board Approval of Investment Advisory Contracts and
Management Fees - continued
Competitiveness of Management Fee and Total Fund Expenses. The Board considered the fund's management fee and total expenses compared to "mapped groups" of competitive funds and classes. Fidelity creates "mapped groups" by combining similar Lipper investment objective categories that have comparable management fee characteristics. Combining Lipper investment objective categories aids the Board's management fee and total expense comparisons by broadening the competitive group used for comparison and by reducing the number of universes to which various Fidelity funds are compared. The Board also considered supplemental information about how the fund's management fee and total expenses ranked relative to groups based on Lipper classifications, which take into account a fund's market capitalization and style.
The Board considered two proprietary management fee comparisons for the 12-month periods shown in the chart below. The group of Lipper funds used by the Board for management fee comparisons is referred to below as the "Total Mapped Group" and, for the reasons explained above, is broader than the Lipper peer group used by the Board for performance comparisons. The Total Mapped Group comparison focuses on a fund's standing relative to the total universe of comparable funds available to investors, in terms of gross management fees before expense reimbursements or caps, and without giving effect to the fund's performance adjustment. "TMG %" represents the percentage of funds in the Total Mapped Group that had management fees that were lower than the fund's. For example, a TMG % of 21% means that 79% of the funds in the Total Mapped Group had higher management fees than the fund. The "Asset-Size Peer Group" (ASPG) comparison focuses on a fund's standing relative to non-Fidelity funds similar in size to the fund within the Total Mapped Group. The ASPG represents at least 15% of the funds in the Total Mapped Group with comparable asset size and management fee characteristics, subject to a minimum of 50 funds (or all funds in the Total Mapped Group if fewer than 50). Additional information, such as the ASPG quartile in which the fund's management fee ranked and the impact of the fund's performance adjustment, is also included in the chart and considered by the Board.
Annual Report
Fidelity International Small Cap Fund

The Board noted that the fund's management fee ranked below the median of its Total Mapped Group and below the median of its ASPG for 2007. The Board also noted the effect of the fund's positive performance adjustment on the fund's management fee ranking. The Board noted that the performance adjustment for each year represents calculations for performance periods that differ from the periods shown in the performance charts above.
Based on its review, the Board concluded that the fund's management fee was fair and reasonable in light of the services that the fund receives and the other factors considered.
In its review of each class's total expenses, the Board considered the fund's management fee as well as other fund or class expenses, as applicable, such as transfer agent fees, pricing and bookkeeping fees, fund-paid 12b-1 fees, and custodial, legal, and audit fees. The Board also noted the effects of any waivers and reimbursements on fees and expenses, as well as the impact of the fund's performance adjustment. As part of its review, the Board also considered current and historical total expenses of each class of the fund compared to competitive fund median expenses. Each class of the fund is compared to those funds and classes in the Total Mapped Group (used by the Board for management fee comparisons) that have a similar sales load structure.
The Board noted that the total expenses of each of Class A, Class B, Class C, Institutional Class, and Fidelity International Small Cap (retail class) ranked below its competitive median for 2007, and the total expenses of Class T ranked above its competitive median for 2007. The Board considered that the total expenses of Class T were above the median primarily because its 12b-1 fee is higher than the typical front-end load class. The Board noted that the fund offers multiple classes, each of which has a different sales load and 12b-1 fee structure, and that the multiple structures are intended to offer a range of pricing options for the intermediary market. The Board also noted that the total expenses of the classes vary primarily by the level of their 12b-1 fees, although differences in transfer agent fees may also cause expenses to vary from class to class.
Annual Report
Board Approval of Investment Advisory Contracts and
Management Fees - continued
In its review of total expenses, the Board also considered Fidelity fee structures and other information on clients that FMR and its affiliates service in other competitive markets, such as other mutual funds advised or subadvised by FMR or its affiliates, pension plan clients, and other institutional clients.
Based on its review, the Board concluded that the total expenses of each class of the fund were reasonable, although in one case above the median of the universe presented for comparison, in light of the services that the fund and its shareholders receive and the other factors considered.
Costs of the Services and Profitability. The Board considered the revenues earned and the expenses incurred by Fidelity in conducting the business of developing, marketing, distributing, managing, administering and servicing the fund and its shareholders. The Board also considered the level of Fidelity's profits in respect of all the Fidelity funds.
On an annual basis, FMR presents to the Board Fidelity's profitability for the fund. Fidelity calculates the profitability for each fund, as well as aggregate profitability for groups of Fidelity funds and all Fidelity funds, using a series of detailed revenue and cost allocation methodologies which originate with the audited books and records of Fidelity. The Audit Committee of the Board reviews any significant changes from the prior year's methodologies.
PricewaterhouseCoopers LLP (PwC), independent registered public accounting firm and auditor to Fidelity and certain Fidelity funds, has been engaged annually by the Board as part of the Board's assessment of the results of Fidelity's profitability analysis. PwC's engagement includes the review and assessment of Fidelity's methodologies used in determining the revenues and expenses attributable to Fidelity's mutual fund business, and completion of agreed-upon procedures surrounding the mathematical accuracy of fund profitability and its conformity to allocation methodologies. After considering PwC's reports issued under the engagement and information provided by Fidelity, the Board believes that while other allocation methods may also be reasonable, Fidelity's profitability methodologies are reasonable in all material respects.
Annual Report
The Board has also reviewed Fidelity's non-fund businesses and any fall-out benefits related to the mutual fund business as well as cases where Fidelity's affiliates may benefit from or be related to the fund's business.
The Board considered the costs of the services provided by and the profits realized by Fidelity in connection with the operation of the fund and determined that the amount of profit is a fair entrepreneurial profit for the management of the fund.
Economies of Scale. The Board considered whether there have been economies of scale in respect of the management of the Fidelity funds, whether the Fidelity funds (including the fund) have appropriately benefited from any such economies of scale, and whether there is potential for realization of any further economies of scale. The Board considered the extent to which the fund will benefit from economies of scale through increased services to the fund, through waivers or reimbursements, or through fee or expense reductions.
The Board recognized that the fund's management contract incorporates a "group fee" structure, which provides for lower group fee rates as total fund assets under FMR's management increase, and for higher group fee rates as total fund assets under FMR's management decrease. FMR determines the group fee rates based on a tiered asset "breakpoint" schedule. The Board considered that the group fee is designed to deliver the benefits of economies of scale to fund shareholders when total fund assets increase, even if assets of any particular fund are unchanged or have declined, because some portion of Fidelity's costs are attributable to services provided to all Fidelity funds, and all funds benefit if those costs can be allocated among more assets. The Board also considered that although the fund is partially closed to new investors, it continues to incur investment management expenses, and marketing and distribution expenses related to the retention of existing shareholders and assets. The Board further noted that the fund may continue to realize benefits from the group fee structure, even though assets may not be expected to grow significantly at the fund level. The Board concluded that, given the group fee structure, fund shareholders will achieve a certain level of economies of scale as assets under FMR's management increase at the fund complex level, regardless of whether Fidelity achieves any such economies of scale.
The Board further concluded that any potential economies of scale are being shared between fund shareholders and Fidelity in an appropriate manner.
Additional Information Requested by the Board. In order to develop fully the factual basis for consideration of the Fidelity funds' Advisory Contracts, the Board requested and received additional information on certain topics, including (i) fund performance trends and actions to be taken by FMR to improve certain funds' overall performance; (ii) portfolio manager changes that have occurred during the past year; (iii) Fidelity's fund profitability methodology, the profitability of certain fund service providers, and profitability trends for certain funds; (iv) Fidelity's compensation structure for portfolio managers and key personnel, including its effects on fund profitability and the extent to which portfolio manager compensation is linked to fund performance; (v) Fidelity's fee structures and rationale for recommending different fees among categories of funds; and (vi) Fidelity's rationale for recommending which funds should have a performance adjustment component as part of their management fees.
Annual Report
Board Approval of Investment Advisory Contracts and
Management Fees - continued
Based on its evaluation of all of the conclusions noted above, and after considering all material factors, the Board ultimately concluded that the advisory fee structures are fair and reasonable, and that the fund's Advisory Contracts should be renewed.
Annual Report
Managing Your Investments
Fidelity offers several ways to conveniently manage your personal investments via your telephone or PC. You can access your account information, conduct trades and research your investments 24 hours a day.
By Phone
Fidelity Automated Service Telephone provides a single toll-free number to access account balances, positions, quotes and trading. It's easy to navigate the service, and on your first call, the system will help you create a personal identification number (PIN) for security.
(phone_graphic)
Fidelity Automated
Service Telephone (FAST®)
1-800-544-5555
Press
For mutual fund and brokerage trading.
For quotes.*
For account balances and holdings.
To review orders and mutual
fund activity.
To change your PIN.
To speak to a Fidelity representative.
By PC
Fidelity's web site on the Internet provides a wide range of information, including daily financial news, fund performance, interactive planning tools and news about Fidelity products and services.
(computer_graphic)
Fidelity's Web Site
www.fidelity.com
* When you call the quotes line, please remember that a fund's yield and return will vary and, except for money market funds, share price will also vary. This means that you may have a gain or loss when you sell your shares. There is no assurance that money market funds will be able to maintain a stable $1 share price; an investment in a money market fund is not insured or guaranteed by the U.S. government. Total returns are historical and include changes in share price, reinvestment of dividends and capital gains, and the effects of any sales charges.
Annual Report
To Visit Fidelity
For directions and hours,
please call 1-800-544-9797.
Arizona
7001 West Ray Road
Chandler, AZ
15445 N. Scottsdale Road
Scottsdale, AZ
California
815 East Birch Street
Brea, CA
1411 Chapin Avenue
Burlingame, CA
851 East Hamilton Avenue
Campbell, CA
19200 Von Karman Avenue
Irvine, CA
601 Larkspur Landing Circle
Larkspur, CA
2000 Avenue of the Stars
Los Angeles, CA
27101 Puerta Real
Mission Viejo, CA
73-575 El Paseo
Palm Desert, CA
251 University Avenue
Palo Alto, CA
123 South Lake Avenue
Pasadena, CA
16656 Bernardo Ctr. Drive
Rancho Bernardo, CA
1220 Roseville Parkway
Roseville, CA
1740 Arden Way
Sacramento, CA
7676 Hazard Center Drive
San Diego, CA
11943 El Camino Real
San Diego, CA
8 Montgomery Street
San Francisco, CA
3793 State Street
Santa Barbara, CA
1200 Wilshire Boulevard
Santa Monica, CA
398 West El Camino Real
Sunnyvale, CA
111 South Westlake Blvd
Thousand Oaks, CA
21701 Hawthorne Boulevard
Torrance, CA
2001 North Main Street
Walnut Creek, CA
6326 Canoga Avenue
Woodland Hills, CA
Colorado
281 East Flatiron Circle
Broomfield, CO
1625 Broadway
Denver, CO
9185 Westview Road
Lone Tree, CO
Connecticut
48 West Putnam Avenue
Greenwich, CT
265 Church Street
New Haven, CT
300 Atlantic Street
Stamford, CT
29 South Main Street
West Hartford, CT
Delaware
400 Delaware Avenue
Wilmington, DE
Florida
175 East Altamonte Drive
Altamonte Springs, FL
4400 N. Federal Highway
Boca Raton, FL
121 Alhambra Plaza
Coral Gables, FL
2948 N. Federal Highway
Ft. Lauderdale, FL
4671 Town Center Parkway
Jacksonville, FL
8880 Tamiami Trail, North
Naples, FL
230 Royal Palm Way
Palm Beach, FL
3501 PGA Boulevard
Palm Beach Gardens, FL
3550 Tamiami Trail, South
Sarasota, FL
1502 N. Westshore Blvd.
Tampa, FL
2465 State Road 7
Wellington, FL
Georgia
3445 Peachtree Road, N.E.
Atlanta, GA
1000 Abernathy Road
Atlanta, GA
Illinois
One North LaSalle Street
Chicago, IL
401 North Michigan Avenue
Chicago, IL
One Skokie Valley Road
Highland Park, IL
1415 West 22nd Street
Oak Brook, IL
15105 S LaGrange Road
Orland Park, IL
1572 East Golf Road
Schaumburg, IL
Indiana
4729 East 82nd Street
Indianapolis, IN
8480 Keystone Crossing
Indianapolis, IN
Kansas
5400 College Boulevard
Overland Park, KS
Maine
Three Canal Plaza
Portland, ME
Maryland
7315 Wisconsin Avenue
Bethesda, MD
610 York Road
Towson, MD
Massachusetts
801 Boylston Street
Boston, MA
155 Congress Street
Boston, MA
300 Granite Street
Braintree, MA
44 Mall Road
Burlington, MA
238 Main Street
Cambridge, MA
200 Endicott Street
Danvers, MA
Annual Report
405 Cochituate Road
Framingham, MA
551 Boston Turnpike
Shrewsbury, MA
Michigan
500 E. Eisenhower Pkwy.
Ann Arbor, MI
280 Old N. Woodward Ave.
Birmingham, MI
30200 Northwestern Hwy.
Farmington Hills, MI
43420 Grand River Avenue
Novi, MI
Minnesota
7740 France Avenue South
Edina, MN
8342 3rd Street North
Oakdale, MN
Missouri
1524 South Lindbergh Blvd.
St. Louis, MO
Nevada
2225 Village Walk Drive
Henderson, NV
New Jersey
501 Route 73 South
Marlton, NJ
150 Essex Street
Millburn, NJ
35 Morris Street
Morristown, NJ
396 Route 17, North
Paramus, NJ
3518 Route 1 North
Princeton, NJ
530 Broad Street
Shrewsbury, NJ
New Mexico
2261 Q Street NE
Albuquerque, NM
New York
1130 Franklin Avenue
Garden City, NY
37 West Jericho Turnpike
Huntington Station, NY
1271 Avenue of the Americas
New York, NY
980 Madison Avenue
New York, NY
61 Broadway
New York, NY
350 Park Avenue
New York, NY
200 Fifth Avenue
New York, NY
733 Third Avenue
New York, NY
11 Penn Plaza
New York, NY
2070 Broadway
New York, NY
1075 Northern Blvd.
Roslyn, NY
799 Central Park Avenue
Scarsdale, NY
North Carolina
4611 Sharon Road
Charlotte, NC
7011 Fayetteville Road
Durham, NC
Ohio
3805 Edwards Road
Cincinnati, OH
1324 Polaris Parkway
Columbus, OH
1800 Crocker Road
Westlake, OH
28699 Chagrin Boulevard
Woodmere Village, OH
Oregon
7493 SW Bridgeport Road
Tigard, OR
Pennsylvania
600 West DeKalb Pike
King of Prussia, PA
1735 Market Street
Philadelphia, PA
12001 Perry Highway
Wexford, PA
Rhode Island
10 Memorial Boulevard
Providence, RI
Tennessee
3018 Peoples Street
Johnson City, TN
7628 West Farmington Blvd.
Germantown, TN
2035 Mallory Lane
Franklin, TN
Texas
10000 Research Boulevard
Austin, TX
4001 Northwest Parkway
Dallas, TX
12532 Memorial Drive
Houston, TX
2701 Drexel Drive
Houston, TX
6560 Fannin Street
Houston, TX
1701 Lake Robbins Drive
The Woodlands, TX
6500 N. MacArthur Blvd.
Irving, TX
6005 West Park Boulevard
Plano, TX
14100 San Pedro
San Antonio, TX
1576 East Southlake Blvd.
Southlake, TX
Utah
279 West South Temple
Salt Lake City, UT
Virginia
1861 International Drive
McLean, VA
Washington
10500 NE 8th Street
Bellevue, WA
1518 6th Avenue
Seattle, WA
Washington, DC
1900 K Street, N.W.
Washington, DC
Wisconsin
16020 West Bluemound Road
Brookfield, WI
Fidelity Brokerage Services, Inc., 100 Summer St., Boston, MA 02110 Member NYSE/SIPC
Annual Report
To Write Fidelity
We'll give your correspondence immediate attention and send you written confirmation upon completion of your request.
(letter_graphic)
Making Changes
To Your Account
(such as changing name, address, bank, etc.)
Fidelity Investments
P.O. Box 770001
Cincinnati, OH 45277-0002
(letter_graphic)
For Non-Retirement
Accounts
Buying shares
Fidelity Investments
P.O. Box 770001
Cincinnati, OH 45277-0003
Overnight Express
Fidelity Investments
Attn: Distribution Services
100 Crosby Parkway - KC1H
Covington, KY 41015
Selling shares
Fidelity Investments
P.O. Box 770001
Cincinnati, OH 45277-0035
Overnight Express
Fidelity Investments
Attn: Distribution Services
100 Crosby Parkway - KC1H
Covington, KY 41015
General Correspondence
Fidelity Investments
P.O. Box 500
Merrimack, NH 03054-0500
(letter_graphic)
For Retirement
Accounts
Buying shares
Fidelity Investments
P.O. Box 770001
Cincinnati, OH 45277-0003
Selling shares
Fidelity Investments
P.O. Box 770001
Cincinnati, OH 45277-0035
Overnight Express
Fidelity Investments
Attn: Distribution Services
100 Crosby Parkway - KC1H
Covington, KY 41015
General Correspondence
Fidelity Investments
P.O. Box 500
Merrimack, NH 03054-0500
Annual Report
Investment Adviser
Fidelity Management & Research Company
Boston, MA
Investment Sub-Advisers
FMR Co., Inc.
Fidelity Management & Research
(U.K.) Inc.
Fidelity Research & Analysis
Company
FIL Investment Advisors
Fidelity Investments Japan Limited
FIL Investment Advisors (U.K.) Ltd.
Fidelity Management & Research
(Hong Kong) Limited
Fidelity Management & Research
(Japan) Inc.
General Distributor
Fidelity Distributors Corporation
Boston, MA
Transfer and Service Agents
Fidelity Investments Institutional
Operations Company, Inc.
Boston, MA
Fidelity Service Company, Inc.
Boston, MA
Custodian
Mellon Bank
Pittsburgh, PA
The Fidelity Telephone Connection
Mutual Fund 24-Hour Service
Exchanges/Redemptions
and Account Assistance 1-800-544-6666
Product Information 1-800-544-8888
Retirement Accounts 1-800-544-4774
(8 a.m. - 9 p.m.)
TDD Service 1-800-544-0118
for the deaf and hearing impaired
(9 a.m. - 9 p.m. Eastern time)
Fidelity Automated Service
Telephone (FAST®) 1-800-544-5555
Automated line for quickest service
ISC-UANN-1208
1.793584.105
(Fidelity Investment logo)(registered trademark)
Fidelity Advisor
International Small Cap
Fund - Class A, Class T, Class B
and Class C
Annual Report
October 31, 2008
Class A, Class T, Class B, and Class C are classes of Fidelity®
International Small Cap Fund
(2_fidelity_logos) (Registered_Trademark)
Contents
Chairman's Message | <Click Here> | Ned Johnson's message to shareholders. |
Performance | <Click Here> | How the fund has done over time. |
Managements' Discussion | <Click Here> | The managers' review of fund performance, strategy and outlook. |
Shareholder Expense Example | <Click Here> | An example of shareholder expenses. |
Investment Changes | <Click Here> | A summary of major shifts in the fund's investments over the past six months. |
Investments | <Click Here> | A complete list of the fund's investments with their market values. |
Financial Statements | <Click Here> | Statements of assets and liabilities, operations, and changes in net assets, as well as financial highlights. |
Notes | <Click Here> | Notes to financial statements. |
Report of Independent Registered Public Accounting Firm | <Click Here> | |
Trustees and Officers | <Click Here> | |
Distributions | <Click Here> | |
Proxy Voting Results | <Click Here> | |
Board Approval of Investment Advisory Contracts and Management Fees | <Click Here> | |
To view a fund's proxy voting guidelines and proxy voting record for the 12-month period ended June 30, visit http://www.fidelity.com (search for "proxy voting guidelines") or visit the Securities and Exchange Commission's (SEC) web site at http://www.sec.gov. You may also call 1-877-208-0098 to request a free copy of the proxy voting guidelines.
Standard & Poor's, S&P and S&P 500 are registered service marks of The McGraw-Hill Companies, Inc. and have been licensed for use by Fidelity Distributors Corporation.
Other third party marks appearing herein are the property of their respective owners.
All other marks appearing herein are registered or unregistered trademarks or service marks of FMR LLC or an affiliated company.
Annual Report
This report and the financial statements contained herein are submitted for the general information of the shareholders of the fund. This report is not authorized for distribution to prospective investors in the fund unless preceded or accompanied by an effective prospectus.
A fund files its complete schedule of portfolio holdings with the SEC for the first and third quarters of each fiscal year on Form N-Q. Forms N-Q are available on the SEC's web site at http://www.sec.gov. A fund's Forms N-Q may be reviewed and copied at the SEC's Public Reference Room in Washington, DC. Information regarding the operation of the SEC's Public Reference Room may be obtained by calling 1-800-SEC-0330. For a complete list of a fund's portfolio holdings, view the most recent holdings listing, semiannual report, or annual report on Fidelity's web site at http://www.fidelity.com or http://www.advisor.fidelity.com, as applicable.
NOT FDIC INSURED · MAY LOSE VALUE · NO BANK GUARANTEE
Neither the fund nor Fidelity Distributors Corporation is a bank.
Annual Report
(photo_of_Edward_C_Johnson_3d)
Dear Shareholder:
Turmoil has been the watchword for the world's securities markets in 2008, with domestic and international stocks down sharply amid the global credit squeeze. A flight to quality boosted returns for U.S. Treasuries, one of the few asset classes with positive results heading into the latter stages of the year. Financial markets are always unpredictable, but there are a number of time-tested principles that can put the historical odds in your favor.
One of the basic tenets is to invest for the long term. Over time, riding out the markets' inevitable ups and downs has proven much more effective than selling into panic or chasing the hottest trend. Even missing only a few of the markets' best days can significantly diminish investor returns. Patience also affords the benefits of compounding - of earning interest on additional income or reinvested dividends and capital gains. There are tax advantages and cost benefits to consider as well. The more you sell, the more taxes you pay, and the more you trade, the higher the costs. While staying the course doesn't eliminate risk, it can considerably lessen the effect of short-term declines.
You can further manage your investing risk through diversification. And today, more than ever, geographic diversification should be taken into account. Studies indicate that asset allocation is the single most important determinant of a portfolio's long-term success. The right mix of stocks, bonds and cash - aligned to your particular risk tolerance and investment objective - is very important. Age-appropriate rebalancing is also an essential aspect of asset allocation. For younger investors, an emphasis on equities - which historically have been the best-performing asset class over time - is encouraged. As investors near their specific goal, such as retirement or sending a child to college, consideration may be given to replacing volatile assets (e.g. common stocks) with more-stable fixed investments (bonds or savings plans).
A third investment principle - investing regularly - can help lower the average cost of your purchases. Investing a certain amount of money each month or quarter helps ensure you won't pay for all your shares at market highs. This strategy - known as dollar cost averaging - also reduces unconstructive "emotion" from investing, helping shareholders avoid selling weak performers just prior to an upswing, or chasing a hot performer just before a correction.
We invite you to contact us via the Internet, through our Investor Centers or over the phone. It is our privilege to provide you the information you need to make the investments that are right for you.
Sincerely,
/s/Edward C. Johnson 3d
Edward C. Johnson 3d
Annual Report
Average annual total return reflects the change in the value of an investment, assuming reinvestment of the class' dividend income and capital gains (the profits earned upon the sale of securities that have grown in value, if any) and assuming a constant rate of performance each year. The $10,000 table and the fund's returns do not reflect the deduction of taxes that a shareholder would pay on fund distributions or the redemption of fund shares. During periods of reimbursement by Fidelity, a fund's total return will be greater than it would be had the reimbursement not occurred. How a fund did yesterday is no guarantee of how it will do tomorrow.
Average Annual Total Returns
Periods ended October 31, 2008 | Past 1
year | Past 5
years | Life of
class A |
Class A (incl. 5.75% sales charge) B | -56.04% | 2.35% | 11.90% |
Class T (incl. 3.50% sales charge) C | -55.08% | 2.56% | 12.08% |
Class B (incl. contingent deferred sales charge) D | -55.59% | 2.50% | 12.18% |
Class C (incl. contingent deferred sales charge) E | -54.05% | 2.81% | 12.26% |
A From May 27, 2003.
B Class A shares bear a 0.25% 12b-1 fee. The initial offering of Class A shares took place on May 27, 2003. Returns prior to May 27, 2003, are those of International Small Cap, the original class of the fund, which has no 12b-1 fee. Had Class A shares' 12b-1 fee been reflected, returns prior to May 27, 2003, would have been lower.
C Class T shares bear a 0.50% 12b-1 fee. The initial offering of Class T shares took place on May 27, 2003. Returns prior to May 27, 2003, are those of International Small Cap, the original class of the fund, which has no 12b-1 fee. Had Class T shares' 12b-1 fee been reflected, returns prior to May 27, 2003, would have been lower.
D Class B shares bear a 1.00% 12b-1 fee. The initial offering of Class B shares took place on May 27, 2003. Returns prior to May 27, 2003, are those of International Small Cap, the original class of the fund, which has no 12b-1 fee. Had Class B shares' 12b-1 fee been reflected, returns prior to May 27, 2003, would have been lower. Class B shares' contingent deferred sales charge included in the past one year, five years, and life of fund total return figures are 5%, 2%, and 0%, respectively.
E Class C shares bear a 1.00% 12b-1 fee. The initial offering of Class C shares took place on May 27, 2003. Returns prior to May 27, 2003, are those of International Small Cap, the original class of the fund, which has no 12b-1 fee. Had Class C shares' 12b-1 fee been reflected, returns prior to May 27, 2003, would have been lower. Class C shares' contingent deferred sales charge included in the past one year, five years, and life of fund total return figures are 1%, 0%, and 0%, respectively.
Annual Report
$10,000 Over Life of Fund
Let's say hypothetically that $10,000 was invested in Fidelity Advisor International Small Cap Fund - Class A, a class of the fund, on September 18, 2002, when the fund started, and the current 5.75% sales charge was paid. The chart shows how the value of your investment would have changed, and also shows how the MSCI® EAFE® Small Cap Index performed over the same period. The initial offering of Class A took place on May 27, 2003. See the previous page for additional information regarding the performance of Class A.
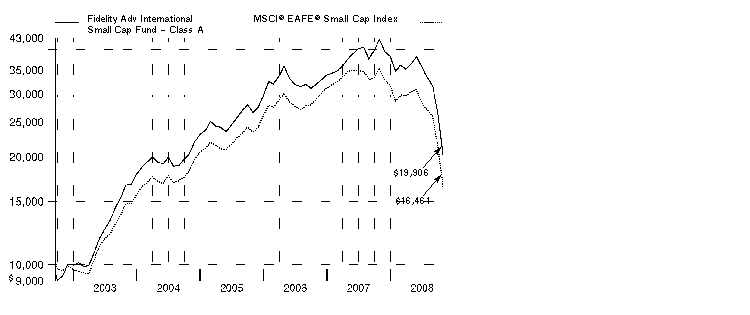
In prior years, the performance from year to year was represented by the performance of Class T. Going forward, the fund's performance will be represented by Class A for consistency with other fund materials.
Annual Report
Comments from Colin Stone, Noriko Takahashi and Wilson Wong, Co-Portfolio Managers of Fidelity Advisor International Small Cap Fund
International stocks fell hard during the 12 months ending October 31, 2008, especially during the latter stages of the period and mostly as a result of fallout from the financial crisis in the United States. The viral spread of this financial contagion - which began in the U.S. subprime mortgage market, then seized up the credit markets, hobbled major financial institutions and eventually slowed economic growth worldwide - left virtually no corner of the globe untouched. Developed international equity markets - as gauged by the MSCI® Europe, Australasia, Far East (EAFE®) Index, which monitors established markets outside the U.S. and Canada - fell 46.54%, while the Standard & Poor's 500SM Index, a measure of U.S. stocks, dropped 36.10%. Among countries constituting at least 1% of the EAFE index, Switzerland had the "least worst" showing, falling roughly 32%, followed by Japan, where stocks slid by around 37%. The weakest overall performance came from Belgium, where stocks slipped by nearly 70%. In the United Kingdom, the largest component of the index, equities were down almost 48%. Emerging markets declined 56.22%, as measured by the MSCI Emerging Markets Index.
During the year, the fund's Class A, Class T, Class B and Class C shares returned -53.35%, -53.46%, -53.68% and -53.67%, respectively (excluding sales charges), versus -53.46% for the MSCI Europe, Australasia, Far East Small Cap Index. Stock selection was helpful in Germany and Canada. Conversely, our picks in Japan and Australia hurt. On a sector basis, stock and market selection in health care and materials helped, as did our cash stake, while poor picks in information technology, consumer discretionary, industrials and financials detracted. The Asia-Pacific ex Japan subportfolio beat its benchmark. Contributors included Australia's Incitec Pivot, which benefited from high fertilizer prices earlier in the period and which we sold. An out-of-benchmark stake in Oil Search - based in Papua New Guinea - helped as well. Detractors included Queensland Gas Company, an Australian holding that we sold. The Europe/Middle East/Africa subportfolio edged its benchmark. Western Canadian Coal profited from higher coal prices and was sold from the fund. Swiss biopharmaceutical company Actelion also added value, while U.K.-headquartered Phorm, a global digital technology company, detracted. The three stocks just mentioned were out-of-index holdings. The Japanese subportfolio trailed its benchmark. Crystal electronic parts maker Nihon Dempa Kogyo -which we sold - and auto parts manufacturer Nippon Seiki detracted. Tsumura, an herbal medicine company, contributed.
The views expressed above reflect those of the portfolio manager(s) only through the end of the period as stated on the cover of this report and do not necessarily represent the views of Fidelity or any other person in the Fidelity organization. Any such views are subject to change at any time based upon market or other conditions and Fidelity disclaims any responsibility to update such views. These views may not be relied on as investment advice and, because investment decisions for a Fidelity fund are based on numerous factors, may not be relied on as an indication of trading intent on behalf of any Fidelity fund.
Annual Report
Shareholder Expense Example
As a shareholder of the Fund, you incur two types of costs: (1) transaction costs, including sales charges (loads) on purchase payments or redemption proceeds, redemption fees, and (2) ongoing costs, including management fees, distribution and/or service (12b-1) fees and other Fund expenses. This Example is intended to help you understand your ongoing costs (in dollars) of investing in the Fund and to compare these costs with the ongoing costs of investing in other mutual funds.
The Example is based on an investment of $1,000 invested at the beginning of the period and held for the entire period (May 1, 2008 to October 31, 2008).
Actual Expenses
The first line of the accompanying table for each class of the Fund provides information about actual account values and actual expenses. You may use the information in this line, together with the amount you invested, to estimate the expenses that you paid over the period. Simply divide your account value by $1,000.00 (for example, an $8,600 account value divided by $1,000.00 = 8.6), then multiply the result by the number in the first line for a class of the Fund under the heading entitled "Expenses Paid During Period" to estimate the expenses you paid on your account during this period. A small balance maintenance fee of $12.00 that is charged once a year may apply for certain accounts with a value of less than $2,000. This fee is not included in the table below. If it was, the estimate of expenses you paid during the period would be higher, and your ending account value lower, by this amount. In addition, the Fund, as a shareholder in the underlying Fidelity Central Funds, will indirectly bear its pro rata share of the fees and expenses incurred by the underlying Fidelity Central Funds. These fees and expenses are not included in the Fund's annualized expense ratio used to calculate the expense estimate in the table below.
Hypothetical Example for Comparison Purposes
The second line of the accompanying table for each class of the Fund provides information about hypothetical account values and hypothetical expenses based on a Class' actual expense ratio and an assumed rate of return of 5% per year before expenses, which is not the Class' actual return. The hypothetical account values and expenses may not be used to estimate the actual ending account balance or expenses you paid for the period. You may use this information to compare the ongoing costs of investing in the Fund and other funds. To do so, compare this 5% hypothetical example with the 5% hypothetical examples that appear in the shareholder reports of the other funds. A small balance maintenance fee of $12.00 that is charged once a year may apply for certain accounts with a value of less than $2,000. This fee is not included in the table below. If it was, the estimate of expenses you paid during the period would be higher, and your ending account value lower, by this amount. In addition, the Fund, as a shareholder in the underlying Fidelity Central Funds, will indirectly bear its pro rata share of the fees and expenses incurred by the underlying Fidelity Central Funds. These fees and expenses are not included in the Fund's annualized expense ratio used to calculate the expense estimate in the table below.
Annual Report
Please note that the expenses shown in the table are meant to highlight your ongoing costs only and do not reflect any transaction costs. Therefore, the second line of the table is useful in comparing ongoing costs only, and will not help you determine the relative total costs of owning different funds. In addition, if these transactional costs were included, your costs would have been higher.
| Annualized
Expense Ratio | Beginning
Account Value
May 1, 2008 | Ending
Account Value
October 31, 2008 | Expenses Paid
During Period*
May 1, 2008 to October 31, 2008 |
Class A | 1.65% | | | |
Actual | | $ 1,000.00 | $ 546.80 | $ 6.42 |
HypotheticalA | | $ 1,000.00 | $ 1,016.84 | $ 8.36 |
Class T | 1.90% | | | |
Actual | | $ 1,000.00 | $ 546.40 | $ 7.39 |
HypotheticalA | | $ 1,000.00 | $ 1,015.58 | $ 9.63 |
Class B | 2.40% | | | |
Actual | | $ 1,000.00 | $ 545.20 | $ 9.32 |
HypotheticalA | | $ 1,000.00 | $ 1,013.07 | $ 12.14 |
Class C | 2.40% | | | |
Actual | | $ 1,000.00 | $ 545.20 | $ 9.32 |
HypotheticalA | | $ 1,000.00 | $ 1,013.07 | $ 12.14 |
International Small Cap | 1.52% | | | |
Actual | | $ 1,000.00 | $ 547.60 | $ 5.91 |
HypotheticalA | | $ 1,000.00 | $ 1,017.50 | $ 7.71 |
Institutional Class | 1.40% | | | |
Actual | | $ 1,000.00 | $ 547.70 | $ 5.45 |
HypotheticalA | | $ 1,000.00 | $ 1,018.10 | $ 7.10 |
A 5% return per year before expenses
* Expenses are equal to each Class' annualized expense ratio, multiplied by the average account value over the period, multiplied by 184/366 (to reflect the one-half year period).
Annual Report
Investment Changes (Unaudited)
Geographic Diversification (% of fund's net assets) |
As of October 31, 2008 |
| Japan 32.3% |
| United Kingdom 19.7% |
| United States of America 8.3% |
| Australia 7.6% |
| Germany 6.5% |
| France 5.3% |
| Switzerland 2.6% |
| Sweden 1.7% |
| Spain 1.7% |
| Other 14.3% |

Percentages are adjusted for the effect of futures contracts, if applicable. |
As of April 30, 2008 |
| Japan 29.8% |
| United Kingdom 17.0% |
| Australia 10.5% |
| United States of America 7.3% |
| Canada 3.8% |
| Germany 3.2% |
| France 2.8% |
| Sweden 2.4% |
| Bermuda 2.3% |
| Other 20.9% |

Percentages are adjusted for the effect of futures contracts, if applicable. |
Asset Allocation |
| % of fund's
net assets | % of fund's net assets
6 months ago |
Stocks and Investment Companies | 92.5 | 95.0 |
Bonds | 0.0 | 0.4 |
Short-Term Investments and Net Other Assets | 7.5 | 4.6 |
Top Ten Stocks as of October 31, 2008 |
| % of fund's
net assets | % of fund's net assets
6 months ago |
Actelion Ltd. (Reg.) (Switzerland, Biotechnology) | 1.7 | 1.1 |
Biotest AG (non-vtg.) (Germany, Biotechnology) | 1.5 | 0.0 |
ASOS PLC (United Kingdom, Internet & Catalog Retail) | 1.3 | 0.0 |
Seven Bank Ltd. (Japan, Commercial Banks) | 1.0 | 0.0 |
Grifols SA (Spain, Biotechnology) | 1.0 | 0.7 |
Xchanging PLC (United Kingdom, IT Services) | 1.0 | 0.6 |
Datacash Group PLC (United Kingdom, IT Services) | 1.0 | 0.7 |
Fresenius Medical Care AG (Germany, Health Care Providers & Services) | 0.9 | 0.5 |
Autonomy Corp. PLC (United Kingdom, Software) | 0.9 | 0.6 |
SHO-BOND Holdings Co. Ltd. (Japan, Construction & Engineering) | 0.8 | 0.0 |
| 11.1 | |
Market Sectors as of October 31, 2008 |
| % of fund's
net assets | % of fund's net assets
6 months ago |
Health Care | 19.4 | 8.8 |
Industrials | 14.8 | 14.9 |
Consumer Discretionary | 14.8 | 17.0 |
Information Technology | 12.8 | 12.1 |
Financials | 9.1 | 7.2 |
Materials | 6.4 | 19.4 |
Energy | 6.0 | 8.3 |
Consumer Staples | 5.1 | 6.9 |
Utilities | 2.6 | 0.3 |
Telecommunication Services | 1.3 | 0.5 |
Annual Report
Investments October 31, 2008
Showing Percentage of Net Assets
Common Stocks - 90.8% |
| Shares | | Value (000s) |
Australia - 7.6% |
AGL Energy Ltd. | 41,046 | | $ 385 |
Allied Gold Ltd. (a) | 1,000,000 | | 143 |
Allied Gold Ltd. (United Kingdom) (a) | 5,974,800 | | 904 |
Ansell Ltd. | 468,802 | | 3,942 |
APA Group unit | 1,269,996 | | 2,474 |
Bradken Ltd. | 84,197 | | 278 |
Centamin Egypt Ltd. (a) | 8,016,301 | | 3,471 |
Centennial Coal Co. Ltd. | 905,473 | | 2,128 |
Charter Hall Group unit | 393,821 | | 117 |
Coal of Africa Ltd. (a) | 2,057,900 | | 1,685 |
CopperCo Ltd. (a) | 3,342,244 | | 219 |
David Jones Ltd. | 1,228,763 | | 2,529 |
DUET Group | 1,515,279 | | 2,417 |
International Ferro Metals | 993,881 | | 570 |
Invocare Ltd. | 35,429 | | 115 |
Iress Market Technology Ltd. | 210,229 | | 653 |
JB Hi-Fi Ltd. (d) | 246,857 | | 1,448 |
Macquarie Airports unit | 520,928 | | 740 |
Metcash Ltd. | 884,235 | | 2,385 |
Monto Minerals Ltd. (a) | 8,206,552 | | 0 |
Monto Minerals Ltd. warrants 5/25/09 (a) | 1,485,934 | | 0 |
Navitas Ltd. | 1,655,222 | | 2,335 |
Northern Iron Ltd. | 614,455 | | 307 |
Nufarm Ltd. | 144,837 | | 1,048 |
SAI Global Ltd. | 345,535 | | 564 |
Seek Ltd. (d) | 428,872 | | 948 |
SP AusNet unit | 3,634,154 | | 2,677 |
Spark Infrastructure Group unit (f) | 1,942,854 | | 1,898 |
Tassal Group Ltd. | 3,261,040 | | 3,800 |
Tattersall's Ltd. | 485,563 | | 813 |
Tianshan Goldfields Ltd. (a) | 744,712 | | 34 |
Tianshan Goldfields Ltd. (United Kingdom) (a) | 200,000 | | 9 |
United Group Ltd. | 280,367 | | 1,778 |
WorleyParsons Ltd. | 30,013 | | 301 |
Wotif.com Holdings Ltd. | 340,639 | | 784 |
TOTAL AUSTRALIA | | 43,899 |
Belgium - 0.1% |
Hansen Transmission International NV | 500,100 | | 839 |
Bermuda - 1.2% |
Oakley Capital Investments Ltd. (a) | 1,458,000 | | 1,508 |
Peace Mark Holdings Ltd. | 788,000 | | 0 |
Common Stocks - continued |
| Shares | | Value (000s) |
Bermuda - continued |
Ports Design Ltd. | 118,500 | | $ 138 |
PureCircle Ltd. | 616,000 | | 1,359 |
Seadrill Ltd. | 133,600 | | 1,286 |
Vtech Holdings Ltd. | 622,000 | | 2,317 |
Zambezi Resources Ltd.: | | | |
CDI (a) | 2,184,593 | | 80 |
warrants 8/31/09 (a) | 108,686 | | 1 |
TOTAL BERMUDA | | 6,689 |
British Virgin Islands - 1.0% |
Albidon Ltd. unit (a) | 1,469,000 | | 455 |
Kalahari Energy (g) | 1,451,000 | | 1,814 |
Playtech Ltd. (d) | 672,400 | | 3,745 |
TOTAL BRITISH VIRGIN ISLANDS | | 6,014 |
Canada - 1.0% |
AirSea Lines (g) | 1,893,338 | | 362 |
AirSea Lines warrants 8/4/11 (a)(g) | 1,862,300 | | 0 |
Aquiline Resources, Inc. (a) | 125,900 | | 108 |
European Goldfields Ltd. (a) | 966,800 | | 1,211 |
Red Back Mining, Inc. (a) | 742,600 | | 2,919 |
Rock Well Petroleum, Inc. (g) | 770,400 | | 125 |
Starfield Resources, Inc. (a) | 4,328,075 | | 933 |
TOTAL CANADA | | 5,658 |
Cayman Islands - 1.1% |
International Consolidated Minerals, Inc. (a) | 852,927 | | 868 |
New Oriental Education & Technology Group, Inc. sponsored ADR (a) | 28,000 | | 1,791 |
New World Department Store China Ltd. | 3,079,000 | | 1,706 |
Orchid Developments Group Ltd. (a) | 1,211,000 | | 1,607 |
Stella International Holdings Ltd. | 134,000 | | 113 |
TOTAL CAYMAN ISLANDS | | 6,085 |
China - 0.2% |
Baidu.com, Inc. sponsored ADR (a) | 2,400 | | 494 |
Yantai Changyu Pioneer Wine Co. (B Shares) | 254,510 | | 791 |
TOTAL CHINA | | 1,285 |
Common Stocks - continued |
| Shares | | Value (000s) |
Cyprus - 1.0% |
Buried Hill Energy (Cyprus) PCL (g) | 1,947,000 | | $ 4,906 |
Mirland Development Corp. PLC (a) | 800,700 | | 1,033 |
TOTAL CYPRUS | | 5,939 |
Denmark - 0.6% |
Vestas Wind Systems AS (a) | 83,500 | | 3,420 |
Egypt - 0.2% |
Talaat Moustafa Group Holding | 1,669,700 | | 1,101 |
Finland - 0.5% |
Nokian Tyres Ltd. | 222,740 | | 2,912 |
France - 5.3% |
Adenclassifieds SA (a) | 26,500 | | 540 |
Altamir Amboise | 311,100 | | 1,247 |
ALTEN (a)(d) | 48,200 | | 1,215 |
April Group | 84,200 | | 3,054 |
Audika SA | 108,200 | | 2,523 |
Boursorama (a) | 165,300 | | 1,206 |
Delachaux SA (d) | 55,900 | | 3,075 |
Devoteam SA | 41,900 | | 753 |
Iliad Group SA | 46,600 | | 3,685 |
Laurent-Perrier Group | 8,460 | | 686 |
LeGuide.com SA (a) | 96,800 | | 1,589 |
Maisons France Confort | 48,000 | | 830 |
Meetic (a)(d) | 236,186 | | 3,330 |
SeLoger.com (a)(d) | 139,000 | | 2,606 |
SR Teleperformance SA | 109,300 | | 2,359 |
Vilmorin & Cie (d) | 18,910 | | 1,848 |
TOTAL FRANCE | | 30,546 |
Germany - 5.0% |
Biotest AG | 1,902 | | 140 |
CTS Eventim AG | 68,800 | | 1,737 |
Delticom AG | 53,200 | | 2,676 |
Fresenius Medical Care AG | 115,410 | | 5,249 |
Gerresheimer AG | 91,400 | | 3,204 |
KROMI Logistik AG (a) | 126,500 | | 684 |
Q-Cells AG (a)(d) | 73,100 | | 2,876 |
Rational AG | 27,500 | | 2,865 |
SMA Solar Technology AG | 55,500 | | 2,506 |
Solarvalue AG | 96,800 | | 90 |
STRATEC Biomedical Systems AG | 53,265 | | 900 |
United Internet AG | 345,300 | | 3,118 |
Common Stocks - continued |
| Shares | | Value (000s) |
Germany - continued |
Vossloh AG | 16,900 | | $ 1,306 |
Wirecard AG | 277,950 | | 1,628 |
TOTAL GERMANY | | 28,979 |
Greece - 0.6% |
Babis Vovos International Technical SA (a) | 132,000 | | 2,474 |
Jumbo SA | 84,900 | | 862 |
TOTAL GREECE | | 3,336 |
Hong Kong - 0.7% |
Cafe de Coral Holdings Ltd. | 1,094,000 | | 1,719 |
Champion (REIT) | 1,652,000 | | 397 |
First Pacific Co. Ltd. | 1,686,000 | | 681 |
Melco International Development Ltd. | 914,000 | | 164 |
Midland Holdings Ltd. | 624,000 | | 260 |
Prosperity (REIT) | 1,329,000 | | 143 |
Sa Sa International Holdings Ltd. | 2,010,000 | | 307 |
Shaw Brothers (Hong Kong) Ltd. | 93,000 | | 101 |
Texwinca Holdings Ltd. | 1,022,000 | | 478 |
TOTAL HONG KONG | | 4,250 |
Indonesia - 0.1% |
PT Bumi Resources Tbk | 2,782,000 | | 364 |
Ireland - 0.2% |
Kenmare Resources PLC (a) | 1,165,900 | | 292 |
Kenmare Resources PLC warrants 7/23/09 (a) | 1,712,500 | | 84 |
Paddy Power PLC (Ireland) | 54,700 | | 933 |
Vimio PLC (a) | 867,300 | | 0 |
TOTAL IRELAND | | 1,309 |
Italy - 0.3% |
Seldovia Native Association, Inc. (SNAI) (a)(d) | 351,590 | | 1,052 |
Teleunit SpA (a)(e) | 12,312,258 | | 458 |
TOTAL ITALY | | 1,510 |
Japan - 32.3% |
Aioi Insurance Co. Ltd. | 235,000 | | 965 |
Air Water, Inc. | 436,000 | | 4,105 |
Airport Facilities Co. Ltd. | 186,700 | | 1,012 |
Alpen Co. Ltd. | 125,700 | | 2,186 |
ARCS Co. Ltd. | 137,800 | | 1,963 |
Arnest One Corp. (d) | 293,900 | | 379 |
C. Uyemura & Co. Ltd. | 59,100 | | 1,679 |
Common Stocks - continued |
| Shares | | Value (000s) |
Japan - continued |
Chiba Bank Ltd. | 256,000 | | $ 1,265 |
Coca-Cola West Japan Co. Ltd. | 90,700 | | 1,819 |
COMSYS Holdings Corp. | 147,000 | | 1,051 |
Create SD Co. Ltd. | 52,700 | | 807 |
Culture Convenience Club Co. Ltd. (d) | 149,700 | | 992 |
Daicel Chemical Industries Ltd. | 588,000 | | 2,120 |
Daihen Corp. (d) | 1,132,000 | | 2,639 |
Daikin Industries Ltd. | 40,700 | | 915 |
Dainippon Screen Manufacturing Co. Ltd. | 336,000 | | 716 |
Daiseki Co. Ltd. | 98,830 | | 2,251 |
Daito Gyorui Co. Ltd. | 13,000 | | 14 |
Don Quijote Co. Ltd. | 113,200 | | 2,053 |
eAccess Ltd. (d) | 3,211 | | 1,493 |
EPS Co. Ltd. | 979 | | 4,100 |
FamilyMart Co. Ltd. | 88,000 | | 3,486 |
Ferrotec Corp. | 93,700 | | 1,037 |
FreeBit Co., Ltd. (a)(d) | 259 | | 1,059 |
Furuno Electric Co. Ltd. | 193,400 | | 1,147 |
Green Hospital Supply, Inc. (a)(d) | 2,215 | | 755 |
Hamamatsu Photonics KK | 68,500 | | 1,520 |
Hisaka Works Ltd. | 81,000 | | 934 |
Hisamitsu Pharmaceutical Co., Inc. | 37,100 | | 1,546 |
Hitachi Construction Machinery Co. Ltd. (d) | 79,800 | | 926 |
Hitachi Metals Ltd. | 105,000 | | 789 |
Hitachi Transport System Ltd. | 80,700 | | 1,079 |
Hokuto Corp. | 97,500 | | 2,582 |
Ichirokudo Co. Ltd. (a) | 822 | | 397 |
Ichiyoshi Securities Co. Ltd. | 185,300 | | 1,484 |
Iino Kaiun Kaisha Ltd. (d) | 315,600 | | 1,613 |
Inpex Corp. | 447 | | 2,595 |
Itochu Corp. | 339,000 | | 1,791 |
Japan Asia Investment Co. Ltd. (d) | 805,000 | | 611 |
JFE Shoji Holdings, Inc. | 272,000 | | 859 |
Jupiter Telecommunications Co. | 3,036 | | 2,050 |
Kakaku.com, Inc. (d) | 1,216 | | 3,577 |
Kinki Sharyo Co. Ltd. (d) | 234,000 | | 862 |
Kuraray Co. Ltd. | 370,500 | | 2,835 |
McDonald's Holdings Co. (Japan) Ltd. | 108,500 | | 1,657 |
Meiko Electronics Co. Ltd. | 94,200 | | 1,066 |
Mitsubishi UFJ Lease & Finance Co. Ltd. | 118,280 | | 2,832 |
Nabtesco Corp. | 145,000 | | 884 |
Namco Bandai Holdings, Inc. | 414,000 | | 4,257 |
Common Stocks - continued |
| Shares | | Value (000s) |
Japan - continued |
Nihon Kohden Corp. | 206,100 | | $ 3,481 |
Nihon M&A Center, Inc. (d) | 291 | | 1,122 |
Nihon Nohyaku Co. Ltd. (d) | 361,000 | | 1,958 |
Nikon Corp. | 124,000 | | 1,747 |
Nippon Seiki Co. Ltd. | 229,000 | | 1,516 |
Nissha Printing Co. Ltd. (d) | 12,900 | | 717 |
NOF Corp. | 384,000 | | 1,101 |
NS Solutions Corp. | 97,400 | | 1,184 |
Obara Corp. | 50 | | 0 |
Oenon Holdings, Inc. | 663,000 | | 1,761 |
Oiles Corp. | 48 | | 1 |
Onward Holdings Co. Ltd. | 76,000 | | 556 |
ORIX JREIT, Inc. | 733 | | 3,360 |
Otsuka Corp. | 46,500 | | 2,339 |
Pigeon Corp. (d) | 80,500 | | 2,339 |
Point, Inc. | 85,540 | | 4,201 |
R-Tech Ueno Ltd. (d) | 70 | | 409 |
Rengo Co. Ltd. (d) | 649,000 | | 3,309 |
Resona Holdings, Inc. (d) | 1,125 | | 1,180 |
Rohto Pharmaceutical Co. Ltd. | 309,000 | | 3,503 |
Roland DG Corp. (d) | 53,600 | | 668 |
Saizeriya Co. Ltd. (d) | 270,400 | | 4,033 |
Sankyu, Inc. | 913,000 | | 2,877 |
Santen Pharmaceutical Co. Ltd. | 128,000 | | 3,273 |
Sato Corp. | 351,000 | | 3,508 |
Sec Carbon Ltd. | 126,000 | | 413 |
Sega Sammy Holdings, Inc. (d) | 299,300 | | 2,263 |
Sekisui Chemical Co. Ltd. | 216,000 | | 1,262 |
Seven Bank Ltd. | 1,972 | | 5,680 |
Shimadzu Corp. | 395,000 | | 2,703 |
Shin Nippon Biomedical Laboratories Ltd. (d) | 154,000 | | 1,976 |
Shin-Kobe Electric Machinery Co. Ltd. (d) | 173,000 | | 835 |
Shinohara Systems of Construction Co. Ltd. | 268 | | 61 |
SHO-BOND Holdings Co. Ltd. | 274,800 | | 4,909 |
So-net M3, Inc. (d) | 925 | | 3,128 |
Sony Financial Holdings, Inc. | 441 | | 1,434 |
SRI Sports Ltd. | 1,058 | | 890 |
Stanley Electric Co. Ltd. | 215,800 | | 2,713 |
Start Today Co. Ltd. (d) | 426 | | 833 |
Sumitomo Rubber Industries Ltd. | 129,500 | | 1,142 |
Sysmex Corp. | 62,100 | | 1,929 |
T&D Holdings, Inc. | 24,450 | | 934 |
Common Stocks - continued |
| Shares | | Value (000s) |
Japan - continued |
Taikisha Ltd. | 275,400 | | $ 3,931 |
Takeei Corp. (d) | 87,100 | | 750 |
The Suruga Bank Ltd. | 150,000 | | 1,412 |
Tocalo Co. Ltd. | 61,800 | | 597 |
Toho Pharmaceutical Co. Ltd. | 34,000 | | 365 |
Tohoku Electric Power Co., Inc. | 43,800 | | 984 |
Tokai Carbon Co. Ltd. | 78,000 | | 409 |
Tokyo Gas Co. Ltd. | 235,000 | | 1,010 |
Toyo Suisan Kaisha Ltd. | 164,000 | | 4,228 |
Tsumura & Co. | 170,100 | | 4,353 |
USJ Co. Ltd. | 4,057 | | 1,677 |
Works Applications Co. Ltd. | 2,985 | | 1,834 |
TOTAL JAPAN | | 185,552 |
Korea (South) - 0.1% |
Taewoong Co. Ltd. | 8,436 | | 412 |
Luxembourg - 0.3% |
GlobeOp Financial Services SA | 741,785 | | 1,853 |
Malaysia - 0.1% |
Top Glove Corp. Bhd | 380,700 | | 408 |
Netherlands - 1.5% |
Brunel International NV | 96,600 | | 1,249 |
Cryo-Save Group NV | 679,500 | | 307 |
Gemalto NV (a) | 77,100 | | 2,160 |
QIAGEN NV (a) | 282,300 | | 4,144 |
SMARTRAC NV (a) | 49,800 | | 671 |
TOTAL NETHERLANDS | | 8,531 |
New Zealand - 0.4% |
Fisher & Paykel Healthcare Corp. | 877,173 | | 1,521 |
The Warehouse Group Ltd. | 401,934 | | 934 |
TOTAL NEW ZEALAND | | 2,455 |
Norway - 1.1% |
IMAREX NOS ASA (a) | 169,600 | | 1,532 |
Norwegian Property ASA | 400,590 | | 597 |
Revus Energy ASA (a) | 261,800 | | 4,014 |
TOTAL NORWAY | | 6,143 |
Common Stocks - continued |
| Shares | | Value (000s) |
Papua New Guinea - 0.5% |
Lihir Gold Ltd. (a) | 750,837 | | $ 936 |
Oil Search Ltd. | 553,039 | | 1,675 |
TOTAL PAPUA NEW GUINEA | | 2,611 |
Singapore - 1.2% |
MobileOne Ltd. | 609,000 | | 542 |
Raffles Medical Group Ltd. | 2,607,000 | | 1,165 |
Singapore Post Ltd. | 1,313,000 | | 630 |
SMRT Corp. Ltd. | 3,369,000 | | 3,549 |
Suntec (REIT) | 1,498,000 | | 717 |
TOTAL SINGAPORE | | 6,603 |
Spain - 1.7% |
Grifols SA | 280,872 | | 5,590 |
Laboratorios Almirall SA | 159,700 | | 1,415 |
Laboratorios Farmaceuticos ROVI SA | 305,800 | | 2,735 |
TOTAL SPAIN | | 9,740 |
Sweden - 1.7% |
Countermine Technologies AB warrants 3/1/10 (a) | 1,085,197 | | 69 |
Elekta AB (B Shares) | 332,800 | | 4,208 |
Intrum Justitia AB | 235,600 | | 2,327 |
Modern Times Group MTG AB (B Shares) | 54,310 | | 1,165 |
Q-Med AB | 207,100 | | 852 |
RNB RETAIL AND BRANDS AB (d) | 274,351 | | 147 |
XCounter AB (a) | 1,108,000 | | 992 |
TOTAL SWEDEN | | 9,760 |
Switzerland - 2.6% |
Actelion Ltd. (Reg.) (a) | 186,820 | | 9,860 |
Arpida Ltd. (a) | 135 | | 1 |
Basilea Pharmaceutica AG (a) | 13,960 | | 1,893 |
Cytos Biotechnology AG (a) | 30,781 | | 932 |
VZ Holding AG | 48,110 | | 1,975 |
TOTAL SWITZERLAND | | 14,661 |
Taiwan - 0.1% |
Sinyi Realty, Inc. | 694,645 | | 769 |
Thailand - 0.2% |
Advanced Info Service PCL (For. Reg.) | 391,200 | | 829 |
Total Access Communication PCL | 897,500 | | 543 |
TOTAL THAILAND | | 1,372 |
Common Stocks - continued |
| Shares | | Value (000s) |
United Kingdom - 19.5% |
Abcam PLC | 354,600 | | $ 2,590 |
ACP Capital Ltd. | 265,625 | | 68 |
Advanced Fluid Connections PLC (a) | 7,009,687 | | 0 |
Afren PLC (a) | 2,379,850 | | 1,826 |
Antisoma PLC (a) | 3,747,300 | | 1,151 |
Appian Technology PLC warrants 7/11/09 (a)(g) | 479,045 | | 0 |
Ark Therapeutics Group PLC (a) | 789,321 | | 534 |
ASOS PLC (a)(d) | 1,784,800 | | 7,491 |
Autonomy Corp. PLC (a) | 330,900 | | 5,246 |
Axis Shield PLC (a) | 502,500 | | 2,396 |
Axon Group PLC | 412,200 | | 4,207 |
Blackstar Investors PLC (a) | 169,235 | | 162 |
Blinkx PLC (a) | 2,063,000 | | 617 |
Bond International Software PLC | 583,666 | | 483 |
Cadogan Petroleum PLC | 1,406,300 | | 1,895 |
Camco International Ltd. (a) | 1,183,202 | | 670 |
Carluccio's PLC | 633,800 | | 761 |
Celsis International PLC (a) | 443,648 | | 996 |
Centurion Electronics PLC (a)(e) | 748,299 | | 0 |
Ceres Power Holdings PLC (a)(d) | 469,300 | | 515 |
China Goldmines PLC (a) | 590,953 | | 341 |
Clerkenwell Ventures PLC (a) | 2,023,000 | | 945 |
Clipper Windpower PLC (a) | 168,400 | | 583 |
Concateno PLC (a) | 1,990,000 | | 2,952 |
Connaught PLC | 385,900 | | 2,131 |
Corac Group PLC (a) | 3,979,104 | | 2,152 |
Craneware PLC | 865,000 | | 2,965 |
CustomVis PLC (a)(e) | 14,020,636 | | 201 |
CVS Group PLC | 374,200 | | 879 |
Dana Petroleum PLC (a) | 208,800 | | 3,359 |
Datacash Group PLC | 1,568,980 | | 5,463 |
Eclipse Energy Co. Ltd. (g) | 102,000 | | 2,956 |
European Nickel PLC (a) | 3,872,700 | | 161 |
Faroe Petroleum PLC (a) | 262,500 | | 289 |
GoIndustry-DoveBid PLC (a) | 1,466,500 | | 155 |
IBS Group Holding Ltd. GDR (Reg. S) | 311,000 | | 1,344 |
Ideal Shopping Direct PLC | 234,592 | | 166 |
IG Group Holdings PLC | 1,008,089 | | 4,709 |
Inova Holding PLC (a) | 1,443,461 | | 0 |
Intec Telecom Systems PLC (a) | 1,837,268 | | 785 |
Jubilee Platinum PLC (a) | 1,657,843 | | 383 |
Keronite PLC (g) | 13,620,267 | | 1,315 |
Common Stocks - continued |
| Shares | | Value (000s) |
United Kingdom - continued |
Landround PLC warrants 12/11/09 (a)(g) | 166,666 | | $ 0 |
Marwyn Value Investors II Ltd. (a) | 1,670,000 | | 1,033 |
Max Petroleum PLC (a)(d) | 2,509,220 | | 542 |
Michael Page International PLC | 686,419 | | 2,223 |
NCC Group Ltd. | 288,215 | | 1,629 |
Nviro Cleantech PLC (a) | 2,175,000 | | 978 |
Powerleague Group PLC | 786,200 | | 352 |
Pureprofile Media PLC (g) | 1,108,572 | | 669 |
Pursuit Dynamics PLC (a)(d) | 804,239 | | 1,058 |
Redhall Group PLC | 370,000 | | 1,088 |
Regenersis PLC (a) | 815,000 | | 962 |
Renewable Energy Generation Ltd. | 1,762,500 | | 2,294 |
RGI International Ltd. (a) | 337,500 | | 184 |
Romag Holdings PLC | 542,000 | | 1,035 |
Royalblue Group PLC | 299,842 | | 2,770 |
Salamander Energy PLC (a) | 272,400 | | 756 |
SDL PLC (a) | 1,230,962 | | 4,826 |
Serco Group PLC | 480,699 | | 2,866 |
Silverdell PLC (a) | 921,000 | | 379 |
Sinclair Pharma PLC (a) | 1,888,371 | | 599 |
Sphere Medical Holding PLC (g) | 420,000 | | 1,149 |
SR Pharma PLC (a) | 2,889,000 | | 802 |
Stem Cell Sciences PLC (a) | 400,000 | | 68 |
SubSea Resources PLC warrants 11/4/09 (a) | 1,805,625 | | 0 |
Synergy Health PLC (d) | 418,515 | | 2,537 |
TMO Biotec (g) | 1,000,000 | | 1,118 |
Toledo Mining Corp. PLC (a) | 625,864 | | 185 |
Triple Plate Junction PLC (a) | 1,162,400 | | 54 |
Ukrproduct Group Ltd. | 988,000 | | 284 |
Unite Group PLC | 379,010 | | 920 |
Valiant Petroleum PLC | 160,000 | | 923 |
Vectura Group PLC (a) | 1,011,260 | | 770 |
Wellstream Holdings PLC | 248,600 | | 1,735 |
Xchanging PLC | 1,557,400 | | 5,547 |
York Pharma PLC (a) | 837,600 | | 243 |
YouGov PLC (a) | 1,865,154 | | 2,345 |
Zenergy Power PLC (a) | 761,280 | | 1,206 |
ZincOx Resources PLC (a) | 570,100 | | 310 |
TOTAL UNITED KINGDOM | | 112,281 |
United States of America - 0.8% |
CTC Media, Inc. (a) | 336,700 | | 2,492 |
Common Stocks - continued |
| Shares | | Value (000s) |
United States of America - continued |
Cyberview Technology, Inc. (a)(e) | 996,527 | | $ 0 |
Frontera Resources Corp. (a) | 1,157,200 | | 802 |
Frontier Mining Ltd. (a) | 6,056,000 | | 148 |
Phorm, Inc. | 251,500 | | 763 |
TyraTech, Inc. (a) | 191,500 | | 133 |
XL TechGroup, Inc. (a) | 1,329,250 | | 0 |
TOTAL UNITED STATES OF AMERICA | | 4,338 |
TOTAL COMMON STOCKS (Cost $810,643) | 521,624 |
Nonconvertible Preferred Stocks - 1.5% |
| | | |
Germany - 1.5% |
Biotest AG (non-vtg.)
(Cost $11,136) | 136,500 | | 8,451 |
Investment Companies - 0.2% |
| | | |
United Kingdom - 0.2% |
Brookwell Ltd. (e)
(Cost $3,644) | 1,856,210 | | 1,451 |
Money Market Funds - 12.9% |
| | | |
Fidelity Cash Central Fund, 1.81% (b) | 42,315,053 | | 42,315 |
Fidelity Securities Lending Cash Central Fund, 2.67% (b)(c) | 31,582,427 | | 31,582 |
TOTAL MONEY MARKET FUNDS (Cost $73,897) | 73,897 |
TOTAL INVESTMENT PORTFOLIO - 105.4% (Cost $899,320) | | 605,423 |
NET OTHER ASSETS - (5.4)% | | (30,973) |
NET ASSETS - 100% | $ 574,450 |
Legend |
(a) Non-income producing |
(b) Affiliated fund that is available only to investment companies and other accounts managed by Fidelity Investments. The rate quoted is the annualized seven-day yield of the fund at period end. A complete unaudited listing of the fund's holdings as of its most recent quarter end is available upon request. |
(c) Investment made with cash collateral received from securities on loan. |
(d) Security or a portion of the security is on loan at period end. |
(e) Affiliated company |
(f) Security exempt from registration under Rule 144A of the Securities Act of 1933. These securities may be resold in transactions exempt from registration, normally to qualified institutional buyers. At the end of the period, the value of these securities amounted to $1,898,000 or 0.3% of net assets. |
(g) Restricted securities - Investment in securities not registered under the Securities Act of 1933 (excluding 144A issues). At the end of the period, the value of restricted securities (excluding 144A issues) amounted to $14,415,000 or 2.5% of net assets. |
Additional information on each holding is as follows: |
Security | Acquisition Date | Acquisition Cost (000s) |
AirSea Lines | 8/4/06 | $ 1,199 |
AirSea Lines warrants 8/4/11 | 8/4/06 | $ 0 |
Appian Technology PLC warrants 7/11/09 | 2/18/05 | $ 0 |
Buried Hill Energy (Cyprus) PCL | 8/18/06 | $ 2,142 |
Eclipse Energy Co. Ltd. | 4/28/05 | $ 1,459 |
Kalahari Energy | 9/1/06 | $ 1,814 |
Keronite PLC | 8/16/06 | $ 1,549 |
Landround PLC warrants 12/11/09 | 12/12/06 | $ 0 |
Pureprofile Media PLC | 5/3/05 - 1/11/06 | $ 1,173 |
Rock Well Petroleum, Inc. | 4/13/06 | $ 1,004 |
Sphere Medical Holding PLC | 8/27/08 | $ 1,310 |
TMO Biotec | 10/27/05 | $ 535 |
Affiliated Central Funds |
Information regarding fiscal year to date income earned by the Fund from investments in Fidelity Central Funds is as follows: |
Fund | Income earned
(Amounts in thousands) |
Fidelity Cash Central Fund | $ 1,569 |
Fidelity Securities Lending Cash Central Fund | 1,694 |
Total | $ 3,263 |
Other Affiliated Issuers |
An affiliated company is a company in which the fund has ownership of at least 5% of the voting securities. Fiscal year to date transactions with companies which are or were affiliates are as follows: |
Affiliate
(Amounts in thousands) | Value, beginning of period | Purchases | Sales Proceeds | Dividend Income | Value,
end of
period |
ADVFN PLC | $ 2,066 | $ - | $ 1,489 | $ - | $ - |
Allied Gold Ltd. | 12,802 | 3,513 | 9,185 | - | - |
Allied Gold Ltd. (United Kingdom) | 410 | 2,249 | 6,735 | - | - |
BioCare Solutions PLC | 1,260 | - | 73 | - | - |
Brookwell Ltd. | - | 3,644 | - | - | 1,451 |
Capital-XX Ltd. | 3,105 | 736 | 1,321 | - | - |
Centurion Electronics PLC | 89 | - | - | - | - |
Corac Group PLC | 5,414 | - | 767 | - | - |
CustomVis PLC | 591 | 421 | 8 | - | 201 |
Cyberview Technology, Inc. | 3,802 | - | - | - | - |
Frontier Mining Ltd. | 1,619 | - | 35 | - | - |
Healthcare Enterprise Group PLC | 373 | - | 274 | - | - |
Hydrodec Group PLC | 3,795 | - | 9,368 | - | - |
Impact Holdings PLC | 650 | - | 188 | - | - |
Motivcom PLC | 5,545 | - | 2,303 | 49 | - |
Phorm, Inc. | 28,335 | - | 5,912 | - | - |
Skywest Airlines Ltd. | 4,437 | - | 3,480 | 222 | - |
SPI Lasers PLC | 3,778 | - | 1,986 | - | - |
Sylvania Resources Ltd. | 25,111 | 640 | 6,598 | - | - |
Sylvania Resources Ltd. (United Kingdom) | 13,425 | 818 | 27,147 | - | - |
Tanzanite One Ltd. | 8,937 | - | 4,053 | 410 | - |
Teleunit SpA | 1,025 | - | 26 | - | 458 |
Visual Defence, Inc. | 1,503 | - | 509 | - | - |
Total | $ 128,072 | $ 12,021 | $ 81,457 | $ 681 | $ 2,110 |
Income Tax Information |
At October 31, 2008, the fund had a capital loss carryforward of approximately $28,799,000 all of which will expire on October 31, 2016. |
See accompanying notes which are an integral part of the financial statements.
Annual Report
Statement of Assets and Liabilities
Amounts in thousands (except per-share amounts) | October 31, 2008 |
Assets | | |
Investment in securities, at value (including securities loaned of $29,883) - See accompanying schedule: Unaffiliated issuers (cost $809,370) | $ 529,416 | |
Fidelity Central Funds (cost $73,897) | 73,897 | |
Other affiliated issuers (cost $16,053) | 2,110 | |
Total Investments (cost $899,320) | | $ 605,423 |
Foreign currency held at value (cost $821) | | 822 |
Receivable for investments sold | | 6,696 |
Receivable for fund shares sold | | 862 |
Dividends receivable | | 2,108 |
Distributions receivable from Fidelity Central Funds | | 136 |
Receivable from investment adviser for expense reductions | | 24 |
Other receivables | | 245 |
Total assets | | 616,316 |
| | |
Liabilities | | |
Payable for investments purchased | $ 8,143 | |
Payable for fund shares redeemed | 1,075 | |
Accrued management fee | 618 | |
Distribution fees payable | 17 | |
Other affiliated payables | 223 | |
Other payables and accrued expenses | 208 | |
Collateral on securities loaned, at value | 31,582 | |
Total liabilities | | 41,866 |
| | |
Net Assets | | $ 574,450 |
Net Assets consist of: | | |
Paid in capital | | $ 905,604 |
Accumulated undistributed net realized gain (loss) on investments and foreign currency transactions | | (37,825) |
Net unrealized appreciation (depreciation) on investments and assets and liabilities in foreign currencies | | (293,329) |
Net Assets | | $ 574,450 |
See accompanying notes which are an integral part of the financial statements.
Annual Report
Statement of Assets and Liabilities - continued
Amounts in thousands (except per-share amounts) | October 31, 2008 |
Calculation of Maximum Offering Price Class A: Net Asset Value and redemption price per share ($13,561 ÷ 1,138.35 shares) | | $ 11.91 |
| | |
Maximum offering price per share (100/94.25 of $11.91) | | $ 12.64 |
Class T:
Net Asset Value and redemption price per share ($13,493 ÷ 1,139.44 shares) | | $ 11.84 |
| | |
Maximum offering price per share (100/96.50 of $11.84) | | $ 12.27 |
Class B:
Net Asset Value and offering price per share ($3,230 ÷ 277.28 shares)A | | $ 11.65 |
| | |
Class C:
Net Asset Value and offering price per share ($5,658 ÷ 483.62 shares)A | | $ 11.70 |
| | |
| | |
International Small Cap:
Net Asset Value, offering price and redemption price per share ($536,291 ÷ 44,591.13 shares) | | $ 12.03 |
| | |
Institutional Class:
Net Asset Value, offering price and redemption price per share ($2,217 ÷ 184.55 shares) | | $ 12.01 |
A Redemption price per share is equal to net asset value less any applicable contingent deferred sales charge.
See accompanying notes which are an integral part of the financial statements.
Annual Report
Financial Statements - continued
Statement of Operations
Amounts in thousands | Year ended October 31, 2008 |
Investment Income | | |
Dividends (including $681 earned from other affiliated issuers) | | $ 17,101 |
Interest | | 348 |
Income from Fidelity Central Funds (including $1,694 from security lending) | | 3,263 |
| | 20,712 |
Less foreign taxes withheld | | (1,152) |
Total income | | 19,560 |
| | |
Expenses | | |
Management fee
Basic fee | $ 10,529 | |
Performance adjustment | 3,402 | |
Transfer agent fees | 2,880 | |
Distribution fees | 416 | |
Accounting and security lending fees | 577 | |
Custodian fees and expenses | 465 | |
Independent trustees' compensation | 6 | |
Registration fees | 84 | |
Audit | 136 | |
Legal | 7 | |
Miscellaneous | 207 | |
Total expenses before reductions | 18,709 | |
Expense reductions | (736) | 17,973 |
Net investment income (loss) | | 1,587 |
Realized and Unrealized Gain (Loss) Net realized gain (loss) on: | | |
Investment securities: | | |
Unaffiliated issuers (net of foreign taxes of $741) | 6,591 | |
Other affiliated issuers | 3,373 | |
Foreign currency transactions | (1,386) | |
Total net realized gain (loss) | | 8,578 |
Change in net unrealized appreciation (depreciation) on: Investment securities (net of decrease in deferred foreign taxes of $751) | (799,901) | |
Assets and liabilities in foreign currencies | 414 | |
Total change in net unrealized appreciation (depreciation) | | (799,487) |
Net gain (loss) | | (790,909) |
Net increase (decrease) in net assets resulting from operations | | $ (789,322) |
See accompanying notes which are an integral part of the financial statements.
Annual Report
Statement of Changes in Net Assets
Amounts in thousands | Year ended
October 31,
2008 | Year ended
October 31,
2007 |
Increase (Decrease) in Net Assets | | |
Operations | | |
Net investment income (loss) | $ 1,587 | $ 7,040 |
Net realized gain (loss) | 8,578 | 289,903 |
Change in net unrealized appreciation (depreciation) | (799,487) | 201,775 |
Net increase (decrease) in net assets resulting
from operations | (789,322) | 498,718 |
Distributions to shareholders from net investment income | (6,293) | (3,787) |
Distributions to shareholders from net realized gain | (288,048) | (351,004) |
Total distributions | (294,341) | (354,791) |
Share transactions - net increase (decrease) | (123,774) | (298,912) |
Redemption fees | 146 | 245 |
Total increase (decrease) in net assets | (1,207,291) | (154,740) |
| | |
Net Assets | | |
Beginning of period | 1,781,741 | 1,936,481 |
End of period (including undistributed net investment income of $0 and $7,171, respectively) | $ 574,450 | $ 1,781,741 |
See accompanying notes which are an integral part of the financial statements.
Annual Report
Financial Highlights - Class A
Years ended October 31, | 2008 | 2007 | 2006 | 2005 | 2004 |
Selected Per-Share Data | | | | | |
Net asset value, beginning of period | $ 31.14 | $ 28.79 | $ 26.69 | $ 21.25 | $ 17.69 |
Income from Investment
Operations | | | | |
Net investment income (loss) C | - G | .03 | (.02) | .05 | .02 |
Net realized and unrealized gain (loss) | (14.03) | 7.97 | 5.05 | 6.16 | 3.83 |
Total from investment operations | (14.03) | 8.00 | 5.03 | 6.21 | 3.85 |
Distributions from net investment income | (.03) | - | (.05) | (.02) | (.02) |
Distributions from net realized gain | (5.18) | (5.65) | (2.89) | (.77) | (.31) |
Total distributions | (5.20) H | (5.65) | (2.94) | (.79) | (.33) |
Redemption fees added to paid in capital C | - G | - G | .01 | .02 | .04 |
Net asset value, end of period | $ 11.91 | $ 31.14 | $ 28.79 | $ 26.69 | $ 21.25 |
Total Return A, B | (53.35)% | 33.43% | 20.22% | 30.16% | 22.36% |
Ratios to Average Net Assets D, F | | | | |
Expenses before reductions | 1.82% | 1.53% | 1.64% | 1.66% | 1.71% |
Expenses net of fee waivers, if any | 1.65% | 1.53% | 1.64% | 1.66% | 1.71% |
Expenses net of all reductions | 1.60% | 1.49% | 1.58% | 1.63% | 1.69% |
Net investment income (loss) | -% I | .10% | (.08)% | .21% | .09% |
Supplemental Data | | | | | |
Net assets, end of period (in millions) | $ 14 | $ 39 | $ 37 | $ 35 | $ 13 |
Portfolio turnover rate E | 113% | 70% | 84% | 79% | 77% |
A Total returns would have been lower had certain expenses not been reduced during the periods shown.
B Total returns do not include the effect of the sales charges.
C Calculated based on average shares outstanding during the period.
D Fees and expenses of the underlying Fidelity Central Funds are not included in the Fund's expense ratio. The Fund indirectly bears its proportionate share of the expenses of any underlying Fidelity Central Funds.
E Amount does not include the portfolio activity of any underlying Fidelity Central Funds.
F Expense ratios reflect operating expenses of the class. Expenses before reductions do not reflect amounts reimbursed by the investment adviser or reductions from brokerage service arrangements or other expense offset arrangements and do not represent the amount paid by the class during periods when reimbursements or reductions occur. Expenses net of fee waivers reflect expenses after reimbursement by the investment adviser but prior to reductions from brokerage service arrangements or other expense offset arrangements. Expenses net of all reductions represent the net expenses paid by the class.
G Amount represents less than $.01 per share.
H Total distributions of $5.20 per share is comprised of distributions from net investment income of $.026 and distributions from net realized gain of $5.176 per share.
I Amount represents less than .01%.
See accompanying notes which are an integral part of the financial statements.
Annual Report
Financial Highlights - Class T
Years ended October 31, | 2008 | 2007 | 2006 | 2005 | 2004 |
Selected Per-Share Data | | | | | |
Net asset value, beginning of period | $ 30.96 | $ 28.64 | $ 26.57 | $ 21.20 | $ 17.68 |
Income from Investment Operations | | | | | |
Net investment income (loss) C | (.05) | (.04) | (.09) | (.01) | (.03) |
Net realized and unrealized gain (loss) | (13.95) | 7.93 | 5.03 | 6.12 | 3.83 |
Total from investment operations | (14.00) | 7.89 | 4.94 | 6.11 | 3.80 |
Distributions from net investment income | - | - | - | - | (.01) |
Distributions from net realized gain | (5.12) | (5.57) | (2.88) | (.76) | (.31) |
Total distributions | (5.12) | (5.57) | (2.88) | (.76) | (.32) |
Redemption fees added to paid in capital C | - G | - G | .01 | .02 | .04 |
Net asset value, end of period | $ 11.84 | $ 30.96 | $ 28.64 | $ 26.57 | $ 21.20 |
Total Return A, B | (53.46)% | 33.07% | 19.93% | 29.72% | 22.07% |
Ratios to Average Net Assets D, F | | | | | |
Expenses before reductions | 2.07% | 1.77% | 1.89% | 1.92% | 1.94% |
Expenses net of fee waivers, if any | 1.90% | 1.77% | 1.89% | 1.91% | 1.94% |
Expenses net of all reductions | 1.86% | 1.73% | 1.83% | 1.88% | 1.92% |
Net investment income (loss) | (.25)% | (.14)% | (.32)% | (.04)% | (.14)% |
Supplemental Data | | | | | |
Net assets, end of period (in millions) | $ 13 | $ 41 | $ 42 | $ 42 | $ 15 |
Portfolio turnover rate E | 113% | 70% | 84% | 79% | 77% |
A Total returns would have been lower had certain expenses not been reduced during the periods shown.
B Total returns do not include the effect of the sales charges.
C Calculated based on average shares outstanding during the period.
D Fees and expenses of the underlying Fidelity Central Funds are not included in the Fund's expense ratio. The Fund indirectly bears its proportionate share of the expenses of any underlying Fidelity Central Funds.
E Amount does not include the portfolio activity of any underlying Fidelity Central Funds.
F Expense ratios reflect operating expenses of the class. Expenses before reductions do not reflect amounts reimbursed by the investment adviser or reductions from brokerage service arrangements or other expense offset arrangements and do not represent the amount paid by the class during periods when reimbursements or reductions occur. Expenses net of fee waivers reflect expenses after reimbursement by the investment adviser but prior to reductions from brokerage service arrangements or other expense offset arrangements. Expenses net of all reductions represent the net expenses paid by the class.
G Amount represents less than $.01 per share.
See accompanying notes which are an integral part of the financial statements.
Annual Report
Financial Highlights - Class B
Years ended October 31, | 2008 | 2007 | 2006 | 2005 | 2004 |
Selected Per-Share Data | | | | | |
Net asset value, beginning of period | $ 30.49 | $ 28.26 | $ 26.24 | $ 20.99 | $ 17.62 |
Income from Investment Operations | | | | | |
Net investment income (loss) C | (.16) | (.18) | (.24) | (.14) | (.16) |
Net realized and unrealized gain (loss) | (13.73) | 7.82 | 4.98 | 6.08 | 3.80 |
Total from investment operations | (13.89) | 7.64 | 4.74 | 5.94 | 3.64 |
Distributions from net realized gain | (4.95) | (5.41) | (2.73) | (.71) | (.31) |
Redemption fees added to paid in capital C | - G | - G | .01 | .02 | .04 |
Net asset value, end of period | $ 11.65 | $ 30.49 | $ 28.26 | $ 26.24 | $ 20.99 |
Total Return A, B | (53.68)% | 32.38% | 19.28% | 29.13% | 21.21% |
Ratios to Average Net Assets D, F | | | | | |
Expenses before reductions | 2.58% | 2.30% | 2.48% | 2.49% | 2.63% |
Expenses net of fee waivers, if any | 2.40% | 2.30% | 2.40% | 2.43% | 2.63% |
Expenses net of all reductions | 2.36% | 2.26% | 2.34% | 2.40% | 2.60% |
Net investment income (loss) | (.75)% | (.66)% | (.84)% | (.56)% | (.83)% |
Supplemental Data | | | | | |
Net assets, end of period (in millions) | $ 3 | $ 11 | $ 11 | $ 13 | $ 5 |
Portfolio turnover rate E | 113% | 70% | 84% | 79% | 77% |
A Total returns would have been lower had certain expenses not been reduced during the periods shown.
B Total returns do not include the effect of the contingent deferred sales charge.
C Calculated based on average shares outstanding during the period.
D Fees and expenses of the underlying Fidelity Central Funds are not included in the Fund's expense ratio. The Fund indirectly bears its proportionate share of the expenses of any underlying Fidelity Central Funds.
E Amount does not include the portfolio activity of any underlying Fidelity Central Funds.
F Expense ratios reflect operating expenses of the class. Expenses before reductions do not reflect amounts reimbursed by the investment adviser or reductions from brokerage service arrangements or other expense offset arrangements and do not represent the amount paid by the class during periods when reimbursements or reductions occur. Expenses net of fee waivers reflect expenses after reimbursement by the investment adviser but prior to reductions from brokerage service arrangements or other expense offset arrangements. Expenses net of all reductions represent the net expenses paid by the class.
G Amount represents less than $.01 per share.
See accompanying notes which are an integral part of the financial statements.
Annual Report
Financial Highlights - Class C
Years ended October 31, | 2008 | 2007 | 2006 | 2005 | 2004 |
Selected Per-Share Data | | | | | |
Net asset value, beginning of period | $ 30.62 | $ 28.33 | $ 26.31 | $ 21.04 | $ 17.64 |
Income from Investment Operations | | | | | |
Net investment income (loss) C | (.16) | (.17) | (.23) | (.13) | (.12) |
Net realized and unrealized gain (loss) | (13.78) | 7.85 | 4.99 | 6.10 | 3.80 |
Total from investment operations | (13.94) | 7.68 | 4.76 | 5.97 | 3.68 |
Distributions from net investment income | - | - | - | - | (.01) |
Distributions from net realized gain | (4.98) | (5.39) | (2.75) | (.72) | (.31) |
Total distributions | (4.98) | (5.39) | (2.75) | (.72) | (.32) |
Redemption fees added to paid in capital C | - G | - G | .01 | .02 | .04 |
Net asset value, end of period | $ 11.70 | $ 30.62 | $ 28.33 | $ 26.31 | $ 21.04 |
Total Return A, B | (53.67)% | 32.39% | 19.34% | 29.22% | 21.43% |
Ratios to Average Net Assets D, F | | | | | |
Expenses before reductions | 2.57% | 2.26% | 2.38% | 2.41% | 2.43% |
Expenses net of fee waivers, if any | 2.40% | 2.26% | 2.38% | 2.41% | 2.43% |
Expenses net of all reductions | 2.36% | 2.22% | 2.32% | 2.38% | 2.40% |
Net investment income (loss) | (.76)% | (.62)% | (.81)% | (.54)% | (.62)% |
Supplemental Data | | | | | |
Net assets, end of period (in millions) | $ 6 | $ 20 | $ 21 | $ 25 | $ 9 |
Portfolio turnover rate E | 113% | 70% | 84% | 79% | 77% |
A Total returns would have been lower had certain expenses not been reduced during the periods shown.
B Total returns do not include the effect of the contingent deferred sales charge.
C Calculated based on average shares outstanding during the period.
D Fees and expenses of the underlying Fidelity Central Funds are not included in the Fund's expense ratio. The Fund indirectly bears its proportionate share of the expenses of any underlying Fidelity Central Funds.
E Amount does not include the portfolio activity of any underlying Fidelity Central Funds.
F Expense ratios reflect operating expenses of the class. Expenses before reductions do not reflect amounts reimbursed by the investment adviser or reductions from brokerage service arrangements or other expense offset arrangements and do not represent the amount paid by the class during periods when reimbursements or reductions occur. Expenses net of fee waivers reflect expenses after reimbursement by the investment adviser but prior to reductions from brokerage service arrangements or other expense offset arrangements. Expenses net of all reductions represent the net expenses paid by the class.
G Amount represents less than $.01 per share.
See accompanying notes which are an integral part of the financial statements.
Annual Report
Financial Highlights - International Small Cap
Years ended October 31, | 2008 | 2007 | 2006 | 2005 | 2004 |
Selected Per-Share Data | | | | | |
Net asset value, beginning of period | $ 31.44 | $ 29.03 | $ 26.89 | $ 21.36 | $ 17.71 |
Income from Investment Operations | | | | | |
Net investment income (loss) B | .03 | .12 | .08 | .15 | .10 |
Net realized and unrealized gain (loss) | (14.14) | 8.03 | 5.08 | 6.19 | 3.84 |
Total from investment operations | (14.11) | 8.15 | 5.16 | 6.34 | 3.94 |
Distributions from net investment income | (.12) | (.07) | (.14) | (.06) | (.02) |
Distributions from net realized gain | (5.18) | (5.67) | (2.89) | (.77) | (.31) |
Total distributions | (5.30)G | (5.74) | (3.03) | (.83) | (.33) |
Redemption fees added to paid in capital B | -F | -F | .01 | .02 | .04 |
Net asset value, end of period | $ 12.03 | $ 31.44 | $ 29.03 | $ 26.89 | $ 21.36 |
Total ReturnA | (53.25)% | 33.82% | 20.65% | 30.67% | 22.84% |
Ratios to Average Net AssetsC, E | | | | | |
Expenses before reductions | 1.49% | 1.19% | 1.28% | 1.28% | 1.30% |
Expenses net of fee waivers, if any | 1.49% | 1.19% | 1.28% | 1.28% | 1.30% |
Expenses net of all reductions | 1.44% | 1.15% | 1.22% | 1.25% | 1.28% |
Net investment income (loss) | .16% | .45% | .29% | .59% | .50% |
Supplemental Data | | | | | |
Net assets, end of period (in millions) | $ 536 | $ 1,664 | $ 1,816 | $ 2,090 | $ 1,091 |
Portfolio turnover rateD | 113% | 70% | 84% | 79% | 77% |
A Total returns would have been lower had certain expenses not been reduced during the periods shown.
B Calculated based on average shares outstanding during the period.
C Fees and expenses of the underlying Fidelity Central Funds are not included in the Fund's expense ratio. The Fund indirectly bears its proportionate share of the expenses of any underlying Fidelity Central Funds.
D Amount does not include the portfolio activity of any underlying Fidelity Central Funds.
E Expense ratios reflect operating expenses of the class. Expenses before reductions do not reflect amounts reimbursed by the investment adviser or reductions from brokerage service arrangements or other expense offset arrangements and do not represent the amount paid by the class during periods when reimbursements or reductions occur. Expenses net of fee waivers reflect expenses after reimbursement by the investment adviser but prior to reductions from brokerage service arrangements or other expense offset arrangements. Expenses net of all reductions represent the net expenses paid by the class.
F Amount represents less than $.01 per share.
G Total distributions of $5.30 per share is comprised of distributions from net investment income of $.120 and distributions from net realized gain of $5.176 per share.
See accompanying notes which are an integral part of the financial statements.
Annual Report
Financial Highlights - Institutional Class
Years ended October 31, | 2008 | 2007 | 2006 | 2005 | 2004 |
Selected Per-Share Data | | | | | |
Net asset value, beginning of period | $ 31.38 | $ 28.99 | $ 26.86 | $ 21.36 | $ 17.72 |
Income from Investment Operations | | | | | |
Net investment income (loss) B | .05 | .12 | .08 | .14 | .10 |
Net realized and unrealized gain (loss) | (14.12) | 8.01 | 5.07 | 6.18 | 3.84 |
Total from investment operations | (14.07) | 8.13 | 5.15 | 6.32 | 3.94 |
Distributions from net investment income | (.12) | (.07) | (.14) | (.07) | (.03) |
Distributions from net realized gain | (5.18) | (5.67) | (2.89) | (.77) | (.31) |
Total distributions | (5.30) G | (5.74) | (3.03) | (.84) | (.34) |
Redemption fees added to paid in capital B | - F | - F | .01 | .02 | .04 |
Net asset value, end of period | $ 12.01 | $ 31.38 | $ 28.99 | $ 26.86 | $ 21.36 |
Total Return A | (53.22)% | 33.84% | 20.65% | 30.59% | 22.84% |
Ratios to Average Net Assets C, E | | | | | |
Expenses before reductions | 1.49% | 1.18% | 1.29% | 1.30% | 1.32% |
Expenses net of fee waivers, if any | 1.40% | 1.18% | 1.29% | 1.30% | 1.32% |
Expenses net of all reductions | 1.35% | 1.14% | 1.23% | 1.27% | 1.29% |
Net investment income (loss) | .25% | .45% | .28% | .57% | .49% |
Supplemental Data | | | | | |
Net assets, end of period (in millions) | $ 2 | $ 8 | $ 9 | $ 7 | $ 3 |
Portfolio turnover rate D | 113% | 70% | 84% | 79% | 77% |
A Total returns would have been lower had certain expenses not been reduced during the periods shown.
B Calculated based on average shares outstanding during the period.
C Fees and expenses of the underlying Fidelity Central Funds are not included in the Fund's expense ratio. The Fund indirectly bears its proportionate share of the expenses of any underlying Fidelity Central Funds.
D Amount does not include the portfolio activity of any underlying Fidelity Central Funds.
E Expense ratios reflect operating expenses of the class. Expenses before reductions do not reflect amounts reimbursed by the investment adviser or reductions from brokerage service arrangements or other expense offset arrangements and do not represent the amount paid by the class during periods when reimbursements or reductions occur. Expenses net of fee waivers reflect expenses after reimbursement by the investment adviser but prior to reductions from brokerage service arrangements or other expense offset arrangements. Expenses net of all reductions represent the net expenses paid by the class.
F Amount represents less than $.01 per share.
G Total distributions of $5.30 per share is comprised of distributions from net investment income of $.120 and distributions from net realized gain of $5.176 per share.
See accompanying notes which are an integral part of the financial statements.
Annual Report
Notes to Financial Statements
For the period ended October 31, 2008
(Amounts in thousands except ratios)
1. Organization.
Fidelity International Small Cap Fund (the Fund) is a fund of Fidelity Investment Trust (the trust) and is authorized to issue an unlimited number of shares. The Fund is currently closed to most new accounts. The trust is registered under the Investment Company Act of 1940, as amended (the 1940 Act), as an open-end management investment company organized as a Massachusetts business trust.
The Fund offers Class A, Class T, Class B, Class C, International Small Cap and Institutional Class shares, each of which has equal rights as to assets and voting privileges. Each class has exclusive voting rights with respect to matters that affect that class. Class B shares will automatically convert to Class A shares after a holding period of seven years from the initial date of purchase. Investment income, realized and unrealized capital gains and losses, the common expenses of the Fund, and certain fund-level expense reductions, if any, are allocated on a pro rata basis to each class based on the relative net assets of each class to the total net assets of the Fund. Each class differs with respect to transfer agent and distribution and service plan fees incurred. Certain expense reductions also differ by class.
2. Investments in Fidelity Central Funds.
The Fund may invest in Fidelity Central Funds, which are open-end investment companies available only to other investment companies and accounts managed by Fidelity Management & Research Company (FMR) and its affiliates. The Fund's Schedule of Investments lists each of the Fidelity Central Funds held as of period end, if any, as an investment of the Fund, but does not include the underlying holdings of each Fidelity Central Fund. As an Investing Fund, the Fund indirectly bears its proportionate share of the expenses of the underlying Fidelity Central Funds.
The Money Market Central Funds seek preservation of capital and current income and are managed by Fidelity Investments Money Management, Inc. (FIMM), an affiliate of FMR.
A complete unaudited list of holdings for each Fidelity Central Fund is available upon request or at the SEC's web site at www.sec.gov. In addition, the financial statements of the Fidelity Central Funds are available on the SEC's web site or upon request.
3. Significant Accounting Policies.
The financial statements have been prepared in conformity with accounting principles generally accepted in the United States of America, which require management to make certain estimates and assumptions at the date of the financial statements. Actual results could differ from those estimates. The following summarizes the significant accounting policies of the Fund:
Annual Report
3. Significant Accounting Policies - continued
Security Valuation. Investments are valued as of 4:00 p.m. Eastern time on the last calendar day of the period. Wherever possible, the Fund uses independent pricing services approved by the Board of Trustees to value its investments.
Equity securities, including restricted securities, for which market quotations are readily available, are valued at the last reported sale price or official closing price as reported by an independent pricing service on the primary market or exchange on which they are traded. In the event there were no sales during the day or closing prices are not available, securities are valued at the last quoted bid price. Investments in open-end mutual funds including the Fidelity Central Funds, are valued at their closing net asset value each business day. Short-term securities with remaining maturities of sixty days or less for which quotations are not readily available are valued at amortized cost, which approximates value.
When current market prices or quotations are not readily available or reliable, valuations may be determined in good faith in accordance with procedures adopted by the Board of Trustees. Factors used in determining value may include significant market or security specific events, changes in interest rates and credit quality, and developments in foreign markets which are monitored by evaluating the performance of ADRs, futures contracts and exchange-traded funds. The frequency with which these procedures are used cannot be predicted and may be utilized to a significant extent. The value of securities used for net asset value (NAV) calculation under these procedures may differ from published prices for the same securities.
Foreign Currency. The Fund uses foreign currency contracts to facilitate transactions in foreign-denominated securities. Losses from these transactions may arise from changes in the value of the foreign currency or if the counterparties do not perform under the contracts' terms.
Foreign-denominated assets, including investment securities, and liabilities are translated into U.S. dollars at the exchange rate at period end. Purchases and sales of investment securities, income and dividends received and expenses denominated in foreign currencies are translated into U.S. dollars at the exchange rate in effect on the transaction date.
The effects of exchange rate fluctuations on investments are included with the net realized and unrealized gain (loss) on investment securities. Other foreign currency transactions resulting in realized and unrealized gain (loss) are disclosed separately.
Annual Report
Notes to Financial Statements - continued
(Amounts in thousands except ratios)
3. Significant Accounting Policies - continued
Investment Transactions and Income. For financial reporting purposes, the Fund's investment holdings and NAV include trades executed through the end of the last business day of the period. The NAV per share for processing shareholder transactions is calculated as of the close of business of the New York Stock Exchange (NYSE), normally 4:00 p.m. Eastern time and includes trades executed through the end of the prior business day. Gains and losses on securities sold are determined on the basis of identified cost. Dividend income is recorded on the ex-dividend date, except for certain dividends from foreign securities where the ex-dividend date may have passed, which are recorded as soon as the Fund is informed of the ex-dividend date. Non-cash dividends included in dividend income, if any, are recorded at the fair market value of the securities received. Distributions received on securities that represent a return of capital or capital gain are recorded as a reduction of cost of investments and/or as a realized gain. The Fund estimates the components of distributions received that may be considered return of capital distributions or capital gain distributions. Interest income and distributions from the Fidelity Central Funds are accrued as earned. Interest income includes coupon interest and amortization of premium and accretion of discount on debt securities. Investment income is recorded net of foreign taxes withheld where recovery of such taxes is uncertain.
Expenses. Most expenses of the trust can be directly attributed to a fund. Expenses which cannot be directly attributed are apportioned among each Fund in the trust. Expense estimates are accrued in the period to which they relate and adjustments are made when actual amounts are known.
Income Tax Information and Distributions to Shareholders. Each year, the Fund intends to qualify as a regulated investment company by distributing substantially all of its taxable income and realized gains under Subchapter M of the Internal Revenue Code and filing its U.S. federal tax return. As a result, no provision for income taxes is required. The Fund is subject to the provisions of FASB Interpretation No. 48, Accounting for Uncertainties in Income Taxes (FIN 48). FIN 48 sets forth a minimum threshold for financial statement recognition of the benefit of a tax position taken or expected to be taken in a tax return. The implementation of FIN 48 did not result in any unrecognized tax benefits in the accompanying financial statements. Each of the Fund's federal tax returns for the prior three fiscal years remains subject to examination by the Internal Revenue Service (IRS). Foreign taxes are provided for based on the Fund's understanding of the tax rules and rates that exist in the foreign markets in which it invests.
Distributions are recorded on the ex-dividend date. Income dividends and capital gain distributions are declared separately for each class. Income and capital gain distributions are determined in accordance with income tax regulations, which may differ from generally accepted accounting principles.
Annual Report
3. Significant Accounting Policies - continued
Income Tax Information and Distributions to Shareholders - continued
Capital accounts within the financial statements are adjusted for permanent book-tax differences. These adjustments have no impact on net assets or the results of operations. Temporary book-tax differences will reverse in a subsequent period.
Book-tax differences are primarily due to, foreign currency transactions, certain foreign taxes, passive foreign investments companies (PFIC), capital loss carryforwards and losses deferred due to wash sales.
The tax-basis components of distributable earnings and the federal tax cost as of period end were as follows:
Unrealized appreciation | $ 29,805 |
Unrealized depreciation | (332,161) |
Net unrealized appreciation (depreciation) | (302,356) |
Capital loss carryforward | (28,799) |
| |
Cost for federal income tax purposes | $ 907,779 |
The tax character of distributions paid was as follows:
| October 31, 2008 | October 31, 2007 |
Ordinary Income | $ 73,752 | $ 43,869 |
Long-term Capital Gains | 220,589 | 310,922 |
Total | $ 294,341 | $ 354,791 |
Short-Term Trading (Redemption) Fees. Shares held in the Fund less than 90 days are subject to a redemption fee equal to 2.00% of the proceeds of the redeemed shares. All redemption fees, including any estimated redemption fees paid by FMR, are retained by the Fund and accounted for as an addition to paid in capital.
New Accounting Pronouncement. In September 2006, Statement of Financial Accounting Standards No. 157, Fair Value Measurements (SFAS 157), was issued and is effective for fiscal years beginning after November 15, 2007. SFAS 157 defines fair value, establishes a framework for measuring fair value and results in expanded disclosures about fair value measurements.
4. Operating Policies.
Repurchase Agreements. FMR has received an Exemptive Order from the Securities and Exchange Commission (the SEC) which permits the Fund and other affiliated entities of FMR to transfer uninvested cash balances into joint trading accounts which are then invested in repurchase agreements. The Fund may also invest directly with institutions in repurchase agreements. Repurchase agreements are collateralized by
Annual Report
Notes to Financial Statements - continued
(Amounts in thousands except ratios)
4. Operating Policies - continued
Repurchase Agreements - continued
government or non-government securities. Upon settlement date, collateral is held in segregated accounts with custodian banks and may be obtained in the event of a default of the counterparty. The Fund monitors, on a daily basis, the value of the collateral to ensure it is at least equal to the principal amount of the repurchase agreement (including accrued interest). In the event of a default by the counterparty, realization of the collateral proceeds could be delayed, during which time the value of the collateral may decline.
Restricted Securities. The Fund may invest in securities that are subject to legal or contractual restrictions on resale. These securities generally may be resold in transactions exempt from registration or to the public if the securities are registered. Disposal of these securities may involve time-consuming negotiations and expense, and prompt sale at an acceptable price may be difficult. Information regarding restricted securities is included at the end of the Fund's Schedule of Investments.
5. Purchases and Sales of Investments.
Purchases and sales of securities, other short-term securities, aggregated $1,347,283 and $1,736,784, respectively.
6. Fees and Other Transactions with Affiliates.
Management Fee. FMR and its affiliates provide the Fund with investment management related services for which the Fund pays a monthly management fee. The management fee is the sum of an individual fund fee rate that is based on an annual rate of .60% of the Fund's average net assets and a group fee rate that averaged .26% during the period. The group fee rate is based upon the average net assets of all the mutual funds advised by FMR. The group fee rate decreases as assets under management increase and increases as assets under management decrease. In addition, the management fee is subject to a performance adjustment (up to a maximum of ± .20% of the Fund's average net assets over a 36 month performance period). The upward or downward adjustment to the management fee is based on the relative investment performance of the retail class of the Fund, International Small Cap as compared to an appropriate benchmark index. For the period, the total annual management fee rate, including the performance adjustment, was 1.14% of the Fund's average net assets.
Distribution and Service Plan. In accordance with Rule 12b-1 of the 1940 Act, the Fund has adopted separate Distribution and Service Plans for each class of shares. Certain classes pay Fidelity Distributors Corporation (FDC), an affiliate of FMR, separate Distribution and Service Fees, each of which is based on an annual percentage of each class' average net assets. In addition, FDC may pay financial intermediaries for selling shares of the Fund and providing shareholder support services.
Annual Report
6. Fees and Other Transactions with Affiliates - continued
Distribution and Service Plan - continued
For the period, the Distribution and Service Fee rates and the total amounts paid to and retained by FDC were as follows:
| Distribution
Fee | Service
Fee | Paid to
FDC | Retained
by FDC |
Class A | 0% | .25% | $ 67 | $ 3 |
Class T | .25% | .25% | 143 | 1 |
Class B | .75% | .25% | 71 | 54 |
Class C | .75% | .25% | 135 | 4 |
| | | $ 416 | $ 62 |
Sales Load. FDC receives a front-end sales charge of up to 5.75% for selling Class A shares, and 3.50% for selling Class T shares, some of which is paid to financial intermediaries for selling shares of the Fund. FDC receives the proceeds of contingent deferred sales charges levied on Class A, Class T, Class B, and Class C redemptions. These charges depend on the holding period. The deferred sales charges range from 5% to 1% for Class B, 1% for Class C, 1.00% to .50% for certain purchases of Class A shares and .25% for certain purchases of Class T shares.
For the period, sales charge amounts retained by FDC were as follows:
| Retained
by FDC |
Class A | $ 2 |
Class T | 2 |
Class B* | 12 |
Class C* | 2 |
| $ 18 |
* When Class B and Class C shares are initially sold, FDC pays commissions from its own resources to financial intermediaries through which the sales are made.
Transfer Agent Fees. Fidelity Investments Institutional Operations Company, Inc. (FIIOC), an affiliate of FMR, is the transfer, dividend disbursing and shareholder servicing agent for each class of the Fund. FIIOC receives account fees and asset-based fees that vary according to the account size and type of account of the shareholders of the respective classes of the Fund. FIIOC pays for typesetting, printing and mailing of shareholder reports, except proxy statements. Prior to January 1, 2008, Fidelity Service Company, Inc. (FSC), also an affiliate of FMR, was the transfer agent for International Small Cap shares.
Annual Report
Notes to Financial Statements - continued
(Amounts in thousands except ratios)
6. Fees and Other Transactions with Affiliates - continued
Transfer Agent Fees - continued
For the period, each class paid the following transfer agent fees:
| Amount | % of
Average
Net Assets |
Class A | $ 82 | .31 |
Class T | 88 | .31 |
Class B | 22 | .31 |
Class C | 41 | .30 |
International Small Cap | 2,636 | .23 |
Institutional Class | 11 | .22 |
| $ 2,880 | |
Accounting and Security Lending Fees. FSC, an affiliate of FMR, maintains the Fund's accounting records. The accounting fee is based on the level of average net assets for the month. Under a separate contract, FSC administers the security lending program. The security lending fee is based on the number and duration of lending transactions.
Brokerage Commissions. The Fund placed a portion of its portfolio transactions with brokerage firms which are affiliates of the investment adviser. The commissions paid to these affiliated firms were $1 for the period.
7. Committed Line of Credit.
The Fund participates with other funds managed by FMR in a $4.2 billion credit facility (the "line of credit") to be utilized for temporary or emergency purposes to fund shareholder redemptions or for other short-term liquidity purposes. The Fund has agreed to pay commitment fees on its pro rata portion of the line of credit, which amounted to $3 and is reflected in Miscellaneous Expense on the Statement of Operations. During the period, there were no borrowings on this line of credit.
8. Security Lending.
The Fund lends portfolio securities from time to time in order to earn additional income. On the settlement date of the loan, the Fund receives collateral (in the form of U.S. Treasury obligations, letters of credit and/or cash) against the loaned securities and maintains collateral in an amount not less than 100% of the market value of the loaned securities during the period of the loan. The market value of the loaned securities is determined at the close of business of the Fund and any additional required collateral is delivered to the Fund on the next business day. If the borrower defaults on its obligation to return the securities loaned because of insolvency or other reasons, a fund could
Annual Report
8. Security Lending - continued
experience delays and costs in recovering the securities loaned or in gaining access to the collateral. Any cash collateral received is invested in the Fidelity Securities Lending Cash Central Fund. The value of loaned securities and cash collateral at period end are disclosed on the Fund's Statement of Assets and Liabilities. Security lending income represents the income earned on investing cash collateral, less fees and expenses associated with the loan, plus any premium payments that may be received on the loan of certain types of securities. Security lending income is presented in the Statement of Operations as a component of income from Fidelity Central Funds.
9. Expense Reductions.
FMR voluntarily agreed to reimburse each class to the extent annual operating expenses exceeded certain levels of average net assets as noted in the table below. Some expenses, for example interest expense, including commitment fees, are excluded from this reimbursement.
The following classes were in reimbursement during the period:
| Expense
Limitations | Reimbursement
from adviser |
Class A | 1.65% | $ 45 |
Class T | 1.90% | 48 |
Class B | 2.40% | 13 |
Class C | 2.40% | 22 |
Institutional Class | 1.40% | 4 |
| | $ 132 |
Many of the brokers with whom FMR places trades on behalf of the Fund provided services to the Fund in addition to trade execution. These services included payments of certain expenses on behalf of the Fund totaling $591 for the period. In addition, through arrangements with the Fund's custodian and each class' transfer agent, credits realized as a result of uninvested cash balances were used to reduce the Fund's expenses. During the period, credits reduced each class' transfer agent expense as noted in the table below.
| Transfer Agent
expense reduction |
International Small Cap | $ 13 |
Annual Report
Notes to Financial Statements - continued
(Amounts in thousands except ratios)
10. Other.
The Fund's organizational documents provide former and current trustees and officers with a limited indemnification against liabilities arising in connection with the performance of their duties to the Fund. In the normal course of business, the Fund may also enter into contracts that provide general indemnifications. The Fund's maximum exposure under these arrangements is unknown as this would be dependent on future claims that may be made against the Fund. The risk of material loss from such claims is considered remote.
In December 2006, the Independent Trustees, with the assistance of independent counsel, completed an investigation regarding gifts, gratuities and business entertainment provided by certain brokers to certain individuals who were employed on FMR's domestic equity trading desk during the period 2002 to 2004. The Independent Trustees and FMR agreed that, despite the absence of proof that the Fidelity mutual funds experienced diminished execution quality as a result of the improper receipt of gifts and business entertainment, the conduct at issue was serious and was worthy of redress. Accordingly, the Independent Trustees requested, and FMR agreed to make, a payment of $42 million plus accrued interest, which equaled approximately $7.3 million, to certain Fidelity mutual funds.
In March 2008, the Trustees approved a method for allocating this payment among the funds and, in total, FMR paid the fund $1, which is recorded in the accompanying Statement of Operations.
In a related administrative order dated March 5, 2008, the U.S. Securities and Exchange Commission ("SEC") announced a settlement with FMR and FMR Co., Inc. (an affiliate of FMR) involving the SEC's regulatory rules for investment advisers and the improper receipt of gifts, gratuities and business entertainment. Without admitting or denying the SEC's findings, FMR agreed to pay an $8 million civil penalty to the United States Treasury.
11. Distributions to Shareholders.
Distributions to shareholders of each class were as follows:
Years ended October 31, | 2008 | 2007 |
From net investment income | | |
Class A | $ 32 | $ - |
International Small Cap | 6,232 | 3,765 |
Institutional Class | 29 | 22 |
Total | $ 6,293 | $ 3,787 |
Annual Report
11. Distributions to Shareholders - continued
Distributions to shareholders of each class were as follows:
Years ended October 31, | 2008 | 2007 |
From net realized gain | | |
Class A | $ 6,370 | $ 6,864 |
Class T | 6,691 | 7,706 |
Class B | 1,698 | 2,092 |
Class C | 3,224 | 3,882 |
International Small Cap | 268,817 | 328,782 |
Institutional Class | 1,248 | 1,678 |
Total | $ 288,048 | $ 351,004 |
12. Share Transactions.
Transactions for each class of shares were as follows:
| Shares | Dollars |
Years ended October 31, | 2008 | 2007 | 2008 | 2007 |
Class A | | | | |
Shares sold | 288 | 268 | $ 6,010 | $ 7,316 |
Reinvestment of distributions | 250 | 252 | 5,922 | 6,096 |
Shares redeemed | (639) | (556) | (12,839) | (14,980) |
Net increase (decrease) | (101) | (36) | $ (907) | $ (1,568) |
Class T | | | | |
Shares sold | 197 | 226 | $ 4,234 | $ 6,120 |
Reinvestment of distributions | 267 | 297 | 6,298 | 7,166 |
Shares redeemed | (643) | (671) | (12,849) | (17,855) |
Net increase (decrease) | (179) | (148) | $ (2,317) | $ (4,569) |
Class B | | | | |
Shares sold | 15 | 19 | $ 298 | $ 519 |
Reinvestment of distributions | 66 | 79 | 1,550 | 1,892 |
Shares redeemed | (155) | (149) | (3,078) | (3,957) |
Net increase (decrease) | (74) | (51) | $ (1,230) | $ (1,546) |
Class C | | | | |
Shares sold | 43 | 56 | $ 916 | $ 1,462 |
Reinvestment of distributions | 110 | 124 | 2,587 | 2,967 |
Shares redeemed | (325) | (277) | (6,282) | (7,298) |
Net increase (decrease) | (172) | (97) | $ (2,779) | $ (2,869) |
Annual Report
Notes to Financial Statements - continued
(Amounts in thousands except ratios)
12. Share Transactions - continued
Transactions for each class of shares were as follows:
| Shares | Dollars |
Years ended October 31, | 2008 | 2007 | 2008 | 2007 |
International Small Cap | | | | |
Shares sold | 6,448 | 7,028 | $ 135,999 | $ 194,115 |
Reinvestment of distributions | 10,463 | 12,767 | 249,850 | 311,000 |
Shares redeemed | (25,232) | (29,445) | (501,269) | (791,655) |
Net increase (decrease) | (8,321) | (9,650) | $ (115,420) | $ (286,540) |
Institutional Class | | | | |
Shares sold | 51 | 47 | $ 1,128 | $ 1,226 |
Reinvestment of distributions | 31 | 39 | 750 | 938 |
Shares redeemed | (145) | (150) | (2,999) | (3,984) |
Net increase (decrease) | (63) | (64) | $ (1,121) | $ (1,820) |
Annual Report
To the Trustees of Fidelity Investment Trust and Shareholders of Fidelity International Small Cap Fund:
We have audited the accompanying statement of assets and liabilities of Fidelity International Small Cap Fund (the Fund), a fund of Fidelity Investment Trust, including the schedule of investments, as of October 31, 2008, and the related statement of operations for the year then ended, the statement of changes in net assets for each of the two years in the period then ended, and the financial highlights for each of the five years in the period then ended. These financial statements and financial highlights are the responsibility of the Fund's management. Our responsibility is to express an opinion on these financial statements and financial highlights based on our audits.
We conducted our audits in accordance with standards of the Public Company Accounting Oversight Board (United States). Those standards require that we plan and perform the audit to obtain reasonable assurance about whether the financial statements and financial highlights are free of material misstatement. The Fund is not required to have, nor were we engaged to perform, an audit of its internal control over financial reporting. Our audits included consideration of internal control over financial reporting as a basis for designing audit procedures that are appropriate in the circumstances, but not for the purpose of expressing an opinion on the effectiveness of the Fund's internal control over financial reporting. Accordingly, we express no such opinion. An audit also includes examining, on a test basis, evidence supporting the amounts and disclosures in the financial statements, assessing the accounting principles used and significant estimates made by management, as well as evaluating the overall financial statement presentation. Our procedures included confirmation of securities owned as of October 31, 2008, by correspondence with the custodians and brokers; where replies were not received from brokers, we performed other auditing procedures. We believe that our audits provide a reasonable basis for our opinion.
In our opinion, the financial statements and financial highlights referred to above present fairly, in all material respects, the financial position of Fidelity International Small Cap Fund as of October 31, 2008, the results of its operations for the year then ended, the changes in its net assets for each of the two years in the period then ended, and its financial highlights for each of the five years in the period then ended, in conformity with accounting principles generally accepted in the United States of America.
/s/ Deloitte & Touche LLP
DELOITTE & TOUCHE LLP
Boston, Massachusetts
December 23, 2008
Annual Report
The Trustees, Member of the Advisory Board, and executive officers of the trust and fund, as applicable, are listed below. The Board of Trustees governs the fund and is responsible for protecting the interests of shareholders. The Trustees are experienced executives who meet periodically throughout the year to oversee the fund's activities, review contractual arrangements with companies that provide services to the fund, and review the fund's performance. Except for Edward C. Johnson and James C. Curvey, each of the Trustees oversees 220 funds advised by FMR or an affiliate. Messrs. Johnson and Curvey oversee 379 funds advised by FMR or an affiliate.
The Trustees hold office without limit in time except that (a) any Trustee may resign; (b) any Trustee may be removed by written instrument, signed by at least two-thirds of the number of Trustees prior to such removal; (c) any Trustee who requests to be retired or who has become incapacitated by illness or injury may be retired by written instrument signed by a majority of the other Trustees; and (d) any Trustee may be removed at any special meeting of shareholders by a two-thirds vote of the outstanding voting securities of the trust. Each Trustee who is not an interested person (as defined in the 1940 Act) (Independent Trustee), shall retire not later than the last day of the calendar year in which his or her 72nd birthday occurs. The Independent Trustees may waive this mandatory retirement age policy with respect to individual Trustees. The executive officers and Advisory Board Member hold office without limit in time, except that any officer and Advisory Board Member may resign or may be removed by a vote of a majority of the Trustees at any regular meeting or any special meeting of the Trustees. Except as indicated, each individual has held the office shown or other offices in the same company for the past five years.
The fund's Statement of Additional Information (SAI) includes more information about the Trustees. To request a free copy, call Fidelity at 1-800-544-8544.
Interested Trustees*:
Correspondence intended for each Trustee who is an interested person may be sent to Fidelity Investments, 82 Devonshire Street, Boston, Massachusetts 02109.
Name, Age; Principal Occupation |
Edward C. Johnson 3d (78) |
| Year of Election or Appointment: 1984 Mr. Johnson is Chairman of the Board of Trustees. Mr. Johnson serves as Chief Executive Officer, Chairman, and a Director of FMR LLC; Chairman and a Director of FMR; Chairman and a Director of Fidelity Research & Analysis Company (FRAC); Chairman and a Director of Fidelity Investments Money Management, Inc.; and Chairman and a Director of FMR Co., Inc. In addition, Mr. Johnson serves as Chairman and Director of FIL Limited. Previously, Mr. Johnson served as President of FMR LLC (2006-2007). |
James C. Curvey (73) |
| Year of Election or Appointment: 2007 Mr. Curvey also serves as Trustee (2007-present) of other investment companies advised by FMR. Mr. Curvey is a Director of FMR and FMR Co., Inc. (2007-present). Mr. Curvey is also Vice Chairman (2006-
present) and Director of FMR LLC. In addition, Mr. Curvey serves as an Overseer for the Boston Symphony Orchestra and a member of the Trustees of Villanova University. |
* Trustees have been determined to be "Interested Trustees" by virtue of, among other things, their affiliation with the trust or various entities under common control with FMR. FMR Corp. merged with and into FMR LLC on October 1, 2007. Any references to FMR LLC for prior periods are deemed to be references to the prior entity.
Independent Trustees:
Correspondence intended for each Independent Trustee (that is, the Trustees other than the Interested Trustees) may be sent to Fidelity Investments, P.O. Box 55235, Boston, Massachusetts 02205-5235.
Name, Age; Principal Occupation |
Dennis J. Dirks (60) |
| Year of Election or Appointment: 2005 Prior to his retirement in May 2003, Mr. Dirks was Chief Operating Officer and a member of the Board of The Depository Trust & Clearing Corporation (DTCC) (1999-2003). He also served as President, Chief Operating Officer, and Board member of The Depository Trust Company (DTC) (1999-2003) and President and Board member of the National Securities Clearing Corporation (NSCC) (1999-2003). In addition, Mr. Dirks served as a Trustee and a member of the Finance Committee of Manhattan College (2005-2008), and as Chief Executive Officer and Board member of the Government Securities Clearing Corporation (2001-2003) and Chief Executive Officer and Board member of the Mortgage-Backed Securities Clearing Corporation (2001-2003). Mr. Dirks also serves as a Trustee and a member of the Finance Committee of AHRC of Nassau County (2006-present). |
Alan J. Lacy (55) |
| Year of Election or Appointment: 2008 Mr. Lacy serves as Senior Adviser (2007-present) of Oak Hill Capital Partners, L.P. (a private equity firm). Mr. Lacy also served as Chief Executive Officer (2000-2005) and Vice Chairman (2005-2006) of Sears Holdings Corporation and Sears, Roebuck and Co. (retail). In addition, Mr. Lacy serves as a member of the Board of Directors of The Western Union Company (global money transfer, 2006-present) and Bristol-Myers Squibb (global pharmaceuticals, 2007-present). Mr. Lacy is a Trustee of the National Parks Conservation Association and The Field Museum of Natural History. |
Ned C. Lautenbach (64) |
| Year of Election or Appointment: 2000 Mr. Lautenbach is Chairman of the Independent Trustees (2006-present). Mr. Lautenbach is an Advisory Partner of Clayton, Dubilier & Rice, Inc. (private equity investment firm). Previously, Mr. Lautenbach was with the International Business Machines Corporation (IBM) from 1968 until his retirement in 1998. Mr. Lautenbach serves as a Director of Eaton Corporation (diversified industrial) as well as the Philharmonic Center for the Arts in Naples, Florida. He also is a member of the Board of Trustees of Fairfield University (2005-present), as well as a member of the Council on Foreign Relations. Previously, Mr. Lautenbach served as a Director of Sony Corporation (2006-2007). |
Joseph Mauriello (64) |
| Year of Election or Appointment: 2008 Prior to his retirement in January 2006, Mr. Mauriello served in numerous senior management positions including Deputy Chairman and Chief Operating Officer (2004-2005), and Vice Chairman of Financial Services (2002-2004) of KPMG LLP US (professional services firm, 1965-2005). Mr. Mauriello currently serves as a member of the Board of Directors of XL Capital Ltd. (global insurance and re-insurance company, 2006-
present) and of Arcadia Resources Inc. (health care services and products, 2007-present). He also served as a Director of the Hamilton Funds of the Bank of New York (2006-2007). |
Cornelia M. Small (64) |
| Year of Election or Appointment: 2005 Ms. Small is a member of the Investment Committee, and Chair (2008-present) and a member of the Board of Trustees of Smith College. Ms. Small also serves on the Investment Committee of the Berkshire Taconic Community Foundation (2008-present). Previously, Ms. Small served as Chairperson of the Investment Committee (2002-2008) of Smith College and as Co-Chair (2000-2003) of the Annual Fund for the Fletcher School of Law and Diplomacy. In addition, she served as Chief Investment Officer, Director of Global Equity Investments, and a member of the Board of Directors of Scudder, Stevens & Clark and Scudder Kemper Investments. |
William S. Stavropoulos (69) |
| Year of Election or Appointment: 2001 Mr. Stavropoulos is Chairman Emeritus of the Board of Directors of The Dow Chemical Company, where he previously served in numerous senior management positions, including President (1993-2000; 2002-
2003), CEO (1995-2000; 2002-2004), Chairman of the Executive Committee (2000-2006), and as a member of the Board of Directors (1990-2006). Currently, he is a Director of Teradata Corporation (data warehousing and technology solutions, 2008-present), Chemical Financial Corporation, Maersk Inc. (industrial conglomerate), Tyco International, Inc. (multinational manufacturing and services, 2007-present), and a member of the Advisory Board for Metalmark Capital (private equity investment firm, 2005-present). He is a special advisor to Clayton, Dubilier & Rice, Inc. (private equity investment). In addition, Mr. Stavropoulos is a member of the University of Notre Dame Advisory Council for the College of Science. |
David M. Thomas (59) |
| Year of Election or Appointment: 2008 Previously, Mr. Thomas served as Executive Chairman (2005-2006) and Chairman and Chief Executive Officer (2000-2005) of IMS Health, Inc. (pharmaceutical and healthcare information solutions). In addition, Mr. Thomas serves as a member of the Board of Directors of Fortune Brands, Inc. (consumer products holding company), and Interpublic Group of Companies, Inc. (marketing communication, 2004-present). |
Michael E. Wiley (58) |
| Year of Election or Appointment: 2008 Mr. Wiley also serves as a member of the Board of Trustees of the University of Tulsa (2000-2006; 2007-present). He serves as a Director of Tesoro Corporation (independent oil refiner and marketer, 2005-present), and a Director of Bill Barrett Corporation (exploration and production company, 2005-present). In addition, he also serves as a Director of Post Oak Bank (privately-held bank, 2004-present). Previously, Mr. Wiley served as a Sr. Energy Advisor of Katzenbach Partners, LLC (consulting firm, 2006-
2007), as an Advisory Director of Riverstone Holdings (private investment firm), Chairman, President, and CEO of Baker Hughes, Inc. (oilfield services company, 2000-2004), and as Director of Spinnaker Exploration Company (exploration and production company, 2001-2005). |
Advisory Board Member and Executive Officers**:
Correspondence intended for each executive officer and Mr. Lynch may be sent to Fidelity Investments, 82 Devonshire Street, Boston, Massachusetts 02109.
Name, Age; Principal Occupation |
Peter S. Lynch (64) |
| Year of Election or Appointment: 2003 Member of the Advisory Board of Fidelity's Equity and High Income Funds. Mr. Lynch is Vice Chairman and a Director of FMR, and Vice Chairman (2001-present) and a Director of FMR Co., Inc. Previously, Mr. Lynch served as a Trustee of the Fidelity funds (1990-2003). In addition, he serves as a Trustee of Boston College and as the Chairman of the Inner-City Scholarship Fund. Previously, Mr. Lynch served on the Special Olympics International Board of Directors (1997-2006). |
Kenneth B. Robins (39) |
| Year of Election or Appointment: 2008 President and Treasurer of Fidelity's Equity and High Income Funds. Mr. Robins is an employee of Fidelity Investments (2004-present). Before joining Fidelity Investments, Mr. Robins worked at KPMG LLP, where he was a partner in KPMG's department of professional practice (2002-2004). |
Walter C. Donovan (46) |
| Year of Election or Appointment: 2007 Vice President of Fidelity's Equity Funds. Mr. Donovan also serves as President of FMR and FMR Co., Inc., and Executive Vice President of Fidelity Investments Money Management, Inc. (2007-present). Previously, Mr. Donovan served as Executive Vice President of FMR and FMR Co., Inc. (2005-2007) and Senior Vice President of FMR (2003-2005) and FMR Co., Inc. (2004-2005). |
Eric M. Wetlaufer (46) |
| Year of Election or Appointment: 2006 Vice President of Fidelity's International Equity Funds. Mr. Wetlaufer also serves as Group Chief Investment Officer of FMR. Mr. Wetlaufer is Chairman, Chief Executive Officer, and President of Fidelity Management & Research (Hong Kong) Limited (2008-present); Chairman, Chief Executive Officer, President, and a Director of Fidelity Management & Research (Japan) Inc. (2008-present); Chairman and Chief Executive Officer (2007-present) and President and a Director (2006-present) of Fidelity Management & Research (U.K.) Inc. and President and a Director of Fidelity Research & Analysis Company (2006-present). Before joining Fidelity Investments in 2005, Mr. Wetlaufer was a partner in Oxhead Capital Management (2004-2005) and a Chief Investment Officer of Putnam Investments (1997-2003). |
Scott C. Goebel (40) |
| Year of Election or Appointment: 2008 Secretary and Chief Legal Officer (CLO) of the Fidelity funds. Mr. Goebel also serves as General Counsel, Secretary, and Senior Vice President of FMR (2008-present); Deputy General Counsel of FMR LLC; Chief Legal Secretary of Fidelity Management & Research (Hong Kong) Limited (2008-present) and Assistant Secretary of Fidelity Management & Research (Japan) Inc. (2008-present). Previously, Mr. Goebel served as Assistant Secretary of the Funds (2007-2008) and as Vice President and Secretary of Fidelity Distributors Corporation (FDC) (2005-2007). |
John B. McGinty, Jr. (46) |
| Year of Election or Appointment: 2008 Assistant Secretary of Fidelity's Equity and High Income Funds. Mr. McGinty is an employee of Fidelity Investments (2004-present). Mr. McGinty also serves as Senior Vice President, Secretary, and Chief Legal Officer of FDC (2007-present). Before joining Fidelity Investments, Mr. McGinty practiced law at Ropes & Gray, LLP. |
Holly C. Laurent (54) |
| Year of Election or Appointment: 2008 Anti-Money Laundering (AML) Officer of the Fidelity funds. Ms. Laurent is an employee of Fidelity Investments. Previously, Ms. Laurent was Senior Vice President and Head of Legal for Fidelity Business Services India Pvt. Ltd. (2006-2008), Senior Vice President, Deputy General Counsel and Group Head for FMR LLC (2005-2006). |
Christine Reynolds (50) |
| Year of Election or Appointment: 2008 Chief Financial Officer of the Fidelity funds. Ms. Reynolds became President of Fidelity Pricing and Cash Management Services (FPCMS) in August 2008. She served as Chief Operating Officer of FPCMS from 2007 through July 2008. Previously, Ms. Reynolds served as President, Treasurer, and Anti-Money Laundering Officer of the Fidelity funds (2004-
2007). Before joining Fidelity Investments, Ms. Reynolds worked at PricewaterhouseCoopers LLP (PwC) (1980-2002), where she was an audit partner with PwC's investment management practice. |
Kenneth A. Rathgeber (61) |
| Year of Election or Appointment: 2004 Chief Compliance Officer of Fidelity's Equity and High Income Funds. Mr. Rathgeber is Chief Compliance Officer of Fidelity Management & Research (Hong Kong) Limited (2008-present), Fidelity Management & Research (Japan) Inc. (2008-present), FMR (2005-present), FMR Co., Inc. (2005-present), Fidelity Management & Research (U.K.) Inc. (2005-
present), Fidelity Research & Analysis Company (2005-present), Fidelity Investments Money Management, Inc. (2005-present), and Strategic Advisers, Inc. (2005-present). |
Bryan A. Mehrmann (47) |
| Year of Election or Appointment: 2005 Deputy Treasurer of the Fidelity funds. Mr. Mehrmann is an employee of Fidelity Investments. Previously, Mr. Mehrmann served as Vice President of Fidelity Investments Institutional Services Group (FIIS)/Fidelity Investments Institutional Operations Corporation, Inc. (FIIOC) Client Services (1998-2004). |
Adrien E. Deberghes (41) |
| Year of Election or Appointment: 2008 Deputy Treasurer of Fidelity's Equity and High Income Funds. Mr. Deberghes is an employee of Fidelity Investments (2008-present). Previously, Mr. Deberghes served as Senior Vice President of Mutual Fund Administration at State Street Corporation (2007-2008), Senior Director of Mutual Fund Administration at Investors Bank & Trust (2005-2007), and Director of Finance for Dunkin' Brands (2000-2005). |
Robert G. Byrnes (41) |
| Year of Election or Appointment: 2005 Assistant Treasurer of the Fidelity funds. Mr. Byrnes is an employee of Fidelity Investments (2005-present). Previously, Mr. Byrnes served as Vice President of Fidelity Pricing and Cash Management Services (FPCMS) (2003-2005). Before joining Fidelity Investments, Mr. Byrnes worked at Deutsche Asset Management where he served as Vice President of the Investment Operations Group (2000-2003). |
Peter L. Lydecker (54) |
| Year of Election or Appointment: 2004 Assistant Treasurer of the Fidelity funds. Mr. Lydecker is an employee of Fidelity Investments. |
Paul M. Murphy (61) |
| Year of Election or Appointment: 2007 Assistant Treasurer of the Fidelity funds. Mr. Murphy is an employee of Fidelity Investments (2007-present). Previously, Mr. Murphy served as Chief Financial Officer of the Fidelity Funds (2005-2006), Vice President and Associate General Counsel of FMR (2007), and Senior Vice President of Fidelity Pricing and Cash Management Services (FPCMS) (1994-2007). |
Gary W. Ryan (50) |
| Year of Election or Appointment: 2005 Assistant Treasurer of the Fidelity funds. Mr. Ryan is an employee of Fidelity Investments. Previously, Mr. Ryan served as Vice President of Fund Reporting in Fidelity Pricing and Cash Management Services (FPCMS) (1999-2005). |
** FMR Corp. merged with and into FMR LLC on October 1, 2007. Any references to FMR LLC for prior periods are deemed to be references to the prior entity.
Annual Report
Class A designates 23%; Class T designates 24%; Class B designates 28%; and Class C designates 28%; of the dividend distributed during the fiscal year as amounts which may be taken into account as a dividend for purposes of the maximum rate under section 1(h)(11) of the Internal Revenue Code.
The amounts per share which represent income derived from sources within, and taxes paid to, foreign countries or possessions of the United States are as follows:
| Pay Date | Income | Taxes |
Class A | 12/10/2007 | $0.304 | $0.0222 |
Class T | 12/10/2007 | $0.285 | $0.0222 |
Class B | 12/10/2007 | $0.243 | $0.0222 |
Class C | 12/10/2007 | $0.249 | $0.0222 |
The fund will notify shareholders in January 2009 of amounts for use in preparing 2008 income tax returns.
Annual Report
A special meeting of the fund's shareholders was held on December 13, 2007. The results of votes taken among shareholders on the proposals before them are reported below. Each vote reported represents one dollar of net asset value held on the record date for the meeting.
PROPOSAL 1 |
To amend the Declaration of Trust to reduce the required quorum for shareholder meetings.A |
| # of
Votes | % of
Votes |
Affirmative | 45,014,793,255.82 | 80.372 |
Against | 6,871,112,667.08 | 12.268 |
Abstain | 2,163,456,438.02 | 3.863 |
Broker
Non-Votes | 1,958,633,563.89 | 3.497 |
TOTAL | 56,007,995,924.81 | 100.000 |
PROPOSAL 2 |
To elect the nominees specified below as Trustees.A |
| # of
Votes | % of
Votes |
James C. Curvey |
Affirmative | 53,384,952,361.03 | 95.317 |
Withheld | 2,623,043,563.78 | 4.683 |
TOTAL | 56,007,995,924.81 | 100.000 |
Dennis J. Dirks |
Affirmative | 53,595,104,608.67 | 95.692 |
Withheld | 2,412,891,316.14 | 4.308 |
TOTAL | 56,007,995,924.81 | 100.000 |
Albert R. Gamper, Jr. |
Affirmative | 53,570,235,221.69 | 95.647 |
Withheld | 2,437,760,703.12 | 4.353 |
TOTAL | 56,007,995,924.81 | 100.000 |
George H. Heilmeier |
Affirmative | 53,166,350,588.50 | 94.926 |
Withheld | 2,841,645,336.31 | 5.074 |
TOTAL | 56,007,995,924.81 | 100.000 |
| # of
Votes | % of
Votes |
Edward C. Johnson 3d |
Affirmative | 53,230,508,654.93 | 95.041 |
Withheld | 2,777,487,269.88 | 4.959 |
TOTAL | 56,007,995,924.81 | 100.000 |
James H. Keyes |
Affirmative | 53,549,161,456.52 | 95.610 |
Withheld | 2,458,834,468.29 | 4.390 |
TOTAL | 56,007,995,924.81 | 100.000 |
Marie L. Knowles |
Affirmative | 53,543,925,066.86 | 95.601 |
Withheld | 2,464,070,857.95 | 4.399 |
TOTAL | 56,007,995,924.81 | 100.000 |
Ned C. Lautenbach |
Affirmative | 53,547,116,322.50 | 95.606 |
Withheld | 2,460,879,602.31 | 4.394 |
TOTAL | 56,007,995,924.81 | 100.000 |
Cornelia M. Small |
Affirmative | 53,564,793,514.25 | 95.638 |
Withheld | 2,443,202,410.56 | 4.362 |
TOTAL | 56,007,995,924.81 | 100.000 |
William S. Stavropoulos |
Affirmative | 53,426,544,502.76 | 95.391 |
Withheld | 2,581,451,422.05 | 4.609 |
TOTAL | 56,007,995,924.81 | 100.000 |
Kenneth L. Wolfe |
Affirmative | 53,229,881,790.63 | 95.040 |
Withheld | 2,778,114,134.18 | 4.960 |
TOTAL | 56,007,995,924.81 | 100.000 |
A Denotes trust-wide proposal and voting results.
Annual Report
Proxy Voting Results
A special meeting of the fund's shareholders was held on April 16, 2008. The results of votes taken among shareholders on the proposal before them are reported below. Each vote reported represents one dollar of net asset value held on the record date for the meeting.
PROPOSAL 1 |
To elect a Board of Trustees.A |
| # of
Votes | % of
Votes |
James C. Curvey |
Affirmative | 44,485,656,811.55 | 94.702 |
Withheld | 2,488,551,854.62 | 5.298 |
TOTAL | 46,974,208,666.17 | 100.000 |
Dennis J. Dirks |
Affirmative | 44,706,671,638.31 | 95.173 |
Withheld | 2,267,537,027.86 | 4.827 |
TOTAL | 46,974,208,666.17 | 100.000 |
Edward C. Johnson 3d |
Affirmative | 44,294,881,638.16 | 94.296 |
Withheld | 2,679,327,028.01 | 5.704 |
TOTAL | 46,974,208,666.17 | 100.000 |
Alan J. Lacy |
Affirmative | 44,685,373,413.16 | 95.127 |
Withheld | 2,288,835,253.01 | 4.873 |
TOTAL | 46,974,208,666.17 | 100.000 |
Ned C. Lautenbach |
Affirmative | 44,634,541,379.41 | 95.019 |
Withheld | 2,339,667,286.76 | 4.981 |
TOTAL | 46,974,208,666.17 | 100.000 |
Joseph Mauriello |
Affirmative | 44,683,962,099.80 | 95.124 |
Withheld | 2,290,246,566.37 | 4.876 |
TOTAL | 46,974,208,666.17 | 100.000 |
Cornelia M. Small |
Affirmative | 44,671,688,375.36 | 95.098 |
Withheld | 2,302,520,290.81 | 4.902 |
TOTAL | 46,974,208,666.17 | 100.000 |
| # of
Votes | % of
Votes |
William S. Stavropoulos |
Affirmative | 44,465,262,087.61 | 94.659 |
Withheld | 2,508,946,578.56 | 5.341 |
TOTAL | 46,974,208,666.17 | 100.000 |
David M. Thomas |
Affirmative | 44,694,340,813.87 | 95.147 |
Withheld | 2,279,867,852.30 | 4.853 |
TOTAL | 46,974,208,666.17 | 100.000 |
Michael E. Wiley |
Affirmative | 44,686,513,174.78 | 95.130 |
Withheld | 2,287,695,491.39 | 4.870 |
TOTAL | 46,974,208,666.17 | 100.000 |
A Denotes trust-wide proposal and voting results.
Annual Report
Board Approval of Investment Advisory Contracts and Management Fees
Fidelity International Small Cap Fund
Each year, typically in July, the Board of Trustees, including the Independent Trustees (together, the Board), votes on the renewal of the management contract and sub-advisory agreements (together, the Advisory Contracts) for the fund. The Board, assisted by the advice of fund counsel and Independent Trustees' counsel, requests and considers a broad range of information throughout the year.
The Board meets regularly and, acting directly and through its separate committees, requests and receives information concerning, and considers at each of its meetings factors that are relevant to, its annual consideration of the renewal of the fund's Advisory Contracts, including the services and support provided to the fund and its shareholders. At the time of the renewal, the Board had 12 standing committees, each composed of Independent Trustees with varying backgrounds, to which the Board has assigned specific subject matter responsibilities in order to enhance effective decision-making by the Board. Each committee has a written charter outlining the structure and purposes of the committee. The Board also meets as needed to consider matters specifically related to the Board's annual consideration of the renewal of Advisory Contracts.
At its July 2008 meeting, the Board of Trustees, including the Independent Trustees, unanimously determined to renew the fund's Advisory Contracts. In reaching its determination, the Board considered all factors it believed relevant, including (i) the nature, extent, and quality of the services to be provided to the fund and its shareholders (including the investment performance of the fund); (ii) the competitiveness of the fund's management fee and total expenses; (iii) the total costs of the services to be provided by and the profits to be realized by Fidelity from its relationship with the fund; (iv) the extent to which economies of scale would be realized as the fund grows; and (v) whether fee levels reflect these economies of scale, if any, for the benefit of fund shareholders. The Board also approved agreements with foreign sub-advisers Fidelity Management & Research (Japan) Inc. and Fidelity Management & Research (Hong Kong) Limited, as well as amendments to the fund's agreement with Fidelity Management & Research (U.K.) Inc.
In considering whether to renew the Advisory Contracts for the fund, the Board ultimately reached a determination, with the assistance of fund counsel and Independent Trustees' counsel and through the exercise of its business judgment, that the renewal of the Advisory Contracts and the compensation to be received by Fidelity under the management contract is consistent with Fidelity's fiduciary duty under applicable law. The Board's decision to renew the Advisory Contracts was not based on any single factor noted above, but rather was based on a comprehensive consideration of all the information provided to the Board at its meetings throughout the year. The Board, in reaching its determination to renew the Advisory Contracts, is aware that shareholders in the fund have a broad range of investment choices available to them, including a wide choice among mutual funds offered by competitors to Fidelity, and that the fund's shareholders, with the opportunity to review and weigh the disclosure provided by the fund in its prospectus and other public disclosures, have chosen to invest in this fund, managed by Fidelity.
Annual Report
Nature, Extent, and Quality of Services Provided. The Board considered staffing within the investment adviser, FMR, and the sub-advisers (together, the Investment Advisers), including the backgrounds of the fund's investment personnel and the fund's investment objective and discipline. The Independent Trustees also had discussions with senior management of Fidelity's investment operations and investment groups. The Board considered the structure of the portfolio manager compensation program and whether this structure provides appropriate incentives.
Resources Dedicated to Investment Management and Support Services. The Board reviewed the size, education, and experience of the Investment Advisers' investment staff, their use of technology, and the Investment Advisers' approach to recruiting, training, and retaining portfolio managers and other research, advisory, and management personnel. The Board noted that Fidelity's analysts have access to a variety of technological tools that enable them to perform both fundamental and quantitative analysis and to specialize in various disciplines. The Board considered Fidelity's extensive global research capabilities that enable the Investment Advisers to aggregate data from various sources in an effort to produce positive investment results. The Board also considered that Fidelity's portfolio managers and analysts have access to daily portfolio attribution that allows for monitoring of a fund's portfolio, as well as an electronic communication system that provides immediate real-time access to research concerning issuers and credit enhancers.
Shareholder and Administrative Services. The Board considered (i) the nature, extent, quality, and cost of advisory, administrative, distribution, and shareholder services performed by the Investment Advisers and their affiliates under the Advisory Contracts and under separate agreements covering transfer agency, pricing and bookkeeping, and securities lending services for the fund; (ii) the nature and extent of the Investment Advisers' supervision of third party service providers, principally custodians and subcustodians; and (iii) the resources devoted to, and the record of compliance with, the fund's compliance policies and procedures. The Board also reviewed the allocation of fund brokerage, including allocations to brokers affiliated with the Investment Advisers, the use of brokerage commissions to pay fund expenses, and the use of "soft" commission dollars to pay for research services. The Board further considered that Fidelity voluntarily pays for market data out of its own resources.
The Board noted that the growth of fund assets across the complex allows Fidelity to reinvest in the development of services designed to enhance the value or convenience of the Fidelity funds as investment vehicles. These services include 24-hour access to account information and market information through phone representatives and over the Internet, and investor education materials and asset allocation tools.
Annual Report
Board Approval of Investment Advisory Contracts and
Management Fees - continued
Investment in a Large Fund Family. The Board considered the benefits to shareholders of investing in a Fidelity fund, including the benefits of investing in a fund that is part of a large family of funds offering a variety of investment disciplines and providing for a large variety of mutual fund investor services. For example, fund shareholders are offered the privilege of exchanging shares of the fund for shares of other Fidelity funds, as set forth in the fund's prospectus, without paying a sales charge. The Board noted that, Fidelity has taken a number of actions over the previous year that benefited particular funds, including (i) dedicating additional resources to investment research and to restructure the investment research teams; (ii) contractually agreeing to reduce the management fees on Fidelity's Institutional Money Market Funds and launching Class IV and Institutional Class of certain of these funds; (iii) reducing the transfer agent fees for the Fidelity Select Portfolios and Investor Class of the VIP funds; and (iv) launching Class K of 29 equity funds as a lower-fee class available to certain employer-sponsored retirement plans.
Investment Performance. The Board considered whether the fund has operated within its investment objective, as well as its record of compliance with its investment restrictions. It also reviewed the fund's absolute investment performance for each class, as well as the fund's relative investment performance for each class measured against (i) a broad-based securities market index, and (ii) a peer group of mutual funds deemed appropriate by the Board over multiple periods. The following charts considered by the Board show, over the one-, three-, and five-year periods ended December 31, 2007, as available, the cumulative total returns of Fidelity International Small Cap (retail class) and Class B of the fund, the cumulative total returns of a broad-based securities market index ("benchmark"), and a range of cumulative total returns of a peer group of mutual funds identified by Lipper Inc. as having an investment objective similar to that of the fund. The returns of Fidelity International Small Cap (retail class) and Class B show the performance of the highest and lowest performing classes, respectively (based on three-year performance). The box within each chart shows the 25th percentile return (bottom of box) and the 75th percentile return (top of box) of the peer group. Returns shown above the box are in the first quartile and returns shown below the box are in the fourth quartile. The percentage beaten numbers noted below each chart correspond to the percentile box and represent the percentage of funds in the peer group whose performance was equal to or lower than that of the class indicated.
Annual Report
Fidelity International Small Cap Fund

The Board reviewed the fund's relative investment performance against its peer group and stated that the performance of Fidelity International Small Cap (retail class) of the fund was in the second quartile for the one- and three-year periods and the first quartile for the five-year period. The Board also stated that the investment performance of Fidelity International Small Cap (retail class) of the fund compared favorably to its benchmark for all the periods shown. The Board considered that the variations in performance among the fund's classes reflect the variations in class expenses, which result in lower performance for higher expense classes.
The Board also considered that the fund's management fee is subject to upward or downward adjustment depending upon whether, and to what extent, the fund's investment performance for the performance period exceeds, or is exceeded by, the record (over the same period) of a Board-approved performance adjustment index. The Board realizes that the performance adjustment provides FMR with a strong economic incentive to seek to achieve superior performance for the fund's shareholders and helps to more closely align the interests of FMR and the fund's shareholders.
The Board considered that FMR has taken steps to refocus and strengthen equity research, equity portfolio management, and compliance.
Based on its review, and giving particular weight to the nature and quality of the resources dedicated by the Investment Advisers to maintain and improve relative performance, the Board concluded that the nature, extent, and quality of the services provided to the fund will benefit the fund's shareholders, particularly in light of the Board's view that the fund's shareholders benefit from investing in a fund that is part of a large family of funds offering a variety of investment disciplines and services.
Annual Report
Board Approval of Investment Advisory Contracts and
Management Fees - continued
Competitiveness of Management Fee and Total Fund Expenses. The Board considered the fund's management fee and total expenses compared to "mapped groups" of competitive funds and classes. Fidelity creates "mapped groups" by combining similar Lipper investment objective categories that have comparable management fee characteristics. Combining Lipper investment objective categories aids the Board's management fee and total expense comparisons by broadening the competitive group used for comparison and by reducing the number of universes to which various Fidelity funds are compared. The Board also considered supplemental information about how the fund's management fee and total expenses ranked relative to groups based on Lipper classifications, which take into account a fund's market capitalization and style.
The Board considered two proprietary management fee comparisons for the 12-month periods shown in the chart below. The group of Lipper funds used by the Board for management fee comparisons is referred to below as the "Total Mapped Group" and, for the reasons explained above, is broader than the Lipper peer group used by the Board for performance comparisons. The Total Mapped Group comparison focuses on a fund's standing relative to the total universe of comparable funds available to investors, in terms of gross management fees before expense reimbursements or caps, and without giving effect to the fund's performance adjustment. "TMG %" represents the percentage of funds in the Total Mapped Group that had management fees that were lower than the fund's. For example, a TMG % of 21% means that 79% of the funds in the Total Mapped Group had higher management fees than the fund. The "Asset-Size Peer Group" (ASPG) comparison focuses on a fund's standing relative to non-Fidelity funds similar in size to the fund within the Total Mapped Group. The ASPG represents at least 15% of the funds in the Total Mapped Group with comparable asset size and management fee characteristics, subject to a minimum of 50 funds (or all funds in the Total Mapped Group if fewer than 50). Additional information, such as the ASPG quartile in which the fund's management fee ranked and the impact of the fund's performance adjustment, is also included in the chart and considered by the Board.
Annual Report
Fidelity International Small Cap Fund

The Board noted that the fund's management fee ranked below the median of its Total Mapped Group and below the median of its ASPG for 2007. The Board also noted the effect of the fund's positive performance adjustment on the fund's management fee ranking. The Board noted that the performance adjustment for each year represents calculations for performance periods that differ from the periods shown in the performance charts above.
Based on its review, the Board concluded that the fund's management fee was fair and reasonable in light of the services that the fund receives and the other factors considered.
In its review of each class's total expenses, the Board considered the fund's management fee as well as other fund or class expenses, as applicable, such as transfer agent fees, pricing and bookkeeping fees, fund-paid 12b-1 fees, and custodial, legal, and audit fees. The Board also noted the effects of any waivers and reimbursements on fees and expenses, as well as the impact of the fund's performance adjustment. As part of its review, the Board also considered current and historical total expenses of each class of the fund compared to competitive fund median expenses. Each class of the fund is compared to those funds and classes in the Total Mapped Group (used by the Board for management fee comparisons) that have a similar sales load structure.
The Board noted that the total expenses of each of Class A, Class B, Class C, Institutional Class, and Fidelity International Small Cap (retail class) ranked below its competitive median for 2007, and the total expenses of Class T ranked above its competitive median for 2007. The Board considered that the total expenses of Class T were above the median primarily because its 12b-1 fee is higher than the typical front-end load class. The Board noted that the fund offers multiple classes, each of which has a different sales load and 12b-1 fee structure, and that the multiple structures are intended to offer a range of pricing options for the intermediary market. The Board also noted that the total expenses of the classes vary primarily by the level of their 12b-1 fees, although differences in transfer agent fees may also cause expenses to vary from class to class.
Annual Report
Board Approval of Investment Advisory Contracts and
Management Fees - continued
In its review of total expenses, the Board also considered Fidelity fee structures and other information on clients that FMR and its affiliates service in other competitive markets, such as other mutual funds advised or subadvised by FMR or its affiliates, pension plan clients, and other institutional clients.
Based on its review, the Board concluded that the total expenses of each class of the fund were reasonable, although in one case above the median of the universe presented for comparison, in light of the services that the fund and its shareholders receive and the other factors considered.
Costs of the Services and Profitability. The Board considered the revenues earned and the expenses incurred by Fidelity in conducting the business of developing, marketing, distributing, managing, administering and servicing the fund and its shareholders. The Board also considered the level of Fidelity's profits in respect of all the Fidelity funds.
On an annual basis, FMR presents to the Board Fidelity's profitability for the fund. Fidelity calculates the profitability for each fund, as well as aggregate profitability for groups of Fidelity funds and all Fidelity funds, using a series of detailed revenue and cost allocation methodologies which originate with the audited books and records of Fidelity. The Audit Committee of the Board reviews any significant changes from the prior year's methodologies.
PricewaterhouseCoopers LLP (PwC), independent registered public accounting firm and auditor to Fidelity and certain Fidelity funds, has been engaged annually by the Board as part of the Board's assessment of the results of Fidelity's profitability analysis. PwC's engagement includes the review and assessment of Fidelity's methodologies used in determining the revenues and expenses attributable to Fidelity's mutual fund business, and completion of agreed-upon procedures surrounding the mathematical accuracy of fund profitability and its conformity to allocation methodologies. After considering PwC's reports issued under the engagement and information provided by Fidelity, the Board believes that while other allocation methods may also be reasonable, Fidelity's profitability methodologies are reasonable in all material respects.
Annual Report
The Board has also reviewed Fidelity's non-fund businesses and any fall-out benefits related to the mutual fund business as well as cases where Fidelity's affiliates may benefit from or be related to the fund's business.
The Board considered the costs of the services provided by and the profits realized by Fidelity in connection with the operation of the fund and determined that the amount of profit is a fair entrepreneurial profit for the management of the fund.
Economies of Scale. The Board considered whether there have been economies of scale in respect of the management of the Fidelity funds, whether the Fidelity funds (including the fund) have appropriately benefited from any such economies of scale, and whether there is potential for realization of any further economies of scale. The Board considered the extent to which the fund will benefit from economies of scale through increased services to the fund, through waivers or reimbursements, or through fee or expense reductions.
The Board recognized that the fund's management contract incorporates a "group fee" structure, which provides for lower group fee rates as total fund assets under FMR's management increase, and for higher group fee rates as total fund assets under FMR's management decrease. FMR determines the group fee rates based on a tiered asset "breakpoint" schedule. The Board considered that the group fee is designed to deliver the benefits of economies of scale to fund shareholders when total fund assets increase, even if assets of any particular fund are unchanged or have declined, because some portion of Fidelity's costs are attributable to services provided to all Fidelity funds, and all funds benefit if those costs can be allocated among more assets. The Board also considered that although the fund is partially closed to new investors, it continues to incur investment management expenses, and marketing and distribution expenses related to the retention of existing shareholders and assets. The Board further noted that the fund may continue to realize benefits from the group fee structure, even though assets may not be expected to grow significantly at the fund level. The Board concluded that, given the group fee structure, fund shareholders will achieve a certain level of economies of scale as assets under FMR's management increase at the fund complex level, regardless of whether Fidelity achieves any such economies of scale.
The Board further concluded that any potential economies of scale are being shared between fund shareholders and Fidelity in an appropriate manner.
Additional Information Requested by the Board. In order to develop fully the factual basis for consideration of the Fidelity funds' Advisory Contracts, the Board requested and received additional information on certain topics, including (i) fund performance trends and actions to be taken by FMR to improve certain funds' overall performance; (ii) portfolio manager changes that have occurred during the past year; (iii) Fidelity's fund profitability methodology, the profitability of certain fund service providers, and profitability trends for certain funds; (iv) Fidelity's compensation structure for portfolio managers and key personnel, including its effects on fund profitability and the extent to which portfolio manager compensation is linked to fund performance; (v) Fidelity's fee structures and rationale for recommending different fees among categories of funds; and (vi) Fidelity's rationale for recommending which funds should have a performance adjustment component as part of their management fees.
Annual Report
Board Approval of Investment Advisory Contracts and
Management Fees - continued
Based on its evaluation of all of the conclusions noted above, and after considering all material factors, the Board ultimately concluded that the advisory fee structures are fair and reasonable, and that the fund's Advisory Contracts should be renewed.
Annual Report
Investment Adviser
Fidelity Management & Research Company
Boston, MA
Investment Sub-Advisers
FMR Co., Inc.
Fidelity Management & Research
(U.K.) Inc.
Fidelity Research & Analysis
Company
FIL Investment Advisors
Fidelity Investments Japan Limited
FIL Investment Advisors (U.K.) Ltd.
Fidelity Management & Research
(Hong Kong) Limited
Fidelity Management & Research
(Japan) Inc.
General Distributor
Fidelity Distributors Corporation
Boston, MA
Transfer and Service Agents
Fidelity Investments Institutional Operations Company, Inc.
Boston, MA
Fidelity Service Company, Inc.
Boston, MA
Custodian
Mellon Bank
Pittsburgh, PA
AISC-UANN-1208
1.793568.105
(Fidelity Investment logo)(registered trademark)
Fidelity Advisor
International Small Cap
Fund - Institutional Class
Annual Report
October 31, 2008
Institutional Class is a class of
Fidelity® International Small Cap Fund
(2_fidelity_logos) (Registered_Trademark)
Contents
Chairman's Message | <Click Here> | Ned Johnson's message to shareholders. |
Performance | <Click Here> | How the fund has done over time. |
Managements' Discussion | <Click Here> | The managers' review of fund performance, strategy and outlook. |
Shareholder Expense Example | <Click Here> | An example of shareholder expenses. |
Investment Changes | <Click Here> | A summary of major shifts in the fund's investments over the past six months. |
Investments | <Click Here> | A complete list of the fund's investments with their market values. |
Financial Statements | <Click Here> | Statements of assets and liabilities, operations, and changes in net assets, as well as financial highlights. |
Notes | <Click Here> | Notes to financial statements. |
Report of Independent Registered Public Accounting Firm | <Click Here> | |
Trustees and Officers | <Click Here> | |
Distributions | <Click Here> | |
Proxy Voting Results | <Click Here> | |
Board Approval of Investment Advisory Contracts and Management Fees | <Click Here> | |
To view a fund's proxy voting guidelines and proxy voting record for the 12-month period ended June 30, visit http://www.fidelity.com (search for "proxy voting guidelines") or visit the Securities and Exchange Commission's (SEC) web site at http://www.sec.gov. You may also call 1-877-208-0098 to request a free copy of the proxy voting guidelines.
Standard & Poor's, S&P and S&P 500 are registered service marks of The McGraw-Hill Companies, Inc. and have been licensed for use by Fidelity Distributors Corporation.
Other third party marks appearing herein are the property of their respective owners.
All other marks appearing herein are registered or unregistered trademarks or service marks of FMR LLC or an affiliated company.
Annual Report
This report and the financial statements contained herein are submitted for the general information of the shareholders of the fund. This report is not authorized for distribution to prospective investors in the fund unless preceded or accompanied by an effective prospectus.
A fund files its complete schedule of portfolio holdings with the SEC for the first and third quarters of each fiscal year on Form N-Q. Forms N-Q are available on the SEC's web site at http://www.sec.gov. A fund's Forms N-Q may be reviewed and copied at the SEC's Public Reference Room in Washington, DC. Information regarding the operation of the SEC's Public Reference Room may be obtained by calling 1-800-SEC-0330. For a complete list of a fund's portfolio holdings, view the most recent holdings listing, semiannual report, or annual report on Fidelity's web site at http://www.fidelity.com or http://www.advisor.fidelity.com, as applicable.
NOT FDIC INSURED · MAY LOSE VALUE · NO BANK GUARANTEE
Neither the fund nor Fidelity Distributors Corporation is a bank.
Annual Report
(photo_of_Edward_C_Johnson_3d)
Dear Shareholder:
Turmoil has been the watchword for the world's securities markets in 2008, with domestic and international stocks down sharply amid the global credit squeeze. A flight to quality boosted returns for U.S. Treasuries, one of the few asset classes with positive results heading into the latter stages of the year. Financial markets are always unpredictable, but there are a number of time-tested principles that can put the historical odds in your favor.
One of the basic tenets is to invest for the long term. Over time, riding out the markets' inevitable ups and downs has proven much more effective than selling into panic or chasing the hottest trend. Even missing only a few of the markets' best days can significantly diminish investor returns. Patience also affords the benefits of compounding - of earning interest on additional income or reinvested dividends and capital gains. There are tax advantages and cost benefits to consider as well. The more you sell, the more taxes you pay, and the more you trade, the higher the costs. While staying the course doesn't eliminate risk, it can considerably lessen the effect of short-term declines.
You can further manage your investing risk through diversification. And today, more than ever, geographic diversification should be taken into account. Studies indicate that asset allocation is the single most important determinant of a portfolio's long-term success. The right mix of stocks, bonds and cash - aligned to your particular risk tolerance and investment objective - is very important. Age-appropriate rebalancing is also an essential aspect of asset allocation. For younger investors, an emphasis on equities - which historically have been the best-performing asset class over time - is encouraged. As investors near their specific goal, such as retirement or sending a child to college, consideration may be given to replacing volatile assets (e.g. common stocks) with more-stable fixed investments (bonds or savings plans).
A third investment principle - investing regularly - can help lower the average cost of your purchases. Investing a certain amount of money each month or quarter helps ensure you won't pay for all your shares at market highs. This strategy - known as dollar cost averaging - also reduces unconstructive "emotion" from investing, helping shareholders avoid selling weak performers just prior to an upswing, or chasing a hot performer just before a correction.
We invite you to contact us via the Internet, through our Investor Centers or over the phone. It is our privilege to provide you the information you need to make the investments that are right for you.
Sincerely,
/s/Edward C. Johnson 3d
Edward C. Johnson 3d
Annual Report
Average annual total return reflects the change in the value of an investment, assuming reinvestment of the class' dividend income and capital gains (the profits earned upon the sale of securities that have grown in value, if any) and assuming a constant rate of performance each year. The $10,000 table and the fund's returns do not reflect the deduction of taxes that a shareholder would pay on fund distributions or the redemption of fund shares. During periods of reimbursement by Fidelity, a fund's total return will be greater than it would be had the reimbursement not occurred. How a fund did yesterday is no guarantee of how it will do tomorrow.
Average Annual Total Returns
Periods ended October 31, 2008 | Past 1
year | Past 5
years | Life of
classA |
Institutional Class B | -53.22% | 3.91% | 13.33% |
A From May 27, 2003.
B The initial offering of Institutional Class shares took place on May 27, 2003. Returns prior to May 27, 2003 are those of International Small Cap, the original class of the fund.
$10,000 Over Life of Fund
Let's say hypothetically that $10,000 was invested in Fidelity Advisor International Small Cap Fund - Institutional Class, a class of the fund, on September 18, 2002, when the fund started. The chart shows how the value of your investment would have changed, and also shows how the MSCI® EAFE® Small Cap Index performed over the same period. The initial offering of Institutional Class took place on May 27, 2003. See above for additional information regarding the performance of Institutional Class.
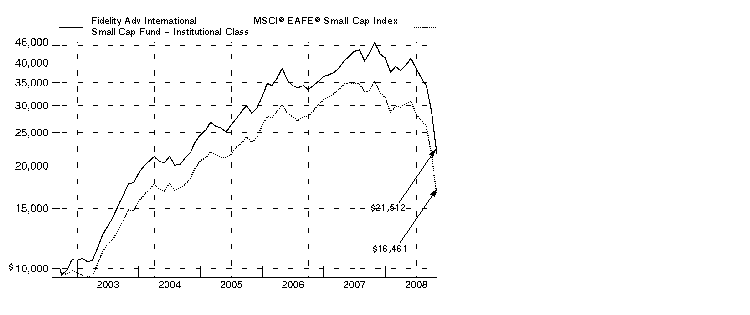
Annual Report
Comments from Colin Stone, Noriko Takahashi and Wilson Wong, Co-Portfolio Managers of Fidelity Advisor International Small Cap Fund
International stocks fell hard during the 12 months ending October 31, 2008, especially during the latter stages of the period and mostly as a result of fallout from the financial crisis in the United States. The viral spread of this financial contagion - which began in the U.S. subprime mortgage market, then seized up the credit markets, hobbled major financial institutions and eventually slowed economic growth worldwide - left virtually no corner of the globe untouched. Developed international equity markets - as gauged by the MSCI® Europe, Australasia, Far East (EAFE®) Index, which monitors established markets outside the U.S. and Canada - fell 46.54%, while the Standard & Poor's 500SM Index, a measure of U.S. stocks, dropped 36.10%. Among countries constituting at least 1% of the EAFE index, Switzerland had the "least worst" showing, falling roughly 32%, followed by Japan, where stocks slid by around 37%. The weakest overall performance came from Belgium, where stocks slipped by nearly 70%. In the United Kingdom, the largest component of the index, equities were down almost 48%. Emerging markets declined 56.22%, as measured by the MSCI Emerging Markets Index.
During the year, the fund's Institutional Class shares returned -53.22%, versus -53.46% for the MSCI Europe, Australasia, Far East Small Cap Index. Stock selection was helpful in Germany and Canada. Conversely, our picks in Japan and Australia hurt. On a sector basis, stock and market selection in health care and materials helped, as did our cash stake, while poor picks in information technology, consumer discretionary, industrials and financials detracted. The Asia-Pacific ex Japan subportfolio beat its benchmark. Contributors included Australia's Incitec Pivot, which benefited from high fertilizer prices earlier in the period and which we sold. An out-of-benchmark stake in Oil Search - based in Papua New Guinea - helped as well. Detractors included Queensland Gas Company, an Australian holding that we sold. The Europe/Middle East/Africa subportfolio edged its benchmark. Western Canadian Coal profited from higher coal prices and was sold from the fund. Swiss biopharmaceutical company Actelion also added value, while U.K.-headquartered Phorm, a global digital technology company, detracted and was sold. The three stocks just mentioned were out-of-index holdings. The Japanese subportfolio trailed its benchmark. Crystal electronic parts maker Nihon Dempa Kogyo - which we sold - and auto parts manufacturer Nippon Seiki detracted. Tsumura, an herbal medicine company, contributed.
The views expressed above reflect those of the portfolio manager(s) only through the end of the period as stated on the cover of this report and do not necessarily represent the views of Fidelity or any other person in the Fidelity organization. Any such views are subject to change at any time based upon market or other conditions and Fidelity disclaims any responsibility to update such views. These views may not be relied on as investment advice and, because investment decisions for a Fidelity fund are based on numerous factors, may not be relied on as an indication of trading intent on behalf of any Fidelity fund.
Annual Report
As a shareholder of the Fund, you incur two types of costs: (1) transaction costs, including sales charges (loads) on purchase payments or redemption proceeds, redemption fees, and (2) ongoing costs, including management fees, distribution and/or service (12b-1) fees and other Fund expenses. This Example is intended to help you understand your ongoing costs (in dollars) of investing in the Fund and to compare these costs with the ongoing costs of investing in other mutual funds.
The Example is based on an investment of $1,000 invested at the beginning of the period and held for the entire period (May 1, 2008 to October 31, 2008).
Actual Expenses
The first line of the accompanying table for each class of the Fund provides information about actual account values and actual expenses. You may use the information in this line, together with the amount you invested, to estimate the expenses that you paid over the period. Simply divide your account value by $1,000.00 (for example, an $8,600 account value divided by $1,000.00 = 8.6), then multiply the result by the number in the first line for a class of the Fund under the heading entitled "Expenses Paid During Period" to estimate the expenses you paid on your account during this period. A small balance maintenance fee of $12.00 that is charged once a year may apply for certain accounts with a value of less than $2,000. This fee is not included in the table below. If it was, the estimate of expenses you paid during the period would be higher, and your ending account value lower, by this amount. In addition, the Fund, as a shareholder in the underlying Fidelity Central Funds, will indirectly bear its pro rata share of the fees and expenses incurred by the underlying Fidelity Central Funds. These fees and expenses are not included in the Fund's annualized expense ratio used to calculate the expense estimate in the table below.
Hypothetical Example for Comparison Purposes
The second line of the accompanying table for each class of the Fund provides information about hypothetical account values and hypothetical expenses based on a Class' actual expense ratio and an assumed rate of return of 5% per year before expenses, which is not the Class' actual return. The hypothetical account values and expenses may not be used to estimate the actual ending account balance or expenses you paid for the period. You may use this information to compare the ongoing costs of investing in the Fund and other funds. To do so, compare this 5% hypothetical example with the 5% hypothetical examples that appear in the shareholder reports of the other funds. A small balance maintenance fee of $12.00 that is charged once a year may apply for certain accounts with a value of less than $2,000. This fee is not included in the table below. If it was, the estimate of expenses you paid during the period would be higher, and your ending account value lower, by this amount. In addition, the Fund, as a shareholder in the underlying Fidelity Central Funds, will indirectly bear its pro rata share of the fees and expenses incurred by the underlying Fidelity Central Funds. These fees and expenses are not included in the Fund's annualized expense ratio used to calculate the expense estimate in the table below.
Annual Report
Please note that the expenses shown in the table are meant to highlight your ongoing costs only and do not reflect any transaction costs. Therefore, the second line of the table is useful in comparing ongoing costs only, and will not help you determine the relative total costs of owning different funds. In addition, if these transactional costs were included, your costs would have been higher.
| Annualized
Expense Ratio | Beginning
Account Value
May 1, 2008 | Ending
Account Value
October 31, 2008 | Expenses Paid
During Period*
May 1, 2008 to October 31, 2008 |
Class A | 1.65% | | | |
Actual | | $ 1,000.00 | $ 546.80 | $ 6.42 |
HypotheticalA | | $ 1,000.00 | $ 1,016.84 | $ 8.36 |
Class T | 1.90% | | | |
Actual | | $ 1,000.00 | $ 546.40 | $ 7.39 |
HypotheticalA | | $ 1,000.00 | $ 1,015.58 | $ 9.63 |
Class B | 2.40% | | | |
Actual | | $ 1,000.00 | $ 545.20 | $ 9.32 |
HypotheticalA | | $ 1,000.00 | $ 1,013.07 | $ 12.14 |
Class C | 2.40% | | | |
Actual | | $ 1,000.00 | $ 545.20 | $ 9.32 |
HypotheticalA | | $ 1,000.00 | $ 1,013.07 | $ 12.14 |
International Small Cap | 1.52% | | | |
Actual | | $ 1,000.00 | $ 547.60 | $ 5.91 |
HypotheticalA | | $ 1,000.00 | $ 1,017.50 | $ 7.71 |
Institutional Class | 1.40% | | | |
Actual | | $ 1,000.00 | $ 547.70 | $ 5.45 |
HypotheticalA | | $ 1,000.00 | $ 1,018.10 | $ 7.10 |
A 5% return per year before expenses
* Expenses are equal to each Class' annualized expense ratio, multiplied by the average account value over the period, multiplied by 184/366 (to reflect the one-half year period).
Annual Report
Geographic Diversification (% of fund's net assets) |
As of October 31, 2008 |
| Japan 32.3% |
| United Kingdom 19.7% |
| United States of America 8.3% |
| Australia 7.6% |
| Germany 6.5% |
| France 5.3% |
| Switzerland 2.6% |
| Sweden 1.7% |
| Spain 1.7% |
| Other 14.3% |

Percentages are adjusted for the effect of futures contracts, if applicable. |
As of April 30, 2008 |
| Japan 29.8% |
| United Kingdom 17.0% |
| Australia 10.5% |
| United States of America 7.3% |
| Canada 3.8% |
| Germany 3.2% |
| France 2.8% |
| Sweden 2.4% |
| Bermuda 2.3% |
| Other 20.9% |

Percentages are adjusted for the effect of futures contracts, if applicable. |
Asset Allocation |
| % of fund's
net assets | % of fund's net assets
6 months ago |
Stocks and Investment Companies | 92.5 | 95.0 |
Bonds | 0.0 | 0.4 |
Short-Term Investments and Net Other Assets | 7.5 | 4.6 |
Top Ten Stocks as of October 31, 2008 |
| % of fund's
net assets | % of fund's net assets
6 months ago |
Actelion Ltd. (Reg.) (Switzerland, Biotechnology) | 1.7 | 1.1 |
Biotest AG (non-vtg.) (Germany, Biotechnology) | 1.5 | 0.0 |
ASOS PLC (United Kingdom, Internet & Catalog Retail) | 1.3 | 0.0 |
Seven Bank Ltd. (Japan, Commercial Banks) | 1.0 | 0.0 |
Grifols SA (Spain, Biotechnology) | 1.0 | 0.7 |
Xchanging PLC (United Kingdom, IT Services) | 1.0 | 0.6 |
Datacash Group PLC (United Kingdom, IT Services) | 1.0 | 0.7 |
Fresenius Medical Care AG (Germany, Health Care Providers & Services) | 0.9 | 0.5 |
Autonomy Corp. PLC (United Kingdom, Software) | 0.9 | 0.6 |
SHO-BOND Holdings Co. Ltd. (Japan, Construction & Engineering) | 0.8 | 0.0 |
| 11.1 | |
Market Sectors as of October 31, 2008 |
| % of fund's
net assets | % of fund's net assets
6 months ago |
Health Care | 19.4 | 8.8 |
Industrials | 14.8 | 14.9 |
Consumer Discretionary | 14.8 | 17.0 |
Information Technology | 12.8 | 12.1 |
Financials | 9.1 | 7.2 |
Materials | 6.4 | 19.4 |
Energy | 6.0 | 8.3 |
Consumer Staples | 5.1 | 6.9 |
Utilities | 2.6 | 0.3 |
Telecommunication Services | 1.3 | 0.5 |
Annual Report
Showing Percentage of Net Assets
Common Stocks - 90.8% |
| Shares | | Value (000s) |
Australia - 7.6% |
AGL Energy Ltd. | 41,046 | | $ 385 |
Allied Gold Ltd. (a) | 1,000,000 | | 143 |
Allied Gold Ltd. (United Kingdom) (a) | 5,974,800 | | 904 |
Ansell Ltd. | 468,802 | | 3,942 |
APA Group unit | 1,269,996 | | 2,474 |
Bradken Ltd. | 84,197 | | 278 |
Centamin Egypt Ltd. (a) | 8,016,301 | | 3,471 |
Centennial Coal Co. Ltd. | 905,473 | | 2,128 |
Charter Hall Group unit | 393,821 | | 117 |
Coal of Africa Ltd. (a) | 2,057,900 | | 1,685 |
CopperCo Ltd. (a) | 3,342,244 | | 219 |
David Jones Ltd. | 1,228,763 | | 2,529 |
DUET Group | 1,515,279 | | 2,417 |
International Ferro Metals | 993,881 | | 570 |
Invocare Ltd. | 35,429 | | 115 |
Iress Market Technology Ltd. | 210,229 | | 653 |
JB Hi-Fi Ltd. (d) | 246,857 | | 1,448 |
Macquarie Airports unit | 520,928 | | 740 |
Metcash Ltd. | 884,235 | | 2,385 |
Monto Minerals Ltd. (a) | 8,206,552 | | 0 |
Monto Minerals Ltd. warrants 5/25/09 (a) | 1,485,934 | | 0 |
Navitas Ltd. | 1,655,222 | | 2,335 |
Northern Iron Ltd. | 614,455 | | 307 |
Nufarm Ltd. | 144,837 | | 1,048 |
SAI Global Ltd. | 345,535 | | 564 |
Seek Ltd. (d) | 428,872 | | 948 |
SP AusNet unit | 3,634,154 | | 2,677 |
Spark Infrastructure Group unit (f) | 1,942,854 | | 1,898 |
Tassal Group Ltd. | 3,261,040 | | 3,800 |
Tattersall's Ltd. | 485,563 | | 813 |
Tianshan Goldfields Ltd. (a) | 744,712 | | 34 |
Tianshan Goldfields Ltd. (United Kingdom) (a) | 200,000 | | 9 |
United Group Ltd. | 280,367 | | 1,778 |
WorleyParsons Ltd. | 30,013 | | 301 |
Wotif.com Holdings Ltd. | 340,639 | | 784 |
TOTAL AUSTRALIA | | 43,899 |
Belgium - 0.1% |
Hansen Transmission International NV | 500,100 | | 839 |
Bermuda - 1.2% |
Oakley Capital Investments Ltd. (a) | 1,458,000 | | 1,508 |
Peace Mark Holdings Ltd. | 788,000 | | 0 |
Common Stocks - continued |
| Shares | | Value (000s) |
Bermuda - continued |
Ports Design Ltd. | 118,500 | | $ 138 |
PureCircle Ltd. | 616,000 | | 1,359 |
Seadrill Ltd. | 133,600 | | 1,286 |
Vtech Holdings Ltd. | 622,000 | | 2,317 |
Zambezi Resources Ltd.: | | | |
CDI (a) | 2,184,593 | | 80 |
warrants 8/31/09 (a) | 108,686 | | 1 |
TOTAL BERMUDA | | 6,689 |
British Virgin Islands - 1.0% |
Albidon Ltd. unit (a) | 1,469,000 | | 455 |
Kalahari Energy (g) | 1,451,000 | | 1,814 |
Playtech Ltd. (d) | 672,400 | | 3,745 |
TOTAL BRITISH VIRGIN ISLANDS | | 6,014 |
Canada - 1.0% |
AirSea Lines (g) | 1,893,338 | | 362 |
AirSea Lines warrants 8/4/11 (a)(g) | 1,862,300 | | 0 |
Aquiline Resources, Inc. (a) | 125,900 | | 108 |
European Goldfields Ltd. (a) | 966,800 | | 1,211 |
Red Back Mining, Inc. (a) | 742,600 | | 2,919 |
Rock Well Petroleum, Inc. (g) | 770,400 | | 125 |
Starfield Resources, Inc. (a) | 4,328,075 | | 933 |
TOTAL CANADA | | 5,658 |
Cayman Islands - 1.1% |
International Consolidated Minerals, Inc. (a) | 852,927 | | 868 |
New Oriental Education & Technology Group, Inc. sponsored ADR (a) | 28,000 | | 1,791 |
New World Department Store China Ltd. | 3,079,000 | | 1,706 |
Orchid Developments Group Ltd. (a) | 1,211,000 | | 1,607 |
Stella International Holdings Ltd. | 134,000 | | 113 |
TOTAL CAYMAN ISLANDS | | 6,085 |
China - 0.2% |
Baidu.com, Inc. sponsored ADR (a) | 2,400 | | 494 |
Yantai Changyu Pioneer Wine Co. (B Shares) | 254,510 | | 791 |
TOTAL CHINA | | 1,285 |
Common Stocks - continued |
| Shares | | Value (000s) |
Cyprus - 1.0% |
Buried Hill Energy (Cyprus) PCL (g) | 1,947,000 | | $ 4,906 |
Mirland Development Corp. PLC (a) | 800,700 | | 1,033 |
TOTAL CYPRUS | | 5,939 |
Denmark - 0.6% |
Vestas Wind Systems AS (a) | 83,500 | | 3,420 |
Egypt - 0.2% |
Talaat Moustafa Group Holding | 1,669,700 | | 1,101 |
Finland - 0.5% |
Nokian Tyres Ltd. | 222,740 | | 2,912 |
France - 5.3% |
Adenclassifieds SA (a) | 26,500 | | 540 |
Altamir Amboise | 311,100 | | 1,247 |
ALTEN (a)(d) | 48,200 | | 1,215 |
April Group | 84,200 | | 3,054 |
Audika SA | 108,200 | | 2,523 |
Boursorama (a) | 165,300 | | 1,206 |
Delachaux SA (d) | 55,900 | | 3,075 |
Devoteam SA | 41,900 | | 753 |
Iliad Group SA | 46,600 | | 3,685 |
Laurent-Perrier Group | 8,460 | | 686 |
LeGuide.com SA (a) | 96,800 | | 1,589 |
Maisons France Confort | 48,000 | | 830 |
Meetic (a)(d) | 236,186 | | 3,330 |
SeLoger.com (a)(d) | 139,000 | | 2,606 |
SR Teleperformance SA | 109,300 | | 2,359 |
Vilmorin & Cie (d) | 18,910 | | 1,848 |
TOTAL FRANCE | | 30,546 |
Germany - 5.0% |
Biotest AG | 1,902 | | 140 |
CTS Eventim AG | 68,800 | | 1,737 |
Delticom AG | 53,200 | | 2,676 |
Fresenius Medical Care AG | 115,410 | | 5,249 |
Gerresheimer AG | 91,400 | | 3,204 |
KROMI Logistik AG (a) | 126,500 | | 684 |
Q-Cells AG (a)(d) | 73,100 | | 2,876 |
Rational AG | 27,500 | | 2,865 |
SMA Solar Technology AG | 55,500 | | 2,506 |
Solarvalue AG | 96,800 | | 90 |
STRATEC Biomedical Systems AG | 53,265 | | 900 |
United Internet AG | 345,300 | | 3,118 |
Common Stocks - continued |
| Shares | | Value (000s) |
Germany - continued |
Vossloh AG | 16,900 | | $ 1,306 |
Wirecard AG | 277,950 | | 1,628 |
TOTAL GERMANY | | 28,979 |
Greece - 0.6% |
Babis Vovos International Technical SA (a) | 132,000 | | 2,474 |
Jumbo SA | 84,900 | | 862 |
TOTAL GREECE | | 3,336 |
Hong Kong - 0.7% |
Cafe de Coral Holdings Ltd. | 1,094,000 | | 1,719 |
Champion (REIT) | 1,652,000 | | 397 |
First Pacific Co. Ltd. | 1,686,000 | | 681 |
Melco International Development Ltd. | 914,000 | | 164 |
Midland Holdings Ltd. | 624,000 | | 260 |
Prosperity (REIT) | 1,329,000 | | 143 |
Sa Sa International Holdings Ltd. | 2,010,000 | | 307 |
Shaw Brothers (Hong Kong) Ltd. | 93,000 | | 101 |
Texwinca Holdings Ltd. | 1,022,000 | | 478 |
TOTAL HONG KONG | | 4,250 |
Indonesia - 0.1% |
PT Bumi Resources Tbk | 2,782,000 | | 364 |
Ireland - 0.2% |
Kenmare Resources PLC (a) | 1,165,900 | | 292 |
Kenmare Resources PLC warrants 7/23/09 (a) | 1,712,500 | | 84 |
Paddy Power PLC (Ireland) | 54,700 | | 933 |
Vimio PLC (a) | 867,300 | | 0 |
TOTAL IRELAND | | 1,309 |
Italy - 0.3% |
Seldovia Native Association, Inc. (SNAI) (a)(d) | 351,590 | | 1,052 |
Teleunit SpA (a)(e) | 12,312,258 | | 458 |
TOTAL ITALY | | 1,510 |
Japan - 32.3% |
Aioi Insurance Co. Ltd. | 235,000 | | 965 |
Air Water, Inc. | 436,000 | | 4,105 |
Airport Facilities Co. Ltd. | 186,700 | | 1,012 |
Alpen Co. Ltd. | 125,700 | | 2,186 |
ARCS Co. Ltd. | 137,800 | | 1,963 |
Arnest One Corp. (d) | 293,900 | | 379 |
C. Uyemura & Co. Ltd. | 59,100 | | 1,679 |
Common Stocks - continued |
| Shares | | Value (000s) |
Japan - continued |
Chiba Bank Ltd. | 256,000 | | $ 1,265 |
Coca-Cola West Japan Co. Ltd. | 90,700 | | 1,819 |
COMSYS Holdings Corp. | 147,000 | | 1,051 |
Create SD Co. Ltd. | 52,700 | | 807 |
Culture Convenience Club Co. Ltd. (d) | 149,700 | | 992 |
Daicel Chemical Industries Ltd. | 588,000 | | 2,120 |
Daihen Corp. (d) | 1,132,000 | | 2,639 |
Daikin Industries Ltd. | 40,700 | | 915 |
Dainippon Screen Manufacturing Co. Ltd. | 336,000 | | 716 |
Daiseki Co. Ltd. | 98,830 | | 2,251 |
Daito Gyorui Co. Ltd. | 13,000 | | 14 |
Don Quijote Co. Ltd. | 113,200 | | 2,053 |
eAccess Ltd. (d) | 3,211 | | 1,493 |
EPS Co. Ltd. | 979 | | 4,100 |
FamilyMart Co. Ltd. | 88,000 | | 3,486 |
Ferrotec Corp. | 93,700 | | 1,037 |
FreeBit Co., Ltd. (a)(d) | 259 | | 1,059 |
Furuno Electric Co. Ltd. | 193,400 | | 1,147 |
Green Hospital Supply, Inc. (a)(d) | 2,215 | | 755 |
Hamamatsu Photonics KK | 68,500 | | 1,520 |
Hisaka Works Ltd. | 81,000 | | 934 |
Hisamitsu Pharmaceutical Co., Inc. | 37,100 | | 1,546 |
Hitachi Construction Machinery Co. Ltd. (d) | 79,800 | | 926 |
Hitachi Metals Ltd. | 105,000 | | 789 |
Hitachi Transport System Ltd. | 80,700 | | 1,079 |
Hokuto Corp. | 97,500 | | 2,582 |
Ichirokudo Co. Ltd. (a) | 822 | | 397 |
Ichiyoshi Securities Co. Ltd. | 185,300 | | 1,484 |
Iino Kaiun Kaisha Ltd. (d) | 315,600 | | 1,613 |
Inpex Corp. | 447 | | 2,595 |
Itochu Corp. | 339,000 | | 1,791 |
Japan Asia Investment Co. Ltd. (d) | 805,000 | | 611 |
JFE Shoji Holdings, Inc. | 272,000 | | 859 |
Jupiter Telecommunications Co. | 3,036 | | 2,050 |
Kakaku.com, Inc. (d) | 1,216 | | 3,577 |
Kinki Sharyo Co. Ltd. (d) | 234,000 | | 862 |
Kuraray Co. Ltd. | 370,500 | | 2,835 |
McDonald's Holdings Co. (Japan) Ltd. | 108,500 | | 1,657 |
Meiko Electronics Co. Ltd. | 94,200 | | 1,066 |
Mitsubishi UFJ Lease & Finance Co. Ltd. | 118,280 | | 2,832 |
Nabtesco Corp. | 145,000 | | 884 |
Namco Bandai Holdings, Inc. | 414,000 | | 4,257 |
Common Stocks - continued |
| Shares | | Value (000s) |
Japan - continued |
Nihon Kohden Corp. | 206,100 | | $ 3,481 |
Nihon M&A Center, Inc. (d) | 291 | | 1,122 |
Nihon Nohyaku Co. Ltd. (d) | 361,000 | | 1,958 |
Nikon Corp. | 124,000 | | 1,747 |
Nippon Seiki Co. Ltd. | 229,000 | | 1,516 |
Nissha Printing Co. Ltd. (d) | 12,900 | | 717 |
NOF Corp. | 384,000 | | 1,101 |
NS Solutions Corp. | 97,400 | | 1,184 |
Obara Corp. | 50 | | 0 |
Oenon Holdings, Inc. | 663,000 | | 1,761 |
Oiles Corp. | 48 | | 1 |
Onward Holdings Co. Ltd. | 76,000 | | 556 |
ORIX JREIT, Inc. | 733 | | 3,360 |
Otsuka Corp. | 46,500 | | 2,339 |
Pigeon Corp. (d) | 80,500 | | 2,339 |
Point, Inc. | 85,540 | | 4,201 |
R-Tech Ueno Ltd. (d) | 70 | | 409 |
Rengo Co. Ltd. (d) | 649,000 | | 3,309 |
Resona Holdings, Inc. (d) | 1,125 | | 1,180 |
Rohto Pharmaceutical Co. Ltd. | 309,000 | | 3,503 |
Roland DG Corp. (d) | 53,600 | | 668 |
Saizeriya Co. Ltd. (d) | 270,400 | | 4,033 |
Sankyu, Inc. | 913,000 | | 2,877 |
Santen Pharmaceutical Co. Ltd. | 128,000 | | 3,273 |
Sato Corp. | 351,000 | | 3,508 |
Sec Carbon Ltd. | 126,000 | | 413 |
Sega Sammy Holdings, Inc. (d) | 299,300 | | 2,263 |
Sekisui Chemical Co. Ltd. | 216,000 | | 1,262 |
Seven Bank Ltd. | 1,972 | | 5,680 |
Shimadzu Corp. | 395,000 | | 2,703 |
Shin Nippon Biomedical Laboratories Ltd. (d) | 154,000 | | 1,976 |
Shin-Kobe Electric Machinery Co. Ltd. (d) | 173,000 | | 835 |
Shinohara Systems of Construction Co. Ltd. | 268 | | 61 |
SHO-BOND Holdings Co. Ltd. | 274,800 | | 4,909 |
So-net M3, Inc. (d) | 925 | | 3,128 |
Sony Financial Holdings, Inc. | 441 | | 1,434 |
SRI Sports Ltd. | 1,058 | | 890 |
Stanley Electric Co. Ltd. | 215,800 | | 2,713 |
Start Today Co. Ltd. (d) | 426 | | 833 |
Sumitomo Rubber Industries Ltd. | 129,500 | | 1,142 |
Sysmex Corp. | 62,100 | | 1,929 |
T&D Holdings, Inc. | 24,450 | | 934 |
Common Stocks - continued |
| Shares | | Value (000s) |
Japan - continued |
Taikisha Ltd. | 275,400 | | $ 3,931 |
Takeei Corp. (d) | 87,100 | | 750 |
The Suruga Bank Ltd. | 150,000 | | 1,412 |
Tocalo Co. Ltd. | 61,800 | | 597 |
Toho Pharmaceutical Co. Ltd. | 34,000 | | 365 |
Tohoku Electric Power Co., Inc. | 43,800 | | 984 |
Tokai Carbon Co. Ltd. | 78,000 | | 409 |
Tokyo Gas Co. Ltd. | 235,000 | | 1,010 |
Toyo Suisan Kaisha Ltd. | 164,000 | | 4,228 |
Tsumura & Co. | 170,100 | | 4,353 |
USJ Co. Ltd. | 4,057 | | 1,677 |
Works Applications Co. Ltd. | 2,985 | | 1,834 |
TOTAL JAPAN | | 185,552 |
Korea (South) - 0.1% |
Taewoong Co. Ltd. | 8,436 | | 412 |
Luxembourg - 0.3% |
GlobeOp Financial Services SA | 741,785 | | 1,853 |
Malaysia - 0.1% |
Top Glove Corp. Bhd | 380,700 | | 408 |
Netherlands - 1.5% |
Brunel International NV | 96,600 | | 1,249 |
Cryo-Save Group NV | 679,500 | | 307 |
Gemalto NV (a) | 77,100 | | 2,160 |
QIAGEN NV (a) | 282,300 | | 4,144 |
SMARTRAC NV (a) | 49,800 | | 671 |
TOTAL NETHERLANDS | | 8,531 |
New Zealand - 0.4% |
Fisher & Paykel Healthcare Corp. | 877,173 | | 1,521 |
The Warehouse Group Ltd. | 401,934 | | 934 |
TOTAL NEW ZEALAND | | 2,455 |
Norway - 1.1% |
IMAREX NOS ASA (a) | 169,600 | | 1,532 |
Norwegian Property ASA | 400,590 | | 597 |
Revus Energy ASA (a) | 261,800 | | 4,014 |
TOTAL NORWAY | | 6,143 |
Common Stocks - continued |
| Shares | | Value (000s) |
Papua New Guinea - 0.5% |
Lihir Gold Ltd. (a) | 750,837 | | $ 936 |
Oil Search Ltd. | 553,039 | | 1,675 |
TOTAL PAPUA NEW GUINEA | | 2,611 |
Singapore - 1.2% |
MobileOne Ltd. | 609,000 | | 542 |
Raffles Medical Group Ltd. | 2,607,000 | | 1,165 |
Singapore Post Ltd. | 1,313,000 | | 630 |
SMRT Corp. Ltd. | 3,369,000 | | 3,549 |
Suntec (REIT) | 1,498,000 | | 717 |
TOTAL SINGAPORE | | 6,603 |
Spain - 1.7% |
Grifols SA | 280,872 | | 5,590 |
Laboratorios Almirall SA | 159,700 | | 1,415 |
Laboratorios Farmaceuticos ROVI SA | 305,800 | | 2,735 |
TOTAL SPAIN | | 9,740 |
Sweden - 1.7% |
Countermine Technologies AB warrants 3/1/10 (a) | 1,085,197 | | 69 |
Elekta AB (B Shares) | 332,800 | | 4,208 |
Intrum Justitia AB | 235,600 | | 2,327 |
Modern Times Group MTG AB (B Shares) | 54,310 | | 1,165 |
Q-Med AB | 207,100 | | 852 |
RNB RETAIL AND BRANDS AB (d) | 274,351 | | 147 |
XCounter AB (a) | 1,108,000 | | 992 |
TOTAL SWEDEN | | 9,760 |
Switzerland - 2.6% |
Actelion Ltd. (Reg.) (a) | 186,820 | | 9,860 |
Arpida Ltd. (a) | 135 | | 1 |
Basilea Pharmaceutica AG (a) | 13,960 | | 1,893 |
Cytos Biotechnology AG (a) | 30,781 | | 932 |
VZ Holding AG | 48,110 | | 1,975 |
TOTAL SWITZERLAND | | 14,661 |
Taiwan - 0.1% |
Sinyi Realty, Inc. | 694,645 | | 769 |
Thailand - 0.2% |
Advanced Info Service PCL (For. Reg.) | 391,200 | | 829 |
Total Access Communication PCL | 897,500 | | 543 |
TOTAL THAILAND | | 1,372 |
Common Stocks - continued |
| Shares | | Value (000s) |
United Kingdom - 19.5% |
Abcam PLC | 354,600 | | $ 2,590 |
ACP Capital Ltd. | 265,625 | | 68 |
Advanced Fluid Connections PLC (a) | 7,009,687 | | 0 |
Afren PLC (a) | 2,379,850 | | 1,826 |
Antisoma PLC (a) | 3,747,300 | | 1,151 |
Appian Technology PLC warrants 7/11/09 (a)(g) | 479,045 | | 0 |
Ark Therapeutics Group PLC (a) | 789,321 | | 534 |
ASOS PLC (a)(d) | 1,784,800 | | 7,491 |
Autonomy Corp. PLC (a) | 330,900 | | 5,246 |
Axis Shield PLC (a) | 502,500 | | 2,396 |
Axon Group PLC | 412,200 | | 4,207 |
Blackstar Investors PLC (a) | 169,235 | | 162 |
Blinkx PLC (a) | 2,063,000 | | 617 |
Bond International Software PLC | 583,666 | | 483 |
Cadogan Petroleum PLC | 1,406,300 | | 1,895 |
Camco International Ltd. (a) | 1,183,202 | | 670 |
Carluccio's PLC | 633,800 | | 761 |
Celsis International PLC (a) | 443,648 | | 996 |
Centurion Electronics PLC (a)(e) | 748,299 | | 0 |
Ceres Power Holdings PLC (a)(d) | 469,300 | | 515 |
China Goldmines PLC (a) | 590,953 | | 341 |
Clerkenwell Ventures PLC (a) | 2,023,000 | | 945 |
Clipper Windpower PLC (a) | 168,400 | | 583 |
Concateno PLC (a) | 1,990,000 | | 2,952 |
Connaught PLC | 385,900 | | 2,131 |
Corac Group PLC (a) | 3,979,104 | | 2,152 |
Craneware PLC | 865,000 | | 2,965 |
CustomVis PLC (a)(e) | 14,020,636 | | 201 |
CVS Group PLC | 374,200 | | 879 |
Dana Petroleum PLC (a) | 208,800 | | 3,359 |
Datacash Group PLC | 1,568,980 | | 5,463 |
Eclipse Energy Co. Ltd. (g) | 102,000 | | 2,956 |
European Nickel PLC (a) | 3,872,700 | | 161 |
Faroe Petroleum PLC (a) | 262,500 | | 289 |
GoIndustry-DoveBid PLC (a) | 1,466,500 | | 155 |
IBS Group Holding Ltd. GDR (Reg. S) | 311,000 | | 1,344 |
Ideal Shopping Direct PLC | 234,592 | | 166 |
IG Group Holdings PLC | 1,008,089 | | 4,709 |
Inova Holding PLC (a) | 1,443,461 | | 0 |
Intec Telecom Systems PLC (a) | 1,837,268 | | 785 |
Jubilee Platinum PLC (a) | 1,657,843 | | 383 |
Keronite PLC (g) | 13,620,267 | | 1,315 |
Common Stocks - continued |
| Shares | | Value (000s) |
United Kingdom - continued |
Landround PLC warrants 12/11/09 (a)(g) | 166,666 | | $ 0 |
Marwyn Value Investors II Ltd. (a) | 1,670,000 | | 1,033 |
Max Petroleum PLC (a)(d) | 2,509,220 | | 542 |
Michael Page International PLC | 686,419 | | 2,223 |
NCC Group Ltd. | 288,215 | | 1,629 |
Nviro Cleantech PLC (a) | 2,175,000 | | 978 |
Powerleague Group PLC | 786,200 | | 352 |
Pureprofile Media PLC (g) | 1,108,572 | | 669 |
Pursuit Dynamics PLC (a)(d) | 804,239 | | 1,058 |
Redhall Group PLC | 370,000 | | 1,088 |
Regenersis PLC (a) | 815,000 | | 962 |
Renewable Energy Generation Ltd. | 1,762,500 | | 2,294 |
RGI International Ltd. (a) | 337,500 | | 184 |
Romag Holdings PLC | 542,000 | | 1,035 |
Royalblue Group PLC | 299,842 | | 2,770 |
Salamander Energy PLC (a) | 272,400 | | 756 |
SDL PLC (a) | 1,230,962 | | 4,826 |
Serco Group PLC | 480,699 | | 2,866 |
Silverdell PLC (a) | 921,000 | | 379 |
Sinclair Pharma PLC (a) | 1,888,371 | | 599 |
Sphere Medical Holding PLC (g) | 420,000 | | 1,149 |
SR Pharma PLC (a) | 2,889,000 | | 802 |
Stem Cell Sciences PLC (a) | 400,000 | | 68 |
SubSea Resources PLC warrants 11/4/09 (a) | 1,805,625 | | 0 |
Synergy Health PLC (d) | 418,515 | | 2,537 |
TMO Biotec (g) | 1,000,000 | | 1,118 |
Toledo Mining Corp. PLC (a) | 625,864 | | 185 |
Triple Plate Junction PLC (a) | 1,162,400 | | 54 |
Ukrproduct Group Ltd. | 988,000 | | 284 |
Unite Group PLC | 379,010 | | 920 |
Valiant Petroleum PLC | 160,000 | | 923 |
Vectura Group PLC (a) | 1,011,260 | | 770 |
Wellstream Holdings PLC | 248,600 | | 1,735 |
Xchanging PLC | 1,557,400 | | 5,547 |
York Pharma PLC (a) | 837,600 | | 243 |
YouGov PLC (a) | 1,865,154 | | 2,345 |
Zenergy Power PLC (a) | 761,280 | | 1,206 |
ZincOx Resources PLC (a) | 570,100 | | 310 |
TOTAL UNITED KINGDOM | | 112,281 |
United States of America - 0.8% |
CTC Media, Inc. (a) | 336,700 | | 2,492 |
Common Stocks - continued |
| Shares | | Value (000s) |
United States of America - continued |
Cyberview Technology, Inc. (a)(e) | 996,527 | | $ 0 |
Frontera Resources Corp. (a) | 1,157,200 | | 802 |
Frontier Mining Ltd. (a) | 6,056,000 | | 148 |
Phorm, Inc. | 251,500 | | 763 |
TyraTech, Inc. (a) | 191,500 | | 133 |
XL TechGroup, Inc. (a) | 1,329,250 | | 0 |
TOTAL UNITED STATES OF AMERICA | | 4,338 |
TOTAL COMMON STOCKS (Cost $810,643) | 521,624 |
Nonconvertible Preferred Stocks - 1.5% |
| | | |
Germany - 1.5% |
Biotest AG (non-vtg.)
(Cost $11,136) | 136,500 | | 8,451 |
Investment Companies - 0.2% |
| | | |
United Kingdom - 0.2% |
Brookwell Ltd. (e)
(Cost $3,644) | 1,856,210 | | 1,451 |
Money Market Funds - 12.9% |
| | | |
Fidelity Cash Central Fund, 1.81% (b) | 42,315,053 | | 42,315 |
Fidelity Securities Lending Cash Central Fund, 2.67% (b)(c) | 31,582,427 | | 31,582 |
TOTAL MONEY MARKET FUNDS (Cost $73,897) | 73,897 |
TOTAL INVESTMENT PORTFOLIO - 105.4% (Cost $899,320) | | 605,423 |
NET OTHER ASSETS - (5.4)% | | (30,973) |
NET ASSETS - 100% | $ 574,450 |
Legend |
(a) Non-income producing |
(b) Affiliated fund that is available only to investment companies and other accounts managed by Fidelity Investments. The rate quoted is the annualized seven-day yield of the fund at period end. A complete unaudited listing of the fund's holdings as of its most recent quarter end is available upon request. |
(c) Investment made with cash collateral received from securities on loan. |
(d) Security or a portion of the security is on loan at period end. |
(e) Affiliated company |
(f) Security exempt from registration under Rule 144A of the Securities Act of 1933. These securities may be resold in transactions exempt from registration, normally to qualified institutional buyers. At the end of the period, the value of these securities amounted to $1,898,000 or 0.3% of net assets. |
(g) Restricted securities - Investment in securities not registered under the Securities Act of 1933 (excluding 144A issues). At the end of the period, the value of restricted securities (excluding 144A issues) amounted to $14,415,000 or 2.5% of net assets. |
Additional information on each holding is as follows: |
Security | Acquisition Date | Acquisition Cost (000s) |
AirSea Lines | 8/4/06 | $ 1,199 |
AirSea Lines warrants 8/4/11 | 8/4/06 | $ 0 |
Appian Technology PLC warrants 7/11/09 | 2/18/05 | $ 0 |
Buried Hill Energy (Cyprus) PCL | 8/18/06 | $ 2,142 |
Eclipse Energy Co. Ltd. | 4/28/05 | $ 1,459 |
Kalahari Energy | 9/1/06 | $ 1,814 |
Keronite PLC | 8/16/06 | $ 1,549 |
Landround PLC warrants 12/11/09 | 12/12/06 | $ 0 |
Pureprofile Media PLC | 5/3/05 - 1/11/06 | $ 1,173 |
Rock Well Petroleum, Inc. | 4/13/06 | $ 1,004 |
Sphere Medical Holding PLC | 8/27/08 | $ 1,310 |
TMO Biotec | 10/27/05 | $ 535 |
Affiliated Central Funds |
Information regarding fiscal year to date income earned by the Fund from investments in Fidelity Central Funds is as follows: |
Fund | Income earned
(Amounts in thousands) |
Fidelity Cash Central Fund | $ 1,569 |
Fidelity Securities Lending Cash Central Fund | 1,694 |
Total | $ 3,263 |
Other Affiliated Issuers |
An affiliated company is a company in which the fund has ownership of at least 5% of the voting securities. Fiscal year to date transactions with companies which are or were affiliates are as follows: |
Affiliate
(Amounts in thousands) | Value, beginning of period | Purchases | Sales Proceeds | Dividend Income | Value,
end of
period |
ADVFN PLC | $ 2,066 | $ - | $ 1,489 | $ - | $ - |
Allied Gold Ltd. | 12,802 | 3,513 | 9,185 | - | - |
Allied Gold Ltd. (United Kingdom) | 410 | 2,249 | 6,735 | - | - |
BioCare Solutions PLC | 1,260 | - | 73 | - | - |
Brookwell Ltd. | - | 3,644 | - | - | 1,451 |
Capital-XX Ltd. | 3,105 | 736 | 1,321 | - | - |
Centurion Electronics PLC | 89 | - | - | - | - |
Corac Group PLC | 5,414 | - | 767 | - | - |
CustomVis PLC | 591 | 421 | 8 | - | 201 |
Cyberview Technology, Inc. | 3,802 | - | - | - | - |
Frontier Mining Ltd. | 1,619 | - | 35 | - | - |
Healthcare Enterprise Group PLC | 373 | - | 274 | - | - |
Hydrodec Group PLC | 3,795 | - | 9,368 | - | - |
Impact Holdings PLC | 650 | - | 188 | - | - |
Motivcom PLC | 5,545 | - | 2,303 | 49 | - |
Phorm, Inc. | 28,335 | - | 5,912 | - | - |
Skywest Airlines Ltd. | 4,437 | - | 3,480 | 222 | - |
SPI Lasers PLC | 3,778 | - | 1,986 | - | - |
Sylvania Resources Ltd. | 25,111 | 640 | 6,598 | - | - |
Sylvania Resources Ltd. (United Kingdom) | 13,425 | 818 | 27,147 | - | - |
Tanzanite One Ltd. | 8,937 | - | 4,053 | 410 | - |
Teleunit SpA | 1,025 | - | 26 | - | 458 |
Visual Defence, Inc. | 1,503 | - | 509 | - | - |
Total | $ 128,072 | $ 12,021 | $ 81,457 | $ 681 | $ 2,110 |
Income Tax Information |
At October 31, 2008, the fund had a capital loss carryforward of approximately $28,799,000 all of which will expire on October 31, 2016. |
See accompanying notes which are an integral part of the financial statements.
Annual Report
Statement of Assets and Liabilities
Amounts in thousands (except per-share amounts) | October 31, 2008 |
Assets | | |
Investment in securities, at value (including securities loaned of $29,883) - See accompanying schedule: Unaffiliated issuers (cost $809,370) | $ 529,416 | |
Fidelity Central Funds (cost $73,897) | 73,897 | |
Other affiliated issuers (cost $16,053) | 2,110 | |
Total Investments (cost $899,320) | | $ 605,423 |
Foreign currency held at value (cost $821) | | 822 |
Receivable for investments sold | | 6,696 |
Receivable for fund shares sold | | 862 |
Dividends receivable | | 2,108 |
Distributions receivable from Fidelity Central Funds | | 136 |
Receivable from investment adviser for expense reductions | | 24 |
Other receivables | | 245 |
Total assets | | 616,316 |
| | |
Liabilities | | |
Payable for investments purchased | $ 8,143 | |
Payable for fund shares redeemed | 1,075 | |
Accrued management fee | 618 | |
Distribution fees payable | 17 | |
Other affiliated payables | 223 | |
Other payables and accrued expenses | 208 | |
Collateral on securities loaned, at value | 31,582 | |
Total liabilities | | 41,866 |
| | |
Net Assets | | $ 574,450 |
Net Assets consist of: | | |
Paid in capital | | $ 905,604 |
Accumulated undistributed net realized gain (loss) on investments and foreign currency transactions | | (37,825) |
Net unrealized appreciation (depreciation) on investments and assets and liabilities in foreign currencies | | (293,329) |
Net Assets | | $ 574,450 |
See accompanying notes which are an integral part of the financial statements.
Annual Report
Statement of Assets and Liabilities - continued
Amounts in thousands (except per-share amounts) | October 31, 2008 |
Calculation of Maximum Offering Price Class A:
Net Asset Value and redemption price per share ($13,561 ÷ 1,138.35 shares) | | $ 11.91 |
| | |
Maximum offering price per share (100/94.25 of $11.91) | | $ 12.64 |
Class T:
Net Asset Value and redemption price per share ($13,493 ÷ 1,139.44 shares) | | $ 11.84 |
| | |
Maximum offering price per share (100/96.50 of $11.84) | | $ 12.27 |
Class B:
Net Asset Value and offering price per share ($3,230 ÷ 277.28 shares)A | | $ 11.65 |
| | |
Class C:
Net Asset Value and offering price per share ($5,658 ÷ 483.62 shares)A | | $ 11.70 |
| | |
| | |
International Small Cap:
Net Asset Value, offering price and redemption price per share ($536,291 ÷ 44,591.13 shares) | | $ 12.03 |
| | |
Institutional Class:
Net Asset Value, offering price and redemption price per share ($2,217 ÷ 184.55 shares) | | $ 12.01 |
A Redemption price per share is equal to net asset value less any applicable contingent deferred sales charge.
See accompanying notes which are an integral part of the financial statements.
Annual Report
Financial Statements - continued
Statement of Operations
Amounts in thousands | Year ended October 31, 2008 |
Investment Income | | |
Dividends (including $681 earned from other affiliated issuers) | | $ 17,101 |
Interest | | 348 |
Income from Fidelity Central Funds (including $1,694 from security lending) | | 3,263 |
| | 20,712 |
Less foreign taxes withheld | | (1,152) |
Total income | | 19,560 |
| | |
Expenses | | |
Management fee
Basic fee | $ 10,529 | |
Performance adjustment | 3,402 | |
Transfer agent fees | 2,880 | |
Distribution fees | 416 | |
Accounting and security lending fees | 577 | |
Custodian fees and expenses | 465 | |
Independent trustees' compensation | 6 | |
Registration fees | 84 | |
Audit | 136 | |
Legal | 7 | |
Miscellaneous | 207 | |
Total expenses before reductions | 18,709 | |
Expense reductions | (736) | 17,973 |
Net investment income (loss) | | 1,587 |
Realized and Unrealized Gain (Loss) Net realized gain (loss) on: | | |
Investment securities: | | |
Unaffiliated issuers (net of foreign taxes of $741) | 6,591 | |
Other affiliated issuers | 3,373 | |
Foreign currency transactions | (1,386) | |
Total net realized gain (loss) | | 8,578 |
Change in net unrealized appreciation (depreciation) on: Investment securities (net of decrease in deferred foreign taxes of $751) | (799,901) | |
Assets and liabilities in foreign currencies | 414 | |
Total change in net unrealized appreciation (depreciation) | | (799,487) |
Net gain (loss) | | (790,909) |
Net increase (decrease) in net assets resulting from operations | | $ (789,322) |
See accompanying notes which are an integral part of the financial statements.
Annual Report
Statement of Changes in Net Assets
Amounts in thousands | Year ended
October 31,
2008 | Year ended
October 31,
2007 |
Increase (Decrease) in Net Assets | | |
Operations | | |
Net investment income (loss) | $ 1,587 | $ 7,040 |
Net realized gain (loss) | 8,578 | 289,903 |
Change in net unrealized appreciation (depreciation) | (799,487) | 201,775 |
Net increase (decrease) in net assets resulting
from operations | (789,322) | 498,718 |
Distributions to shareholders from net investment income | (6,293) | (3,787) |
Distributions to shareholders from net realized gain | (288,048) | (351,004) |
Total distributions | (294,341) | (354,791) |
Share transactions - net increase (decrease) | (123,774) | (298,912) |
Redemption fees | 146 | 245 |
Total increase (decrease) in net assets | (1,207,291) | (154,740) |
| | |
Net Assets | | |
Beginning of period | 1,781,741 | 1,936,481 |
End of period (including undistributed net investment income of $0 and $7,171, respectively) | $ 574,450 | $ 1,781,741 |
See accompanying notes which are an integral part of the financial statements.
Annual Report
Financial Highlights - Class A
Years ended October 31, | 2008 | 2007 | 2006 | 2005 | 2004 |
Selected Per-Share Data | | | | | |
Net asset value, beginning of period | $ 31.14 | $ 28.79 | $ 26.69 | $ 21.25 | $ 17.69 |
Income from Investment
Operations | | | | |
Net investment income (loss) C | - G | .03 | (.02) | .05 | .02 |
Net realized and unrealized gain (loss) | (14.03) | 7.97 | 5.05 | 6.16 | 3.83 |
Total from investment operations | (14.03) | 8.00 | 5.03 | 6.21 | 3.85 |
Distributions from net investment income | (.03) | - | (.05) | (.02) | (.02) |
Distributions from net realized gain | (5.18) | (5.65) | (2.89) | (.77) | (.31) |
Total distributions | (5.20) H | (5.65) | (2.94) | (.79) | (.33) |
Redemption fees added to paid in capital C | - G | - G | .01 | .02 | .04 |
Net asset value, end of period | $ 11.91 | $ 31.14 | $ 28.79 | $ 26.69 | $ 21.25 |
Total Return A, B | (53.35)% | 33.43% | 20.22% | 30.16% | 22.36% |
Ratios to Average Net Assets D, F | | | | |
Expenses before reductions | 1.82% | 1.53% | 1.64% | 1.66% | 1.71% |
Expenses net of fee waivers, if any | 1.65% | 1.53% | 1.64% | 1.66% | 1.71% |
Expenses net of all reductions | 1.60% | 1.49% | 1.58% | 1.63% | 1.69% |
Net investment income (loss) | -% I | .10% | (.08)% | .21% | .09% |
Supplemental Data | | | | | |
Net assets, end of period (in millions) | $ 14 | $ 39 | $ 37 | $ 35 | $ 13 |
Portfolio turnover rate E | 113% | 70% | 84% | 79% | 77% |
A Total returns would have been lower had certain expenses not been reduced during the periods shown.
B Total returns do not include the effect of the sales charges.
C Calculated based on average shares outstanding during the period.
D Fees and expenses of the underlying Fidelity Central Funds are not included in the Fund's expense ratio. The Fund indirectly bears its proportionate share of the expenses of any underlying Fidelity Central Funds.
E Amount does not include the portfolio activity of any underlying Fidelity Central Funds.
F Expense ratios reflect operating expenses of the class. Expenses before reductions do not reflect amounts reimbursed by the investment adviser or reductions from brokerage service arrangements or other expense offset arrangements and do not represent the amount paid by the class during periods when reimbursements or reductions occur. Expenses net of fee waivers reflect expenses after reimbursement by the investment adviser but prior to reductions from brokerage service arrangements or other expense offset arrangements. Expenses net of all reductions represent the net expenses paid by the class.
G Amount represents less than $.01 per share.
H Total distributions of $5.20 per share is comprised of distributions from net investment income of $.026 and distributions from net realized gain of $5.176 per share.
I Amount represents less than .01%.
See accompanying notes which are an integral part of the financial statements.
Annual Report
Financial Highlights - Class T
Years ended October 31, | 2008 | 2007 | 2006 | 2005 | 2004 |
Selected Per-Share Data | | | | | |
Net asset value, beginning of period | $ 30.96 | $ 28.64 | $ 26.57 | $ 21.20 | $ 17.68 |
Income from Investment Operations | | | | | |
Net investment income (loss) C | (.05) | (.04) | (.09) | (.01) | (.03) |
Net realized and unrealized gain (loss) | (13.95) | 7.93 | 5.03 | 6.12 | 3.83 |
Total from investment operations | (14.00) | 7.89 | 4.94 | 6.11 | 3.80 |
Distributions from net investment income | - | - | - | - | (.01) |
Distributions from net realized gain | (5.12) | (5.57) | (2.88) | (.76) | (.31) |
Total distributions | (5.12) | (5.57) | (2.88) | (.76) | (.32) |
Redemption fees added to paid in capital C | - G | - G | .01 | .02 | .04 |
Net asset value, end of period | $ 11.84 | $ 30.96 | $ 28.64 | $ 26.57 | $ 21.20 |
Total Return A, B | (53.46)% | 33.07% | 19.93% | 29.72% | 22.07% |
Ratios to Average Net Assets D, F | | | | | |
Expenses before reductions | 2.07% | 1.77% | 1.89% | 1.92% | 1.94% |
Expenses net of fee waivers, if any | 1.90% | 1.77% | 1.89% | 1.91% | 1.94% |
Expenses net of all reductions | 1.86% | 1.73% | 1.83% | 1.88% | 1.92% |
Net investment income (loss) | (.25)% | (.14)% | (.32)% | (.04)% | (.14)% |
Supplemental Data | | | | | |
Net assets, end of period (in millions) | $ 13 | $ 41 | $ 42 | $ 42 | $ 15 |
Portfolio turnover rate E | 113% | 70% | 84% | 79% | 77% |
A Total returns would have been lower had certain expenses not been reduced during the periods shown.
B Total returns do not include the effect of the sales charges.
C Calculated based on average shares outstanding during the period.
D Fees and expenses of the underlying Fidelity Central Funds are not included in the Fund's expense ratio. The Fund indirectly bears its proportionate share of the expenses of any underlying Fidelity Central Funds.
E Amount does not include the portfolio activity of any underlying Fidelity Central Funds.
F Expense ratios reflect operating expenses of the class. Expenses before reductions do not reflect amounts reimbursed by the investment adviser or reductions from brokerage service arrangements or other expense offset arrangements and do not represent the amount paid by the class during periods when reimbursements or reductions occur. Expenses net of fee waivers reflect expenses after reimbursement by the investment adviser but prior to reductions from brokerage service arrangements or other expense offset arrangements. Expenses net of all reductions represent the net expenses paid by the class.
G Amount represents less than $.01 per share.
See accompanying notes which are an integral part of the financial statements.
Annual Report
Financial Highlights - Class B
Years ended October 31, | 2008 | 2007 | 2006 | 2005 | 2004 |
Selected Per-Share Data | | | | | |
Net asset value, beginning of period | $ 30.49 | $ 28.26 | $ 26.24 | $ 20.99 | $ 17.62 |
Income from Investment Operations | | | | | |
Net investment income (loss) C | (.16) | (.18) | (.24) | (.14) | (.16) |
Net realized and unrealized gain (loss) | (13.73) | 7.82 | 4.98 | 6.08 | 3.80 |
Total from investment operations | (13.89) | 7.64 | 4.74 | 5.94 | 3.64 |
Distributions from net realized gain | (4.95) | (5.41) | (2.73) | (.71) | (.31) |
Redemption fees added to paid in capital C | - G | - G | .01 | .02 | .04 |
Net asset value, end of period | $ 11.65 | $ 30.49 | $ 28.26 | $ 26.24 | $ 20.99 |
Total Return A, B | (53.68)% | 32.38% | 19.28% | 29.13% | 21.21% |
Ratios to Average Net Assets D, F | | | | | |
Expenses before reductions | 2.58% | 2.30% | 2.48% | 2.49% | 2.63% |
Expenses net of fee waivers, if any | 2.40% | 2.30% | 2.40% | 2.43% | 2.63% |
Expenses net of all reductions | 2.36% | 2.26% | 2.34% | 2.40% | 2.60% |
Net investment income (loss) | (.75)% | (.66)% | (.84)% | (.56)% | (.83)% |
Supplemental Data | | | | | |
Net assets, end of period (in millions) | $ 3 | $ 11 | $ 11 | $ 13 | $ 5 |
Portfolio turnover rate E | 113% | 70% | 84% | 79% | 77% |
A Total returns would have been lower had certain expenses not been reduced during the periods shown.
B Total returns do not include the effect of the contingent deferred sales charge.
C Calculated based on average shares outstanding during the period.
D Fees and expenses of the underlying Fidelity Central Funds are not included in the Fund's expense ratio. The Fund indirectly bears its proportionate share of the expenses of any underlying Fidelity Central Funds.
E Amount does not include the portfolio activity of any underlying Fidelity Central Funds.
F Expense ratios reflect operating expenses of the class. Expenses before reductions do not reflect amounts reimbursed by the investment adviser or reductions from brokerage service arrangements or other expense offset arrangements and do not represent the amount paid by the class during periods when reimbursements or reductions occur. Expenses net of fee waivers reflect expenses after reimbursement by the investment adviser but prior to reductions from brokerage service arrangements or other expense offset arrangements. Expenses net of all reductions represent the net expenses paid by the class.
G Amount represents less than $.01 per share.
See accompanying notes which are an integral part of the financial statements.
Annual Report
Financial Highlights - Class C
Years ended October 31, | 2008 | 2007 | 2006 | 2005 | 2004 |
Selected Per-Share Data | | | | | |
Net asset value, beginning of period | $ 30.62 | $ 28.33 | $ 26.31 | $ 21.04 | $ 17.64 |
Income from Investment Operations | | | | | |
Net investment income (loss) C | (.16) | (.17) | (.23) | (.13) | (.12) |
Net realized and unrealized gain (loss) | (13.78) | 7.85 | 4.99 | 6.10 | 3.80 |
Total from investment operations | (13.94) | 7.68 | 4.76 | 5.97 | 3.68 |
Distributions from net investment income | - | - | - | - | (.01) |
Distributions from net realized gain | (4.98) | (5.39) | (2.75) | (.72) | (.31) |
Total distributions | (4.98) | (5.39) | (2.75) | (.72) | (.32) |
Redemption fees added to paid in capital C | - G | - G | .01 | .02 | .04 |
Net asset value, end of period | $ 11.70 | $ 30.62 | $ 28.33 | $ 26.31 | $ 21.04 |
Total Return A, B | (53.67)% | 32.39% | 19.34% | 29.22% | 21.43% |
Ratios to Average Net Assets D, F | | | | | |
Expenses before reductions | 2.57% | 2.26% | 2.38% | 2.41% | 2.43% |
Expenses net of fee waivers, if any | 2.40% | 2.26% | 2.38% | 2.41% | 2.43% |
Expenses net of all reductions | 2.36% | 2.22% | 2.32% | 2.38% | 2.40% |
Net investment income (loss) | (.76)% | (.62)% | (.81)% | (.54)% | (.62)% |
Supplemental Data | | | | | |
Net assets, end of period (in millions) | $ 6 | $ 20 | $ 21 | $ 25 | $ 9 |
Portfolio turnover rate E | 113% | 70% | 84% | 79% | 77% |
A Total returns would have been lower had certain expenses not been reduced during the periods shown.
B Total returns do not include the effect of the contingent deferred sales charge.
C Calculated based on average shares outstanding during the period.
D Fees and expenses of the underlying Fidelity Central Funds are not included in the Fund's expense ratio. The Fund indirectly bears its proportionate share of the expenses of any underlying Fidelity Central Funds.
E Amount does not include the portfolio activity of any underlying Fidelity Central Funds.
F Expense ratios reflect operating expenses of the class. Expenses before reductions do not reflect amounts reimbursed by the investment adviser or reductions from brokerage service arrangements or other expense offset arrangements and do not represent the amount paid by the class during periods when reimbursements or reductions occur. Expenses net of fee waivers reflect expenses after reimbursement by the investment adviser but prior to reductions from brokerage service arrangements or other expense offset arrangements. Expenses net of all reductions represent the net expenses paid by the class.
G Amount represents less than $.01 per share.
See accompanying notes which are an integral part of the financial statements.
Annual Report
Financial Highlights - International Small Cap
Years ended October 31, | 2008 | 2007 | 2006 | 2005 | 2004 |
Selected Per-Share Data | | | | | |
Net asset value, beginning of period | $ 31.44 | $ 29.03 | $ 26.89 | $ 21.36 | $ 17.71 |
Income from Investment Operations | | | | | |
Net investment income (loss) B | .03 | .12 | .08 | .15 | .10 |
Net realized and unrealized gain (loss) | (14.14) | 8.03 | 5.08 | 6.19 | 3.84 |
Total from investment operations | (14.11) | 8.15 | 5.16 | 6.34 | 3.94 |
Distributions from net investment income | (.12) | (.07) | (.14) | (.06) | (.02) |
Distributions from net realized gain | (5.18) | (5.67) | (2.89) | (.77) | (.31) |
Total distributions | (5.30)G | (5.74) | (3.03) | (.83) | (.33) |
Redemption fees added to paid in capital B | -F | -F | .01 | .02 | .04 |
Net asset value, end of period | $ 12.03 | $ 31.44 | $ 29.03 | $ 26.89 | $ 21.36 |
Total ReturnA | (53.25)% | 33.82% | 20.65% | 30.67% | 22.84% |
Ratios to Average Net AssetsC, E | | | | | |
Expenses before reductions | 1.49% | 1.19% | 1.28% | 1.28% | 1.30% |
Expenses net of fee waivers, if any | 1.49% | 1.19% | 1.28% | 1.28% | 1.30% |
Expenses net of all reductions | 1.44% | 1.15% | 1.22% | 1.25% | 1.28% |
Net investment income (loss) | .16% | .45% | .29% | .59% | .50% |
Supplemental Data | | | | | |
Net assets, end of period (in millions) | $ 536 | $ 1,664 | $ 1,816 | $ 2,090 | $ 1,091 |
Portfolio turnover rateD | 113% | 70% | 84% | 79% | 77% |
A Total returns would have been lower had certain expenses not been reduced during the periods shown.
B Calculated based on average shares outstanding during the period.
C Fees and expenses of the underlying Fidelity Central Funds are not included in the Fund's expense ratio. The Fund indirectly bears its proportionate share of the expenses of any underlying Fidelity Central Funds.
D Amount does not include the portfolio activity of any underlying Fidelity Central Funds.
E Expense ratios reflect operating expenses of the class. Expenses before reductions do not reflect amounts reimbursed by the investment adviser or reductions from brokerage service arrangements or other expense offset arrangements and do not represent the amount paid by the class during periods when reimbursements or reductions occur. Expenses net of fee waivers reflect expenses after reimbursement by the investment adviser but prior to reductions from brokerage service arrangements or other expense offset arrangements. Expenses net of all reductions represent the net expenses paid by the class.
F Amount represents less than $.01 per share.
G Total distributions of $5.30 per share is comprised of distributions from net investment income of $.120 and distributions from net realized gain of $5.176 per share.
See accompanying notes which are an integral part of the financial statements.
Annual Report
Financial Highlights - Institutional Class
Years ended October 31, | 2008 | 2007 | 2006 | 2005 | 2004 |
Selected Per-Share Data | | | | | |
Net asset value, beginning of period | $ 31.38 | $ 28.99 | $ 26.86 | $ 21.36 | $ 17.72 |
Income from Investment Operations | | | | | |
Net investment income (loss) B | .05 | .12 | .08 | .14 | .10 |
Net realized and unrealized gain (loss) | (14.12) | 8.01 | 5.07 | 6.18 | 3.84 |
Total from investment operations | (14.07) | 8.13 | 5.15 | 6.32 | 3.94 |
Distributions from net investment income | (.12) | (.07) | (.14) | (.07) | (.03) |
Distributions from net realized gain | (5.18) | (5.67) | (2.89) | (.77) | (.31) |
Total distributions | (5.30) G | (5.74) | (3.03) | (.84) | (.34) |
Redemption fees added to paid in capital B | - F | - F | .01 | .02 | .04 |
Net asset value, end of period | $ 12.01 | $ 31.38 | $ 28.99 | $ 26.86 | $ 21.36 |
Total Return A | (53.22)% | 33.84% | 20.65% | 30.59% | 22.84% |
Ratios to Average Net Assets C, E | | | | | |
Expenses before reductions | 1.49% | 1.18% | 1.29% | 1.30% | 1.32% |
Expenses net of fee waivers, if any | 1.40% | 1.18% | 1.29% | 1.30% | 1.32% |
Expenses net of all reductions | 1.35% | 1.14% | 1.23% | 1.27% | 1.29% |
Net investment income (loss) | .25% | .45% | .28% | .57% | .49% |
Supplemental Data | | | | | |
Net assets, end of period (in millions) | $ 2 | $ 8 | $ 9 | $ 7 | $ 3 |
Portfolio turnover rate D | 113% | 70% | 84% | 79% | 77% |
A Total returns would have been lower had certain expenses not been reduced during the periods shown.
B Calculated based on average shares outstanding during the period.
C Fees and expenses of the underlying Fidelity Central Funds are not included in the Fund's expense ratio. The Fund indirectly bears its proportionate share of the expenses of any underlying Fidelity Central Funds.
D Amount does not include the portfolio activity of any underlying Fidelity Central Funds.
E Expense ratios reflect operating expenses of the class. Expenses before reductions do not reflect amounts reimbursed by the investment adviser or reductions from brokerage service arrangements or other expense offset arrangements and do not represent the amount paid by the class during periods when reimbursements or reductions occur. Expenses net of fee waivers reflect expenses after reimbursement by the investment adviser but prior to reductions from brokerage service arrangements or other expense offset arrangements. Expenses net of all reductions represent the net expenses paid by the class.
F Amount represents less than $.01 per share.
G Total distributions of $5.30 per share is comprised of distributions from net investment income of $.120 and distributions from net realized gain of $5.176 per share.
See accompanying notes which are an integral part of the financial statements.
Annual Report
Notes to Financial Statements
For the period ended October 31, 2008
(Amounts in thousands except ratios)
1. Organization.
Fidelity International Small Cap Fund (the Fund) is a fund of Fidelity Investment Trust (the trust) and is authorized to issue an unlimited number of shares. The Fund is currently closed to most new accounts. The trust is registered under the Investment Company Act of 1940, as amended (the 1940 Act), as an open-end management investment company organized as a Massachusetts business trust.
The Fund offers Class A, Class T, Class B, Class C, International Small Cap and Institutional Class shares, each of which has equal rights as to assets and voting privileges. Each class has exclusive voting rights with respect to matters that affect that class. Class B shares will automatically convert to Class A shares after a holding period of seven years from the initial date of purchase. Investment income, realized and unrealized capital gains and losses, the common expenses of the Fund, and certain fund-level expense reductions, if any, are allocated on a pro rata basis to each class based on the relative net assets of each class to the total net assets of the Fund. Each class differs with respect to transfer agent and distribution and service plan fees incurred. Certain expense reductions also differ by class.
2. Investments in Fidelity Central Funds.
The Fund may invest in Fidelity Central Funds, which are open-end investment companies available only to other investment companies and accounts managed by Fidelity Management & Research Company (FMR) and its affiliates. The Fund's Schedule of Investments lists each of the Fidelity Central Funds held as of period end, if any, as an investment of the Fund, but does not include the underlying holdings of each Fidelity Central Fund. As an Investing Fund, the Fund indirectly bears its proportionate share of the expenses of the underlying Fidelity Central Funds.
The Money Market Central Funds seek preservation of capital and current income and are managed by Fidelity Investments Money Management, Inc. (FIMM), an affiliate of FMR.
A complete unaudited list of holdings for each Fidelity Central Fund is available upon request or at the SEC's web site at www.sec.gov. In addition, the financial statements of the Fidelity Central Funds are available on the SEC's web site or upon request.
3. Significant Accounting Policies.
The financial statements have been prepared in conformity with accounting principles generally accepted in the United States of America, which require management to make certain estimates and assumptions at the date of the financial statements. Actual results could differ from those estimates. The following summarizes the significant accounting policies of the Fund:
Annual Report
3. Significant Accounting Policies - continued
Security Valuation. Investments are valued as of 4:00 p.m. Eastern time on the last calendar day of the period. Wherever possible, the Fund uses independent pricing services approved by the Board of Trustees to value its investments.
Equity securities, including restricted securities, for which market quotations are readily available, are valued at the last reported sale price or official closing price as reported by an independent pricing service on the primary market or exchange on which they are traded. In the event there were no sales during the day or closing prices are not available, securities are valued at the last quoted bid price. Investments in open-end mutual funds including the Fidelity Central Funds, are valued at their closing net asset value each business day. Short-term securities with remaining maturities of sixty days or less for which quotations are not readily available are valued at amortized cost, which approximates value.
When current market prices or quotations are not readily available or reliable, valuations may be determined in good faith in accordance with procedures adopted by the Board of Trustees. Factors used in determining value may include significant market or security specific events, changes in interest rates and credit quality, and developments in foreign markets which are monitored by evaluating the performance of ADRs, futures contracts and exchange-traded funds. The frequency with which these procedures are used cannot be predicted and may be utilized to a significant extent. The value of securities used for net asset value (NAV) calculation under these procedures may differ from published prices for the same securities.
Foreign Currency. The Fund uses foreign currency contracts to facilitate transactions in foreign-denominated securities. Losses from these transactions may arise from changes in the value of the foreign currency or if the counterparties do not perform under the contracts' terms.
Foreign-denominated assets, including investment securities, and liabilities are translated into U.S. dollars at the exchange rate at period end. Purchases and sales of investment securities, income and dividends received and expenses denominated in foreign currencies are translated into U.S. dollars at the exchange rate in effect on the transaction date.
The effects of exchange rate fluctuations on investments are included with the net realized and unrealized gain (loss) on investment securities. Other foreign currency transactions resulting in realized and unrealized gain (loss) are disclosed separately.
Annual Report
Notes to Financial Statements - continued
(Amounts in thousands except ratios)
3. Significant Accounting Policies - continued
Investment Transactions and Income. For financial reporting purposes, the Fund's investment holdings and NAV include trades executed through the end of the last business day of the period. The NAV per share for processing shareholder transactions is calculated as of the close of business of the New York Stock Exchange (NYSE), normally 4:00 p.m. Eastern time and includes trades executed through the end of the prior business day. Gains and losses on securities sold are determined on the basis of identified cost. Dividend income is recorded on the ex-dividend date, except for certain dividends from foreign securities where the ex-dividend date may have passed, which are recorded as soon as the Fund is informed of the ex-dividend date. Non-cash dividends included in dividend income, if any, are recorded at the fair market value of the securities received. Distributions received on securities that represent a return of capital or capital gain are recorded as a reduction of cost of investments and/or as a realized gain. The Fund estimates the components of distributions received that may be considered return of capital distributions or capital gain distributions. Interest income and distributions from the Fidelity Central Funds are accrued as earned. Interest income includes coupon interest and amortization of premium and accretion of discount on debt securities. Investment income is recorded net of foreign taxes withheld where recovery of such taxes is uncertain.
Expenses. Most expenses of the trust can be directly attributed to a fund. Expenses which cannot be directly attributed are apportioned among each Fund in the trust. Expense estimates are accrued in the period to which they relate and adjustments are made when actual amounts are known.
Income Tax Information and Distributions to Shareholders. Each year, the Fund intends to qualify as a regulated investment company by distributing substantially all of its taxable income and realized gains under Subchapter M of the Internal Revenue Code and filing its U.S. federal tax return. As a result, no provision for income taxes is required. The Fund is subject to the provisions of FASB Interpretation No. 48, Accounting for Uncertainties in Income Taxes (FIN 48). FIN 48 sets forth a minimum threshold for financial statement recognition of the benefit of a tax position taken or expected to be taken in a tax return. The implementation of FIN 48 did not result in any unrecognized tax benefits in the accompanying financial statements. Each of the Fund's federal tax returns for the prior three fiscal years remains subject to examination by the Internal Revenue Service (IRS). Foreign taxes are provided for based on the Fund's understanding of the tax rules and rates that exist in the foreign markets in which it invests.
Distributions are recorded on the ex-dividend date. Income dividends and capital gain distributions are declared separately for each class. Income and capital gain distributions are determined in accordance with income tax regulations, which may differ from generally accepted accounting principles.
Annual Report
3. Significant Accounting Policies - continued
Income Tax Information and Distributions to Shareholders - continued
Capital accounts within the financial statements are adjusted for permanent book-tax differences. These adjustments have no impact on net assets or the results of operations. Temporary book-tax differences will reverse in a subsequent period.
Book-tax differences are primarily due to, foreign currency transactions, certain foreign taxes, passive foreign investments companies (PFIC), capital loss carryforwards and losses deferred due to wash sales.
The tax-basis components of distributable earnings and the federal tax cost as of period end were as follows:
Unrealized appreciation | $ 29,805 |
Unrealized depreciation | (332,161) |
Net unrealized appreciation (depreciation) | (302,356) |
Capital loss carryforward | (28,799) |
| |
Cost for federal income tax purposes | $ 907,779 |
The tax character of distributions paid was as follows:
| October 31, 2008 | October 31, 2007 |
Ordinary Income | $ 73,752 | $ 43,869 |
Long-term Capital Gains | 220,589 | 310,922 |
Total | $ 294,341 | $ 354,791 |
Short-Term Trading (Redemption) Fees. Shares held in the Fund less than 90 days are subject to a redemption fee equal to 2.00% of the proceeds of the redeemed shares. All redemption fees, including any estimated redemption fees paid by FMR, are retained by the Fund and accounted for as an addition to paid in capital.
New Accounting Pronouncement. In September 2006, Statement of Financial Accounting Standards No. 157, Fair Value Measurements (SFAS 157), was issued and is effective for fiscal years beginning after November 15, 2007. SFAS 157 defines fair value, establishes a framework for measuring fair value and results in expanded disclosures about fair value measurements.
4. Operating Policies.
Repurchase Agreements. FMR has received an Exemptive Order from the Securities and Exchange Commission (the SEC) which permits the Fund and other affiliated entities of FMR to transfer uninvested cash balances into joint trading accounts which are then invested in repurchase agreements. The Fund may also invest directly with institutions in repurchase agreements. Repurchase agreements are collateralized by
Annual Report
Notes to Financial Statements - continued
(Amounts in thousands except ratios)
4. Operating Policies - continued
Repurchase Agreements - continued
government or non-government securities. Upon settlement date, collateral is held in segregated accounts with custodian banks and may be obtained in the event of a default of the counterparty. The Fund monitors, on a daily basis, the value of the collateral to ensure it is at least equal to the principal amount of the repurchase agreement (including accrued interest). In the event of a default by the counterparty, realization of the collateral proceeds could be delayed, during which time the value of the collateral may decline.
Restricted Securities. The Fund may invest in securities that are subject to legal or contractual restrictions on resale. These securities generally may be resold in transactions exempt from registration or to the public if the securities are registered. Disposal of these securities may involve time-consuming negotiations and expense, and prompt sale at an acceptable price may be difficult. Information regarding restricted securities is included at the end of the Fund's Schedule of Investments.
5. Purchases and Sales of Investments.
Purchases and sales of securities, other short-term securities, aggregated $1,347,283 and $1,736,784, respectively.
6. Fees and Other Transactions with Affiliates.
Management Fee. FMR and its affiliates provide the Fund with investment management related services for which the Fund pays a monthly management fee. The management fee is the sum of an individual fund fee rate that is based on an annual rate of .60% of the Fund's average net assets and a group fee rate that averaged .26% during the period. The group fee rate is based upon the average net assets of all the mutual funds advised by FMR. The group fee rate decreases as assets under management increase and increases as assets under management decrease. In addition, the management fee is subject to a performance adjustment (up to a maximum of ± .20% of the Fund's average net assets over a 36 month performance period). The upward or downward adjustment to the management fee is based on the relative investment performance of the retail class of the Fund, International Small Cap as compared to an appropriate benchmark index. For the period, the total annual management fee rate, including the performance adjustment, was 1.14% of the Fund's average net assets.
Distribution and Service Plan. In accordance with Rule 12b-1 of the 1940 Act, the Fund has adopted separate Distribution and Service Plans for each class of shares. Certain classes pay Fidelity Distributors Corporation (FDC), an affiliate of FMR, separate Distribution and Service Fees, each of which is based on an annual percentage of each class' average net assets. In addition, FDC may pay financial intermediaries for selling shares of the Fund and providing shareholder support services.
Annual Report
6. Fees and Other Transactions with Affiliates - continued
Distribution and Service Plan - continued
For the period, the Distribution and Service Fee rates and the total amounts paid to and retained by FDC were as follows:
| Distribution
Fee | Service
Fee | Paid to
FDC | Retained
by FDC |
Class A | 0% | .25% | $ 67 | $ 3 |
Class T | .25% | .25% | 143 | 1 |
Class B | .75% | .25% | 71 | 54 |
Class C | .75% | .25% | 135 | 4 |
| | | $ 416 | $ 62 |
Sales Load. FDC receives a front-end sales charge of up to 5.75% for selling Class A shares, and 3.50% for selling Class T shares, some of which is paid to financial intermediaries for selling shares of the Fund. FDC receives the proceeds of contingent deferred sales charges levied on Class A, Class T, Class B, and Class C redemptions. These charges depend on the holding period. The deferred sales charges range from 5% to 1% for Class B, 1% for Class C, 1.00% to .50% for certain purchases of Class A shares and .25% for certain purchases of Class T shares.
For the period, sales charge amounts retained by FDC were as follows:
| Retained
by FDC |
Class A | $ 2 |
Class T | 2 |
Class B* | 12 |
Class C* | 2 |
| $ 18 |
* When Class B and Class C shares are initially sold, FDC pays commissions from its own resources to financial intermediaries through which the sales are made.
Transfer Agent Fees. Fidelity Investments Institutional Operations Company, Inc. (FIIOC), an affiliate of FMR, is the transfer, dividend disbursing and shareholder servicing agent for each class of the Fund. FIIOC receives account fees and asset-based fees that vary according to the account size and type of account of the shareholders of the respective classes of the Fund. FIIOC pays for typesetting, printing and mailing of shareholder reports, except proxy statements. Prior to January 1, 2008, Fidelity Service Company, Inc. (FSC), also an affiliate of FMR, was the transfer agent for International Small Cap shares.
Annual Report
Notes to Financial Statements - continued
(Amounts in thousands except ratios)
6. Fees and Other Transactions with Affiliates - continued
Transfer Agent Fees - continued
For the period, each class paid the following transfer agent fees:
| Amount | % of
Average
Net Assets |
Class A | $ 82 | .31 |
Class T | 88 | .31 |
Class B | 22 | .31 |
Class C | 41 | .30 |
International Small Cap | 2,636 | .23 |
Institutional Class | 11 | .22 |
| $ 2,880 | |
Accounting and Security Lending Fees. FSC, an affiliate of FMR, maintains the Fund's accounting records. The accounting fee is based on the level of average net assets for the month. Under a separate contract, FSC administers the security lending program. The security lending fee is based on the number and duration of lending transactions.
Brokerage Commissions. The Fund placed a portion of its portfolio transactions with brokerage firms which are affiliates of the investment adviser. The commissions paid to these affiliated firms were $1 for the period.
7. Committed Line of Credit.
The Fund participates with other funds managed by FMR in a $4.2 billion credit facility (the "line of credit") to be utilized for temporary or emergency purposes to fund shareholder redemptions or for other short-term liquidity purposes. The Fund has agreed to pay commitment fees on its pro rata portion of the line of credit, which amounted to $3 and is reflected in Miscellaneous Expense on the Statement of Operations. During the period, there were no borrowings on this line of credit.
8. Security Lending.
The Fund lends portfolio securities from time to time in order to earn additional income. On the settlement date of the loan, the Fund receives collateral (in the form of U.S. Treasury obligations, letters of credit and/or cash) against the loaned securities and maintains collateral in an amount not less than 100% of the market value of the loaned securities during the period of the loan. The market value of the loaned securities is determined at the close of business of the Fund and any additional required collateral is delivered to the Fund on the next business day. If the borrower defaults on its obligation to return the securities loaned because of insolvency or other reasons, a fund could
Annual Report
8. Security Lending - continued
experience delays and costs in recovering the securities loaned or in gaining access to the collateral. Any cash collateral received is invested in the Fidelity Securities Lending Cash Central Fund. The value of loaned securities and cash collateral at period end are disclosed on the Fund's Statement of Assets and Liabilities. Security lending income represents the income earned on investing cash collateral, less fees and expenses associated with the loan, plus any premium payments that may be received on the loan of certain types of securities. Security lending income is presented in the Statement of Operations as a component of income from Fidelity Central Funds.
9. Expense Reductions.
FMR voluntarily agreed to reimburse each class to the extent annual operating expenses exceeded certain levels of average net assets as noted in the table below. Some expenses, for example interest expense, including commitment fees, are excluded from this reimbursement.
The following classes were in reimbursement during the period:
| Expense
Limitations | Reimbursement
from adviser |
Class A | 1.65% | $ 45 |
Class T | 1.90% | 48 |
Class B | 2.40% | 13 |
Class C | 2.40% | 22 |
Institutional Class | 1.40% | 4 |
| | $ 132 |
Many of the brokers with whom FMR places trades on behalf of the Fund provided services to the Fund in addition to trade execution. These services included payments of certain expenses on behalf of the Fund totaling $591 for the period. In addition, through arrangements with the Fund's custodian and each class' transfer agent, credits realized as a result of uninvested cash balances were used to reduce the Fund's expenses. During the period, credits reduced each class' transfer agent expense as noted in the table below.
| Transfer Agent
expense reduction |
International Small Cap | $ 13 |
Annual Report
Notes to Financial Statements - continued
(Amounts in thousands except ratios)
10. Other.
The Fund's organizational documents provide former and current trustees and officers with a limited indemnification against liabilities arising in connection with the performance of their duties to the Fund. In the normal course of business, the Fund may also enter into contracts that provide general indemnifications. The Fund's maximum exposure under these arrangements is unknown as this would be dependent on future claims that may be made against the Fund. The risk of material loss from such claims is considered remote.
In December 2006, the Independent Trustees, with the assistance of independent counsel, completed an investigation regarding gifts, gratuities and business entertainment provided by certain brokers to certain individuals who were employed on FMR's domestic equity trading desk during the period 2002 to 2004. The Independent Trustees and FMR agreed that, despite the absence of proof that the Fidelity mutual funds experienced diminished execution quality as a result of the improper receipt of gifts and business entertainment, the conduct at issue was serious and was worthy of redress. Accordingly, the Independent Trustees requested, and FMR agreed to make, a payment of $42 million plus accrued interest, which equaled approximately $7.3 million, to certain Fidelity mutual funds.
In March 2008, the Trustees approved a method for allocating this payment among the funds and, in total, FMR paid the fund $1, which is recorded in the accompanying Statement of Operations.
In a related administrative order dated March 5, 2008, the U.S. Securities and Exchange Commission ("SEC") announced a settlement with FMR and FMR Co., Inc. (an affiliate of FMR) involving the SEC's regulatory rules for investment advisers and the improper receipt of gifts, gratuities and business entertainment. Without admitting or denying the SEC's findings, FMR agreed to pay an $8 million civil penalty to the United States Treasury.
11. Distributions to Shareholders.
Distributions to shareholders of each class were as follows:
Years ended October 31, | 2008 | 2007 |
From net investment income | | |
Class A | $ 32 | $ - |
International Small Cap | 6,232 | 3,765 |
Institutional Class | 29 | 22 |
Total | $ 6,293 | $ 3,787 |
Annual Report
11. Distributions to Shareholders - continued
Distributions to shareholders of each class were as follows:
Years ended October 31, | 2008 | 2007 |
From net realized gain | | |
Class A | $ 6,370 | $ 6,864 |
Class T | 6,691 | 7,706 |
Class B | 1,698 | 2,092 |
Class C | 3,224 | 3,882 |
International Small Cap | 268,817 | 328,782 |
Institutional Class | 1,248 | 1,678 |
Total | $ 288,048 | $ 351,004 |
12. Share Transactions.
Transactions for each class of shares were as follows:
| Shares | Dollars |
Years ended October 31, | 2008 | 2007 | 2008 | 2007 |
Class A | | | | |
Shares sold | 288 | 268 | $ 6,010 | $ 7,316 |
Reinvestment of distributions | 250 | 252 | 5,922 | 6,096 |
Shares redeemed | (639) | (556) | (12,839) | (14,980) |
Net increase (decrease) | (101) | (36) | $ (907) | $ (1,568) |
Class T | | | | |
Shares sold | 197 | 226 | $ 4,234 | $ 6,120 |
Reinvestment of distributions | 267 | 297 | 6,298 | 7,166 |
Shares redeemed | (643) | (671) | (12,849) | (17,855) |
Net increase (decrease) | (179) | (148) | $ (2,317) | $ (4,569) |
Class B | | | | |
Shares sold | 15 | 19 | $ 298 | $ 519 |
Reinvestment of distributions | 66 | 79 | 1,550 | 1,892 |
Shares redeemed | (155) | (149) | (3,078) | (3,957) |
Net increase (decrease) | (74) | (51) | $ (1,230) | $ (1,546) |
Class C | | | | |
Shares sold | 43 | 56 | $ 916 | $ 1,462 |
Reinvestment of distributions | 110 | 124 | 2,587 | 2,967 |
Shares redeemed | (325) | (277) | (6,282) | (7,298) |
Net increase (decrease) | (172) | (97) | $ (2,779) | $ (2,869) |
Annual Report
Notes to Financial Statements - continued
(Amounts in thousands except ratios)
12. Share Transactions - continued
Transactions for each class of shares were as follows:
| Shares | Dollars |
Years ended October 31, | 2008 | 2007 | 2008 | 2007 |
International Small Cap | | | | |
Shares sold | 6,448 | 7,028 | $ 135,999 | $ 194,115 |
Reinvestment of distributions | 10,463 | 12,767 | 249,850 | 311,000 |
Shares redeemed | (25,232) | (29,445) | (501,269) | (791,655) |
Net increase (decrease) | (8,321) | (9,650) | $ (115,420) | $ (286,540) |
Institutional Class | | | | |
Shares sold | 51 | 47 | $ 1,128 | $ 1,226 |
Reinvestment of distributions | 31 | 39 | 750 | 938 |
Shares redeemed | (145) | (150) | (2,999) | (3,984) |
Net increase (decrease) | (63) | (64) | $ (1,121) | $ (1,820) |
Annual Report
To the Trustees of Fidelity Investment Trust and Shareholders of Fidelity International Small Cap Fund:
We have audited the accompanying statement of assets and liabilities of Fidelity International Small Cap Fund (the Fund), a fund of Fidelity Investment Trust, including the schedule of investments, as of October 31, 2008, and the related statement of operations for the year then ended, the statement of changes in net assets for each of the two years in the period then ended, and the financial highlights for each of the five years in the period then ended. These financial statements and financial highlights are the responsibility of the Fund's management. Our responsibility is to express an opinion on these financial statements and financial highlights based on our audits.
We conducted our audits in accordance with standards of the Public Company Accounting Oversight Board (United States). Those standards require that we plan and perform the audit to obtain reasonable assurance about whether the financial statements and financial highlights are free of material misstatement. The Fund is not required to have, nor were we engaged to perform, an audit of its internal control over financial reporting. Our audits included consideration of internal control over financial reporting as a basis for designing audit procedures that are appropriate in the circumstances, but not for the purpose of expressing an opinion on the effectiveness of the Fund's internal control over financial reporting. Accordingly, we express no such opinion. An audit also includes examining, on a test basis, evidence supporting the amounts and disclosures in the financial statements, assessing the accounting principles used and significant estimates made by management, as well as evaluating the overall financial statement presentation. Our procedures included confirmation of securities owned as of October 31, 2008, by correspondence with the custodians and brokers; where replies were not received from brokers, we performed other auditing procedures. We believe that our audits provide a reasonable basis for our opinion.
In our opinion, the financial statements and financial highlights referred to above present fairly, in all material respects, the financial position of Fidelity International Small Cap Fund as of October 31, 2008, the results of its operations for the year then ended, the changes in its net assets for each of the two years in the period then ended, and its financial highlights for each of the five years in the period then ended, in conformity with accounting principles generally accepted in the United States of America.
/s/ Deloitte & Touche LLP
DELOITTE & TOUCHE LLP
Boston, Massachusetts
December 23, 2008
Annual Report
The Trustees, Member of the Advisory Board, and executive officers of the trust and fund, as applicable, are listed below. The Board of Trustees governs the fund and is responsible for protecting the interests of shareholders. The Trustees are experienced executives who meet periodically throughout the year to oversee the fund's activities, review contractual arrangements with companies that provide services to the fund, and review the fund's performance. Except for Edward C. Johnson and James C. Curvey, each of the Trustees oversees 220 funds advised by FMR or an affiliate. Messrs. Johnson and Curvey oversee 379 funds advised by FMR or an affiliate.
The Trustees hold office without limit in time except that (a) any Trustee may resign; (b) any Trustee may be removed by written instrument, signed by at least two-thirds of the number of Trustees prior to such removal; (c) any Trustee who requests to be retired or who has become incapacitated by illness or injury may be retired by written instrument signed by a majority of the other Trustees; and (d) any Trustee may be removed at any special meeting of shareholders by a two-thirds vote of the outstanding voting securities of the trust. Each Trustee who is not an interested person (as defined in the 1940 Act) (Independent Trustee), shall retire not later than the last day of the calendar year in which his or her 72nd birthday occurs. The Independent Trustees may waive this mandatory retirement age policy with respect to individual Trustees. The executive officers and Advisory Board Member hold office without limit in time, except that any officer and Advisory Board Member may resign or may be removed by a vote of a majority of the Trustees at any regular meeting or any special meeting of the Trustees. Except as indicated, each individual has held the office shown or other offices in the same company for the past five years.
The fund's Statement of Additional Information (SAI) includes more information about the Trustees. To request a free copy, call Fidelity at 1-800-544-8544.
Interested Trustees*:
Correspondence intended for each Trustee who is an interested person may be sent to Fidelity Investments, 82 Devonshire Street, Boston, Massachusetts 02109.
Name, Age; Principal Occupation |
Edward C. Johnson 3d (78) |
| Year of Election or Appointment: 1984 Mr. Johnson is Chairman of the Board of Trustees. Mr. Johnson serves as Chief Executive Officer, Chairman, and a Director of FMR LLC; Chairman and a Director of FMR; Chairman and a Director of Fidelity Research & Analysis Company (FRAC); Chairman and a Director of Fidelity Investments Money Management, Inc.; and Chairman and a Director of FMR Co., Inc. In addition, Mr. Johnson serves as Chairman and Director of FIL Limited. Previously, Mr. Johnson served as President of FMR LLC (2006-2007). |
James C. Curvey (73) |
| Year of Election or Appointment: 2007 Mr. Curvey also serves as Trustee (2007-present) of other investment companies advised by FMR. Mr. Curvey is a Director of FMR and FMR Co., Inc. (2007-present). Mr. Curvey is also Vice Chairman (2006-
present) and Director of FMR LLC. In addition, Mr. Curvey serves as an Overseer for the Boston Symphony Orchestra and a member of the Trustees of Villanova University. |
* Trustees have been determined to be "Interested Trustees" by virtue of, among other things, their affiliation with the trust or various entities under common control with FMR. FMR Corp. merged with and into FMR LLC on October 1, 2007. Any references to FMR LLC for prior periods are deemed to be references to the prior entity.
Independent Trustees:
Correspondence intended for each Independent Trustee (that is, the Trustees other than the Interested Trustees) may be sent to Fidelity Investments, P.O. Box 55235, Boston, Massachusetts 02205-5235.
Name, Age; Principal Occupation |
Dennis J. Dirks (60) |
| Year of Election or Appointment: 2005 Prior to his retirement in May 2003, Mr. Dirks was Chief Operating Officer and a member of the Board of The Depository Trust & Clearing Corporation (DTCC) (1999-2003). He also served as President, Chief Operating Officer, and Board member of The Depository Trust Company (DTC) (1999-2003) and President and Board member of the National Securities Clearing Corporation (NSCC) (1999-2003). In addition, Mr. Dirks served as a Trustee and a member of the Finance Committee of Manhattan College (2005-2008), and as Chief Executive Officer and Board member of the Government Securities Clearing Corporation (2001-2003) and Chief Executive Officer and Board member of the Mortgage-Backed Securities Clearing Corporation (2001-2003). Mr. Dirks also serves as a Trustee and a member of the Finance Committee of AHRC of Nassau County (2006-present). |
Alan J. Lacy (55) |
| Year of Election or Appointment: 2008 Mr. Lacy serves as Senior Adviser (2007-present) of Oak Hill Capital Partners, L.P. (a private equity firm). Mr. Lacy also served as Chief Executive Officer (2000-2005) and Vice Chairman (2005-2006) of Sears Holdings Corporation and Sears, Roebuck and Co. (retail). In addition, Mr. Lacy serves as a member of the Board of Directors of The Western Union Company (global money transfer, 2006-present) and Bristol-Myers Squibb (global pharmaceuticals, 2007-present). Mr. Lacy is a Trustee of the National Parks Conservation Association and The Field Museum of Natural History. |
Ned C. Lautenbach (64) |
| Year of Election or Appointment: 2000 Mr. Lautenbach is Chairman of the Independent Trustees (2006-present). Mr. Lautenbach is an Advisory Partner of Clayton, Dubilier & Rice, Inc. (private equity investment firm). Previously, Mr. Lautenbach was with the International Business Machines Corporation (IBM) from 1968 until his retirement in 1998. Mr. Lautenbach serves as a Director of Eaton Corporation (diversified industrial) as well as the Philharmonic Center for the Arts in Naples, Florida. He also is a member of the Board of Trustees of Fairfield University (2005-present), as well as a member of the Council on Foreign Relations. Previously, Mr. Lautenbach served as a Director of Sony Corporation (2006-2007). |
Joseph Mauriello (64) |
| Year of Election or Appointment: 2008 Prior to his retirement in January 2006, Mr. Mauriello served in numerous senior management positions including Deputy Chairman and Chief Operating Officer (2004-2005), and Vice Chairman of Financial Services (2002-2004) of KPMG LLP US (professional services firm, 1965-2005). Mr. Mauriello currently serves as a member of the Board of Directors of XL Capital Ltd. (global insurance and re-insurance company, 2006-
present) and of Arcadia Resources Inc. (health care services and products, 2007-present). He also served as a Director of the Hamilton Funds of the Bank of New York (2006-2007). |
Cornelia M. Small (64) |
| Year of Election or Appointment: 2005 Ms. Small is a member of the Investment Committee, and Chair (2008-present) and a member of the Board of Trustees of Smith College. Ms. Small also serves on the Investment Committee of the Berkshire Taconic Community Foundation (2008-present). Previously, Ms. Small served as Chairperson of the Investment Committee (2002-2008) of Smith College and as Co-Chair (2000-2003) of the Annual Fund for the Fletcher School of Law and Diplomacy. In addition, she served as Chief Investment Officer, Director of Global Equity Investments, and a member of the Board of Directors of Scudder, Stevens & Clark and Scudder Kemper Investments. |
William S. Stavropoulos (69) |
| Year of Election or Appointment: 2001 Mr. Stavropoulos is Chairman Emeritus of the Board of Directors of The Dow Chemical Company, where he previously served in numerous senior management positions, including President (1993-2000; 2002-
2003), CEO (1995-2000; 2002-2004), Chairman of the Executive Committee (2000-2006), and as a member of the Board of Directors (1990-2006). Currently, he is a Director of Teradata Corporation (data warehousing and technology solutions, 2008-present), Chemical Financial Corporation, Maersk Inc. (industrial conglomerate), Tyco International, Inc. (multinational manufacturing and services, 2007-present), and a member of the Advisory Board for Metalmark Capital (private equity investment firm, 2005-present). He is a special advisor to Clayton, Dubilier & Rice, Inc. (private equity investment). In addition, Mr. Stavropoulos is a member of the University of Notre Dame Advisory Council for the College of Science. |
David M. Thomas (59) |
| Year of Election or Appointment: 2008 Previously, Mr. Thomas served as Executive Chairman (2005-2006) and Chairman and Chief Executive Officer (2000-2005) of IMS Health, Inc. (pharmaceutical and healthcare information solutions). In addition, Mr. Thomas serves as a member of the Board of Directors of Fortune Brands, Inc. (consumer products holding company), and Interpublic Group of Companies, Inc. (marketing communication, 2004-present). |
Michael E. Wiley (58) |
| Year of Election or Appointment: 2008 Mr. Wiley also serves as a member of the Board of Trustees of the University of Tulsa (2000-2006; 2007-present). He serves as a Director of Tesoro Corporation (independent oil refiner and marketer, 2005-present), and a Director of Bill Barrett Corporation (exploration and production company, 2005-present). In addition, he also serves as a Director of Post Oak Bank (privately-held bank, 2004-present). Previously, Mr. Wiley served as a Sr. Energy Advisor of Katzenbach Partners, LLC (consulting firm, 2006-
2007), as an Advisory Director of Riverstone Holdings (private investment firm), Chairman, President, and CEO of Baker Hughes, Inc. (oilfield services company, 2000-2004), and as Director of Spinnaker Exploration Company (exploration and production company, 2001-2005). |
Advisory Board Member and Executive Officers**:
Correspondence intended for each executive officer and Mr. Lynch may be sent to Fidelity Investments, 82 Devonshire Street, Boston, Massachusetts 02109.
Name, Age; Principal Occupation |
Peter S. Lynch (64) |
| Year of Election or Appointment: 2003 Member of the Advisory Board of Fidelity's Equity and High Income Funds. Mr. Lynch is Vice Chairman and a Director of FMR, and Vice Chairman (2001-present) and a Director of FMR Co., Inc. Previously, Mr. Lynch served as a Trustee of the Fidelity funds (1990-2003). In addition, he serves as a Trustee of Boston College and as the Chairman of the Inner-City Scholarship Fund. Previously, Mr. Lynch served on the Special Olympics International Board of Directors (1997-2006). |
Kenneth B. Robins (39) |
| Year of Election or Appointment: 2008 President and Treasurer of Fidelity's Equity and High Income Funds. Mr. Robins is an employee of Fidelity Investments (2004-present). Before joining Fidelity Investments, Mr. Robins worked at KPMG LLP, where he was a partner in KPMG's department of professional practice (2002-2004). |
Walter C. Donovan (46) |
| Year of Election or Appointment: 2007 Vice President of Fidelity's Equity Funds. Mr. Donovan also serves as President of FMR and FMR Co., Inc., and Executive Vice President of Fidelity Investments Money Management, Inc. (2007-present). Previously, Mr. Donovan served as Executive Vice President of FMR and FMR Co., Inc. (2005-2007) and Senior Vice President of FMR (2003-2005) and FMR Co., Inc. (2004-2005). |
Eric M. Wetlaufer (46) |
| Year of Election or Appointment: 2006 Vice President of Fidelity's International Equity Funds. Mr. Wetlaufer also serves as Group Chief Investment Officer of FMR. Mr. Wetlaufer is Chairman, Chief Executive Officer, and President of Fidelity Management & Research (Hong Kong) Limited (2008-present); Chairman, Chief Executive Officer, President, and a Director of Fidelity Management & Research (Japan) Inc. (2008-present); Chairman and Chief Executive Officer (2007-present) and President and a Director (2006-present) of Fidelity Management & Research (U.K.) Inc. and President and a Director of Fidelity Research & Analysis Company (2006-present). Before joining Fidelity Investments in 2005, Mr. Wetlaufer was a partner in Oxhead Capital Management (2004-2005) and a Chief Investment Officer of Putnam Investments (1997-2003). |
Scott C. Goebel (40) |
| Year of Election or Appointment: 2008 Secretary and Chief Legal Officer (CLO) of the Fidelity funds. Mr. Goebel also serves as General Counsel, Secretary, and Senior Vice President of FMR (2008-present); Deputy General Counsel of FMR LLC; Chief Legal Secretary of Fidelity Management & Research (Hong Kong) Limited (2008-present) and Assistant Secretary of Fidelity Management & Research (Japan) Inc. (2008-present). Previously, Mr. Goebel served as Assistant Secretary of the Funds (2007-2008) and as Vice President and Secretary of Fidelity Distributors Corporation (FDC) (2005-2007). |
John B. McGinty, Jr. (46) |
| Year of Election or Appointment: 2008 Assistant Secretary of Fidelity's Equity and High Income Funds. Mr. McGinty is an employee of Fidelity Investments (2004-present). Mr. McGinty also serves as Senior Vice President, Secretary, and Chief Legal Officer of FDC (2007-present). Before joining Fidelity Investments, Mr. McGinty practiced law at Ropes & Gray, LLP. |
Holly C. Laurent (54) |
| Year of Election or Appointment: 2008 Anti-Money Laundering (AML) Officer of the Fidelity funds. Ms. Laurent is an employee of Fidelity Investments. Previously, Ms. Laurent was Senior Vice President and Head of Legal for Fidelity Business Services India Pvt. Ltd. (2006-2008), Senior Vice President, Deputy General Counsel and Group Head for FMR LLC (2005-2006). |
Christine Reynolds (50) |
| Year of Election or Appointment: 2008 Chief Financial Officer of the Fidelity funds. Ms. Reynolds became President of Fidelity Pricing and Cash Management Services (FPCMS) in August 2008. She served as Chief Operating Officer of FPCMS from 2007 through July 2008. Previously, Ms. Reynolds served as President, Treasurer, and Anti-Money Laundering Officer of the Fidelity funds (2004-
2007). Before joining Fidelity Investments, Ms. Reynolds worked at PricewaterhouseCoopers LLP (PwC) (1980-2002), where she was an audit partner with PwC's investment management practice. |
Kenneth A. Rathgeber (61) |
| Year of Election or Appointment: 2004 Chief Compliance Officer of Fidelity's Equity and High Income Funds. Mr. Rathgeber is Chief Compliance Officer of Fidelity Management & Research (Hong Kong) Limited (2008-present), Fidelity Management & Research (Japan) Inc. (2008-present), FMR (2005-present), FMR Co., Inc. (2005-present), Fidelity Management & Research (U.K.) Inc. (2005-
present), Fidelity Research & Analysis Company (2005-present), Fidelity Investments Money Management, Inc. (2005-present), and Strategic Advisers, Inc. (2005-present). |
Bryan A. Mehrmann (47) |
| Year of Election or Appointment: 2005 Deputy Treasurer of the Fidelity funds. Mr. Mehrmann is an employee of Fidelity Investments. Previously, Mr. Mehrmann served as Vice President of Fidelity Investments Institutional Services Group (FIIS)/Fidelity Investments Institutional Operations Corporation, Inc. (FIIOC) Client Services (1998-2004). |
Adrien E. Deberghes (41) |
| Year of Election or Appointment: 2008 Deputy Treasurer of Fidelity's Equity and High Income Funds. Mr. Deberghes is an employee of Fidelity Investments (2008-present). Previously, Mr. Deberghes served as Senior Vice President of Mutual Fund Administration at State Street Corporation (2007-2008), Senior Director of Mutual Fund Administration at Investors Bank & Trust (2005-2007), and Director of Finance for Dunkin' Brands (2000-2005). |
Robert G. Byrnes (41) |
| Year of Election or Appointment: 2005 Assistant Treasurer of the Fidelity funds. Mr. Byrnes is an employee of Fidelity Investments (2005-present). Previously, Mr. Byrnes served as Vice President of Fidelity Pricing and Cash Management Services (FPCMS) (2003-2005). Before joining Fidelity Investments, Mr. Byrnes worked at Deutsche Asset Management where he served as Vice President of the Investment Operations Group (2000-2003). |
Peter L. Lydecker (54) |
| Year of Election or Appointment: 2004 Assistant Treasurer of the Fidelity funds. Mr. Lydecker is an employee of Fidelity Investments. |
Paul M. Murphy (61) |
| Year of Election or Appointment: 2007 Assistant Treasurer of the Fidelity funds. Mr. Murphy is an employee of Fidelity Investments (2007-present). Previously, Mr. Murphy served as Chief Financial Officer of the Fidelity Funds (2005-2006), Vice President and Associate General Counsel of FMR (2007), and Senior Vice President of Fidelity Pricing and Cash Management Services (FPCMS) (1994-2007). |
Gary W. Ryan (50) |
| Year of Election or Appointment: 2005 Assistant Treasurer of the Fidelity funds. Mr. Ryan is an employee of Fidelity Investments. Previously, Mr. Ryan served as Vice President of Fund Reporting in Fidelity Pricing and Cash Management Services (FPCMS) (1999-2005). |
** FMR Corp. merged with and into FMR LLC on October 1, 2007. Any references to FMR LLC for prior periods are deemed to be references to the prior entity.
Annual Report
The fund designates 21% of the dividends distributed during the fiscal year as amounts which may be taken into account as a dividend for the purposes of the maximum rate under section 1(h)(11) of the Internal Revenue Code.
The amounts per share which represent income derived from sources within, and taxes paid to, foreign countries or possessions of the United States are $0.326 and $0.0222 for the dividend paid December 10, 2007.
The fund will notify shareholders in January 2009 of amounts for use in preparing 2008 income tax returns.
Annual Report
A special meeting of the fund's shareholders was held on December 13, 2007. The results of votes taken among shareholders on the proposals before them are reported below. Each vote reported represents one dollar of net asset value held on the record date for the meeting.
PROPOSAL 1 |
To amend the Declaration of Trust to reduce the required quorum for shareholder meetings.A |
| # of
Votes | % of
Votes |
Affirmative | 45,014,793,255.82 | 80.372 |
Against | 6,871,112,667.08 | 12.268 |
Abstain | 2,163,456,438.02 | 3.863 |
Broker
Non-Votes | 1,958,633,563.89 | 3.497 |
TOTAL | 56,007,995,924.81 | 100.000 |
PROPOSAL 2 |
To elect the nominees specified below as Trustees.A |
| # of
Votes | % of
Votes |
James C. Curvey |
Affirmative | 53,384,952,361.03 | 95.317 |
Withheld | 2,623,043,563.78 | 4.683 |
TOTAL | 56,007,995,924.81 | 100.000 |
Dennis J. Dirks |
Affirmative | 53,595,104,608.67 | 95.692 |
Withheld | 2,412,891,316.14 | 4.308 |
TOTAL | 56,007,995,924.81 | 100.000 |
Albert R. Gamper, Jr. |
Affirmative | 53,570,235,221.69 | 95.647 |
Withheld | 2,437,760,703.12 | 4.353 |
TOTAL | 56,007,995,924.81 | 100.000 |
George H. Heilmeier |
Affirmative | 53,166,350,588.50 | 94.926 |
Withheld | 2,841,645,336.31 | 5.074 |
TOTAL | 56,007,995,924.81 | 100.000 |
| # of
Votes | % of
Votes |
Edward C. Johnson 3d |
Affirmative | 53,230,508,654.93 | 95.041 |
Withheld | 2,777,487,269.88 | 4.959 |
TOTAL | 56,007,995,924.81 | 100.000 |
James H. Keyes |
Affirmative | 53,549,161,456.52 | 95.610 |
Withheld | 2,458,834,468.29 | 4.390 |
TOTAL | 56,007,995,924.81 | 100.000 |
Marie L. Knowles |
Affirmative | 53,543,925,066.86 | 95.601 |
Withheld | 2,464,070,857.95 | 4.399 |
TOTAL | 56,007,995,924.81 | 100.000 |
Ned C. Lautenbach |
Affirmative | 53,547,116,322.50 | 95.606 |
Withheld | 2,460,879,602.31 | 4.394 |
TOTAL | 56,007,995,924.81 | 100.000 |
Cornelia M. Small |
Affirmative | 53,564,793,514.25 | 95.638 |
Withheld | 2,443,202,410.56 | 4.362 |
TOTAL | 56,007,995,924.81 | 100.000 |
William S. Stavropoulos |
Affirmative | 53,426,544,502.76 | 95.391 |
Withheld | 2,581,451,422.05 | 4.609 |
TOTAL | 56,007,995,924.81 | 100.000 |
Kenneth L. Wolfe |
Affirmative | 53,229,881,790.63 | 95.040 |
Withheld | 2,778,114,134.18 | 4.960 |
TOTAL | 56,007,995,924.81 | 100.000 |
A Denotes trust-wide proposal and voting results.
Annual Report
Proxy Voting Results
A special meeting of the fund's shareholders was held on April 16, 2008. The results of votes taken among shareholders on the proposal before them are reported below. Each vote reported represents one dollar of net asset value held on the record date for the meeting.
PROPOSAL 1 |
To elect a Board of Trustees.A |
| # of
Votes | % of
Votes |
James C. Curvey |
Affirmative | 44,485,656,811.55 | 94.702 |
Withheld | 2,488,551,854.62 | 5.298 |
TOTAL | 46,974,208,666.17 | 100.000 |
Dennis J. Dirks |
Affirmative | 44,706,671,638.31 | 95.173 |
Withheld | 2,267,537,027.86 | 4.827 |
TOTAL | 46,974,208,666.17 | 100.000 |
Edward C. Johnson 3d |
Affirmative | 44,294,881,638.16 | 94.296 |
Withheld | 2,679,327,028.01 | 5.704 |
TOTAL | 46,974,208,666.17 | 100.000 |
Alan J. Lacy |
Affirmative | 44,685,373,413.16 | 95.127 |
Withheld | 2,288,835,253.01 | 4.873 |
TOTAL | 46,974,208,666.17 | 100.000 |
Ned C. Lautenbach |
Affirmative | 44,634,541,379.41 | 95.019 |
Withheld | 2,339,667,286.76 | 4.981 |
TOTAL | 46,974,208,666.17 | 100.000 |
Joseph Mauriello |
Affirmative | 44,683,962,099.80 | 95.124 |
Withheld | 2,290,246,566.37 | 4.876 |
TOTAL | 46,974,208,666.17 | 100.000 |
Cornelia M. Small |
Affirmative | 44,671,688,375.36 | 95.098 |
Withheld | 2,302,520,290.81 | 4.902 |
TOTAL | 46,974,208,666.17 | 100.000 |
| # of
Votes | % of
Votes |
William S. Stavropoulos |
Affirmative | 44,465,262,087.61 | 94.659 |
Withheld | 2,508,946,578.56 | 5.341 |
TOTAL | 46,974,208,666.17 | 100.000 |
David M. Thomas |
Affirmative | 44,694,340,813.87 | 95.147 |
Withheld | 2,279,867,852.30 | 4.853 |
TOTAL | 46,974,208,666.17 | 100.000 |
Michael E. Wiley |
Affirmative | 44,686,513,174.78 | 95.130 |
Withheld | 2,287,695,491.39 | 4.870 |
TOTAL | 46,974,208,666.17 | 100.000 |
A Denotes trust-wide proposal and voting results.
Annual Report
Board Approval of Investment Advisory Contracts and Management Fees
Fidelity International Small Cap Fund
Each year, typically in July, the Board of Trustees, including the Independent Trustees (together, the Board), votes on the renewal of the management contract and sub-advisory agreements (together, the Advisory Contracts) for the fund. The Board, assisted by the advice of fund counsel and Independent Trustees' counsel, requests and considers a broad range of information throughout the year.
The Board meets regularly and, acting directly and through its separate committees, requests and receives information concerning, and considers at each of its meetings factors that are relevant to, its annual consideration of the renewal of the fund's Advisory Contracts, including the services and support provided to the fund and its shareholders. At the time of the renewal, the Board had 12 standing committees, each composed of Independent Trustees with varying backgrounds, to which the Board has assigned specific subject matter responsibilities in order to enhance effective decision-making by the Board. Each committee has a written charter outlining the structure and purposes of the committee. The Board also meets as needed to consider matters specifically related to the Board's annual consideration of the renewal of Advisory Contracts.
At its July 2008 meeting, the Board of Trustees, including the Independent Trustees, unanimously determined to renew the fund's Advisory Contracts. In reaching its determination, the Board considered all factors it believed relevant, including (i) the nature, extent, and quality of the services to be provided to the fund and its shareholders (including the investment performance of the fund); (ii) the competitiveness of the fund's management fee and total expenses; (iii) the total costs of the services to be provided by and the profits to be realized by Fidelity from its relationship with the fund; (iv) the extent to which economies of scale would be realized as the fund grows; and (v) whether fee levels reflect these economies of scale, if any, for the benefit of fund shareholders. The Board also approved agreements with foreign sub-advisers Fidelity Management & Research (Japan) Inc. and Fidelity Management & Research (Hong Kong) Limited, as well as amendments to the fund's agreement with Fidelity Management & Research (U.K.) Inc.
In considering whether to renew the Advisory Contracts for the fund, the Board ultimately reached a determination, with the assistance of fund counsel and Independent Trustees' counsel and through the exercise of its business judgment, that the renewal of the Advisory Contracts and the compensation to be received by Fidelity under the management contract is consistent with Fidelity's fiduciary duty under applicable law. The Board's decision to renew the Advisory Contracts was not based on any single factor noted above, but rather was based on a comprehensive consideration of all the information provided to the Board at its meetings throughout the year. The Board, in reaching its determination to renew the Advisory Contracts, is aware that shareholders in the fund have a broad range of investment choices available to them, including a wide choice among mutual funds offered by competitors to Fidelity, and that the fund's shareholders, with the opportunity to review and weigh the disclosure provided by the fund in its prospectus and other public disclosures, have chosen to invest in this fund, managed by Fidelity.
Annual Report
Nature, Extent, and Quality of Services Provided. The Board considered staffing within the investment adviser, FMR, and the sub-advisers (together, the Investment Advisers), including the backgrounds of the fund's investment personnel and the fund's investment objective and discipline. The Independent Trustees also had discussions with senior management of Fidelity's investment operations and investment groups. The Board considered the structure of the portfolio manager compensation program and whether this structure provides appropriate incentives.
Resources Dedicated to Investment Management and Support Services. The Board reviewed the size, education, and experience of the Investment Advisers' investment staff, their use of technology, and the Investment Advisers' approach to recruiting, training, and retaining portfolio managers and other research, advisory, and management personnel. The Board noted that Fidelity's analysts have access to a variety of technological tools that enable them to perform both fundamental and quantitative analysis and to specialize in various disciplines. The Board considered Fidelity's extensive global research capabilities that enable the Investment Advisers to aggregate data from various sources in an effort to produce positive investment results. The Board also considered that Fidelity's portfolio managers and analysts have access to daily portfolio attribution that allows for monitoring of a fund's portfolio, as well as an electronic communication system that provides immediate real-time access to research concerning issuers and credit enhancers.
Shareholder and Administrative Services. The Board considered (i) the nature, extent, quality, and cost of advisory, administrative, distribution, and shareholder services performed by the Investment Advisers and their affiliates under the Advisory Contracts and under separate agreements covering transfer agency, pricing and bookkeeping, and securities lending services for the fund; (ii) the nature and extent of the Investment Advisers' supervision of third party service providers, principally custodians and subcustodians; and (iii) the resources devoted to, and the record of compliance with, the fund's compliance policies and procedures. The Board also reviewed the allocation of fund brokerage, including allocations to brokers affiliated with the Investment Advisers, the use of brokerage commissions to pay fund expenses, and the use of "soft" commission dollars to pay for research services. The Board further considered that Fidelity voluntarily pays for market data out of its own resources.
The Board noted that the growth of fund assets across the complex allows Fidelity to reinvest in the development of services designed to enhance the value or convenience of the Fidelity funds as investment vehicles. These services include 24-hour access to account information and market information through phone representatives and over the Internet, and investor education materials and asset allocation tools.
Annual Report
Board Approval of Investment Advisory Contracts and
Management Fees - continued
Investment in a Large Fund Family. The Board considered the benefits to shareholders of investing in a Fidelity fund, including the benefits of investing in a fund that is part of a large family of funds offering a variety of investment disciplines and providing for a large variety of mutual fund investor services. For example, fund shareholders are offered the privilege of exchanging shares of the fund for shares of other Fidelity funds, as set forth in the fund's prospectus, without paying a sales charge. The Board noted that, Fidelity has taken a number of actions over the previous year that benefited particular funds, including (i) dedicating additional resources to investment research and to restructure the investment research teams; (ii) contractually agreeing to reduce the management fees on Fidelity's Institutional Money Market Funds and launching Class IV and Institutional Class of certain of these funds; (iii) reducing the transfer agent fees for the Fidelity Select Portfolios and Investor Class of the VIP funds; and (iv) launching Class K of 29 equity funds as a lower-fee class available to certain employer-sponsored retirement plans.
Investment Performance. The Board considered whether the fund has operated within its investment objective, as well as its record of compliance with its investment restrictions. It also reviewed the fund's absolute investment performance for each class, as well as the fund's relative investment performance for each class measured against (i) a broad-based securities market index, and (ii) a peer group of mutual funds deemed appropriate by the Board over multiple periods. The following charts considered by the Board show, over the one-, three-, and five-year periods ended December 31, 2007, as available, the cumulative total returns of Fidelity International Small Cap (retail class) and Class B of the fund, the cumulative total returns of a broad-based securities market index ("benchmark"), and a range of cumulative total returns of a peer group of mutual funds identified by Lipper Inc. as having an investment objective similar to that of the fund. The returns of Fidelity International Small Cap (retail class) and Class B show the performance of the highest and lowest performing classes, respectively (based on three-year performance). The box within each chart shows the 25th percentile return (bottom of box) and the 75th percentile return (top of box) of the peer group. Returns shown above the box are in the first quartile and returns shown below the box are in the fourth quartile. The percentage beaten numbers noted below each chart correspond to the percentile box and represent the percentage of funds in the peer group whose performance was equal to or lower than that of the class indicated.
Annual Report
Fidelity International Small Cap Fund
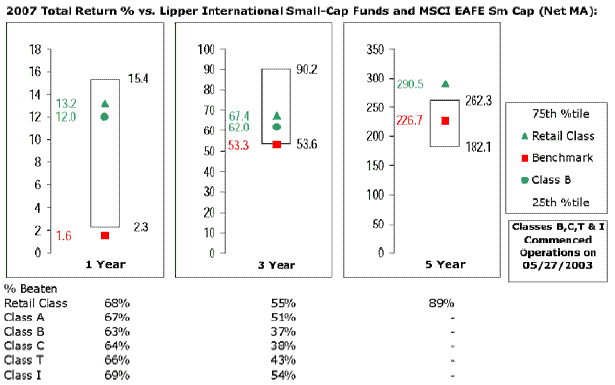
The Board reviewed the fund's relative investment performance against its peer group and stated that the performance of Fidelity International Small Cap (retail class) of the fund was in the second quartile for the one- and three-year periods and the first quartile for the five-year period. The Board also stated that the investment performance of Fidelity International Small Cap (retail class) of the fund compared favorably to its benchmark for all the periods shown. The Board considered that the variations in performance among the fund's classes reflect the variations in class expenses, which result in lower performance for higher expense classes.
The Board also considered that the fund's management fee is subject to upward or downward adjustment depending upon whether, and to what extent, the fund's investment performance for the performance period exceeds, or is exceeded by, the record (over the same period) of a Board-approved performance adjustment index. The Board realizes that the performance adjustment provides FMR with a strong economic incentive to seek to achieve superior performance for the fund's shareholders and helps to more closely align the interests of FMR and the fund's shareholders.
The Board considered that FMR has taken steps to refocus and strengthen equity research, equity portfolio management, and compliance.
Based on its review, and giving particular weight to the nature and quality of the resources dedicated by the Investment Advisers to maintain and improve relative performance, the Board concluded that the nature, extent, and quality of the services provided to the fund will benefit the fund's shareholders, particularly in light of the Board's view that the fund's shareholders benefit from investing in a fund that is part of a large family of funds offering a variety of investment disciplines and services.
Annual Report
Board Approval of Investment Advisory Contracts and
Management Fees - continued
Competitiveness of Management Fee and Total Fund Expenses. The Board considered the fund's management fee and total expenses compared to "mapped groups" of competitive funds and classes. Fidelity creates "mapped groups" by combining similar Lipper investment objective categories that have comparable management fee characteristics. Combining Lipper investment objective categories aids the Board's management fee and total expense comparisons by broadening the competitive group used for comparison and by reducing the number of universes to which various Fidelity funds are compared. The Board also considered supplemental information about how the fund's management fee and total expenses ranked relative to groups based on Lipper classifications, which take into account a fund's market capitalization and style.
The Board considered two proprietary management fee comparisons for the 12-month periods shown in the chart below. The group of Lipper funds used by the Board for management fee comparisons is referred to below as the "Total Mapped Group" and, for the reasons explained above, is broader than the Lipper peer group used by the Board for performance comparisons. The Total Mapped Group comparison focuses on a fund's standing relative to the total universe of comparable funds available to investors, in terms of gross management fees before expense reimbursements or caps, and without giving effect to the fund's performance adjustment. "TMG %" represents the percentage of funds in the Total Mapped Group that had management fees that were lower than the fund's. For example, a TMG % of 21% means that 79% of the funds in the Total Mapped Group had higher management fees than the fund. The "Asset-Size Peer Group" (ASPG) comparison focuses on a fund's standing relative to non-Fidelity funds similar in size to the fund within the Total Mapped Group. The ASPG represents at least 15% of the funds in the Total Mapped Group with comparable asset size and management fee characteristics, subject to a minimum of 50 funds (or all funds in the Total Mapped Group if fewer than 50). Additional information, such as the ASPG quartile in which the fund's management fee ranked and the impact of the fund's performance adjustment, is also included in the chart and considered by the Board.
Annual Report
Fidelity International Small Cap Fund
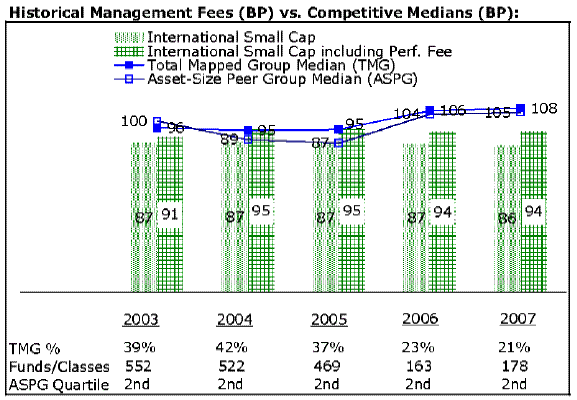
The Board noted that the fund's management fee ranked below the median of its Total Mapped Group and below the median of its ASPG for 2007. The Board also noted the effect of the fund's positive performance adjustment on the fund's management fee ranking. The Board noted that the performance adjustment for each year represents calculations for performance periods that differ from the periods shown in the performance charts above.
Based on its review, the Board concluded that the fund's management fee was fair and reasonable in light of the services that the fund receives and the other factors considered.
In its review of each class's total expenses, the Board considered the fund's management fee as well as other fund or class expenses, as applicable, such as transfer agent fees, pricing and bookkeeping fees, fund-paid 12b-1 fees, and custodial, legal, and audit fees. The Board also noted the effects of any waivers and reimbursements on fees and expenses, as well as the impact of the fund's performance adjustment. As part of its review, the Board also considered current and historical total expenses of each class of the fund compared to competitive fund median expenses. Each class of the fund is compared to those funds and classes in the Total Mapped Group (used by the Board for management fee comparisons) that have a similar sales load structure.
The Board noted that the total expenses of each of Class A, Class B, Class C, Institutional Class, and Fidelity International Small Cap (retail class) ranked below its competitive median for 2007, and the total expenses of Class T ranked above its competitive median for 2007. The Board considered that the total expenses of Class T were above the median primarily because its 12b-1 fee is higher than the typical front-end load class. The Board noted that the fund offers multiple classes, each of which has a different sales load and 12b-1 fee structure, and that the multiple structures are intended to offer a range of pricing options for the intermediary market. The Board also noted that the total expenses of the classes vary primarily by the level of their 12b-1 fees, although differences in transfer agent fees may also cause expenses to vary from class to class.
Annual Report
Board Approval of Investment Advisory Contracts and
Management Fees - continued
In its review of total expenses, the Board also considered Fidelity fee structures and other information on clients that FMR and its affiliates service in other competitive markets, such as other mutual funds advised or subadvised by FMR or its affiliates, pension plan clients, and other institutional clients.
Based on its review, the Board concluded that the total expenses of each class of the fund were reasonable, although in one case above the median of the universe presented for comparison, in light of the services that the fund and its shareholders receive and the other factors considered.
Costs of the Services and Profitability. The Board considered the revenues earned and the expenses incurred by Fidelity in conducting the business of developing, marketing, distributing, managing, administering and servicing the fund and its shareholders. The Board also considered the level of Fidelity's profits in respect of all the Fidelity funds.
On an annual basis, FMR presents to the Board Fidelity's profitability for the fund. Fidelity calculates the profitability for each fund, as well as aggregate profitability for groups of Fidelity funds and all Fidelity funds, using a series of detailed revenue and cost allocation methodologies which originate with the audited books and records of Fidelity. The Audit Committee of the Board reviews any significant changes from the prior year's methodologies.
PricewaterhouseCoopers LLP (PwC), independent registered public accounting firm and auditor to Fidelity and certain Fidelity funds, has been engaged annually by the Board as part of the Board's assessment of the results of Fidelity's profitability analysis. PwC's engagement includes the review and assessment of Fidelity's methodologies used in determining the revenues and expenses attributable to Fidelity's mutual fund business, and completion of agreed-upon procedures surrounding the mathematical accuracy of fund profitability and its conformity to allocation methodologies. After considering PwC's reports issued under the engagement and information provided by Fidelity, the Board believes that while other allocation methods may also be reasonable, Fidelity's profitability methodologies are reasonable in all material respects.
Annual Report
The Board has also reviewed Fidelity's non-fund businesses and any fall-out benefits related to the mutual fund business as well as cases where Fidelity's affiliates may benefit from or be related to the fund's business.
The Board considered the costs of the services provided by and the profits realized by Fidelity in connection with the operation of the fund and determined that the amount of profit is a fair entrepreneurial profit for the management of the fund.
Economies of Scale. The Board considered whether there have been economies of scale in respect of the management of the Fidelity funds, whether the Fidelity funds (including the fund) have appropriately benefited from any such economies of scale, and whether there is potential for realization of any further economies of scale. The Board considered the extent to which the fund will benefit from economies of scale through increased services to the fund, through waivers or reimbursements, or through fee or expense reductions.
The Board recognized that the fund's management contract incorporates a "group fee" structure, which provides for lower group fee rates as total fund assets under FMR's management increase, and for higher group fee rates as total fund assets under FMR's management decrease. FMR determines the group fee rates based on a tiered asset "breakpoint" schedule. The Board considered that the group fee is designed to deliver the benefits of economies of scale to fund shareholders when total fund assets increase, even if assets of any particular fund are unchanged or have declined, because some portion of Fidelity's costs are attributable to services provided to all Fidelity funds, and all funds benefit if those costs can be allocated among more assets. The Board also considered that although the fund is partially closed to new investors, it continues to incur investment management expenses, and marketing and distribution expenses related to the retention of existing shareholders and assets. The Board further noted that the fund may continue to realize benefits from the group fee structure, even though assets may not be expected to grow significantly at the fund level. The Board concluded that, given the group fee structure, fund shareholders will achieve a certain level of economies of scale as assets under FMR's management increase at the fund complex level, regardless of whether Fidelity achieves any such economies of scale.
The Board further concluded that any potential economies of scale are being shared between fund shareholders and Fidelity in an appropriate manner.
Additional Information Requested by the Board. In order to develop fully the factual basis for consideration of the Fidelity funds' Advisory Contracts, the Board requested and received additional information on certain topics, including (i) fund performance trends and actions to be taken by FMR to improve certain funds' overall performance; (ii) portfolio manager changes that have occurred during the past year; (iii) Fidelity's fund profitability methodology, the profitability of certain fund service providers, and profitability trends for certain funds; (iv) Fidelity's compensation structure for portfolio managers and key personnel, including its effects on fund profitability and the extent to which portfolio manager compensation is linked to fund performance; (v) Fidelity's fee structures and rationale for recommending different fees among categories of funds; and (vi) Fidelity's rationale for recommending which funds should have a performance adjustment component as part of their management fees.
Annual Report
Board Approval of Investment Advisory Contracts and
Management Fees - continued
Based on its evaluation of all of the conclusions noted above, and after considering all material factors, the Board ultimately concluded that the advisory fee structures are fair and reasonable, and that the fund's Advisory Contracts should be renewed.
Annual Report
Investment Adviser
Fidelity Management & Research Company
Boston, MA
Investment Sub-Advisers
FMR Co., Inc.
Fidelity Management & Research
(U.K.) Inc.
Fidelity Research & Analysis
Company
FIL Investment Advisors
Fidelity Investments Japan Limited
FIL Investment Advisors (U.K.) Ltd.
Fidelity Management & Research
(Hong Kong) Limited
Fidelity Management & Research
(Japan) Inc.
General Distributor
Fidelity Distributors Corporation
Boston, MA
Transfer and Service Agents
Fidelity Investments Institutional Operations Company, Inc.
Boston, MA
Fidelity Service Company, Inc.
Boston, MA
Custodian
Mellon Bank
Pittsburgh, PA
AISCI-UANN-1208
1.793572.105
Fidelity®
International Small Cap Opportunities
Fund
Annual Report
October 31, 2008
(2_fidelity_logos) (Registered_Trademark)
Contents
Chairman's Message | <Click Here> | Ned Johnson's message to shareholders. |
Performance | <Click Here> | How the fund has done over time. |
Managements' Discussion | <Click Here> | The managers' review of fund performance, strategy and outlook. |
Shareholder Expense Example | <Click Here> | An example of shareholder expenses. |
Investment Changes | <Click Here> | A summary of major shifts in the fund's investments over the past six months. |
Investments | <Click Here> | A complete list of the fund's investments with their market values. |
Financial Statements | <Click Here> | Statements of assets and liabilities, operations, and changes in net assets, as well as financial highlights. |
Notes | <Click Here> | Notes to the financial statements. |
Report of Independent Registered Public Accounting Firm | <Click Here> | |
Trustees and Officers | <Click Here> | |
Distributions | <Click Here> | |
Proxy Voting Results | <Click Here> | |
Board Approval of Investment Advisory Contracts and Management Fees | <Click Here> | |
To view a fund's proxy voting guidelines and proxy voting record for the 12-month period ended June 30, visit http://www.fidelity.com (search for "proxy voting guidelines") or visit the Securities and Exchange Commission's (SEC) web site at http://www.sec.gov. You may also call 1-800-544-8544 to request a free copy of the proxy voting guidelines.
Standard & Poor's, S&P and S&P 500 are registered service marks of The McGraw-Hill Companies, Inc. and have been licensed for use by Fidelity Distributors Corporation.
Other third party marks appearing herein are the property of their respective owners.
All other marks appearing herein are registered or unregistered trademarks or service marks of FMR LLC or an affiliated company.
Annual Report
This report and the financial statements contained herein are submitted for the general information of the shareholders of the fund. This report is not authorized for distribution to prospective investors in the fund unless preceded or accompanied by an effective prospectus.
A fund files its complete schedule of portfolio holdings with the SEC for the first and third quarters of each fiscal year on Form N-Q. Forms N-Q are available on the SEC's web site at http://www.sec.gov. A fund's Forms N-Q may be reviewed and copied at the SEC's Public Reference Room in Washington, DC. Information regarding the operation of the SEC's Public Reference Room may be obtained by calling 1-800-SEC-0330. For a complete list of a fund's portfolio holdings, view the most recent holdings listing, semiannual report, or annual report on Fidelity's web site at http://www.fidelity.com or http://www.advisor.fidelity.com, as applicable.
NOT FDIC INSURED · MAY LOSE VALUE · NO BANK GUARANTEE
Neither the fund nor Fidelity Distributors Corporation is a bank.
Annual Report
(photo_of_Edward_C_Johnson_3d)
Dear Shareholder:
Turmoil has been the watchword for the world's securities markets in 2008, with domestic and international stocks down sharply amid the global credit squeeze. A flight to quality boosted returns for U.S. Treasuries, one of the few asset classes with positive results heading into the latter stages of the year. Financial markets are always unpredictable, but there are a number of time-tested principles that can put the historical odds in your favor.
One of the basic tenets is to invest for the long term. Over time, riding out the markets' inevitable ups and downs has proven much more effective than selling into panic or chasing the hottest trend. Even missing only a few of the markets' best days can significantly diminish investor returns. Patience also affords the benefits of compounding - of earning interest on additional income or reinvested dividends and capital gains. There are tax advantages and cost benefits to consider as well. The more you sell, the more taxes you pay, and the more you trade, the higher the costs. While staying the course doesn't eliminate risk, it can considerably lessen the effect of short-term declines.
You can further manage your investing risk through diversification. And today, more than ever, geographic diversification should be taken into account. Studies indicate that asset allocation is the single most important determinant of a portfolio's long-term success. The right mix of stocks, bonds and cash - aligned to your particular risk tolerance and investment objective - is very important. Age-appropriate rebalancing is also an essential aspect of asset allocation. For younger investors, an emphasis on equities - which historically have been the best-performing asset class over time - is encouraged. As investors near their specific goal, such as retirement or sending a child to college, consideration may be given to replacing volatile assets (e.g. common stocks) with more-stable fixed investments (bonds or savings plans).
A third investment principle - investing regularly - can help lower the average cost of your purchases. Investing a certain amount of money each month or quarter helps ensure you won't pay for all your shares at market highs. This strategy - known as dollar cost averaging - also reduces unconstructive "emotion" from investing, helping shareholders avoid selling weak performers just prior to an upswing, or chasing a hot performer just before a correction.
We invite you to contact us via the Internet, through our Investor Centers or over the phone. It is our privilege to provide you the information you need to make the investments that are right for you.
Sincerely,
/s/Edward C. Johnson 3d
Edward C. Johnson 3d
Annual Report
Average annual total return reflects the change in the value of an investment, assuming reinvestment of the class' dividend income and capital gains (the profits earned upon the sale of securities that have grown in value, if any) and assuming a constant rate of performance each year. The $10,000 table and the fund's returns do not reflect the deduction of taxes that a shareholder would pay on fund distributions or the redemption of fund shares. During periods of reimbursement by Fidelity, a fund's total return will be greater than it would be had the reimbursement not occurred. How a fund did yesterday is no guarantee of how it will do tomorrow.
Average Annual Total Returns
Periods ended October 31, 2008 | Past 1
year | Life of fund A |
International Small Cap Opportunities | -62.91% | -10.08% |
A From August 2, 2005
$10,000 Over Life of Fund
Let's say hypothetically that $10,000 was invested in International Small Cap Opportunities, a class of the fund, on August 2, 2005, when the fund started. The chart shows how the value of your investment would have changed, and also shows how the MSCI® Europe, Australasia, Far East (MSCI EAFE®) Small Cap Index performed over the same period.
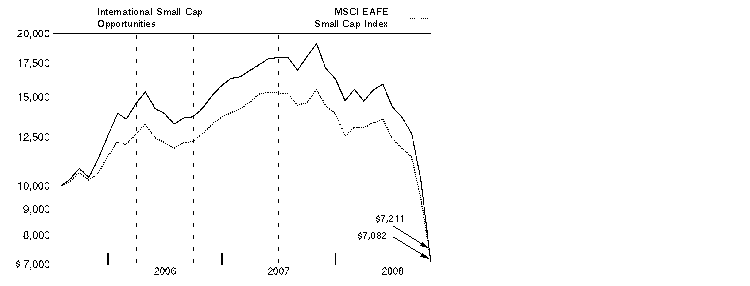
Annual Report
Comments from Andrew Sassine, Portfolio Manager of Fidelity® International Small Cap Opportunities Fund during the period covered in this report
In a dramatic reversal of what had been a multiyear global growth story, international stocks fell long and hard during the 12 months ending October 31, 2008, especially so during the latter stages of the period and mostly as a result of fallout from the financial crisis that emanated from the United States. The viral spread of this financial contagion - which began in the U.S. subprime mortgage market, then seized up the credit markets, hobbled major financial institutions and eventually slowed economic growth worldwide - left virtually no corner of the globe untouched. Developed international equity markets - as gauged by the MSCI® Europe, Australasia, Far East (EAFE®) Index, which monitors established markets outside the U.S. and Canada - fell 46.54%, while the Standard & Poor's 500SM Index, a measure of U.S. stocks, dropped 36.10%. Among countries constituting at least 1% of the EAFE index, Switzerland had the "least worst" showing, falling roughly 32%, followed by Japan, where stocks slid by around 37%. Meanwhile, the weakest overall performance came from Belgium, where stocks slipped by nearly 70%. In the United Kingdom, the largest component of the index, equities were down almost 48%. Emerging markets were the weakest performers among the global economies, declining 56.22% as measured by the MSCI Emerging Markets Index.
For the year, the fund's Retail Class shares returned -62.91%, compared with -53.46% for the MSCI EAFE Small Cap Index. Stock selection in materials and consumer staples detracted from relative performance, as did weak results in financials and information technology. However, our holdings in the consumer discretionary sector aided the fund's performance. Security selection in Japan and Norway detracted, while underweightings in Greece, Denmark, Spain and Singapore helped. A cash position also aided returns. Babcock & Brown, an Australian global alternative asset manager, was hurt by the credit crisis. In materials, Papua New Guinea-based Lihir Gold also detracted from performance. Marine Harvest, a Norwegian salmon farmer, fell, as did Renovo Group, a U.K.-based biotechnology firm. Netherlands-based Gemalto, a secure personal devices manufacturer, buoyed performance, so did Chiquita Brands, a U.S. food products distributor. Rakuten, a Japanese Internet services company, rose as well. Many of the stocks I've mentioned were out-of-index holdings.
Note to shareholders: Jed Weiss will become Portfolio Manager on December 4, 2008.
The views expressed above reflect those of the portfolio manager(s) only through the end of the period as stated on the cover of this report and do not necessarily represent the views of Fidelity or any other person in the Fidelity organization. Any such views are subject to change at any time based upon market or other conditions and Fidelity disclaims any responsibility to update such views. These views may not be relied on as investment advice and, because investment decisions for a Fidelity fund are based on numerous factors, may not be relied on as an indication of trading intent on behalf of any Fidelity fund.
Annual Report
Shareholder Expense Example
As a shareholder of the Fund, you incur two types of costs: (1) transaction costs, including sales charges (loads) on purchase payments or redemption proceeds, redemption fees, and (2) ongoing costs, including management fees, distribution and/or service (12b-1) fees and other Fund expenses. This Example is intended to help you understand your ongoing costs (in dollars) of investing in the Fund and to compare these costs with the ongoing costs of investing in other mutual funds.
The Example is based on an investment of $1,000 invested at the beginning of the period and held for the entire period (May 1, 2008 to October 31, 2008).
Actual Expenses
The first line of the accompanying table for each class of the Fund provides information about actual account values and actual expenses. You may use the information in this line, together with the amount you invested, to estimate the expenses that you paid over the period. Simply divide your account value by $1,000.00 (for example, an $8,600 account value divided by $1,000.00 = 8.6), then multiply the result by the number in the first line for a class of the Fund under the heading entitled "Expenses Paid During Period" to estimate the expenses you paid on your account during this period. A small balance maintenance fee of $12.00 that is charged once a year may apply for certain accounts with a value of less than $2,000. This fee is not included in the table below. If it was, the estimate of expenses you paid during the period would be higher, and your ending account value lower, by this amount. In addition, the Fund, as a shareholder in the underlying Fidelity Central Funds, will indirectly bear its pro rata share of the fees and expenses incurred by the underlying Fidelity Central Funds. These fees and expenses are not included in the Fund's annualized expense ratio used to calculate the expense estimate in the table below.
Hypothetical Example for Comparison Purposes
The second line of the accompanying table for each class of the Fund provides information about hypothetical account values and hypothetical expenses based on a Class' actual expense ratio and an assumed rate of return of 5% per year before expenses, which is not the Class' actual return. The hypothetical account values and expenses may not be used to estimate the actual ending account balance or expenses you paid for the period. You may use this information to compare the ongoing costs of investing in the Fund and other funds. To do so, compare this 5% hypothetical example with the 5% hypothetical examples that appear in the shareholder reports of the other funds. A small balance maintenance fee of $12.00 that is charged once a year may apply for certain accounts with a value of less than $2,000. This fee is not included in the table below. If it was, the estimate of expenses you paid during the period would be higher, and your ending account value lower, by this amount. In addition, the Fund, as a shareholder in the underlying Fidelity Central Funds, will indirectly bear its pro rata share of the fees and expenses incurred by the underlying Fidelity Central Funds. These fees and expenses are not included in the Fund's annualized expense ratio used to calculate the expense estimate in the table below.
Please note that the expenses shown in the table are meant to highlight your ongoing costs only and do not reflect any transaction costs. Therefore, the second line of the table is useful in comparing ongoing costs only, and will not help you determine the relative total costs of owning different funds. In addition, if these transactional costs were included, your costs would have been higher.
Annual Report
|
Annualized Expense Ratio
|
Beginning
Account Value
May 1, 2008
|
Ending
Account Value
October 31, 2008
| Expenses Paid
During Period*
May 1, 2008 to
October 31, 2008 |
Class A | 1.65% | | | |
Actual | | $ 1,000.00 | $ 457.50 | $ 6.05 |
HypotheticalA | | $ 1,000.00 | $ 1,016.84 | $ 8.36 |
Class T | 1.90% | | | |
Actual | | $ 1,000.00 | $ 456.90 | $ 6.96 |
HypotheticalA | | $ 1,000.00 | $ 1,015.58 | $ 9.63 |
Class B | 2.40% | | | |
Actual | | $ 1,000.00 | $ 455.00 | $ 8.78 |
HypotheticalA | | $ 1,000.00 | $ 1,013.07 | $ 12.14 |
Class C | 2.40% | | | |
Actual | | $ 1,000.00 | $ 455.00 | $ 8.78 |
HypotheticalA | | $ 1,000.00 | $ 1,013.07 | $ 12.14 |
International Small Cap Opportunities | 1.44% | | | |
Actual | | $ 1,000.00 | $ 457.70 | $ 5.28 |
HypotheticalA | | $ 1,000.00 | $ 1,017.90 | $ 7.30 |
Institutional Class | 1.40% | | | |
Actual | | $ 1,000.00 | $ 457.30 | $ 5.13 |
HypotheticalA | | $ 1,000.00 | $ 1,018.10 | $ 7.10 |
A 5% return per year before expenses
* Expenses are equal to each Class' annualized expense ratio, multiplied by the average account value over the period, multiplied by 184/366 (to reflect the one-half year period).
Annual Report
Investment Changes (Unaudited)
Geographic Diversification (% of fund's net assets) |
As of October 31, 2008 |
| Japan 15.4% |
| United Kingdom 13.6% |
| China 9.2% |
| Netherlands 7.6% |
| Cayman Islands 7.5% |
| United States of America 7.3% |
| Papua New Guinea 7.3% |
| Australia 6.4% |
| Germany 6.4% |
| Other 19.3% |

Percentages are adjusted for the effect of futures contracts, if applicable. |
|
As of April 30, 2008 |
| Japan 25.1% |
| United Kingdom 8.6% |
| Germany 7.3% |
| Netherlands 6.8% |
| United States of America 6.6% |
| China 6.3% |
| Cayman Islands 5.9% |
| Norway 5.9% |
| Papua New Guinea 5.9% |
| Other 21.6% |

Percentages are adjusted for the effect of futures contracts, if applicable. |
Asset Allocation |
| % of fund's
net assets | % of fund's net assets
6 months ago |
Stocks | 98.9 | 98.6 |
Short-Term Investments and Net Other Assets | 1.1 | 1.4 |
Top Ten Stocks as of October 31, 2008 |
| % of fund's
net assets | % of fund's net assets
6 months ago |
Lihir Gold Ltd. (Papua New Guinea, Metals & Mining) | 7.3 | 5.9 |
Gemalto NV (Netherlands, Computers & Peripherals) | 4.9 | 2.0 |
Himax Technologies, Inc. sponsored ADR (Cayman Islands, Semiconductors & Semiconductor Equipment) | 4.2 | 3.9 |
Chiquita Brands International, Inc. (United States of America, Food Products) | 4.1 | 2.4 |
BB BIOTECH AG (Switzerland, Biotechnology) | 3.5 | 1.5 |
HannStar Display Corp. (Taiwan, Electronic Equipment & Components) | 3.2 | 2.7 |
GEA Group AG (Germany, Machinery) | 3.1 | 2.9 |
Focus Media Holding Ltd. ADR (China, Media) | 2.8 | 1.3 |
EFG International (Switzerland, Capital Markets) | 2.7 | 0.0 |
Autonomy Corp. PLC (United Kingdom, Software) | 2.7 | 1.0 |
| 38.5 | |
Market Sectors as of October 31, 2008 |
| % of fund's
net assets | % of fund's net assets
6 months ago |
Information Technology | 27.5 | 24.0 |
Industrials | 21.5 | 27.8 |
Materials | 11.3 | 11.0 |
Financials | 10.5 | 9.7 |
Consumer Staples | 10.6 | 14.1 |
Consumer Discretionary | 9.5 | 5.8 |
Health Care | 6.5 | 4.2 |
Energy | 1.0 | 2.0 |
Utilities | 0.5 | 0.0 |
Annual Report
Investments October 31, 2008
Showing Percentage of Net Assets
Common Stocks - 98.9% |
| Shares | | Value |
Australia - 6.4% |
Babcock & Brown Ltd. (d) | 2,582,465 | | $ 2,255,477 |
Babcock & Brown Wind Partners | 3,000,000 | | 1,678,673 |
Downer EDI Ltd. | 2,930,464 | | 9,511,882 |
Newcrest Mining Ltd. | 300,000 | | 4,121,771 |
Silex Systems Ltd. (a)(d) | 816,160 | | 2,125,030 |
Sino Gold Mining Ltd. (a) | 1,580,111 | | 3,637,557 |
TOTAL AUSTRALIA | | 23,330,390 |
Austria - 0.6% |
Andritz AG | 79,996 | | 2,278,136 |
Bermuda - 0.8% |
Noble Group Ltd. | 3,841,000 | | 2,796,019 |
Cayman Islands - 7.5% |
CNinsure, Inc. ADR (d) | 409,600 | | 3,579,904 |
Himax Technologies, Inc. sponsored ADR | 8,253,009 | | 15,433,127 |
LDK Solar Co. Ltd. sponsored ADR (a)(d) | 451,300 | | 8,195,608 |
TOTAL CAYMAN ISLANDS | | 27,208,639 |
China - 9.2% |
BYD Co. Ltd. (H Shares) | 3,229,500 | | 5,488,922 |
China TechFaith Wireless Communication Technology Ltd. sponsored ADR (a) | 1,801,341 | | 1,603,193 |
Focus Media Holding Ltd. ADR (a)(d) | 555,800 | | 10,298,974 |
Global Bio-Chem Technology Group Co. Ltd. | 50,703,300 | | 7,066,410 |
Shanda Interactive Entertainment Ltd. sponsored ADR (a)(d) | 325,000 | | 8,986,250 |
TOTAL CHINA | | 33,443,749 |
Finland - 0.4% |
KCI Konecranes Oyj | 84,000 | | 1,427,454 |
France - 1.5% |
Nexans SA | 46,874 | | 2,673,689 |
Ubisoft Entertainment SA (a) | 48,569 | | 2,567,318 |
TOTAL FRANCE | | 5,241,007 |
Germany - 6.4% |
Demag Cranes AG | 50,000 | | 973,188 |
GEA Group AG | 762,600 | | 11,144,590 |
Q-Cells AG (a)(d) | 76,985 | | 3,028,610 |
Symrise AG | 200,000 | | 2,484,241 |
Vossloh AG | 70,000 | | 5,408,318 |
TOTAL GERMANY | | 23,038,947 |
Common Stocks - continued |
| Shares | | Value |
Italy - 2.5% |
Impregilo SpA (a)(d) | 3,465,200 | | $ 9,140,729 |
Japan - 15.4% |
CyberAgent, Inc. (d) | 4,535 | | 4,048,504 |
Elpida Memory, Inc. (a)(d) | 916,000 | | 4,883,226 |
Hikari Tsushin, Inc. | 150,000 | | 2,238,431 |
Ichiyoshi Securities Co. Ltd. (d) | 661,400 | | 5,295,950 |
JAFCO Co. Ltd. | 124,600 | | 3,353,738 |
Pal Co. Ltd. (d) | 31,850 | | 208,861 |
Promise Co. Ltd. (d) | 291,550 | | 5,232,814 |
Rakuten, Inc. (d) | 18,475 | | 9,158,294 |
SBI Holdings, Inc. | 52,751 | | 6,329,841 |
Sugi Holdings Co. Ltd. (d) | 300,200 | | 7,219,003 |
Sumco Corp. | 599,860 | | 6,495,569 |
Trend Micro, Inc. | 60,000 | | 1,467,708 |
TOTAL JAPAN | | 55,931,939 |
Netherlands - 7.6% |
AMG Advanced Metallurgical Group NV (a)(d) | 265,578 | | 4,298,941 |
Gemalto NV (a) | 632,600 | | 17,723,725 |
Nutreco Holding NV | 24,658 | | 786,186 |
QIAGEN NV (a) | 332,200 | | 4,737,172 |
TOTAL NETHERLANDS | | 27,546,024 |
Norway - 3.7% |
Marine Harvest ASA (a)(d) | 35,659,000 | | 5,759,837 |
Petroleum Geo-Services ASA (a) | 495,500 | | 2,467,297 |
Pronova BioPharma ASA | 1,000,000 | | 2,597,902 |
Renewable Energy Corp. AS (a)(d) | 277,700 | | 2,620,054 |
TOTAL NORWAY | | 13,445,090 |
Papua New Guinea - 7.3% |
Lihir Gold Ltd. (a) | 14,300,867 | | 17,834,905 |
Lihir Gold Ltd. sponsored ADR (a)(d) | 662,200 | | 8,462,916 |
TOTAL PAPUA NEW GUINEA | | 26,297,821 |
Spain - 0.4% |
Prosegur Comp Securidad SA (Reg.) | 50,000 | | 1,420,475 |
Switzerland - 6.2% |
BB BIOTECH AG (d) | 196,970 | | 12,489,540 |
EFG International | 457,120 | | 9,838,583 |
TOTAL SWITZERLAND | | 22,328,123 |
Common Stocks - continued |
| Shares | | Value |
Taiwan - 3.2% |
HannStar Display Corp. | 63,362,704 | | $ 11,525,731 |
United Kingdom - 13.6% |
ARM Holdings PLC sponsored ADR (d) | 1,848,700 | | 8,725,864 |
Autonomy Corp. PLC (a) | 616,700 | | 9,776,980 |
BlueBay Asset Management (d) | 808,100 | | 2,624,170 |
easyJet PLC (a) | 1,800,000 | | 8,978,340 |
Informa PLC | 1,221,200 | | 4,136,877 |
Invensys PLC (a) | 3,190,900 | | 8,000,531 |
Max Petroleum PLC (a) | 4,500,000 | | 972,624 |
Premier Foods PLC | 5,899,300 | | 2,615,460 |
Renovo Group PLC (a) | 8,702,203 | | 3,553,008 |
TOTAL UNITED KINGDOM | | 49,383,854 |
United States of America - 6.2% |
AGCO Corp. (a) | 92,700 | | 2,921,904 |
Chiquita Brands International, Inc. (a)(d) | 1,087,400 | | 14,843,010 |
Virgin Media, Inc. (d) | 800,000 | | 4,608,000 |
TOTAL UNITED STATES OF AMERICA | | 22,372,914 |
TOTAL COMMON STOCKS (Cost $669,718,098) | 358,157,041 |
Money Market Funds - 22.1% |
| | | |
Fidelity Cash Central Fund, 1.81% (b) | 4,789,854 | | 4,789,854 |
Fidelity Securities Lending Cash Central Fund, 2.67% (b)(c) | 75,262,022 | | 75,262,022 |
TOTAL MONEY MARKET FUNDS (Cost $80,051,876) | 80,051,876 |
TOTAL INVESTMENT PORTFOLIO - 121.0% (Cost $749,769,974) | | 438,208,917 |
NET OTHER ASSETS - (21.0)% | | (76,011,757) |
NET ASSETS - 100% | $ 362,197,160 |
Legend |
(a) Non-income producing |
(b) Affiliated fund that is available only to investment companies and other accounts managed by Fidelity Investments. The rate quoted is the annualized seven-day yield of the fund at period end. A complete unaudited listing of the fund's holdings as of its most recent quarter end is available upon request. |
(c) Investment made with cash collateral received from securities on loan. |
(d) Security or a portion of the security is on loan at period end. |
Affiliated Central Funds |
Information regarding fiscal year to date income earned by the Fund from investments in Fidelity Central Funds is as follows: |
Fund | Income earned |
Fidelity Cash Central Fund | $ 465,321 |
Fidelity Securities Lending Cash Central Fund | 3,820,634 |
Total | $ 4,285,955 |
Other Affiliated Issuers |
An affiliated company is a company in which the fund has ownership of at least 5% of the voting securities. Fiscal year to date transactions with companies which are or were affiliates are as follows: |
Affiliate | Value,
beginning of
period | Purchases | Sales
Proceeds | Dividend Income | Value,
end of
period |
First Tractor Co. Ltd. (H Shares) | $ 11,999,397 | $ - | $ 5,122,915 | $ 68,411 | $ - |
Income Tax Information |
At October 31, 2008, the fund had a capital loss carryforward of approximately $146,419,794 all of which will expire on October 31, 2016. |
See accompanying notes which are an integral part of the financial statements.
Annual Report
Statement of Assets and Liabilities
| October 31, 2008 |
| | |
Assets | | |
Investment in securities, at value (including securities loaned of $70,265,441) - See accompanying schedule: Unaffiliated issuers (cost $669,718,098) | $ 358,157,041 | |
Fidelity Central Funds (cost $80,051,876) | 80,051,876 | |
Total Investments (cost $749,769,974) | | $ 438,208,917 |
Foreign currency held at value (cost $160) | | 152 |
Receivable for investments sold | | 1,858,770 |
Receivable for fund shares sold | | 587,971 |
Dividends receivable | | 485,964 |
Distributions receivable from Fidelity Central Funds | | 188,423 |
Receivable from investment adviser for expense reductions | | 15,082 |
Other receivables | | 72,137 |
Total assets | | 441,417,416 |
| | |
Liabilities | | |
Payable for investments purchased | $ 2,718,402 | |
Payable for fund shares redeemed | 702,790 | |
Accrued management fee | 249,739 | |
Distribution fees payable | 21,117 | |
Other affiliated payables | 174,594 | |
Other payables and accrued expenses | 91,592 | |
Collateral on securities loaned, at value | 75,262,022 | |
Total liabilities | | 79,220,256 |
| | |
Net Assets | | $ 362,197,160 |
Net Assets consist of: | | |
Paid in capital | | $ 834,317,445 |
Accumulated undistributed net realized gain (loss) on investments and foreign currency transactions | | (160,554,996) |
Net unrealized appreciation (depreciation) on investments and assets and liabilities in foreign currencies | | (311,565,289) |
Net Assets | | $ 362,197,160 |
See accompanying notes which are an integral part of the financial statements.
Annual Report
Statement of Assets and Liabilities - continued
| October 31, 2008 |
| | |
Calculation of Maximum Offering Price
Class A:
Net Asset Value and redemption price per share ($17,905,406 ÷ 2,871,641 shares) | | $ 6.24 |
| | |
Maximum offering price per share (100/94.25 of $6.24) | | $ 6.62 |
Class T:
Net Asset Value and redemption price per share ($11,614,253 ÷ 1,874,345 shares) | | $ 6.20 |
| | |
Maximum offering price per share (100/96.50 of $6.20) | | $ 6.42 |
Class B:
Net Asset Value and offering price per share ($2,687,045 ÷ 438,825 shares)A | | $ 6.12 |
| | |
Class C:
Net Asset Value and offering price per share ($9,496,686 ÷ 1,553,173 shares)A | | $ 6.11 |
| | |
| | |
International Small Cap Opportunities:
Net Asset Value, offering price and redemption price per share ($312,376,291 ÷ 49,754,757 shares) | | $ 6.28 |
| | |
Institutional Class:
Net Asset Value, offering price and redemption price per share ($8,117,479 ÷ 1,294,002 shares) | | $ 6.27 |
A Redemption price per share is equal to net asset value less any applicable contingent deferred sales charge.
See accompanying notes which are an integral part of the financial statements.
Annual Report
Financial Statements - continued
Statement of Operations
| Year ended October 31, 2008 |
| | |
Investment Income | | |
Dividends (including $68,411 earned from other affiliated issuers) | | $ 14,002,599 |
Interest | | 2,082 |
Income from Fidelity Central Funds (including $3,820,634 from security lending) | | 4,285,955 |
| | 18,290,636 |
Less foreign taxes withheld | | (1,290,068) |
Total income | | 17,000,568 |
| | |
Expenses | | |
Management fee
Basic fee | $ 8,348,490 | |
Performance adjustment | 2,000,573 | |
Transfer agent fees | 2,467,216 | |
Distribution fees | 580,404 | |
Accounting and security lending fees | 491,904 | |
Custodian fees and expenses | 216,963 | |
Independent trustees' compensation | 4,564 | |
Registration fees | 94,266 | |
Audit | 67,068 | |
Legal | 6,317 | |
Interest | 39,161 | |
Miscellaneous | 211,922 | |
Total expenses before reductions | 14,528,848 | |
Expense reductions | (430,556) | 14,098,292 |
Net investment income (loss) | | 2,902,276 |
Realized and Unrealized Gain (Loss) Net realized gain (loss) on: | | |
Investment securities: | | |
Unaffiliated issuers | (153,629,459) | |
Other affiliated issuers | (3,139,491) | |
Foreign currency transactions | 78,947 | |
Total net realized gain (loss) | | (156,690,003) |
Change in net unrealized appreciation (depreciation) on: Investment securities | (647,254,659) | |
Assets and liabilities in foreign currencies | 55,716 | |
Total change in net unrealized appreciation (depreciation) | | (647,198,943) |
Net gain (loss) | | (803,888,946) |
Net increase (decrease) in net assets resulting from operations | | $ (800,986,670) |
See accompanying notes which are an integral part of the financial statements.
Annual Report
Statement of Changes in Net Assets
| Year ended
October 31,
2008 | Year ended
October 31,
2007 |
Increase (Decrease) in Net Assets | | |
Operations | | |
Net investment income (loss) | $ 2,902,276 | $ 5,724,841 |
Net realized gain (loss) | (156,690,003) | 184,590,119 |
Change in net unrealized appreciation (depreciation) | (647,198,943) | 219,203,434 |
Net increase (decrease) in net assets resulting
from operations | (800,986,670) | 409,518,394 |
Distributions to shareholders from net investment income | (4,817,372) | - |
Distributions to shareholders from net realized gain | (154,491,933) | - |
Total distributions | (159,309,305) | - |
Share transactions - net increase (decrease) | (308,489,372) | 127,196,896 |
Redemption fees | 307,719 | 783,954 |
Total increase (decrease) in net assets | (1,268,477,628) | 537,499,244 |
| | |
Net Assets | | |
Beginning of period | 1,630,674,788 | 1,093,175,544 |
End of period (including undistributed net investment income of $0 and undistributed net investment income of $5,724,841, respectively) | $ 362,197,160 | $ 1,630,674,788 |
See accompanying notes which are an integral part of the financial statements.
Annual Report
Financial Highlights - Class A
Years ended October 31, | 2008 | 2007 | 2006 | 2005 H |
Selected Per-Share Data | | | | |
Net asset value, beginning of period | $ 18.97 | $ 14.18 | $ 10.41 | $ 10.00 |
Income from Investment Operations | | | | |
Net investment income (loss) E | .02 | .02 | - J | - J |
Net realized and unrealized gain (loss) | (10.85) | 4.76 | 3.74 | .40 |
Total from investment operations | (10.83) | 4.78 | 3.74 | .40 |
Distributions from net investment income | (.03) | - | - | - |
Distributions from net realized gain | (1.88) | - | - J | - |
Total distributions | (1.90) K | - | - J | - |
Redemption fees added to paid in capital E | - J | .01 | .03 | .01 |
Net asset value, end of period | $ 6.24 | $ 18.97 | $ 14.18 | $ 10.41 |
Total Return B, C, D | (62.98)% | 33.78% | 36.25% | 4.10% |
Ratios to Average Net Assets F, I | | | | |
Expenses before reductions | 1.75% | 1.63% | 1.63% | 2.67% A |
Expenses net of fee waivers, if any | 1.66% | 1.63% | 1.63% | 1.65% A |
Expenses net of all reductions | 1.62% | 1.59% | 1.51% | 1.54% A |
Net investment income (loss) | .13% | .10% | .02% | (.09)% A |
Supplemental Data | | | | |
Net assets, end of period (000 omitted) | $ 17,905 | $ 70,785 | $ 35,674 | $ 5,533 |
Portfolio turnover rate G | 61% | 107% | 164% | 46% |
A Annualized
B Total returns for periods of less than one year are not annualized.
C Total returns would have been lower had certain expenses not been reduced during the periods shown.
D Total returns do not include the effect of the sales charges.
E Calculated based on average shares outstanding during the period.
F Fees and expenses of the underlying Fidelity Central Funds are not included in the Fund's expense ratio. The Fund indirectly bears its proportionate share of the expenses of any underlying Fidelity Central Funds.
G Amount does not include the portfolio activity of any underlying Fidelity Central Funds.
H For the period August 2, 2005 (commencement of operations) to October 31, 2005.
I Expense ratios reflect operating expenses of the class. Expenses before reductions do not reflect amounts reimbursed by the investment adviser or reductions from brokerage service arrangements or other expense offset arrangements and do not represent the amount paid by the class during periods when reimbursements or reductions occur. Expense ratios before reductions for start-up periods may not be representative of longer-term operating periods. Expenses net of fee waivers reflect expenses after reimbursement by the investment adviser but prior to reductions from brokerage service arrangements or other expense offset arrangements. Expenses net of all reductions represent the net expenses paid by the class.
J Amount represents less than $.01 per share.
K Total distributions of $1.903 per share is comprised of distributions from net investment income of $.025 and distributions from net realized gain of $1.878 per share.
See accompanying notes which are an integral part of the financial statements.
Annual Report
Financial Highlights - Class T
Years ended October 31, | 2008 | 2007 | 2006 | 2005 H |
Selected Per-Share Data | | | | |
Net asset value, beginning of period | $ 18.85 | $ 14.12 | $ 10.38 | $ 10.00 |
Income from Investment Operations | | | | |
Net investment income (loss) E | (.02) | (.02) | (.03) | (.01) |
Net realized and unrealized gain (loss) | (10.78) | 4.74 | 3.74 | .38 |
Total from investment operations | (10.80) | 4.72 | 3.71 | .37 |
Distributions from net realized gain | (1.85) K | - | - | - |
Redemption fees added to paid in capital E | - J | .01 | .03 | .01 |
Net asset value, end of period | $ 6.20 | $ 18.85 | $ 14.12 | $ 10.38 |
Total Return B, C, D | (63.08)% | 33.50% | 36.03% | 3.80% |
Ratios to Average Net Assets F, I | | | | |
Expenses before reductions | 2.00% | 1.85% | 1.85% | 2.92% A |
Expenses net of fee waivers, if any | 1.91% | 1.85% | 1.85% | 1.90% A |
Expenses net of all reductions | 1.87% | 1.81% | 1.74% | 1.78% A |
Net investment income (loss) | (.12)% | (.13)% | (.20)% | (.33)% A |
Supplemental Data | | | | |
Net assets, end of period (000 omitted) | $ 11,614 | $ 46,568 | $ 28,309 | $ 2,704 |
Portfolio turnover rate G | 61% | 107% | 164% | 46% |
A Annualized
B Total returns for periods of less than one year are not annualized.
C Total returns would have been lower had certain expenses not been reduced during the periods shown.
D Total returns do not include the effect of the sales charges.
E Calculated based on average shares outstanding during the period.
F Fees and expenses of the underlying Fidelity Central Funds are not included in the Fund's expense ratio. The Fund indirectly bears its proportionate share of the expenses of any underlying Fidelity Central Funds.
G Amount does not include the portfolio activity of any underlying Fidelity Central Funds.
H For the period August 2, 2005 (commencement of operations) to October 31, 2005.
I Expense ratios reflect operating expenses of the class. Expenses before reductions do not reflect amounts reimbursed by the investment adviser or reductions from brokerage service arrangements or other expense offset arrangements and do not represent the amount paid by the class during periods when reimbursements or reductions occur. Expense ratios before reductions for start-up periods may not be representative of longer-term operating periods. Expenses net of fee waivers reflect expenses after reimbursement by the investment adviser but prior to reductions from brokerage service arrangements or other expense offset arrangements. Expenses net of all reductions represent the net expenses paid by the class.
J Amount represents less than $.01 per share.
K Total distributions of $1.852 per share is comprised of distributions from net realized gain of $1.852 per share.
See accompanying notes which are an integral part of the financial statements.
Annual Report
Financial Highlights - Class B
Years ended October 31, | 2008 | 2007 | 2006 | 2005 H |
Selected Per-Share Data | | | | |
Net asset value, beginning of period | $ 18.64 | $ 14.04 | $ 10.37 | $ 10.00 |
Income from Investment Operations | | | | |
Net investment income (loss) E | (.08) | (.11) | (.10) | (.02) |
Net realized and unrealized gain (loss) | (10.68) | 4.70 | 3.74 | .38 |
Total from investment operations | (10.76) | 4.59 | 3.64 | .36 |
Distributions from net realized gain | (1.76) K | - | - | - |
Redemption fees added to paid in capital E | - J | .01 | .03 | .01 |
Net asset value, end of period | $ 6.12 | $ 18.64 | $ 14.04 | $ 10.37 |
Total Return B, C, D | (63.32)% | 32.76% | 35.39% | 3.70% |
Ratios to Average Net Assets F, I | | | | |
Expenses before reductions | 2.51% | 2.40% | 2.45% | 3.43% A |
Expenses net of fee waivers, if any | 2.41% | 2.40% | 2.41% | 2.40% A |
Expenses net of all reductions | 2.38% | 2.36% | 2.30% | 2.27% A |
Net investment income (loss) | (.62)% | (.67)% | (.76)% | (.82)% A |
Supplemental Data | | | | |
Net assets, end of period (000 omitted) | $ 2,687 | $ 10,975 | $ 7,709 | $ 1,705 |
Portfolio turnover rate G | 61% | 107% | 164% | 46% |
A Annualized
B Total returns for periods of less than one year are not annualized.
C Total returns would have been lower had certain expenses not been reduced during the periods shown.
D Total returns do not include the effect of the contingent deferred sales charge.
E Calculated based on average shares outstanding during the period.
F Fees and expenses of the underlying Fidelity Central Funds are not included in the Fund's expense ratio. The Fund indirectly bears its proportionate share of the expenses of any underlying Fidelity Central Funds.
G Amount does not include the portfolio activity of any underlying Fidelity Central Funds.
H For the period August 2, 2005 (commencement of operations) to October 31, 2005.
I Expense ratios reflect operating expenses of the class. Expenses before reductions do not reflect amounts reimbursed by the investment adviser or reductions from brokerage service arrangements or other expense offset arrangements and do not represent the amount paid by the class during periods when reimbursements or reductions occur. Expense ratios before reductions for start-up periods may not be representative of longer-term operating periods. Expenses net of fee waivers reflect expenses after reimbursement by the investment adviser but prior to reductions from brokerage service arrangements or other expense offset arrangements. Expenses net of all reductions represent the net expenses paid by the class.
J Amount represents less than $.01 per share.
K Total distributions of $1.760 per share is comprised of distributions from net realized gain of $1.760 per share.
See accompanying notes which are an integral part of the financial statements.
Annual Report
Financial Highlights - Class C
Years ended October 31, | 2008 | 2007 | 2006 | 2005 H |
Selected Per-Share Data | | | | |
Net asset value, beginning of period | $ 18.63 | $ 14.03 | $ 10.37 | $ 10.00 |
Income from Investment Operations | | | | |
Net investment income (loss) E | (.08) | (.11) | (.10) | (.02) |
Net realized and unrealized gain (loss) | (10.66) | 4.70 | 3.73 | .38 |
Total from investment operations | (10.74) | 4.59 | 3.63 | .36 |
Distributions from net realized gain | (1.78) K | - | - | - |
Redemption fees added to paid in capital E | - J | .01 | .03 | .01 |
Net asset value, end of period | $ 6.11 | $ 18.63 | $ 14.03 | $ 10.37 |
Total Return B, C, D | (63.32)% | 32.79% | 35.29% | 3.70% |
Ratios to Average Net Assets F, I | | | | |
Expenses before reductions | 2.51% | 2.38% | 2.38% | 3.32% A |
Expenses net of fee waivers, if any | 2.41% | 2.38% | 2.38% | 2.40% A |
Expenses net of all reductions | 2.38% | 2.34% | 2.27% | 2.29% A |
Net investment income (loss) | (.62)% | (.66)% | (.73)% | (.84)% A |
Supplemental Data | | | | |
Net assets, end of period (000 omitted) | $ 9,497 | $ 40,894 | $ 26,320 | $ 3,317 |
Portfolio turnover rate G | 61% | 107% | 164% | 46% |
A Annualized
B Total returns for periods of less than one year are not annualized.
C Total returns would have been lower had certain expenses not been reduced during the periods shown.
D Total returns do not include the effect of the contingent deferred sales charge.
E Calculated based on average shares outstanding during the period.
F Fees and expenses of the underlying Fidelity Central Funds are not included in the Fund's expense ratio. The Fund indirectly bears its proportionate share of the expenses of any underlying Fidelity Central Funds.
G Amount does not include the portfolio activity of any underlying Fidelity Central Funds.
H For the period August 2, 2005 (commencement of operations) to October 31, 2005.
I Expense ratios reflect operating expenses of the class. Expenses before reductions do not reflect amounts reimbursed by the investment adviser or reductions from brokerage service arrangements or other expense offset arrangements and do not represent the amount paid by the class during periods when reimbursements or reductions occur. Expense ratios before reductions for start-up periods may not be representative of longer-term operating periods. Expenses net of fee waivers reflect expenses after reimbursement by the investment adviser but prior to reductions from brokerage service arrangements or other expense offset arrangements. Expenses net of all reductions represent the net expenses paid by the class.
J Amount represents less than $.01 per share.
K Total distributions of $1.775 per share is comprised of distributions from net realized gain of $1.775 per share.
See accompanying notes which are an integral part of the financial statements.
Annual Report
Financial Highlights - International Small Cap Opportunities
Years ended October 31, | 2008 | 2007 | 2006 | 2005 G |
Selected Per-Share Data | | | | |
Net asset value, beginning of period | $ 19.09 | $ 14.23 | $ 10.40 | $ 10.00 |
Income from Investment Operations | | | | |
Net investment income (loss) D | .05 | .07 | .05 | - I |
Net realized and unrealized gain (loss) | (10.92) | 4.78 | 3.75 | .39 |
Total from investment operations | (10.87) | 4.85 | 3.80 | .39 |
Distributions from net investment income | (.06) | - | - | - |
Distributions from net realized gain | (1.88) | - | - I | - |
Total distributions | (1.94) J | - | - I | - |
Redemption fees added to paid in capital D | - I | .01 | .03 | .01 |
Net asset value, end of period | $ 6.28 | $ 19.09 | $ 14.23 | $ 10.40 |
Total Return B, C | (62.91)% | 34.15% | 36.86% | 4.00% |
Ratios to Average Net Assets E, H | | | | |
Expenses before reductions | 1.44% | 1.30% | 1.28% | 2.25% A |
Expenses net of fee waivers, if any | 1.44% | 1.30% | 1.28% | 1.40% A |
Expenses net of all reductions | 1.40% | 1.25% | 1.16% | 1.31% A |
Net investment income (loss) | .36% | .43% | .37% | .14% A |
Supplemental Data | | | | |
Net assets, end of period (000 omitted) | $ 312,376 | $ 1,433,844 | $ 981,210 | $ 197,349 |
Portfolio turnover rate F | 61% | 107% | 164% | 46% |
A Annualized
B Total returns for periods of less than one year are not annualized.
C Total returns would have been lower had certain expenses not been reduced during the periods shown.
D Calculated based on average shares outstanding during the period.
E Fees and expenses of the underlying Fidelity Central Funds are not included in the Fund's expense ratio. The Fund indirectly bears its proportionate share of the expenses of any underlying Fidelity Central Funds.
F Amount does not include the portfolio activity of any underlying Fidelity Central Funds.
G For the period August 2, 2005 (commencement of operations) to October 31, 2005.
H Expense ratios reflect operating expenses of the class. Expenses before reductions do not reflect amounts reimbursed by the investment adviser or reductions from brokerage service arrangements or other expense offset arrangements and do not represent the amount paid by the class during periods when reimbursements or reductions occur. Expense ratios before reductions for start-up periods may not be representative of longer-term operating periods. Expenses net of fee waivers reflect expenses after reimbursement by the investment adviser but prior to reductions from brokerage service arrangements or other expense offset arrangements. Expenses net of all reductions represent the net expenses paid by the class.
I Amount represents less than $.01 per share.
J Total distributions of $1.942 per share is comprised of distributions from net investment income of $.064 and distributions from net realized gain of $1.878 per share.
See accompanying notes which are an integral part of the financial statements.
Annual Report
Financial Highlights - Institutional Class
Years ended October 31, | 2008 | 2007 | 2006 | 2005 G |
Selected Per-Share Data | | | | |
Net asset value, beginning of period | $ 19.09 | $ 14.22 | $ 10.40 | $ 10.00 |
Income from Investment Operations | | | | |
Net investment income (loss) D | .05 | .08 | .05 | - I |
Net realized and unrealized gain (loss) | (10.92) | 4.78 | 3.74 | .39 |
Total from investment operations | (10.87) | 4.86 | 3.79 | .39 |
Distributions from net investment income | (.07) | - | - | - |
Distributions from net realized gain | (1.88) | - | - I | - |
Total distributions | (1.95) J | - | - I | - |
Redemption fees added to paid in capital D | - I | .01 | .03 | .01 |
Net asset value, end of period | $ 6.27 | $ 19.09 | $ 14.22 | $ 10.40 |
Total Return B, C | (62.95)% | 34.25% | 36.77% | 4.00% |
Ratios to Average Net Assets E, H | | | | |
Expenses before reductions | 1.40% | 1.29% | 1.25% | 2.25% A |
Expenses net of fee waivers, if any | 1.40% | 1.29% | 1.25% | 1.40% A |
Expenses net of all reductions | 1.37% | 1.25% | 1.14% | 1.29% A |
Net investment income (loss) | .39% | .44% | .40% | .16% A |
Supplemental Data | | | | |
Net assets, end of period (000 omitted) | $ 8,117 | $ 27,609 | $ 13,954 | $ 2,849 |
Portfolio turnover rate F | 61% | 107% | 164% | 46% |
A Annualized
B Total returns for periods of less than one year are not annualized.
C Total returns would have been lower had certain expenses not been reduced during the periods shown.
D Calculated based on average shares outstanding during the period.
E Fees and expenses of the underlying Fidelity Central Funds are not included in the Fund's expense ratio. The Fund indirectly bears its proportionate share of the expenses of any underlying Fidelity Central Funds.
F Amount does not include the portfolio activity of any underlying Fidelity Central Funds.
G For the period August 2, 2005 (commencement of operations) to October 31, 2005.
H Expense ratios reflect operating expenses of the class. Expenses before reductions do not reflect amounts reimbursed by the investment adviser or reductions from brokerage service arrangements or other expense offset arrangements and do not represent the amount paid by the class during periods when reimbursements or reductions occur. Expense ratios before reductions for start-up periods may not be representative of longer-term operating periods. Expenses net of fee waivers reflect expenses after reimbursement by the investment adviser but prior to reductions from brokerage service arrangements or other expense offset arrangements. Expenses net of all reductions represent the net expenses paid by the class.
I Amount represents less than $.01 per share.
J Total distributions of $1.952 per share is comprised of distributions from net investment income of $.074 and distributions from net realized gain of $1.878 per share.
See accompanying notes which are an integral part of the financial statements.
Annual Report
Notes to Financial Statements
For the period ended October 31, 2008
1. Organization.
Fidelity International Small Cap Opportunities Fund (the Fund) is a fund of Fidelity Investment Trust (the trust) and is authorized to issue an unlimited number of shares. The trust is registered under the Investment Company Act of 1940, as amended (the 1940 Act), as an open-end management investment company organized as a Massachusetts business trust. The Fund offers Class A, Class T, Class B, Class C, International Small Cap Opportunities, and Institutional Class shares, each of which has equal rights as to assets and voting privileges. Each class has exclusive voting rights with respect to matters that affect that class. Class B shares will automatically convert to Class A shares after a holding period of seven years from the initial date of purchase. Investment income, realized and unrealized capital gains and losses, the common expenses of the Fund, and certain fund-level expense reductions, if any, are allocated on a pro rata basis to each class based on the relative net assets of each class to the total net assets of the Fund. Each class differs with respect to transfer agent and distribution and service plan fees incurred. Certain expense reductions also differ by class. The Fund's investments in emerging markets can be subject to social, economic, regulatory, and political uncertainties and can be extremely volatile.
2. Investments in Fidelity Central Funds.
The Fund may invest in Fidelity Central Funds, which are open-end investment companies available only to other investment companies and accounts managed by Fidelity Management & Research Company (FMR) and its affiliates. The Fund's Schedule of Investments lists each of the Fidelity Central Funds held as of period end, if any, as an investment of the Fund, but does not include the underlying holdings of each Fidelity Central Fund. As an Investing Fund, the Fund indirectly bears its proportionate share of the expenses of the underlying Fidelity Central Funds.
The Money Market Central Funds seek preservation of capital and current income and are managed by Fidelity Investments Money Management, Inc. (FIMM), an affiliate of FMR.
A complete unaudited list of holdings for each Fidelity Central Fund is available upon request or at the SEC's web site at www.sec.gov. In addition, the financial statements of the Fidelity Central Funds, which are not covered by the Fund's Report of Independent Registered Public Accounting Firm, are available on the SEC's web site or upon request.
3. Significant Accounting Policies.
The financial statements have been prepared in conformity with accounting principles generally accepted in the United States of America, which require management to make certain estimates and assumptions at the date of the financial statements. Actual results
Annual Report
3. Significant Accounting Policies - continued
could differ from those estimates. The following summarizes the significant accounting policies of the Fund:
Security Valuation. Investments are valued as of 4:00 p.m. Eastern time on the last calendar day of the period. Wherever possible, the Fund uses independent pricing services approved by the Board of Trustees to value its investments.
Equity securities, including restricted securities, for which market quotations are readily available, are valued at the last reported sale price or official closing price as reported by an independent pricing service on the primary market or exchange on which they are traded. In the event there were no sales during the day or closing prices are not available, securities are valued at the last quoted bid price. Investments in open-end mutual funds, including the Fidelity Central Funds, are valued at their closing net asset value each business day. Short-term securities with remaining maturities of sixty days or less for which quotations are not readily available are valued at amortized cost, which approximates value.
When current market prices or quotations are not readily available or reliable, valuations may be determined in good faith in accordance with procedures adopted by the Board of Trustees. Factors used in determining value may include significant market or security specific events, changes in interest rates and credit quality, and developments in foreign markets which are monitored by evaluating the performance of ADRs, futures contracts and exchange-traded funds. The frequency with which these procedures are used cannot be predicted and may be utilized to a significant extent. The value of securities used for net asset value (NAV) calculation under these procedures may differ from published prices for the same securities.
Foreign Currency. The Fund uses foreign currency contracts to facilitate transactions in foreign-denominated securities. Losses from these transactions may arise from changes in the value of the foreign currency or if the counterparties do not perform under the contracts' terms.
Foreign-denominated assets, including investment securities, and liabilities are translated into U.S. dollars at the exchange rate at period end. Purchases and sales of investment securities, income and dividends received and expenses denominated in foreign currencies are translated into U.S. dollars at the exchange rate in effect on the transaction date.
The effects of exchange rate fluctuations on investments are included with the net realized and unrealized gain (loss) on investment securities. Other foreign currency transactions resulting in realized and unrealized gain (loss) are disclosed separately.
Annual Report
Notes to Financial Statements - continued
3. Significant Accounting Policies - continued
Investment Transactions and Income. For financial reporting purposes, the Fund's investment holdings and NAV include trades executed through the end of the last business day of the period. The NAV per share for processing shareholder transactions is calculated as of the close of business of the New York Stock Exchange (NYSE), normally 4:00 p.m. Eastern time and includes trades executed through the end of the prior business day. Gains and losses on securities sold are determined on the basis of identified cost. Dividend income is recorded on the ex-dividend date, except for certain dividends from foreign securities where the ex-dividend date may have passed, which are recorded as soon as the Fund is informed of the ex-dividend date. Non-cash dividends included in dividend income, if any, are recorded at the fair market value of the securities received. Interest income and distributions from the Fidelity Central Funds are accrued as earned. Interest income includes coupon interest and amortization of premium and accretion of discount on debt securities. Investment income is recorded net of foreign taxes withheld where recovery of such taxes is uncertain.
Expenses. Most expenses of the trust can be directly attributed to a fund. Expenses which cannot be directly attributed are apportioned among each Fund in the trust. Expense estimates are accrued in the period to which they relate and adjustments are made when actual amounts are known.
Income Tax Information and Distributions to Shareholders. Each year, the Fund intends to qualify as a regulated investment company by distributing substantially all of its taxable income and realized gains under Subchapter M of the Internal Revenue Code and filing its U.S. federal tax return. As a result, no provision for income taxes is required. The Fund is subject to the provisions of FASB Interpretation No. 48, Accounting for Uncertainties in Income Taxes (FIN 48). FIN 48 sets forth a minimum threshold for financial statement recognition of the benefit of a tax position taken or expected to be taken in a tax return. The implementation of FIN 48 did not result in any unrecognized tax benefits in the accompanying financial statements. Each of the Fund's federal tax returns for the prior three fiscal years remains subject to examination by the Internal Revenue Service (IRS). Foreign taxes are provided for based on the Fund's understanding of the tax rules and rates that exist in the foreign markets in which it invests.
Distributions are recorded on the ex-dividend date. Income dividends and capital gain distributions are declared separately for each class. Income and capital gain distributions are determined in accordance with income tax regulations, which may differ from generally accepted accounting principles.
Capital accounts within the financial statements are adjusted for permanent book-tax differences. These adjustments have no impact on net assets or the results of operations. Temporary book-tax differences will reverse in a subsequent period.
Annual Report
3. Significant Accounting Policies - continued
Income Tax Information and Distributions to Shareholders - continued
Book-tax differences are primarily due to foreign currency transactions, passive foreign investment companies (PFIC), certain foreign taxes, capital loss carryforwards and losses deferred due to wash sales.
The tax-basis components of distributable earnings and the federal tax cost as of period end were as follows:
Unrealized appreciation | $ 7,261,219 |
Unrealized depreciation | (332,961,765) |
Net unrealized appreciation (depreciation) | (325,700,546) |
Capital loss carryforward | (146,419,794) |
| |
Cost for federal income tax purposes | $ 763,909,463 |
The tax character of distributions paid was as follows:
| October 31, 2008 | October 31, 2007 |
Ordinary Income | $ 16,665,902 | $ - |
Long-term Capital Gains | 142,643,403 | - |
Total | $ 159,309,305 | $ - |
Short-Term Trading (Redemption) Fees. Shares held in the Fund less than 90 days are subject to a redemption fee equal to 2.00% of the proceeds of the redeemed shares. All redemption fees, including any estimated redemption fees paid by FMR, are retained by the Fund and accounted for as an addition to paid in capital.
New Accounting Pronouncement. In September 2006, Statement of Financial Accounting Standards No. 157, Fair Value Measurements (SFAS 157), was issued and is effective for fiscal years beginning after November 15, 2007. SFAS 157 defines fair value, establishes a framework for measuring fair value and results in expanded disclosures about fair value measurements.
4. Operating Policies.
Repurchase Agreements. FMR has received an Exemptive Order from the Securities and Exchange Commission (the SEC) which permits the Fund and other affiliated entities of FMR to transfer uninvested cash balances into joint trading accounts which are then invested in repurchase agreements. The Fund may also invest directly with institutions in repurchase agreements. Repurchase agreements are collateralized by government or non-government securities. Upon settlement date, collateral is held in segregated accounts with custodian banks and may be obtained in the event of a default of the counterparty. The Fund monitors, on a daily basis, the value of the collateral to ensure it is at least equal to the principal amount of the repurchase agreement
Annual Report
Notes to Financial Statements - continued
4. Operating Policies - continued
Repurchase Agreements - continued
(including accrued interest). In the event of a default by the counterparty, realization of the collateral proceeds could be delayed, during which time the value of the collateral may decline.
5. Purchases and Sales of Investments.
Purchases and sales of securities, other than short-term securities, aggregated $594,537,624 and $981,461,622, respectively.
6. Fees and Other Transactions with Affiliates.
Management Fee. FMR and its affiliates provide the Fund with investment management related services for which the Fund pays a monthly management fee. The management fee is the sum of an individual fund fee rate that is based on an annual rate of .60% of the Fund's average net assets and a group fee rate that averaged .26% during the period. The group fee rate is based upon the average net assets of all the mutual funds advised by FMR. The group fee rate decreases as assets under management increase and increases as assets under management decrease. In addition, the management fee is subject to a performance adjustment (up to a maximum of ± .20% of the Fund's average net assets over a 36 month performance period). The upward or downward adjustment to the management fee is based on the relative investment performance of the retail class of the Fund, International Small Cap Opportunities as compared to an appropriate benchmark index. For the period, the total annual management fee rate, including the performance adjustment, was 1.07% of the Fund's average net assets.
Distribution and Service Plan. In accordance with Rule 12b-1 of the 1940 Act, the Fund has adopted separate Distribution and Service Plans for each class of shares. Certain classes pay Fidelity Distributors Corporation (FDC), an affiliate of FMR, separate Distribution and Service Fees, each of which is based on an annual percentage of each class' average net assets. In addition, FDC may pay financial intermediaries for selling shares of the Fund and providing shareholder support services. For the period, the Distribution and Service Fee rates and the total amounts paid to and retained by FDC were as follows:
| Distribution
Fee | Service
Fee | Paid to
FDC | Retained
by FDC |
Class A | 0% | .25% | $ 113,686 | $ 9,692 |
Class T | .25% | .25% | 142,986 | 2,758 |
Class B | .75% | .25% | 68,222 | 51,535 |
Class C | .75% | .25% | 255,510 | 47,663 |
| | | $ 580,404 | $ 111,648 |
Annual Report
6. Fees and Other Transactions with Affiliates - continued
Sales Load. FDC receives a front-end sales charge of up to 5.75% for selling Class A shares, and 3.50% for selling Class T shares, some of which is paid to financial intermediaries for selling shares of the Fund. FDC receives the proceeds of contingent deferred sales charges levied on Class A, Class T, Class B, and Class C redemptions. These charges depend on the holding period. The deferred sales charges range from 5% to 1% for Class B, 1% for Class C, 1.00% to .50% for certain purchases of Class A shares and .25% for certain purchases of Class T shares.
For the period, sales charge amounts retained by FDC were as follows:
| Retained
by FDC |
Class A | $ 19,917 |
Class T | 6,001 |
Class B* | 29,903 |
Class C* | 4,501 |
| $ 60,322 |
* When Class B and Class C shares are initially sold, FDC pays commissions from its own resources to financial intermediaries through which the sales are made.
Transfer Agent Fees. Fidelity Investments Institutional Operations Company, Inc. (FIIOC), an affiliate of FMR, is the transfer, dividend disbursing and shareholder servicing agent for each class of the Fund. FIIOC receives account fees and asset-based fees that vary according to the account size and type of account of the shareholders of the respective classes of the Fund. FIIOC pays for typesetting, printing and mailing of shareholder reports, except proxy statements. Prior to January 1, 2008, Fidelity Service Company, Inc. (FSC), also an affiliate of FMR was the transfer agent for International Small Cap Opportunities shares. For the period, each class paid the following transfer agent fees:
| Amount | % of
Average
Net Assets |
Class A | $ 140,073 | .31 |
Class T | 88,875 | .31 |
Class B | 21,153 | .31 |
Class C | 79,086 | .31 |
International Small Cap Opportunities | 2,100,743 | .25 |
Institutional Class | 37,286 | .22 |
| $ 2,467,216 | |
Accounting and Security Lending Fees. FSC, an affiliate of FMR, maintains the Fund's accounting records. The accounting fee is based on the level of average net assets for the month. Under a separate contract, FSC administers the security lending program. The security lending fee is based on the number and duration of lending transactions.
Annual Report
Notes to Financial Statements - continued
6. Fees and Other Transactions with Affiliates - continued
Brokerage Commissions. The Fund placed a portion of its portfolio transactions with brokerage firms which are affiliates of the investment adviser. The commissions paid to these affiliated firms were $6,205 for the period.
Interfund Lending Program. Pursuant to an Exemptive Order issued by the SEC, the Fund, along with other registered investment companies having management contracts with FMR, may participate in an interfund lending program. This program provides an alternative credit facility allowing the funds to borrow from, or lend money to, other participating affiliated funds. At period end, there were no interfund loans outstanding. The Fund's activity in this program during the period for which loans were outstanding was as follows:
Borrower or Lender | Average Daily Loan
Balance | Weighted Average
Interest Rate | Interest
Expense |
Borrower | $ 6,424,452 | 3.28% | $ 36,307 |
7. Committed Line of Credit.
The Fund participates with other funds managed by FMR in a $4.2 billion credit facility (the "line of credit") to be utilized for temporary or emergency purposes to fund shareholder redemptions or for other short-term liquidity purposes. The Fund has agreed to pay commitment fees on its pro rata portion of the line of credit, which amounted to $2,080 and is reflected in Miscellaneous Expense on the Statement of Operations. During the period, there were no borrowings on this line of credit.
8. Security Lending.
The Fund lends portfolio securities from time to time in order to earn additional income. On the settlement date of the loan, the Fund receives collateral (in the form of U.S. Treasury obligations, letters of credit and/or cash) against the loaned securities and maintains collateral in an amount not less than 100% of the market value of the loaned securities during the period of the loan. The market value of the loaned securities is determined at the close of business of the Fund and any additional required collateral is delivered to the Fund on the next business day. If the borrower defaults on its obligation to return the securities loaned because of insolvency or other reasons, a fund could experience delays and costs in recovering the securities loaned or in gaining access to the collateral. Any cash collateral received is invested in the Fidelity Securities Lending Cash Central Fund. The value of loaned securities and cash collateral at period end are disclosed on the Fund's Statement of Assets and Liabilities. Security lending income represents the income earned on investing cash collateral, less fees and expenses associated with the loan, plus any premium payments that may be received on the loan of certain types of securities. Security lending income is presented in the Statement of Operations as a component of income from Fidelity Central Funds.
Annual Report
9. Bank Borrowings.
The Fund is permitted to have bank borrowings for temporary or emergency purposes to fund shareholder redemptions. The Fund has established borrowing arrangements with certain banks. The interest rate on the borrowings is the bank's base rate, as revised from time to time. The average daily loan balance during the period for which loans were outstanding amounted to $8,838,667. The weighted average interest rate was 3.87%. The interest expense amounted to $2,854 under the bank borrowing program. At period end, there were no bank borrowings outstanding.
10. Expense Reductions.
FMR voluntarily agreed to reimburse each class to the extent annual operating expenses exceeded certain levels of average net assets as noted in the table below. Some expenses, for example interest expense, including commitment fees, are excluded from this reimbursement.
The following classes were in reimbursement during the period:
| Expense
Limitations | Reimbursement
from adviser |
| | |
Class A | 1.65% | $ 40,541 |
Class T | 1.90% | 26,563 |
Class B | 2.40% | 6,483 |
Class C | 2.40% | 24,403 |
| | $ 97,990 |
Many of the brokers with whom FMR places trades on behalf of the Fund provided services to the Fund in addition to trade execution. These services included payments of certain expenses on behalf of the Fund totaling $329,425 for the period. In addition, through arrangements with each class' transfer agent, credits realized as a result of uninvested cash balances were used to reduce the Fund's expenses.
During the period, credits reduced each class' transfer agent expense as noted in the table below.
| Transfer Agent
expense reduction |
International Small Cap Opportunities | $ 3,141 |
Annual Report
Notes to Financial Statements - continued
11. Other.
The Fund's organizational documents provide former and current trustees and officers with a limited indemnification against liabilities arising in connection with the performance of their duties to the Fund. In the normal course of business, the Fund may also enter into contracts that provide general indemnifications. The Fund's maximum exposure under these arrangements is unknown as this would be dependent on future claims that may be made against the Fund. The risk of material loss from such claims is considered remote.
12. Distributions to Shareholders.
Distributions to shareholders of each class were as follows:
Years ended October 31, | 2008 | 2007 |
From net investment income | | |
Class A | $ 91,280 | $ - |
International Small Cap Opportunities | 4,620,425 | - |
Institutional Class | 105,667 | - |
Total | $ 4,817,372 | $ - |
From net realized gain | | |
Class A | $ 6,856,940 | $ - |
Class T | 4,515,065 | - |
Class B | 1,019,225 | - |
Class C | 3,838,511 | - |
International Small Cap Opportunities | 135,580,534 | - |
Institutional Class | 2,681,658 | - |
Total | $ 154,491,933 | $ - |
13. Share Transactions.
Transactions for each class of shares were as follows:
| Shares | Dollars |
Years ended October 31, | 2008 | 2007 | 2008 | 2007 |
Class A | | | | |
Shares sold | 828,854 | 2,107,892 | $ 10,916,918 | $ 35,531,826 |
Reinvestment of distributions | 416,175 | - | 6,313,370 | - |
Shares redeemed | (2,104,322) | (892,381) | (25,609,420) | (14,908,147) |
Net increase (decrease) | (859,293) | 1,215,511 | $ (8,379,132) | $ 20,623,679 |
Class T | | | | |
Shares sold | 298,437 | 1,311,252 | $ 3,745,246 | $ 21,607,239 |
Reinvestment of distributions | 288,615 | - | 4,360,975 | - |
Shares redeemed | (1,182,864) | (845,477) | (14,814,150) | (14,215,111) |
Net increase (decrease) | (595,812) | 465,775 | $ (6,707,929) | $ 7,392,128 |
Annual Report
13. Share Transactions - continued
Transactions for each class of shares were as follows:
| Shares | Dollars |
Years ended October 31, | 2008 | 2007 | 2008 | 2007 |
Class B | | | | |
Shares sold | 67,210 | 286,293 | $ 882,196 | $ 4,653,400 |
Reinvestment of distributions | 61,167 | - | 917,505 | - |
Shares redeemed | (278,427) | (246,522) | (3,422,675) | (4,027,585) |
Net increase (decrease) | (150,050) | 39,771 | $ (1,622,974) | $ 625,815 |
Class C | | | | |
Shares sold | 393,320 | 888,414 | $ 4,565,906 | $ 14,698,282 |
Reinvestment of distributions | 216,879 | - | 3,248,846 | - |
Shares redeemed | (1,252,106) | (569,219) | (14,199,211) | (9,379,169) |
Net increase (decrease) | (641,907) | 319,195 | $ (6,384,459) | $ 5,319,113 |
International Small Cap Opportunities | | | | |
Shares sold | 10,644,155 | 48,402,736 | $ 141,713,979 | $ 800,622,633 |
Reinvestment of distributions | 8,363,264 | - | 127,539,782 | - |
Shares redeemed | (44,345,885) | (42,286,931) | (553,799,561) | (715,447,148) |
Net increase (decrease) | (25,338,466) | 6,115,805 | $ (284,545,800) | $ 85,175,485 |
Institutional Class | | | | |
Shares sold | 915,939 | 903,141 | $ 11,419,413 | $ 15,436,027 |
Reinvestment of distributions | 149,148 | - | 2,273,017 | - |
Shares redeemed | (1,217,529) | (437,882) | (14,541,508) | (7,375,351) |
Net increase (decrease) | (152,442) | 465,259 | $ (849,078) | $ 8,060,676 |
Annual Report
To the Trustees of Fidelity Investment Trust and Shareholders of Fidelity International Small Cap Opportunities Fund:
We have audited the accompanying statement of assets and liabilities of Fidelity International Small Cap Opportunities Fund (the Fund), a fund of Fidelity Investment Trust, including the schedule of investments, as of October 31, 2008, and the related statement of operations for the year then ended, the statement of changes in net assets for each of the two years in the period then ended, and the financial highlights for the three years in the period then ended and for the period from August 2, 2005 (commencement of operations) to October 31, 2005. These financial statements and financial highlights are the responsibility of the Fund's management. Our responsibility is to express an opinion on these financial statements and financial highlights based on our audits.
We conducted our audits in accordance with standards of the Public Company Accounting Oversight Board (United States). Those standards require that we plan and perform the audit to obtain reasonable assurance about whether the financial statements and financial highlights are free of material misstatement. The Fund is not required to have, nor were we engaged to perform, an audit of its internal control over financial reporting. Our audits included consideration of internal control over financial reporting as a basis for designing audit procedures that are appropriate in the circumstances, but not for the purpose of expressing an opinion on the effectiveness of the Fund's internal control over financial reporting. Accordingly, we express no such opinion. An audit also includes examining, on a test basis, evidence supporting the amounts and disclosures in the financial statements, assessing the accounting principles used and significant estimates made by management, as well as evaluating the overall financial statement presentation. Our procedures included confirmation of securities owned as of October 31, 2008, by correspondence with the custodians and brokers; where replies were not received from brokers, we performed other auditing procedures. We believe that our audits provide a reasonable basis for our opinion.
In our opinion, the financial statements and financial highlights referred to above present fairly, in all material respects, the financial position of Fidelity International Small Cap Opportunities Fund as of October 31, 2008, the results of its operations for the year then ended, the changes in its net assets for each of the two years in the period then ended, and its financial highlights for each of the three years in the period then ended and for the period from August 2, 2005 (commencement of operations) to October 31, 2005, in conformity with accounting principles generally accepted in the United States of America.
/s/ Deloitte & Touche LLP
DELOITTE & TOUCHE LLP
Boston, Massachusetts
December 19, 2008
Annual Report
The Trustees, Member of the Advisory Board, and executive officers of the trust and fund, as applicable, are listed below. The Board of Trustees governs the fund and is responsible for protecting the interests of shareholders. The Trustees are experienced executives who meet periodically throughout the year to oversee the fund's activities, review contractual arrangements with companies that provide services to the fund, and review the fund's performance. Except for Edward C. Johnson 3d and James C. Curvey, each of the Trustees oversees 220 funds advised by FMR or an affiliate. Messrs. Johnson and Curvey oversee 379 funds advised by FMR or an affiliate.
The Trustees hold office without limit in time except that (a) any Trustee may resign; (b) any Trustee may be removed by written instrument, signed by at least two-thirds of the number of Trustees prior to such removal; (c) any Trustee who requests to be retired or who has become incapacitated by illness or injury may be retired by written instrument signed by a majority of the other Trustees; and (d) any Trustee may be removed at any special meeting of shareholders by a two-thirds vote of the outstanding voting securities of the trust. Each Trustee who is not an interested person (as defined in the 1940 Act) (Independent Trustee), shall retire not later than the last day of the calendar year in which his or her 72nd birthday occurs. The Independent Trustees may waive this mandatory retirement age policy with respect to individual Trustees. The executive officers and Advisory Board Member hold office without limit in time, except that any officer and Advisory Board Member may resign or may be removed by a vote of a majority of the Trustees at any regular meeting or any special meeting of the Trustees. Except as indicated, each individual has held the office shown or other offices in the same company for the past five years.
The fund's Statement of Additional Information (SAI) includes more information about the Trustees. To request a free copy, call Fidelity at 1-800-544-8544.
Interested Trustees*:
Correspondence intended for each Trustee who is an interested person may be sent to Fidelity Investments, 82 Devonshire Street, Boston, Massachusetts 02109.
Name, Age; Principal Occupation |
Edward C. Johnson 3d (78) |
| Year of Election or Appointment: 1984 Mr. Johnson is Chairman of the Board of Trustees. Mr. Johnson serves as Chief Executive Officer, Chairman, and a Director of FMR LLC; Chairman and a Director of FMR; Chairman and a Director of Fidelity Research & Analysis Company (FRAC); Chairman and a Director of Fidelity Investments Money Management, Inc.; and Chairman and a Director of FMR Co., Inc. In addition, Mr. Johnson serves as Chairman and Director of FIL Limited. Previously, Mr. Johnson served as President of FMR LLC (2006-2007). |
James C. Curvey (73) |
| Year of Election or Appointment: 2007 Mr. Curvey also serves as Trustee (2007-present) of other investment companies advised by FMR. Mr. Curvey is a Director of FMR and FMR Co., Inc. (2007-present). Mr. Curvey is also Vice Chairman (2006-
present) and Director of FMR LLC. In addition, Mr. Curvey serves as an Overseer for the Boston Symphony Orchestra and a member of the Trustees of Villanova University. |
* Trustees have been determined to be "Interested Trustees" by virtue of, among other things, their affiliation with the trust or various entities under common control with FMR. FMR Corp. merged with and into FMR LLC on October 1, 2007. Any references to FMR LLC for prior periods are deemed to be references to the prior entity.
Independent Trustees:
Correspondence intended for each Independent Trustee (that is, the Trustees other than the Interested Trustees) may be sent to Fidelity Investments, P.O. Box 55235, Boston, Massachusetts 02205-5235.
Name, Age; Principal Occupation |
Dennis J. Dirks (60) |
| Year of Election or Appointment: 2005 Prior to his retirement in May 2003, Mr. Dirks was Chief Operating Officer and a member of the Board of The Depository Trust & Clearing Corporation (DTCC) (1999-2003). He also served as President, Chief Operating Officer, and Board member of The Depository Trust Company (DTC) (1999-2003) and President and Board member of the National Securities Clearing Corporation (NSCC) (1999-2003). In addition, Mr. Dirks served as a Trustee and a member of the Finance Committee of Manhattan College (2005-2008), and as Chief Executive Officer and Board member of the Government Securities Clearing Corporation (2001-2003) and Chief Executive Officer and Board member of the Mortgage-Backed Securities Clearing Corporation (2001-2003). Mr. Dirks also serves as a Trustee and a member of the Finance Committee of AHRC of Nassau County (2006-present). |
Alan J. Lacy (55) |
| Year of Election or Appointment: 2008 Mr. Lacy serves as Senior Adviser (2007-present) of Oak Hill Capital Partners, L.P. (a private equity firm). Mr. Lacy also served as Chief Executive Officer (2000-2005) and Vice Chairman (2005-2006) of Sears Holdings Corporation and Sears, Roebuck and Co. (retail). In addition, Mr. Lacy serves as a member of the Board of Directors of The Western Union Company (global money transfer, 2006-present) and Bristol-Myers Squibb (global pharmaceuticals, 2007-present). Mr. Lacy is a Trustee of the National Parks Conservation Association and The Field Museum of Natural History. |
Ned C. Lautenbach (64) |
| Year of Election or Appointment: 2000 Mr. Lautenbach is Chairman of the Independent Trustees (2006-present). Mr. Lautenbach is an Advisory Partner of Clayton, Dubilier & Rice, Inc. (private equity investment firm). Previously, Mr. Lautenbach was with the International Business Machines Corporation (IBM) from 1968 until his retirement in 1998. Mr. Lautenbach serves as a Director of Eaton Corporation (diversified industrial) as well as the Philharmonic Center for the Arts in Naples, Florida. He also is a member of the Board of Trustees of Fairfield University (2005-present), as well as a member of the Council on Foreign Relations. Previously, Mr. Lautenbach served as a Director of Sony Corporation (2006-2007).] |
Joseph Mauriello (64) |
| Year of Election or Appointment: 2008 Prior to his retirement in January 2006, Mr. Mauriello served in numerous senior management positions including Deputy Chairman and Chief Operating Officer (2004-2005), and Vice Chairman of Financial Services (2002-2004) of KPMG LLP US (professional services firm, 1965-2005). Mr. Mauriello currently serves as a member of the Board of Directors of XL Capital Ltd. (global insurance and re-insurance company, 2006-present) and of Arcadia Resources Inc. (health care services and products, 2007-present). He also served as a Director of the Hamilton Funds of the Bank of New York (2006-2007). |
Cornelia M. Small (64) |
| Year of Election or Appointment: 2005 Ms. Small is a member of the Investment Committee, and Chair (2008-present) and a member of the Board of Trustees of Smith College. Ms. Small also serves on the Investment Committee of the Berkshire Taconic Community Foundation (2008-present). Previously, Ms. Small served as Chairperson of the Investment Committee (2002-2008) of Smith College and as Co-Chair (2000-2003) of the Annual Fund for the Fletcher School of Law and Diplomacy. In addition, she served as Chief Investment Officer, Director of Global Equity Investments, and a member of the Board of Directors of Scudder, Stevens & Clark and Scudder Kemper Investments. |
William S. Stavropoulos (69) |
| Year of Election or Appointment: 2001 Mr. Stavropoulos is Chairman Emeritus of the Board of Directors of The Dow Chemical Company, where he previously served in numerous senior management positions, including President (1993-2000; 2002-
2003), CEO (1995-2000; 2002-2004), Chairman of the Executive Committee (2000-2006), and as a member of the Board of Directors (1990-2006). Currently, he is a Director of Teradata Corporation (data warehousing and technology solutions, 2008-present), Chemical Financial Corporation, Maersk Inc. (industrial conglomerate), Tyco International, Inc. (multinational manufacturing and services, 2007-present), and a member of the Advisory Board for Metalmark Capital (private equity investment firm, 2005-present). He is a special advisor to Clayton, Dubilier & Rice, Inc. (private equity investment). In addition, Mr. Stavropoulos is a member of the University of Notre Dame Advisory Council for the College of Science. |
David M. Thomas (59) |
| Year of Election or Appointment: 2008 Previously, Mr. Thomas served as Executive Chairman (2005-2006) and Chairman and Chief Executive Officer (2000-2005) of IMS Health, Inc. (pharmaceutical and healthcare information solutions). In addition, Mr. Thomas serves as a member of the Board of Directors of Fortune Brands, Inc. (consumer products holding company), and Interpublic Group of Companies, Inc. (marketing communication, 2004-present). |
Michael E. Wiley (58) |
| Year of Election or Appointment: 2008 Mr. Wiley also serves as a member of the Board of Trustees of the University of Tulsa (2000-2006; 2007-present). He serves as a Director of Tesoro Corporation (independent oil refiner and marketer, 2005-
present), and a Director of Bill Barrett Corporation (exploration and production company, 2005-present). In addition, he also serves as a Director of Post Oak Bank (privately-held bank, 2004-present). Previously, Mr. Wiley served as a Sr. Energy Advisor of Katzenbach Partners, LLC (consulting firm, 2006-2007), as an Advisory Director of Riverstone Holdings (private investment firm), Chairman, President, and CEO of Baker Hughes, Inc. (oilfield services company, 2000-2004), and as Director of Spinnaker Exploration Company (exploration and production company, 2001-2005). |
Advisory Board Member and Executive Officers**:
Correspondence intended for each executive officer and Mr. Lynch may be sent to Fidelity Investments, 82 Devonshire Street, Boston, Massachusetts 02109.
Name, Age; Principal Occupation |
Peter S. Lynch (64) |
| Year of Election or Appointment: 2003 Member of the Advisory Board of the Fidelity's Equity and High Income Funds. Mr. Lynch is Vice Chairman and a Director of FMR, and Vice Chairman (2001-present) and a Director of FMR Co., Inc. Previously, Mr. Lynch served as a Trustee of the Fidelity funds (1990-2003). In addition, he serves as a Trustee of Boston College and as the Chairman of the Inner-City Scholarship Fund. Previously, Mr. Lynch served on the Special Olympics International Board of Directors (1997-2006). |
Kenneth B. Robins (39) |
| Year of Election or Appointment: 2008 President and Treasurer of Fidelity's Equity and High Income Funds. Mr. Robins is an employee of Fidelity Investments (2004-present). Before joining Fidelity Investments, Mr. Robins worked at KPMG LLP, where he was a partner in KPMG's department of professional practice (2002-2004). |
Walter C. Donovan (46) |
| Year of Election or Appointment: 2007 Vice President of Fidelity's Equity Funds. Mr. Donovan also serves as President of FMR and FMR Co., Inc., and Executive Vice President of Fidelity Investments Money Management, Inc. (2007-present). Previously, Mr. Donovan served as Executive Vice President of FMR and FMR Co., Inc. (2005-2007) and Senior Vice President of FMR (2003-2005) and FMR Co., Inc. (2004-2005). |
Bruce T. Herring (43) |
| Year of Election or Appointment: 2006 Vice President of certain Equity Funds. Mr. Herring also serves as Group Chief Investments Officer of FMR. Previously, Mr. Herring served as a portfolio manager for Fidelity U.S. Equity Funds. |
Thomas C. Hense (44) |
| Year of Election or Appointment: 2008 Vice President of Fidelity's High Income and Small Cap Funds. Previously, Mr. Hense served as a portfolio manager for Fidelity's Institutional Money Management Group (Pyramis) (2003-2008). |
Eric M. Wetlaufer (46) |
| Year of Election or Appointment: 2006 Vice President of Fidelity's International Equity Funds. Mr. Wetlaufer also serves as Group Chief Investment Officer of FMR. Mr. Wetlaufer is Chairman, Chief Executive Officer, and President of Fidelity Management & Research (Hong Kong) Limited (2008-present); Chairman, Chief Executive Officer, President, and a Director of Fidelity Management & Research (Japan) Inc. (2008-present); Chairman and Chief Executive Officer (2007-present) and President and a Director (2006-present) of Fidelity Management & Research (U.K.) Inc. and President and a Director of Fidelity Research & Analysis Company (2006-present). Before joining Fidelity Investments in 2005, Mr. Wetlaufer was a partner in Oxhead Capital Management (2004-2005) and a Chief Investment Officer of Putnam Investments (1997-2003). |
Scott C. Goebel (40) |
| Year of Election or Appointment: 2008 Secretary and Chief Legal Officer (CLO) of the Fidelity funds. Mr. Goebel also serves as General Counsel, Secretary, and Senior Vice President of FMR (2008-present); Deputy General Counsel of FMR LLC; Chief Legal Secretary of Fidelity Management & Research (Hong Kong) Limited (2008-present) and Assistant Secretary of Fidelity Management & Research (Japan) Inc. (2008-present). Previously, Mr. Goebel served as Assistant Secretary of the Funds (2007-2008) and as Vice President and Secretary of Fidelity Distributors Corporation (FDC) (2005-2007). |
John B. McGinty, Jr. (46) |
| Year of Election or Appointment: 2008 Assistant Secretary of Fidelity's Equity and High Income Funds. Mr. McGinty is an employee of Fidelity Investments (2004-present). Mr. McGinty also serves as Senior Vice President, Secretary, and Chief Legal Officer of FDC (2007-present). Before joining Fidelity Investments, Mr. McGinty practiced law at Ropes & Gray, LLP. |
Holly C. Laurent (54) |
| Year of Election or Appointment: 2008 Anti-Money Laundering (AML) Officer of the Fidelity funds. Ms. Laurent is an employee of Fidelity Investments. Previously, Ms. Laurent was Senior Vice President and Head of Legal for Fidelity Business Services India Pvt. Ltd. (2006-2008), Senior Vice President, Deputy General Counsel and Group Head for FMR LLC (2005-2006). |
Christine Reynolds (50) |
| Year of Election or Appointment: 2008 Chief Financial Officer of the Fidelity funds. Ms. Reynolds became President of Fidelity Pricing and Cash Management Services (FPCMS) in August 2008. She served as Chief Operating Officer of FPCMS from 2007 through July 2008. Previously, Ms. Reynolds served as President, Treasurer, and Anti-Money Laundering officer of the Fidelity funds (2004-2007). Before joining Fidelity Investments, Ms. Reynolds worked at PricewaterhouseCoopers LLP (PwC) (1980-2002), where she was an audit partner with PwC's investment management practice. |
Kenneth A. Rathgeber (61) |
| Year of Election or Appointment: 2004 Chief Compliance Officer of Fidelity's Equity and High Income Funds. Mr. Rathgeber is Chief Compliance Officer of Fidelity Management & Research (Hong Kong) Limited (2008-present), Fidelity Management & Research (Japan) Inc. (2008-present), FMR (2005-present), FMR Co., Inc. (2005-present), Fidelity Management & Research (U.K.) Inc. (2005-
present), Fidelity Research & Analysis Company (2005-present), Fidelity Investments Money Management, Inc. (2005-present), and Strategic Advisers, Inc. (2005-present). |
Bryan A. Mehrmann (47) |
| Year of Election or Appointment: 2005 Deputy Treasurer of the Fidelity funds. Mr. Mehrmann is an employee of Fidelity Investments. Previously, Mr. Mehrmann served as Vice President of Fidelity Investments Institutional Services Group (FIIS)/Fidelity Investments Institutional Operations Corporation, Inc. (FIIOC) Client Services (1998-2004). |
Adrien E. Deberghes (41) |
| Year of Election or Appointment: 2008 Deputy Treasurer of Fidelity's Equity and High Income Funds. Mr. Deberghes is an employee of Fidelity Investments (2008-present). Previously, Mr. Deberghes served as Senior Vice President of Mutual Fund Administration at State Street Corporation (2007-2008), Senior Director of Mutual Fund Administration at Investors Bank & Trust (2005-2007), and Director of Finance for Dunkin' Brands (2000-2005). |
Robert G. Byrnes (41) |
| Year of Election or Appointment: 2005 Assistant Treasurer of the Fidelity funds. Mr. Byrnes is an employee of Fidelity Investments (2005-present). Previously, Mr. Byrnes served as Vice President of Fidelity Pricing and Cash Management Services (FPCMS) (2003-2005). Before joining Fidelity Investments, Mr. Byrnes worked at Deutsche Asset Management where he served as Vice President of the Investment Operations Group (2000-2003). |
Peter L. Lydecker (54) |
| Year of Election or Appointment: 2004 Assistant Treasurer of the Fidelity funds. Mr. Lydecker is an employee of Fidelity Investments. |
Paul M. Murphy (61) |
| Year of Election or Appointment: 2007 Assistant Treasurer of the Fidelity funds. Mr. Murphy is an employee of Fidelity Investments (2007-present). Previously, Mr. Murphy served as Chief Financial Officer of the Fidelity Funds (2005-2006), Vice President and Associate General Counsel of FMR (2007), and Senior Vice President of Fidelity Pricing and Cash Management Services (FPCMS) (1994-2007). |
Gary W. Ryan (50) |
| Year of Election or Appointment: 2005 Assistant Treasurer of the Fidelity funds. Mr. Ryan is an employee of Fidelity Investments. Previously, Mr. Ryan served as Vice President of Fund Reporting in Fidelity Pricing and Cash Management Services (FPCMS) (1999-2005). |
** FMR Corp. merged with and into FMR LLC on October 1, 2007. Any references to FMR LLC for prior periods are deemed to be references to the prior entity.
Annual Report
The Fund designates 82% of the dividends distributed during the fiscal year as amounts which may be taken into account as a dividend for purposes of the maximum rate under section 1(h)(11) of the Internal Revenue Code.
The amounts per share which represent income derived from sources within, and taxes paid to, foreign countries or possessions of the United States are as follows:
| Pay Date | Income | Taxes |
International Small Cap Opportunities Fund | 12/10/07 | $0.172 | $0.0219 |
The fund will notify shareholders in January 2009 of amounts for use in preparing 2008 income tax returns.
Annual Report
A special meeting of the fund's shareholders was held on April 16, 2008. The results of votes taken among shareholders on the proposal before them are reported below. Each vote reported represents one dollar of net asset value held on the record date for the meeting.
PROPOSAL 1 |
To elect a Board of Trustees.A |
| # of
Votes | % of
Votes |
James C. Curvey |
Affirmative | 44,485,656,811.55 | 94.702 |
Withheld | 2,488,551,854.62 | 5.298 |
TOTAL | 46,974,208,666.17 | 100.000 |
Dennis J. Dirks |
Affirmative | 44,706,671,638.31 | 95.173 |
Withheld | 2,267,537,027.86 | 4.827 |
TOTAL | 46,974,208,666.17 | 100.000 |
Edward C. Johnson 3d |
Affirmative | 44,294,881,638.16 | 94.296 |
Withheld | 2,679,327,028.01 | 5.704 |
TOTAL | 46,974,208,666.17 | 100.000 |
Alan J. Lacy |
Affirmative | 44,685,373,413.16 | 95.127 |
Withheld | 2,288,835,253.01 | 4.873 |
TOTAL | 46,974,208,666.17 | 100.000 |
Ned C. Lautenbach |
Affirmative | 44,634,541,379.41 | 95.019 |
Withheld | 2,339,667,286.76 | 4.981 |
TOTAL | 46,974,208,666.17 | 100.000 |
Joseph Mauriello |
Affirmative | 44,683,962,099.80 | 95.124 |
Withheld | 2,290,246,566.37 | 4.876 |
TOTAL | 46,974,208,666.17 | 100.000 |
Cornelia M. Small |
Affirmative | 44,671,688,375.36 | 95.098 |
Withheld | 2,302,520,290.81 | 4.902 |
TOTAL | 46,974,208,666.17 | 100.000 |
| # of
Votes | % of
Votes |
William S. Stavropoulos |
Affirmative | 44,465,262,087.61 | 94.659 |
Withheld | 2,508,946,578.56 | 5.341 |
TOTAL | 46,974,208,666.17 | 100.000 |
David M. Thomas |
Affirmative | 44,694,340,813.87 | 95.147 |
Withheld | 2,279,867,852.30 | 4.853 |
TOTAL | 46,974,208,666.17 | 100.000 |
Michael E. Wiley |
Affirmative | 44,686,513,174.78 | 95.130 |
Withheld | 2,287,695,491.39 | 4.870 |
TOTAL | 46,974,208,666.17 | 100.000 |
A Denotes trust-wide proposal and voting results.
Annual Report
Proxy Voting Results
A special meeting of the fund's shareholders was held on December 13, 2007. The results of votes taken among shareholders on the proposals before them are reported below. Each vote reported represents one dollar of net asset value held on the record date for the meeting.
PROPOSAL 1 |
To amend the Declaration of Trust to reduce the required quorum for shareholder meetings.A |
| # of
Votes | % of
Votes |
Affirmative | 45,014,793,255.82 | 80.372 |
Against | 6,871,112,667.08 | 12.268 |
Abstain | 2,163,456,438.02 | 3.863 |
Broker
Non-Votes | 1,958,633,563.89 | 3.497 |
TOTAL | 56,007,995,924.81 | 100.000 |
PROPOSAL 2 |
To elect the nominees specified below as Trustees.A |
James C. Curvey |
Affirmative | 53,384,952,361.03 | 95.317 |
Withheld | 2,623,043,563.78 | 4.683 |
TOTAL | 56,007,995,924.81 | 100.000 |
Dennis J. Dirks |
Affirmative | 53,595,104,608.67 | 95.692 |
Withheld | 2,412,891,316.14 | 4.308 |
TOTAL | 56,007,995,924.81 | 100.000 |
Albert R. Gamper, Jr. |
Affirmative | 53,570,235,221.69 | 95.647 |
Withheld | 2,437,760,703.12 | 4.353 |
TOTAL | 56,007,995,924.81 | 100.000 |
George H. Heilmeier |
Affirmative | 53,166,350,588.50 | 94.926 |
Withheld | 2,841,645,336.31 | 5.074 |
TOTAL | 56,007,995,924.81 | 100.000 |
Edward C. Johnson 3d |
Affirmative | 53,230,508,654.93 | 95.041 |
Withheld | 2,777,487,269.88 | 4.959 |
TOTAL | 56,007,995,924.81 | 100.000 |
| # of
Votes | % of
Votes |
James H. Keyes |
Affirmative | 53,549,161,456.52 | 95.610 |
Withheld | 2,458,834,468.29 | 4.390 |
TOTAL | 56,007,995,924.81 | 100.000 |
Marie L. Knowles |
Affirmative | 53,543,925,066.86 | 95.601 |
Withheld | 2,464,070,857.95 | 4.399 |
TOTAL | 56,007,995,924.81 | 100.000 |
Ned C. Lautenbach |
Affirmative | 53,547,116,322.50 | 95.606 |
Withheld | 2,460,879,602.31 | 4.394 |
TOTAL | 56,007,995,924.81 | 100.000 |
Cornelia M. Small |
Affirmative | 53,564,793,514.25 | 95.638 |
Withheld | 2,443,202,410.56 | 4.362 |
TOTAL | 56,007,995,924.81 | 100.000 |
William S. Stavropoulos |
Affirmative | 53,426,544,502.76 | 95.391 |
Withheld | 2,581,451,422.05 | 4.609 |
TOTAL | 56,007,995,924.81 | 100.000 |
Kenneth L. Wolfe |
Affirmative | 53,229,881,790.63 | 95.040 |
Withheld | 2,778,114,134.18 | 4.960 |
TOTAL | 56,007,995,924.81 | 100.000 |
A Denotes trust-wide proposal and voting results.
Annual Report
Board Approval of Investment Advisory Contracts and Management Fees
Fidelity International Small Cap Opportunities Fund
Each year, typically in July, the Board of Trustees, including the Independent Trustees (together, the Board), votes on the renewal of the management contract and sub-advisory agreements (together, the Advisory Contracts) for the fund. The Board, assisted by the advice of fund counsel and Independent Trustees' counsel, requests and considers a broad range of information throughout the year.
The Board meets regularly and, acting directly and through its separate committees, requests and receives information concerning, and considers at each of its meetings factors that are relevant to, its annual consideration of the renewal of the fund's Advisory Contracts, including the services and support provided to the fund and its shareholders. At the time of the renewal, the Board had 12 standing committees, each composed of Independent Trustees with varying backgrounds, to which the Board has assigned specific subject matter responsibilities in order to enhance effective decision-making by the Board. Each committee has a written charter outlining the structure and purposes of the committee. The Board also meets as needed to consider matters specifically related to the Board's annual consideration of the renewal of Advisory Contracts.
At its July 2008 meeting, the Board of Trustees, including the Independent Trustees, unanimously determined to renew the fund's Advisory Contracts. In reaching its determination, the Board considered all factors it believed relevant, including (i) the nature, extent, and quality of the services to be provided to the fund and its shareholders (including the investment performance of the fund); (ii) the competitiveness of the fund's management fee and total expenses; (iii) the total costs of the services to be provided by and the profits to be realized by Fidelity from its relationship with the fund; (iv) the extent to which economies of scale would be realized as the fund grows; and (v) whether fee levels reflect these economies of scale, if any, for the benefit of fund shareholders. The Board also approved agreements with foreign sub-advisers Fidelity Management & Research (Japan) Inc. and Fidelity Management & Research (Hong Kong) Limited, as well as amendments to the fund's agreement with Fidelity Management & Research (U.K.) Inc.
In considering whether to renew the Advisory Contracts for the fund, the Board ultimately reached a determination, with the assistance of fund counsel and Independent Trustees' counsel and through the exercise of its business judgment, that the renewal of the Advisory Contracts and the compensation to be received by Fidelity under the management contract is consistent with Fidelity's fiduciary duty under applicable law. The Board's decision to renew the Advisory Contracts was not based on any single factor noted above, but rather was based on a comprehensive consideration of all the information provided to the Board at its meetings throughout the year. The Board, in reaching its determination to renew the Advisory Contracts, is aware that shareholders in the fund have a broad range of investment choices available to them, including a wide choice among mutual funds offered by competitors to Fidelity, and that the fund's shareholders, with the opportunity to review and weigh the disclosure provided by the fund in its prospectus and other public disclosures, have chosen to invest in this fund, managed by Fidelity.
Annual Report
Nature, Extent, and Quality of Services Provided. The Board considered staffing within the investment adviser, FMR, and the sub-advisers (together, the Investment Advisers), including the backgrounds of the fund's investment personnel and the fund's investment objective and discipline. The Independent Trustees also had discussions with senior management of Fidelity's investment operations and investment groups. The Board considered the structure of the portfolio manager compensation program and whether this structure provides appropriate incentives.
Resources Dedicated to Investment Management and Support Services. The Board reviewed the size, education, and experience of the Investment Advisers' investment staff, their use of technology, and the Investment Advisers' approach to recruiting, training, and retaining portfolio managers and other research, advisory, and management personnel. The Board noted that Fidelity's analysts have access to a variety of technological tools that enable them to perform both fundamental and quantitative analysis and to specialize in various disciplines. The Board considered Fidelity's extensive global research capabilities that enable the Investment Advisers to aggregate data from various sources in an effort to produce positive investment results. The Board also considered that Fidelity's portfolio managers and analysts have access to daily portfolio attribution that allows for monitoring of a fund's portfolio, as well as an electronic communication system that provides immediate real-time access to research concerning issuers and credit enhancers.
Shareholder and Administrative Services. The Board considered (i) the nature, extent, quality, and cost of advisory, administrative, distribution, and shareholder services performed by the Investment Advisers and their affiliates under the Advisory Contracts and under separate agreements covering transfer agency, pricing and bookkeeping, and securities lending services for the fund; (ii) the nature and extent of the Investment Advisers' supervision of third party service providers, principally custodians and subcustodians; and (iii) the resources devoted to, and the record of compliance with, the fund's compliance policies and procedures. The Board also reviewed the allocation of fund brokerage, including allocations to brokers affiliated with the Investment Advisers, the use of brokerage commissions to pay fund expenses, and the use of "soft" commission dollars to pay for research services. The Board further considered that Fidelity voluntarily pays for market data out of its own resources.
The Board noted that the growth of fund assets across the complex allows Fidelity to reinvest in the development of services designed to enhance the value or convenience of the Fidelity funds as investment vehicles. These services include 24-hour access to account information and market information through phone representatives and over the Internet, and investor education materials and asset allocation tools.
Annual Report
Board Approval of Investment Advisory Contracts and
Management Fees - continued
Investment in a Large Fund Family. The Board considered the benefits to shareholders of investing in a Fidelity fund, including the benefits of investing in a fund that is part of a large family of funds offering a variety of investment disciplines and providing for a large variety of mutual fund investor services. For example, fund shareholders are offered the privilege of exchanging shares of the fund for shares of other Fidelity funds, as set forth in the fund's prospectus, without paying a sales charge. The Board noted that Fidelity has taken a number of actions over the previous year that benefited particular funds, including (i) dedicating additional resources to investment research and to restructure the investment research teams; (ii) contractually agreeing to reduce the management fees on Fidelity's Institutional Money Market Funds and launching Class IV and Institutional Class of certain of these funds; (iii) reducing the transfer agent fees for the Fidelity Select Portfolios and Investor Class of the VIP funds; and (iv) launching Class K of 29 equity funds as a lower-fee class available to certain employer-sponsored retirement plans.
Investment Performance. The Board considered whether the fund has operated within its investment objective, as well as its record of compliance with its investment restrictions. It also reviewed the fund's absolute investment performance for each class, as well as the fund's relative investment performance for each class measured against (i) a broad-based securities market index, and (ii) a peer group of mutual funds deemed appropriate by the Board. Because the fund had been in existence less than three calendar years, the following chart considered by the Board shows, for the one-year period ended December 31, 2007, the total returns of Institutional Class (Class I) and Class B of the fund, the total return of a broad-based securities market index ("benchmark"), and a range of total returns of a peer group of mutual funds identified by Lipper Inc. as having an investment objective similar to that of the fund. The returns of Institutional Class (Class I) and Class B show the performance of the highest and lowest performing classes, respectively. The box within the chart shows the 25th percentile return (bottom of box) and the 75th percentile return (top of box) of the peer group. Returns shown above the box are in the first quartile and returns shown below the box are in the fourth quartile. The percentage beaten numbers noted below the chart correspond to the percentile box and represent the percentage of funds in the peer group whose performance was equal to or lower than that of the class indicated.
Annual Report
Fidelity International Small Cap Opportunities Fund

The Board reviewed the fund's relative investment performance against its peer group and stated that the performance of Institutional Class (Class I) of the fund was in the third quartile for the period shown. The Board also stated that the investment performance of Institutional Class (Class I) of the fund compared favorably to its benchmark for the period shown. The Board considered that the variations in performance among the fund's classes reflect the variations in class expenses, which result in lower performance for higher expense classes. The Board stated that it is difficult to evaluate in any comprehensive fashion the performance of the fund, in light of its relatively recent commencement of operations.
The Board also considered that the fund's management fee is subject to upward or downward adjustment depending upon whether, and to what extent, the fund's investment performance for the performance period exceeds, or is exceeded by, the record (over the same period) of a Board-approved performance adjustment index. The Board realizes that the performance adjustment provides FMR with a strong economic incentive to seek to achieve superior performance for the fund's shareholders and helps to more closely align the interests of FMR and the fund's shareholders.
The Board considered that FMR has taken steps to refocus and strengthen equity research, equity portfolio management, and compliance.
Based on its review, and giving particular weight to the nature and quality of the resources dedicated by the Investment Advisers to maintain and improve relative performance, the Board concluded that the nature, extent, and quality of the services provided to the fund will benefit the fund's shareholders, particularly in light of the Board's view that the fund's shareholders benefit from investing in a fund that is part of a large family of funds offering a variety of investment disciplines and services.
Annual Report
Board Approval of Investment Advisory Contracts and
Management Fees - continued
Competitiveness of Management Fee and Total Fund Expenses. The Board considered the fund's management fee and total expenses compared to "mapped groups" of competitive funds and classes. Fidelity creates "mapped groups" by combining similar Lipper investment objective categories that have comparable management fee characteristics. Combining Lipper investment objective categories aids the Board's management fee and total expense comparisons by broadening the competitive group used for comparison and by reducing the number of universes to which various Fidelity funds are compared. The Board also considered supplemental information about how the fund's management fee and total expenses ranked relative to groups based on Lipper classifications, which take into account a fund's market capitalization and style.
The Board considered two proprietary management fee comparisons for the 12-month (or shorter) periods shown in the chart below. The group of Lipper funds used by the Board for management fee comparisons is referred to below as the "Total Mapped Group" and, for the reasons explained above, is broader than the Lipper peer group used by the Board for performance comparisons. The Total Mapped Group comparison focuses on a fund's standing relative to the total universe of comparable funds available to investors, in terms of gross management fees before expense reimbursements or caps, and without giving effect to the fund's performance adjustment. "TMG %" represents the percentage of funds in the Total Mapped Group that had management fees that were lower than the fund's. For example, a TMG % of 21% means that 79% of the funds in the Total Mapped Group had higher management fees than the fund. The "Asset-Size Peer Group" (ASPG) comparison focuses on a fund's standing relative to non-Fidelity funds similar in size to the fund within the Total Mapped Group. The ASPG represents at least 15% of the funds in the Total Mapped Group with comparable asset size and management fee characteristics, subject to a minimum of 50 funds (or all funds in the Total Mapped Group if fewer than 50). Additional information, such as the ASPG quartile in which the fund's management fee ranked and the impact of the fund's performance adjustment, is also included in the chart and considered by the Board.
Annual Report
Fidelity International Small Cap Opportunities Fund
The Board noted that the fund's management fee ranked below the median of its Total Mapped Group and below the median of its ASPG for 2007. The Board also noted the effect of the fund's positive performance adjustment on the fund's management fee ranking. The Board noted that the performance adjustment for each year represents calculations for performance periods that differ from the period shown in the performance chart above.
Based on its review, the Board concluded that the fund's management fee was fair and reasonable in light of the services that the fund receives and the other factors considered.
In its review of each class's total expenses, the Board considered the fund's management fee as well as other fund or class expenses, as applicable, such as transfer agent fees, pricing and bookkeeping fees, fund-paid 12b-1 fees, and custodial, legal, and audit fees. The Board also noted the effects of any waivers and reimbursements on fees and expenses, as well as the impact of the fund's performance adjustment. As part of its review, the Board also considered current and historical total expenses of each class of the fund compared to competitive fund median expenses. Each class of the fund is compared to those funds and classes in the Total Mapped Group (used by the Board for management fee comparisons) that have a similar sales load structure.
The Board noted that the total expenses of each of Class A, Class B, Class C, Institutional Class, and Fidelity International Small Cap Opportunities (retail class) ranked below its competitive median for 2007, and the total expenses of Class T ranked above its competitive median for 2007. The Board considered that the total expenses of Class T were above the median primarily because its 12b-1 fee is higher than the typical front-end load class. The Board noted that the fund offers multiple classes, each of which has a different sales load and 12b-1 fee structure, and that the multiple structures are intended to offer a range of pricing options for the intermediary market. The Board also noted that the total expenses of the classes vary primarily by the level of their 12b-1 fees, although differences in transfer agent fees may also cause expenses to vary from class to class.
Annual Report
Board Approval of Investment Advisory Contracts and
Management Fees - continued
In its review of total expenses, the Board also considered Fidelity fee structures and other information on clients that FMR and its affiliates service in other competitive markets, such as other mutual funds advised or subadvised by FMR or its affiliates, pension plan clients, and other institutional clients.
Based on its review, the Board concluded that the total expenses of each class of the fund were reasonable, although in one case above the median of the universe presented for comparison, in light of the services that the fund and its shareholders receive and the other factors considered.
Costs of the Services and Profitability. The Board considered the revenues earned and the expenses incurred by Fidelity in conducting the business of developing, marketing, distributing, managing, administering and servicing the fund and its shareholders. The Board also considered the level of Fidelity's profits in respect of all the Fidelity funds.
On an annual basis, FMR presents to the Board Fidelity's profitability for the fund. Fidelity calculates the profitability for each fund, as well as aggregate profitability for groups of Fidelity funds and all Fidelity funds, using a series of detailed revenue and cost allocation methodologies which originate with the audited books and records of Fidelity. The Audit Committee of the Board reviews any significant changes from the prior year's methodologies.
PricewaterhouseCoopers LLP (PwC), independent registered public accounting firm and auditor to Fidelity and certain Fidelity funds, has been engaged annually by the Board as part of the Board's assessment of the results of Fidelity's profitability analysis. PwC's engagement includes the review and assessment of Fidelity's methodologies used in determining the revenues and expenses attributable to Fidelity's mutual fund business, and completion of agreed-upon procedures surrounding the mathematical accuracy of fund profitability and its conformity to allocation methodologies. After considering PwC's reports issued under the engagement and information provided by Fidelity, the Board believes that while other allocation methods may also be reasonable, Fidelity's profitability methodologies are reasonable in all material respects.
The Board has also reviewed Fidelity's non-fund businesses and any fall-out benefits related to the mutual fund business as well as cases where Fidelity's affiliates may benefit from or be related to the fund's business.
Annual Report
The Board considered the costs of the services provided by and the profits realized by Fidelity in connection with the operation of the fund and determined that the amount of profit is a fair entrepreneurial profit for the management of the fund.
Economies of Scale. The Board considered whether there have been economies of scale in respect of the management of the Fidelity funds, whether the Fidelity funds (including the fund) have appropriately benefited from any such economies of scale, and whether there is potential for realization of any further economies of scale. The Board considered the extent to which the fund will benefit from economies of scale through increased services to the fund, through waivers or reimbursements, or through fee or expense reductions.
The Board recognized that the fund's management contract incorporates a "group fee" structure, which provides for lower group fee rates as total fund assets under FMR's management increase, and for higher group fee rates as total fund assets under FMR's management decrease. FMR determines the group fee rates based on a tiered asset "breakpoint" schedule. The Board considered that the group fee is designed to deliver the benefits of economies of scale to fund shareholders when total fund assets increase, even if assets of any particular fund are unchanged or have declined, because some portion of Fidelity's costs are attributable to services provided to all Fidelity funds, and all funds benefit if those costs can be allocated among more assets. The Board concluded that, given the group fee structure, fund shareholders will achieve a certain level of economies of scale as assets under FMR's management increase at the fund complex level, regardless of whether Fidelity achieves any such economies of scale.
The Board further concluded that any potential economies of scale are being shared between fund shareholders and Fidelity in an appropriate manner.
Additional Information Requested by the Board. In order to develop fully the factual basis for consideration of the Fidelity funds' Advisory Contracts, the Board requested and received additional information on certain topics, including (i) fund performance trends and actions to be taken by FMR to improve certain funds' overall performance; (ii) portfolio manager changes that have occurred during the past year; (iii) Fidelity's fund profitability methodology, the profitability of certain fund service providers, and profitability trends for certain funds; (iv) Fidelity's compensation structure for portfolio managers and key personnel, including its effects on fund profitability and the extent to which portfolio manager compensation is linked to fund performance; (v) Fidelity's fee structures and rationale for recommending different fees among categories of funds; and (vi) Fidelity's rationale for recommending which funds should have a performance adjustment component as part of their management fees.
Based on its evaluation of all of the conclusions noted above, and after considering all material factors, the Board ultimately concluded that the advisory fee structures are fair and reasonable, and that the fund's Advisory Contracts should be renewed.
Annual Report
Managing Your Investments
Fidelity offers several ways to conveniently manage your personal investments via your telephone or PC. You can access your account information, conduct trades and research your investments 24 hours a day.
By Phone
Fidelity Automated Service Telephone provides a single toll-free number to access account balances, positions, quotes and trading. It's easy to navigate the service, and on your first call, the system will help you create a personal identification number (PIN) for security.
(phone_graphic)
Fidelity Automated
Service Telephone (FAST®)
1-800-544-5555
Press
For mutual fund and brokerage trading.
For quotes.*
For account balances and holdings.
To review orders and mutual
fund activity.
To change your PIN.
To speak to a Fidelity representative.
By PC
Fidelity's web site on the Internet provides a wide range of information, including daily financial news, fund performance, interactive planning tools and news about Fidelity products and services.
(computer_graphic)
Fidelity's Web Site
www.fidelity.com
* When you call the quotes line, please remember that a fund's yield and return will vary and, except for money market funds, share price will also vary. This means that you may have a gain or loss when you sell your shares. There is no assurance that money market funds will be able to maintain a stable $1 share price; an investment in a money market fund is not insured or guaranteed by the U.S. government. Total returns are historical and include changes in share price, reinvestment of dividends and capital gains, and the effects of any sales charges.
Annual Report
Investment Adviser
Fidelity Management & Research Company
Boston, MA
Investment Sub-Advisers
FMR Co., Inc.
Fidelity Research & Analysis Company
Fidelity Management & Research
(Hong Kong) Limited
Fidelity Management & Research
(Japan) Inc.
Fidelity Management & Research
(U.K.) Inc.
Fidelity Investments Japan Limited
FIL Investment Advisors
FIL Investment Advisors (U.K.) Ltd.
General Distributor
Fidelity Distributors Corporation
Boston, MA
Transfer and Service Agents
Fidelity Investments Institutional
Operations Company, Inc.
Boston, MA
Fidelity Service Company, Inc.
Boston, MA
Custodian
The Northern Trust Company
Chicago, IL
The Fidelity Telephone Connection
Mutual Fund 24-Hour Service
Exchanges/Redemptions
and Account Assistance 1-800-544-6666
Product Information 1-800-544-6666
Retirement Accounts 1-800-544-4774
(8 a.m. - 9 p.m.)
TDD Service 1-800-544-0118
for the deaf and hearing impaired
(9 a.m. - 9 p.m. Eastern time)
Fidelity Automated Service
Telephone (FAST®) 1-800-544-5555
Automated line for quickest service
ILS-UANN-1208
1.815061.104
(Fidelity Investment logo)(registered trademark)
Fidelity Advisor
International Small Cap Opportunities
Fund - Class A, Class T, Class B
and Class C
Annual Report
October 31, 2008
Class A, Class T, Class B
and Class C are classes of
Fidelity® International
Small Cap Opportunities Fund
(2_fidelity_logos) (Registered_Trademark)
Contents
Chairman's Message | <Click Here> | Ned Johnson's message to shareholders. |
Performance | <Click Here> | How the fund has done over time. |
Managements' Discussion | <Click Here> | The managers' review of fund performance, strategy and outlook. |
Shareholder Expense Example | <Click Here> | An example of shareholder expenses. |
Investment Changes | <Click Here> | A summary of major shifts in the fund's investments over the past six months. |
Investments | <Click Here> | A complete list of the fund's investments with their market values. |
Financial Statements | <Click Here> | Statements of assets and liabilities, operations, and changes in net assets, as well as financial highlights. |
Notes | <Click Here> | Notes to the financial statements. |
Report of Independent Registered Public Accounting Firm | <Click Here> | |
Trustees and Officers | <Click Here> | |
Distributions | <Click Here> | |
Proxy Voting Results | <Click Here> | |
Board Approval of Investment Advisory Contracts and Management Fees | <Click Here> | |
To view a fund's proxy voting guidelines and proxy voting record for the 12-month period ended June 30, visit http://www.fidelity.com (search for "proxy voting guidelines") or visit the Securities and Exchange Commission's (SEC) web site at http://www.sec.gov. You may also call 1-877-208-0098 to request a free copy of the proxy voting guidelines.
Standard & Poor's, S&P and S&P 500 are registered service marks of The McGraw-Hill Companies, Inc. and have been licensed for use by Fidelity Distributors Corporation.
Other third party marks appearing herein are the property of their respective owners.
All other marks appearing herein are registered or unregistered trademarks or service marks of FMR LLC or an affiliated company.
Annual Report
This report and the financial statements contained herein are submitted for the general information of the shareholders of the fund. This report is not authorized for distribution to prospective investors in the fund unless preceded or accompanied by an effective prospectus.
A fund files its complete schedule of portfolio holdings with the SEC for the first and third quarters of each fiscal year on Form N-Q. Forms N-Q are available on the SEC's web site at http://www.sec.gov. A fund's Forms N-Q may be reviewed and copied at the SEC's Public Reference Room in Washington, DC. Information regarding the operation of the SEC's Public Reference Room may be obtained by calling 1-800-SEC-0330. For a complete list of a fund's portfolio holdings, view the most recent holdings listing, semiannual report, or annual report on Fidelity's web site at http://www.fidelity.com or http://www.advisor.fidelity.com, as applicable.
NOT FDIC INSURED · MAY LOSE VALUE · NO BANK GUARANTEE
Neither the fund nor Fidelity Distributors Corporation is a bank.
Annual Report
(photo_of_Edward_C_Johnson_3d)
Dear Shareholder:
Turmoil has been the watchword for the world's securities markets in 2008, with domestic and international stocks down sharply amid the global credit squeeze. A flight to quality boosted returns for U.S. Treasuries, one of the few asset classes with positive results heading into the latter stages of the year. Financial markets are always unpredictable, but there are a number of time-tested principles that can put the historical odds in your favor.
One of the basic tenets is to invest for the long term. Over time, riding out the markets' inevitable ups and downs has proven much more effective than selling into panic or chasing the hottest trend. Even missing only a few of the markets' best days can significantly diminish investor returns. Patience also affords the benefits of compounding - of earning interest on additional income or reinvested dividends and capital gains. There are tax advantages and cost benefits to consider as well. The more you sell, the more taxes you pay, and the more you trade, the higher the costs. While staying the course doesn't eliminate risk, it can considerably lessen the effect of short-term declines.
You can further manage your investing risk through diversification. And today, more than ever, geographic diversification should be taken into account. Studies indicate that asset allocation is the single most important determinant of a portfolio's long-term success. The right mix of stocks, bonds and cash - aligned to your particular risk tolerance and investment objective - is very important. Age-appropriate rebalancing is also an essential aspect of asset allocation. For younger investors, an emphasis on equities - which historically have been the best-performing asset class over time - is encouraged. As investors near their specific goal, such as retirement or sending a child to college, consideration may be given to replacing volatile assets (e.g. common stocks) with more-stable fixed investments (bonds or savings plans).
A third investment principle - investing regularly - can help lower the average cost of your purchases. Investing a certain amount of money each month or quarter helps ensure you won't pay for all your shares at market highs. This strategy - known as dollar cost averaging - also reduces unconstructive "emotion" from investing, helping shareholders avoid selling weak performers just prior to an upswing, or chasing a hot performer just before a correction.
We invite you to contact us via the Internet, through our Investor Centers or over the phone. It is our privilege to provide you the information you need to make the investments that are right for you.
Sincerely,
/s/Edward C. Johnson 3d
Edward C. Johnson 3d
Annual Report
Average annual total return reflects the change in the value of an investment, assuming reinvestment of the class' dividend income and capital gains (the profits earned upon the sale of securities that have grown in value, if any) and assuming a constant rate of performance each year. The $10,000 table and the fund's returns do not reflect the deduction of taxes that a shareholder would pay on fund distributions or the redemption of fund shares. During periods of reimbursement by Fidelity, a fund's total return will be greater than it would be had the reimbursement not occurred. How a fund did yesterday is no guarantee of how it will do tomorrow.
Average Annual Total Returns
Periods ended October 31, 2008 | Past 1
year | Life of
fund A |
Class A (incl. 5.75% sales charge) | -65.11% | -11.92% |
Class T (incl. 3.50% sales charge) | -64.37% | -11.53% |
Class B (incl. contingent deferred sales charge) B | -64.96% | -11.78% |
Class C (incl. contingent deferred sales charge) C | -63.65% | -11.06% |
A From August 2, 2005.
B Class B shares' contingent deferred sales charges included in the past one year and life of fund total return figures are 5% and 3%, respectively.
C Class C shares' contingent deferred sales charge included in the past one year and life of fund total return figures are 1% and 0%, respectively.
Annual Report
$10,000 Over Life of Fund
Let's say hypothetically that $10,000 was invested in Fidelity Advisor International Small Cap Opportunities Fund - Class A on August 2, 2005, when the fund started, and the current 5.75% sales charge was paid. The chart shows how the value of your investment would have changed, and also shows how the MSCI® Europe, Australasia, Far East (MSCI EAFE® ) Small Cap Index performed over the same period.
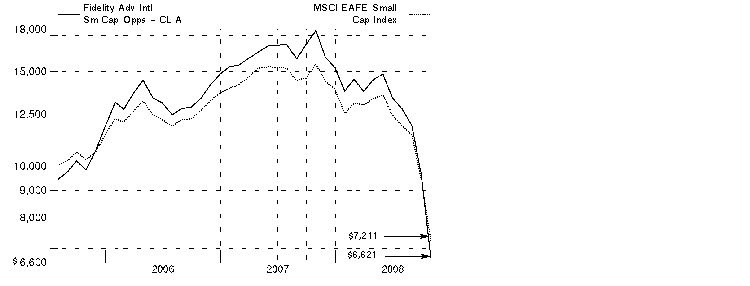
In prior years, the performance from year to year was represented by the performance of Class T. Going forward, the fund's performance will be represented by Class A for consistency with other fund materials.
Annual Report
Comments from Andrew Sassine, Portfolio Manager of Fidelity Advisor International Small Cap Opportunities Fund during the period covered in this report
In a dramatic reversal of what had been a multiyear global growth story, international stocks fell long and hard during the 12 months ending October 31, 2008, especially so during the latter stages of the period and mostly as a result of fallout from the financial crisis that emanated from the United States. The viral spread of this financial contagion - which began in the U.S. subprime mortgage market, then seized up the credit markets, hobbled major financial institutions and eventually slowed economic growth worldwide - left virtually no corner of the globe untouched. Developed international equity markets - as gauged by the MSCI® Europe, Australasia, Far East (EAFE®) Index, which monitors established markets outside the U.S. and Canada - fell 46.54%, while the Standard & Poor's 500SM Index, a measure of U.S. stocks, dropped 36.10%. Among countries constituting at least 1% of the EAFE index, Switzerland had the "least worst" showing, falling roughly 32%, followed by Japan, where stocks slid by around 37%. Meanwhile, the weakest overall performance came from Belgium, where stocks slipped by nearly 70%. In the United Kingdom, the largest component of the index, equities were down almost 48%. Emerging markets were the weakest performers among the global economies, declining 56.22% as measured by the MSCI Emerging Markets Index.
For the year, the fund's Class A, Class T, Class B and Class C shares returned -62.98%, -63.08%, -63.32% and -63.32%, respectively (excluding sales charges), compared with -53.46% for the MSCI EAFE Small Cap Index. Stock selection in materials and consumer staples detracted from relative performance, as did weak results in financials and information technology. However, our holdings in the consumer discretionary sector aided the fund's performance. Security selection in Japan and Norway detracted, while underweightings in Greece, Denmark, Spain and Singapore helped. A cash position also aided returns. Babcock & Brown, an Australian global alternative asset manager, was hurt by the credit crisis. In materials, Papua New Guinea-based Lihir Gold also detracted from performance. Marine Harvest, a Norwegian salmon farmer, fell, as did Renovo Group, a U.K.-based biotechnology firm. Netherlands-based Gemalto, a secure personal devices manufacturer, buoyed performance, so did Chiquita Brands, a U.S. food products distributor. Rakuten, a Japanese Internet services company, also rose. Many of the stocks I've mentioned were out-of-index holdings.
Note to shareholders: Jed Weiss will become Portfolio Manager on December 4, 2008.
The views expressed above reflect those of the portfolio manager(s) only through the end of the period as stated on the cover of this report and do not necessarily represent the views of Fidelity or any other person in the Fidelity organization. Any such views are subject to change at any time based upon market or other conditions and Fidelity disclaims any responsibility to update such views. These views may not be relied on as investment advice and, because investment decisions for a Fidelity fund are based on numerous factors, may not be relied on as an indication of trading intent on behalf of any Fidelity fund.
Annual Report
Shareholder Expense Example
As a shareholder of the Fund, you incur two types of costs: (1) transaction costs, including sales charges (loads) on purchase payments or redemption proceeds, redemption fees, and (2) ongoing costs, including management fees, distribution and/or service (12b-1) fees and other Fund expenses. This Example is intended to help you understand your ongoing costs (in dollars) of investing in the Fund and to compare these costs with the ongoing costs of investing in other mutual funds.
The Example is based on an investment of $1,000 invested at the beginning of the period and held for the entire period (May 1, 2008 to October 31, 2008).
Actual Expenses
The first line of the accompanying table for each class of the Fund provides information about actual account values and actual expenses. You may use the information in this line, together with the amount you invested, to estimate the expenses that you paid over the period. Simply divide your account value by $1,000.00 (for example, an $8,600 account value divided by $1,000.00 = 8.6), then multiply the result by the number in the first line for a class of the Fund under the heading entitled "Expenses Paid During Period" to estimate the expenses you paid on your account during this period. A small balance maintenance fee of $12.00 that is charged once a year may apply for certain accounts with a value of less than $2,000. This fee is not included in the table below. If it was, the estimate of expenses you paid during the period would be higher, and your ending account value lower, by this amount. In addition, the Fund, as a shareholder in the underlying Fidelity Central Funds, will indirectly bear its pro rata share of the fees and expenses incurred by the underlying Fidelity Central Funds. These fees and expenses are not included in the Fund's annualized expense ratio used to calculate the expense estimate in the table below.
Hypothetical Example for Comparison Purposes
The second line of the accompanying table for each class of the Fund provides information about hypothetical account values and hypothetical expenses based on a Class' actual expense ratio and an assumed rate of return of 5% per year before expenses, which is not the Class' actual return. The hypothetical account values and expenses may not be used to estimate the actual ending account balance or expenses you paid for the period. You may use this information to compare the ongoing costs of investing in the Fund and other funds. To do so, compare this 5% hypothetical example with the 5% hypothetical examples that appear in the shareholder reports of the other funds. A small balance maintenance fee of $12.00 that is charged once a year may apply for certain accounts with a value of less than $2,000. This fee is not included in the table below. If it was, the estimate of expenses you paid during the period would be higher, and your ending account value lower, by this amount. In addition, the Fund, as a shareholder in the underlying Fidelity Central Funds, will indirectly bear its pro rata share of the fees and expenses incurred by the underlying Fidelity Central Funds. These fees and expenses are not included in the Fund's annualized expense ratio used to calculate the expense estimate in the table below.
Please note that the expenses shown in the table are meant to highlight your ongoing costs only and do not reflect any transaction costs. Therefore, the second line of the table is useful in comparing ongoing costs only, and will not help you determine the relative total costs of owning different funds. In addition, if these transactional costs were included, your costs would have been higher.
Annual Report
|
Annualized Expense Ratio
|
Beginning
Account Value
May 1, 2008
|
Ending
Account Value
October 31, 2008
| Expenses Paid
During Period*
May 1, 2008 to
October 31, 2008 |
Class A | 1.65% | | | |
Actual | | $ 1,000.00 | $ 457.50 | $ 6.05 |
HypotheticalA | | $ 1,000.00 | $ 1,016.84 | $ 8.36 |
Class T | 1.90% | | | |
Actual | | $ 1,000.00 | $ 456.90 | $ 6.96 |
HypotheticalA | | $ 1,000.00 | $ 1,015.58 | $ 9.63 |
Class B | 2.40% | | | |
Actual | | $ 1,000.00 | $ 455.00 | $ 8.78 |
HypotheticalA | | $ 1,000.00 | $ 1,013.07 | $ 12.14 |
Class C | 2.40% | | | |
Actual | | $ 1,000.00 | $ 455.00 | $ 8.78 |
HypotheticalA | | $ 1,000.00 | $ 1,013.07 | $ 12.14 |
International Small Cap Opportunities | 1.44% | | | |
Actual | | $ 1,000.00 | $ 457.70 | $ 5.28 |
HypotheticalA | | $ 1,000.00 | $ 1,017.90 | $ 7.30 |
Institutional Class | 1.40% | | | |
Actual | | $ 1,000.00 | $ 457.30 | $ 5.13 |
HypotheticalA | | $ 1,000.00 | $ 1,018.10 | $ 7.10 |
A 5% return per year before expenses
* Expenses are equal to each Class' annualized expense ratio, multiplied by the average account value over the period, multiplied by 184/366 (to reflect the one-half year period).
Annual Report
Investment Changes (Unaudited)
Geographic Diversification (% of fund's net assets) |
As of October 31, 2008 |
| Japan 15.4% |
| United Kingdom 13.6% |
| China 9.2% |
| Netherlands 7.6% |
| Cayman Islands 7.5% |
| United States of America 7.3% |
| Papua New Guinea 7.3% |
| Australia 6.4% |
| Germany 6.4% |
| Other 19.3% |

Percentages are adjusted for the effect of futures contracts, if applicable. |
|
As of April 30, 2008 |
| Japan 25.1% |
| United Kingdom 8.6% |
| Germany 7.3% |
| Netherlands 6.8% |
| United States of America 6.6% |
| China 6.3% |
| Cayman Islands 5.9% |
| Norway 5.9% |
| Papua New Guinea 5.9% |
| Other 21.6% |
Percentages are adjusted for the effect of futures contracts, if applicable. |
Asset Allocation |
| % of fund's
net assets | % of fund's net assets
6 months ago |
Stocks | 98.9 | 98.6 |
Short-Term Investments and Net Other Assets | 1.1 | 1.4 |
Top Ten Stocks as of October 31, 2008 |
| % of fund's
net assets | % of fund's net assets
6 months ago |
Lihir Gold Ltd. (Papua New Guinea, Metals & Mining) | 7.3 | 5.9 |
Gemalto NV (Netherlands, Computers & Peripherals) | 4.9 | 2.0 |
Himax Technologies, Inc. sponsored ADR (Cayman Islands, Semiconductors & Semiconductor Equipment) | 4.2 | 3.9 |
Chiquita Brands International, Inc. (United States of America, Food Products) | 4.1 | 2.4 |
BB BIOTECH AG (Switzerland, Biotechnology) | 3.5 | 1.5 |
HannStar Display Corp. (Taiwan, Electronic Equipment & Components) | 3.2 | 2.7 |
GEA Group AG (Germany, Machinery) | 3.1 | 2.9 |
Focus Media Holding Ltd. ADR (China, Media) | 2.8 | 1.3 |
EFG International (Switzerland, Capital Markets) | 2.7 | 0.0 |
Autonomy Corp. PLC (United Kingdom, Software) | 2.7 | 1.0 |
| 38.5 | |
Market Sectors as of October 31, 2008 |
| % of fund's
net assets | % of fund's net assets
6 months ago |
Information Technology | 27.5 | 24.0 |
Industrials | 21.5 | 27.8 |
Materials | 11.3 | 11.0 |
Financials | 10.5 | 9.7 |
Consumer Staples | 10.6 | 14.1 |
Consumer Discretionary | 9.5 | 5.8 |
Health Care | 6.5 | 4.2 |
Energy | 1.0 | 2.0 |
Utilities | 0.5 | 0.0 |
Annual Report
Investments October 31, 2008
Showing Percentage of Net Assets
Common Stocks - 98.9% |
| Shares | | Value |
Australia - 6.4% |
Babcock & Brown Ltd. (d) | 2,582,465 | | $ 2,255,477 |
Babcock & Brown Wind Partners | 3,000,000 | | 1,678,673 |
Downer EDI Ltd. | 2,930,464 | | 9,511,882 |
Newcrest Mining Ltd. | 300,000 | | 4,121,771 |
Silex Systems Ltd. (a)(d) | 816,160 | | 2,125,030 |
Sino Gold Mining Ltd. (a) | 1,580,111 | | 3,637,557 |
TOTAL AUSTRALIA | | 23,330,390 |
Austria - 0.6% |
Andritz AG | 79,996 | | 2,278,136 |
Bermuda - 0.8% |
Noble Group Ltd. | 3,841,000 | | 2,796,019 |
Cayman Islands - 7.5% |
CNinsure, Inc. ADR (d) | 409,600 | | 3,579,904 |
Himax Technologies, Inc. sponsored ADR | 8,253,009 | | 15,433,127 |
LDK Solar Co. Ltd. sponsored ADR (a)(d) | 451,300 | | 8,195,608 |
TOTAL CAYMAN ISLANDS | | 27,208,639 |
China - 9.2% |
BYD Co. Ltd. (H Shares) | 3,229,500 | | 5,488,922 |
China TechFaith Wireless Communication Technology Ltd. sponsored ADR (a) | 1,801,341 | | 1,603,193 |
Focus Media Holding Ltd. ADR (a)(d) | 555,800 | | 10,298,974 |
Global Bio-Chem Technology Group Co. Ltd. | 50,703,300 | | 7,066,410 |
Shanda Interactive Entertainment Ltd. sponsored ADR (a)(d) | 325,000 | | 8,986,250 |
TOTAL CHINA | | 33,443,749 |
Finland - 0.4% |
KCI Konecranes Oyj | 84,000 | | 1,427,454 |
France - 1.5% |
Nexans SA | 46,874 | | 2,673,689 |
Ubisoft Entertainment SA (a) | 48,569 | | 2,567,318 |
TOTAL FRANCE | | 5,241,007 |
Germany - 6.4% |
Demag Cranes AG | 50,000 | | 973,188 |
GEA Group AG | 762,600 | | 11,144,590 |
Q-Cells AG (a)(d) | 76,985 | | 3,028,610 |
Symrise AG | 200,000 | | 2,484,241 |
Vossloh AG | 70,000 | | 5,408,318 |
TOTAL GERMANY | | 23,038,947 |
Common Stocks - continued |
| Shares | | Value |
Italy - 2.5% |
Impregilo SpA (a)(d) | 3,465,200 | | $ 9,140,729 |
Japan - 15.4% |
CyberAgent, Inc. (d) | 4,535 | | 4,048,504 |
Elpida Memory, Inc. (a)(d) | 916,000 | | 4,883,226 |
Hikari Tsushin, Inc. | 150,000 | | 2,238,431 |
Ichiyoshi Securities Co. Ltd. (d) | 661,400 | | 5,295,950 |
JAFCO Co. Ltd. | 124,600 | | 3,353,738 |
Pal Co. Ltd. (d) | 31,850 | | 208,861 |
Promise Co. Ltd. (d) | 291,550 | | 5,232,814 |
Rakuten, Inc. (d) | 18,475 | | 9,158,294 |
SBI Holdings, Inc. | 52,751 | | 6,329,841 |
Sugi Holdings Co. Ltd. (d) | 300,200 | | 7,219,003 |
Sumco Corp. | 599,860 | | 6,495,569 |
Trend Micro, Inc. | 60,000 | | 1,467,708 |
TOTAL JAPAN | | 55,931,939 |
Netherlands - 7.6% |
AMG Advanced Metallurgical Group NV (a)(d) | 265,578 | | 4,298,941 |
Gemalto NV (a) | 632,600 | | 17,723,725 |
Nutreco Holding NV | 24,658 | | 786,186 |
QIAGEN NV (a) | 332,200 | | 4,737,172 |
TOTAL NETHERLANDS | | 27,546,024 |
Norway - 3.7% |
Marine Harvest ASA (a)(d) | 35,659,000 | | 5,759,837 |
Petroleum Geo-Services ASA (a) | 495,500 | | 2,467,297 |
Pronova BioPharma ASA | 1,000,000 | | 2,597,902 |
Renewable Energy Corp. AS (a)(d) | 277,700 | | 2,620,054 |
TOTAL NORWAY | | 13,445,090 |
Papua New Guinea - 7.3% |
Lihir Gold Ltd. (a) | 14,300,867 | | 17,834,905 |
Lihir Gold Ltd. sponsored ADR (a)(d) | 662,200 | | 8,462,916 |
TOTAL PAPUA NEW GUINEA | | 26,297,821 |
Spain - 0.4% |
Prosegur Comp Securidad SA (Reg.) | 50,000 | | 1,420,475 |
Switzerland - 6.2% |
BB BIOTECH AG (d) | 196,970 | | 12,489,540 |
EFG International | 457,120 | | 9,838,583 |
TOTAL SWITZERLAND | | 22,328,123 |
Common Stocks - continued |
| Shares | | Value |
Taiwan - 3.2% |
HannStar Display Corp. | 63,362,704 | | $ 11,525,731 |
United Kingdom - 13.6% |
ARM Holdings PLC sponsored ADR (d) | 1,848,700 | | 8,725,864 |
Autonomy Corp. PLC (a) | 616,700 | | 9,776,980 |
BlueBay Asset Management (d) | 808,100 | | 2,624,170 |
easyJet PLC (a) | 1,800,000 | | 8,978,340 |
Informa PLC | 1,221,200 | | 4,136,877 |
Invensys PLC (a) | 3,190,900 | | 8,000,531 |
Max Petroleum PLC (a) | 4,500,000 | | 972,624 |
Premier Foods PLC | 5,899,300 | | 2,615,460 |
Renovo Group PLC (a) | 8,702,203 | | 3,553,008 |
TOTAL UNITED KINGDOM | | 49,383,854 |
United States of America - 6.2% |
AGCO Corp. (a) | 92,700 | | 2,921,904 |
Chiquita Brands International, Inc. (a)(d) | 1,087,400 | | 14,843,010 |
Virgin Media, Inc. (d) | 800,000 | | 4,608,000 |
TOTAL UNITED STATES OF AMERICA | | 22,372,914 |
TOTAL COMMON STOCKS (Cost $669,718,098) | 358,157,041 |
Money Market Funds - 22.1% |
| | | |
Fidelity Cash Central Fund, 1.81% (b) | 4,789,854 | | 4,789,854 |
Fidelity Securities Lending Cash Central Fund, 2.67% (b)(c) | 75,262,022 | | 75,262,022 |
TOTAL MONEY MARKET FUNDS (Cost $80,051,876) | 80,051,876 |
TOTAL INVESTMENT PORTFOLIO - 121.0% (Cost $749,769,974) | | 438,208,917 |
NET OTHER ASSETS - (21.0)% | | (76,011,757) |
NET ASSETS - 100% | $ 362,197,160 |
Legend |
(a) Non-income producing |
(b) Affiliated fund that is available only to investment companies and other accounts managed by Fidelity Investments. The rate quoted is the annualized seven-day yield of the fund at period end. A complete unaudited listing of the fund's holdings as of its most recent quarter end is available upon request. |
(c) Investment made with cash collateral received from securities on loan. |
(d) Security or a portion of the security is on loan at period end. |
Affiliated Central Funds |
Information regarding fiscal year to date income earned by the Fund from investments in Fidelity Central Funds is as follows: |
Fund | Income earned |
Fidelity Cash Central Fund | $ 465,321 |
Fidelity Securities Lending Cash Central Fund | 3,820,634 |
Total | $ 4,285,955 |
Other Affiliated Issuers |
An affiliated company is a company in which the fund has ownership of at least 5% of the voting securities. Fiscal year to date transactions with companies which are or were affiliates are as follows: |
Affiliate | Value,
beginning of
period | Purchases | Sales
Proceeds | Dividend Income | Value,
end of
period |
First Tractor Co. Ltd. (H Shares) | $ 11,999,397 | $ - | $ 5,122,915 | $ 68,411 | $ - |
Income Tax Information |
At October 31, 2008, the fund had a capital loss carryforward of approximately $146,419,794 all of which will expire on October 31, 2016. |
See accompanying notes which are an integral part of the financial statements.
Annual Report
Statement of Assets and Liabilities
| October 31, 2008 |
| | |
Assets | | |
Investment in securities, at value (including securities loaned of $70,265,441) - See accompanying schedule: Unaffiliated issuers (cost $669,718,098) | $ 358,157,041 | |
Fidelity Central Funds (cost $80,051,876) | 80,051,876 | |
Total Investments (cost $749,769,974) | | $ 438,208,917 |
Foreign currency held at value (cost $160) | | 152 |
Receivable for investments sold | | 1,858,770 |
Receivable for fund shares sold | | 587,971 |
Dividends receivable | | 485,964 |
Distributions receivable from Fidelity Central Funds | | 188,423 |
Receivable from investment adviser for expense reductions | | 15,082 |
Other receivables | | 72,137 |
Total assets | | 441,417,416 |
| | |
Liabilities | | |
Payable for investments purchased | $ 2,718,402 | |
Payable for fund shares redeemed | 702,790 | |
Accrued management fee | 249,739 | |
Distribution fees payable | 21,117 | |
Other affiliated payables | 174,594 | |
Other payables and accrued expenses | 91,592 | |
Collateral on securities loaned, at value | 75,262,022 | |
Total liabilities | | 79,220,256 |
| | |
Net Assets | | $ 362,197,160 |
Net Assets consist of: | | |
Paid in capital | | $ 834,317,445 |
Accumulated undistributed net realized gain (loss) on investments and foreign currency transactions | | (160,554,996) |
Net unrealized appreciation (depreciation) on investments and assets and liabilities in foreign currencies | | (311,565,289) |
Net Assets | | $ 362,197,160 |
See accompanying notes which are an integral part of the financial statements.
Annual Report
Statement of Assets and Liabilities - continued
| October 31, 2008 |
| | |
Calculation of Maximum Offering Price
Class A:
Net Asset Value and redemption price per share ($17,905,406 ÷ 2,871,641 shares) | | $ 6.24 |
| | |
Maximum offering price per share (100/94.25 of $6.24) | | $ 6.62 |
Class T:
Net Asset Value and redemption price per share ($11,614,253 ÷ 1,874,345 shares) | | $ 6.20 |
| | |
Maximum offering price per share (100/96.50 of $6.20) | | $ 6.42 |
Class B:
Net Asset Value and offering price per share ($2,687,045 ÷ 438,825 shares)A | | $ 6.12 |
| | |
Class C:
Net Asset Value and offering price per share ($9,496,686 ÷ 1,553,173 shares)A | | $ 6.11 |
| | |
| | |
International Small Cap Opportunities:
Net Asset Value, offering price and redemption price per share ($312,376,291 ÷ 49,754,757 shares) | | $ 6.28 |
| | |
Institutional Class:
Net Asset Value, offering price and redemption price per share ($8,117,479 ÷ 1,294,002 shares) | | $ 6.27 |
A Redemption price per share is equal to net asset value less any applicable contingent deferred sales charge.
See accompanying notes which are an integral part of the financial statements.
Annual Report
Financial Statements - continued
Statement of Operations
| Year ended October 31, 2008 |
| | |
Investment Income | | |
Dividends (including $68,411 earned from other affiliated issuers) | | $ 14,002,599 |
Interest | | 2,082 |
Income from Fidelity Central Funds (including $3,820,634 from security lending) | | 4,285,955 |
| | 18,290,636 |
Less foreign taxes withheld | | (1,290,068) |
Total income | | 17,000,568 |
| | |
Expenses | | |
Management fee
Basic fee | $ 8,348,490 | |
Performance adjustment | 2,000,573 | |
Transfer agent fees | 2,467,216 | |
Distribution fees | 580,404 | |
Accounting and security lending fees | 491,904 | |
Custodian fees and expenses | 216,963 | |
Independent trustees' compensation | 4,564 | |
Registration fees | 94,266 | |
Audit | 67,068 | |
Legal | 6,317 | |
Interest | 39,161 | |
Miscellaneous | 211,922 | |
Total expenses before reductions | 14,528,848 | |
Expense reductions | (430,556) | 14,098,292 |
Net investment income (loss) | | 2,902,276 |
Realized and Unrealized Gain (Loss) Net realized gain (loss) on: | | |
Investment securities: | | |
Unaffiliated issuers | (153,629,459) | |
Other affiliated issuers | (3,139,491) | |
Foreign currency transactions | 78,947 | |
Total net realized gain (loss) | | (156,690,003) |
Change in net unrealized appreciation (depreciation) on: Investment securities | (647,254,659) | |
Assets and liabilities in foreign currencies | 55,716 | |
Total change in net unrealized appreciation (depreciation) | | (647,198,943) |
Net gain (loss) | | (803,888,946) |
Net increase (decrease) in net assets resulting from operations | | $ (800,986,670) |
See accompanying notes which are an integral part of the financial statements.
Annual Report
Statement of Changes in Net Assets
| Year ended
October 31,
2008 | Year ended
October 31,
2007 |
Increase (Decrease) in Net Assets | | |
Operations | | |
Net investment income (loss) | $ 2,902,276 | $ 5,724,841 |
Net realized gain (loss) | (156,690,003) | 184,590,119 |
Change in net unrealized appreciation (depreciation) | (647,198,943) | 219,203,434 |
Net increase (decrease) in net assets resulting
from operations | (800,986,670) | 409,518,394 |
Distributions to shareholders from net investment income | (4,817,372) | - |
Distributions to shareholders from net realized gain | (154,491,933) | - |
Total distributions | (159,309,305) | - |
Share transactions - net increase (decrease) | (308,489,372) | 127,196,896 |
Redemption fees | 307,719 | 783,954 |
Total increase (decrease) in net assets | (1,268,477,628) | 537,499,244 |
| | |
Net Assets | | |
Beginning of period | 1,630,674,788 | 1,093,175,544 |
End of period (including undistributed net investment income of $0 and undistributed net investment income of $5,724,841, respectively) | $ 362,197,160 | $ 1,630,674,788 |
See accompanying notes which are an integral part of the financial statements.
Annual Report
Financial Highlights - Class A
Years ended October 31, | 2008 | 2007 | 2006 | 2005 H |
Selected Per-Share Data | | | | |
Net asset value, beginning of period | $ 18.97 | $ 14.18 | $ 10.41 | $ 10.00 |
Income from Investment Operations | | | | |
Net investment income (loss) E | .02 | .02 | - J | - J |
Net realized and unrealized gain (loss) | (10.85) | 4.76 | 3.74 | .40 |
Total from investment operations | (10.83) | 4.78 | 3.74 | .40 |
Distributions from net investment income | (.03) | - | - | - |
Distributions from net realized gain | (1.88) | - | - J | - |
Total distributions | (1.90) K | - | - J | - |
Redemption fees added to paid in capital E | - J | .01 | .03 | .01 |
Net asset value, end of period | $ 6.24 | $ 18.97 | $ 14.18 | $ 10.41 |
Total Return B, C, D | (62.98)% | 33.78% | 36.25% | 4.10% |
Ratios to Average Net Assets F, I | | | | |
Expenses before reductions | 1.75% | 1.63% | 1.63% | 2.67% A |
Expenses net of fee waivers, if any | 1.66% | 1.63% | 1.63% | 1.65% A |
Expenses net of all reductions | 1.62% | 1.59% | 1.51% | 1.54% A |
Net investment income (loss) | .13% | .10% | .02% | (.09)% A |
Supplemental Data | | | | |
Net assets, end of period (000 omitted) | $ 17,905 | $ 70,785 | $ 35,674 | $ 5,533 |
Portfolio turnover rate G | 61% | 107% | 164% | 46% |
A Annualized
B Total returns for periods of less than one year are not annualized.
C Total returns would have been lower had certain expenses not been reduced during the periods shown.
D Total returns do not include the effect of the sales charges.
E Calculated based on average shares outstanding during the period.
F Fees and expenses of the underlying Fidelity Central Funds are not included in the Fund's expense ratio. The Fund indirectly bears its proportionate share of the expenses of any underlying Fidelity Central Funds.
G Amount does not include the portfolio activity of any underlying Fidelity Central Funds.
H For the period August 2, 2005 (commencement of operations) to October 31, 2005.
I Expense ratios reflect operating expenses of the class. Expenses before reductions do not reflect amounts reimbursed by the investment adviser or reductions from brokerage service arrangements or other expense offset arrangements and do not represent the amount paid by the class during periods when reimbursements or reductions occur. Expense ratios before reductions for start-up periods may not be representative of longer-term operating periods. Expenses net of fee waivers reflect expenses after reimbursement by the investment adviser but prior to reductions from brokerage service arrangements or other expense offset arrangements. Expenses net of all reductions represent the net expenses paid by the class.
J Amount represents less than $.01 per share.
K Total distributions of $1.903 per share is comprised of distributions from net investment income of $.025 and distributions from net realized gain of $1.878 per share.
See accompanying notes which are an integral part of the financial statements.
Annual Report
Financial Highlights - Class T
Years ended October 31, | 2008 | 2007 | 2006 | 2005 H |
Selected Per-Share Data | | | | |
Net asset value, beginning of period | $ 18.85 | $ 14.12 | $ 10.38 | $ 10.00 |
Income from Investment Operations | | | | |
Net investment income (loss) E | (.02) | (.02) | (.03) | (.01) |
Net realized and unrealized gain (loss) | (10.78) | 4.74 | 3.74 | .38 |
Total from investment operations | (10.80) | 4.72 | 3.71 | .37 |
Distributions from net realized gain | (1.85) K | - | - | - |
Redemption fees added to paid in capital E | - J | .01 | .03 | .01 |
Net asset value, end of period | $ 6.20 | $ 18.85 | $ 14.12 | $ 10.38 |
Total Return B, C, D | (63.08)% | 33.50% | 36.03% | 3.80% |
Ratios to Average Net Assets F, I | | | | |
Expenses before reductions | 2.00% | 1.85% | 1.85% | 2.92% A |
Expenses net of fee waivers, if any | 1.91% | 1.85% | 1.85% | 1.90% A |
Expenses net of all reductions | 1.87% | 1.81% | 1.74% | 1.78% A |
Net investment income (loss) | (.12)% | (.13)% | (.20)% | (.33)% A |
Supplemental Data | | | | |
Net assets, end of period (000 omitted) | $ 11,614 | $ 46,568 | $ 28,309 | $ 2,704 |
Portfolio turnover rate G | 61% | 107% | 164% | 46% |
A Annualized
B Total returns for periods of less than one year are not annualized.
C Total returns would have been lower had certain expenses not been reduced during the periods shown.
D Total returns do not include the effect of the sales charges.
E Calculated based on average shares outstanding during the period.
F Fees and expenses of the underlying Fidelity Central Funds are not included in the Fund's expense ratio. The Fund indirectly bears its proportionate share of the expenses of any underlying Fidelity Central Funds.
G Amount does not include the portfolio activity of any underlying Fidelity Central Funds.
H For the period August 2, 2005 (commencement of operations) to October 31, 2005.
I Expense ratios reflect operating expenses of the class. Expenses before reductions do not reflect amounts reimbursed by the investment adviser or reductions from brokerage service arrangements or other expense offset arrangements and do not represent the amount paid by the class during periods when reimbursements or reductions occur. Expense ratios before reductions for start-up periods may not be representative of longer-term operating periods. Expenses net of fee waivers reflect expenses after reimbursement by the investment adviser but prior to reductions from brokerage service arrangements or other expense offset arrangements. Expenses net of all reductions represent the net expenses paid by the class.
J Amount represents less than $.01 per share.
K Total distributions of $1.852 per share is comprised of distributions from net realized gain of $1.852 per share.
See accompanying notes which are an integral part of the financial statements.
Annual Report
Financial Highlights - Class B
Years ended October 31, | 2008 | 2007 | 2006 | 2005 H |
Selected Per-Share Data | | | | |
Net asset value, beginning of period | $ 18.64 | $ 14.04 | $ 10.37 | $ 10.00 |
Income from Investment Operations | | | | |
Net investment income (loss) E | (.08) | (.11) | (.10) | (.02) |
Net realized and unrealized gain (loss) | (10.68) | 4.70 | 3.74 | .38 |
Total from investment operations | (10.76) | 4.59 | 3.64 | .36 |
Distributions from net realized gain | (1.76) K | - | - | - |
Redemption fees added to paid in capital E | - J | .01 | .03 | .01 |
Net asset value, end of period | $ 6.12 | $ 18.64 | $ 14.04 | $ 10.37 |
Total Return B, C, D | (63.32)% | 32.76% | 35.39% | 3.70% |
Ratios to Average Net Assets F, I | | | | |
Expenses before reductions | 2.51% | 2.40% | 2.45% | 3.43% A |
Expenses net of fee waivers, if any | 2.41% | 2.40% | 2.41% | 2.40% A |
Expenses net of all reductions | 2.38% | 2.36% | 2.30% | 2.27% A |
Net investment income (loss) | (.62)% | (.67)% | (.76)% | (.82)% A |
Supplemental Data | | | | |
Net assets, end of period (000 omitted) | $ 2,687 | $ 10,975 | $ 7,709 | $ 1,705 |
Portfolio turnover rate G | 61% | 107% | 164% | 46% |
A Annualized
B Total returns for periods of less than one year are not annualized.
C Total returns would have been lower had certain expenses not been reduced during the periods shown.
D Total returns do not include the effect of the contingent deferred sales charge.
E Calculated based on average shares outstanding during the period.
F Fees and expenses of the underlying Fidelity Central Funds are not included in the Fund's expense ratio. The Fund indirectly bears its proportionate share of the expenses of any underlying Fidelity Central Funds.
G Amount does not include the portfolio activity of any underlying Fidelity Central Funds.
H For the period August 2, 2005 (commencement of operations) to October 31, 2005.
I Expense ratios reflect operating expenses of the class. Expenses before reductions do not reflect amounts reimbursed by the investment adviser or reductions from brokerage service arrangements or other expense offset arrangements and do not represent the amount paid by the class during periods when reimbursements or reductions occur. Expense ratios before reductions for start-up periods may not be representative of longer-term operating periods. Expenses net of fee waivers reflect expenses after reimbursement by the investment adviser but prior to reductions from brokerage service arrangements or other expense offset arrangements. Expenses net of all reductions represent the net expenses paid by the class.
J Amount represents less than $.01 per share.
K Total distributions of $1.760 per share is comprised of distributions from net realized gain of $1.760 per share.
See accompanying notes which are an integral part of the financial statements.
Annual Report
Financial Highlights - Class C
Years ended October 31, | 2008 | 2007 | 2006 | 2005 H |
Selected Per-Share Data | | | | |
Net asset value, beginning of period | $ 18.63 | $ 14.03 | $ 10.37 | $ 10.00 |
Income from Investment Operations | | | | |
Net investment income (loss) E | (.08) | (.11) | (.10) | (.02) |
Net realized and unrealized gain (loss) | (10.66) | 4.70 | 3.73 | .38 |
Total from investment operations | (10.74) | 4.59 | 3.63 | .36 |
Distributions from net realized gain | (1.78) K | - | - | - |
Redemption fees added to paid in capital E | - J | .01 | .03 | .01 |
Net asset value, end of period | $ 6.11 | $ 18.63 | $ 14.03 | $ 10.37 |
Total Return B, C, D | (63.32)% | 32.79% | 35.29% | 3.70% |
Ratios to Average Net Assets F, I | | | | |
Expenses before reductions | 2.51% | 2.38% | 2.38% | 3.32% A |
Expenses net of fee waivers, if any | 2.41% | 2.38% | 2.38% | 2.40% A |
Expenses net of all reductions | 2.38% | 2.34% | 2.27% | 2.29% A |
Net investment income (loss) | (.62)% | (.66)% | (.73)% | (.84)% A |
Supplemental Data | | | | |
Net assets, end of period (000 omitted) | $ 9,497 | $ 40,894 | $ 26,320 | $ 3,317 |
Portfolio turnover rate G | 61% | 107% | 164% | 46% |
A Annualized
B Total returns for periods of less than one year are not annualized.
C Total returns would have been lower had certain expenses not been reduced during the periods shown.
D Total returns do not include the effect of the contingent deferred sales charge.
E Calculated based on average shares outstanding during the period.
F Fees and expenses of the underlying Fidelity Central Funds are not included in the Fund's expense ratio. The Fund indirectly bears its proportionate share of the expenses of any underlying Fidelity Central Funds.
G Amount does not include the portfolio activity of any underlying Fidelity Central Funds.
H For the period August 2, 2005 (commencement of operations) to October 31, 2005.
I Expense ratios reflect operating expenses of the class. Expenses before reductions do not reflect amounts reimbursed by the investment adviser or reductions from brokerage service arrangements or other expense offset arrangements and do not represent the amount paid by the class during periods when reimbursements or reductions occur. Expense ratios before reductions for start-up periods may not be representative of longer-term operating periods. Expenses net of fee waivers reflect expenses after reimbursement by the investment adviser but prior to reductions from brokerage service arrangements or other expense offset arrangements. Expenses net of all reductions represent the net expenses paid by the class.
J Amount represents less than $.01 per share.
K Total distributions of $1.775 per share is comprised of distributions from net realized gain of $1.775 per share.
See accompanying notes which are an integral part of the financial statements.
Annual Report
Financial Highlights - International Small Cap Opportunities
Years ended October 31, | 2008 | 2007 | 2006 | 2005 G |
Selected Per-Share Data | | | | |
Net asset value, beginning of period | $ 19.09 | $ 14.23 | $ 10.40 | $ 10.00 |
Income from Investment Operations | | | | |
Net investment income (loss) D | .05 | .07 | .05 | - I |
Net realized and unrealized gain (loss) | (10.92) | 4.78 | 3.75 | .39 |
Total from investment operations | (10.87) | 4.85 | 3.80 | .39 |
Distributions from net investment income | (.06) | - | - | - |
Distributions from net realized gain | (1.88) | - | - I | - |
Total distributions | (1.94) J | - | - I | - |
Redemption fees added to paid in capital D | - I | .01 | .03 | .01 |
Net asset value, end of period | $ 6.28 | $ 19.09 | $ 14.23 | $ 10.40 |
Total Return B, C | (62.91)% | 34.15% | 36.86% | 4.00% |
Ratios to Average Net Assets E, H | | | | |
Expenses before reductions | 1.44% | 1.30% | 1.28% | 2.25% A |
Expenses net of fee waivers, if any | 1.44% | 1.30% | 1.28% | 1.40% A |
Expenses net of all reductions | 1.40% | 1.25% | 1.16% | 1.31% A |
Net investment income (loss) | .36% | .43% | .37% | .14% A |
Supplemental Data | | | | |
Net assets, end of period (000 omitted) | $ 312,376 | $ 1,433,844 | $ 981,210 | $ 197,349 |
Portfolio turnover rate F | 61% | 107% | 164% | 46% |
A Annualized
B Total returns for periods of less than one year are not annualized.
C Total returns would have been lower had certain expenses not been reduced during the periods shown.
D Calculated based on average shares outstanding during the period.
E Fees and expenses of the underlying Fidelity Central Funds are not included in the Fund's expense ratio. The Fund indirectly bears its proportionate share of the expenses of any underlying Fidelity Central Funds.
F Amount does not include the portfolio activity of any underlying Fidelity Central Funds.
G For the period August 2, 2005 (commencement of operations) to October 31, 2005.
H Expense ratios reflect operating expenses of the class. Expenses before reductions do not reflect amounts reimbursed by the investment adviser or reductions from brokerage service arrangements or other expense offset arrangements and do not represent the amount paid by the class during periods when reimbursements or reductions occur. Expense ratios before reductions for start-up periods may not be representative of longer-term operating periods. Expenses net of fee waivers reflect expenses after reimbursement by the investment adviser but prior to reductions from brokerage service arrangements or other expense offset arrangements. Expenses net of all reductions represent the net expenses paid by the class.
I Amount represents less than $.01 per share.
J Total distributions of $1.942 per share is comprised of distributions from net investment income of $.064 and distributions from net realized gain of $1.878 per share.
See accompanying notes which are an integral part of the financial statements.
Annual Report
Financial Highlights - Institutional Class
Years ended October 31, | 2008 | 2007 | 2006 | 2005 G |
Selected Per-Share Data | | | | |
Net asset value, beginning of period | $ 19.09 | $ 14.22 | $ 10.40 | $ 10.00 |
Income from Investment Operations | | | | |
Net investment income (loss) D | .05 | .08 | .05 | - I |
Net realized and unrealized gain (loss) | (10.92) | 4.78 | 3.74 | .39 |
Total from investment operations | (10.87) | 4.86 | 3.79 | .39 |
Distributions from net investment income | (.07) | - | - | - |
Distributions from net realized gain | (1.88) | - | - I | - |
Total distributions | (1.95) J | - | - I | - |
Redemption fees added to paid in capital D | - I | .01 | .03 | .01 |
Net asset value, end of period | $ 6.27 | $ 19.09 | $ 14.22 | $ 10.40 |
Total Return B, C | (62.95)% | 34.25% | 36.77% | 4.00% |
Ratios to Average Net Assets E, H | | | | |
Expenses before reductions | 1.40% | 1.29% | 1.25% | 2.25% A |
Expenses net of fee waivers, if any | 1.40% | 1.29% | 1.25% | 1.40% A |
Expenses net of all reductions | 1.37% | 1.25% | 1.14% | 1.29% A |
Net investment income (loss) | .39% | .44% | .40% | .16% A |
Supplemental Data | | | | |
Net assets, end of period (000 omitted) | $ 8,117 | $ 27,609 | $ 13,954 | $ 2,849 |
Portfolio turnover rate F | 61% | 107% | 164% | 46% |
A Annualized
B Total returns for periods of less than one year are not annualized.
C Total returns would have been lower had certain expenses not been reduced during the periods shown.
D Calculated based on average shares outstanding during the period.
E Fees and expenses of the underlying Fidelity Central Funds are not included in the Fund's expense ratio. The Fund indirectly bears its proportionate share of the expenses of any underlying Fidelity Central Funds.
F Amount does not include the portfolio activity of any underlying Fidelity Central Funds.
G For the period August 2, 2005 (commencement of operations) to October 31, 2005.
H Expense ratios reflect operating expenses of the class. Expenses before reductions do not reflect amounts reimbursed by the investment adviser or reductions from brokerage service arrangements or other expense offset arrangements and do not represent the amount paid by the class during periods when reimbursements or reductions occur. Expense ratios before reductions for start-up periods may not be representative of longer-term operating periods. Expenses net of fee waivers reflect expenses after reimbursement by the investment adviser but prior to reductions from brokerage service arrangements or other expense offset arrangements. Expenses net of all reductions represent the net expenses paid by the class.
I Amount represents less than $.01 per share.
J Total distributions of $1.952 per share is comprised of distributions from net investment income of $.074 and distributions from net realized gain of $1.878 per share.
See accompanying notes which are an integral part of the financial statements.
Annual Report
Notes to Financial Statements
For the period ended October 31, 2008
1. Organization.
Fidelity International Small Cap Opportunities Fund (the Fund) is a fund of Fidelity Investment Trust (the trust) and is authorized to issue an unlimited number of shares. The trust is registered under the Investment Company Act of 1940, as amended (the 1940 Act), as an open-end management investment company organized as a Massachusetts business trust. The Fund offers Class A, Class T, Class B, Class C, International Small Cap Opportunities, and Institutional Class shares, each of which has equal rights as to assets and voting privileges. Each class has exclusive voting rights with respect to matters that affect that class. Class B shares will automatically convert to Class A shares after a holding period of seven years from the initial date of purchase. Investment income, realized and unrealized capital gains and losses, the common expenses of the Fund, and certain fund-level expense reductions, if any, are allocated on a pro rata basis to each class based on the relative net assets of each class to the total net assets of the Fund. Each class differs with respect to transfer agent and distribution and service plan fees incurred. Certain expense reductions also differ by class. The Fund's investments in emerging markets can be subject to social, economic, regulatory, and political uncertainties and can be extremely volatile.
2. Investments in Fidelity Central Funds.
The Fund may invest in Fidelity Central Funds, which are open-end investment companies available only to other investment companies and accounts managed by Fidelity Management & Research Company (FMR) and its affiliates. The Fund's Schedule of Investments lists each of the Fidelity Central Funds held as of period end, if any, as an investment of the Fund, but does not include the underlying holdings of each Fidelity Central Fund. As an Investing Fund, the Fund indirectly bears its proportionate share of the expenses of the underlying Fidelity Central Funds.
The Money Market Central Funds seek preservation of capital and current income and are managed by Fidelity Investments Money Management, Inc. (FIMM), an affiliate of FMR.
A complete unaudited list of holdings for each Fidelity Central Fund is available upon request or at the SEC's web site at www.sec.gov. In addition, the financial statements of the Fidelity Central Funds, which are not covered by the Fund's Report of Independent Registered Public Accounting Firm, are available on the SEC's web site or upon request.
3. Significant Accounting Policies.
The financial statements have been prepared in conformity with accounting principles generally accepted in the United States of America, which require management to make certain estimates and assumptions at the date of the financial statements. Actual results
Annual Report
3. Significant Accounting Policies - continued
could differ from those estimates. The following summarizes the significant accounting policies of the Fund:
Security Valuation. Investments are valued as of 4:00 p.m. Eastern time on the last calendar day of the period. Wherever possible, the Fund uses independent pricing services approved by the Board of Trustees to value its investments.
Equity securities, including restricted securities, for which market quotations are readily available, are valued at the last reported sale price or official closing price as reported by an independent pricing service on the primary market or exchange on which they are traded. In the event there were no sales during the day or closing prices are not available, securities are valued at the last quoted bid price. Investments in open-end mutual funds, including the Fidelity Central Funds, are valued at their closing net asset value each business day. Short-term securities with remaining maturities of sixty days or less for which quotations are not readily available are valued at amortized cost, which approximates value.
When current market prices or quotations are not readily available or reliable, valuations may be determined in good faith in accordance with procedures adopted by the Board of Trustees. Factors used in determining value may include significant market or security specific events, changes in interest rates and credit quality, and developments in foreign markets which are monitored by evaluating the performance of ADRs, futures contracts and exchange-traded funds. The frequency with which these procedures are used cannot be predicted and may be utilized to a significant extent. The value of securities used for net asset value (NAV) calculation under these procedures may differ from published prices for the same securities.
Foreign Currency. The Fund uses foreign currency contracts to facilitate transactions in foreign-denominated securities. Losses from these transactions may arise from changes in the value of the foreign currency or if the counterparties do not perform under the contracts' terms.
Foreign-denominated assets, including investment securities, and liabilities are translated into U.S. dollars at the exchange rate at period end. Purchases and sales of investment securities, income and dividends received and expenses denominated in foreign currencies are translated into U.S. dollars at the exchange rate in effect on the transaction date.
The effects of exchange rate fluctuations on investments are included with the net realized and unrealized gain (loss) on investment securities. Other foreign currency transactions resulting in realized and unrealized gain (loss) are disclosed separately.
Annual Report
Notes to Financial Statements - continued
3. Significant Accounting Policies - continued
Investment Transactions and Income. For financial reporting purposes, the Fund's investment holdings and NAV include trades executed through the end of the last business day of the period. The NAV per share for processing shareholder transactions is calculated as of the close of business of the New York Stock Exchange (NYSE), normally 4:00 p.m. Eastern time and includes trades executed through the end of the prior business day. Gains and losses on securities sold are determined on the basis of identified cost. Dividend income is recorded on the ex-dividend date, except for certain dividends from foreign securities where the ex-dividend date may have passed, which are recorded as soon as the Fund is informed of the ex-dividend date. Non-cash dividends included in dividend income, if any, are recorded at the fair market value of the securities received. Interest income and distributions from the Fidelity Central Funds are accrued as earned. Interest income includes coupon interest and amortization of premium and accretion of discount on debt securities. Investment income is recorded net of foreign taxes withheld where recovery of such taxes is uncertain.
Expenses. Most expenses of the trust can be directly attributed to a fund. Expenses which cannot be directly attributed are apportioned among each Fund in the trust. Expense estimates are accrued in the period to which they relate and adjustments are made when actual amounts are known.
Income Tax Information and Distributions to Shareholders. Each year, the Fund intends to qualify as a regulated investment company by distributing substantially all of its taxable income and realized gains under Subchapter M of the Internal Revenue Code and filing its U.S. federal tax return. As a result, no provision for income taxes is required. The Fund is subject to the provisions of FASB Interpretation No. 48, Accounting for Uncertainties in Income Taxes (FIN 48). FIN 48 sets forth a minimum threshold for financial statement recognition of the benefit of a tax position taken or expected to be taken in a tax return. The implementation of FIN 48 did not result in any unrecognized tax benefits in the accompanying financial statements. Each of the Fund's federal tax returns for the prior three fiscal years remains subject to examination by the Internal Revenue Service (IRS). Foreign taxes are provided for based on the Fund's understanding of the tax rules and rates that exist in the foreign markets in which it invests.
Distributions are recorded on the ex-dividend date. Income dividends and capital gain distributions are declared separately for each class. Income and capital gain distributions are determined in accordance with income tax regulations, which may differ from generally accepted accounting principles.
Capital accounts within the financial statements are adjusted for permanent book-tax differences. These adjustments have no impact on net assets or the results of operations. Temporary book-tax differences will reverse in a subsequent period.
Annual Report
3. Significant Accounting Policies - continued
Income Tax Information and Distributions to Shareholders - continued
Book-tax differences are primarily due to foreign currency transactions, passive foreign investment companies (PFIC), certain foreign taxes, capital loss carryforwards and losses deferred due to wash sales.
The tax-basis components of distributable earnings and the federal tax cost as of period end were as follows:
Unrealized appreciation | $ 7,261,219 |
Unrealized depreciation | (332,961,765) |
Net unrealized appreciation (depreciation) | (325,700,546) |
Capital loss carryforward | (146,419,794) |
| |
Cost for federal income tax purposes | $ 763,909,463 |
The tax character of distributions paid was as follows:
| October 31, 2008 | October 31, 2007 |
Ordinary Income | $ 16,665,902 | $ - |
Long-term Capital Gains | 142,643,403 | - |
Total | $ 159,309,305 | $ - |
Short-Term Trading (Redemption) Fees. Shares held in the Fund less than 90 days are subject to a redemption fee equal to 2.00% of the proceeds of the redeemed shares. All redemption fees, including any estimated redemption fees paid by FMR, are retained by the Fund and accounted for as an addition to paid in capital.
New Accounting Pronouncement. In September 2006, Statement of Financial Accounting Standards No. 157, Fair Value Measurements (SFAS 157), was issued and is effective for fiscal years beginning after November 15, 2007. SFAS 157 defines fair value, establishes a framework for measuring fair value and results in expanded disclosures about fair value measurements.
4. Operating Policies.
Repurchase Agreements. FMR has received an Exemptive Order from the Securities and Exchange Commission (the SEC) which permits the Fund and other affiliated entities of FMR to transfer uninvested cash balances into joint trading accounts which are then invested in repurchase agreements. The Fund may also invest directly with institutions in repurchase agreements. Repurchase agreements are collateralized by government or non-government securities. Upon settlement date, collateral is held in segregated accounts with custodian banks and may be obtained in the event of a default of the counterparty. The Fund monitors, on a daily basis, the value of the collateral to ensure it is at least equal to the principal amount of the repurchase agreement
Annual Report
Notes to Financial Statements - continued
4. Operating Policies - continued
Repurchase Agreements - continued
(including accrued interest). In the event of a default by the counterparty, realization of the collateral proceeds could be delayed, during which time the value of the collateral may decline.
5. Purchases and Sales of Investments.
Purchases and sales of securities, other than short-term securities, aggregated $594,537,624 and $981,461,622, respectively.
6. Fees and Other Transactions with Affiliates.
Management Fee. FMR and its affiliates provide the Fund with investment management related services for which the Fund pays a monthly management fee. The management fee is the sum of an individual fund fee rate that is based on an annual rate of .60% of the Fund's average net assets and a group fee rate that averaged .26% during the period. The group fee rate is based upon the average net assets of all the mutual funds advised by FMR. The group fee rate decreases as assets under management increase and increases as assets under management decrease. In addition, the management fee is subject to a performance adjustment (up to a maximum of ± .20% of the Fund's average net assets over a 36 month performance period). The upward or downward adjustment to the management fee is based on the relative investment performance of the retail class of the Fund, International Small Cap Opportunities as compared to an appropriate benchmark index. For the period, the total annual management fee rate, including the performance adjustment, was 1.07% of the Fund's average net assets.
Distribution and Service Plan. In accordance with Rule 12b-1 of the 1940 Act, the Fund has adopted separate Distribution and Service Plans for each class of shares. Certain classes pay Fidelity Distributors Corporation (FDC), an affiliate of FMR, separate Distribution and Service Fees, each of which is based on an annual percentage of each class' average net assets. In addition, FDC may pay financial intermediaries for selling shares of the Fund and providing shareholder support services. For the period, the Distribution and Service Fee rates and the total amounts paid to and retained by FDC were as follows:
| Distribution
Fee | Service
Fee | Paid to
FDC | Retained
by FDC |
Class A | 0% | .25% | $ 113,686 | $ 9,692 |
Class T | .25% | .25% | 142,986 | 2,758 |
Class B | .75% | .25% | 68,222 | 51,535 |
Class C | .75% | .25% | 255,510 | 47,663 |
| | | $ 580,404 | $ 111,648 |
Annual Report
6. Fees and Other Transactions with Affiliates - continued
Sales Load. FDC receives a front-end sales charge of up to 5.75% for selling Class A shares, and 3.50% for selling Class T shares, some of which is paid to financial intermediaries for selling shares of the Fund. FDC receives the proceeds of contingent deferred sales charges levied on Class A, Class T, Class B, and Class C redemptions. These charges depend on the holding period. The deferred sales charges range from 5% to 1% for Class B, 1% for Class C, 1.00% to .50% for certain purchases of Class A shares and .25% for certain purchases of Class T shares.
For the period, sales charge amounts retained by FDC were as follows:
| Retained
by FDC |
Class A | $ 19,917 |
Class T | 6,001 |
Class B* | 29,903 |
Class C* | 4,501 |
| $ 60,322 |
* When Class B and Class C shares are initially sold, FDC pays commissions from its own resources to financial intermediaries through which the sales are made.
Transfer Agent Fees. Fidelity Investments Institutional Operations Company, Inc. (FIIOC), an affiliate of FMR, is the transfer, dividend disbursing and shareholder servicing agent for each class of the Fund. FIIOC receives account fees and asset-based fees that vary according to the account size and type of account of the shareholders of the respective classes of the Fund. FIIOC pays for typesetting, printing and mailing of shareholder reports, except proxy statements. Prior to January 1, 2008, Fidelity Service Company, Inc. (FSC), also an affiliate of FMR was the transfer agent for International Small Cap Opportunities shares. For the period, each class paid the following transfer agent fees:
| Amount | % of
Average
Net Assets |
Class A | $ 140,073 | .31 |
Class T | 88,875 | .31 |
Class B | 21,153 | .31 |
Class C | 79,086 | .31 |
International Small Cap Opportunities | 2,100,743 | .25 |
Institutional Class | 37,286 | .22 |
| $ 2,467,216 | |
Accounting and Security Lending Fees. FSC, an affiliate of FMR, maintains the Fund's accounting records. The accounting fee is based on the level of average net assets for the month. Under a separate contract, FSC administers the security lending program. The security lending fee is based on the number and duration of lending transactions.
Annual Report
Notes to Financial Statements - continued
6. Fees and Other Transactions with Affiliates - continued
Brokerage Commissions. The Fund placed a portion of its portfolio transactions with brokerage firms which are affiliates of the investment adviser. The commissions paid to these affiliated firms were $6,205 for the period.
Interfund Lending Program. Pursuant to an Exemptive Order issued by the SEC, the Fund, along with other registered investment companies having management contracts with FMR, may participate in an interfund lending program. This program provides an alternative credit facility allowing the funds to borrow from, or lend money to, other participating affiliated funds. At period end, there were no interfund loans outstanding. The Fund's activity in this program during the period for which loans were outstanding was as follows:
Borrower or Lender | Average Daily Loan
Balance | Weighted Average
Interest Rate | Interest
Expense |
Borrower | $ 6,424,452 | 3.28% | $ 36,307 |
7. Committed Line of Credit.
The Fund participates with other funds managed by FMR in a $4.2 billion credit facility (the "line of credit") to be utilized for temporary or emergency purposes to fund shareholder redemptions or for other short-term liquidity purposes. The Fund has agreed to pay commitment fees on its pro rata portion of the line of credit, which amounted to $2,080 and is reflected in Miscellaneous Expense on the Statement of Operations. During the period, there were no borrowings on this line of credit.
8. Security Lending.
The Fund lends portfolio securities from time to time in order to earn additional income. On the settlement date of the loan, the Fund receives collateral (in the form of U.S. Treasury obligations, letters of credit and/or cash) against the loaned securities and maintains collateral in an amount not less than 100% of the market value of the loaned securities during the period of the loan. The market value of the loaned securities is determined at the close of business of the Fund and any additional required collateral is delivered to the Fund on the next business day. If the borrower defaults on its obligation to return the securities loaned because of insolvency or other reasons, a fund could experience delays and costs in recovering the securities loaned or in gaining access to the collateral. Any cash collateral received is invested in the Fidelity Securities Lending Cash Central Fund. The value of loaned securities and cash collateral at period end are disclosed on the Fund's Statement of Assets and Liabilities. Security lending income represents the income earned on investing cash collateral, less fees and expenses associated with the loan, plus any premium payments that may be received on the loan of certain types of securities. Security lending income is presented in the Statement of Operations as a component of income from Fidelity Central Funds.
Annual Report
9. Bank Borrowings.
The Fund is permitted to have bank borrowings for temporary or emergency purposes to fund shareholder redemptions. The Fund has established borrowing arrangements with certain banks. The interest rate on the borrowings is the bank's base rate, as revised from time to time. The average daily loan balance during the period for which loans were outstanding amounted to $8,838,667. The weighted average interest rate was 3.87%. The interest expense amounted to $2,854 under the bank borrowing program. At period end, there were no bank borrowings outstanding.
10. Expense Reductions.
FMR voluntarily agreed to reimburse each class to the extent annual operating expenses exceeded certain levels of average net assets as noted in the table below. Some expenses, for example interest expense, including commitment fees, are excluded from this reimbursement.
The following classes were in reimbursement during the period:
| Expense
Limitations | Reimbursement
from adviser |
| | |
Class A | 1.65% | $ 40,541 |
Class T | 1.90% | 26,563 |
Class B | 2.40% | 6,483 |
Class C | 2.40% | 24,403 |
| | $ 97,990 |
Many of the brokers with whom FMR places trades on behalf of the Fund provided services to the Fund in addition to trade execution. These services included payments of certain expenses on behalf of the Fund totaling $329,425 for the period. In addition, through arrangements with each class' transfer agent, credits realized as a result of uninvested cash balances were used to reduce the Fund's expenses.
During the period, credits reduced each class' transfer agent expense as noted in the table below.
| Transfer Agent
expense reduction |
International Small Cap Opportunities | $ 3,141 |
Annual Report
Notes to Financial Statements - continued
11. Other.
The Fund's organizational documents provide former and current trustees and officers with a limited indemnification against liabilities arising in connection with the performance of their duties to the Fund. In the normal course of business, the Fund may also enter into contracts that provide general indemnifications. The Fund's maximum exposure under these arrangements is unknown as this would be dependent on future claims that may be made against the Fund. The risk of material loss from such claims is considered remote.
12. Distributions to Shareholders.
Distributions to shareholders of each class were as follows:
Years ended October 31, | 2008 | 2007 |
From net investment income | | |
Class A | $ 91,280 | $ - |
International Small Cap Opportunities | 4,620,425 | - |
Institutional Class | 105,667 | - |
Total | $ 4,817,372 | $ - |
From net realized gain | | |
Class A | $ 6,856,940 | $ - |
Class T | 4,515,065 | - |
Class B | 1,019,225 | - |
Class C | 3,838,511 | - |
International Small Cap Opportunities | 135,580,534 | - |
Institutional Class | 2,681,658 | - |
Total | $ 154,491,933 | $ - |
13. Share Transactions.
Transactions for each class of shares were as follows:
| Shares | Dollars |
Years ended October 31, | 2008 | 2007 | 2008 | 2007 |
Class A | | | | |
Shares sold | 828,854 | 2,107,892 | $ 10,916,918 | $ 35,531,826 |
Reinvestment of distributions | 416,175 | - | 6,313,370 | - |
Shares redeemed | (2,104,322) | (892,381) | (25,609,420) | (14,908,147) |
Net increase (decrease) | (859,293) | 1,215,511 | $ (8,379,132) | $ 20,623,679 |
Class T | | | | |
Shares sold | 298,437 | 1,311,252 | $ 3,745,246 | $ 21,607,239 |
Reinvestment of distributions | 288,615 | - | 4,360,975 | - |
Shares redeemed | (1,182,864) | (845,477) | (14,814,150) | (14,215,111) |
Net increase (decrease) | (595,812) | 465,775 | $ (6,707,929) | $ 7,392,128 |
Annual Report
13. Share Transactions - continued
Transactions for each class of shares were as follows:
| Shares | Dollars |
Years ended October 31, | 2008 | 2007 | 2008 | 2007 |
Class B | | | | |
Shares sold | 67,210 | 286,293 | $ 882,196 | $ 4,653,400 |
Reinvestment of distributions | 61,167 | - | 917,505 | - |
Shares redeemed | (278,427) | (246,522) | (3,422,675) | (4,027,585) |
Net increase (decrease) | (150,050) | 39,771 | $ (1,622,974) | $ 625,815 |
Class C | | | | |
Shares sold | 393,320 | 888,414 | $ 4,565,906 | $ 14,698,282 |
Reinvestment of distributions | 216,879 | - | 3,248,846 | - |
Shares redeemed | (1,252,106) | (569,219) | (14,199,211) | (9,379,169) |
Net increase (decrease) | (641,907) | 319,195 | $ (6,384,459) | $ 5,319,113 |
International Small Cap Opportunities | | | | |
Shares sold | 10,644,155 | 48,402,736 | $ 141,713,979 | $ 800,622,633 |
Reinvestment of distributions | 8,363,264 | - | 127,539,782 | - |
Shares redeemed | (44,345,885) | (42,286,931) | (553,799,561) | (715,447,148) |
Net increase (decrease) | (25,338,466) | 6,115,805 | $ (284,545,800) | $ 85,175,485 |
Institutional Class | | | | |
Shares sold | 915,939 | 903,141 | $ 11,419,413 | $ 15,436,027 |
Reinvestment of distributions | 149,148 | - | 2,273,017 | - |
Shares redeemed | (1,217,529) | (437,882) | (14,541,508) | (7,375,351) |
Net increase (decrease) | (152,442) | 465,259 | $ (849,078) | $ 8,060,676 |
Annual Report
To the Trustees of Fidelity Investment Trust and Shareholders of Fidelity International Small Cap Opportunities Fund:
We have audited the accompanying statement of assets and liabilities of Fidelity International Small Cap Opportunities Fund (the Fund), a fund of Fidelity Investment Trust, including the schedule of investments, as of October 31, 2008, and the related statement of operations for the year then ended, the statement of changes in net assets for each of the two years in the period then ended, and the financial highlights for the three years in the period then ended and for the period from August 2, 2005 (commencement of operations) to October 31, 2005. These financial statements and financial highlights are the responsibility of the Fund's management. Our responsibility is to express an opinion on these financial statements and financial highlights based on our audits.
We conducted our audits in accordance with standards of the Public Company Accounting Oversight Board (United States). Those standards require that we plan and perform the audit to obtain reasonable assurance about whether the financial statements and financial highlights are free of material misstatement. The Fund is not required to have, nor were we engaged to perform, an audit of its internal control over financial reporting. Our audits included consideration of internal control over financial reporting as a basis for designing audit procedures that are appropriate in the circumstances, but not for the purpose of expressing an opinion on the effectiveness of the Fund's internal control over financial reporting. Accordingly, we express no such opinion. An audit also includes examining, on a test basis, evidence supporting the amounts and disclosures in the financial statements, assessing the accounting principles used and significant estimates made by management, as well as evaluating the overall financial statement presentation. Our procedures included confirmation of securities owned as of October 31, 2008, by correspondence with the custodians and brokers; where replies were not received from brokers, we performed other auditing procedures. We believe that our audits provide a reasonable basis for our opinion.
In our opinion, the financial statements and financial highlights referred to above present fairly, in all material respects, the financial position of Fidelity International Small Cap Opportunities Fund as of October 31, 2008, the results of its operations for the year then ended, the changes in its net assets for each of the two years in the period then ended, and its financial highlights for each of the three years in the period then ended and for the period from August 2, 2005 (commencement of operations) to October 31, 2005, in conformity with accounting principles generally accepted in the United States of America.
/s/ Deloitte & Touche LLP
DELOITTE & TOUCHE LLP
Boston, Massachusetts
December 19, 2008
Annual Report
The Trustees, Member of the Advisory Board, and executive officers of the trust and fund, as applicable, are listed below. The Board of Trustees governs the fund and is responsible for protecting the interests of shareholders. The Trustees are experienced executives who meet periodically throughout the year to oversee the fund's activities, review contractual arrangements with companies that provide services to the fund, and review the fund's performance. Except for Edward C. Johnson 3d and James C. Curvey, each of the Trustees oversees 220 funds advised by FMR or an affiliate. Messrs. Johnson and Curvey oversee 379 funds advised by FMR or an affiliate.
The Trustees hold office without limit in time except that (a) any Trustee may resign; (b) any Trustee may be removed by written instrument, signed by at least two-thirds of the number of Trustees prior to such removal; (c) any Trustee who requests to be retired or who has become incapacitated by illness or injury may be retired by written instrument signed by a majority of the other Trustees; and (d) any Trustee may be removed at any special meeting of shareholders by a two-thirds vote of the outstanding voting securities of the trust. Each Trustee who is not an interested person (as defined in the 1940 Act) (Independent Trustee), shall retire not later than the last day of the calendar year in which his or her 72nd birthday occurs. The Independent Trustees may waive this mandatory retirement age policy with respect to individual Trustees. The executive officers and Advisory Board Member hold office without limit in time, except that any officer and Advisory Board Member may resign or may be removed by a vote of a majority of the Trustees at any regular meeting or any special meeting of the Trustees. Except as indicated, each individual has held the office shown or other offices in the same company for the past five years.
The fund's Statement of Additional Information (SAI) includes more information about the Trustees. To request a free copy, call Fidelity at 1-877-208-0098.
Interested Trustees*:
Correspondence intended for each Trustee who is an interested person may be sent to Fidelity Investments, 82 Devonshire Street, Boston, Massachusetts 02109.
Name, Age; Principal Occupation |
Edward C. Johnson 3d (78) |
| Year of Election or Appointment: 1984 Mr. Johnson is Chairman of the Board of Trustees. Mr. Johnson serves as Chief Executive Officer, Chairman, and a Director of FMR LLC; Chairman and a Director of FMR; Chairman and a Director of Fidelity Research & Analysis Company (FRAC); Chairman and a Director of Fidelity Investments Money Management, Inc.; and Chairman and a Director of FMR Co., Inc. In addition, Mr. Johnson serves as Chairman and Director of FIL Limited. Previously, Mr. Johnson served as President of FMR LLC (2006-2007). |
James C. Curvey (73) |
| Year of Election or Appointment: 2007 Mr. Curvey also serves as Trustee (2007-present) of other investment companies advised by FMR. Mr. Curvey is a Director of FMR and FMR Co., Inc. (2007-present). Mr. Curvey is also Vice Chairman (2006-
present) and Director of FMR LLC. In addition, Mr. Curvey serves as an Overseer for the Boston Symphony Orchestra and a member of the Trustees of Villanova University. |
* Trustees have been determined to be "Interested Trustees" by virtue of, among other things, their affiliation with the trust or various entities under common control with FMR. FMR Corp. merged with and into FMR LLC on October 1, 2007. Any references to FMR LLC for prior periods are deemed to be references to the prior entity.
Independent Trustees:
Correspondence intended for each Independent Trustee (that is, the Trustees other than the Interested Trustees) may be sent to Fidelity Investments, P.O. Box 55235, Boston, Massachusetts 02205-5235.
Name, Age; Principal Occupation |
Dennis J. Dirks (60) |
| Year of Election or Appointment: 2005 Prior to his retirement in May 2003, Mr. Dirks was Chief Operating Officer and a member of the Board of The Depository Trust & Clearing Corporation (DTCC) (1999-2003). He also served as President, Chief Operating Officer, and Board member of The Depository Trust Company (DTC) (1999-2003) and President and Board member of the National Securities Clearing Corporation (NSCC) (1999-2003). In addition, Mr. Dirks served as a Trustee and a member of the Finance Committee of Manhattan College (2005-2008), and as Chief Executive Officer and Board member of the Government Securities Clearing Corporation (2001-2003) and Chief Executive Officer and Board member of the Mortgage-Backed Securities Clearing Corporation (2001-2003). Mr. Dirks also serves as a Trustee and a member of the Finance Committee of AHRC of Nassau County (2006-present). |
Alan J. Lacy (55) |
| Year of Election or Appointment: 2008 Mr. Lacy serves as Senior Adviser (2007-present) of Oak Hill Capital Partners, L.P. (a private equity firm). Mr. Lacy also served as Chief Executive Officer (2000-2005) and Vice Chairman (2005-2006) of Sears Holdings Corporation and Sears, Roebuck and Co. (retail). In addition, Mr. Lacy serves as a member of the Board of Directors of The Western Union Company (global money transfer, 2006-present) and Bristol-Myers Squibb (global pharmaceuticals, 2007-present). Mr. Lacy is a Trustee of the National Parks Conservation Association and The Field Museum of Natural History. |
Ned C. Lautenbach (64) |
| Year of Election or Appointment: 2000 Mr. Lautenbach is Chairman of the Independent Trustees (2006-present). Mr. Lautenbach is an Advisory Partner of Clayton, Dubilier & Rice, Inc. (private equity investment firm). Previously, Mr. Lautenbach was with the International Business Machines Corporation (IBM) from 1968 until his retirement in 1998. Mr. Lautenbach serves as a Director of Eaton Corporation (diversified industrial) as well as the Philharmonic Center for the Arts in Naples, Florida. He also is a member of the Board of Trustees of Fairfield University (2005-present), as well as a member of the Council on Foreign Relations. Previously, Mr. Lautenbach served as a Director of Sony Corporation (2006-2007).] |
Joseph Mauriello (64) |
| Year of Election or Appointment: 2008 Prior to his retirement in January 2006, Mr. Mauriello served in numerous senior management positions including Deputy Chairman and Chief Operating Officer (2004-2005), and Vice Chairman of Financial Services (2002-2004) of KPMG LLP US (professional services firm, 1965-
2005). Mr. Mauriello currently serves as a member of the Board of Directors of XL Capital Ltd. (global insurance and re-insurance company, 2006-present) and of Arcadia Resources Inc. (health care services and products, 2007-present). He also served as a Director of the Hamilton Funds of the Bank of New York (2006-2007). |
Cornelia M. Small (64) |
| Year of Election or Appointment: 2005 Ms. Small is a member of the Investment Committee, and Chair (2008-present) and a member of the Board of Trustees of Smith College. Ms. Small also serves on the Investment Committee of the Berkshire Taconic Community Foundation (2008-present). Previously, Ms. Small served as Chairperson of the Investment Committee (2002-2008) of Smith College and as Co-Chair (2000-2003) of the Annual Fund for the Fletcher School of Law and Diplomacy. In addition, she served as Chief Investment Officer, Director of Global Equity Investments, and a member of the Board of Directors of Scudder, Stevens & Clark and Scudder Kemper Investments. |
William S. Stavropoulos (69) |
| Year of Election or Appointment: 2001 Mr. Stavropoulos is Chairman Emeritus of the Board of Directors of The Dow Chemical Company, where he previously served in numerous senior management positions, including President (1993-2000; 2002-
2003), CEO (1995-2000; 2002-2004), Chairman of the Executive Committee (2000-2006), and as a member of the Board of Directors (1990-2006). Currently, he is a Director of Teradata Corporation (data warehousing and technology solutions, 2008-present), Chemical Financial Corporation, Maersk Inc. (industrial conglomerate), Tyco International, Inc. (multinational manufacturing and services, 2007-present), and a member of the Advisory Board for Metalmark Capital (private equity investment firm, 2005-present). He is a special advisor to Clayton, Dubilier & Rice, Inc. (private equity investment). In addition, Mr. Stavropoulos is a member of the University of Notre Dame Advisory Council for the College of Science. |
David M. Thomas (59) |
| Year of Election or Appointment: 2008 Previously, Mr. Thomas served as Executive Chairman (2005-2006) and Chairman and Chief Executive Officer (2000-2005) of IMS Health, Inc. (pharmaceutical and healthcare information solutions). In addition, Mr. Thomas serves as a member of the Board of Directors of Fortune Brands, Inc. (consumer products holding company), and Interpublic Group of Companies, Inc. (marketing communication, 2004-present). |
Michael E. Wiley (58) |
| Year of Election or Appointment: 2008 Mr. Wiley also serves as a member of the Board of Trustees of the University of Tulsa (2000-2006; 2007-present). He serves as a Director of Tesoro Corporation (independent oil refiner and marketer, 2005-
present), and a Director of Bill Barrett Corporation (exploration and production company, 2005-present). In addition, he also serves as a Director of Post Oak Bank (privately-held bank, 2004-present). Previously, Mr. Wiley served as a Sr. Energy Advisor of Katzenbach Partners, LLC (consulting firm, 2006-2007), as an Advisory Director of Riverstone Holdings (private investment firm), Chairman, President, and CEO of Baker Hughes, Inc. (oilfield services company, 2000-2004), and as Director of Spinnaker Exploration Company (exploration and production company, 2001-2005). |
Advisory Board Member and Executive Officers**:
Correspondence intended for each executive officer and Mr. Lynch may be sent to Fidelity Investments, 82 Devonshire Street, Boston, Massachusetts 02109.
Name, Age; Principal Occupation |
Peter S. Lynch (64) |
| Year of Election or Appointment: 2003 Member of the Advisory Board of Fidelity's Equity and High Income Funds. Mr. Lynch is Vice Chairman and a Director of FMR, and Vice Chairman (2001-present) and a Director of FMR Co., Inc. Previously, Mr. Lynch served as a Trustee of the Fidelity funds (1990-2003). In addition, he serves as a Trustee of Boston College and as the Chairman of the Inner-City Scholarship Fund. Previously, Mr. Lynch served on the Special Olympics International Board of Directors (1997-2006). |
Kenneth B. Robins (39) |
| Year of Election or Appointment: 2008 President and Treasurer of Fidelity's Equity and High Income Funds. Mr. Robins is an employee of Fidelity Investments (2004-present). Before joining Fidelity Investments, Mr. Robins worked at KPMG LLP, where he was a partner in KPMG's department of professional practice (2002-2004). |
Walter C. Donovan (46) |
| Year of Election or Appointment: 2007 Vice President of Fidelity's Equity Funds. Mr. Donovan also serves as President of FMR and FMR Co., Inc., and Executive Vice President of Fidelity Investments Money Management, Inc. (2007-present). Previously, Mr. Donovan served as Executive Vice President of FMR and FMR Co., Inc. (2005-2007) and Senior Vice President of FMR (2003-2005) and FMR Co., Inc. (2004-2005). |
Bruce T. Herring (43) |
| Year of Election or Appointment: 2006 Vice President of certain Equity Funds. Mr. Herring also serves as Group Chief Investments Officer of FMR. Previously, Mr. Herring served as a portfolio manager for Fidelity U.S. Equity Funds. |
Thomas C. Hense (44) |
| Year of Election or Appointment: 2008 Vice President of Fidelity's High Income and Small Cap Funds. Previously, Mr. Hense served as a portfolio manager for Fidelity's Institutional Money Management Group (Pyramis) (2003-2008). |
Eric M. Wetlaufer (46) |
| Year of Election or Appointment: 2006 Vice President of Fidelity's International Equity Funds. Mr. Wetlaufer also serves as Group Chief Investment Officer of FMR. Mr. Wetlaufer is Chairman, Chief Executive Officer, and President of Fidelity Management & Research (Hong Kong) Limited (2008-present); Chairman, Chief Executive Officer, President, and a Director of Fidelity Management & Research (Japan) Inc. (2008-present); Chairman and Chief Executive Officer (2007-present) and President and a Director (2006-present) of Fidelity Management & Research (U.K.) Inc. and President and a Director of Fidelity Research & Analysis Company (2006-present). Before joining Fidelity Investments in 2005, Mr. Wetlaufer was a partner in Oxhead Capital Management (2004-2005) and a Chief Investment Officer of Putnam Investments (1997-2003). |
Scott C. Goebel (40) |
| Year of Election or Appointment: 2008 Secretary and Chief Legal Officer (CLO) of the Fidelity funds. Mr. Goebel also serves as General Counsel, Secretary, and Senior Vice President of FMR (2008-present); Deputy General Counsel of FMR LLC; Chief Legal Secretary of Fidelity Management & Research (Hong Kong) Limited (2008-present) and Assistant Secretary of Fidelity Management & Research (Japan) Inc. (2008-present). Previously, Mr. Goebel served as Assistant Secretary of the Funds (2007-2008) and as Vice President and Secretary of Fidelity Distributors Corporation (FDC) (2005-2007). |
John B. McGinty, Jr. (46) |
| Year of Election or Appointment: 2008 Assistant Secretary of Fidelity's Equity and High Income Funds. Mr. McGinty is an employee of Fidelity Investments (2004-present). Mr. McGinty also serves as Senior Vice President, Secretary, and Chief Legal Officer of FDC (2007-present). Before joining Fidelity Investments, Mr. McGinty practiced law at Ropes & Gray, LLP. |
Holly C. Laurent (54) |
| Year of Election or Appointment: 2008 Anti-Money Laundering (AML) Officer of the Fidelity funds. Ms. Laurent is an employee of Fidelity Investments. Previously, Ms. Laurent was Senior Vice President and Head of Legal for Fidelity Business Services India Pvt. Ltd. (2006-2008), Senior Vice President, Deputy General Counsel and Group Head for FMR LLC (2005-2006). |
Christine Reynolds (50) |
| Year of Election or Appointment: 2008 Chief Financial Officer of the Fidelity funds. Ms. Reynolds became President of Fidelity Pricing and Cash Management Services (FPCMS) in August 2008. She served as Chief Operating Officer of FPCMS from 2007 through July 2008. Previously, Ms. Reynolds served as President, Treasurer, and Anti-Money Laundering officer of the Fidelity funds (2004-2007). Before joining Fidelity Investments, Ms. Reynolds worked at PricewaterhouseCoopers LLP (PwC) (1980-2002), where she was an audit partner with PwC's investment management practice. |
Kenneth A. Rathgeber (61) |
| Year of Election or Appointment: 2004 Chief Compliance Officer of Fidelity's Equity and High Income Funds. Mr. Rathgeber is Chief Compliance Officer of Fidelity Management & Research (Hong Kong) Limited (2008-present), Fidelity Management & Research (Japan) Inc. (2008-present), FMR (2005-present), FMR Co., Inc. (2005-present), Fidelity Management & Research (U.K.) Inc. (2005-
present), Fidelity Research & Analysis Company (2005-present), Fidelity Investments Money Management, Inc. (2005-present), and Strategic Advisers, Inc. (2005-present). |
Bryan A. Mehrmann (47) |
| Year of Election or Appointment: 2005 Deputy Treasurer of the Fidelity funds. Mr. Mehrmann is an employee of Fidelity Investments. Previously, Mr. Mehrmann served as Vice President of Fidelity Investments Institutional Services Group (FIIS)/Fidelity Investments Institutional Operations Corporation, Inc. (FIIOC) Client Services (1998-2004). |
Adrien E. Deberghes (41) |
| Year of Election or Appointment: 2008 Deputy Treasurer of Fidelity's Equity and High Income Funds. Mr. Deberghes is an employee of Fidelity Investments (2008-present). Previously, Mr. Deberghes served as Senior Vice President of Mutual Fund Administration at State Street Corporation (2007-2008), Senior Director of Mutual Fund Administration at Investors Bank & Trust (2005-2007), and Director of Finance for Dunkin' Brands (2000-2005). |
Robert G. Byrnes (41) |
| Year of Election or Appointment: 2005 Assistant Treasurer of the Fidelity funds. Mr. Byrnes is an employee of Fidelity Investments (2005-present). Previously, Mr. Byrnes served as Vice President of Fidelity Pricing and Cash Management Services (FPCMS) (2003-2005). Before joining Fidelity Investments, Mr. Byrnes worked at Deutsche Asset Management where he served as Vice President of the Investment Operations Group (2000-2003). |
Peter L. Lydecker (54) |
| Year of Election or Appointment: 2004 Assistant Treasurer of the Fidelity funds. Mr. Lydecker is an employee of Fidelity Investments. |
Paul M. Murphy (61) |
| Year of Election or Appointment: 2007 Assistant Treasurer of the Fidelity funds. Mr. Murphy is an employee of Fidelity Investments (2007-present). Previously, Mr. Murphy served as Chief Financial Officer of the Fidelity Funds (2005-2006), Vice President and Associate General Counsel of FMR (2007), and Senior Vice President of Fidelity Pricing and Cash Management Services (FPCMS) (1994-2007). |
Gary W. Ryan (50) |
| Year of Election or Appointment: 2005 Assistant Treasurer of the Fidelity funds. Mr. Ryan is an employee of Fidelity Investments. Previously, Mr. Ryan served as Vice President of Fund Reporting in Fidelity Pricing and Cash Management Services (FPCMS) (1999-2005). |
** FMR Corp. merged with and into FMR LLC on October 1, 2007. Any references to FMR LLC for prior periods are deemed to be references to the prior entity.
Annual Report
Class A, Class T, Class B, and Class C designates 99%, 100%, 100% and 100% of the dividends distributed during the fiscal year as amounts which may be taken into account as a dividend for purposes of the maximum rate under section 1(h)(11) of the Internal Revenue Code.
The amounts per share which represent income derived from sources within, and taxes paid to, foreign countries or possessions of the United States are as follows:
| Pay Date | Income | Taxes |
Class A | 12/10/07 | $0.143 | $0.0219 |
Class T | 12/10/07 | $0.106 | $0.0219 |
Class B | 12/10/07 | $0.038 | $0.0219 |
Class C | 12/10/07 | $0.049 | $0.0219 |
The fund will notify shareholders in January 2009 of amounts for use in preparing 2008 income tax returns.
Annual Report
A special meeting of the fund's shareholders was held on April 16, 2008. The results of votes taken among shareholders on the proposal before them are reported below. Each vote reported represents one dollar of net asset value held on the record date for the meeting.
PROPOSAL 1 |
To elect a Board of Trustees.A |
| # of
Votes | % of
Votes |
James C. Curvey |
Affirmative | 44,485,656,811.55 | 94.702 |
Withheld | 2,488,551,854.62 | 5.298 |
TOTAL | 46,974,208,666.17 | 100.000 |
Dennis J. Dirks |
Affirmative | 44,706,671,638.31 | 95.173 |
Withheld | 2,267,537,027.86 | 4.827 |
TOTAL | 46,974,208,666.17 | 100.000 |
Edward C. Johnson 3d |
Affirmative | 44,294,881,638.16 | 94.296 |
Withheld | 2,679,327,028.01 | 5.704 |
TOTAL | 46,974,208,666.17 | 100.000 |
Alan J. Lacy |
Affirmative | 44,685,373,413.16 | 95.127 |
Withheld | 2,288,835,253.01 | 4.873 |
TOTAL | 46,974,208,666.17 | 100.000 |
Ned C. Lautenbach |
Affirmative | 44,634,541,379.41 | 95.019 |
Withheld | 2,339,667,286.76 | 4.981 |
TOTAL | 46,974,208,666.17 | 100.000 |
Joseph Mauriello |
Affirmative | 44,683,962,099.80 | 95.124 |
Withheld | 2,290,246,566.37 | 4.876 |
TOTAL | 46,974,208,666.17 | 100.000 |
Cornelia M. Small |
Affirmative | 44,671,688,375.36 | 95.098 |
Withheld | 2,302,520,290.81 | 4.902 |
TOTAL | 46,974,208,666.17 | 100.000 |
| # of
Votes | % of
Votes |
William S. Stavropoulos |
Affirmative | 44,465,262,087.61 | 94.659 |
Withheld | 2,508,946,578.56 | 5.341 |
TOTAL | 46,974,208,666.17 | 100.000 |
David M. Thomas |
Affirmative | 44,694,340,813.87 | 95.147 |
Withheld | 2,279,867,852.30 | 4.853 |
TOTAL | 46,974,208,666.17 | 100.000 |
Michael E. Wiley |
Affirmative | 44,686,513,174.78 | 95.130 |
Withheld | 2,287,695,491.39 | 4.870 |
TOTAL | 46,974,208,666.17 | 100.000 |
A Denotes trust-wide proposal and voting results.
Annual Report
Proxy Voting Results
A special meeting of the fund's shareholders was held on December 13, 2007. The results of votes taken among shareholders on the proposals before them are reported below. Each vote reported represents one dollar of net asset value held on the record date for the meeting.
PROPOSAL 1 |
To amend the Declaration of Trust to reduce the required quorum for shareholder meetings.A |
| # of
Votes | % of
Votes |
Affirmative | 45,014,793,255.82 | 80.372 |
Against | 6,871,112,667.08 | 12.268 |
Abstain | 2,163,456,438.02 | 3.863 |
Broker
Non-Votes | 1,958,633,563.89 | 3.497 |
TOTAL | 56,007,995,924.81 | 100.000 |
PROPOSAL 2 |
To elect the nominees specified below as Trustees.A |
James C. Curvey |
Affirmative | 53,384,952,361.03 | 95.317 |
Withheld | 2,623,043,563.78 | 4.683 |
TOTAL | 56,007,995,924.81 | 100.000 |
Dennis J. Dirks |
Affirmative | 53,595,104,608.67 | 95.692 |
Withheld | 2,412,891,316.14 | 4.308 |
TOTAL | 56,007,995,924.81 | 100.000 |
Albert R. Gamper, Jr. |
Affirmative | 53,570,235,221.69 | 95.647 |
Withheld | 2,437,760,703.12 | 4.353 |
TOTAL | 56,007,995,924.81 | 100.000 |
George H. Heilmeier |
Affirmative | 53,166,350,588.50 | 94.926 |
Withheld | 2,841,645,336.31 | 5.074 |
TOTAL | 56,007,995,924.81 | 100.000 |
Edward C. Johnson 3d |
Affirmative | 53,230,508,654.93 | 95.041 |
Withheld | 2,777,487,269.88 | 4.959 |
TOTAL | 56,007,995,924.81 | 100.000 |
| # of
Votes | % of
Votes |
James H. Keyes |
Affirmative | 53,549,161,456.52 | 95.610 |
Withheld | 2,458,834,468.29 | 4.390 |
TOTAL | 56,007,995,924.81 | 100.000 |
Marie L. Knowles |
Affirmative | 53,543,925,066.86 | 95.601 |
Withheld | 2,464,070,857.95 | 4.399 |
TOTAL | 56,007,995,924.81 | 100.000 |
Ned C. Lautenbach |
Affirmative | 53,547,116,322.50 | 95.606 |
Withheld | 2,460,879,602.31 | 4.394 |
TOTAL | 56,007,995,924.81 | 100.000 |
Cornelia M. Small |
Affirmative | 53,564,793,514.25 | 95.638 |
Withheld | 2,443,202,410.56 | 4.362 |
TOTAL | 56,007,995,924.81 | 100.000 |
William S. Stavropoulos |
Affirmative | 53,426,544,502.76 | 95.391 |
Withheld | 2,581,451,422.05 | 4.609 |
TOTAL | 56,007,995,924.81 | 100.000 |
Kenneth L. Wolfe |
Affirmative | 53,229,881,790.63 | 95.040 |
Withheld | 2,778,114,134.18 | 4.960 |
TOTAL | 56,007,995,924.81 | 100.000 |
A Denotes trust-wide proposal and voting results.
Annual Report
Board Approval of Investment Advisory Contracts and Management Fees
Fidelity International Small Cap Opportunities Fund
Each year, typically in July, the Board of Trustees, including the Independent Trustees (together, the Board), votes on the renewal of the management contract and sub-advisory agreements (together, the Advisory Contracts) for the fund. The Board, assisted by the advice of fund counsel and Independent Trustees' counsel, requests and considers a broad range of information throughout the year.
The Board meets regularly and, acting directly and through its separate committees, requests and receives information concerning, and considers at each of its meetings factors that are relevant to, its annual consideration of the renewal of the fund's Advisory Contracts, including the services and support provided to the fund and its shareholders. At the time of the renewal, the Board had 12 standing committees, each composed of Independent Trustees with varying backgrounds, to which the Board has assigned specific subject matter responsibilities in order to enhance effective decision-making by the Board. Each committee has a written charter outlining the structure and purposes of the committee. The Board also meets as needed to consider matters specifically related to the Board's annual consideration of the renewal of Advisory Contracts.
At its July 2008 meeting, the Board of Trustees, including the Independent Trustees, unanimously determined to renew the fund's Advisory Contracts. In reaching its determination, the Board considered all factors it believed relevant, including (i) the nature, extent, and quality of the services to be provided to the fund and its shareholders (including the investment performance of the fund); (ii) the competitiveness of the fund's management fee and total expenses; (iii) the total costs of the services to be provided by and the profits to be realized by Fidelity from its relationship with the fund; (iv) the extent to which economies of scale would be realized as the fund grows; and (v) whether fee levels reflect these economies of scale, if any, for the benefit of fund shareholders. The Board also approved agreements with foreign sub-advisers Fidelity Management & Research (Japan) Inc. and Fidelity Management & Research (Hong Kong) Limited, as well as amendments to the fund's agreement with Fidelity Management & Research (U.K.) Inc.
In considering whether to renew the Advisory Contracts for the fund, the Board ultimately reached a determination, with the assistance of fund counsel and Independent Trustees' counsel and through the exercise of its business judgment, that the renewal of the Advisory Contracts and the compensation to be received by Fidelity under the management contract is consistent with Fidelity's fiduciary duty under applicable law. The Board's decision to renew the Advisory Contracts was not based on any single factor noted above, but rather was based on a comprehensive consideration of all the information provided to the Board at its meetings throughout the year. The Board, in reaching its determination to renew the Advisory Contracts, is aware that shareholders in the fund have a broad range of investment choices available to them, including a wide choice among mutual funds offered by competitors to Fidelity, and that the fund's shareholders, with the opportunity to review and weigh the disclosure provided by the fund in its prospectus and other public disclosures, have chosen to invest in this fund, managed by Fidelity.
Annual Report
Nature, Extent, and Quality of Services Provided. The Board considered staffing within the investment adviser, FMR, and the sub-advisers (together, the Investment Advisers), including the backgrounds of the fund's investment personnel and the fund's investment objective and discipline. The Independent Trustees also had discussions with senior management of Fidelity's investment operations and investment groups. The Board considered the structure of the portfolio manager compensation program and whether this structure provides appropriate incentives.
Resources Dedicated to Investment Management and Support Services. The Board reviewed the size, education, and experience of the Investment Advisers' investment staff, their use of technology, and the Investment Advisers' approach to recruiting, training, and retaining portfolio managers and other research, advisory, and management personnel. The Board noted that Fidelity's analysts have access to a variety of technological tools that enable them to perform both fundamental and quantitative analysis and to specialize in various disciplines. The Board considered Fidelity's extensive global research capabilities that enable the Investment Advisers to aggregate data from various sources in an effort to produce positive investment results. The Board also considered that Fidelity's portfolio managers and analysts have access to daily portfolio attribution that allows for monitoring of a fund's portfolio, as well as an electronic communication system that provides immediate real-time access to research concerning issuers and credit enhancers.
Shareholder and Administrative Services. The Board considered (i) the nature, extent, quality, and cost of advisory, administrative, distribution, and shareholder services performed by the Investment Advisers and their affiliates under the Advisory Contracts and under separate agreements covering transfer agency, pricing and bookkeeping, and securities lending services for the fund; (ii) the nature and extent of the Investment Advisers' supervision of third party service providers, principally custodians and subcustodians; and (iii) the resources devoted to, and the record of compliance with, the fund's compliance policies and procedures. The Board also reviewed the allocation of fund brokerage, including allocations to brokers affiliated with the Investment Advisers, the use of brokerage commissions to pay fund expenses, and the use of "soft" commission dollars to pay for research services. The Board further considered that Fidelity voluntarily pays for market data out of its own resources.
The Board noted that the growth of fund assets across the complex allows Fidelity to reinvest in the development of services designed to enhance the value or convenience of the Fidelity funds as investment vehicles. These services include 24-hour access to account information and market information through phone representatives and over the Internet, and investor education materials and asset allocation tools.
Annual Report
Board Approval of Investment Advisory Contracts and
Management Fees - continued
Investment in a Large Fund Family. The Board considered the benefits to shareholders of investing in a Fidelity fund, including the benefits of investing in a fund that is part of a large family of funds offering a variety of investment disciplines and providing for a large variety of mutual fund investor services. For example, fund shareholders are offered the privilege of exchanging shares of the fund for shares of other Fidelity funds, as set forth in the fund's prospectus, without paying a sales charge. The Board noted that Fidelity has taken a number of actions over the previous year that benefited particular funds, including (i) dedicating additional resources to investment research and to restructure the investment research teams; (ii) contractually agreeing to reduce the management fees on Fidelity's Institutional Money Market Funds and launching Class IV and Institutional Class of certain of these funds; (iii) reducing the transfer agent fees for the Fidelity Select Portfolios and Investor Class of the VIP funds; and (iv) launching Class K of 29 equity funds as a lower-fee class available to certain employer-sponsored retirement plans.
Investment Performance. The Board considered whether the fund has operated within its investment objective, as well as its record of compliance with its investment restrictions. It also reviewed the fund's absolute investment performance for each class, as well as the fund's relative investment performance for each class measured against (i) a broad-based securities market index, and (ii) a peer group of mutual funds deemed appropriate by the Board. Because the fund had been in existence less than three calendar years, the following chart considered by the Board shows, for the one-year period ended December 31, 2007, the total returns of Institutional Class (Class I) and Class B of the fund, the total return of a broad-based securities market index ("benchmark"), and a range of total returns of a peer group of mutual funds identified by Lipper Inc. as having an investment objective similar to that of the fund. The returns of Institutional Class (Class I) and Class B show the performance of the highest and lowest performing classes, respectively. The box within the chart shows the 25th percentile return (bottom of box) and the 75th percentile return (top of box) of the peer group. Returns shown above the box are in the first quartile and returns shown below the box are in the fourth quartile. The percentage beaten numbers noted below the chart correspond to the percentile box and represent the percentage of funds in the peer group whose performance was equal to or lower than that of the class indicated.
Annual Report
Fidelity International Small Cap Opportunities Fund

The Board reviewed the fund's relative investment performance against its peer group and stated that the performance of Institutional Class (Class I) of the fund was in the third quartile for the period shown. The Board also stated that the investment performance of Institutional Class (Class I) of the fund compared favorably to its benchmark for the period shown. The Board considered that the variations in performance among the fund's classes reflect the variations in class expenses, which result in lower performance for higher expense classes. The Board stated that it is difficult to evaluate in any comprehensive fashion the performance of the fund, in light of its relatively recent commencement of operations.
The Board also considered that the fund's management fee is subject to upward or downward adjustment depending upon whether, and to what extent, the fund's investment performance for the performance period exceeds, or is exceeded by, the record (over the same period) of a Board-approved performance adjustment index. The Board realizes that the performance adjustment provides FMR with a strong economic incentive to seek to achieve superior performance for the fund's shareholders and helps to more closely align the interests of FMR and the fund's shareholders.
The Board considered that FMR has taken steps to refocus and strengthen equity research, equity portfolio management, and compliance.
Based on its review, and giving particular weight to the nature and quality of the resources dedicated by the Investment Advisers to maintain and improve relative performance, the Board concluded that the nature, extent, and quality of the services provided to the fund will benefit the fund's shareholders, particularly in light of the Board's view that the fund's shareholders benefit from investing in a fund that is part of a large family of funds offering a variety of investment disciplines and services.
Annual Report
Board Approval of Investment Advisory Contracts and
Management Fees - continued
Competitiveness of Management Fee and Total Fund Expenses. The Board considered the fund's management fee and total expenses compared to "mapped groups" of competitive funds and classes. Fidelity creates "mapped groups" by combining similar Lipper investment objective categories that have comparable management fee characteristics. Combining Lipper investment objective categories aids the Board's management fee and total expense comparisons by broadening the competitive group used for comparison and by reducing the number of universes to which various Fidelity funds are compared. The Board also considered supplemental information about how the fund's management fee and total expenses ranked relative to groups based on Lipper classifications, which take into account a fund's market capitalization and style.
The Board considered two proprietary management fee comparisons for the 12-month (or shorter) periods shown in the chart below. The group of Lipper funds used by the Board for management fee comparisons is referred to below as the "Total Mapped Group" and, for the reasons explained above, is broader than the Lipper peer group used by the Board for performance comparisons. The Total Mapped Group comparison focuses on a fund's standing relative to the total universe of comparable funds available to investors, in terms of gross management fees before expense reimbursements or caps, and without giving effect to the fund's performance adjustment. "TMG %" represents the percentage of funds in the Total Mapped Group that had management fees that were lower than the fund's. For example, a TMG % of 21% means that 79% of the funds in the Total Mapped Group had higher management fees than the fund. The "Asset-Size Peer Group" (ASPG) comparison focuses on a fund's standing relative to non-Fidelity funds similar in size to the fund within the Total Mapped Group. The ASPG represents at least 15% of the funds in the Total Mapped Group with comparable asset size and management fee characteristics, subject to a minimum of 50 funds (or all funds in the Total Mapped Group if fewer than 50). Additional information, such as the ASPG quartile in which the fund's management fee ranked and the impact of the fund's performance adjustment, is also included in the chart and considered by the Board.
Annual Report
Fidelity International Small Cap Opportunities Fund

The Board noted that the fund's management fee ranked below the median of its Total Mapped Group and below the median of its ASPG for 2007. The Board also noted the effect of the fund's positive performance adjustment on the fund's management fee ranking. The Board noted that the performance adjustment for each year represents calculations for performance periods that differ from the period shown in the performance chart above.
Based on its review, the Board concluded that the fund's management fee was fair and reasonable in light of the services that the fund receives and the other factors considered.
In its review of each class's total expenses, the Board considered the fund's management fee as well as other fund or class expenses, as applicable, such as transfer agent fees, pricing and bookkeeping fees, fund-paid 12b-1 fees, and custodial, legal, and audit fees. The Board also noted the effects of any waivers and reimbursements on fees and expenses, as well as the impact of the fund's performance adjustment. As part of its review, the Board also considered current and historical total expenses of each class of the fund compared to competitive fund median expenses. Each class of the fund is compared to those funds and classes in the Total Mapped Group (used by the Board for management fee comparisons) that have a similar sales load structure.
The Board noted that the total expenses of each of Class A, Class B, Class C, Institutional Class, and Fidelity International Small Cap Opportunities (retail class) ranked below its competitive median for 2007, and the total expenses of Class T ranked above its competitive median for 2007. The Board considered that the total expenses of Class T were above the median primarily because its 12b-1 fee is higher than the typical front-end load class. The Board noted that the fund offers multiple classes, each of which has a different sales load and 12b-1 fee structure, and that the multiple structures are intended to offer a range of pricing options for the intermediary market. The Board also noted that the total expenses of the classes vary primarily by the level of their 12b-1 fees, although differences in transfer agent fees may also cause expenses to vary from class to class.
Annual Report
Board Approval of Investment Advisory Contracts and
Management Fees - continued
In its review of total expenses, the Board also considered Fidelity fee structures and other information on clients that FMR and its affiliates service in other competitive markets, such as other mutual funds advised or subadvised by FMR or its affiliates, pension plan clients, and other institutional clients.
Based on its review, the Board concluded that the total expenses of each class of the fund were reasonable, although in one case above the median of the universe presented for comparison, in light of the services that the fund and its shareholders receive and the other factors considered.
Costs of the Services and Profitability. The Board considered the revenues earned and the expenses incurred by Fidelity in conducting the business of developing, marketing, distributing, managing, administering and servicing the fund and its shareholders. The Board also considered the level of Fidelity's profits in respect of all the Fidelity funds.
On an annual basis, FMR presents to the Board Fidelity's profitability for the fund. Fidelity calculates the profitability for each fund, as well as aggregate profitability for groups of Fidelity funds and all Fidelity funds, using a series of detailed revenue and cost allocation methodologies which originate with the audited books and records of Fidelity. The Audit Committee of the Board reviews any significant changes from the prior year's methodologies.
PricewaterhouseCoopers LLP (PwC), independent registered public accounting firm and auditor to Fidelity and certain Fidelity funds, has been engaged annually by the Board as part of the Board's assessment of the results of Fidelity's profitability analysis. PwC's engagement includes the review and assessment of Fidelity's methodologies used in determining the revenues and expenses attributable to Fidelity's mutual fund business, and completion of agreed-upon procedures surrounding the mathematical accuracy of fund profitability and its conformity to allocation methodologies. After considering PwC's reports issued under the engagement and information provided by Fidelity, the Board believes that while other allocation methods may also be reasonable, Fidelity's profitability methodologies are reasonable in all material respects.
The Board has also reviewed Fidelity's non-fund businesses and any fall-out benefits related to the mutual fund business as well as cases where Fidelity's affiliates may benefit from or be related to the fund's business.
Annual Report
The Board considered the costs of the services provided by and the profits realized by Fidelity in connection with the operation of the fund and determined that the amount of profit is a fair entrepreneurial profit for the management of the fund.
Economies of Scale. The Board considered whether there have been economies of scale in respect of the management of the Fidelity funds, whether the Fidelity funds (including the fund) have appropriately benefited from any such economies of scale, and whether there is potential for realization of any further economies of scale. The Board considered the extent to which the fund will benefit from economies of scale through increased services to the fund, through waivers or reimbursements, or through fee or expense reductions.
The Board recognized that the fund's management contract incorporates a "group fee" structure, which provides for lower group fee rates as total fund assets under FMR's management increase, and for higher group fee rates as total fund assets under FMR's management decrease. FMR determines the group fee rates based on a tiered asset "breakpoint" schedule. The Board considered that the group fee is designed to deliver the benefits of economies of scale to fund shareholders when total fund assets increase, even if assets of any particular fund are unchanged or have declined, because some portion of Fidelity's costs are attributable to services provided to all Fidelity funds, and all funds benefit if those costs can be allocated among more assets. The Board concluded that, given the group fee structure, fund shareholders will achieve a certain level of economies of scale as assets under FMR's management increase at the fund complex level, regardless of whether Fidelity achieves any such economies of scale.
The Board further concluded that any potential economies of scale are being shared between fund shareholders and Fidelity in an appropriate manner.
Additional Information Requested by the Board. In order to develop fully the factual basis for consideration of the Fidelity funds' Advisory Contracts, the Board requested and received additional information on certain topics, including (i) fund performance trends and actions to be taken by FMR to improve certain funds' overall performance; (ii) portfolio manager changes that have occurred during the past year; (iii) Fidelity's fund profitability methodology, the profitability of certain fund service providers, and profitability trends for certain funds; (iv) Fidelity's compensation structure for portfolio managers and key personnel, including its effects on fund profitability and the extent to which portfolio manager compensation is linked to fund performance; (v) Fidelity's fee structures and rationale for recommending different fees among categories of funds; and (vi) Fidelity's rationale for recommending which funds should have a performance adjustment component as part of their management fees.
Based on its evaluation of all of the conclusions noted above, and after considering all material factors, the Board ultimately concluded that the advisory fee structures are fair and reasonable, and that the fund's Advisory Contracts should be renewed.
Annual Report
Investment Adviser
Fidelity Management & Research Company
Boston, MA
Investment Sub-Advisers
FMR Co., Inc.
Fidelity Management & Research
(Hong Kong) Limited
Fidelity Management & Research
(Japan) Inc.
Fidelity Management & Research
(U.K.) Inc.
Fidelity Research & Analysis Company
FIL Investment Advisors
Fidelity Investments Japan Limited
FIL Investment Advisors (U.K.) Ltd.
General Distributor
Fidelity Distributors Corporation
Boston, MA
Transfer and Service Agents
Fidelity Investments Institutional
Operations Company, Inc.
Boston, MA
Fidelity Service Company, Inc.
Boston, MA
Custodian
The Northern Trust Company
Chicago, IL
AILS-UANN-1208
1.815089.103
(Fidelity Investment logo)(registered trademark)
Fidelity Advisor
International Small Cap Opportunities
Fund - Institutional Class
Annual Report
October 31, 2008
Institutional Class
is a class of Fidelity®
International Small Cap
Opportunities Fund
(2_fidelity_logos) (Registered_Trademark)
Contents
Chairman's Message | <Click Here> | Ned Johnson's message to shareholders. |
Performance | <Click Here> | How the fund has done over time. |
Managements' Discussion | <Click Here> | The managers' review of fund performance, strategy and outlook. |
Shareholder Expense Example | <Click Here> | An example of shareholder expenses. |
Investment Changes | <Click Here> | A summary of major shifts in the fund's investments over the past six months. |
Investments | <Click Here> | A complete list of the fund's investments with their market values. |
Financial Statements | <Click Here> | Statements of assets and liabilities, operations, and changes in net assets, as well as financial highlights. |
Notes | <Click Here> | Notes to the financial statements. |
Report of Independent Registered Public Accounting Firm | <Click Here> | |
Trustees and Officers | <Click Here> | |
Distributions | <Click Here> | |
Proxy Voting Results | <Click Here> | |
Board Approval of Investment Advisory Contracts and Management Fees | <Click Here> | |
To view a fund's proxy voting guidelines and proxy voting record for the 12-month period ended June 30, visit http://www.fidelity.com (search for "proxy voting guidelines") or visit the Securities and Exchange Commission's (SEC) web site at http://www.sec.gov. You may also call 1-877-208-0098 to request a free copy of the proxy voting guidelines.
Standard & Poor's, S&P and S&P 500 are registered service marks of The McGraw-Hill Companies, Inc. and have been licensed for use by Fidelity Distributors Corporation.
Other third party marks appearing herein are the property of their respective owners.
All other marks appearing herein are registered or unregistered trademarks or service marks of FMR LLC or an affiliated company.
Annual Report
This report and the financial statements contained herein are submitted for the general information of the shareholders of the fund. This report is not authorized for distribution to prospective investors in the fund unless preceded or accompanied by an effective prospectus.
A fund files its complete schedule of portfolio holdings with the SEC for the first and third quarters of each fiscal year on Form N-Q. Forms N-Q are available on the SEC's web site at http://www.sec.gov. A fund's Forms N-Q may be reviewed and copied at the SEC's Public Reference Room in Washington, DC. Information regarding the operation of the SEC's Public Reference Room may be obtained by calling 1-800-SEC-0330. For a complete list of a fund's portfolio holdings, view the most recent holdings listing, semiannual report, or annual report on Fidelity's web site at http://www.fidelity.com or http://www.advisor.fidelity.com, as applicable.
NOT FDIC INSURED · MAY LOSE VALUE · NO BANK GUARANTEE
Neither the fund nor Fidelity Distributors Corporation is a bank.
Annual Report
(photo_of_Edward_C_Johnson_3d)
Dear Shareholder:
Turmoil has been the watchword for the world's securities markets in 2008, with domestic and international stocks down sharply amid the global credit squeeze. A flight to quality boosted returns for U.S. Treasuries, one of the few asset classes with positive results heading into the latter stages of the year. Financial markets are always unpredictable, but there are a number of time-tested principles that can put the historical odds in your favor.
One of the basic tenets is to invest for the long term. Over time, riding out the markets' inevitable ups and downs has proven much more effective than selling into panic or chasing the hottest trend. Even missing only a few of the markets' best days can significantly diminish investor returns. Patience also affords the benefits of compounding - of earning interest on additional income or reinvested dividends and capital gains. There are tax advantages and cost benefits to consider as well. The more you sell, the more taxes you pay, and the more you trade, the higher the costs. While staying the course doesn't eliminate risk, it can considerably lessen the effect of short-term declines.
You can further manage your investing risk through diversification. And today, more than ever, geographic diversification should be taken into account. Studies indicate that asset allocation is the single most important determinant of a portfolio's long-term success. The right mix of stocks, bonds and cash - aligned to your particular risk tolerance and investment objective - is very important. Age-appropriate rebalancing is also an essential aspect of asset allocation. For younger investors, an emphasis on equities - which historically have been the best-performing asset class over time - is encouraged. As investors near their specific goal, such as retirement or sending a child to college, consideration may be given to replacing volatile assets (e.g. common stocks) with more-stable fixed investments (bonds or savings plans).
A third investment principle - investing regularly - can help lower the average cost of your purchases. Investing a certain amount of money each month or quarter helps ensure you won't pay for all your shares at market highs. This strategy - known as dollar cost averaging - also reduces unconstructive "emotion" from investing, helping shareholders avoid selling weak performers just prior to an upswing, or chasing a hot performer just before a correction.
We invite you to contact us via the Internet, through our Investor Centers or over the phone. It is our privilege to provide you the information you need to make the investments that are right for you.
Sincerely,
/s/Edward C. Johnson 3d
Edward C. Johnson 3d
Annual Report
Average annual total return reflects the change in the value of an investment, assuming reinvestment of the class' dividend income and capital gains (the profits earned upon the sale of securities that have grown in value, if any) and assuming a constant rate of performance each year. The $10,000 table and the fund's returns do not reflect the deduction of taxes that a shareholder would pay on fund distributions or the redemption of fund shares. During periods of reimbursement by Fidelity, a fund's total return will be greater than it would be had the reimbursement not occurred. How a fund did yesterday is no guarantee of how it will do tomorrow.
Average Annual Total Returns
Periods ended October 31, 2008 | Past 1
year | Life of
fund A |
Institutional Class | -62.95% | -10.10% |
A From August 2, 2005.
$10,000 Over Life of Fund
Let's say hypothetically that $10,000 was invested in Fidelity Advisor International Small Cap Opportunities Fund - Institutional Class on August 2, 2005, when the fund started. The chart shows how the value of your investment would have changed, and also shows how the MSCI® Europe, Australasia, Far East (MSCI EAFE®) Small Cap Index performed over the same period.
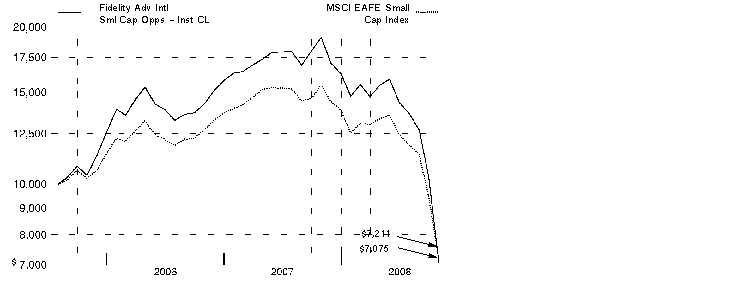
Annual Report
Comments from Andrew Sassine, Portfolio Manager of Fidelity Advisor International Small Cap Opportunities Fund during the period covered in this report
In a dramatic reversal of what had been a multiyear global growth story, international stocks fell long and hard during the 12 months ending October 31, 2008, especially so during the latter stages of the period and mostly as a result of fallout from the financial crisis that emanated from the United States. The viral spread of this financial contagion - which began in the U.S. subprime mortgage market, then seized up the credit markets, hobbled major financial institutions and eventually slowed economic growth worldwide - left virtually no corner of the globe untouched. Developed international equity markets - as gauged by the MSCI® Europe, Australasia, Far East (EAFE®) Index, which monitors established markets outside the U.S. and Canada - fell 46.54%, while the Standard & Poor's 500SM Index, a measure of U.S. stocks, dropped 36.10%. Among countries constituting at least 1% of the EAFE index, Switzerland had the "least worst" showing, falling roughly 32%, followed by Japan, where stocks slid by around 37%. Meanwhile, the weakest overall performance came from Belgium, where stocks slipped by nearly 70%. In the United Kingdom, the largest component of the index, equities were down almost 48%. Emerging markets were the weakest performers among the global economies, declining 56.22% as measured by the MSCI Emerging Markets Index.
For the year, the fund's Institutional Class shares returned -62.95%, compared with -53.46% for the MSCI EAFE Small Cap Index. Stock selection in materials and consumer staples detracted from relative performance, as did weak results in financials and information technology. However, our holdings in the consumer discretionary sector aided the fund's performance. Security selection in Japan and Norway detracted, while underweightings in Greece, Denmark, Spain and Singapore helped. A cash position also aided returns. Babcock & Brown, an Australian global alternative asset manager, was hurt by the credit crisis. In materials, Papua New Guinea-based Lihir Gold also detracted from performance. Marine Harvest, a Norwegian salmon farmer, fell, as did Renovo Group, a U.K.-based biotechnology firm. Netherlands-based Gemalto, a secure personal devices manufacturer, buoyed performance, so did Chiquita Brands, a U.S. food products distributor. Rakuten, a Japanese Internet services company, also rose. Many of the stocks I've mentioned were out-of-index holdings.
Note to shareholders: Jed Weiss will become Portfolio Manager on December 4, 2008.
The views expressed above reflect those of the portfolio manager(s) only through the end of the period as stated on the cover of this report and do not necessarily represent the views of Fidelity or any other person in the Fidelity organization. Any such views are subject to change at any time based upon market or other conditions and Fidelity disclaims any responsibility to update such views. These views may not be relied on as investment advice and, because investment decisions for a Fidelity fund are based on numerous factors, may not be relied on as an indication of trading intent on behalf of any Fidelity fund.
Annual Report
Shareholder Expense Example
As a shareholder of the Fund, you incur two types of costs: (1) transaction costs, including sales charges (loads) on purchase payments or redemption proceeds, redemption fees, and (2) ongoing costs, including management fees, distribution and/or service (12b-1) fees and other Fund expenses. This Example is intended to help you understand your ongoing costs (in dollars) of investing in the Fund and to compare these costs with the ongoing costs of investing in other mutual funds.
The Example is based on an investment of $1,000 invested at the beginning of the period and held for the entire period (May 1, 2008 to October 31, 2008).
Actual Expenses
The first line of the accompanying table for each class of the Fund provides information about actual account values and actual expenses. You may use the information in this line, together with the amount you invested, to estimate the expenses that you paid over the period. Simply divide your account value by $1,000.00 (for example, an $8,600 account value divided by $1,000.00 = 8.6), then multiply the result by the number in the first line for a class of the Fund under the heading entitled "Expenses Paid During Period" to estimate the expenses you paid on your account during this period. A small balance maintenance fee of $12.00 that is charged once a year may apply for certain accounts with a value of less than $2,000. This fee is not included in the table below. If it was, the estimate of expenses you paid during the period would be higher, and your ending account value lower, by this amount. In addition, the Fund, as a shareholder in the underlying Fidelity Central Funds, will indirectly bear its pro rata share of the fees and expenses incurred by the underlying Fidelity Central Funds. These fees and expenses are not included in the Fund's annualized expense ratio used to calculate the expense estimate in the table below.
Hypothetical Example for Comparison Purposes
The second line of the accompanying table for each class of the Fund provides information about hypothetical account values and hypothetical expenses based on a Class' actual expense ratio and an assumed rate of return of 5% per year before expenses, which is not the Class' actual return. The hypothetical account values and expenses may not be used to estimate the actual ending account balance or expenses you paid for the period. You may use this information to compare the ongoing costs of investing in the Fund and other funds. To do so, compare this 5% hypothetical example with the 5% hypothetical examples that appear in the shareholder reports of the other funds. A small balance maintenance fee of $12.00 that is charged once a year may apply for certain accounts with a value of less than $2,000. This fee is not included in the table below. If it was, the estimate of expenses you paid during the period would be higher, and your ending account value lower, by this amount. In addition, the Fund, as a shareholder in the underlying Fidelity Central Funds, will indirectly bear its pro rata share of the fees and expenses incurred by the underlying Fidelity Central Funds. These fees and expenses are not included in the Fund's annualized expense ratio used to calculate the expense estimate in the table below.
Please note that the expenses shown in the table are meant to highlight your ongoing costs only and do not reflect any transaction costs. Therefore, the second line of the table is useful in comparing ongoing costs only, and will not help you determine the relative total costs of owning different funds. In addition, if these transactional costs were included, your costs would have been higher.
Annual Report
|
Annualized Expense Ratio
|
Beginning
Account Value
May 1, 2008
|
Ending
Account Value
October 31, 2008
| Expenses Paid
During Period*
May 1, 2008 to
October 31, 2008 |
Class A | 1.65% | | | |
Actual | | $ 1,000.00 | $ 457.50 | $ 6.05 |
HypotheticalA | | $ 1,000.00 | $ 1,016.84 | $ 8.36 |
Class T | 1.90% | | | |
Actual | | $ 1,000.00 | $ 456.90 | $ 6.96 |
HypotheticalA | | $ 1,000.00 | $ 1,015.58 | $ 9.63 |
Class B | 2.40% | | | |
Actual | | $ 1,000.00 | $ 455.00 | $ 8.78 |
HypotheticalA | | $ 1,000.00 | $ 1,013.07 | $ 12.14 |
Class C | 2.40% | | | |
Actual | | $ 1,000.00 | $ 455.00 | $ 8.78 |
HypotheticalA | | $ 1,000.00 | $ 1,013.07 | $ 12.14 |
International Small Cap Opportunities | 1.44% | | | |
Actual | | $ 1,000.00 | $ 457.70 | $ 5.28 |
HypotheticalA | | $ 1,000.00 | $ 1,017.90 | $ 7.30 |
Institutional Class | 1.40% | | | |
Actual | | $ 1,000.00 | $ 457.30 | $ 5.13 |
HypotheticalA | | $ 1,000.00 | $ 1,018.10 | $ 7.10 |
A 5% return per year before expenses
* Expenses are equal to each Class' annualized expense ratio, multiplied by the average account value over the period, multiplied by 184/366 (to reflect the one-half year period).
Annual Report
Investment Changes (Unaudited)
Geographic Diversification (% of fund's net assets) |
As of October 31, 2008 |
| Japan 15.4% |
| United Kingdom 13.6% |
| China 9.2% |
| Netherlands 7.6% |
| Cayman Islands 7.5% |
| United States of America 7.3% |
| Papua New Guinea 7.3% |
| Australia 6.4% |
| Germany 6.4% |
| Other 19.3% |
Percentages are adjusted for the effect of futures contracts, if applicable. |
|
As of April 30, 2008 |
| Japan 25.1% |
| United Kingdom 8.6% |
| Germany 7.3% |
| Netherlands 6.8% |
| United States of America 6.6% |
| China 6.3% |
| Cayman Islands 5.9% |
| Norway 5.9% |
| Papua New Guinea 5.9% |
| Other 21.6% |

Percentages are adjusted for the effect of futures contracts, if applicable. |
Asset Allocation |
| % of fund's
net assets | % of fund's net assets
6 months ago |
Stocks | 98.9 | 98.6 |
Short-Term Investments and Net Other Assets | 1.1 | 1.4 |
Top Ten Stocks as of October 31, 2008 |
| % of fund's
net assets | % of fund's net assets
6 months ago |
Lihir Gold Ltd. (Papua New Guinea, Metals & Mining) | 7.3 | 5.9 |
Gemalto NV (Netherlands, Computers & Peripherals) | 4.9 | 2.0 |
Himax Technologies, Inc. sponsored ADR (Cayman Islands, Semiconductors & Semiconductor Equipment) | 4.2 | 3.9 |
Chiquita Brands International, Inc. (United States of America, Food Products) | 4.1 | 2.4 |
BB BIOTECH AG (Switzerland, Biotechnology) | 3.5 | 1.5 |
HannStar Display Corp. (Taiwan, Electronic Equipment & Components) | 3.2 | 2.7 |
GEA Group AG (Germany, Machinery) | 3.1 | 2.9 |
Focus Media Holding Ltd. ADR (China, Media) | 2.8 | 1.3 |
EFG International (Switzerland, Capital Markets) | 2.7 | 0.0 |
Autonomy Corp. PLC (United Kingdom, Software) | 2.7 | 1.0 |
| 38.5 | |
Market Sectors as of October 31, 2008 |
| % of fund's
net assets | % of fund's net assets
6 months ago |
Information Technology | 27.5 | 24.0 |
Industrials | 21.5 | 27.8 |
Materials | 11.3 | 11.0 |
Financials | 10.5 | 9.7 |
Consumer Staples | 10.6 | 14.1 |
Consumer Discretionary | 9.5 | 5.8 |
Health Care | 6.5 | 4.2 |
Energy | 1.0 | 2.0 |
Utilities | 0.5 | 0.0 |
Annual Report
Investments October 31, 2008
Showing Percentage of Net Assets
Common Stocks - 98.9% |
| Shares | | Value |
Australia - 6.4% |
Babcock & Brown Ltd. (d) | 2,582,465 | | $ 2,255,477 |
Babcock & Brown Wind Partners | 3,000,000 | | 1,678,673 |
Downer EDI Ltd. | 2,930,464 | | 9,511,882 |
Newcrest Mining Ltd. | 300,000 | | 4,121,771 |
Silex Systems Ltd. (a)(d) | 816,160 | | 2,125,030 |
Sino Gold Mining Ltd. (a) | 1,580,111 | | 3,637,557 |
TOTAL AUSTRALIA | | 23,330,390 |
Austria - 0.6% |
Andritz AG | 79,996 | | 2,278,136 |
Bermuda - 0.8% |
Noble Group Ltd. | 3,841,000 | | 2,796,019 |
Cayman Islands - 7.5% |
CNinsure, Inc. ADR (d) | 409,600 | | 3,579,904 |
Himax Technologies, Inc. sponsored ADR | 8,253,009 | | 15,433,127 |
LDK Solar Co. Ltd. sponsored ADR (a)(d) | 451,300 | | 8,195,608 |
TOTAL CAYMAN ISLANDS | | 27,208,639 |
China - 9.2% |
BYD Co. Ltd. (H Shares) | 3,229,500 | | 5,488,922 |
China TechFaith Wireless Communication Technology Ltd. sponsored ADR (a) | 1,801,341 | | 1,603,193 |
Focus Media Holding Ltd. ADR (a)(d) | 555,800 | | 10,298,974 |
Global Bio-Chem Technology Group Co. Ltd. | 50,703,300 | | 7,066,410 |
Shanda Interactive Entertainment Ltd. sponsored ADR (a)(d) | 325,000 | | 8,986,250 |
TOTAL CHINA | | 33,443,749 |
Finland - 0.4% |
KCI Konecranes Oyj | 84,000 | | 1,427,454 |
France - 1.5% |
Nexans SA | 46,874 | | 2,673,689 |
Ubisoft Entertainment SA (a) | 48,569 | | 2,567,318 |
TOTAL FRANCE | | 5,241,007 |
Germany - 6.4% |
Demag Cranes AG | 50,000 | | 973,188 |
GEA Group AG | 762,600 | | 11,144,590 |
Q-Cells AG (a)(d) | 76,985 | | 3,028,610 |
Symrise AG | 200,000 | | 2,484,241 |
Vossloh AG | 70,000 | | 5,408,318 |
TOTAL GERMANY | | 23,038,947 |
Common Stocks - continued |
| Shares | | Value |
Italy - 2.5% |
Impregilo SpA (a)(d) | 3,465,200 | | $ 9,140,729 |
Japan - 15.4% |
CyberAgent, Inc. (d) | 4,535 | | 4,048,504 |
Elpida Memory, Inc. (a)(d) | 916,000 | | 4,883,226 |
Hikari Tsushin, Inc. | 150,000 | | 2,238,431 |
Ichiyoshi Securities Co. Ltd. (d) | 661,400 | | 5,295,950 |
JAFCO Co. Ltd. | 124,600 | | 3,353,738 |
Pal Co. Ltd. (d) | 31,850 | | 208,861 |
Promise Co. Ltd. (d) | 291,550 | | 5,232,814 |
Rakuten, Inc. (d) | 18,475 | | 9,158,294 |
SBI Holdings, Inc. | 52,751 | | 6,329,841 |
Sugi Holdings Co. Ltd. (d) | 300,200 | | 7,219,003 |
Sumco Corp. | 599,860 | | 6,495,569 |
Trend Micro, Inc. | 60,000 | | 1,467,708 |
TOTAL JAPAN | | 55,931,939 |
Netherlands - 7.6% |
AMG Advanced Metallurgical Group NV (a)(d) | 265,578 | | 4,298,941 |
Gemalto NV (a) | 632,600 | | 17,723,725 |
Nutreco Holding NV | 24,658 | | 786,186 |
QIAGEN NV (a) | 332,200 | | 4,737,172 |
TOTAL NETHERLANDS | | 27,546,024 |
Norway - 3.7% |
Marine Harvest ASA (a)(d) | 35,659,000 | | 5,759,837 |
Petroleum Geo-Services ASA (a) | 495,500 | | 2,467,297 |
Pronova BioPharma ASA | 1,000,000 | | 2,597,902 |
Renewable Energy Corp. AS (a)(d) | 277,700 | | 2,620,054 |
TOTAL NORWAY | | 13,445,090 |
Papua New Guinea - 7.3% |
Lihir Gold Ltd. (a) | 14,300,867 | | 17,834,905 |
Lihir Gold Ltd. sponsored ADR (a)(d) | 662,200 | | 8,462,916 |
TOTAL PAPUA NEW GUINEA | | 26,297,821 |
Spain - 0.4% |
Prosegur Comp Securidad SA (Reg.) | 50,000 | | 1,420,475 |
Switzerland - 6.2% |
BB BIOTECH AG (d) | 196,970 | | 12,489,540 |
EFG International | 457,120 | | 9,838,583 |
TOTAL SWITZERLAND | | 22,328,123 |
Common Stocks - continued |
| Shares | | Value |
Taiwan - 3.2% |
HannStar Display Corp. | 63,362,704 | | $ 11,525,731 |
United Kingdom - 13.6% |
ARM Holdings PLC sponsored ADR (d) | 1,848,700 | | 8,725,864 |
Autonomy Corp. PLC (a) | 616,700 | | 9,776,980 |
BlueBay Asset Management (d) | 808,100 | | 2,624,170 |
easyJet PLC (a) | 1,800,000 | | 8,978,340 |
Informa PLC | 1,221,200 | | 4,136,877 |
Invensys PLC (a) | 3,190,900 | | 8,000,531 |
Max Petroleum PLC (a) | 4,500,000 | | 972,624 |
Premier Foods PLC | 5,899,300 | | 2,615,460 |
Renovo Group PLC (a) | 8,702,203 | | 3,553,008 |
TOTAL UNITED KINGDOM | | 49,383,854 |
United States of America - 6.2% |
AGCO Corp. (a) | 92,700 | | 2,921,904 |
Chiquita Brands International, Inc. (a)(d) | 1,087,400 | | 14,843,010 |
Virgin Media, Inc. (d) | 800,000 | | 4,608,000 |
TOTAL UNITED STATES OF AMERICA | | 22,372,914 |
TOTAL COMMON STOCKS (Cost $669,718,098) | 358,157,041 |
Money Market Funds - 22.1% |
| | | |
Fidelity Cash Central Fund, 1.81% (b) | 4,789,854 | | 4,789,854 |
Fidelity Securities Lending Cash Central Fund, 2.67% (b)(c) | 75,262,022 | | 75,262,022 |
TOTAL MONEY MARKET FUNDS (Cost $80,051,876) | 80,051,876 |
TOTAL INVESTMENT PORTFOLIO - 121.0% (Cost $749,769,974) | | 438,208,917 |
NET OTHER ASSETS - (21.0)% | | (76,011,757) |
NET ASSETS - 100% | $ 362,197,160 |
Legend |
(a) Non-income producing |
(b) Affiliated fund that is available only to investment companies and other accounts managed by Fidelity Investments. The rate quoted is the annualized seven-day yield of the fund at period end. A complete unaudited listing of the fund's holdings as of its most recent quarter end is available upon request. |
(c) Investment made with cash collateral received from securities on loan. |
(d) Security or a portion of the security is on loan at period end. |
Affiliated Central Funds |
Information regarding fiscal year to date income earned by the Fund from investments in Fidelity Central Funds is as follows: |
Fund | Income earned |
Fidelity Cash Central Fund | $ 465,321 |
Fidelity Securities Lending Cash Central Fund | 3,820,634 |
Total | $ 4,285,955 |
Other Affiliated Issuers |
An affiliated company is a company in which the fund has ownership of at least 5% of the voting securities. Fiscal year to date transactions with companies which are or were affiliates are as follows: |
Affiliate | Value,
beginning of
period | Purchases | Sales
Proceeds | Dividend Income | Value,
end of
period |
First Tractor Co. Ltd. (H Shares) | $ 11,999,397 | $ - | $ 5,122,915 | $ 68,411 | $ - |
Income Tax Information |
At October 31, 2008, the fund had a capital loss carryforward of approximately $146,419,794 all of which will expire on October 31, 2016. |
See accompanying notes which are an integral part of the financial statements.
Annual Report
Statement of Assets and Liabilities
| October 31, 2008 |
| | |
Assets | | |
Investment in securities, at value (including securities loaned of $70,265,441) - See accompanying schedule: Unaffiliated issuers (cost $669,718,098) | $ 358,157,041 | |
Fidelity Central Funds (cost $80,051,876) | 80,051,876 | |
Total Investments (cost $749,769,974) | | $ 438,208,917 |
Foreign currency held at value (cost $160) | | 152 |
Receivable for investments sold | | 1,858,770 |
Receivable for fund shares sold | | 587,971 |
Dividends receivable | | 485,964 |
Distributions receivable from Fidelity Central Funds | | 188,423 |
Receivable from investment adviser for expense reductions | | 15,082 |
Other receivables | | 72,137 |
Total assets | | 441,417,416 |
| | |
Liabilities | | |
Payable for investments purchased | $ 2,718,402 | |
Payable for fund shares redeemed | 702,790 | |
Accrued management fee | 249,739 | |
Distribution fees payable | 21,117 | |
Other affiliated payables | 174,594 | |
Other payables and accrued expenses | 91,592 | |
Collateral on securities loaned, at value | 75,262,022 | |
Total liabilities | | 79,220,256 |
| | |
Net Assets | | $ 362,197,160 |
Net Assets consist of: | | |
Paid in capital | | $ 834,317,445 |
Accumulated undistributed net realized gain (loss) on investments and foreign currency transactions | | (160,554,996) |
Net unrealized appreciation (depreciation) on investments and assets and liabilities in foreign currencies | | (311,565,289) |
Net Assets | | $ 362,197,160 |
See accompanying notes which are an integral part of the financial statements.
Annual Report
Statement of Assets and Liabilities - continued
| October 31, 2008 |
| | |
Calculation of Maximum Offering Price
Class A:
Net Asset Value and redemption price per share ($17,905,406 ÷ 2,871,641 shares) | | $ 6.24 |
| | |
Maximum offering price per share (100/94.25 of $6.24) | | $ 6.62 |
Class T:
Net Asset Value and redemption price per share ($11,614,253 ÷ 1,874,345 shares) | | $ 6.20 |
| | |
Maximum offering price per share (100/96.50 of $6.20) | | $ 6.42 |
Class B:
Net Asset Value and offering price per share ($2,687,045 ÷ 438,825 shares)A | | $ 6.12 |
| | |
Class C:
Net Asset Value and offering price per share ($9,496,686 ÷ 1,553,173 shares)A | | $ 6.11 |
| | |
| | |
International Small Cap Opportunities:
Net Asset Value, offering price and redemption price per share ($312,376,291 ÷ 49,754,757 shares) | | $ 6.28 |
| | |
Institutional Class:
Net Asset Value, offering price and redemption price per share ($8,117,479 ÷ 1,294,002 shares) | | $ 6.27 |
A Redemption price per share is equal to net asset value less any applicable contingent deferred sales charge.
See accompanying notes which are an integral part of the financial statements.
Annual Report
Financial Statements - continued
Statement of Operations
| Year ended October 31, 2008 |
| | |
Investment Income | | |
Dividends (including $68,411 earned from other affiliated issuers) | | $ 14,002,599 |
Interest | | 2,082 |
Income from Fidelity Central Funds (including $3,820,634 from security lending) | | 4,285,955 |
| | 18,290,636 |
Less foreign taxes withheld | | (1,290,068) |
Total income | | 17,000,568 |
| | |
Expenses | | |
Management fee
Basic fee | $ 8,348,490 | |
Performance adjustment | 2,000,573 | |
Transfer agent fees | 2,467,216 | |
Distribution fees | 580,404 | |
Accounting and security lending fees | 491,904 | |
Custodian fees and expenses | 216,963 | |
Independent trustees' compensation | 4,564 | |
Registration fees | 94,266 | |
Audit | 67,068 | |
Legal | 6,317 | |
Interest | 39,161 | |
Miscellaneous | 211,922 | |
Total expenses before reductions | 14,528,848 | |
Expense reductions | (430,556) | 14,098,292 |
Net investment income (loss) | | 2,902,276 |
Realized and Unrealized Gain (Loss) Net realized gain (loss) on: | | |
Investment securities: | | |
Unaffiliated issuers | (153,629,459) | |
Other affiliated issuers | (3,139,491) | |
Foreign currency transactions | 78,947 | |
Total net realized gain (loss) | | (156,690,003) |
Change in net unrealized appreciation (depreciation) on: Investment securities | (647,254,659) | |
Assets and liabilities in foreign currencies | 55,716 | |
Total change in net unrealized appreciation (depreciation) | | (647,198,943) |
Net gain (loss) | | (803,888,946) |
Net increase (decrease) in net assets resulting from operations | | $ (800,986,670) |
See accompanying notes which are an integral part of the financial statements.
Annual Report
Statement of Changes in Net Assets
| Year ended
October 31,
2008 | Year ended
October 31,
2007 |
Increase (Decrease) in Net Assets | | |
Operations | | |
Net investment income (loss) | $ 2,902,276 | $ 5,724,841 |
Net realized gain (loss) | (156,690,003) | 184,590,119 |
Change in net unrealized appreciation (depreciation) | (647,198,943) | 219,203,434 |
Net increase (decrease) in net assets resulting
from operations | (800,986,670) | 409,518,394 |
Distributions to shareholders from net investment income | (4,817,372) | - |
Distributions to shareholders from net realized gain | (154,491,933) | - |
Total distributions | (159,309,305) | - |
Share transactions - net increase (decrease) | (308,489,372) | 127,196,896 |
Redemption fees | 307,719 | 783,954 |
Total increase (decrease) in net assets | (1,268,477,628) | 537,499,244 |
| | |
Net Assets | | |
Beginning of period | 1,630,674,788 | 1,093,175,544 |
End of period (including undistributed net investment income of $0 and undistributed net investment income of $5,724,841, respectively) | $ 362,197,160 | $ 1,630,674,788 |
See accompanying notes which are an integral part of the financial statements.
Annual Report
Financial Highlights - Class A
Years ended October 31, | 2008 | 2007 | 2006 | 2005 H |
Selected Per-Share Data | | | | |
Net asset value, beginning of period | $ 18.97 | $ 14.18 | $ 10.41 | $ 10.00 |
Income from Investment Operations | | | | |
Net investment income (loss) E | .02 | .02 | - J | - J |
Net realized and unrealized gain (loss) | (10.85) | 4.76 | 3.74 | .40 |
Total from investment operations | (10.83) | 4.78 | 3.74 | .40 |
Distributions from net investment income | (.03) | - | - | - |
Distributions from net realized gain | (1.88) | - | - J | - |
Total distributions | (1.90) K | - | - J | - |
Redemption fees added to paid in capital E | - J | .01 | .03 | .01 |
Net asset value, end of period | $ 6.24 | $ 18.97 | $ 14.18 | $ 10.41 |
Total Return B, C, D | (62.98)% | 33.78% | 36.25% | 4.10% |
Ratios to Average Net Assets F, I | | | | |
Expenses before reductions | 1.75% | 1.63% | 1.63% | 2.67% A |
Expenses net of fee waivers, if any | 1.66% | 1.63% | 1.63% | 1.65% A |
Expenses net of all reductions | 1.62% | 1.59% | 1.51% | 1.54% A |
Net investment income (loss) | .13% | .10% | .02% | (.09)% A |
Supplemental Data | | | | |
Net assets, end of period (000 omitted) | $ 17,905 | $ 70,785 | $ 35,674 | $ 5,533 |
Portfolio turnover rate G | 61% | 107% | 164% | 46% |
A Annualized
B Total returns for periods of less than one year are not annualized.
C Total returns would have been lower had certain expenses not been reduced during the periods shown.
D Total returns do not include the effect of the sales charges.
E Calculated based on average shares outstanding during the period.
F Fees and expenses of the underlying Fidelity Central Funds are not included in the Fund's expense ratio. The Fund indirectly bears its proportionate share of the expenses of any underlying Fidelity Central Funds.
G Amount does not include the portfolio activity of any underlying Fidelity Central Funds.
H For the period August 2, 2005 (commencement of operations) to October 31, 2005.
I Expense ratios reflect operating expenses of the class. Expenses before reductions do not reflect amounts reimbursed by the investment adviser or reductions from brokerage service arrangements or other expense offset arrangements and do not represent the amount paid by the class during periods when reimbursements or reductions occur. Expense ratios before reductions for start-up periods may not be representative of longer-term operating periods. Expenses net of fee waivers reflect expenses after reimbursement by the investment adviser but prior to reductions from brokerage service arrangements or other expense offset arrangements. Expenses net of all reductions represent the net expenses paid by the class.
J Amount represents less than $.01 per share.
K Total distributions of $1.903 per share is comprised of distributions from net investment income of $.025 and distributions from net realized gain of $1.878 per share.
See accompanying notes which are an integral part of the financial statements.
Annual Report
Financial Highlights - Class T
Years ended October 31, | 2008 | 2007 | 2006 | 2005 H |
Selected Per-Share Data | | | | |
Net asset value, beginning of period | $ 18.85 | $ 14.12 | $ 10.38 | $ 10.00 |
Income from Investment Operations | | | | |
Net investment income (loss) E | (.02) | (.02) | (.03) | (.01) |
Net realized and unrealized gain (loss) | (10.78) | 4.74 | 3.74 | .38 |
Total from investment operations | (10.80) | 4.72 | 3.71 | .37 |
Distributions from net realized gain | (1.85) K | - | - | - |
Redemption fees added to paid in capital E | - J | .01 | .03 | .01 |
Net asset value, end of period | $ 6.20 | $ 18.85 | $ 14.12 | $ 10.38 |
Total Return B, C, D | (63.08)% | 33.50% | 36.03% | 3.80% |
Ratios to Average Net Assets F, I | | | | |
Expenses before reductions | 2.00% | 1.85% | 1.85% | 2.92% A |
Expenses net of fee waivers, if any | 1.91% | 1.85% | 1.85% | 1.90% A |
Expenses net of all reductions | 1.87% | 1.81% | 1.74% | 1.78% A |
Net investment income (loss) | (.12)% | (.13)% | (.20)% | (.33)% A |
Supplemental Data | | | | |
Net assets, end of period (000 omitted) | $ 11,614 | $ 46,568 | $ 28,309 | $ 2,704 |
Portfolio turnover rate G | 61% | 107% | 164% | 46% |
A Annualized
B Total returns for periods of less than one year are not annualized.
C Total returns would have been lower had certain expenses not been reduced during the periods shown.
D Total returns do not include the effect of the sales charges.
E Calculated based on average shares outstanding during the period.
F Fees and expenses of the underlying Fidelity Central Funds are not included in the Fund's expense ratio. The Fund indirectly bears its proportionate share of the expenses of any underlying Fidelity Central Funds.
G Amount does not include the portfolio activity of any underlying Fidelity Central Funds.
H For the period August 2, 2005 (commencement of operations) to October 31, 2005.
I Expense ratios reflect operating expenses of the class. Expenses before reductions do not reflect amounts reimbursed by the investment adviser or reductions from brokerage service arrangements or other expense offset arrangements and do not represent the amount paid by the class during periods when reimbursements or reductions occur. Expense ratios before reductions for start-up periods may not be representative of longer-term operating periods. Expenses net of fee waivers reflect expenses after reimbursement by the investment adviser but prior to reductions from brokerage service arrangements or other expense offset arrangements. Expenses net of all reductions represent the net expenses paid by the class.
J Amount represents less than $.01 per share.
K Total distributions of $1.852 per share is comprised of distributions from net realized gain of $1.852 per share.
See accompanying notes which are an integral part of the financial statements.
Annual Report
Financial Highlights - Class B
Years ended October 31, | 2008 | 2007 | 2006 | 2005 H |
Selected Per-Share Data | | | | |
Net asset value, beginning of period | $ 18.64 | $ 14.04 | $ 10.37 | $ 10.00 |
Income from Investment Operations | | | | |
Net investment income (loss) E | (.08) | (.11) | (.10) | (.02) |
Net realized and unrealized gain (loss) | (10.68) | 4.70 | 3.74 | .38 |
Total from investment operations | (10.76) | 4.59 | 3.64 | .36 |
Distributions from net realized gain | (1.76) K | - | - | - |
Redemption fees added to paid in capital E | - J | .01 | .03 | .01 |
Net asset value, end of period | $ 6.12 | $ 18.64 | $ 14.04 | $ 10.37 |
Total Return B, C, D | (63.32)% | 32.76% | 35.39% | 3.70% |
Ratios to Average Net Assets F, I | | | | |
Expenses before reductions | 2.51% | 2.40% | 2.45% | 3.43% A |
Expenses net of fee waivers, if any | 2.41% | 2.40% | 2.41% | 2.40% A |
Expenses net of all reductions | 2.38% | 2.36% | 2.30% | 2.27% A |
Net investment income (loss) | (.62)% | (.67)% | (.76)% | (.82)% A |
Supplemental Data | | | | |
Net assets, end of period (000 omitted) | $ 2,687 | $ 10,975 | $ 7,709 | $ 1,705 |
Portfolio turnover rate G | 61% | 107% | 164% | 46% |
A Annualized
B Total returns for periods of less than one year are not annualized.
C Total returns would have been lower had certain expenses not been reduced during the periods shown.
D Total returns do not include the effect of the contingent deferred sales charge.
E Calculated based on average shares outstanding during the period.
F Fees and expenses of the underlying Fidelity Central Funds are not included in the Fund's expense ratio. The Fund indirectly bears its proportionate share of the expenses of any underlying Fidelity Central Funds.
G Amount does not include the portfolio activity of any underlying Fidelity Central Funds.
H For the period August 2, 2005 (commencement of operations) to October 31, 2005.
I Expense ratios reflect operating expenses of the class. Expenses before reductions do not reflect amounts reimbursed by the investment adviser or reductions from brokerage service arrangements or other expense offset arrangements and do not represent the amount paid by the class during periods when reimbursements or reductions occur. Expense ratios before reductions for start-up periods may not be representative of longer-term operating periods. Expenses net of fee waivers reflect expenses after reimbursement by the investment adviser but prior to reductions from brokerage service arrangements or other expense offset arrangements. Expenses net of all reductions represent the net expenses paid by the class.
J Amount represents less than $.01 per share.
K Total distributions of $1.760 per share is comprised of distributions from net realized gain of $1.760 per share.
See accompanying notes which are an integral part of the financial statements.
Annual Report
Financial Highlights - Class C
Years ended October 31, | 2008 | 2007 | 2006 | 2005 H |
Selected Per-Share Data | | | | |
Net asset value, beginning of period | $ 18.63 | $ 14.03 | $ 10.37 | $ 10.00 |
Income from Investment Operations | | | | |
Net investment income (loss) E | (.08) | (.11) | (.10) | (.02) |
Net realized and unrealized gain (loss) | (10.66) | 4.70 | 3.73 | .38 |
Total from investment operations | (10.74) | 4.59 | 3.63 | .36 |
Distributions from net realized gain | (1.78) K | - | - | - |
Redemption fees added to paid in capital E | - J | .01 | .03 | .01 |
Net asset value, end of period | $ 6.11 | $ 18.63 | $ 14.03 | $ 10.37 |
Total Return B, C, D | (63.32)% | 32.79% | 35.29% | 3.70% |
Ratios to Average Net Assets F, I | | | | |
Expenses before reductions | 2.51% | 2.38% | 2.38% | 3.32% A |
Expenses net of fee waivers, if any | 2.41% | 2.38% | 2.38% | 2.40% A |
Expenses net of all reductions | 2.38% | 2.34% | 2.27% | 2.29% A |
Net investment income (loss) | (.62)% | (.66)% | (.73)% | (.84)% A |
Supplemental Data | | | | |
Net assets, end of period (000 omitted) | $ 9,497 | $ 40,894 | $ 26,320 | $ 3,317 |
Portfolio turnover rate G | 61% | 107% | 164% | 46% |
A Annualized
B Total returns for periods of less than one year are not annualized.
C Total returns would have been lower had certain expenses not been reduced during the periods shown.
D Total returns do not include the effect of the contingent deferred sales charge.
E Calculated based on average shares outstanding during the period.
F Fees and expenses of the underlying Fidelity Central Funds are not included in the Fund's expense ratio. The Fund indirectly bears its proportionate share of the expenses of any underlying Fidelity Central Funds.
G Amount does not include the portfolio activity of any underlying Fidelity Central Funds.
H For the period August 2, 2005 (commencement of operations) to October 31, 2005.
I Expense ratios reflect operating expenses of the class. Expenses before reductions do not reflect amounts reimbursed by the investment adviser or reductions from brokerage service arrangements or other expense offset arrangements and do not represent the amount paid by the class during periods when reimbursements or reductions occur. Expense ratios before reductions for start-up periods may not be representative of longer-term operating periods. Expenses net of fee waivers reflect expenses after reimbursement by the investment adviser but prior to reductions from brokerage service arrangements or other expense offset arrangements. Expenses net of all reductions represent the net expenses paid by the class.
J Amount represents less than $.01 per share.
K Total distributions of $1.775 per share is comprised of distributions from net realized gain of $1.775 per share.
See accompanying notes which are an integral part of the financial statements.
Annual Report
Financial Highlights - International Small Cap Opportunities
Years ended October 31, | 2008 | 2007 | 2006 | 2005 G |
Selected Per-Share Data | | | | |
Net asset value, beginning of period | $ 19.09 | $ 14.23 | $ 10.40 | $ 10.00 |
Income from Investment Operations | | | | |
Net investment income (loss) D | .05 | .07 | .05 | - I |
Net realized and unrealized gain (loss) | (10.92) | 4.78 | 3.75 | .39 |
Total from investment operations | (10.87) | 4.85 | 3.80 | .39 |
Distributions from net investment income | (.06) | - | - | - |
Distributions from net realized gain | (1.88) | - | - I | - |
Total distributions | (1.94) J | - | - I | - |
Redemption fees added to paid in capital D | - I | .01 | .03 | .01 |
Net asset value, end of period | $ 6.28 | $ 19.09 | $ 14.23 | $ 10.40 |
Total Return B, C | (62.91)% | 34.15% | 36.86% | 4.00% |
Ratios to Average Net Assets E, H | | | | |
Expenses before reductions | 1.44% | 1.30% | 1.28% | 2.25% A |
Expenses net of fee waivers, if any | 1.44% | 1.30% | 1.28% | 1.40% A |
Expenses net of all reductions | 1.40% | 1.25% | 1.16% | 1.31% A |
Net investment income (loss) | .36% | .43% | .37% | .14% A |
Supplemental Data | | | | |
Net assets, end of period (000 omitted) | $ 312,376 | $ 1,433,844 | $ 981,210 | $ 197,349 |
Portfolio turnover rate F | 61% | 107% | 164% | 46% |
A Annualized
B Total returns for periods of less than one year are not annualized.
C Total returns would have been lower had certain expenses not been reduced during the periods shown.
D Calculated based on average shares outstanding during the period.
E Fees and expenses of the underlying Fidelity Central Funds are not included in the Fund's expense ratio. The Fund indirectly bears its proportionate share of the expenses of any underlying Fidelity Central Funds.
F Amount does not include the portfolio activity of any underlying Fidelity Central Funds.
G For the period August 2, 2005 (commencement of operations) to October 31, 2005.
H Expense ratios reflect operating expenses of the class. Expenses before reductions do not reflect amounts reimbursed by the investment adviser or reductions from brokerage service arrangements or other expense offset arrangements and do not represent the amount paid by the class during periods when reimbursements or reductions occur. Expense ratios before reductions for start-up periods may not be representative of longer-term operating periods. Expenses net of fee waivers reflect expenses after reimbursement by the investment adviser but prior to reductions from brokerage service arrangements or other expense offset arrangements. Expenses net of all reductions represent the net expenses paid by the class.
I Amount represents less than $.01 per share.
J Total distributions of $1.942 per share is comprised of distributions from net investment income of $.064 and distributions from net realized gain of $1.878 per share.
See accompanying notes which are an integral part of the financial statements.
Annual Report
Financial Highlights - Institutional Class
Years ended October 31, | 2008 | 2007 | 2006 | 2005 G |
Selected Per-Share Data | | | | |
Net asset value, beginning of period | $ 19.09 | $ 14.22 | $ 10.40 | $ 10.00 |
Income from Investment Operations | | | | |
Net investment income (loss) D | .05 | .08 | .05 | - I |
Net realized and unrealized gain (loss) | (10.92) | 4.78 | 3.74 | .39 |
Total from investment operations | (10.87) | 4.86 | 3.79 | .39 |
Distributions from net investment income | (.07) | - | - | - |
Distributions from net realized gain | (1.88) | - | - I | - |
Total distributions | (1.95) J | - | - I | - |
Redemption fees added to paid in capital D | - I | .01 | .03 | .01 |
Net asset value, end of period | $ 6.27 | $ 19.09 | $ 14.22 | $ 10.40 |
Total Return B, C | (62.95)% | 34.25% | 36.77% | 4.00% |
Ratios to Average Net Assets E, H | | | | |
Expenses before reductions | 1.40% | 1.29% | 1.25% | 2.25% A |
Expenses net of fee waivers, if any | 1.40% | 1.29% | 1.25% | 1.40% A |
Expenses net of all reductions | 1.37% | 1.25% | 1.14% | 1.29% A |
Net investment income (loss) | .39% | .44% | .40% | .16% A |
Supplemental Data | | | | |
Net assets, end of period (000 omitted) | $ 8,117 | $ 27,609 | $ 13,954 | $ 2,849 |
Portfolio turnover rate F | 61% | 107% | 164% | 46% |
A Annualized
B Total returns for periods of less than one year are not annualized.
C Total returns would have been lower had certain expenses not been reduced during the periods shown.
D Calculated based on average shares outstanding during the period.
E Fees and expenses of the underlying Fidelity Central Funds are not included in the Fund's expense ratio. The Fund indirectly bears its proportionate share of the expenses of any underlying Fidelity Central Funds.
F Amount does not include the portfolio activity of any underlying Fidelity Central Funds.
G For the period August 2, 2005 (commencement of operations) to October 31, 2005.
H Expense ratios reflect operating expenses of the class. Expenses before reductions do not reflect amounts reimbursed by the investment adviser or reductions from brokerage service arrangements or other expense offset arrangements and do not represent the amount paid by the class during periods when reimbursements or reductions occur. Expense ratios before reductions for start-up periods may not be representative of longer-term operating periods. Expenses net of fee waivers reflect expenses after reimbursement by the investment adviser but prior to reductions from brokerage service arrangements or other expense offset arrangements. Expenses net of all reductions represent the net expenses paid by the class.
I Amount represents less than $.01 per share.
J Total distributions of $1.952 per share is comprised of distributions from net investment income of $.074 and distributions from net realized gain of $1.878 per share.
See accompanying notes which are an integral part of the financial statements.
Annual Report
Notes to Financial Statements
For the period ended October 31, 2008
1. Organization.
Fidelity International Small Cap Opportunities Fund (the Fund) is a fund of Fidelity Investment Trust (the trust) and is authorized to issue an unlimited number of shares. The trust is registered under the Investment Company Act of 1940, as amended (the 1940 Act), as an open-end management investment company organized as a Massachusetts business trust. The Fund offers Class A, Class T, Class B, Class C, International Small Cap Opportunities, and Institutional Class shares, each of which has equal rights as to assets and voting privileges. Each class has exclusive voting rights with respect to matters that affect that class. Class B shares will automatically convert to Class A shares after a holding period of seven years from the initial date of purchase. Investment income, realized and unrealized capital gains and losses, the common expenses of the Fund, and certain fund-level expense reductions, if any, are allocated on a pro rata basis to each class based on the relative net assets of each class to the total net assets of the Fund. Each class differs with respect to transfer agent and distribution and service plan fees incurred. Certain expense reductions also differ by class. The Fund's investments in emerging markets can be subject to social, economic, regulatory, and political uncertainties and can be extremely volatile.
2. Investments in Fidelity Central Funds.
The Fund may invest in Fidelity Central Funds, which are open-end investment companies available only to other investment companies and accounts managed by Fidelity Management & Research Company (FMR) and its affiliates. The Fund's Schedule of Investments lists each of the Fidelity Central Funds held as of period end, if any, as an investment of the Fund, but does not include the underlying holdings of each Fidelity Central Fund. As an Investing Fund, the Fund indirectly bears its proportionate share of the expenses of the underlying Fidelity Central Funds.
The Money Market Central Funds seek preservation of capital and current income and are managed by Fidelity Investments Money Management, Inc. (FIMM), an affiliate of FMR.
A complete unaudited list of holdings for each Fidelity Central Fund is available upon request or at the SEC's web site at www.sec.gov. In addition, the financial statements of the Fidelity Central Funds, which are not covered by the Fund's Report of Independent Registered Public Accounting Firm, are available on the SEC's web site or upon request.
3. Significant Accounting Policies.
The financial statements have been prepared in conformity with accounting principles generally accepted in the United States of America, which require management to make certain estimates and assumptions at the date of the financial statements. Actual results
Annual Report
3. Significant Accounting Policies - continued
could differ from those estimates. The following summarizes the significant accounting policies of the Fund:
Security Valuation. Investments are valued as of 4:00 p.m. Eastern time on the last calendar day of the period. Wherever possible, the Fund uses independent pricing services approved by the Board of Trustees to value its investments.
Equity securities, including restricted securities, for which market quotations are readily available, are valued at the last reported sale price or official closing price as reported by an independent pricing service on the primary market or exchange on which they are traded. In the event there were no sales during the day or closing prices are not available, securities are valued at the last quoted bid price. Investments in open-end mutual funds, including the Fidelity Central Funds, are valued at their closing net asset value each business day. Short-term securities with remaining maturities of sixty days or less for which quotations are not readily available are valued at amortized cost, which approximates value.
When current market prices or quotations are not readily available or reliable, valuations may be determined in good faith in accordance with procedures adopted by the Board of Trustees. Factors used in determining value may include significant market or security specific events, changes in interest rates and credit quality, and developments in foreign markets which are monitored by evaluating the performance of ADRs, futures contracts and exchange-traded funds. The frequency with which these procedures are used cannot be predicted and may be utilized to a significant extent. The value of securities used for net asset value (NAV) calculation under these procedures may differ from published prices for the same securities.
Foreign Currency. The Fund uses foreign currency contracts to facilitate transactions in foreign-denominated securities. Losses from these transactions may arise from changes in the value of the foreign currency or if the counterparties do not perform under the contracts' terms.
Foreign-denominated assets, including investment securities, and liabilities are translated into U.S. dollars at the exchange rate at period end. Purchases and sales of investment securities, income and dividends received and expenses denominated in foreign currencies are translated into U.S. dollars at the exchange rate in effect on the transaction date.
The effects of exchange rate fluctuations on investments are included with the net realized and unrealized gain (loss) on investment securities. Other foreign currency transactions resulting in realized and unrealized gain (loss) are disclosed separately.
Annual Report
Notes to Financial Statements - continued
3. Significant Accounting Policies - continued
Investment Transactions and Income. For financial reporting purposes, the Fund's investment holdings and NAV include trades executed through the end of the last business day of the period. The NAV per share for processing shareholder transactions is calculated as of the close of business of the New York Stock Exchange (NYSE), normally 4:00 p.m. Eastern time and includes trades executed through the end of the prior business day. Gains and losses on securities sold are determined on the basis of identified cost. Dividend income is recorded on the ex-dividend date, except for certain dividends from foreign securities where the ex-dividend date may have passed, which are recorded as soon as the Fund is informed of the ex-dividend date. Non-cash dividends included in dividend income, if any, are recorded at the fair market value of the securities received. Interest income and distributions from the Fidelity Central Funds are accrued as earned. Interest income includes coupon interest and amortization of premium and accretion of discount on debt securities. Investment income is recorded net of foreign taxes withheld where recovery of such taxes is uncertain.
Expenses. Most expenses of the trust can be directly attributed to a fund. Expenses which cannot be directly attributed are apportioned among each Fund in the trust. Expense estimates are accrued in the period to which they relate and adjustments are made when actual amounts are known.
Income Tax Information and Distributions to Shareholders. Each year, the Fund intends to qualify as a regulated investment company by distributing substantially all of its taxable income and realized gains under Subchapter M of the Internal Revenue Code and filing its U.S. federal tax return. As a result, no provision for income taxes is required. The Fund is subject to the provisions of FASB Interpretation No. 48, Accounting for Uncertainties in Income Taxes (FIN 48). FIN 48 sets forth a minimum threshold for financial statement recognition of the benefit of a tax position taken or expected to be taken in a tax return. The implementation of FIN 48 did not result in any unrecognized tax benefits in the accompanying financial statements. Each of the Fund's federal tax returns for the prior three fiscal years remains subject to examination by the Internal Revenue Service (IRS). Foreign taxes are provided for based on the Fund's understanding of the tax rules and rates that exist in the foreign markets in which it invests.
Distributions are recorded on the ex-dividend date. Income dividends and capital gain distributions are declared separately for each class. Income and capital gain distributions are determined in accordance with income tax regulations, which may differ from generally accepted accounting principles.
Capital accounts within the financial statements are adjusted for permanent book-tax differences. These adjustments have no impact on net assets or the results of operations. Temporary book-tax differences will reverse in a subsequent period.
Annual Report
3. Significant Accounting Policies - continued
Income Tax Information and Distributions to Shareholders - continued
Book-tax differences are primarily due to foreign currency transactions, passive foreign investment companies (PFIC), certain foreign taxes, capital loss carryforwards and losses deferred due to wash sales.
The tax-basis components of distributable earnings and the federal tax cost as of period end were as follows:
Unrealized appreciation | $ 7,261,219 |
Unrealized depreciation | (332,961,765) |
Net unrealized appreciation (depreciation) | (325,700,546) |
Capital loss carryforward | (146,419,794) |
| |
Cost for federal income tax purposes | $ 763,909,463 |
The tax character of distributions paid was as follows:
| October 31, 2008 | October 31, 2007 |
Ordinary Income | $ 16,665,902 | $ - |
Long-term Capital Gains | 142,643,403 | - |
Total | $ 159,309,305 | $ - |
Short-Term Trading (Redemption) Fees. Shares held in the Fund less than 90 days are subject to a redemption fee equal to 2.00% of the proceeds of the redeemed shares. All redemption fees, including any estimated redemption fees paid by FMR, are retained by the Fund and accounted for as an addition to paid in capital.
New Accounting Pronouncement. In September 2006, Statement of Financial Accounting Standards No. 157, Fair Value Measurements (SFAS 157), was issued and is effective for fiscal years beginning after November 15, 2007. SFAS 157 defines fair value, establishes a framework for measuring fair value and results in expanded disclosures about fair value measurements.
4. Operating Policies.
Repurchase Agreements. FMR has received an Exemptive Order from the Securities and Exchange Commission (the SEC) which permits the Fund and other affiliated entities of FMR to transfer uninvested cash balances into joint trading accounts which are then invested in repurchase agreements. The Fund may also invest directly with institutions in repurchase agreements. Repurchase agreements are collateralized by government or non-government securities. Upon settlement date, collateral is held in segregated accounts with custodian banks and may be obtained in the event of a default of the counterparty. The Fund monitors, on a daily basis, the value of the collateral to ensure it is at least equal to the principal amount of the repurchase agreement
Annual Report
Notes to Financial Statements - continued
4. Operating Policies - continued
Repurchase Agreements - continued
(including accrued interest). In the event of a default by the counterparty, realization of the collateral proceeds could be delayed, during which time the value of the collateral may decline.
5. Purchases and Sales of Investments.
Purchases and sales of securities, other than short-term securities, aggregated $594,537,624 and $981,461,622, respectively.
6. Fees and Other Transactions with Affiliates.
Management Fee. FMR and its affiliates provide the Fund with investment management related services for which the Fund pays a monthly management fee. The management fee is the sum of an individual fund fee rate that is based on an annual rate of .60% of the Fund's average net assets and a group fee rate that averaged .26% during the period. The group fee rate is based upon the average net assets of all the mutual funds advised by FMR. The group fee rate decreases as assets under management increase and increases as assets under management decrease. In addition, the management fee is subject to a performance adjustment (up to a maximum of ± .20% of the Fund's average net assets over a 36 month performance period). The upward or downward adjustment to the management fee is based on the relative investment performance of the retail class of the Fund, International Small Cap Opportunities as compared to an appropriate benchmark index. For the period, the total annual management fee rate, including the performance adjustment, was 1.07% of the Fund's average net assets.
Distribution and Service Plan. In accordance with Rule 12b-1 of the 1940 Act, the Fund has adopted separate Distribution and Service Plans for each class of shares. Certain classes pay Fidelity Distributors Corporation (FDC), an affiliate of FMR, separate Distribution and Service Fees, each of which is based on an annual percentage of each class' average net assets. In addition, FDC may pay financial intermediaries for selling shares of the Fund and providing shareholder support services. For the period, the Distribution and Service Fee rates and the total amounts paid to and retained by FDC were as follows:
| Distribution
Fee | Service
Fee | Paid to
FDC | Retained
by FDC |
Class A | 0% | .25% | $ 113,686 | $ 9,692 |
Class T | .25% | .25% | 142,986 | 2,758 |
Class B | .75% | .25% | 68,222 | 51,535 |
Class C | .75% | .25% | 255,510 | 47,663 |
| | | $ 580,404 | $ 111,648 |
Annual Report
6. Fees and Other Transactions with Affiliates - continued
Sales Load. FDC receives a front-end sales charge of up to 5.75% for selling Class A shares, and 3.50% for selling Class T shares, some of which is paid to financial intermediaries for selling shares of the Fund. FDC receives the proceeds of contingent deferred sales charges levied on Class A, Class T, Class B, and Class C redemptions. These charges depend on the holding period. The deferred sales charges range from 5% to 1% for Class B, 1% for Class C, 1.00% to .50% for certain purchases of Class A shares and .25% for certain purchases of Class T shares.
For the period, sales charge amounts retained by FDC were as follows:
| Retained
by FDC |
Class A | $ 19,917 |
Class T | 6,001 |
Class B* | 29,903 |
Class C* | 4,501 |
| $ 60,322 |
* When Class B and Class C shares are initially sold, FDC pays commissions from its own resources to financial intermediaries through which the sales are made.
Transfer Agent Fees. Fidelity Investments Institutional Operations Company, Inc. (FIIOC), an affiliate of FMR, is the transfer, dividend disbursing and shareholder servicing agent for each class of the Fund. FIIOC receives account fees and asset-based fees that vary according to the account size and type of account of the shareholders of the respective classes of the Fund. FIIOC pays for typesetting, printing and mailing of shareholder reports, except proxy statements. Prior to January 1, 2008, Fidelity Service Company, Inc. (FSC), also an affiliate of FMR was the transfer agent for International Small Cap Opportunities shares. For the period, each class paid the following transfer agent fees:
| Amount | % of
Average
Net Assets |
Class A | $ 140,073 | .31 |
Class T | 88,875 | .31 |
Class B | 21,153 | .31 |
Class C | 79,086 | .31 |
International Small Cap Opportunities | 2,100,743 | .25 |
Institutional Class | 37,286 | .22 |
| $ 2,467,216 | |
Accounting and Security Lending Fees. FSC, an affiliate of FMR, maintains the Fund's accounting records. The accounting fee is based on the level of average net assets for the month. Under a separate contract, FSC administers the security lending program. The security lending fee is based on the number and duration of lending transactions.
Annual Report
Notes to Financial Statements - continued
6. Fees and Other Transactions with Affiliates - continued
Brokerage Commissions. The Fund placed a portion of its portfolio transactions with brokerage firms which are affiliates of the investment adviser. The commissions paid to these affiliated firms were $6,205 for the period.
Interfund Lending Program. Pursuant to an Exemptive Order issued by the SEC, the Fund, along with other registered investment companies having management contracts with FMR, may participate in an interfund lending program. This program provides an alternative credit facility allowing the funds to borrow from, or lend money to, other participating affiliated funds. At period end, there were no interfund loans outstanding. The Fund's activity in this program during the period for which loans were outstanding was as follows:
Borrower or Lender | Average Daily Loan
Balance | Weighted Average
Interest Rate | Interest
Expense |
Borrower | $ 6,424,452 | 3.28% | $ 36,307 |
7. Committed Line of Credit.
The Fund participates with other funds managed by FMR in a $4.2 billion credit facility (the "line of credit") to be utilized for temporary or emergency purposes to fund shareholder redemptions or for other short-term liquidity purposes. The Fund has agreed to pay commitment fees on its pro rata portion of the line of credit, which amounted to $2,080 and is reflected in Miscellaneous Expense on the Statement of Operations. During the period, there were no borrowings on this line of credit.
8. Security Lending.
The Fund lends portfolio securities from time to time in order to earn additional income. On the settlement date of the loan, the Fund receives collateral (in the form of U.S. Treasury obligations, letters of credit and/or cash) against the loaned securities and maintains collateral in an amount not less than 100% of the market value of the loaned securities during the period of the loan. The market value of the loaned securities is determined at the close of business of the Fund and any additional required collateral is delivered to the Fund on the next business day. If the borrower defaults on its obligation to return the securities loaned because of insolvency or other reasons, a fund could experience delays and costs in recovering the securities loaned or in gaining access to the collateral. Any cash collateral received is invested in the Fidelity Securities Lending Cash Central Fund. The value of loaned securities and cash collateral at period end are disclosed on the Fund's Statement of Assets and Liabilities. Security lending income represents the income earned on investing cash collateral, less fees and expenses associated with the loan, plus any premium payments that may be received on the loan of certain types of securities. Security lending income is presented in the Statement of Operations as a component of income from Fidelity Central Funds.
Annual Report
9. Bank Borrowings.
The Fund is permitted to have bank borrowings for temporary or emergency purposes to fund shareholder redemptions. The Fund has established borrowing arrangements with certain banks. The interest rate on the borrowings is the bank's base rate, as revised from time to time. The average daily loan balance during the period for which loans were outstanding amounted to $8,838,667. The weighted average interest rate was 3.87%. The interest expense amounted to $2,854 under the bank borrowing program. At period end, there were no bank borrowings outstanding.
10. Expense Reductions.
FMR voluntarily agreed to reimburse each class to the extent annual operating expenses exceeded certain levels of average net assets as noted in the table below. Some expenses, for example interest expense, including commitment fees, are excluded from this reimbursement.
The following classes were in reimbursement during the period:
| Expense
Limitations | Reimbursement
from adviser |
| | |
Class A | 1.65% | $ 40,541 |
Class T | 1.90% | 26,563 |
Class B | 2.40% | 6,483 |
Class C | 2.40% | 24,403 |
| | $ 97,990 |
Many of the brokers with whom FMR places trades on behalf of the Fund provided services to the Fund in addition to trade execution. These services included payments of certain expenses on behalf of the Fund totaling $329,425 for the period. In addition, through arrangements with each class' transfer agent, credits realized as a result of uninvested cash balances were used to reduce the Fund's expenses.
During the period, credits reduced each class' transfer agent expense as noted in the table below.
| Transfer Agent
expense reduction |
International Small Cap Opportunities | $ 3,141 |
Annual Report
Notes to Financial Statements - continued
11. Other.
The Fund's organizational documents provide former and current trustees and officers with a limited indemnification against liabilities arising in connection with the performance of their duties to the Fund. In the normal course of business, the Fund may also enter into contracts that provide general indemnifications. The Fund's maximum exposure under these arrangements is unknown as this would be dependent on future claims that may be made against the Fund. The risk of material loss from such claims is considered remote.
12. Distributions to Shareholders.
Distributions to shareholders of each class were as follows:
Years ended October 31, | 2008 | 2007 |
From net investment income | | |
Class A | $ 91,280 | $ - |
International Small Cap Opportunities | 4,620,425 | - |
Institutional Class | 105,667 | - |
Total | $ 4,817,372 | $ - |
From net realized gain | | |
Class A | $ 6,856,940 | $ - |
Class T | 4,515,065 | - |
Class B | 1,019,225 | - |
Class C | 3,838,511 | - |
International Small Cap Opportunities | 135,580,534 | - |
Institutional Class | 2,681,658 | - |
Total | $ 154,491,933 | $ - |
13. Share Transactions.
Transactions for each class of shares were as follows:
| Shares | Dollars |
Years ended October 31, | 2008 | 2007 | 2008 | 2007 |
Class A | | | | |
Shares sold | 828,854 | 2,107,892 | $ 10,916,918 | $ 35,531,826 |
Reinvestment of distributions | 416,175 | - | 6,313,370 | - |
Shares redeemed | (2,104,322) | (892,381) | (25,609,420) | (14,908,147) |
Net increase (decrease) | (859,293) | 1,215,511 | $ (8,379,132) | $ 20,623,679 |
Class T | | | | |
Shares sold | 298,437 | 1,311,252 | $ 3,745,246 | $ 21,607,239 |
Reinvestment of distributions | 288,615 | - | 4,360,975 | - |
Shares redeemed | (1,182,864) | (845,477) | (14,814,150) | (14,215,111) |
Net increase (decrease) | (595,812) | 465,775 | $ (6,707,929) | $ 7,392,128 |
Annual Report
13. Share Transactions - continued
Transactions for each class of shares were as follows:
| Shares | Dollars |
Years ended October 31, | 2008 | 2007 | 2008 | 2007 |
Class B | | | | |
Shares sold | 67,210 | 286,293 | $ 882,196 | $ 4,653,400 |
Reinvestment of distributions | 61,167 | - | 917,505 | - |
Shares redeemed | (278,427) | (246,522) | (3,422,675) | (4,027,585) |
Net increase (decrease) | (150,050) | 39,771 | $ (1,622,974) | $ 625,815 |
Class C | | | | |
Shares sold | 393,320 | 888,414 | $ 4,565,906 | $ 14,698,282 |
Reinvestment of distributions | 216,879 | - | 3,248,846 | - |
Shares redeemed | (1,252,106) | (569,219) | (14,199,211) | (9,379,169) |
Net increase (decrease) | (641,907) | 319,195 | $ (6,384,459) | $ 5,319,113 |
International Small Cap Opportunities | | | | |
Shares sold | 10,644,155 | 48,402,736 | $ 141,713,979 | $ 800,622,633 |
Reinvestment of distributions | 8,363,264 | - | 127,539,782 | - |
Shares redeemed | (44,345,885) | (42,286,931) | (553,799,561) | (715,447,148) |
Net increase (decrease) | (25,338,466) | 6,115,805 | $ (284,545,800) | $ 85,175,485 |
Institutional Class | | | | |
Shares sold | 915,939 | 903,141 | $ 11,419,413 | $ 15,436,027 |
Reinvestment of distributions | 149,148 | - | 2,273,017 | - |
Shares redeemed | (1,217,529) | (437,882) | (14,541,508) | (7,375,351) |
Net increase (decrease) | (152,442) | 465,259 | $ (849,078) | $ 8,060,676 |
Annual Report
To the Trustees of Fidelity Investment Trust and Shareholders of Fidelity International Small Cap Opportunities Fund:
We have audited the accompanying statement of assets and liabilities of Fidelity International Small Cap Opportunities Fund (the Fund), a fund of Fidelity Investment Trust, including the schedule of investments, as of October 31, 2008, and the related statement of operations for the year then ended, the statement of changes in net assets for each of the two years in the period then ended, and the financial highlights for the three years in the period then ended and for the period from August 2, 2005 (commencement of operations) to October 31, 2005. These financial statements and financial highlights are the responsibility of the Fund's management. Our responsibility is to express an opinion on these financial statements and financial highlights based on our audits.
We conducted our audits in accordance with standards of the Public Company Accounting Oversight Board (United States). Those standards require that we plan and perform the audit to obtain reasonable assurance about whether the financial statements and financial highlights are free of material misstatement. The Fund is not required to have, nor were we engaged to perform, an audit of its internal control over financial reporting. Our audits included consideration of internal control over financial reporting as a basis for designing audit procedures that are appropriate in the circumstances, but not for the purpose of expressing an opinion on the effectiveness of the Fund's internal control over financial reporting. Accordingly, we express no such opinion. An audit also includes examining, on a test basis, evidence supporting the amounts and disclosures in the financial statements, assessing the accounting principles used and significant estimates made by management, as well as evaluating the overall financial statement presentation. Our procedures included confirmation of securities owned as of October 31, 2008, by correspondence with the custodians and brokers; where replies were not received from brokers, we performed other auditing procedures. We believe that our audits provide a reasonable basis for our opinion.
In our opinion, the financial statements and financial highlights referred to above present fairly, in all material respects, the financial position of Fidelity International Small Cap Opportunities Fund as of October 31, 2008, the results of its operations for the year then ended, the changes in its net assets for each of the two years in the period then ended, and its financial highlights for each of the three years in the period then ended and for the period from August 2, 2005 (commencement of operations) to October 31, 2005, in conformity with accounting principles generally accepted in the United States of America.
/s/ Deloitte & Touche LLP
DELOITTE & TOUCHE LLP
Boston, Massachusetts
December 19, 2008
Annual Report
The Trustees, Member of the Advisory Board, and executive officers of the trust and fund, as applicable, are listed below. The Board of Trustees governs the fund and is responsible for protecting the interests of shareholders. The Trustees are experienced executives who meet periodically throughout the year to oversee the fund's activities, review contractual arrangements with companies that provide services to the fund, and review the fund's performance. Except for Edward C. Johnson 3d and James C. Curvey, each of the Trustees oversees 220 funds advised by FMR or an affiliate. Messrs. Johnson and Curvey oversee 379 funds advised by FMR or an affiliate.
The Trustees hold office without limit in time except that (a) any Trustee may resign; (b) any Trustee may be removed by written instrument, signed by at least two-thirds of the number of Trustees prior to such removal; (c) any Trustee who requests to be retired or who has become incapacitated by illness or injury may be retired by written instrument signed by a majority of the other Trustees; and (d) any Trustee may be removed at any special meeting of shareholders by a two-thirds vote of the outstanding voting securities of the trust. Each Trustee who is not an interested person (as defined in the 1940 Act) (Independent Trustee), shall retire not later than the last day of the calendar year in which his or her 72nd birthday occurs. The Independent Trustees may waive this mandatory retirement age policy with respect to individual Trustees. The executive officers and Advisory Board Member hold office without limit in time, except that any officer and Advisory Board Member may resign or may be removed by a vote of a majority of the Trustees at any regular meeting or any special meeting of the Trustees. Except as indicated, each individual has held the office shown or other offices in the same company for the past five years.
The fund's Statement of Additional Information (SAI) includes more information about the Trustees. To request a free copy, call Fidelity at 1-877-208-0098.
Interested Trustees*:
Correspondence intended for each Trustee who is an interested person may be sent to Fidelity Investments, 82 Devonshire Street, Boston, Massachusetts 02109.
Name, Age; Principal Occupation |
Edward C. Johnson 3d (78) |
| Year of Election or Appointment: 1984 Mr. Johnson is Chairman of the Board of Trustees. Mr. Johnson serves as Chief Executive Officer, Chairman, and a Director of FMR LLC; Chairman and a Director of FMR; Chairman and a Director of Fidelity Research & Analysis Company (FRAC); Chairman and a Director of Fidelity Investments Money Management, Inc.; and Chairman and a Director of FMR Co., Inc. In addition, Mr. Johnson serves as Chairman and Director of FIL Limited. Previously, Mr. Johnson served as President of FMR LLC (2006-2007). |
James C. Curvey (73) |
| Year of Election or Appointment: 2007 Mr. Curvey also serves as Trustee (2007-present) of other investment companies advised by FMR. Mr. Curvey is a Director of FMR and FMR Co., Inc. (2007-present). Mr. Curvey is also Vice Chairman (2006-
present) and Director of FMR LLC. In addition, Mr. Curvey serves as an Overseer for the Boston Symphony Orchestra and a member of the Trustees of Villanova University. |
* Trustees have been determined to be "Interested Trustees" by virtue of, among other things, their affiliation with the trust or various entities under common control with FMR. FMR Corp. merged with and into FMR LLC on October 1, 2007. Any references to FMR LLC for prior periods are deemed to be references to the prior entity.
Independent Trustees:
Correspondence intended for each Independent Trustee (that is, the Trustees other than the Interested Trustees) may be sent to Fidelity Investments, P.O. Box 55235, Boston, Massachusetts 02205-5235.
Name, Age; Principal Occupation |
Dennis J. Dirks (60) |
| Year of Election or Appointment: 2005 Prior to his retirement in May 2003, Mr. Dirks was Chief Operating Officer and a member of the Board of The Depository Trust & Clearing Corporation (DTCC) (1999-2003). He also served as President, Chief Operating Officer, and Board member of The Depository Trust Company (DTC) (1999-2003) and President and Board member of the National Securities Clearing Corporation (NSCC) (1999-2003). In addition, Mr. Dirks served as a Trustee and a member of the Finance Committee of Manhattan College (2005-2008), and as Chief Executive Officer and Board member of the Government Securities Clearing Corporation (2001-2003) and Chief Executive Officer and Board member of the Mortgage-Backed Securities Clearing Corporation (2001-2003). Mr. Dirks also serves as a Trustee and a member of the Finance Committee of AHRC of Nassau County (2006-present). |
Alan J. Lacy (55) |
| Year of Election or Appointment: 2008 Mr. Lacy serves as Senior Adviser (2007-present) of Oak Hill Capital Partners, L.P. (a private equity firm). Mr. Lacy also served as Chief Executive Officer (2000-2005) and Vice Chairman (2005-2006) of Sears Holdings Corporation and Sears, Roebuck and Co. (retail). In addition, Mr. Lacy serves as a member of the Board of Directors of The Western Union Company (global money transfer, 2006-present) and Bristol-Myers Squibb (global pharmaceuticals, 2007-present). Mr. Lacy is a Trustee of the National Parks Conservation Association and The Field Museum of Natural History. |
Ned C. Lautenbach (64) |
| Year of Election or Appointment: 2000 Mr. Lautenbach is Chairman of the Independent Trustees (2006-present). Mr. Lautenbach is an Advisory Partner of Clayton, Dubilier & Rice, Inc. (private equity investment firm). Previously, Mr. Lautenbach was with the International Business Machines Corporation (IBM) from 1968 until his retirement in 1998. Mr. Lautenbach serves as a Director of Eaton Corporation (diversified industrial) as well as the Philharmonic Center for the Arts in Naples, Florida. He also is a member of the Board of Trustees of Fairfield University (2005-present), as well as a member of the Council on Foreign Relations. Previously, Mr. Lautenbach served as a Director of Sony Corporation (2006-2007).] |
Joseph Mauriello (64) |
| Year of Election or Appointment: 2008 Prior to his retirement in January 2006, Mr. Mauriello served in numerous senior management positions including Deputy Chairman and Chief Operating Officer (2004-2005), and Vice Chairman of Financial Services (2002-2004) of KPMG LLP US (professional services firm, 1965-
2005). Mr. Mauriello currently serves as a member of the Board of Directors of XL Capital Ltd. (global insurance and re-insurance company, 2006-present) and of Arcadia Resources Inc. (health care services and products, 2007-present). He also served as a Director of the Hamilton Funds of the Bank of New York (2006-2007). |
Cornelia M. Small (64) |
| Year of Election or Appointment: 2005 Ms. Small is a member of the Investment Committee, and Chair (2008-present) and a member of the Board of Trustees of Smith College. Ms. Small also serves on the Investment Committee of the Berkshire Taconic Community Foundation (2008-present). Previously, Ms. Small served as Chairperson of the Investment Committee (2002-2008) of Smith College and as Co-Chair (2000-2003) of the Annual Fund for the Fletcher School of Law and Diplomacy. In addition, she served as Chief Investment Officer, Director of Global Equity Investments, and a member of the Board of Directors of Scudder, Stevens & Clark and Scudder Kemper Investments. |
William S. Stavropoulos (69) |
| Year of Election or Appointment: 2001 Mr. Stavropoulos is Chairman Emeritus of the Board of Directors of The Dow Chemical Company, where he previously served in numerous senior management positions, including President (1993-2000; 2002-
2003), CEO (1995-2000; 2002-2004), Chairman of the Executive Committee (2000-2006), and as a member of the Board of Directors (1990-2006). Currently, he is a Director of Teradata Corporation (data warehousing and technology solutions, 2008-present), Chemical Financial Corporation, Maersk Inc. (industrial conglomerate), Tyco International, Inc. (multinational manufacturing and services, 2007-present), and a member of the Advisory Board for Metalmark Capital (private equity investment firm, 2005-present). He is a special advisor to Clayton, Dubilier & Rice, Inc. (private equity investment). In addition, Mr. Stavropoulos is a member of the University of Notre Dame Advisory Council for the College of Science. |
David M. Thomas (59) |
| Year of Election or Appointment: 2008 Previously, Mr. Thomas served as Executive Chairman (2005-2006) and Chairman and Chief Executive Officer (2000-2005) of IMS Health, Inc. (pharmaceutical and healthcare information solutions). In addition, Mr. Thomas serves as a member of the Board of Directors of Fortune Brands, Inc. (consumer products holding company), and Interpublic Group of Companies, Inc. (marketing communication, 2004-present). |
Michael E. Wiley (58) |
| Year of Election or Appointment: 2008 Mr. Wiley also serves as a member of the Board of Trustees of the University of Tulsa (2000-2006; 2007-present). He serves as a Director of Tesoro Corporation (independent oil refiner and marketer, 2005-
present), and a Director of Bill Barrett Corporation (exploration and production company, 2005-present). In addition, he also serves as a Director of Post Oak Bank (privately-held bank, 2004-present). Previously, Mr. Wiley served as a Sr. Energy Advisor of Katzenbach Partners, LLC (consulting firm, 2006-2007), as an Advisory Director of Riverstone Holdings (private investment firm), Chairman, President, and CEO of Baker Hughes, Inc. (oilfield services company, 2000-2004), and as Director of Spinnaker Exploration Company (exploration and production company, 2001-2005). |
Advisory Board Member and Executive Officers**:
Correspondence intended for each executive officer and Mr. Lynch may be sent to Fidelity Investments, 82 Devonshire Street, Boston, Massachusetts 02109.
Name, Age; Principal Occupation |
Peter S. Lynch (64) |
| Year of Election or Appointment: 2003 Member of the Advisory Board of Fidelity's Equity and High Income Funds. Mr. Lynch is Vice Chairman and a Director of FMR, and Vice Chairman (2001-present) and a Director of FMR Co., Inc. Previously, Mr. Lynch served as a Trustee of the Fidelity funds (1990-2003). In addition, he serves as a Trustee of Boston College and as the Chairman of the Inner-City Scholarship Fund. Previously, Mr. Lynch served on the Special Olympics International Board of Directors (1997-2006). |
Kenneth B. Robins (39) |
| Year of Election or Appointment: 2008 President and Treasurer of Fidelity's Equity and High Income Funds. Mr. Robins is an employee of Fidelity Investments (2004-present). Before joining Fidelity Investments, Mr. Robins worked at KPMG LLP, where he was a partner in KPMG's department of professional practice (2002-2004). |
Walter C. Donovan (46) |
| Year of Election or Appointment: 2007 Vice President of Fidelity's Equity Funds. Mr. Donovan also serves as President of FMR and FMR Co., Inc., and Executive Vice President of Fidelity Investments Money Management, Inc. (2007-present). Previously, Mr. Donovan served as Executive Vice President of FMR and FMR Co., Inc. (2005-2007) and Senior Vice President of FMR (2003-2005) and FMR Co., Inc. (2004-2005). |
Bruce T. Herring (43) |
| Year of Election or Appointment: 2006 Vice President of certain Equity Funds. Mr. Herring also serves as Group Chief Investments Officer of FMR. Previously, Mr. Herring served as a portfolio manager for Fidelity U.S. Equity Funds. |
Thomas C. Hense (44) |
| Year of Election or Appointment: 2008 Vice President of Fidelity's High Income and Small Cap Funds. Previously, Mr. Hense served as a portfolio manager for Fidelity's Institutional Money Management Group (Pyramis) (2003-2008). |
Eric M. Wetlaufer (46) |
| Year of Election or Appointment: 2006 Vice President of Fidelity's International Equity Funds. Mr. Wetlaufer also serves as Group Chief Investment Officer of FMR. Mr. Wetlaufer is Chairman, Chief Executive Officer, and President of Fidelity Management & Research (Hong Kong) Limited (2008-present); Chairman, Chief Executive Officer, President, and a Director of Fidelity Management & Research (Japan) Inc. (2008-present); Chairman and Chief Executive Officer (2007-present) and President and a Director (2006-present) of Fidelity Management & Research (U.K.) Inc. and President and a Director of Fidelity Research & Analysis Company (2006-present). Before joining Fidelity Investments in 2005, Mr. Wetlaufer was a partner in Oxhead Capital Management (2004-2005) and a Chief Investment Officer of Putnam Investments (1997-2003). |
Scott C. Goebel (40) |
| Year of Election or Appointment: 2008 Secretary and Chief Legal Officer (CLO) of the Fidelity funds. Mr. Goebel also serves as General Counsel, Secretary, and Senior Vice President of FMR (2008-present); Deputy General Counsel of FMR LLC; Chief Legal Secretary of Fidelity Management & Research (Hong Kong) Limited (2008-present) and Assistant Secretary of Fidelity Management & Research (Japan) Inc. (2008-present). Previously, Mr. Goebel served as Assistant Secretary of the Funds (2007-2008) and as Vice President and Secretary of Fidelity Distributors Corporation (FDC) (2005-2007). |
John B. McGinty, Jr. (46) |
| Year of Election or Appointment: 2008 Assistant Secretary of Fidelity's Equity and High Income Funds. Mr. McGinty is an employee of Fidelity Investments (2004-present). Mr. McGinty also serves as Senior Vice President, Secretary, and Chief Legal Officer of FDC (2007-present). Before joining Fidelity Investments, Mr. McGinty practiced law at Ropes & Gray, LLP. |
Holly C. Laurent (54) |
| Year of Election or Appointment: 2008 Anti-Money Laundering (AML) Officer of the Fidelity funds. Ms. Laurent is an employee of Fidelity Investments. Previously, Ms. Laurent was Senior Vice President and Head of Legal for Fidelity Business Services India Pvt. Ltd. (2006-2008), Senior Vice President, Deputy General Counsel and Group Head for FMR LLC (2005-2006). |
Christine Reynolds (50) |
| Year of Election or Appointment: 2008 Chief Financial Officer of the Fidelity funds. Ms. Reynolds became President of Fidelity Pricing and Cash Management Services (FPCMS) in August 2008. She served as Chief Operating Officer of FPCMS from 2007 through July 2008. Previously, Ms. Reynolds served as President, Treasurer, and Anti-Money Laundering officer of the Fidelity funds (2004-2007). Before joining Fidelity Investments, Ms. Reynolds worked at PricewaterhouseCoopers LLP (PwC) (1980-2002), where she was an audit partner with PwC's investment management practice. |
Kenneth A. Rathgeber (61) |
| Year of Election or Appointment: 2004 Chief Compliance Officer of Fidelity's Equity and High Income Funds. Mr. Rathgeber is Chief Compliance Officer of Fidelity Management & Research (Hong Kong) Limited (2008-present), Fidelity Management & Research (Japan) Inc. (2008-present), FMR (2005-present), FMR Co., Inc. (2005-present), Fidelity Management & Research (U.K.) Inc. (2005-
present), Fidelity Research & Analysis Company (2005-present), Fidelity Investments Money Management, Inc. (2005-present), and Strategic Advisers, Inc. (2005-present). |
Bryan A. Mehrmann (47) |
| Year of Election or Appointment: 2005 Deputy Treasurer of the Fidelity funds. Mr. Mehrmann is an employee of Fidelity Investments. Previously, Mr. Mehrmann served as Vice President of Fidelity Investments Institutional Services Group (FIIS)/Fidelity Investments Institutional Operations Corporation, Inc. (FIIOC) Client Services (1998-2004). |
Adrien E. Deberghes (41) |
| Year of Election or Appointment: 2008 Deputy Treasurer of Fidelity's Equity and High Income Funds. Mr. Deberghes is an employee of Fidelity Investments (2008-present). Previously, Mr. Deberghes served as Senior Vice President of Mutual Fund Administration at State Street Corporation (2007-2008), Senior Director of Mutual Fund Administration at Investors Bank & Trust (2005-2007), and Director of Finance for Dunkin' Brands (2000-2005). |
Robert G. Byrnes (41) |
| Year of Election or Appointment: 2005 Assistant Treasurer of the Fidelity funds. Mr. Byrnes is an employee of Fidelity Investments (2005-present). Previously, Mr. Byrnes served as Vice President of Fidelity Pricing and Cash Management Services (FPCMS) (2003-2005). Before joining Fidelity Investments, Mr. Byrnes worked at Deutsche Asset Management where he served as Vice President of the Investment Operations Group (2000-2003). |
Peter L. Lydecker (54) |
| Year of Election or Appointment: 2004 Assistant Treasurer of the Fidelity funds. Mr. Lydecker is an employee of Fidelity Investments. |
Paul M. Murphy (61) |
| Year of Election or Appointment: 2007 Assistant Treasurer of the Fidelity funds. Mr. Murphy is an employee of Fidelity Investments (2007-present). Previously, Mr. Murphy served as Chief Financial Officer of the Fidelity Funds (2005-2006), Vice President and Associate General Counsel of FMR (2007), and Senior Vice President of Fidelity Pricing and Cash Management Services (FPCMS) (1994-2007). |
Gary W. Ryan (50) |
| Year of Election or Appointment: 2005 Assistant Treasurer of the Fidelity funds. Mr. Ryan is an employee of Fidelity Investments. Previously, Mr. Ryan served as Vice President of Fund Reporting in Fidelity Pricing and Cash Management Services (FPCMS) (1999-2005). |
** FMR Corp. merged with and into FMR LLC on October 1, 2007. Any references to FMR LLC for prior periods are deemed to be references to the prior entity.
Annual Report
Institutional Class designates 79% of the dividends distributed during the fiscal year as amounts which may be taken into account as a dividend for purposes of the maximum rate under section 1(h)(11) of the Internal Revenue Code.
The amounts per share which represent income derived from sources within, and taxes paid to, foreign countries or possessions of the United States are as follows:
| Pay Date | Income | Taxes |
Institutional Class | 12/10/07 | $0.179 | $0.0219 |
The fund will notify shareholders in January 2009 of amounts for use in preparing 2008 income tax returns.
Annual Report
A special meeting of the fund's shareholders was held on April 16, 2008. The results of votes taken among shareholders on the proposal before them are reported below. Each vote reported represents one dollar of net asset value held on the record date for the meeting.
PROPOSAL 1 |
To elect a Board of Trustees.A |
| # of
Votes | % of
Votes |
James C. Curvey |
Affirmative | 44,485,656,811.55 | 94.702 |
Withheld | 2,488,551,854.62 | 5.298 |
TOTAL | 46,974,208,666.17 | 100.000 |
Dennis J. Dirks |
Affirmative | 44,706,671,638.31 | 95.173 |
Withheld | 2,267,537,027.86 | 4.827 |
TOTAL | 46,974,208,666.17 | 100.000 |
Edward C. Johnson 3d |
Affirmative | 44,294,881,638.16 | 94.296 |
Withheld | 2,679,327,028.01 | 5.704 |
TOTAL | 46,974,208,666.17 | 100.000 |
Alan J. Lacy |
Affirmative | 44,685,373,413.16 | 95.127 |
Withheld | 2,288,835,253.01 | 4.873 |
TOTAL | 46,974,208,666.17 | 100.000 |
Ned C. Lautenbach |
Affirmative | 44,634,541,379.41 | 95.019 |
Withheld | 2,339,667,286.76 | 4.981 |
TOTAL | 46,974,208,666.17 | 100.000 |
Joseph Mauriello |
Affirmative | 44,683,962,099.80 | 95.124 |
Withheld | 2,290,246,566.37 | 4.876 |
TOTAL | 46,974,208,666.17 | 100.000 |
Cornelia M. Small |
Affirmative | 44,671,688,375.36 | 95.098 |
Withheld | 2,302,520,290.81 | 4.902 |
TOTAL | 46,974,208,666.17 | 100.000 |
| # of
Votes | % of
Votes |
William S. Stavropoulos |
Affirmative | 44,465,262,087.61 | 94.659 |
Withheld | 2,508,946,578.56 | 5.341 |
TOTAL | 46,974,208,666.17 | 100.000 |
David M. Thomas |
Affirmative | 44,694,340,813.87 | 95.147 |
Withheld | 2,279,867,852.30 | 4.853 |
TOTAL | 46,974,208,666.17 | 100.000 |
Michael E. Wiley |
Affirmative | 44,686,513,174.78 | 95.130 |
Withheld | 2,287,695,491.39 | 4.870 |
TOTAL | 46,974,208,666.17 | 100.000 |
A Denotes trust-wide proposal and voting results.
Annual Report
Proxy Voting Results
A special meeting of the fund's shareholders was held on December 13, 2007. The results of votes taken among shareholders on the proposals before them are reported below. Each vote reported represents one dollar of net asset value held on the record date for the meeting.
PROPOSAL 1 |
To amend the Declaration of Trust to reduce the required quorum for shareholder meetings.A |
| # of
Votes | % of
Votes |
Affirmative | 45,014,793,255.82 | 80.372 |
Against | 6,871,112,667.08 | 12.268 |
Abstain | 2,163,456,438.02 | 3.863 |
Broker
Non-Votes | 1,958,633,563.89 | 3.497 |
TOTAL | 56,007,995,924.81 | 100.000 |
PROPOSAL 2 |
To elect the nominees specified below as Trustees.A |
James C. Curvey |
Affirmative | 53,384,952,361.03 | 95.317 |
Withheld | 2,623,043,563.78 | 4.683 |
TOTAL | 56,007,995,924.81 | 100.000 |
Dennis J. Dirks |
Affirmative | 53,595,104,608.67 | 95.692 |
Withheld | 2,412,891,316.14 | 4.308 |
TOTAL | 56,007,995,924.81 | 100.000 |
Albert R. Gamper, Jr. |
Affirmative | 53,570,235,221.69 | 95.647 |
Withheld | 2,437,760,703.12 | 4.353 |
TOTAL | 56,007,995,924.81 | 100.000 |
George H. Heilmeier |
Affirmative | 53,166,350,588.50 | 94.926 |
Withheld | 2,841,645,336.31 | 5.074 |
TOTAL | 56,007,995,924.81 | 100.000 |
Edward C. Johnson 3d |
Affirmative | 53,230,508,654.93 | 95.041 |
Withheld | 2,777,487,269.88 | 4.959 |
TOTAL | 56,007,995,924.81 | 100.000 |
| # of
Votes | % of
Votes |
James H. Keyes |
Affirmative | 53,549,161,456.52 | 95.610 |
Withheld | 2,458,834,468.29 | 4.390 |
TOTAL | 56,007,995,924.81 | 100.000 |
Marie L. Knowles |
Affirmative | 53,543,925,066.86 | 95.601 |
Withheld | 2,464,070,857.95 | 4.399 |
TOTAL | 56,007,995,924.81 | 100.000 |
Ned C. Lautenbach |
Affirmative | 53,547,116,322.50 | 95.606 |
Withheld | 2,460,879,602.31 | 4.394 |
TOTAL | 56,007,995,924.81 | 100.000 |
Cornelia M. Small |
Affirmative | 53,564,793,514.25 | 95.638 |
Withheld | 2,443,202,410.56 | 4.362 |
TOTAL | 56,007,995,924.81 | 100.000 |
William S. Stavropoulos |
Affirmative | 53,426,544,502.76 | 95.391 |
Withheld | 2,581,451,422.05 | 4.609 |
TOTAL | 56,007,995,924.81 | 100.000 |
Kenneth L. Wolfe |
Affirmative | 53,229,881,790.63 | 95.040 |
Withheld | 2,778,114,134.18 | 4.960 |
TOTAL | 56,007,995,924.81 | 100.000 |
A Denotes trust-wide proposal and voting results.
Annual Report
Board Approval of Investment Advisory Contracts and Management Fees
Fidelity International Small Cap Opportunities Fund
Each year, typically in July, the Board of Trustees, including the Independent Trustees (together, the Board), votes on the renewal of the management contract and sub-advisory agreements (together, the Advisory Contracts) for the fund. The Board, assisted by the advice of fund counsel and Independent Trustees' counsel, requests and considers a broad range of information throughout the year.
The Board meets regularly and, acting directly and through its separate committees, requests and receives information concerning, and considers at each of its meetings factors that are relevant to, its annual consideration of the renewal of the fund's Advisory Contracts, including the services and support provided to the fund and its shareholders. At the time of the renewal, the Board had 12 standing committees, each composed of Independent Trustees with varying backgrounds, to which the Board has assigned specific subject matter responsibilities in order to enhance effective decision-making by the Board. Each committee has a written charter outlining the structure and purposes of the committee. The Board also meets as needed to consider matters specifically related to the Board's annual consideration of the renewal of Advisory Contracts.
At its July 2008 meeting, the Board of Trustees, including the Independent Trustees, unanimously determined to renew the fund's Advisory Contracts. In reaching its determination, the Board considered all factors it believed relevant, including (i) the nature, extent, and quality of the services to be provided to the fund and its shareholders (including the investment performance of the fund); (ii) the competitiveness of the fund's management fee and total expenses; (iii) the total costs of the services to be provided by and the profits to be realized by Fidelity from its relationship with the fund; (iv) the extent to which economies of scale would be realized as the fund grows; and (v) whether fee levels reflect these economies of scale, if any, for the benefit of fund shareholders. The Board also approved agreements with foreign sub-advisers Fidelity Management & Research (Japan) Inc. and Fidelity Management & Research (Hong Kong) Limited, as well as amendments to the fund's agreement with Fidelity Management & Research (U.K.) Inc.
In considering whether to renew the Advisory Contracts for the fund, the Board ultimately reached a determination, with the assistance of fund counsel and Independent Trustees' counsel and through the exercise of its business judgment, that the renewal of the Advisory Contracts and the compensation to be received by Fidelity under the management contract is consistent with Fidelity's fiduciary duty under applicable law. The Board's decision to renew the Advisory Contracts was not based on any single factor noted above, but rather was based on a comprehensive consideration of all the information provided to the Board at its meetings throughout the year. The Board, in reaching its determination to renew the Advisory Contracts, is aware that shareholders in the fund have a broad range of investment choices available to them, including a wide choice among mutual funds offered by competitors to Fidelity, and that the fund's shareholders, with the opportunity to review and weigh the disclosure provided by the fund in its prospectus and other public disclosures, have chosen to invest in this fund, managed by Fidelity.
Annual Report
Nature, Extent, and Quality of Services Provided. The Board considered staffing within the investment adviser, FMR, and the sub-advisers (together, the Investment Advisers), including the backgrounds of the fund's investment personnel and the fund's investment objective and discipline. The Independent Trustees also had discussions with senior management of Fidelity's investment operations and investment groups. The Board considered the structure of the portfolio manager compensation program and whether this structure provides appropriate incentives.
Resources Dedicated to Investment Management and Support Services. The Board reviewed the size, education, and experience of the Investment Advisers' investment staff, their use of technology, and the Investment Advisers' approach to recruiting, training, and retaining portfolio managers and other research, advisory, and management personnel. The Board noted that Fidelity's analysts have access to a variety of technological tools that enable them to perform both fundamental and quantitative analysis and to specialize in various disciplines. The Board considered Fidelity's extensive global research capabilities that enable the Investment Advisers to aggregate data from various sources in an effort to produce positive investment results. The Board also considered that Fidelity's portfolio managers and analysts have access to daily portfolio attribution that allows for monitoring of a fund's portfolio, as well as an electronic communication system that provides immediate real-time access to research concerning issuers and credit enhancers.
Shareholder and Administrative Services. The Board considered (i) the nature, extent, quality, and cost of advisory, administrative, distribution, and shareholder services performed by the Investment Advisers and their affiliates under the Advisory Contracts and under separate agreements covering transfer agency, pricing and bookkeeping, and securities lending services for the fund; (ii) the nature and extent of the Investment Advisers' supervision of third party service providers, principally custodians and subcustodians; and (iii) the resources devoted to, and the record of compliance with, the fund's compliance policies and procedures. The Board also reviewed the allocation of fund brokerage, including allocations to brokers affiliated with the Investment Advisers, the use of brokerage commissions to pay fund expenses, and the use of "soft" commission dollars to pay for research services. The Board further considered that Fidelity voluntarily pays for market data out of its own resources.
The Board noted that the growth of fund assets across the complex allows Fidelity to reinvest in the development of services designed to enhance the value or convenience of the Fidelity funds as investment vehicles. These services include 24-hour access to account information and market information through phone representatives and over the Internet, and investor education materials and asset allocation tools.
Annual Report
Board Approval of Investment Advisory Contracts and
Management Fees - continued
Investment in a Large Fund Family. The Board considered the benefits to shareholders of investing in a Fidelity fund, including the benefits of investing in a fund that is part of a large family of funds offering a variety of investment disciplines and providing for a large variety of mutual fund investor services. For example, fund shareholders are offered the privilege of exchanging shares of the fund for shares of other Fidelity funds, as set forth in the fund's prospectus, without paying a sales charge. The Board noted that Fidelity has taken a number of actions over the previous year that benefited particular funds, including (i) dedicating additional resources to investment research and to restructure the investment research teams; (ii) contractually agreeing to reduce the management fees on Fidelity's Institutional Money Market Funds and launching Class IV and Institutional Class of certain of these funds; (iii) reducing the transfer agent fees for the Fidelity Select Portfolios and Investor Class of the VIP funds; and (iv) launching Class K of 29 equity funds as a lower-fee class available to certain employer-sponsored retirement plans.
Investment Performance. The Board considered whether the fund has operated within its investment objective, as well as its record of compliance with its investment restrictions. It also reviewed the fund's absolute investment performance for each class, as well as the fund's relative investment performance for each class measured against (i) a broad-based securities market index, and (ii) a peer group of mutual funds deemed appropriate by the Board. Because the fund had been in existence less than three calendar years, the following chart considered by the Board shows, for the one-year period ended December 31, 2007, the total returns of Institutional Class (Class I) and Class B of the fund, the total return of a broad-based securities market index ("benchmark"), and a range of total returns of a peer group of mutual funds identified by Lipper Inc. as having an investment objective similar to that of the fund. The returns of Institutional Class (Class I) and Class B show the performance of the highest and lowest performing classes, respectively. The box within the chart shows the 25th percentile return (bottom of box) and the 75th percentile return (top of box) of the peer group. Returns shown above the box are in the first quartile and returns shown below the box are in the fourth quartile. The percentage beaten numbers noted below the chart correspond to the percentile box and represent the percentage of funds in the peer group whose performance was equal to or lower than that of the class indicated.
Annual Report
Fidelity International Small Cap Opportunities Fund
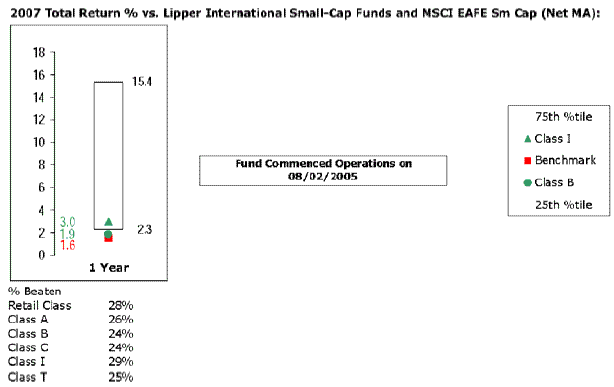
The Board reviewed the fund's relative investment performance against its peer group and stated that the performance of Institutional Class (Class I) of the fund was in the third quartile for the period shown. The Board also stated that the investment performance of Institutional Class (Class I) of the fund compared favorably to its benchmark for the period shown. The Board considered that the variations in performance among the fund's classes reflect the variations in class expenses, which result in lower performance for higher expense classes. The Board stated that it is difficult to evaluate in any comprehensive fashion the performance of the fund, in light of its relatively recent commencement of operations.
The Board also considered that the fund's management fee is subject to upward or downward adjustment depending upon whether, and to what extent, the fund's investment performance for the performance period exceeds, or is exceeded by, the record (over the same period) of a Board-approved performance adjustment index. The Board realizes that the performance adjustment provides FMR with a strong economic incentive to seek to achieve superior performance for the fund's shareholders and helps to more closely align the interests of FMR and the fund's shareholders.
The Board considered that FMR has taken steps to refocus and strengthen equity research, equity portfolio management, and compliance.
Based on its review, and giving particular weight to the nature and quality of the resources dedicated by the Investment Advisers to maintain and improve relative performance, the Board concluded that the nature, extent, and quality of the services provided to the fund will benefit the fund's shareholders, particularly in light of the Board's view that the fund's shareholders benefit from investing in a fund that is part of a large family of funds offering a variety of investment disciplines and services.
Annual Report
Board Approval of Investment Advisory Contracts and
Management Fees - continued
Competitiveness of Management Fee and Total Fund Expenses. The Board considered the fund's management fee and total expenses compared to "mapped groups" of competitive funds and classes. Fidelity creates "mapped groups" by combining similar Lipper investment objective categories that have comparable management fee characteristics. Combining Lipper investment objective categories aids the Board's management fee and total expense comparisons by broadening the competitive group used for comparison and by reducing the number of universes to which various Fidelity funds are compared. The Board also considered supplemental information about how the fund's management fee and total expenses ranked relative to groups based on Lipper classifications, which take into account a fund's market capitalization and style.
The Board considered two proprietary management fee comparisons for the 12-month (or shorter) periods shown in the chart below. The group of Lipper funds used by the Board for management fee comparisons is referred to below as the "Total Mapped Group" and, for the reasons explained above, is broader than the Lipper peer group used by the Board for performance comparisons. The Total Mapped Group comparison focuses on a fund's standing relative to the total universe of comparable funds available to investors, in terms of gross management fees before expense reimbursements or caps, and without giving effect to the fund's performance adjustment. "TMG %" represents the percentage of funds in the Total Mapped Group that had management fees that were lower than the fund's. For example, a TMG % of 21% means that 79% of the funds in the Total Mapped Group had higher management fees than the fund. The "Asset-Size Peer Group" (ASPG) comparison focuses on a fund's standing relative to non-Fidelity funds similar in size to the fund within the Total Mapped Group. The ASPG represents at least 15% of the funds in the Total Mapped Group with comparable asset size and management fee characteristics, subject to a minimum of 50 funds (or all funds in the Total Mapped Group if fewer than 50). Additional information, such as the ASPG quartile in which the fund's management fee ranked and the impact of the fund's performance adjustment, is also included in the chart and considered by the Board.
Annual Report
Fidelity International Small Cap Opportunities Fund

The Board noted that the fund's management fee ranked below the median of its Total Mapped Group and below the median of its ASPG for 2007. The Board also noted the effect of the fund's positive performance adjustment on the fund's management fee ranking. The Board noted that the performance adjustment for each year represents calculations for performance periods that differ from the period shown in the performance chart above.
Based on its review, the Board concluded that the fund's management fee was fair and reasonable in light of the services that the fund receives and the other factors considered.
In its review of each class's total expenses, the Board considered the fund's management fee as well as other fund or class expenses, as applicable, such as transfer agent fees, pricing and bookkeeping fees, fund-paid 12b-1 fees, and custodial, legal, and audit fees. The Board also noted the effects of any waivers and reimbursements on fees and expenses, as well as the impact of the fund's performance adjustment. As part of its review, the Board also considered current and historical total expenses of each class of the fund compared to competitive fund median expenses. Each class of the fund is compared to those funds and classes in the Total Mapped Group (used by the Board for management fee comparisons) that have a similar sales load structure.
The Board noted that the total expenses of each of Class A, Class B, Class C, Institutional Class, and Fidelity International Small Cap Opportunities (retail class) ranked below its competitive median for 2007, and the total expenses of Class T ranked above its competitive median for 2007. The Board considered that the total expenses of Class T were above the median primarily because its 12b-1 fee is higher than the typical front-end load class. The Board noted that the fund offers multiple classes, each of which has a different sales load and 12b-1 fee structure, and that the multiple structures are intended to offer a range of pricing options for the intermediary market. The Board also noted that the total expenses of the classes vary primarily by the level of their 12b-1 fees, although differences in transfer agent fees may also cause expenses to vary from class to class.
Annual Report
Board Approval of Investment Advisory Contracts and
Management Fees - continued
In its review of total expenses, the Board also considered Fidelity fee structures and other information on clients that FMR and its affiliates service in other competitive markets, such as other mutual funds advised or subadvised by FMR or its affiliates, pension plan clients, and other institutional clients.
Based on its review, the Board concluded that the total expenses of each class of the fund were reasonable, although in one case above the median of the universe presented for comparison, in light of the services that the fund and its shareholders receive and the other factors considered.
Costs of the Services and Profitability. The Board considered the revenues earned and the expenses incurred by Fidelity in conducting the business of developing, marketing, distributing, managing, administering and servicing the fund and its shareholders. The Board also considered the level of Fidelity's profits in respect of all the Fidelity funds.
On an annual basis, FMR presents to the Board Fidelity's profitability for the fund. Fidelity calculates the profitability for each fund, as well as aggregate profitability for groups of Fidelity funds and all Fidelity funds, using a series of detailed revenue and cost allocation methodologies which originate with the audited books and records of Fidelity. The Audit Committee of the Board reviews any significant changes from the prior year's methodologies.
PricewaterhouseCoopers LLP (PwC), independent registered public accounting firm and auditor to Fidelity and certain Fidelity funds, has been engaged annually by the Board as part of the Board's assessment of the results of Fidelity's profitability analysis. PwC's engagement includes the review and assessment of Fidelity's methodologies used in determining the revenues and expenses attributable to Fidelity's mutual fund business, and completion of agreed-upon procedures surrounding the mathematical accuracy of fund profitability and its conformity to allocation methodologies. After considering PwC's reports issued under the engagement and information provided by Fidelity, the Board believes that while other allocation methods may also be reasonable, Fidelity's profitability methodologies are reasonable in all material respects.
The Board has also reviewed Fidelity's non-fund businesses and any fall-out benefits related to the mutual fund business as well as cases where Fidelity's affiliates may benefit from or be related to the fund's business.
Annual Report
The Board considered the costs of the services provided by and the profits realized by Fidelity in connection with the operation of the fund and determined that the amount of profit is a fair entrepreneurial profit for the management of the fund.
Economies of Scale. The Board considered whether there have been economies of scale in respect of the management of the Fidelity funds, whether the Fidelity funds (including the fund) have appropriately benefited from any such economies of scale, and whether there is potential for realization of any further economies of scale. The Board considered the extent to which the fund will benefit from economies of scale through increased services to the fund, through waivers or reimbursements, or through fee or expense reductions.
The Board recognized that the fund's management contract incorporates a "group fee" structure, which provides for lower group fee rates as total fund assets under FMR's management increase, and for higher group fee rates as total fund assets under FMR's management decrease. FMR determines the group fee rates based on a tiered asset "breakpoint" schedule. The Board considered that the group fee is designed to deliver the benefits of economies of scale to fund shareholders when total fund assets increase, even if assets of any particular fund are unchanged or have declined, because some portion of Fidelity's costs are attributable to services provided to all Fidelity funds, and all funds benefit if those costs can be allocated among more assets. The Board concluded that, given the group fee structure, fund shareholders will achieve a certain level of economies of scale as assets under FMR's management increase at the fund complex level, regardless of whether Fidelity achieves any such economies of scale.
The Board further concluded that any potential economies of scale are being shared between fund shareholders and Fidelity in an appropriate manner.
Additional Information Requested by the Board. In order to develop fully the factual basis for consideration of the Fidelity funds' Advisory Contracts, the Board requested and received additional information on certain topics, including (i) fund performance trends and actions to be taken by FMR to improve certain funds' overall performance; (ii) portfolio manager changes that have occurred during the past year; (iii) Fidelity's fund profitability methodology, the profitability of certain fund service providers, and profitability trends for certain funds; (iv) Fidelity's compensation structure for portfolio managers and key personnel, including its effects on fund profitability and the extent to which portfolio manager compensation is linked to fund performance; (v) Fidelity's fee structures and rationale for recommending different fees among categories of funds; and (vi) Fidelity's rationale for recommending which funds should have a performance adjustment component as part of their management fees.
Based on its evaluation of all of the conclusions noted above, and after considering all material factors, the Board ultimately concluded that the advisory fee structures are fair and reasonable, and that the fund's Advisory Contracts should be renewed.
Annual Report
Investment Adviser
Fidelity Management & Research Company
Boston, MA
Investment Sub-Advisers
FMR Co., Inc.
Fidelity Management & Research
(U.K.) Inc.
Fidelity Management & Research
(Hong Kong) Limited
Fidelity Management & Research
(Japan) Inc.
Fidelity Research & Analysis Company
FIL Investment Advisors
Fidelity Investments Japan Limited
FIL Investment Advisors (U.K.) Ltd.
General Distributor
Fidelity Distributors Corporation
Boston, MA
Transfer and Service Agents
Fidelity Investments Institutional
Operations Company, Inc.
Boston, MA
Fidelity Service Company, Inc.
Boston, MA
Custodian
The Northern Trust Company
Chicago, IL
AILSI-UANN-1208
1.815081.103
Fidelity®
International Value
Fund
Annual Report
October 31, 2008
(2_fidelity_logos) (Registered_Trademark)
Contents
Chairman's Message | <Click Here> | Ned Johnson's message to shareholders. |
Performance | <Click Here> | How the fund has done over time. |
Management's Discussion | <Click Here> | The manager's review of fund performance, strategy and outlook. |
Shareholder Expense Example | <Click Here> | An example of shareholder expenses. |
Investment Changes | <Click Here> | A summary of major shifts in the fund's investments over the past six months. |
Investments | <Click Here> | A complete list of the fund's investments with their market values. |
Financial Statements | <Click Here> | Statements of assets and liabilities, operations, and changes in net assets, as well as financial highlights. |
Notes | <Click Here> | Notes to financial statements. |
Report of Independent Registered Public Accounting Firm | <Click Here> | |
Trustees and Officers | <Click Here> | |
Distributions | <Click Here> | |
Proxy Voting Results | <Click Here> | |
Board Approval of Investment Advisory Contracts and Management Fees | <Click Here> | |
To view a fund's proxy voting guidelines and proxy voting record for the 12-month period ended June 30, visit http://www.fidelity.com (search for "proxy voting guidelines") or visit the Securities and Exchange Commission's (SEC) web site at http://www.sec.gov. You may also call 1-800-544-8544 to request a free copy of the proxy voting guidelines.
Standard & Poor's, S&P and S&P 500 are registered service marks of The McGraw-Hill Companies, Inc. and have been licensed for use by Fidelity Distributors Corporation.
Other third party marks appearing herein are the property of their respective owners.
All other marks appearing herein are registered or unregistered trademarks or service marks of FMR LLC or an affiliated company.
Annual Report
This report and the financial statements contained herein are submitted for the general information of the shareholders of the fund. This report is not authorized for distribution to prospective investors in the fund unless preceded or accompanied by an effective prospectus.
A fund files its complete schedule of portfolio holdings with the SEC for the first and third quarters of each fiscal year on Form N-Q. Forms N-Q are available on the SEC's web site at http://www.sec.gov. A fund's Forms N-Q may be reviewed and copied at the SEC's Public Reference Room in Washington, DC. Information regarding the operation of the SEC's Public Reference Room may be obtained by calling 1-800-SEC-0330. For a complete list of a fund's portfolio holdings, view the most recent holdings listing, semiannual report, or annual report on Fidelity's web site at http://www.fidelity.com or http://www.advisor.fidelity.com, as applicable.
NOT FDIC INSURED · MAY LOSE VALUE · NO BANK GUARANTEE
Neither the fund nor Fidelity Distributors Corporation is a bank.
Annual Report
(photo_of_Edward_C_Johnson_3d)
Dear Shareholder:
Turmoil has been the watchword for the world's securities markets in 2008, with domestic and international stocks down sharply amid the global credit squeeze. A flight to quality boosted returns for U.S. Treasuries, one of the few asset classes with positive results heading into the latter stages of the year. Financial markets are always unpredictable, but there are a number of time-tested principles that can put the historical odds in your favor.
One of the basic tenets is to invest for the long term. Over time, riding out the markets' inevitable ups and downs has proven much more effective than selling into panic or chasing the hottest trend. Even missing only a few of the markets' best days can significantly diminish investor returns. Patience also affords the benefits of compounding - of earning interest on additional income or reinvested dividends and capital gains. There are tax advantages and cost benefits to consider as well. The more you sell, the more taxes you pay, and the more you trade, the higher the costs. While staying the course doesn't eliminate risk, it can considerably lessen the effect of short-term declines.
You can further manage your investing risk through diversification. And today, more than ever, geographic diversification should be taken into account. Studies indicate that asset allocation is the single most important determinant of a portfolio's long-term success. The right mix of stocks, bonds and cash - aligned to your particular risk tolerance and investment objective - is very important. Age-appropriate rebalancing is also an essential aspect of asset allocation. For younger investors, an emphasis on equities - which historically have been the best-performing asset class over time - is encouraged. As investors near their specific goal, such as retirement or sending a child to college, consideration may be given to replacing volatile assets (e.g. common stocks) with more-stable fixed investments (bonds or savings plans).
A third investment principle - investing regularly - can help lower the average cost of your purchases. Investing a certain amount of money each month or quarter helps ensure you won't pay for all your shares at market highs. This strategy - known as dollar cost averaging - also reduces unconstructive "emotion" from investing, helping shareholders avoid selling weak performers just prior to an upswing, or chasing a hot performer just before a correction.
We invite you to contact us via the Internet, through our Investor Centers or over the phone. It is our privilege to provide you the information you need to make the investments that are right for you.
Sincerely,
/s/Edward C. Johnson 3d
Edward C. Johnson 3d
Annual Report
Average annual total return reflects the change in the value of an investment, assuming reinvestment of the class' dividend income and capital gains (the profits earned upon the sale of securities that have grown in value, if any) and assuming a constant rate of performance each year. The $10,000 table and the fund's returns do not reflect the deduction of taxes that a shareholder would pay on fund distributions or the redemption of fund shares. During periods of reimbursement by Fidelity, a fund's total return will be greater than it would be had the reimbursement not occurred. How a fund did yesterday is no guarantee of how it will do tomorrow.
Average Annual Total Returns
Periods ended October 31, 2008 | | Past 1
year | Life of
fundA |
International Value | | -51.34% | -16.64% |
A From May 18, 2006
$10,000 Over Life of Fund
Let's say hypothetically that $10,000 was invested in International Value, a class of the fund, on May 18, 2006, when the fund started. The chart shows how the value of your investment would have changed, and also shows how the MSCI® Europe, Australasia, Far East (MSCI EAFE®) Value Index performed over the same period.
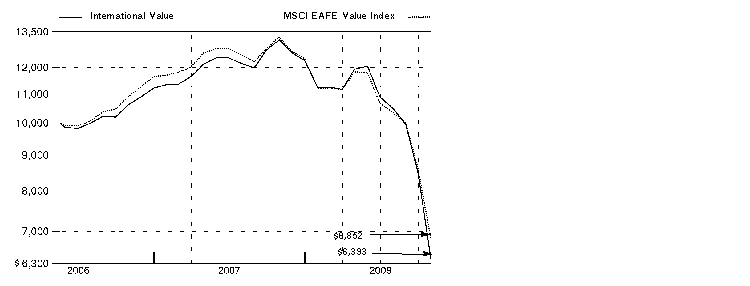
Annual Report
Comments from George Stairs, Portfolio Manager of Fidelity® International Value Fund
In a dramatic reversal of what had been a multiyear global growth story, international stocks fell long and hard during the 12 months ending October 31, 2008, especially so during the latter stages of the period and mostly as a result of fallout from the financial crisis that emanated from the United States. The viral spread of this financial contagion - which began in the U.S. subprime mortgage market, then seized up the credit markets, hobbled major financial institutions and eventually slowed economic growth worldwide - left virtually no corner of the globe untouched. Developed international equity markets - as gauged by the MSCI® Europe, Australasia, Far East (EAFE®) Index, which monitors established markets outside the U.S. and Canada - fell 46.54%, while the Standard & Poor's 500SM Index, a measure of U.S. stocks, dropped 36.10%. Among countries constituting at least 1% of the EAFE index, Switzerland had the "least worst" showing, falling roughly 32%, followed by Japan, where stocks slid by around 37%. Meanwhile, the weakest overall performance came from Belgium, where stocks slipped by nearly 70%. In the United Kingdom, the largest component of the index, equities were down almost 48%. Emerging markets were the weakest performers among the global economies, declining 56.22% as measured by the MSCI Emerging Markets Index.
International Value fell 51.34% for the year, compared with a 48.32% decline for the MSCI EAFE Value index, both returns reflecting the extremely poor performance of equities across the international markets. From a sector allocation perspective, the fund was properly positioned, particularly with its big underweighting in financials and slight overweightings in utilities and energy, which helped performance versus the index. Where it underperformed was in stock selection, with the greatest damage coming from picks in the banks, energy, utilities and media groups, as well as in materials. Among the biggest detractors were such names as UniCredit, a large Italian bank; Petroleum Geo-Services, a Norwegian energy services firm not held in the index; and BP, the big British integrated oil firm, which did relatively well and hurt us because we were significantly underweighted in the stock and eventually sold the position. Productive stock selection in the pharmaceuticals, biotechnology and life science group, as well as in diversified financials and transportation, offset some of our shortfall versus the MSCI benchmark. Top contributors included Swiss drug maker Roche Holding and Japanese passenger rail system East Japan Railway.
The views expressed above reflect those of the portfolio manager(s) only through the end of the period as stated on the cover of this report and do not necessarily represent the views of Fidelity or any other person in the Fidelity organization. Any such views are subject to change at any time based upon market or other conditions and Fidelity disclaims any responsibility to update such views. These views may not be relied on as investment advice and, because investment decisions for a Fidelity fund are based on numerous factors, may not be relied on as an indication of trading intent on behalf of any Fidelity fund.
Annual Report
Shareholder Expense Example
As a shareholder of the Fund, you incur two types of costs: (1) transaction costs, including sales charges (loads) on purchase payments or redemption proceeds, redemption fees, and (2) ongoing costs, including management fees, distribution and/or service (12b-1) fees and other Fund expenses. This Example is intended to help you understand your ongoing costs (in dollars) of investing in the Fund and to compare these costs with the ongoing costs of investing in other mutual funds.
The Example is based on an investment of $1,000 invested at the beginning of the period and held for the entire period (May 1, 2008 to October 31, 2008).
Actual Expenses
The first line of the accompanying table for each class of the Fund provides information about actual account values and actual expenses. You may use the information in this line, together with the amount you invested, to estimate the expenses that you paid over the period. Simply divide your account value by $1,000.00 (for example, an $8,600 account value divided by $1,000.00 = 8.6), then multiply the result by the number in the first line for a class of the Fund under the heading entitled "Expenses Paid During Period" to estimate the expenses you paid on your account during this period. A small balance maintenance fee of $12.00 that is charged once a year may apply for certain accounts with a value of less than $2,000. This fee is not included in the table below. If it was, the estimate of expenses you paid during the period would be higher, and your ending account value lower, by this amount. In addition, the Fund, as a shareholder in the underlying Fidelity Central Funds, will indirectly bear its pro rata share of the fees and expenses incurred by the underlying Fidelity Central Funds. These fees and expenses are not included in the Fund's annualized expense ratio used to calculate the expense estimate in the table below.
Hypothetical Example for Comparison Purposes
The second line of the accompanying table for each class of the Fund provides information about hypothetical account values and hypothetical expenses based on a Class' actual expense ratio and an assumed rate of return of 5% per year before expenses, which is not the Class' actual return. The hypothetical account values and expenses may not be used to estimate the actual ending account balance or expenses you paid for the period. You may use this information to compare the ongoing costs of investing in the Fund and other funds. To do so, compare this 5% hypothetical example with the 5% hypothetical examples that appear in the shareholder reports of the other funds. A small balance maintenance fee of $12.00 that is charged once a year may apply for certain accounts with a value of less than $2,000. This fee is not included in the table below. If it was, the estimate of expenses you paid during the period would be higher, and your ending account value lower, by this amount. In addition, the Fund, as a shareholder in the underlying Fidelity Central Funds, will indirectly bear its pro rata share of the fees and expenses incurred by the underlying Fidelity Central Funds. These fees and expenses are not included in the Fund's annualized expense ratio used to calculate the expense estimate in the table below.
Please note that the expenses shown in the table are meant to highlight your ongoing costs only and do not reflect any transaction costs. Therefore, the second line of the table is useful in comparing ongoing costs only, and will not help you determine the relative total costs of owning different funds. In addition, if these transactional costs were included, your costs would have been higher.
Annual Report
| Annualized
Expense Ratio | Beginning
Account Value
May 1, 2008 | Ending
Account Value
October 31, 2008 | Expenses Paid
During Period*
May 1, 2008 to October 31, 2008 |
Class A | 1.41% | | | |
Actual | | $ 1,000.00 | $ 534.70 | $ 5.44 |
HypotheticalA | | $ 1,000.00 | $ 1,018.05 | $ 7.15 |
Class T | 1.66% | | | |
Actual | | $ 1,000.00 | $ 534.40 | $ 6.40 |
HypotheticalA | | $ 1,000.00 | $ 1,016.79 | $ 8.42 |
Class B | 2.16% | | | |
Actual | | $ 1,000.00 | $ 532.60 | $ 8.32 |
HypotheticalA | | $ 1,000.00 | $ 1,014.28 | $ 10.94 |
Class C | 2.16% | | | |
Actual | | $ 1,000.00 | $ 533.10 | $ 8.32 |
HypotheticalA | | $ 1,000.00 | $ 1,014.28 | $ 10.94 |
International Value | 1.10% | | | |
Actual | | $ 1,000.00 | $ 535.60 | $ 4.25 |
HypotheticalA | | $ 1,000.00 | $ 1,019.61 | $ 5.58 |
Institutional Class | 1.00% | | | |
Actual | | $ 1,000.00 | $ 536.00 | $ 3.86 |
HypotheticalA | | $ 1,000.00 | $ 1,020.11 | $ 5.08 |
A 5% return per year before expenses
* Expenses are equal to each Class' annualized expense ratio, multiplied by the average account value over the period, multiplied by 184/366 (to reflect the one-half year period).
Annual Report
Investment Changes (Unaudited)
Geographic Diversification (% of fund's net assets) |
As of October 31, 2008 |
| Japan 19.6% |
| United Kingdom 14.2% |
| Germany 13.5% |
| France 11.5% |
| Switzerland 7.5% |
| Italy 4.8% |
| Spain 3.6% |
| Norway 3.0% |
| Cayman Islands 2.6% |
| Other 19.7% |
Percentages are adjusted for the effect of futures contracts, if applicable. |
|
As of April 30, 2008 |
| Japan 17.8% |
| United Kingdom 14.8% |
| Germany 11.3% |
| France 8.8% |
| Switzerland 6.1% |
| Spain 5.3% |
| United States of America 4.5% |
| Italy 4.5% |
| Norway 4.4% |
| Other 22.5% |

Percentages are adjusted for the effect of futures contracts, if applicable. |
Asset Allocation |
| % of fund's
net assets | % of fund's net assets
6 months ago |
Stocks | 99.2 | 97.1 |
Short-Term Investments and Net Other Assets | 0.8 | 2.9 |
Top Ten Stocks as of October 31, 2008 |
| % of fund's
net assets | % of fund's net assets
6 months ago |
Royal Dutch Shell PLC Class A sponsored ADR (United Kingdom, Oil, Gas & Consumable Fuels) | 3.7 | 2.7 |
Toyota Motor Corp. (Japan, Automobiles) | 3.5 | 2.5 |
Roche Holding AG (participation certificate) (Switzerland, Pharmaceuticals) | 3.4 | 2.4 |
Muenchener Rueckversicherungs-Gesellschaft AG (Reg.) (Germany, Insurance) | 3.0 | 1.9 |
E.ON AG (Germany, Electric Utilities) | 2.9 | 2.1 |
Mitsui & Co. Ltd. (Japan, Trading Companies & Distributors) | 2.6 | 2.8 |
Total SA sponsored ADR (France, Oil, Gas & Consumable Fuels) | 2.6 | 1.6 |
AXA SA sponsored ADR (France, Insurance) | 2.6 | 2.2 |
UniCredit SpA (Italy, Commercial Banks) | 2.5 | 3.1 |
Allianz AG sponsored ADR (Germany, Insurance) | 2.4 | 2.5 |
| 29.2 | |
Market Sectors as of October 31, 2008 |
| % of fund's
net assets | % of fund's net assets
6 months ago |
Financials | 32.2 | 33.1 |
Energy | 14.9 | 15.4 |
Consumer Discretionary | 9.5 | 10.2 |
Industrials | 9.2 | 9.6 |
Utilities | 8.2 | 6.2 |
Telecommunication Services | 7.0 | 4.4 |
Materials | 5.9 | 6.7 |
Health Care | 5.1 | 3.5 |
Information Technology | 4.0 | 4.7 |
Consumer Staples | 3.2 | 3.3 |
Annual Report
Investments October 31, 2008
Showing Percentage of Net Assets
Common Stocks - 98.4% |
| Shares | | Value |
Australia - 2.1% |
AMP Ltd. | 388,042 | | $ 1,410,774 |
Macquarie Airports unit | 462,720 | | 657,723 |
Macquarie Group Ltd. (d) | 34,191 | | 677,961 |
Macquarie Infrastructure Group unit | 593,083 | | 776,966 |
TOTAL AUSTRALIA | | 3,523,424 |
Bermuda - 0.7% |
Seadrill Ltd. | 128,500 | | 1,237,198 |
Brazil - 1.4% |
Petroleo Brasileiro SA - Petrobras sponsored ADR | 49,700 | | 1,336,433 |
Uniao de Bancos Brasileiros SA (Unibanco) GDR | 15,100 | | 952,508 |
TOTAL BRAZIL | | 2,288,941 |
Canada - 1.3% |
Canadian Natural Resources Ltd. | 8,100 | | 408,560 |
First Quantum Minerals Ltd. | 34,000 | | 716,205 |
Nexen, Inc. | 29,800 | | 473,024 |
Petrobank Energy & Resources Ltd. (a) | 33,800 | | 644,717 |
TOTAL CANADA | | 2,242,506 |
Cayman Islands - 2.6% |
Chaoda Modern Agriculture (Holdings) Ltd. | 1,478,800 | | 1,041,847 |
Subsea 7, Inc. (a) | 41,000 | | 325,902 |
Transocean, Inc. (a) | 37,739 | | 3,107,052 |
TOTAL CAYMAN ISLANDS | | 4,474,801 |
China - 0.4% |
China Construction Bank Corp. (H Shares) | 939,000 | | 465,815 |
Nine Dragons Paper (Holdings) Ltd. | 1,087,000 | | 187,456 |
TOTAL CHINA | | 653,271 |
Cyprus - 0.4% |
Marfin Popular Bank Public Co. | 182,371 | | 617,712 |
Denmark - 0.1% |
Vestas Wind Systems AS (a) | 4,500 | | 184,319 |
Finland - 1.1% |
Fortum Oyj | 13,200 | | 324,404 |
Nokia Corp. sponsored ADR | 98,600 | | 1,496,748 |
TOTAL FINLAND | | 1,821,152 |
France - 11.5% |
Accor SA | 13,400 | | 521,331 |
Common Stocks - continued |
| Shares | | Value |
France - continued |
AXA SA sponsored ADR (d) | 231,500 | | $ 4,331,365 |
BNP Paribas SA | 49,400 | | 3,566,744 |
Compagnie de St. Gobain | 13,700 | | 528,639 |
GDF Suez | 33,989 | | 1,519,294 |
Renault SA | 9,400 | | 288,089 |
Total SA: | | | |
Series B | 43,700 | | 2,404,087 |
sponsored ADR | 80,500 | | 4,462,920 |
Unibail-Rodamco | 12,072 | | 1,810,615 |
TOTAL FRANCE | | 19,433,084 |
Germany - 13.3% |
Allianz AG sponsored ADR | 527,900 | | 4,001,482 |
BASF AG | 16,700 | | 561,558 |
Daimler AG | 114,700 | | 3,957,150 |
E.ON AG | 130,300 | | 4,984,860 |
GEA Group AG | 11,600 | | 169,522 |
GFK AG | 21,800 | | 430,496 |
Muenchener Rueckversicherungs-Gesellschaft AG (Reg.) | 38,200 | | 5,070,095 |
RWE AG | 37,300 | | 3,117,125 |
Tognum AG | 29,900 | | 332,442 |
TOTAL GERMANY | | 22,624,730 |
Greece - 0.4% |
Public Power Corp. of Greece | 51,600 | | 638,043 |
Hong Kong - 1.7% |
China Overseas Land & Investment Ltd. | 450,000 | | 508,167 |
Swire Pacific Ltd. (A Shares) | 340,300 | | 2,396,628 |
TOTAL HONG KONG | | 2,904,795 |
India - 0.7% |
Satyam Computer Services Ltd. sponsored ADR | 63,600 | | 1,000,428 |
Suzlon Energy Ltd. | 177,784 | | 161,161 |
TOTAL INDIA | | 1,161,589 |
Ireland - 1.2% |
Bank of Ireland | 134,771 | | 397,944 |
C&C Group PLC | 103,600 | | 150,697 |
CRH PLC sponsored ADR (d) | 68,800 | | 1,455,808 |
TOTAL IRELAND | | 2,004,449 |
Israel - 0.4% |
Israel Chemicals Ltd. | 69,400 | | 672,725 |
Common Stocks - continued |
| Shares | | Value |
Italy - 4.2% |
ENI SpA sponsored ADR | 32,300 | | $ 1,552,015 |
Fiat SpA | 49,200 | | 391,029 |
Finmeccanica SpA | 73,400 | | 898,002 |
UniCredit SpA | 1,740,700 | | 4,259,013 |
TOTAL ITALY | | 7,100,059 |
Japan - 19.6% |
Aeon Co. Ltd. | 172,700 | | 1,655,948 |
Canon, Inc. | 12,350 | | 432,125 |
Denso Corp. | 76,100 | | 1,483,158 |
East Japan Railway Co. | 243 | | 1,729,101 |
Ibiden Co. Ltd. | 20,300 | | 379,722 |
JSR Corp. | 49,500 | | 558,325 |
Konica Minolta Holdings, Inc. | 183,500 | | 1,205,039 |
Miraca Holdings, Inc. | 68,600 | | 1,106,238 |
Mitsubishi Estate Co. Ltd. | 25,000 | | 446,561 |
Mitsui & Co. Ltd. | 464,000 | | 4,495,703 |
Nomura Holdings, Inc. | 47,000 | | 445,271 |
Obic Co. Ltd. | 3,880 | | 474,898 |
ORIX Corp. | 27,620 | | 2,837,621 |
Osaka Gas Co. Ltd. | 872,000 | | 3,084,319 |
Sumitomo Corp. | 97,000 | | 853,367 |
Sumitomo Metal Industries Ltd. | 330,000 | | 848,697 |
Sumitomo Mitsui Financial Group, Inc. | 132 | | 529,143 |
Sumitomo Trust & Banking Co. Ltd. | 117,000 | | 541,809 |
Takeda Pharmaceutical Co. Ltd. | 22,200 | | 1,102,956 |
Tokuyama Corp. | 295,000 | | 1,493,853 |
Toyota Motor Corp. | 150,800 | | 5,888,579 |
Xebio Co. Ltd. | 61,200 | | 1,044,818 |
Yamada Denki Co. Ltd. | 12,060 | | 656,394 |
TOTAL JAPAN | | 33,293,645 |
Kazakhstan - 0.4% |
JSC Halyk Bank of Kazakhstan unit | 140,800 | | 598,400 |
Korea (South) - 0.2% |
Shinhan Financial Group Co. Ltd. | 15,390 | | 375,570 |
Mexico - 0.6% |
America Movil SAB de CV Series L sponsored ADR | 33,200 | | 1,027,208 |
Netherlands - 1.5% |
Heineken NV (Bearer) | 20,200 | | 681,411 |
Common Stocks - continued |
| Shares | | Value |
Netherlands - continued |
ING Groep NV sponsored ADR (d) | 54,600 | | $ 508,326 |
Koninklijke KPN NV | 99,100 | | 1,395,644 |
TOTAL NETHERLANDS | | 2,585,381 |
Norway - 3.0% |
DnB Nor ASA | 200,000 | | 1,159,067 |
Orkla ASA (A Shares) | 348,750 | | 2,321,704 |
Petroleum Geo-Services ASA (a) | 195,250 | | 972,230 |
StatoilHydro ASA sponsored ADR | 32,200 | | 647,220 |
TOTAL NORWAY | | 5,100,221 |
Philippines - 0.7% |
Philippine Long Distance Telephone Co. sponsored ADR | 29,100 | | 1,190,190 |
Russia - 0.9% |
OAO Gazprom sponsored ADR | 78,300 | | 1,601,235 |
Singapore - 1.2% |
DBS Group Holdings Ltd. | 272,000 | | 2,076,311 |
South Africa - 0.5% |
Impala Platinum Holdings Ltd. | 82,100 | | 847,890 |
Spain - 3.6% |
Banco Bilbao Vizcaya Argentaria SA sponsored ADR (d) | 127,800 | | 1,482,480 |
Banco Santander SA | 174,400 | | 1,886,164 |
Telefonica SA sponsored ADR | 47,800 | | 2,653,378 |
TOTAL SPAIN | | 6,022,022 |
Sweden - 0.5% |
Telefonaktiebolaget LM Ericsson (B Shares) | 132,600 | | 902,487 |
Switzerland - 7.5% |
EFG International | 63,690 | | 1,370,798 |
Nestle SA (Reg.) | 20,489 | | 796,584 |
Roche Holding AG (participation certificate) | 37,748 | | 5,771,438 |
Sonova Holding AG | 18,842 | | 782,727 |
Swiss Life Holding AG | 9,690 | | 872,940 |
Zurich Financial Services AG (Reg.) | 15,415 | | 3,126,685 |
TOTAL SWITZERLAND | | 12,721,172 |
Taiwan - 0.3% |
Advanced Semiconductor Engineering, Inc. | 390,993 | | 166,477 |
Hon Hai Precision Industry Co. Ltd. (Foxconn) | 174,000 | | 422,010 |
TOTAL TAIWAN | | 588,487 |
Common Stocks - continued |
| Shares | | Value |
Thailand - 0.1% |
Total Access Communication PCL unit | 216,000 | | $ 154,379 |
Turkey - 0.1% |
Turkiye Garanti Bankasi AS (a) | 82,000 | | 133,873 |
United Kingdom - 14.2% |
Aegis Group PLC | 821,800 | | 865,981 |
Anglo American PLC (United Kingdom) | 38,195 | | 958,243 |
BAE Systems PLC | 224,200 | | 1,260,064 |
Barratt Developments PLC | 40,600 | | 50,538 |
BHP Billiton PLC | 23,200 | | 393,900 |
British American Tobacco PLC (United Kingdom) | 11,500 | | 315,398 |
easyJet PLC (a) | 169,400 | | 844,962 |
HBOS PLC | 394,809 | | 646,392 |
HSBC Holdings PLC (United Kingdom) (Reg.) | 86,205 | | 1,020,905 |
Informa PLC | 135,400 | | 458,674 |
Man Group PLC | 203,100 | | 1,172,449 |
Misys PLC | 222,200 | | 397,821 |
National Grid PLC | 30,100 | | 339,038 |
Prudential PLC | 252,728 | | 1,269,382 |
Rio Tinto PLC (Reg.) | 26,100 | | 1,219,037 |
Royal Bank of Scotland Group PLC | 1,135,181 | | 1,250,266 |
Royal Dutch Shell PLC Class A sponsored ADR | 112,700 | | 6,289,791 |
Tesco PLC | 106,000 | | 580,714 |
Vodafone Group PLC | 372,400 | | 716,303 |
Vodafone Group PLC sponsored ADR | 195,812 | | 3,773,297 |
Xstrata PLC | 11,800 | | 201,806 |
TOTAL UNITED KINGDOM | | 24,024,961 |
TOTAL COMMON STOCKS (Cost $290,059,335) | 166,826,230 |
Nonconvertible Preferred Stocks - 0.8% |
| | | |
Germany - 0.2% |
ProSiebenSat.1 Media AG | 89,600 | | 270,434 |
Italy - 0.6% |
Fiat SpA (Risp) | 27,800 | | 126,000 |
Telecom Italia SpA (Risp) | 1,172,100 | | 986,350 |
TOTAL ITALY | | 1,112,350 |
TOTAL NONCONVERTIBLE PREFERRED STOCKS (Cost $3,399,874) | 1,382,784 |
Money Market Funds - 1.5% |
| Shares | | Value |
Fidelity Cash Central Fund, 1.81% (b) | 807,368 | | $ 807,368 |
Fidelity Securities Lending Cash Central Fund, 2.67% (b)(c) | 1,638,860 | | 1,638,860 |
TOTAL MONEY MARKET FUNDS (Cost $2,446,228) | 2,446,228 |
TOTAL INVESTMENT PORTFOLIO - 100.7% (Cost $295,905,437) | | 170,655,242 |
NET OTHER ASSETS - (0.7)% | | (1,169,534) |
NET ASSETS - 100% | $ 169,485,708 |
Legend |
(a) Non-income producing |
(b) Affiliated fund that is available only to investment companies and other accounts managed by Fidelity Investments. The rate quoted is the annualized seven-day yield of the fund at period end. A complete unaudited listing of the fund's holdings as of its most recent quarter end is available upon request. |
(c) Investment made with cash collateral received from securities on loan. |
(d) Security or a portion of the security is on loan at period end. |
Affiliated Central Funds |
Information regarding fiscal year to date income earned by the Fund from investments in Fidelity Central Funds is as follows: |
Fund | Income earned |
Fidelity Cash Central Fund | $ 102,969 |
Fidelity Securities Lending Cash Central Fund | 417,002 |
Total | $ 519,971 |
Income Tax Information |
At October 31, 2008, the fund had a capital loss carryforward of approximately $17,062,233 all of which will expire on October 31, 2016. |
See accompanying notes which are an integral part of the financial statements.
Annual Report
Statement of Assets and Liabilities
| October 31, 2008 |
| | |
Assets | | |
Investment in securities, at value (including securities loaned of $1,573,351) - See accompanying schedule: Unaffiliated issuers (cost $293,459,209) | $ 168,209,014 | |
Fidelity Central Funds (cost $2,446,228) | 2,446,228 | |
Total Investments (cost $295,905,437) | | $ 170,655,242 |
Foreign currency held at value (cost $11,124) | | 11,206 |
Receivable for investments sold | | 782,358 |
Receivable for fund shares sold | | 126,211 |
Dividends receivable | | 756,476 |
Distributions receivable from Fidelity Central Funds | | 13,358 |
Prepaid expenses | | 110 |
Other receivables | | 10,852 |
Total assets | | 172,355,813 |
| | |
Liabilities | | |
Payable for investments purchased | $ 787,826 | |
Payable for fund shares redeemed | 235,454 | |
Accrued management fee | 76,047 | |
Distribution fees payable | 4,028 | |
Other affiliated payables | 62,661 | |
Other payables and accrued expenses | 65,229 | |
Collateral on securities loaned, at value | 1,638,860 | |
Total liabilities | | 2,870,105 |
| | |
Net Assets | | $ 169,485,708 |
Net Assets consist of: | | |
Paid in capital | | $ 310,179,781 |
Undistributed net investment income | | 5,906,440 |
Accumulated undistributed net realized gain (loss) on investments and foreign currency transactions | | (21,368,384) |
Net unrealized appreciation (depreciation) on investments and assets and liabilities in foreign currencies | | (125,232,129) |
Net Assets | | $ 169,485,708 |
See accompanying notes which are an integral part of the financial statements.
Annual Report
Statement of Assets and Liabilities - continued
| October 31, 2008 |
| | |
Calculation of Maximum Offering Price
Class A:
Net Asset Value and redemption price per share ($2,854,331 ÷ 481,103 shares) | | $ 5.93 |
| | |
Maximum offering price per share (100/94.25 of $5.93) | | $ 6.29 |
Class T:
Net Asset Value and redemption price per share ($2,086,796 ÷ 353,285 shares) | | $ 5.91 |
| | |
Maximum offering price per share (100/96.50 of $5.91) | | $ 6.12 |
Class B:
Net Asset Value and offering price per share ($930,749 ÷ 158,228 shares)A | | $ 5.88 |
| | |
Class C:
Net Asset Value and offering price per share ($1,784,476 ÷ 303,662 shares)A | | $ 5.88 |
| | |
| | |
International Value:
Net Asset Value, offering price and redemption price per share ($160,777,143 ÷ 27,001,723 shares) | | $ 5.95 |
| | |
Institutional Class:
Net Asset Value, offering price and redemption price per share ($1,052,213 ÷ 176,561 shares) | | $ 5.96 |
A Redemption price per share is equal to net asset value less any applicable contingent deferred sales charge.
See accompanying notes which are an integral part of the financial statements.
Annual Report
Financial Statements - continued
Statement of Operations
| Year ended October 31, 2008 |
| | |
Investment Income | | |
Dividends | | $ 11,310,376 |
Income from Fidelity Central Funds | | 519,971 |
| | 11,830,347 |
Less foreign taxes withheld | | (1,004,576) |
Total income | | 10,825,771 |
| | |
Expenses | | |
Management fee
Basic fee | $ 2,219,944 | |
Performance adjustment | 37,496 | |
Transfer agent fees | 755,414 | |
Distribution fees | 100,125 | |
Accounting and security lending fees | 166,400 | |
Custodian fees and expenses | 74,291 | |
Independent trustees' compensation | 1,436 | |
Registration fees | 82,664 | |
Audit | 62,472 | |
Legal | 1,823 | |
Miscellaneous | 51,367 | |
Total expenses before reductions | 3,553,432 | |
Expense reductions | (34,143) | 3,519,289 |
Net investment income (loss) | | 7,306,482 |
Realized and Unrealized Gain (Loss) Net realized gain (loss) on: | | |
Investment securities: | | |
Unaffiliated issuers (net of foreign taxes of $20,535) | (21,080,305) | |
Foreign currency transactions | (178,048) | |
Total net realized gain (loss) | | (21,258,353) |
Change in net unrealized appreciation (depreciation) on: Investment securities | (181,075,670) | |
Assets and liabilities in foreign currencies | 12,629 | |
Total change in net unrealized appreciation (depreciation) | | (181,063,041) |
Net gain (loss) | | (202,321,394) |
Net increase (decrease) in net assets resulting from operations | | $ (195,014,912) |
See accompanying notes which are an integral part of the financial statements.
Annual Report
Statement of Changes in Net Assets
| Year ended
October 31,
2008 | Year ended
October 31,
2007 |
Increase (Decrease) in Net Assets | | |
Operations | | |
Net investment income (loss) | $ 7,306,482 | $ 6,846,508 |
Net realized gain (loss) | (21,258,353) | 23,723,355 |
Change in net unrealized appreciation (depreciation) | (181,063,041) | 43,769,419 |
Net increase (decrease) in net assets resulting
from operations | (195,014,912) | 74,339,282 |
Distributions to shareholders from net investment income | (5,562,901) | (978,516) |
Distributions to shareholders from net realized gain | (18,717,865) | (557,946) |
Total distributions | (24,280,766) | (1,536,462) |
Share transactions - net increase (decrease) | (16,138,151) | 101,052,444 |
Redemption fees | 26,598 | 30,746 |
Total increase (decrease) in net assets | (235,407,231) | 173,886,010 |
| | |
Net Assets | | |
Beginning of period | 404,892,939 | 231,006,929 |
End of period (including undistributed net investment income of $5,906,440 and undistributed net investment income of $6,624,232, respectively) | $ 169,485,708 | $ 404,892,939 |
See accompanying notes which are an integral part of the financial statements.
Annual Report
Financial Highlights - Class A
Years ended October 31, | 2008 | 2007 | 2006 I |
Selected Per-Share Data | | | |
Net asset value, beginning of period | $ 13.02 | $ 10.60 | $ 10.00 |
Income from Investment Operations | | | |
Net investment income (loss) E | .21 | .18 | .06 H |
Net realized and unrealized gain (loss) | (6.53) | 2.29 | .54 |
Total from investment operations | (6.32) | 2.47 | .60 |
Distributions from net investment income | (.15) | (.03) | - |
Distributions from net realized gain | (.62) | (.02) | - |
Total distributions | (.77) | (.05) | - |
Redemption fees added to paid in capital E, K | - | - | - |
Net asset value, end of period | $ 5.93 | $ 13.02 | $ 10.60 |
Total Return B, C, D | (51.50)% | 23.43% | 6.00% |
Ratios to Average Net Assets F, J | | | |
Expenses before reductions | 1.42% | 1.38% | 1.75% A |
Expenses net of fee waivers, if any | 1.42% | 1.38% | 1.50% A |
Expenses net of all reductions | 1.41% | 1.37% | 1.46% A |
Net investment income (loss) | 2.05% | 1.49% | 1.29% A, H |
Supplemental Data | | | |
Net assets, end of period (000 omitted) | $ 2,854 | $ 6,052 | $ 1,537 |
Portfolio turnover rate G | 68% | 59% | 29% A |
A Annualized
B Total returns for periods of less than one year are not annualized.
C Total returns would have been lower had certain expenses not been reduced during the periods shown.
D Total returns do not include the effect of the sales charges.
E Calculated based on average shares outstanding during the period.
F Fees and expenses of the underlying Fidelity Central Funds are not included in the Fund's expense ratio. The Fund indirectly bears its proportionate share of the expenses of any underlying Fidelity Central Funds.
G Amount does not include the portfolio activity of any underlying Fidelity Central Funds.
H Investment income per share reflects a special dividend which amounted to $.03 per share. Excluding the special dividend, the ratio of net investment income (loss) to average net assets would have been .63%.
I For the period May 18, 2006 (commencement of operations) to October 31, 2006.
J Expense ratios reflect operating expenses of the class. Expenses before reductions do not reflect amounts reimbursed by the investment adviser or reductions from brokerage service arrangements or other expense offset arrangements and do not represent the amount paid by the class during periods when reimbursements or reductions occur. Expense ratios before reductions for start-up periods may not be representative of longer-term operating periods. Expenses net of fee waivers reflect expenses after reimbursement by the investment adviser but prior to reductions from brokerage service arrangements or other expense offset arrangements. Expenses net of all reductions represent the net expenses paid by the class.
K Amount represents less than $.01 per share.
See accompanying notes which are an integral part of the financial statements.
Annual Report
Financial Highlights - Class T
Years ended October 31, | 2008 | 2007 | 2006 I |
Selected Per-Share Data | | | |
Net asset value, beginning of period | $ 12.99 | $ 10.59 | $ 10.00 |
Income from Investment Operations | | | |
Net investment income (loss) E | .18 | .15 | .05 H |
Net realized and unrealized gain (loss) | (6.50) | 2.29 | .54 |
Total from investment operations | (6.32) | 2.44 | .59 |
Distributions from net investment income | (.14) | (.02) | - |
Distributions from net realized gain | (.62) | (.02) | - |
Total distributions | (.76) | (.04) | - |
Redemption fees added to paid in capital E, K | - | - | - |
Net asset value, end of period | $ 5.91 | $ 12.99 | $ 10.59 |
Total Return B, C, D | (51.60)% | 23.13% | 5.90% |
Ratios to Average Net Assets F, J | | | |
Expenses before reductions | 1.67% | 1.60% | 2.01% A |
Expenses net of fee waivers, if any | 1.67% | 1.60% | 1.75% A |
Expenses net of all reductions | 1.66% | 1.58% | 1.71% A |
Net investment income (loss) | 1.80% | 1.27% | 1.04% A, H |
Supplemental Data | | | |
Net assets, end of period (000 omitted) | $ 2,087 | $ 5,081 | $ 1,789 |
Portfolio turnover rate G | 68% | 59% | 29% A |
A Annualized
B Total returns for periods of less than one year are not annualized.
C Total returns would have been lower had certain expenses not been reduced during the periods shown.
D Total returns do not include the effect of the sales charges.
E Calculated based on average shares outstanding during the period.
F Fees and expenses of the underlying Fidelity Central Funds are not included in the Fund's expense ratio. The Fund indirectly bears its proportionate share of the expenses of any underlying Fidelity Central Funds.
G Amount does not include the portfolio activity of any underlying Fidelity Central Funds.
H Investment income per share reflects a special dividend which amounted to $.03 per share. Excluding the special dividend, the ratio of net investment income (loss) to average net assets would have been .38%.
I For the period May 18, 2006 (commencement of operations) to October 31, 2006.
J Expense ratios reflect operating expenses of the class. Expenses before reductions do not reflect amounts reimbursed by the investment adviser or reductions from brokerage service arrangements or other expense offset arrangements and do not represent the amount paid by the class during periods when reimbursements or reductions occur. Expense ratios before reductions for start-up periods may not be representative of longer-term operating periods. Expenses net of fee waivers reflect expenses after reimbursement by the investment adviser but prior to reductions from brokerage service arrangements or other expense offset arrangements. Expenses net of all reductions represent the net expenses paid by the class.
K Amount represents less than $.01 per share.
See accompanying notes which are an integral part of the financial statements.
Annual Report
Financial Highlights - Class B
Years ended October 31, | 2008 | 2007 | 2006 I |
Selected Per-Share Data | | | |
Net asset value, beginning of period | $ 12.93 | $ 10.56 | $ 10.00 |
Income from Investment Operations | | | |
Net investment income (loss) E | .13 | .09 | .02 H |
Net realized and unrealized gain (loss) | (6.48) | 2.29 | .54 |
Total from investment operations | (6.35) | 2.38 | .56 |
Distributions from net investment income | (.08) | - | - |
Distributions from net realized gain | (.62) | (.01) | - |
Total distributions | (.70) | (.01) | - |
Redemption fees added to paid in capital E, K | - | - | - |
Net asset value, end of period | $ 5.88 | $ 12.93 | $ 10.56 |
Total Return B, C, D | (51.85)% | 22.59% | 5.60% |
Ratios to Average Net Assets F, J | | | |
Expenses before reductions | 2.18% | 2.10% | 2.50% A |
Expenses net of fee waivers, if any | 2.18% | 2.10% | 2.25% A |
Expenses net of all reductions | 2.17% | 2.08% | 2.21% A |
Net investment income (loss) | 1.29% | .77% | .54% A, H |
Supplemental Data | | | |
Net assets, end of period (000 omitted) | $ 931 | $ 2,651 | $ 1,304 |
Portfolio turnover rate G | 68% | 59% | 29% A |
A Annualized
B Total returns for periods of less than one year are not annualized.
C Total returns would have been lower had certain expenses not been reduced during the periods shown.
D Total returns do not include the effect of the contingent deferred sales charge.
E Calculated based on average shares outstanding during the period.
F Fees and expenses of the underlying Fidelity Central Funds are not included in the Fund's expense ratio. The Fund indirectly bears its proportionate share of the expenses of any underlying Fidelity Central Funds.
G Amount does not include the portfolio activity of any underlying Fidelity Central Funds.
H Investment income per share reflects a special dividend which amounted to $.03 per share. Excluding the special dividend, the ratio of net investment income (loss) to average net assets would have been (.12)%.
I For the period May 18, 2006 (commencement of operations) to October 31, 2006.
J Expense ratios reflect operating expenses of the class. Expenses before reductions do not reflect amounts reimbursed by the investment adviser or reductions from brokerage service arrangements or other expense offset arrangements and do not represent the amount paid by the class during periods when reimbursements or reductions occur. Expense ratios before reductions for start-up periods may not be representative of longer-term operating periods. Expenses net of fee waivers reflect expenses after reimbursement by the investment adviser but prior to reductions from brokerage service arrangements or other expense offset arrangements. Expenses net of all reductions represent the net expenses paid by the class.
K Amount represents less than $.01 per share.
See accompanying notes which are an integral part of the financial statements.
Annual Report
Financial Highlights - Class C
Years ended October 31, | 2008 | 2007 | 2006 I |
Selected Per-Share Data | | | |
Net asset value, beginning of period | $ 12.92 | $ 10.56 | $ 10.00 |
Income from Investment Operations | | | |
Net investment income (loss) E | .13 | .09 | .02 H |
Net realized and unrealized gain (loss) | (6.47) | 2.29 | .54 |
Total from investment operations | (6.34) | 2.38 | .56 |
Distributions from net investment income | (.08) | - | - |
Distributions from net realized gain | (.62) | (.02) | - |
Total distributions | (.70) | (.02) | - |
Redemption fees added to paid in capital E, K | - | - | - |
Net asset value, end of period | $ 5.88 | $ 12.92 | $ 10.56 |
Total Return B, C, D | (51.80)% | 22.56% | 5.60% |
Ratios to Average Net Assets F, J | | | |
Expenses before reductions | 2.17% | 2.07% | 2.47% A |
Expenses net of fee waivers, if any | 2.17% | 2.07% | 2.25% A |
Expenses net of all reductions | 2.16% | 2.05% | 2.21% A |
Net investment income (loss) | 1.30% | .80% | .54% A, H |
Supplemental Data | | | |
Net assets, end of period (000 omitted) | $ 1,784 | $ 5,996 | $ 2,183 |
Portfolio turnover rate G | 68% | 59% | 29% A |
A Annualized
B Total returns for periods of less than one year are not annualized.
C Total returns would have been lower had certain expenses not been reduced during the periods shown.
D Total returns do not include the effect of the contingent deferred sales charge.
E Calculated based on average shares outstanding during the period.
F Fees and expenses of the underlying Fidelity Central Funds are not included in the Fund's expense ratio. The Fund indirectly bears its proportionate share of the expenses of any underlying Fidelity Central Funds.
G Amount does not include the portfolio activity of any underlying Fidelity Central Funds.
H Investment income per share reflects a special dividend which amounted to $.03 per share. Excluding the special dividend, the ratio of net investment income (loss) to average net assets would have been (.12)%.
I For the period May 18, 2006 (commencement of operations) to October 31, 2006.
J Expense ratios reflect operating expenses of the class. Expenses before reductions do not reflect amounts reimbursed by the investment adviser or reductions from brokerage service arrangements or other expense offset arrangements and do not represent the amount paid by the class during periods when reimbursements or reductions occur. Expense ratios before reductions for start-up periods may not be representative of longer-term operating periods. Expenses net of fee waivers reflect expenses after reimbursement by the investment adviser but prior to reductions from brokerage service arrangements or other expense offset arrangements. Expenses net of all reductions represent the net expenses paid by the class.
K Amount represents less than $.01 per share.
See accompanying notes which are an integral part of the financial statements.
Annual Report
Financial Highlights - International Value
Years ended October 31, | 2008 | 2007 | 2006 H |
Selected Per-Share Data | | | |
Net asset value, beginning of period | $ 13.06 | $ 10.61 | $ 10.00 |
Income from Investment Operations | | | |
Net investment income (loss) D | .24 | .22 | .07 G |
Net realized and unrealized gain (loss) | (6.54) | 2.29 | .54 |
Total from investment operations | (6.30) | 2.51 | .61 |
Distributions from net investment income | (.19) | (.04) | - |
Distributions from net realized gain | (.62) | (.02) | - |
Total distributions | (.81) | (.06) | - |
Redemption fees added to paid in capital D, J | - | - | - |
Net asset value, end of period | $ 5.95 | $ 13.06 | $ 10.61 |
Total Return B, C | (51.34)% | 23.81% | 6.10% |
Ratios to Average Net Assets E, I | | | |
Expenses before reductions | 1.10% | 1.03% | 1.50% A |
Expenses net of fee waivers, if any | 1.10% | 1.03% | 1.25% A |
Expenses net of all reductions | 1.09% | 1.02% | 1.21% A |
Net investment income (loss) | 2.37% | 1.84% | 1.54% A, G |
Supplemental Data | | | |
Net assets, end of period (000 omitted) | $ 160,777 | $ 381,148 | $ 221,130 |
Portfolio turnover rate F | 68% | 59% | 29% A |
A Annualized
B Total returns for periods of less than one year are not annualized.
C Total returns would have been lower had certain expenses not been reduced during the periods shown.
D Calculated based on average shares outstanding during the period.
E Fees and expenses of the underlying Fidelity Central Funds are not included in the Fund's expense ratio. The Fund indirectly bears its proportionate share of the expenses of any underlying Fidelity Central Funds.
F Amount does not include the portfolio activity of any underlying Fidelity Central Funds.
G Investment income per share reflects a special dividend which amounted to $.03 per share. Excluding the special dividend, the ratio of net investment income (loss) to average net assets would have been .88%.
H For the period May 18, 2006 (commencement of operations) to October 31, 2006.
I Expense ratios reflect operating expenses of the class. Expenses before reductions do not reflect amounts reimbursed by the investment adviser or reductions from brokerage service arrangements or other expense offset arrangements and do not represent the amount paid by the class during periods when reimbursements or reductions occur. Expense ratios before reductions for start-up periods may not be representative of longer-term operating periods. Expenses net of fee waivers reflect expenses after reimbursement by the investment adviser but prior to reductions from brokerage service arrangements or other expense offset arrangements. Expenses net of all reductions represent the net expenses paid by the class.
J Amount represents less than $.01 per share.
See accompanying notes which are an integral part of the financial statements.
Annual Report
Financial Highlights - Institutional Class
Years ended October 31, | 2008 | 2007 | 2006 H |
Selected Per-Share Data | | | |
Net asset value, beginning of period | $ 13.07 | $ 10.61 | $ 10.00 |
Income from Investment Operations | | | |
Net investment income (loss) D | .25 | .22 | .07 G |
Net realized and unrealized gain (loss) | (6.54) | 2.30 | .54 |
Total from investment operations | (6.29) | 2.52 | .61 |
Distributions from net investment income | (.20) | (.04) | - |
Distributions from net realized gain | (.62) | (.02) | - |
Total distributions | (.82) | (.06) | - |
Redemption fees added to paid in capital D, J | - | - | - |
Net asset value, end of period | $ 5.96 | $ 13.07 | $ 10.61 |
Total Return B, C | (51.27)% | 23.91% | 6.10% |
Ratios to Average Net Assets E, I | | | |
Expenses before reductions | 1.02% | .98% | 1.38% A |
Expenses net of fee waivers, if any | 1.02% | .98% | 1.25% A |
Expenses net of all reductions | 1.01% | .96% | 1.21% A |
Net investment income (loss) | 2.45% | 1.89% | 1.54% A, G |
Supplemental Data | | | |
Net assets, end of period (000 omitted) | $ 1,052 | $ 3,965 | $ 3,064 |
Portfolio turnover rate F | 68% | 59% | 29% A |
A Annualized
B Total returns for periods of less than one year are not annualized.
C Total returns would have been lower had certain expenses not been reduced during the periods shown.
D Calculated based on average shares outstanding during the period.
E Fees and expenses of the underlying Fidelity Central Funds are not included in the Fund's expense ratio. The Fund indirectly bears its proportionate share of the expenses of any underlying Fidelity Central Funds.
F Amount does not include the portfolio activity of any underlying Fidelity Central Funds.
G Investment income per share reflects a special dividend which amounted to $.03 per share. Excluding the special dividend, the ratio of net investment income (loss) to average net assets would have been .88%.
H For the period May 18, 2006 (commencement of operations) to October 31, 2006.
I Expense ratios reflect operating expenses of the class. Expenses before reductions do not reflect amounts reimbursed by the investment adviser or reductions from brokerage service arrangements or other expense offset arrangements and do not represent the amount paid by the class during periods when reimbursements or reductions occur. Expense ratios before reductions for start-up periods may not be representative of longer-term operating periods. Expenses net of fee waivers reflect expenses after reimbursement by the investment adviser but prior to reductions from brokerage service arrangements or other expense offset arrangements. Expenses net of all reductions represent the net expenses paid by the class.
J Amount represents less than $.01 per share.
See accompanying notes which are an integral part of the financial statements.
Annual Report
Notes to Financial Statements
For the period ended October 31, 2008
1. Organization.
Fidelity International Value Fund (the Fund) is a fund of Fidelity Investment Trust (the trust) and is authorized to issue an unlimited number of shares. The trust is registered under the Investment Company Act of 1940, as amended (the 1940 Act), as an open-end management investment company organized as a Massachusetts business trust. The Fund offers Class A, Class T, Class B, Class C, International Value and Institutional Class shares, each of which has equal rights as to assets and voting privileges. Each class has exclusive voting rights with respect to matters that affect that class. Class B shares will automatically convert to Class A shares after a holding period of seven years from the initial date of purchase. Investment income, realized and unrealized capital gains and losses, the common expenses of the Fund, and certain fund-level expense reductions, if any, are allocated on a pro rata basis to each class based on the relative net assets of each class to the total net assets of the Fund. Each class differs with respect to transfer agent and distribution and service plan fees incurred. Certain expense reductions also differ by class.
The Fund's investments in emerging markets can be subject to social, economic, regulatory, and political uncertainties and can be extremely volatile.
2. Investments in Fidelity Central Funds.
The Fund may invest in Fidelity Central Funds, which are open-end investment companies available only to other investment companies and accounts managed by Fidelity Management & Research Company (FMR) and its affiliates. The Fund's Schedule of Investments lists each of the Fidelity Central Funds held as of period end, if any, as an investment of the Fund, but does not include the underlying holdings of each Fidelity Central Fund. As an Investing Fund, the Fund indirectly bears its proportionate share of the expenses of the underlying Fidelity Central Funds.
The Money Market Central Funds seek preservation of capital and current income and are managed by Fidelity Investments Money Management, Inc. (FIMM), an affiliate of FMR.
A complete unaudited list of holdings for each Fidelity Central Fund is available upon request or at the SEC's web site at www.sec.gov. In addition, the financial statements of the Fidelity Central Funds, which are not covered by the Fund's Report of Independent Registered Public Accounting Firm, are available on the SEC's web site or upon request.
3. Significant Accounting Policies.
The financial statements have been prepared in conformity with accounting principles generally accepted in the United States of America, which require management to make certain estimates and assumptions at the date of the financial statements. Actual results could differ from those estimates. The following summarizes the significant accounting policies of the Fund:
Annual Report
3. Significant Accounting Policies - continued
Security Valuation. Investments are valued as of 4:00 p.m. Eastern time on the last calendar day of the period. Wherever possible, the Fund uses independent pricing services approved by the Board of Trustees to value its investments.
Equity securities, including restricted securities, for which market quotations are readily available, are valued at the last reported sale price or official closing price as reported by an independent pricing service on the primary market or exchange on which they are traded. In the event there were no sales during the day or closing prices are not available, securities are valued at the last quoted bid price. Investments in open-end mutual funds, including Fidelity Central Funds, are valued at their closing net asset value each business day. Short-term securities with remaining maturities of sixty days or less for which quotations are not readily available are valued at amortized cost, which approximates value.
When current market prices or quotations are not readily available or reliable, valuations may be determined in good faith in accordance with procedures adopted by the Board of Trustees. Factors used in determining value may include significant market or security specific events, changes in interest rates and credit quality, and developments in foreign markets which are monitored by evaluating the performance of ADRs, futures contracts and exchange-traded funds. The frequency with which these procedures are used cannot be predicted and may be utilized to a significant extent. The value of securities used for net asset value (NAV) calculation under these procedures may differ from published prices for the same securities.
Foreign Currency. The Fund uses foreign currency contracts to facilitate transactions in foreign-denominated securities. Losses from these transactions may arise from changes in the value of the foreign currency or if the counterparties do not perform under the contracts' terms.
Foreign-denominated assets, including investment securities, and liabilities are translated into U.S. dollars at the exchange rate at period end. Purchases and sales of investment securities, income and dividends received and expenses denominated in foreign currencies are translated into U.S. dollars at the exchange rate in effect on the transaction date.
The effects of exchange rate fluctuations on investments are included with the net realized and unrealized gain (loss) on investment securities. Other foreign currency transactions resulting in realized and unrealized gain (loss) are disclosed separately.
Annual Report
Notes to Financial Statements - continued
3. Significant Accounting Policies - continued
Investment Transactions and Income. For financial reporting purposes, the Fund's investment holdings and NAV include trades executed through the end of the last business day of the period. The NAV per share for processing shareholder transactions is calculated as of the close of business of the New York Stock Exchange (NYSE), normally 4:00 p.m. Eastern time and includes trades executed through the end of the prior business day. Gains and losses on securities sold are determined on the basis of identified cost. Dividend income is recorded on the ex-dividend date, except for certain dividends from foreign securities where the ex-dividend date may have passed, which are recorded as soon as the Fund is informed of the ex-dividend date. Non-cash dividends included in dividend income, if any, are recorded at the fair market value of the securities received. Interest income and distributions from the Fidelity Central Funds are accrued as earned. Interest income includes coupon interest and amortization of premium and accretion of discount on debt securities. Investment income is recorded net of foreign taxes withheld where recovery of such taxes is uncertain.
Expenses. Most expenses of the trust can be directly attributed to a fund. Expenses which cannot be directly attributed are apportioned among each Fund in the trust. Expense estimates are accrued in the period to which they relate and adjustments are made when actual amounts are known.
Income Tax Information and Distributions to Shareholders. Each year, the Fund intends to qualify as a regulated investment company by distributing substantially all of its taxable income and realized gains under Subchapter M of the Internal Revenue Code and filing its U.S. federal tax return. As a result, no provision for income taxes is required. The Fund is subject to the provisions of FASB Interpretation No. 48, Accounting for Uncertainties in Income Taxes (FIN 48). FIN 48 sets forth a minimum threshold for financial statement recognition of the benefit of a tax position taken or expected to be taken in a tax return. The implementation of FIN 48 did not result in any unrecognized tax benefits in the accompanying financial statements. Each of the Fund's federal tax returns for the prior three fiscal years remains subject to examination by the Internal Revenue Service (IRS). Foreign taxes are provided for based on the Fund's understanding of the tax rules and rates that exist in the foreign markets in which it invests.
Distributions are recorded on the ex-dividend date. Income dividends and capital gain distributions are declared separately for each class. Income and capital gain distributions are determined in accordance with income tax regulations, which may differ from generally accepted accounting principles. In addition, the Fund will claim a portion of the payment made to redeeming shareholders as a distribution for income tax purposes.
Capital accounts within the financial statements are adjusted for permanent book-tax differences. These adjustments have no impact on net assets or the results of operations. Temporary book-tax differences will reverse in a subsequent period.
Annual Report
3. Significant Accounting Policies - continued
Income Tax Information and Distributions to Shareholders - continued
Book-tax differences are primarily due to foreign currency transactions, certain foreign taxes, passive foreign investment companies (PFIC), capital loss carryforwards and losses deferred due to wash sales.
The tax-basis components of distributable earnings and the federal tax cost as of period end were as follows:
Unrealized appreciation | $ 807,051 |
Unrealized depreciation | (130,345,335) |
Net unrealized appreciation (depreciation) | (129,538,284) |
Undistributed ordinary income | 2,463,569 |
Capital loss carryforward | (17,062,233) |
| |
Cost for federal income tax purposes | $ 300,193,526 |
The tax character of distributions paid was as follows:
| October 31, 2008 | October 31, 2007 |
Ordinary Income | $ 14,016,131 | $ 1,536,462 |
Long-term Capital Gains | 10,264,635 | - |
Total | $ 24,280,766 | $ 1,536,462 |
Short-Term Trading (Redemption) Fees. Shares held in the Fund less than 30 days are subject to a redemption fee equal to 1.00% of the proceeds of the redeemed shares. All redemption fees, including any estimated redemption fees paid by FMR, are retained by the Fund and accounted for as an addition to paid in capital.
New Accounting Pronouncement. In September 2006, Statement of Financial Accounting Standards No. 157, Fair Value Measurements (SFAS 157), was issued and is effective for fiscal years beginning after November 15, 2007. SFAS 157 defines fair value, establishes a framework for measuring fair value and results in expanded disclosures about fair value measurements.
4. Operating Policies.
Repurchase Agreements. FMR has received an Exemptive Order from the Securities and Exchange Commission (the SEC) which permits the Fund and other affiliated entities of FMR to transfer uninvested cash balances into joint trading accounts which are then invested in repurchase agreements. The Fund may also invest directly with institutions in repurchase agreements. Repurchase agreements are collateralized by government or non-government securities. Upon settlement date, collateral is held in segregated accounts with custodian banks and may be obtained in the event of a default of the counterparty. The
Annual Report
Notes to Financial Statements - continued
4. Operating Policies - continued
Repurchase Agreements - continued
Fund monitors, on a daily basis, the value of the collateral to ensure it is at least equal to the principal amount of the repurchase agreement (including accrued interest). In the event of a default by the counterparty, realization of the collateral proceeds could be delayed, during which time the value of the collateral may decline.
5. Purchases and Sales of Investments.
Purchases and sales of securities, other than short-term securities, aggregated $212,491,909 and $242,763,038, respectively.
6. Fees and Other Transactions with Affiliates.
Management Fee. FMR and its affiliates provide the Fund with investment management related services for which the Fund pays a monthly management fee. The management fee is the sum of an individual fund fee rate that is based on an annual rate of .45% of the Fund's average net assets and a group fee rate that averaged .26% during the period. The group fee rate is based upon the average net assets of all the mutual funds advised by FMR. The group fee rate decreases as assets under management increase and increases as assets under management decrease. In addition, the management fee is subject to a performance adjustment (up to a maximum of ± .20% of the Fund's average net assets over a 36 month performance period). The upward or downward adjustment to the management fee is based on the relative investment performance of the retail class of the Fund, International Value as compared to an appropriate benchmark index. For the period, the total annual management fee rate, including the performance adjustment, was .72% of the Fund's average net assets.
Distribution and Service Plan. In accordance with Rule 12b-1 of the 1940 Act, the Fund has adopted separate Distribution and Service Plans for each class of shares. Certain classes pay Fidelity Distributors Corporation (FDC), an affiliate of FMR, separate Distribution and Service Fees, each of which is based on an annual percentage of each class' average net assets. In addition, FDC may pay financial intermediaries for selling shares of the Fund and providing shareholder support services. For the period, the Distribution and Service Fee rates and the total amounts paid to and retained by FDC were as follows:
| Distribution
Fee | Service
Fee | Paid to
FDC | Retained
by FDC |
Class A | -% | .25% | $ 13,754 | $ 2,352 |
Class T | .25% | .25% | 20,752 | 3,584 |
Class B | .75% | .25% | 21,357 | 18,195 |
Class C | .75% | .25% | 44,262 | 14,734 |
| | | $ 100,125 | $ 38,865 |
Annual Report
6. Fees and Other Transactions with Affiliates - continued
Sales Load. FDC receives a front-end sales charge of up to 5.75% for selling Class A shares, and 3.50% for selling Class T shares, some of which is paid to financial intermediaries for selling shares of the Fund. FDC receives the proceeds of contingent deferred sales charges levied on Class A, Class T, Class B, and Class C redemptions. These charges depend on the holding period. The deferred sales charges range from 5% to 1% for Class B, 1% for Class C, 1.00% to .50% for certain purchases of Class A shares and .25% for certain purchases of Class T shares.
For the period, sales charge amounts retained by FDC were as follows:
| Retained
by FDC |
Class A | $ 6,886 |
Class T | 1,276 |
Class B* | 3,402 |
Class C* | 626 |
| $ 12,190 |
* When Class B and Class C shares are initially sold, FDC pays commissions from its own resources to financial intermediaries through which the sales are made.
Transfer Agent Fees. Fidelity Investments Institutional Operations Company, Inc. (FIIOC), an affiliate of FMR, is the transfer, dividend disbursing and shareholder servicing agent for each class of the Fund. FIIOC receives account fees and asset-based fees that vary according to the account size and type of account of the shareholders of the respective classes of the Fund. FIIOC pays for typesetting, printing, and mailing of shareholder reports, except proxy statements. Prior to January 1, 2008, Fidelity Service Company, Inc. (FSC), also an affiliate of FMR was the transfer agent for International Value. For the period, the total transfer agent fees paid by each class were as follows:
| Amount | % of
Average
Net Assets |
Class A | $ 16,622 | .30 |
Class T | 12,810 | .31 |
Class B | 6,621 | .31 |
Class C | 13,325 | .30 |
International Value | 701,661 | .24 |
Institutional Class | 4,375 | .16 |
| $ 755,414 | |
Annual Report
Notes to Financial Statements - continued
6. Fees and Other Transactions with Affiliates - continued
Accounting and Security Lending Fees. FSC, an affiliate of FMR, maintains the Fund's accounting records. The accounting fee is based on the level of average net assets for the month. Under a separate contract, FSC administers the security lending program. The security lending fee is based on the number and duration of lending transactions.
Brokerage Commissions. The Fund placed a portion of its portfolio transactions with brokerage firms which are affiliates of the investment adviser. The commissions paid to these affiliated firms were $982 for the period.
7. Committed Line of Credit.
The Fund participates with other funds managed by FMR in a $4.2 billion credit facility (the "line of credit") to be utilized for temporary or emergency purposes to fund shareholder redemptions or for other short-term liquidity purposes. The Fund has agreed to pay commitment fees on its pro rata portion of the line of credit, which amounted to $652 and is reflected in Miscellaneous Expense on the Statement of Operations. During the period, there were no borrowings on this line of credit.
8. Security Lending.
The Fund lends portfolio securities from time to time in order to earn additional income. On the settlement date of the loan, the Fund receives collateral (in the form of U.S. Treasury obligations, letters of credit and/or cash) against the loaned securities and maintains collateral in an amount not less than 100% of the market value of the loaned securities during the period of the loan. The market value of the loaned securities is determined at the close of business of the Fund and any additional required collateral is delivered to the Fund on the next business day. If the borrower defaults on its obligation to return the securities loaned because of insolvency or other reasons, a fund could experience delays and costs in recovering the securities loaned or in gaining access to the collateral. Any cash collateral received is invested in the Fidelity Securities Lending Cash Central Fund. The value of loaned securities and cash collateral at period end are disclosed on the Fund's Statement of Assets and Liabilities. Security lending income represents the income earned on investing cash collateral, less fees and expenses associated with the loan, plus any premium payments that may be received on the loan of certain types of securities. Security lending income is presented in the Statement of Operations as a component of income from Fidelity Central Funds. Net income from lending portfolio securities during the period amounted to $417,002.
9. Expense Reductions.
Many of the brokers with whom FMR places trades on behalf of the Fund provided services to the Fund in addition to trade execution. These services included payments of certain expenses on behalf of the Fund totaling $34,143 for the period.
Annual Report
10. Other.
The Fund's organizational documents provide former and current trustees and officers with a limited indemnification against liabilities arising in connection with the performance of their duties to the Fund. In the normal course of business, the Fund may also enter into contracts that provide general indemnifications. The Fund's maximum exposure under these arrangements is unknown as this would be dependent on future claims that may be made against the Fund. The risk of material loss from such claims is considered remote.
During the period, Lehman Brothers Holdings, Inc. and certain of its affiliates (LBHI) sought protection under the insolvency laws of their jurisdictions of organization, including the United States, the United Kingdom and Japan. At the time LBHI's insolvency proceedings were instituted, the Fund had outstanding securities trades with counterparties affiliated with LBHI. As a result of the insolvency proceedings, LBHI is unable to fulfill its commitments and, in certain cases, the Fund may have terminated its trades and related agreements with the relevant entities and, where appropriate, is in the process of initiating claims for damages. FMR believes that the financial impact to the Fund relating to the terminated trades and agreements is immaterial.
11. Distributions to Shareholders.
Distributions to shareholders of each class were as follows:
Years ended October 31, | 2008 | 2007 |
From net investment income | | |
Class A | $ 71,381 | $ 5,613 |
Class T | 53,705 | 4,267 |
Class B | 15,783 | - |
Class C | 37,642 | - |
International Value | 5,325,187 | 956,069 |
Institutional Class | 59,203 | 12,567 |
Total | $ 5,562,901 | $ 978,516 |
From net realized gain | | |
Class A | $ 297,020 | $ 3,983 |
Class T | 246,645 | 4,693 |
Class B | 128,753 | 1,788 |
Class C | 295,420 | 4,566 |
International Value | 17,561,793 | 536,333 |
Institutional Class | 188,234 | 6,583 |
Total | $ 18,717,865 | $ 557,946 |
Annual Report
Notes to Financial Statements - continued
12. Share Transactions.
Transactions for each class of shares were as follows:
| Shares | Dollars |
Years ended October 31, | 2008 | 2007 | 2008 | 2007 |
Class A | | | | |
Shares sold | 298,063 | 556,341 | $ 3,154,503 | $ 6,434,905 |
Reinvestment of distributions | 30,184 | 863 | 357,686 | 9,431 |
Shares redeemed | (312,021) | (237,384) | (3,010,663) | (2,953,175) |
Net increase (decrease) | 16,226 | 319,820 | $ 501,526 | $ 3,491,161 |
Class T | | | | |
Shares sold | 169,412 | 281,943 | $ 1,740,848 | $ 3,296,913 |
Reinvestment of distributions | 21,586 | 806 | 255,358 | 8,796 |
Shares redeemed | (228,991) | (60,435) | (2,152,407) | (714,379) |
Net increase (decrease) | (37,993) | 222,314 | $ (156,201) | $ 2,591,330 |
Class B | | | | |
Shares sold | 48,187 | 114,852 | $ 472,858 | $ 1,342,524 |
Reinvestment of distributions | 10,866 | 151 | 128,544 | 1,653 |
Shares redeemed | (105,867) | (33,404) | (916,142) | (398,508) |
Net increase (decrease) | (46,814) | 81,599 | $ (314,740) | $ 945,669 |
Class C | | | | |
Shares sold | 114,256 | 337,076 | $ 1,072,554 | $ 3,929,869 |
Reinvestment of distributions | 22,711 | 319 | 268,223 | 3,483 |
Shares redeemed | (297,329) | (80,082) | (2,692,615) | (988,817) |
Net increase (decrease) | (160,362) | 257,313 | $ (1,351,838) | $ 2,944,535 |
International Value | | | | |
Shares sold | 13,343,931 | 26,426,338 | $ 131,489,328 | $ 309,978,984 |
Reinvestment of distributions | 1,810,134 | 127,337 | 21,468,187 | 1,391,798 |
Shares redeemed | (17,329,561) | (18,219,061) | (166,721,411) | (220,454,791) |
Net increase (decrease) | (2,175,496) | 8,334,614 | $ (13,763,896) | $ 90,915,991 |
Institutional Class | | | | |
Shares sold | 50,248 | 75,655 | $ 566,166 | $ 870,496 |
Reinvestment of distributions | 6,826 | 692 | 80,952 | 7,564 |
Shares redeemed | (183,848) | (61,819) | (1,700,120) | (714,302) |
Net increase (decrease) | (126,774) | 14,528 | $ (1,053,002) | $ 163,758 |
Annual Report
To the Trustees of Fidelity Investment Trust and Shareholders of Fidelity International Value Fund:
We have audited the accompanying statement of assets and liabilities of Fidelity International Value Fund (the Fund), a fund of Fidelity Investment Trust, including the schedule of investments, as of October 31, 2008, and the related statement of operations for the year then ended, the statement of changes in net assets for each of the two years in the period then ended, and the financial highlights for each of the two years in the period then ended and for the period from May 18, 2006 (commencement of operations) to October 31, 2006. These financial statements and financial highlights are the responsibility of the Fund's management. Our responsibility is to express an opinion on these financial statements and financial highlights based on our audits.
We conducted our audits in accordance with standards of the Public Company Accounting Oversight Board (United States). Those standards require that we plan and perform the audit to obtain reasonable assurance about whether the financial statements and financial highlights are free of material misstatement. The Fund is not required to have, nor were we engaged to perform, an audit of its internal control over financial reporting. Our audits included consideration of internal control over financial reporting as a basis for designing audit procedures that are appropriate in the circumstances, but not for the purpose of expressing an opinion on the effectiveness of the Fund's internal control over financial reporting. Accordingly, we express no such opinion. An audit also includes examining, on a test basis, evidence supporting the amounts and disclosures in the financial statements, assessing the accounting principles used and significant estimates made by management, as well as evaluating the overall financial statement presentation. Our procedures included confirmation of securities owned as of October 31, 2008, by correspondence with the custodians and brokers; where replies were not received from brokers, we performed other auditing procedures. We believe that our audits provide a reasonable basis for our opinion.
In our opinion, the financial statements and financial highlights referred to above present fairly, in all material respects, the financial position of Fidelity International Value Fund as of October 31, 2008, the results of its operations for the year then ended, the changes in its net assets for each of the two years in the period then ended, and its financial highlights for each of the two years in the period then ended, and the financial highlights for each of the two years in the period then ended, and for the period from May 18, 2006 (commencement of operations) to October 31, 2006 in conformity with accounting principles generally accepted in the United States of America.
/s/ Deloitte & Touche LLP
DELOITTE & TOUCHE LLP
Boston, Massachusetts
December 19, 2008
Annual Report
The Trustees, Member of the Advisory Board, and executive officers of the trust and fund, as applicable, are listed below. The Board of Trustees governs the fund and is responsible for protecting the interests of shareholders. The Trustees are experienced executives who meet periodically throughout the year to oversee the fund's activities, review contractual arrangements with companies that provide services to the fund, and review the fund's performance. Except for Edward C. Johnson 3d and James C. Curvey, each of the Trustees oversees 220 funds advised by FMR or an affiliate. Messrs. Johnson and Curvey oversee 379 funds advised by FMR or an affiliate.
The Trustees hold office without limit in time except that (a) any Trustee may resign; (b) any Trustee may be removed by written instrument, signed by at least two-thirds of the number of Trustees prior to such removal; (c) any Trustee who requests to be retired or who has become incapacitated by illness or injury may be retired by written instrument signed by a majority of the other Trustees; and (d) any Trustee may be removed at any special meeting of shareholders by a two-thirds vote of the outstanding voting securities of the trust. Each Trustee who is not an interested person (as defined in the 1940 Act) (Independent Trustee), shall retire not later than the last day of the calendar year in which his or her 72nd birthday occurs. The Independent Trustees may waive this mandatory retirement age policy with respect to individual Trustees. The executive officers and Advisory Board Member hold office without limit in time, except that any officer and Advisory Board Member may resign or may be removed by a vote of a majority of the Trustees at any regular meeting or any special meeting of the Trustees. Except as indicated, each individual has held the office shown or other offices in the same company for the past five years.
The fund's Statement of Additional Information (SAI) includes more information about the Trustees. To request a free copy, call Fidelity at 1-877-208-0098.
Interested Trustees*:
Correspondence intended for each Trustee who is an interested person may be sent to Fidelity Investments, 82 Devonshire Street, Boston, Massachusetts 02109.
Name, Age; Principal Occupation |
Edward C. Johnson 3d (78) |
| Year of Election or Appointment:1984 Mr. Johnson is Chairman of the Board of Trustees. Mr. Johnson serves as Chief Executive Officer, Chairman, and a Director of FMR LLC; Chairman and a Director of FMR; Chairman and a Director of Fidelity Research & Analysis Company (FRAC); Chairman and a Director of Fidelity Investments Money Management, Inc.; and Chairman and a Director of FMR Co., Inc. In addition, Mr. Johnson serves as Chairman and Director of FIL Limited. Previously, Mr. Johnson served as President of FMR LLC (2006-2007). |
James C. Curvey (73) |
| Year of Election or Appointment: 2007 Mr. Curvey also serves as Trustee (2007-present) of other investment companies advised by FMR. Mr. Curvey is a Director of FMR and FMR Co., Inc. (2007-present). Mr. Curvey is also Vice Chairman (2006-
present) and Director of FMR LLC. In addition, Mr. Curvey serves as an Overseer for the Boston Symphony Orchestra and a member of the Trustees of Villanova University. |
* Trustees have been determined to be "Interested Trustees" by virtue of, among other things, their affiliation with the trust or various entities under common control with FMR. FMR Corp. merged with and into FMR LLC on October 1, 2007. Any references to FMR LLC for prior periods are deemed to be references to the prior entity.
Independent Trustees:
Correspondence intended for each Independent Trustee (that is, the Trustees other than the Interested Trustees) may be sent to Fidelity Investments, P.O. Box 55235, Boston, Massachusetts 02205-5235.
Name, Age; Principal Occupation |
Dennis J. Dirks (60) |
| Year of Election or Appointment: 2005 Prior to his retirement in May 2003, Mr. Dirks was Chief Operating Officer and a member of the Board of The Depository Trust & Clearing Corporation (DTCC) (1999-2003). He also served as President, Chief Operating Officer, and Board member of The Depository Trust Company (DTC) (1999-2003) and President and Board member of the National Securities Clearing Corporation (NSCC) (1999-2003). In addition, Mr. Dirks served as a Trustee and a member of the Finance Committee of Manhattan College (2005-2008), and as Chief Executive Officer and Board member of the Government Securities Clearing Corporation (2001-2003) and Chief Executive Officer and Board member of the Mortgage-Backed Securities Clearing Corporation (2001-2003). Mr. Dirks also serves as a Trustee and a member of the Finance Committee of AHRC of Nassau County (2006-present). |
Alan J. Lacy (55) |
| Year of Election or Appointment: 2008 Mr. Lacy serves as Senior Adviser (2007-present) of Oak Hill Capital Partners, L.P. (a private equity firm). Mr. Lacy also served as Chief Executive Officer (2000-2005) and Vice Chairman (2005-2006) of Sears Holdings Corporation and Sears, Roebuck and Co. (retail). In addition, Mr. Lacy serves as a member of the Board of Directors of The Western Union Company (global money transfer, 2006-present) and Bristol-Myers Squibb (global pharmaceuticals, 2007-present). Mr. Lacy is a Trustee of the National Parks Conservation Association and The Field Museum of Natural History. |
Ned C. Lautenbach (64) |
| Year of Election or Appointment: 2000 Mr. Lautenbach is Chairman of the Independent Trustees (2006-present). Mr. Lautenbach is an Advisory Partner of Clayton, Dubilier & Rice, Inc. (private equity investment firm). Previously, Mr. Lautenbach was with the International Business Machines Corporation (IBM) from 1968 until his retirement in 1998. Mr. Lautenbach serves as a Director of Eaton Corporation (diversified industrial) as well as the Philharmonic Center for the Arts in Naples, Florida. He also is a member of the Board of Trustees of Fairfield University (2005-present), as well as a member of the Council on Foreign Relations. Previously, Mr. Lautenbach served as a Director of Sony Corporation (2006-2007). |
Joseph Mauriello (64) |
| Year of Election or Appointment: 2008 Prior to his retirement in January 2006, Mr. Mauriello served in numerous senior management positions including Deputy Chairman and Chief Operating Officer (2004-2005), and Vice Chairman of Financial Services (2002-2004) of KPMG LLP US (professional services firm, 1965-
2005). Mr. Mauriello currently serves as a member of the Board of Directors of XL Capital Ltd. (global insurance and re-insurance company, 2006-present) and of Arcadia Resources Inc. (health care services and products, 2007-present). He also served as a Director of the Hamilton Funds of the Bank of New York (2006-2007). |
Cornelia M. Small (64) |
| Year of Election or Appointment: 2005 Ms. Small is a member of the Investment Committee, and Chair (2008-present) and a member of the Board of Trustees of Smith College. Ms. Small also serves on the Investment Committee of the Berkshire Taconic Community Foundation (2008-present). Previously, Ms. Small served as Chairperson of the Investment Committee (2002-2008) of Smith College and as Co-Chair (2000-2003) of the Annual Fund for the Fletcher School of Law and Diplomacy. In addition, she served as Chief Investment Officer, Director of Global Equity Investments, and a member of the Board of Directors of Scudder, Stevens & Clark and Scudder Kemper Investments. |
William S. Stavropoulos (69) |
| Year of Election or Appointment: 2001 Mr. Stavropoulos is Chairman Emeritus of the Board of Directors of The Dow Chemical Company, where he previously served in numerous senior management positions, including President (1993-2000; 2002-
2003), CEO (1995-2000; 2002-2004), Chairman of the Executive Committee (2000-2006), and as a member of the Board of Directors (1990-2006). Currently, he is a Director of Teradata Corporation (data warehousing and technology solutions, 2008-present), Chemical Financial Corporation, Maersk Inc. (industrial conglomerate), Tyco International, Inc. (multinational manufacturing and services, 2007-present), and a member of the Advisory Board for Metalmark Capital (private equity investment firm, 2005-present). He is a special advisor to Clayton, Dubilier & Rice, Inc. (private equity investment). In addition, Mr. Stavropoulos is a member of the University of Notre Dame Advisory Council for the College of Science. |
David M. Thomas (59) |
| Year of Election or Appointment: 2008 Previously, Mr. Thomas served as Executive Chairman (2005-2006) and Chairman and Chief Executive Officer (2000-2005) of IMS Health, Inc. (pharmaceutical and healthcare information solutions). In addition, Mr. Thomas serves as a member of the Board of Directors of Fortune Brands, Inc. (consumer products holding company), and Interpublic Group of Companies, Inc. (marketing communication, 2004-present). |
Michael E. Wiley (58) |
| Year of Election or Appointment: 2008 Mr. Wiley also serves as a member of the Board of Trustees of the University of Tulsa (2000-2006; 2007-present). He serves as a Director of Tesoro Corporation (independent oil refiner and marketer, 2005-
present), and a Director of Bill Barrett Corporation (exploration and production company, 2005-present). In addition, he also serves as a Director of Post Oak Bank (privately-held bank, 2004-present). Previously, Mr. Wiley served as a Sr. Energy Advisor of Katzenbach Partners, LLC (consulting firm, 2006-2007), as an Advisory Director of Riverstone Holdings (private investment firm), Chairman, President, and CEO of Baker Hughes, Inc. (oilfield services company, 2000-2004), and as Director of Spinnaker Exploration Company (exploration and production company, 2001-2005). |
Advisory Board Member and Executive Officers**:
Correspondence intended for each executive officer and Mr. Lynch may be sent to Fidelity Investments, 82 Devonshire Street, Boston, Massachusetts 02109.
Name, Age; Principal Occupation |
Peter S. Lynch (64) |
| Year of Election or Appointment: 2003 Member of the Advisory Board of Fidelity's Equity and High Income Funds. Mr. Lynch is Vice Chairman and a Director of FMR, and Vice Chairman (2001-present) and a Director of FMR Co., Inc. Previously, Mr. Lynch served as a Trustee of the Fidelity funds (1990-2003). In addition, he serves as a Trustee of Boston College and as the Chairman of the Inner-City Scholarship Fund. Previously, Mr. Lynch served on the Special Olympics International Board of Directors (1997-2006). |
Kenneth B. Robins (39) |
| Year of Election or Appointment: 2008 President and Treasurer of Fidelity's Equity and High Income Funds. Mr. Robins is an employee of Fidelity Investments (2004-present). Before joining Fidelity Investments, Mr. Robins worked at KPMG LLP, where he was a partner in KPMG's department of professional practice (2002-2004). |
Walter C. Donovan (46) |
| Year of Election or Appointment: 2007 Vice President of Fidelity's Equity Funds. Mr. Donovan also serves as President of FMR and FMR Co., Inc., and Executive Vice President of Fidelity Investments Money Management, Inc. (2007-present). Previously, Mr. Donovan served as Executive Vice President of FMR and FMR Co., Inc. (2005-2007) and Senior Vice President of FMR (2003-2005) and FMR Co., Inc. (2004-2005). |
Eric M. Wetlaufer (46) |
| Year of Election or Appointment: 2006 Vice President of Fidelity's International Equity Funds. Mr. Wetlaufer also serves as Group Chief Investment Officer of FMR. Mr. Wetlaufer is Chairman, Chief Executive Officer, and President of Fidelity Management & Research (Hong Kong) Limited (2008-present); Chairman, Chief Executive Officer, President, and a Director of Fidelity Management & Research (Japan) Inc. (2008-present); Chairman and Chief Executive Officer (2007-present) and President and a Director (2006-present) of Fidelity Management & Research (U.K.) Inc. and President and a Director of Fidelity Research & Analysis Company (2006-present). Before joining Fidelity Investments in 2005, Mr. Wetlaufer was a partner in Oxhead Capital Management (2004-2005) and a Chief Investment Officer of Putnam Investments (1997-2003). |
Scott C. Goebel (40) |
| Year of Election or Appointment: 2008 Secretary and Chief Legal Officer (CLO) of the Fidelity funds. Mr. Goebel also serves as General Counsel, Secretary, and Senior Vice President of FMR (2008-present); Deputy General Counsel of FMR LLC; Chief Legal Secretary of Fidelity Management & Research (Hong Kong) Limited (2008-present) and Assistant Secretary of Fidelity Management & Research (Japan) Inc. (2008-present). Previously, Mr. Goebel served as Assistant Secretary of the Funds (2007-2008) and as Vice President and Secretary of Fidelity Distributors Corporation (FDC) (2005-2007). |
John B. McGinty, Jr. (46) |
| Year of Election or Appointment: 2008 Assistant Secretary of Fidelity's Equity and High Income Funds. Mr. McGinty is an employee of Fidelity Investments (2004-present). Mr. McGinty also serves as Senior Vice President, Secretary, and Chief Legal Officer of FDC (2007-present). Before joining Fidelity Investments, Mr. McGinty practiced law at Ropes & Gray, LLP. |
Holly C. Laurent (54) |
| Year of Election or Appointment: 2008 Anti-Money Laundering (AML) Officer of the Fidelity funds. Ms. Laurent is an employee of Fidelity Investments. Previously, Ms. Laurent was Senior Vice President and Head of Legal for Fidelity Business Services India Pvt. Ltd. (2006-2008), Senior Vice President, Deputy General Counsel and Group Head for FMR LLC (2005-2006). |
Christine Reynolds (50) |
| Year of Election or Appointment: 2008 Chief Financial Officer of the Fidelity funds. Ms. Reynolds became President of Fidelity Pricing and Cash Management Services (FPCMS) in August 2008. She served as Chief Operating officer of FPCMS from 2007 through July 2008. Previously, Ms. Reynolds served as President, Treasurer, and Anti-Money Laundering officer of the Fidelity funds (2004-2007). Before joining Fidelity Investments, Ms. Reynolds worked at PricewaterhouseCoopers LLP (PwC) (1980-2002), where she was an audit partner with PwC's investment management practice. |
Kenneth A. Rathgeber (61) |
| Year of Election or Appointment: 2004 Chief Compliance Officer of Fidelity's Equity and High Income Funds. Mr. Rathgeber is Chief Compliance Officer of Fidelity Management & Research (Hong Kong) Limited (2008-present), Fidelity Management & Research (Japan) Inc. (2008-present), FMR (2005-present), FMR Co., Inc. (2005-present), Fidelity Management & Research (U.K.) Inc. (2005-
present), Fidelity Research & Analysis Company (2005-present), Fidelity Investments Money Management, Inc. (2005-present), and Strategic Advisers, Inc. (2005-present). |
Bryan A. Mehrmann (47) |
| Year of Election or Appointment: 2005 Deputy Treasurer of the Fidelity funds. Mr. Mehrmann is an employee of Fidelity Investments. Previously, Mr. Mehrmann served as Vice President of Fidelity Investments Institutional Services Group (FIIS)/Fidelity Investments Institutional Operations Corporation, Inc. (FIIOC) Client Services (1998-2004). |
Adrien E. Deberghes (41) |
| Year of Election or Appointment: 2008 Deputy Treasurer of Fidelity's Equity and High Income Funds. Mr. Deberghes is an employee of Fidelity Investments (2008-present). Previously, Mr. Deberghes served as Senior Vice President of Mutual Fund Administration at State Street Corporation (2007-2008), Senior Director of Mutual Fund Administration at Investors Bank & Trust (2005-2007), and Director of Finance for Dunkin' Brands (2000-2005). |
Robert G. Byrnes (41) |
| Year of Election or Appointment: 2005 Assistant Treasurer of the Fidelity funds. Mr. Byrnes is an employee of Fidelity Investments (2005-present). Previously, Mr. Byrnes served as Vice President of Fidelity Pricing and Cash Management Services (FPCMS) (2003-2005). Before joining Fidelity Investments, Mr. Byrnes worked at Deutsche Asset Management where he served as Vice President of the Investment Operations Group (2000-2003). |
Peter L. Lydecker (54) |
| Year of Election or Appointment: 2004 Assistant Treasurer of the Fidelity funds. Mr. Lydecker is an employee of Fidelity Investments. |
Paul M. Murphy (61) |
| Year of Election or Appointment: 2007 Assistant Treasurer of the Fidelity funds. Mr. Murphy is an employee of Fidelity Investments (2007-present). Previously, Mr. Murphy served as Chief Financial Officer of the Fidelity Funds (2005-2006), Vice President and Associate General Counsel of FMR (2007), and Senior Vice President of Fidelity Pricing and Cash Management Services (FPCMS) (1994-2007). |
Gary W. Ryan (50) |
| Year of Election or Appointment: 2005 Assistant Treasurer of the Fidelity funds. Mr. Ryan is an employee of Fidelity Investments. Previously, Mr. Ryan served as Vice President of Fund Reporting in Fidelity Pricing and Cash Management Services (FPCMS) (1999-2005). |
** FMR Corp. merged with and into FMR LLC on October 1, 2007. Any references to FMR LLC for prior periods are deemed to be references to the prior entity.
Annual Report
The fund designates 47% of the dividends distributed in December 2006 during the fiscal year as amounts which may be taken into account as a dividend for the purposes of the maximum rate under section 1(h)(11) of the Internal Revenue Code.
The amounts per share which represent income derived from sources within, and taxes paid to, foreign countries or possessions of the United States are as follows:
| Pay Date | Income | Taxes |
International Value Fund | 12/10/2007 | $0.204 | $0.0319 |
The fund will notify shareholders in January 2009 of amounts for use in preparing 2008 income tax returns.
Annual Report
A special meeting of the fund's shareholders was held on December 13, 2007. The results of votes taken among shareholders on the proposals before them are reported below. Each vote reported represents one dollar of net asset value held on the record date for the meeting.
PROPOSAL 1 |
To amend the Declaration of Trust to reduce the required quorum for shareholder meetings.A |
| # of
Votes | % of
Votes |
Affirmative | 45,014,793,255.82 | 80.372 |
Against | 6,871,112,667.08 | 12.268 |
Abstain | 2,163,456,438.02 | 3.863 |
Broker
Non-Votes | 1,958,633,563.89 | 3.497 |
TOTAL | 56,007,995,924.81 | 100.000 |
PROPOSAL 2 |
To elect the nominees specified below as Trustees.A |
James C. Curvey |
Affirmative | 53,384,952,361.03 | 95.317 |
Withheld | 2,623,043,563.78 | 4.683 |
TOTAL | 56,007,995,924.81 | 100.000 |
Dennis J. Dirks |
Affirmative | 53,595,104,608.67 | 95.692 |
Withheld | 2,412,891,316.14 | 4.308 |
TOTAL | 56,007,995,924.81 | 100.000 |
Albert R. Gamper, Jr. |
Affirmative | 53,570,235,221.69 | 95.647 |
Withheld | 2,437,760,703.12 | 4.353 |
TOTAL | 56,007,995,924.81 | 100.000 |
George H. Heilmeier |
Affirmative | 53,166,350,588.50 | 94.926 |
Withheld | 2,841,645,336.31 | 5.074 |
TOTAL | 56,007,995,924.81 | 100.000 |
| # of
Votes | % of
Votes |
Edward C. Johnson 3d |
Affirmative | 53,230,508,654.93 | 95.041 |
Withheld | 2,777,487,269.88 | 4.959 |
TOTAL | 56,007,995,924.81 | 100.000 |
James H. Keyes |
Affirmative | 53,549,161,456.52 | 95.610 |
Withheld | 2,458,834,468.29 | 4.390 |
TOTAL | 56,007,995,924.81 | 100.000 |
Marie L. Knowles |
Affirmative | 53,543,925,066.86 | 95.601 |
Withheld | 2,464,070,857.95 | 4.399 |
TOTAL | 56,007,995,924.81 | 100.000 |
Ned C. Lautenbach |
Affirmative | 53,547,116,322.50 | 95.606 |
Withheld | 2,460,879,602.31 | 4.394 |
TOTAL | 56,007,995,924.81 | 100.000 |
Cornelia M. Small |
Affirmative | 53,564,793,514.25 | 95.638 |
Withheld | 2,443,202,410.56 | 4.362 |
TOTAL | 56,007,995,924.81 | 100.000 |
William S. Stavropoulos |
Affirmative | 53,426,544,502.76 | 95.391 |
Withheld | 2,581,451,422.05 | 4.609 |
TOTAL | 56,007,995,924.81 | 100.000 |
Kenneth L. Wolfe |
Affirmative | 53,229,881,790.63 | 95.040 |
Withheld | 2,778,114,134.18 | 4.960 |
TOTAL | 56,007,995,924.81 | 100.000 |
A Denotes trust-wide proposal and voting results. |
Annual Report
Proxy Voting Results
A special meeting of the fund's shareholders was held on April 16, 2008. The results of votes taken among shareholders on the proposal before them are reported below. Each vote reported represents one dollar of net asset value held on the record date for the meeting.
PROPOSAL 1 |
To elect a Board of Trustees.A |
| # of
Votes | % of
Votes |
James C. Curvey |
Affirmative | 44,485,656,811.55 | 94.702 |
Withheld | 2,488,551,854.62 | 5.298 |
TOTAL | 46,974,208,666.17 | 100.000 |
Dennis J. Dirks |
Affirmative | 44,706,671,638.31 | 95.173 |
Withheld | 2,267,537,027.86 | 4.827 |
TOTAL | 46,974,208,666.17 | 100.000 |
Edward C. Johnson 3d |
Affirmative | 44,294,881,638.16 | 94.296 |
Withheld | 2,679,327,028.01 | 5.704 |
TOTAL | 46,974,208,666.17 | 100.000 |
Alan J. Lacy |
Affirmative | 44,685,373,413.16 | 95.127 |
Withheld | 2,288,835,253.01 | 4.873 |
TOTAL | 46,974,208,666.17 | 100.000 |
Ned C. Lautenbach |
Affirmative | 44,634,541,379.41 | 95.019 |
Withheld | 2,339,667,286.76 | 4.981 |
TOTAL | 46,974,208,666.17 | 100.000 |
Joseph Mauriello |
Affirmative | 44,683,962,099.80 | 95.124 |
Withheld | 2,290,246,566.37 | 4.876 |
TOTAL | 46,974,208,666.17 | 100.000 |
Cornelia M. Small |
Affirmative | 44,671,688,375.36 | 95.098 |
Withheld | 2,302,520,290.81 | 4.902 |
TOTAL | 46,974,208,666.17 | 100.000 |
| # of
Votes | % of
Votes |
William S. Stavropoulos |
Affirmative | 44,465,262,087.61 | 94.659 |
Withheld | 2,508,946,578.56 | 5.341 |
TOTAL | 46,974,208,666.17 | 100.000 |
David M. Thomas |
Affirmative | 44,694,340,813.87 | 95.147 |
Withheld | 2,279,867,852.30 | 4.853 |
TOTAL | 46,974,208,666.17 | 100.000 |
Michael E. Wiley |
Affirmative | 44,686,513,174.78 | 95.130 |
Withheld | 2,287,695,491.39 | 4.870 |
TOTAL | 46,974,208,666.17 | 100.000 |
A Denotes trust-wide proposal and voting results.
Annual Report
Board Approval of Investment Advisory Contracts and Management Fees
Fidelity International Value Fund
Each year, typically in July, the Board of Trustees, including the Independent Trustees (together, the Board), votes on the renewal of the management contract and sub-advisory agreements (together, the Advisory Contracts) for the fund. The Board, assisted by the advice of fund counsel and Independent Trustees' counsel, requests and considers a broad range of information throughout the year.
The Board meets regularly and, acting directly and through its separate committees, requests and receives information concerning, and considers at each of its meetings factors that are relevant to, its annual consideration of the renewal of the fund's Advisory Contracts, including the services and support provided to the fund and its shareholders. At the time of the renewal, the Board had 12 standing committees, each composed of Independent Trustees with varying backgrounds, to which the Board has assigned specific subject matter responsibilities in order to enhance effective decision-making by the Board. Each committee has a written charter outlining the structure and purposes of the committee. The Board also meets as needed to consider matters specifically related to the Board's annual consideration of the renewal of Advisory Contracts.
At its July 2008 meeting, the Board of Trustees, including the Independent Trustees, unanimously determined to renew the fund's Advisory Contracts. In reaching its determination, the Board considered all factors it believed relevant, including (i) the nature, extent, and quality of the services to be provided to the fund and its shareholders (including the investment performance of the fund); (ii) the competitiveness of the fund's management fee and total expenses; (iii) the total costs of the services to be provided by and the profits to be realized by Fidelity from its relationship with the fund; (iv) the extent to which economies of scale would be realized as the fund grows; and (v) whether fee levels reflect these economies of scale, if any, for the benefit of fund shareholders. The Board also approved agreements with foreign sub-advisers Fidelity Management & Research (Japan) Inc. and Fidelity Management & Research (Hong Kong) Limited, as well as amendments to the fund's agreement with Fidelity Management & Research (U.K.) Inc.
In considering whether to renew the Advisory Contracts for the fund, the Board ultimately reached a determination, with the assistance of fund counsel and Independent Trustees' counsel and through the exercise of its business judgment, that the renewal of the Advisory Contracts and the compensation to be received by Fidelity under the management contract is consistent with Fidelity's fiduciary duty under applicable law. The Board's decision to renew the Advisory Contracts was not based on any single factor noted above, but rather was based on a comprehensive consideration of all the information provided to the Board at its meetings throughout the year. The Board, in reaching its determination to renew the Advisory Contracts, is aware that shareholders in the fund have a broad range of investment choices available to them, including a wide choice among mutual funds offered by competitors to Fidelity, and that the fund's shareholders, with the opportunity to review and weigh the disclosure provided by the fund in its prospectus and other public disclosures, have chosen to invest in this fund, managed by Fidelity.
Annual Report
Board Approval of Investment Advisory Contracts and
Management Fees - continued
Nature, Extent, and Quality of Services Provided. The Board considered staffing within the investment adviser, FMR, and the sub-advisers (together, the Investment Advisers), including the backgrounds of the fund's investment personnel and the fund's investment objective and discipline. The Independent Trustees also had discussions with senior management of Fidelity's investment operations and investment groups. The Board considered the structure of the portfolio manager compensation program and whether this structure provides appropriate incentives.
Resources Dedicated to Investment Management and Support Services. The Board reviewed the size, education, and experience of the Investment Advisers' investment staff, their use of technology, and the Investment Advisers' approach to recruiting, training, and retaining portfolio managers and other research, advisory, and management personnel. The Board noted that Fidelity's analysts have access to a variety of technological tools that enable them to perform both fundamental and quantitative analysis and to specialize in various disciplines. The Board considered Fidelity's extensive global research capabilities that enable the Investment Advisers to aggregate data from various sources in an effort to produce positive investment results. The Board also considered that Fidelity's portfolio managers and analysts have access to daily portfolio attribution that allows for monitoring of a fund's portfolio, as well as an electronic communication system that provides immediate real-time access to research concerning issuers and credit enhancers.
Shareholder and Administrative Services. The Board considered (i) the nature, extent, quality, and cost of advisory, administrative, distribution, and shareholder services performed by the Investment Advisers and their affiliates under the Advisory Contracts and under separate agreements covering transfer agency, pricing and bookkeeping, and securities lending services for the fund; (ii) the nature and extent of the Investment Advisers' supervision of third party service providers, principally custodians and subcustodians; and (iii) the resources devoted to, and the record of compliance with, the fund's compliance policies and procedures. The Board also reviewed the allocation of fund brokerage, including allocations to brokers affiliated with the Investment Advisers, the use of brokerage commissions to pay fund expenses, and the use of "soft" commission dollars to pay for research services. The Board further considered that Fidelity voluntarily pays for market data out of its own resources.
The Board noted that the growth of fund assets across the complex allows Fidelity to reinvest in the development of services designed to enhance the value or convenience of the Fidelity funds as investment vehicles. These services include 24-hour access to account information and market information through phone representatives and over the Internet, and investor education materials and asset allocation tools.
Annual Report
Investment in a Large Fund Family. The Board considered the benefits to shareholders of investing in a Fidelity fund, including the benefits of investing in a fund that is part of a large family of funds offering a variety of investment disciplines and providing for a large variety of mutual fund investor services. For example, fund shareholders are offered the privilege of exchanging shares of the fund for shares of other Fidelity funds, as set forth in the fund's prospectus, without paying a sales charge. The Board noted that Fidelity has taken a number of actions over the previous year that benefited particular funds, including (i) dedicating additional resources to investment research and to restructure the investment research teams; (ii) contractually agreeing to reduce the management fees on Fidelity's Institutional Money Market Funds and launching Class IV and Institutional Class of certain of these funds; (iii) reducing the transfer agent fees for the Fidelity Select Portfolios and Investor Class of the VIP funds; and (iv) launching Class K of 29 equity funds as a lower-fee class available to certain employer-sponsored retirement plans.
Investment Performance. The Board considered whether the fund has operated within its investment objective, as well as its record of compliance with its investment restrictions. It also reviewed the fund's absolute investment performance for each class, as well as the fund's relative investment performance for each class measured against (i) a broad-based securities market index, and (ii) a custom peer group of mutual funds deemed appropriate by the Board. Because the fund had been in existence less than three calendar years, the following chart considered by the Board shows, for the one-year period ended December 31, 2007, the total returns of Institutional Class (Class I) and Class B of the fund, the total return of a broad-based securities market index ("benchmark"), and a range of total returns of a custom peer group of mutual funds defined by FMR based on categories assigned by Morningstar, Inc. The returns of Institutional Class (Class I) and Class B show the performance of the highest and lowest performing classes, respectively. The box within each chart shows the 25th percentile return (bottom of box) and the 75th percentile return (top of box) of the peer group. Returns shown above the box are in the first quartile and returns shown below the box are in the fourth quartile. The percentage beaten number noted below each chart corresponds to the percentile box and represents the percentage of funds in the peer group whose performance was equal to or lower than that of the fund. The fund's custom peer group, defined by FMR, is a peer group that FMR believes provides a more meaningful performance comparison than the peer group assigned by Morningstar, Inc., which assigns mutual funds to categories based on their investment styles as measured by their underlying portfolio holdings.
Annual Report
Board Approval of Investment Advisory Contracts and
Management Fees - continued
Fidelity International Value Fund

The Board reviewed the fund's relative investment performance against its peer group and stated that the performance of Institutional Class (Class I) of the fund was in the second quartile for the period shown. The Board also stated that the investment performance of Institutional Class (Class I) of the fund compared favorably to its benchmark for the period shown. The Board considered that the variations in performance among the fund's classes reflect the variations in class expenses, which result in lower performance for higher expense classes. The Board stated that it is difficult to evaluate in any comprehensive fashion the performance of the fund, in light of its relatively recent commencement of operations.
The Board also considered that the fund's management fee is subject to upward or downward adjustment depending upon whether, and to what extent, the fund's investment performance for the performance period exceeds, or is exceeded by, the record (over the same period) of a Board-approved performance adjustment index. The Board realizes that the performance adjustment provides FMR with a strong economic incentive to seek to achieve superior performance for the fund's shareholders and helps to more closely align the interests of FMR and the fund's shareholders.
The Board considered that FMR has taken steps to refocus and strengthen equity research, equity portfolio management, and compliance.
Based on its review, and giving particular weight to the nature and quality of the resources dedicated by the Investment Advisers to maintain and improve relative performance, the Board concluded that the nature, extent, and quality of the services provided to the fund will benefit the fund's shareholders, particularly in light of the Board's view that the fund's shareholders benefit from investing in a fund that is part of a large family of funds offering a variety of investment disciplines and services.
Annual Report
Competitiveness of Management Fee and Total Fund Expenses. The Board considered the fund's management fee and total expenses compared to "mapped groups" of competitive funds and classes. Fidelity creates "mapped groups" by combining similar Lipper investment objective categories that have comparable management fee characteristics. Combining Lipper investment objective categories aids the Board's management fee and total expense comparisons by broadening the competitive group used for comparison and by reducing the number of universes to which various Fidelity funds are compared. The Board also considered supplemental information about how the fund's management fee and total expenses ranked relative to groups based on Lipper classifications, which take into account a fund's market capitalization and style.
The Board considered two proprietary management fee comparisons for the 12-month (or shorter) periods shown in the chart below. The group of Lipper funds used by the Board for management fee comparisons is referred to below as the "Total Mapped Group." The Total Mapped Group comparison focuses on a fund's standing relative to the total universe of comparable funds available to investors, in terms of gross management fees before expense reimbursements or caps, and without giving effect to the fund's performance adjustment. "TMG %" represents the percentage of funds in the Total Mapped Group that had management fees that were lower than the fund's. For example, a TMG % of 14% means that 86% of the funds in the Total Mapped Group had higher management fees than the fund. The "Asset-Size Peer Group" (ASPG) comparison focuses on a fund's standing relative to non-Fidelity funds similar in size to the fund within the Total Mapped Group. The ASPG represents at least 15% of the funds in the Total Mapped Group with comparable asset size and management fee characteristics, subject to a minimum of 50 funds (or all funds in the Total Mapped Group if fewer than 50). Additional information, such as the ASPG quartile in which the fund's management fee ranked and the impact of the fund's performance adjustment, is also included in the chart and considered by the Board.
Annual Report
Board Approval of Investment Advisory Contracts and
Management Fees - continued
Fidelity International Value Fund
The Board noted that the fund's management fee ranked below the median of its Total Mapped Group and below the median of its ASPG for 2007. The Board also noted the effect of the fund's negative performance adjustment on the fund's management fee ranking. The Board noted that the performance adjustment for 2007 represents calculations for performance periods that differ from the period shown in the performance chart above.
Based on its review, the Board concluded that the fund's management fee was fair and reasonable in light of the services that the fund receives and the other factors considered.
In its review of each class's total expenses, the Board considered the fund's management fee as well as other fund or class expenses, as applicable, such as transfer agent fees, pricing and bookkeeping fees, fund-paid 12b-1 fees, and custodial, legal, and audit fees. The Board also noted the effects of any waivers and reimbursements on fees and expenses, as well as the impact of the fund's performance adjustment. As part of its review, the Board also considered current and historical total expenses of each class of the fund compared to competitive fund median expenses. Each class of the fund is compared to those funds and classes in the Total Mapped Group (used by the Board for management fee comparisons) that have a similar sales load structure.
The Board noted that the total expenses of each of Class A, Class B, Class C, Institutional Class, and Fidelity International Value (retail class) ranked below its competitive median for 2007, and the total expenses of Class T ranked above its competitive median for 2007. The Board considered that the total expenses of Class T were above the median primarily because its 12b-1 fee is higher than the typical front-end load class. The Board noted that the fund offers multiple classes, each of which has a different sales load and 12b-1 fee structure, and that the multiple structures are intended to offer a range of pricing options for the intermediary market. The Board also noted that the total expenses of the classes vary primarily by the level of their 12b-1 fees, although differences in transfer agent fees may also cause expenses to vary from class to class.
Annual Report
In its review of total expenses, the Board also considered Fidelity fee structures and other information on clients that FMR and its affiliates service in other competitive markets, such as other mutual funds advised or subadvised by FMR or its affiliates, pension plan clients, and other institutional clients.
Based on its review, the Board concluded that the total expenses of each class of the fund were reasonable, although in one case above the median of the universe presented for comparison, in light of the services that the fund and its shareholders receive and the other factors considered.
Costs of the Services and Profitability. The Board considered the revenues earned and the expenses incurred by Fidelity in conducting the business of developing, marketing, distributing, managing, administering and servicing the fund and its shareholders. The Board also considered the level of Fidelity's profits in respect of all the Fidelity funds.
On an annual basis, FMR presents to the Board Fidelity's profitability for the fund. Fidelity calculates the profitability for each fund, as well as aggregate profitability for groups of Fidelity funds and all Fidelity funds, using a series of detailed revenue and cost allocation methodologies which originate with the audited books and records of Fidelity. The Audit Committee of the Board reviews any significant changes from the prior year's methodologies.
PricewaterhouseCoopers LLP (PwC), independent registered public accounting firm and auditor to Fidelity and certain Fidelity funds, has been engaged annually by the Board as part of the Board's assessment of the results of Fidelity's profitability analysis. PwC's engagement includes the review and assessment of Fidelity's methodologies used in determining the revenues and expenses attributable to Fidelity's mutual fund business, and completion of agreed-upon procedures surrounding the mathematical accuracy of fund profitability and its conformity to allocation methodologies. After considering PwC's reports issued under the engagement and information provided by Fidelity, the Board believes that while other allocation methods may also be reasonable, Fidelity's profitability methodologies are reasonable in all material respects.
The Board has also reviewed Fidelity's non-fund businesses and any fall-out benefits related to the mutual fund business as well as cases where Fidelity's affiliates may benefit from or be related to the fund's business.
Annual Report
Board Approval of Investment Advisory Contracts and
Management Fees - continued
The Board considered the costs of the services provided by and the profits realized by Fidelity in connection with the operation of the fund and determined that the amount of profit is a fair entrepreneurial profit for the management of the fund.
Economies of Scale. The Board considered whether there have been economies of scale in respect of the management of the Fidelity funds, whether the Fidelity funds (including the fund) have appropriately benefited from any such economies of scale, and whether there is potential for realization of any further economies of scale. The Board considered the extent to which the fund will benefit from economies of scale through increased services to the fund, through waivers or reimbursements, or through fee or expense reductions.
The Board recognized that the fund's management contract incorporates a "group fee" structure, which provides for lower group fee rates as total fund assets under FMR's management increase, and for higher group fee rates as total fund assets under FMR's management decrease. FMR determines the group fee rates based on a tiered asset "breakpoint" schedule. The Board considered that the group fee is designed to deliver the benefits of economies of scale to fund shareholders when total fund assets increase, even if assets of any particular fund are unchanged or have declined, because some portion of Fidelity's costs are attributable to services provided to all Fidelity funds, and all funds benefit if those costs can be allocated among more assets. The Board concluded that, given the group fee structure, fund shareholders will achieve a certain level of economies of scale as assets under FMR's management increase at the fund complex level, regardless of whether Fidelity achieves any such economies of scale.
The Board further concluded that any potential economies of scale are being shared between fund shareholders and Fidelity in an appropriate manner.
Additional Information Requested by the Board. In order to develop fully the factual basis for consideration of the Fidelity funds' Advisory Contracts, the Board requested and received additional information on certain topics, including (i) fund performance trends and actions to be taken by FMR to improve certain funds' overall performance; (ii) portfolio manager changes that have occurred during the past year; (iii) Fidelity's fund profitability methodology, the profitability of certain fund service providers, and profitability trends for certain funds; (iv) Fidelity's compensation structure for portfolio managers and key personnel, including its effects on fund profitability and the extent to which portfolio manager compensation is linked to fund performance; (v) Fidelity's fee structures and rationale for recommending different fees among categories of funds; and (vi) Fidelity's rationale for recommending which funds should have a performance adjustment component as part of their management fees.
Based on its evaluation of all of the conclusions noted above, and after considering all material factors, the Board ultimately concluded that the advisory fee structures are fair and reasonable, and that the fund's Advisory Contracts should be renewed.
Annual Report
Investment Adviser
Fidelity Management & Research Company
Boston, MA
Investment Sub-Advisers
FMR Co., Inc.
Fidelity Management & Research
(U.K.) Inc.
Fidelity Management & Research
(Hong Kong) Limited
Fidelity Management & Research
(Japan) Inc.
Fidelity Research & Analysis Company
FIL Investment Advisors
Fidelity Investments Japan Limited
FIL Investment Advisors (U.K.) Ltd.
General Distributor
Fidelity Distributors Corporation
Boston, MA
Transfer and Service Agents
Fidelity Investments Institutional
Operations Company, Inc.
Boston, MA
Fidelity Service Company, Inc.
Boston, MA
Custodian
The Northern Trust Company
Chicago, Illinois
The Fidelity Telephone Connection
Mutual Fund 24-Hour Service
Exchanges/Redemptions
and Account Assistance 1-800-544-6666
Product Information 1-800-544-8888
Retirement Accounts 1-800-544-4774
(8 a.m. - 9 p.m.)
TDD Service 1-800-544-0118
for the deaf and hearing impaired
(9 a.m. - 9 p.m. Eastern time)
Fidelity Automated Service
Telephone (FAST®) 1-800-544-5555
Automated line for quickest service
FIV-UANN-1208
1.827481.102
(Fidelity Investment logo)(registered trademark)
Fidelity Advisor
International Value
Fund - Class A, Class T, Class B
and Class C
Annual Report
October 31, 2008
Class A, Class T, Class B, and Class C are classes of Fidelity® International Value Fund
(2_fidelity_logos) (Registered_Trademark)
Contents
Chairman's Message | <Click Here> | Ned Johnson's message to shareholders. |
Performance | <Click Here> | How the fund has done over time. |
Management's Discussion | <Click Here> | The manager's review of fund performance, strategy and outlook. |
Shareholder Expense Example | <Click Here> | An example of shareholder expenses. |
Investment Changes | <Click Here> | A summary of major shifts in the fund's investments over the past six months. |
Investments | <Click Here> | A complete list of the fund's investments with their market values. |
Financial Statements | <Click Here> | Statements of assets and liabilities, operations, and changes in net assets, as well as financial highlights. |
Notes | <Click Here> | Notes to financial statements. |
Report of Independent Registered Public Accounting Firm | <Click Here> | |
Trustees and Officers | <Click Here> | |
Distributions | <Click Here> | |
Proxy Voting Results | <Click Here> | |
Board Approval of Investment Advisory Contracts and Management Fees | <Click Here> | |
To view a fund's proxy voting guidelines and proxy voting record for the 12-month period ended June 30, visit http://www.fidelity.com (search for "proxy voting guidelines") or visit the Securities and Exchange Commission's (SEC) web site at http://www.sec.gov. You may also call 1-877-208-0098 to request a free copy of the proxy voting guidelines.
Standard & Poor's, S&P and S&P 500 are registered service marks of The McGraw-Hill Companies, Inc. and have been licensed for use by Fidelity Distributors Corporation.
Other third party marks appearing herein are the property of their respective owners.
All other marks appearing herein are registered or unregistered trademarks or service marks of FMR LLC or an affiliated company.
Annual Report
This report and the financial statements contained herein are submitted for the general information of the shareholders of the fund. This report is not authorized for distribution to prospective investors in the fund unless preceded or accompanied by an effective prospectus.
A fund files its complete schedule of portfolio holdings with the SEC for the first and third quarters of each fiscal year on Form N-Q. Forms N-Q are available on the SEC's web site at http://www.sec.gov. A fund's Forms N-Q may be reviewed and copied at the SEC's Public Reference Room in Washington, DC. Information regarding the operation of the SEC's Public Reference Room may be obtained by calling 1-800-SEC-0330. For a complete list of a fund's portfolio holdings, view the most recent holdings listing, semiannual report, or annual report on Fidelity's web site at http://www.fidelity.com or http://www.advisor.fidelity.com, as applicable.
NOT FDIC INSURED · MAY LOSE VALUE · NO BANK GUARANTEE
Neither the fund nor Fidelity Distributors Corporation is a bank.
Annual Report
(photo_of_Edward_C_Johnson_3d)
Dear Shareholder:
Turmoil has been the watchword for the world's securities markets in 2008, with domestic and international stocks down sharply amid the global credit squeeze. A flight to quality boosted returns for U.S. Treasuries, one of the few asset classes with positive results heading into the latter stages of the year. Financial markets are always unpredictable, but there are a number of time-tested principles that can put the historical odds in your favor.
One of the basic tenets is to invest for the long term. Over time, riding out the markets' inevitable ups and downs has proven much more effective than selling into panic or chasing the hottest trend. Even missing only a few of the markets' best days can significantly diminish investor returns. Patience also affords the benefits of compounding - of earning interest on additional income or reinvested dividends and capital gains. There are tax advantages and cost benefits to consider as well. The more you sell, the more taxes you pay, and the more you trade, the higher the costs. While staying the course doesn't eliminate risk, it can considerably lessen the effect of short-term declines.
You can further manage your investing risk through diversification. And today, more than ever, geographic diversification should be taken into account. Studies indicate that asset allocation is the single most important determinant of a portfolio's long-term success. The right mix of stocks, bonds and cash - aligned to your particular risk tolerance and investment objective - is very important. Age-appropriate rebalancing is also an essential aspect of asset allocation. For younger investors, an emphasis on equities - which historically have been the best-performing asset class over time - is encouraged. As investors near their specific goal, such as retirement or sending a child to college, consideration may be given to replacing volatile assets (e.g. common stocks) with more-stable fixed investments (bonds or savings plans).
A third investment principle - investing regularly - can help lower the average cost of your purchases. Investing a certain amount of money each month or quarter helps ensure you won't pay for all your shares at market highs. This strategy - known as dollar cost averaging - also reduces unconstructive "emotion" from investing, helping shareholders avoid selling weak performers just prior to an upswing, or chasing a hot performer just before a correction.
We invite you to contact us via the Internet, through our Investor Centers or over the phone. It is our privilege to provide you the information you need to make the investments that are right for you.
Sincerely,
/s/Edward C. Johnson 3d
Edward C. Johnson 3d
Annual Report
Average annual total return reflects the change in the value of an investment, assuming reinvestment of the class' dividend income and capital gains (the profits earned upon the sale of securities that have grown in value, if any) and assuming a constant rate of performance each year. The $10,000 table and the fund's returns do not reflect the deduction of taxes that a shareholder would pay on fund distributions or the redemption of fund shares. During periods of reimbursement by Fidelity, a fund's total return will be greater than it would be had the reimbursement not occurred. How a fund did yesterday is no guarantee of how it will do tomorrow.
Average Annual Total Returns
Periods ended October 31, 2008 | Past 1
year | Life of
fund A |
Class A (incl. 5.75% sales charge) | -54.29% | -18.87% |
Class T (incl. 3.50% sales charge) | -53.29% | -18.27% |
Class B (incl. contingent deferred sales charge)B | -54.12% | -18.45% |
Class C (incl. contingent deferred sales charge)C | -52.25% | -17.46% |
A From May 18, 2006.
B Class B shares' contingent deferred sales charges included in the past one year and life of fund total return figures are 5% and 3%, respectively.
C Class C shares' contingent deferred sales charges included in the past one year and life of fund total return figures are 1% and 0%, respectively.
Annual Report
$10,000 Over Life of Fund
Let's say hypothetically that $10,000 was invested in Fidelity Advisor International Value Fund - Class A on May 18, 2006, when the fund started, and the current 5.75% sales charge was paid. The chart shows how the value of your investment would have changed, and also shows how the MSCI® Europe, Australasia, Far East (MSCI EAFE®) Value Index performed over the same period.

In prior years, the performance from year to year was represented by the performance of Class T. Going forward, the fund's performance will be represented by Class A for consistency with other fund materials.
Annual Report
Comments from George Stairs, Portfolio Manager of Fidelity Advisor International Value Fund
In a dramatic reversal of what had been a multiyear global growth story, international stocks fell long and hard during the 12 months ending October 31, 2008, especially so during the latter stages of the period and mostly as a result of fallout from the financial crisis that emanated from the United States. The viral spread of this financial contagion - which began in the U.S. subprime mortgage market, then seized up the credit markets, hobbled major financial institutions and eventually slowed economic growth worldwide - left virtually no corner of the globe untouched. Developed international equity markets - as gauged by the MSCI® Europe, Australasia, Far East (EAFE®) Index, which monitors established markets outside the U.S. and Canada - fell 46.54%, while the Standard & Poor's 500SM Index, a measure of U.S. stocks, dropped 36.10%. Among countries constituting at least 1% of the EAFE index, Switzerland had the "least worst" showing, falling roughly 32%, followed by Japan, where stocks slid by around 37%. Meanwhile, the weakest overall performance came from Belgium, where stocks slipped by nearly 70%. In the United Kingdom, the largest component of the index, equities were down almost 48%. Emerging markets were the weakest performers among the global economies, declining 56.22% as measured by the MSCI Emerging Markets Index.
For the year, the fund's Class A, Class T, Class B and Class C shares fell 51.50%, 51.60%, 51.85% and 51.80%, respectively (excluding sales charges), compared with a 48.32% decline for the MSCI EAFE Value index, both sets of returns reflecting the extremely poor performance of equities across the international markets. From a sector allocation perspective, the fund was properly positioned, particularly with its big underweighting in financials and slight overweightings in utilities and energy, which helped performance versus the index. Where it underperformed was in stock selection, with the greatest damage coming from picks in the banks, energy, utilities and media groups, as well as in materials. Among the biggest detractors were such names as UniCredit, a large Italian bank; Petroleum Geo-Services, a Norwegian energy services firm not held in the index; and BP, the big British integrated oil firm, which did relatively well and hurt us because we were significantly underweighted in the stock and eventually sold the position. Productive stock selection in the pharmaceuticals, biotechnology and life science group, as well as in diversified financials and transportation, offset some of our shortfall versus the MSCI benchmark. Top contributors included Swiss drug maker Roche Holding and Japanese passenger rail system East Japan Railway.
The views expressed above reflect those of the portfolio manager(s) only through the end of the period as stated on the cover of this report and do not necessarily represent the views of Fidelity or any other person in the Fidelity organization. Any such views are subject to change at any time based upon market or other conditions and Fidelity disclaims any responsibility to update such views. These views may not be relied on as investment advice and, because investment decisions for a Fidelity fund are based on numerous factors, may not be relied on as an indication of trading intent on behalf of any Fidelity fund.
Annual Report
Shareholder Expense Example
As a shareholder of the Fund, you incur two types of costs: (1) transaction costs, including sales charges (loads) on purchase payments or redemption proceeds, redemption fees, and (2) ongoing costs, including management fees, distribution and/or service (12b-1) fees and other Fund expenses. This Example is intended to help you understand your ongoing costs (in dollars) of investing in the Fund and to compare these costs with the ongoing costs of investing in other mutual funds.
The Example is based on an investment of $1,000 invested at the beginning of the period and held for the entire period (May 1, 2008 to October 31, 2008).
Actual Expenses
The first line of the accompanying table for each class of the Fund provides information about actual account values and actual expenses. You may use the information in this line, together with the amount you invested, to estimate the expenses that you paid over the period. Simply divide your account value by $1,000.00 (for example, an $8,600 account value divided by $1,000.00 = 8.6), then multiply the result by the number in the first line for a class of the Fund under the heading entitled "Expenses Paid During Period" to estimate the expenses you paid on your account during this period. A small balance maintenance fee of $12.00 that is charged once a year may apply for certain accounts with a value of less than $2,000. This fee is not included in the table below. If it was, the estimate of expenses you paid during the period would be higher, and your ending account value lower, by this amount. In addition, the Fund, as a shareholder in the underlying Fidelity Central Funds, will indirectly bear its pro rata share of the fees and expenses incurred by the underlying Fidelity Central Funds. These fees and expenses are not included in the Fund's annualized expense ratio used to calculate the expense estimate in the table below.
Hypothetical Example for Comparison Purposes
The second line of the accompanying table for each class of the Fund provides information about hypothetical account values and hypothetical expenses based on a Class' actual expense ratio and an assumed rate of return of 5% per year before expenses, which is not the Class' actual return. The hypothetical account values and expenses may not be used to estimate the actual ending account balance or expenses you paid for the period. You may use this information to compare the ongoing costs of investing in the Fund and other funds. To do so, compare this 5% hypothetical example with the 5% hypothetical examples that appear in the shareholder reports of the other funds. A small balance maintenance fee of $12.00 that is charged once a year may apply for certain accounts with a value of less than $2,000. This fee is not included in the table below. If it was, the estimate of expenses you paid during the period would be higher, and your ending account value lower, by this amount. In addition, the Fund, as a shareholder in the underlying Fidelity Central Funds, will indirectly bear its pro rata share of the fees and expenses incurred by the underlying Fidelity Central Funds. These fees and expenses are not included in the Fund's annualized expense ratio used to calculate the expense estimate in the table below.
Please note that the expenses shown in the table are meant to highlight your ongoing costs only and do not reflect any transaction costs. Therefore, the second line of the table is useful in comparing ongoing costs only, and will not help you determine the relative total costs of owning different funds. In addition, if these transactional costs were included, your costs would have been higher.
Annual Report
| Annualized
Expense Ratio | Beginning
Account Value
May 1, 2008 | Ending
Account Value
October 31, 2008 | Expenses Paid
During Period*
May 1, 2008 to October 31, 2008 |
Class A | 1.41% | | | |
Actual | | $ 1,000.00 | $ 534.70 | $ 5.44 |
HypotheticalA | | $ 1,000.00 | $ 1,018.05 | $ 7.15 |
Class T | 1.66% | | | |
Actual | | $ 1,000.00 | $ 534.40 | $ 6.40 |
HypotheticalA | | $ 1,000.00 | $ 1,016.79 | $ 8.42 |
Class B | 2.16% | | | |
Actual | | $ 1,000.00 | $ 532.60 | $ 8.32 |
HypotheticalA | | $ 1,000.00 | $ 1,014.28 | $ 10.94 |
Class C | 2.16% | | | |
Actual | | $ 1,000.00 | $ 533.10 | $ 8.32 |
HypotheticalA | | $ 1,000.00 | $ 1,014.28 | $ 10.94 |
International Value | 1.10% | | | |
Actual | | $ 1,000.00 | $ 535.60 | $ 4.25 |
HypotheticalA | | $ 1,000.00 | $ 1,019.61 | $ 5.58 |
Institutional Class | 1.00% | | | |
Actual | | $ 1,000.00 | $ 536.00 | $ 3.86 |
HypotheticalA | | $ 1,000.00 | $ 1,020.11 | $ 5.08 |
A 5% return per year before expenses
* Expenses are equal to each Class' annualized expense ratio, multiplied by the average account value over the period, multiplied by 184/366 (to reflect the one-half year period).
Annual Report
Investment Changes (Unaudited)
Geographic Diversification (% of fund's net assets) |
As of October 31, 2008 |
| Japan 19.6% |
| United Kingdom 14.2% |
| Germany 13.5% |
| France 11.5% |
| Switzerland 7.5% |
| Italy 4.8% |
| Spain 3.6% |
| Norway 3.0% |
| Cayman Islands 2.6% |
| Other 19.7% |

Percentages are adjusted for the effect of futures contracts, if applicable. |
|
As of April 30, 2008 |
| Japan 17.8% |
| United Kingdom 14.8% |
| Germany 11.3% |
| France 8.8% |
| Switzerland 6.1% |
| Spain 5.3% |
| United States of America 4.5% |
| Italy 4.5% |
| Norway 4.4% |
| Other 22.5% |

Percentages are adjusted for the effect of futures contracts, if applicable. |
Asset Allocation |
| % of fund's
net assets | % of fund's net assets
6 months ago |
Stocks | 99.2 | 97.1 |
Short-Term Investments and Net Other Assets | 0.8 | 2.9 |
Top Ten Stocks as of October 31, 2008 |
| % of fund's
net assets | % of fund's net assets
6 months ago |
Royal Dutch Shell PLC Class A sponsored ADR (United Kingdom, Oil, Gas & Consumable Fuels) | 3.7 | 2.7 |
Toyota Motor Corp. (Japan, Automobiles) | 3.5 | 2.5 |
Roche Holding AG (participation certificate) (Switzerland, Pharmaceuticals) | 3.4 | 2.4 |
Muenchener Rueckversicherungs-Gesellschaft AG (Reg.) (Germany, Insurance) | 3.0 | 1.9 |
E.ON AG (Germany, Electric Utilities) | 2.9 | 2.1 |
Mitsui & Co. Ltd. (Japan, Trading Companies & Distributors) | 2.6 | 2.8 |
Total SA sponsored ADR (France, Oil, Gas & Consumable Fuels) | 2.6 | 1.6 |
AXA SA sponsored ADR (France, Insurance) | 2.6 | 2.2 |
UniCredit SpA (Italy, Commercial Banks) | 2.5 | 3.1 |
Allianz AG sponsored ADR (Germany, Insurance) | 2.4 | 2.5 |
| 29.2 | |
Market Sectors as of October 31, 2008 |
| % of fund's
net assets | % of fund's net assets
6 months ago |
Financials | 32.2 | 33.1 |
Energy | 14.9 | 15.4 |
Consumer Discretionary | 9.5 | 10.2 |
Industrials | 9.2 | 9.6 |
Utilities | 8.2 | 6.2 |
Telecommunication Services | 7.0 | 4.4 |
Materials | 5.9 | 6.7 |
Health Care | 5.1 | 3.5 |
Information Technology | 4.0 | 4.7 |
Consumer Staples | 3.2 | 3.3 |
Annual Report
Investments October 31, 2008
Showing Percentage of Net Assets
Common Stocks - 98.4% |
| Shares | | Value |
Australia - 2.1% |
AMP Ltd. | 388,042 | | $ 1,410,774 |
Macquarie Airports unit | 462,720 | | 657,723 |
Macquarie Group Ltd. (d) | 34,191 | | 677,961 |
Macquarie Infrastructure Group unit | 593,083 | | 776,966 |
TOTAL AUSTRALIA | | 3,523,424 |
Bermuda - 0.7% |
Seadrill Ltd. | 128,500 | | 1,237,198 |
Brazil - 1.4% |
Petroleo Brasileiro SA - Petrobras sponsored ADR | 49,700 | | 1,336,433 |
Uniao de Bancos Brasileiros SA (Unibanco) GDR | 15,100 | | 952,508 |
TOTAL BRAZIL | | 2,288,941 |
Canada - 1.3% |
Canadian Natural Resources Ltd. | 8,100 | | 408,560 |
First Quantum Minerals Ltd. | 34,000 | | 716,205 |
Nexen, Inc. | 29,800 | | 473,024 |
Petrobank Energy & Resources Ltd. (a) | 33,800 | | 644,717 |
TOTAL CANADA | | 2,242,506 |
Cayman Islands - 2.6% |
Chaoda Modern Agriculture (Holdings) Ltd. | 1,478,800 | | 1,041,847 |
Subsea 7, Inc. (a) | 41,000 | | 325,902 |
Transocean, Inc. (a) | 37,739 | | 3,107,052 |
TOTAL CAYMAN ISLANDS | | 4,474,801 |
China - 0.4% |
China Construction Bank Corp. (H Shares) | 939,000 | | 465,815 |
Nine Dragons Paper (Holdings) Ltd. | 1,087,000 | | 187,456 |
TOTAL CHINA | | 653,271 |
Cyprus - 0.4% |
Marfin Popular Bank Public Co. | 182,371 | | 617,712 |
Denmark - 0.1% |
Vestas Wind Systems AS (a) | 4,500 | | 184,319 |
Finland - 1.1% |
Fortum Oyj | 13,200 | | 324,404 |
Nokia Corp. sponsored ADR | 98,600 | | 1,496,748 |
TOTAL FINLAND | | 1,821,152 |
France - 11.5% |
Accor SA | 13,400 | | 521,331 |
Common Stocks - continued |
| Shares | | Value |
France - continued |
AXA SA sponsored ADR (d) | 231,500 | | $ 4,331,365 |
BNP Paribas SA | 49,400 | | 3,566,744 |
Compagnie de St. Gobain | 13,700 | | 528,639 |
GDF Suez | 33,989 | | 1,519,294 |
Renault SA | 9,400 | | 288,089 |
Total SA: | | | |
Series B | 43,700 | | 2,404,087 |
sponsored ADR | 80,500 | | 4,462,920 |
Unibail-Rodamco | 12,072 | | 1,810,615 |
TOTAL FRANCE | | 19,433,084 |
Germany - 13.3% |
Allianz AG sponsored ADR | 527,900 | | 4,001,482 |
BASF AG | 16,700 | | 561,558 |
Daimler AG | 114,700 | | 3,957,150 |
E.ON AG | 130,300 | | 4,984,860 |
GEA Group AG | 11,600 | | 169,522 |
GFK AG | 21,800 | | 430,496 |
Muenchener Rueckversicherungs-Gesellschaft AG (Reg.) | 38,200 | | 5,070,095 |
RWE AG | 37,300 | | 3,117,125 |
Tognum AG | 29,900 | | 332,442 |
TOTAL GERMANY | | 22,624,730 |
Greece - 0.4% |
Public Power Corp. of Greece | 51,600 | | 638,043 |
Hong Kong - 1.7% |
China Overseas Land & Investment Ltd. | 450,000 | | 508,167 |
Swire Pacific Ltd. (A Shares) | 340,300 | | 2,396,628 |
TOTAL HONG KONG | | 2,904,795 |
India - 0.7% |
Satyam Computer Services Ltd. sponsored ADR | 63,600 | | 1,000,428 |
Suzlon Energy Ltd. | 177,784 | | 161,161 |
TOTAL INDIA | | 1,161,589 |
Ireland - 1.2% |
Bank of Ireland | 134,771 | | 397,944 |
C&C Group PLC | 103,600 | | 150,697 |
CRH PLC sponsored ADR (d) | 68,800 | | 1,455,808 |
TOTAL IRELAND | | 2,004,449 |
Israel - 0.4% |
Israel Chemicals Ltd. | 69,400 | | 672,725 |
Common Stocks - continued |
| Shares | | Value |
Italy - 4.2% |
ENI SpA sponsored ADR | 32,300 | | $ 1,552,015 |
Fiat SpA | 49,200 | | 391,029 |
Finmeccanica SpA | 73,400 | | 898,002 |
UniCredit SpA | 1,740,700 | | 4,259,013 |
TOTAL ITALY | | 7,100,059 |
Japan - 19.6% |
Aeon Co. Ltd. | 172,700 | | 1,655,948 |
Canon, Inc. | 12,350 | | 432,125 |
Denso Corp. | 76,100 | | 1,483,158 |
East Japan Railway Co. | 243 | | 1,729,101 |
Ibiden Co. Ltd. | 20,300 | | 379,722 |
JSR Corp. | 49,500 | | 558,325 |
Konica Minolta Holdings, Inc. | 183,500 | | 1,205,039 |
Miraca Holdings, Inc. | 68,600 | | 1,106,238 |
Mitsubishi Estate Co. Ltd. | 25,000 | | 446,561 |
Mitsui & Co. Ltd. | 464,000 | | 4,495,703 |
Nomura Holdings, Inc. | 47,000 | | 445,271 |
Obic Co. Ltd. | 3,880 | | 474,898 |
ORIX Corp. | 27,620 | | 2,837,621 |
Osaka Gas Co. Ltd. | 872,000 | | 3,084,319 |
Sumitomo Corp. | 97,000 | | 853,367 |
Sumitomo Metal Industries Ltd. | 330,000 | | 848,697 |
Sumitomo Mitsui Financial Group, Inc. | 132 | | 529,143 |
Sumitomo Trust & Banking Co. Ltd. | 117,000 | | 541,809 |
Takeda Pharmaceutical Co. Ltd. | 22,200 | | 1,102,956 |
Tokuyama Corp. | 295,000 | | 1,493,853 |
Toyota Motor Corp. | 150,800 | | 5,888,579 |
Xebio Co. Ltd. | 61,200 | | 1,044,818 |
Yamada Denki Co. Ltd. | 12,060 | | 656,394 |
TOTAL JAPAN | | 33,293,645 |
Kazakhstan - 0.4% |
JSC Halyk Bank of Kazakhstan unit | 140,800 | | 598,400 |
Korea (South) - 0.2% |
Shinhan Financial Group Co. Ltd. | 15,390 | | 375,570 |
Mexico - 0.6% |
America Movil SAB de CV Series L sponsored ADR | 33,200 | | 1,027,208 |
Netherlands - 1.5% |
Heineken NV (Bearer) | 20,200 | | 681,411 |
Common Stocks - continued |
| Shares | | Value |
Netherlands - continued |
ING Groep NV sponsored ADR (d) | 54,600 | | $ 508,326 |
Koninklijke KPN NV | 99,100 | | 1,395,644 |
TOTAL NETHERLANDS | | 2,585,381 |
Norway - 3.0% |
DnB Nor ASA | 200,000 | | 1,159,067 |
Orkla ASA (A Shares) | 348,750 | | 2,321,704 |
Petroleum Geo-Services ASA (a) | 195,250 | | 972,230 |
StatoilHydro ASA sponsored ADR | 32,200 | | 647,220 |
TOTAL NORWAY | | 5,100,221 |
Philippines - 0.7% |
Philippine Long Distance Telephone Co. sponsored ADR | 29,100 | | 1,190,190 |
Russia - 0.9% |
OAO Gazprom sponsored ADR | 78,300 | | 1,601,235 |
Singapore - 1.2% |
DBS Group Holdings Ltd. | 272,000 | | 2,076,311 |
South Africa - 0.5% |
Impala Platinum Holdings Ltd. | 82,100 | | 847,890 |
Spain - 3.6% |
Banco Bilbao Vizcaya Argentaria SA sponsored ADR (d) | 127,800 | | 1,482,480 |
Banco Santander SA | 174,400 | | 1,886,164 |
Telefonica SA sponsored ADR | 47,800 | | 2,653,378 |
TOTAL SPAIN | | 6,022,022 |
Sweden - 0.5% |
Telefonaktiebolaget LM Ericsson (B Shares) | 132,600 | | 902,487 |
Switzerland - 7.5% |
EFG International | 63,690 | | 1,370,798 |
Nestle SA (Reg.) | 20,489 | | 796,584 |
Roche Holding AG (participation certificate) | 37,748 | | 5,771,438 |
Sonova Holding AG | 18,842 | | 782,727 |
Swiss Life Holding AG | 9,690 | | 872,940 |
Zurich Financial Services AG (Reg.) | 15,415 | | 3,126,685 |
TOTAL SWITZERLAND | | 12,721,172 |
Taiwan - 0.3% |
Advanced Semiconductor Engineering, Inc. | 390,993 | | 166,477 |
Hon Hai Precision Industry Co. Ltd. (Foxconn) | 174,000 | | 422,010 |
TOTAL TAIWAN | | 588,487 |
Common Stocks - continued |
| Shares | | Value |
Thailand - 0.1% |
Total Access Communication PCL unit | 216,000 | | $ 154,379 |
Turkey - 0.1% |
Turkiye Garanti Bankasi AS (a) | 82,000 | | 133,873 |
United Kingdom - 14.2% |
Aegis Group PLC | 821,800 | | 865,981 |
Anglo American PLC (United Kingdom) | 38,195 | | 958,243 |
BAE Systems PLC | 224,200 | | 1,260,064 |
Barratt Developments PLC | 40,600 | | 50,538 |
BHP Billiton PLC | 23,200 | | 393,900 |
British American Tobacco PLC (United Kingdom) | 11,500 | | 315,398 |
easyJet PLC (a) | 169,400 | | 844,962 |
HBOS PLC | 394,809 | | 646,392 |
HSBC Holdings PLC (United Kingdom) (Reg.) | 86,205 | | 1,020,905 |
Informa PLC | 135,400 | | 458,674 |
Man Group PLC | 203,100 | | 1,172,449 |
Misys PLC | 222,200 | | 397,821 |
National Grid PLC | 30,100 | | 339,038 |
Prudential PLC | 252,728 | | 1,269,382 |
Rio Tinto PLC (Reg.) | 26,100 | | 1,219,037 |
Royal Bank of Scotland Group PLC | 1,135,181 | | 1,250,266 |
Royal Dutch Shell PLC Class A sponsored ADR | 112,700 | | 6,289,791 |
Tesco PLC | 106,000 | | 580,714 |
Vodafone Group PLC | 372,400 | | 716,303 |
Vodafone Group PLC sponsored ADR | 195,812 | | 3,773,297 |
Xstrata PLC | 11,800 | | 201,806 |
TOTAL UNITED KINGDOM | | 24,024,961 |
TOTAL COMMON STOCKS (Cost $290,059,335) | 166,826,230 |
Nonconvertible Preferred Stocks - 0.8% |
| | | |
Germany - 0.2% |
ProSiebenSat.1 Media AG | 89,600 | | 270,434 |
Italy - 0.6% |
Fiat SpA (Risp) | 27,800 | | 126,000 |
Telecom Italia SpA (Risp) | 1,172,100 | | 986,350 |
TOTAL ITALY | | 1,112,350 |
TOTAL NONCONVERTIBLE PREFERRED STOCKS (Cost $3,399,874) | 1,382,784 |
Money Market Funds - 1.5% |
| Shares | | Value |
Fidelity Cash Central Fund, 1.81% (b) | 807,368 | | $ 807,368 |
Fidelity Securities Lending Cash Central Fund, 2.67% (b)(c) | 1,638,860 | | 1,638,860 |
TOTAL MONEY MARKET FUNDS (Cost $2,446,228) | 2,446,228 |
TOTAL INVESTMENT PORTFOLIO - 100.7% (Cost $295,905,437) | | 170,655,242 |
NET OTHER ASSETS - (0.7)% | | (1,169,534) |
NET ASSETS - 100% | $ 169,485,708 |
Legend |
(a) Non-income producing |
(b) Affiliated fund that is available only to investment companies and other accounts managed by Fidelity Investments. The rate quoted is the annualized seven-day yield of the fund at period end. A complete unaudited listing of the fund's holdings as of its most recent quarter end is available upon request. |
(c) Investment made with cash collateral received from securities on loan. |
(d) Security or a portion of the security is on loan at period end. |
Affiliated Central Funds |
Information regarding fiscal year to date income earned by the Fund from investments in Fidelity Central Funds is as follows: |
Fund | Income earned |
Fidelity Cash Central Fund | $ 102,969 |
Fidelity Securities Lending Cash Central Fund | 417,002 |
Total | $ 519,971 |
Income Tax Information |
At October 31, 2008, the fund had a capital loss carryforward of approximately $17,062,233 all of which will expire on October 31, 2016. |
See accompanying notes which are an integral part of the financial statements.
Annual Report
Statement of Assets and Liabilities
| October 31, 2008 |
| | |
Assets | | |
Investment in securities, at value (including securities loaned of $1,573,351) - See accompanying schedule: Unaffiliated issuers (cost $293,459,209) | $ 168,209,014 | |
Fidelity Central Funds (cost $2,446,228) | 2,446,228 | |
Total Investments (cost $295,905,437) | | $ 170,655,242 |
Foreign currency held at value (cost $11,124) | | 11,206 |
Receivable for investments sold | | 782,358 |
Receivable for fund shares sold | | 126,211 |
Dividends receivable | | 756,476 |
Distributions receivable from Fidelity Central Funds | | 13,358 |
Prepaid expenses | | 110 |
Other receivables | | 10,852 |
Total assets | | 172,355,813 |
| | |
Liabilities | | |
Payable for investments purchased | $ 787,826 | |
Payable for fund shares redeemed | 235,454 | |
Accrued management fee | 76,047 | |
Distribution fees payable | 4,028 | |
Other affiliated payables | 62,661 | |
Other payables and accrued expenses | 65,229 | |
Collateral on securities loaned, at value | 1,638,860 | |
Total liabilities | | 2,870,105 |
| | |
Net Assets | | $ 169,485,708 |
Net Assets consist of: | | |
Paid in capital | | $ 310,179,781 |
Undistributed net investment income | | 5,906,440 |
Accumulated undistributed net realized gain (loss) on investments and foreign currency transactions | | (21,368,384) |
Net unrealized appreciation (depreciation) on investments and assets and liabilities in foreign currencies | | (125,232,129) |
Net Assets | | $ 169,485,708 |
See accompanying notes which are an integral part of the financial statements.
Annual Report
Statement of Assets and Liabilities - continued
| October 31, 2008 |
| | |
Calculation of Maximum Offering Price
Class A:
Net Asset Value and redemption price per share ($2,854,331 ÷ 481,103 shares) | | $ 5.93 |
| | |
Maximum offering price per share (100/94.25 of $5.93) | | $ 6.29 |
Class T:
Net Asset Value and redemption price per share ($2,086,796 ÷ 353,285 shares) | | $ 5.91 |
| | |
Maximum offering price per share (100/96.50 of $5.91) | | $ 6.12 |
Class B:
Net Asset Value and offering price per share ($930,749 ÷ 158,228 shares)A | | $ 5.88 |
| | |
Class C:
Net Asset Value and offering price per share ($1,784,476 ÷ 303,662 shares)A | | $ 5.88 |
| | |
| | |
International Value:
Net Asset Value, offering price and redemption price per share ($160,777,143 ÷ 27,001,723 shares) | | $ 5.95 |
| | |
Institutional Class:
Net Asset Value, offering price and redemption price per share ($1,052,213 ÷ 176,561 shares) | | $ 5.96 |
A Redemption price per share is equal to net asset value less any applicable contingent deferred sales charge.
See accompanying notes which are an integral part of the financial statements.
Annual Report
Financial Statements - continued
Statement of Operations
| Year ended October 31, 2008 |
| | |
Investment Income | | |
Dividends | | $ 11,310,376 |
Income from Fidelity Central Funds | | 519,971 |
| | 11,830,347 |
Less foreign taxes withheld | | (1,004,576) |
Total income | | 10,825,771 |
| | |
Expenses | | |
Management fee
Basic fee | $ 2,219,944 | |
Performance adjustment | 37,496 | |
Transfer agent fees | 755,414 | |
Distribution fees | 100,125 | |
Accounting and security lending fees | 166,400 | |
Custodian fees and expenses | 74,291 | |
Independent trustees' compensation | 1,436 | |
Registration fees | 82,664 | |
Audit | 62,472 | |
Legal | 1,823 | |
Miscellaneous | 51,367 | |
Total expenses before reductions | 3,553,432 | |
Expense reductions | (34,143) | 3,519,289 |
Net investment income (loss) | | 7,306,482 |
Realized and Unrealized Gain (Loss) Net realized gain (loss) on: | | |
Investment securities: | | |
Unaffiliated issuers (net of foreign taxes of $20,535) | (21,080,305) | |
Foreign currency transactions | (178,048) | |
Total net realized gain (loss) | | (21,258,353) |
Change in net unrealized appreciation (depreciation) on: Investment securities | (181,075,670) | |
Assets and liabilities in foreign currencies | 12,629 | |
Total change in net unrealized appreciation (depreciation) | | (181,063,041) |
Net gain (loss) | | (202,321,394) |
Net increase (decrease) in net assets resulting from operations | | $ (195,014,912) |
See accompanying notes which are an integral part of the financial statements.
Annual Report
Statement of Changes in Net Assets
| Year ended
October 31,
2008 | Year ended
October 31,
2007 |
Increase (Decrease) in Net Assets | | |
Operations | | |
Net investment income (loss) | $ 7,306,482 | $ 6,846,508 |
Net realized gain (loss) | (21,258,353) | 23,723,355 |
Change in net unrealized appreciation (depreciation) | (181,063,041) | 43,769,419 |
Net increase (decrease) in net assets resulting
from operations | (195,014,912) | 74,339,282 |
Distributions to shareholders from net investment income | (5,562,901) | (978,516) |
Distributions to shareholders from net realized gain | (18,717,865) | (557,946) |
Total distributions | (24,280,766) | (1,536,462) |
Share transactions - net increase (decrease) | (16,138,151) | 101,052,444 |
Redemption fees | 26,598 | 30,746 |
Total increase (decrease) in net assets | (235,407,231) | 173,886,010 |
| | |
Net Assets | | |
Beginning of period | 404,892,939 | 231,006,929 |
End of period (including undistributed net investment income of $5,906,440 and undistributed net investment income of $6,624,232, respectively) | $ 169,485,708 | $ 404,892,939 |
See accompanying notes which are an integral part of the financial statements.
Annual Report
Financial Highlights - Class A
Years ended October 31, | 2008 | 2007 | 2006 I |
Selected Per-Share Data | | | |
Net asset value, beginning of period | $ 13.02 | $ 10.60 | $ 10.00 |
Income from Investment Operations | | | |
Net investment income (loss) E | .21 | .18 | .06 H |
Net realized and unrealized gain (loss) | (6.53) | 2.29 | .54 |
Total from investment operations | (6.32) | 2.47 | .60 |
Distributions from net investment income | (.15) | (.03) | - |
Distributions from net realized gain | (.62) | (.02) | - |
Total distributions | (.77) | (.05) | - |
Redemption fees added to paid in capital E, K | - | - | - |
Net asset value, end of period | $ 5.93 | $ 13.02 | $ 10.60 |
Total Return B, C, D | (51.50)% | 23.43% | 6.00% |
Ratios to Average Net Assets F, J | | | |
Expenses before reductions | 1.42% | 1.38% | 1.75% A |
Expenses net of fee waivers, if any | 1.42% | 1.38% | 1.50% A |
Expenses net of all reductions | 1.41% | 1.37% | 1.46% A |
Net investment income (loss) | 2.05% | 1.49% | 1.29% A, H |
Supplemental Data | | | |
Net assets, end of period (000 omitted) | $ 2,854 | $ 6,052 | $ 1,537 |
Portfolio turnover rate G | 68% | 59% | 29% A |
A Annualized
B Total returns for periods of less than one year are not annualized.
C Total returns would have been lower had certain expenses not been reduced during the periods shown.
D Total returns do not include the effect of the sales charges.
E Calculated based on average shares outstanding during the period.
F Fees and expenses of the underlying Fidelity Central Funds are not included in the Fund's expense ratio. The Fund indirectly bears its proportionate share of the expenses of any underlying Fidelity Central Funds.
G Amount does not include the portfolio activity of any underlying Fidelity Central Funds.
H Investment income per share reflects a special dividend which amounted to $.03 per share. Excluding the special dividend, the ratio of net investment income (loss) to average net assets would have been .63%.
I For the period May 18, 2006 (commencement of operations) to October 31, 2006.
J Expense ratios reflect operating expenses of the class. Expenses before reductions do not reflect amounts reimbursed by the investment adviser or reductions from brokerage service arrangements or other expense offset arrangements and do not represent the amount paid by the class during periods when reimbursements or reductions occur. Expense ratios before reductions for start-up periods may not be representative of longer-term operating periods. Expenses net of fee waivers reflect expenses after reimbursement by the investment adviser but prior to reductions from brokerage service arrangements or other expense offset arrangements. Expenses net of all reductions represent the net expenses paid by the class.
K Amount represents less than $.01 per share.
See accompanying notes which are an integral part of the financial statements.
Annual Report
Financial Highlights - Class T
Years ended October 31, | 2008 | 2007 | 2006 I |
Selected Per-Share Data | | | |
Net asset value, beginning of period | $ 12.99 | $ 10.59 | $ 10.00 |
Income from Investment Operations | | | |
Net investment income (loss) E | .18 | .15 | .05 H |
Net realized and unrealized gain (loss) | (6.50) | 2.29 | .54 |
Total from investment operations | (6.32) | 2.44 | .59 |
Distributions from net investment income | (.14) | (.02) | - |
Distributions from net realized gain | (.62) | (.02) | - |
Total distributions | (.76) | (.04) | - |
Redemption fees added to paid in capital E, K | - | - | - |
Net asset value, end of period | $ 5.91 | $ 12.99 | $ 10.59 |
Total Return B, C, D | (51.60)% | 23.13% | 5.90% |
Ratios to Average Net Assets F, J | | | |
Expenses before reductions | 1.67% | 1.60% | 2.01% A |
Expenses net of fee waivers, if any | 1.67% | 1.60% | 1.75% A |
Expenses net of all reductions | 1.66% | 1.58% | 1.71% A |
Net investment income (loss) | 1.80% | 1.27% | 1.04% A, H |
Supplemental Data | | | |
Net assets, end of period (000 omitted) | $ 2,087 | $ 5,081 | $ 1,789 |
Portfolio turnover rate G | 68% | 59% | 29% A |
A Annualized
B Total returns for periods of less than one year are not annualized.
C Total returns would have been lower had certain expenses not been reduced during the periods shown.
D Total returns do not include the effect of the sales charges.
E Calculated based on average shares outstanding during the period.
F Fees and expenses of the underlying Fidelity Central Funds are not included in the Fund's expense ratio. The Fund indirectly bears its proportionate share of the expenses of any underlying Fidelity Central Funds.
G Amount does not include the portfolio activity of any underlying Fidelity Central Funds.
H Investment income per share reflects a special dividend which amounted to $.03 per share. Excluding the special dividend, the ratio of net investment income (loss) to average net assets would have been .38%.
I For the period May 18, 2006 (commencement of operations) to October 31, 2006.
J Expense ratios reflect operating expenses of the class. Expenses before reductions do not reflect amounts reimbursed by the investment adviser or reductions from brokerage service arrangements or other expense offset arrangements and do not represent the amount paid by the class during periods when reimbursements or reductions occur. Expense ratios before reductions for start-up periods may not be representative of longer-term operating periods. Expenses net of fee waivers reflect expenses after reimbursement by the investment adviser but prior to reductions from brokerage service arrangements or other expense offset arrangements. Expenses net of all reductions represent the net expenses paid by the class.
K Amount represents less than $.01 per share.
See accompanying notes which are an integral part of the financial statements.
Annual Report
Financial Highlights - Class B
Years ended October 31, | 2008 | 2007 | 2006 I |
Selected Per-Share Data | | | |
Net asset value, beginning of period | $ 12.93 | $ 10.56 | $ 10.00 |
Income from Investment Operations | | | |
Net investment income (loss) E | .13 | .09 | .02 H |
Net realized and unrealized gain (loss) | (6.48) | 2.29 | .54 |
Total from investment operations | (6.35) | 2.38 | .56 |
Distributions from net investment income | (.08) | - | - |
Distributions from net realized gain | (.62) | (.01) | - |
Total distributions | (.70) | (.01) | - |
Redemption fees added to paid in capital E, K | - | - | - |
Net asset value, end of period | $ 5.88 | $ 12.93 | $ 10.56 |
Total Return B, C, D | (51.85)% | 22.59% | 5.60% |
Ratios to Average Net Assets F, J | | | |
Expenses before reductions | 2.18% | 2.10% | 2.50% A |
Expenses net of fee waivers, if any | 2.18% | 2.10% | 2.25% A |
Expenses net of all reductions | 2.17% | 2.08% | 2.21% A |
Net investment income (loss) | 1.29% | .77% | .54% A, H |
Supplemental Data | | | |
Net assets, end of period (000 omitted) | $ 931 | $ 2,651 | $ 1,304 |
Portfolio turnover rate G | 68% | 59% | 29% A |
A Annualized
B Total returns for periods of less than one year are not annualized.
C Total returns would have been lower had certain expenses not been reduced during the periods shown.
D Total returns do not include the effect of the contingent deferred sales charge.
E Calculated based on average shares outstanding during the period.
F Fees and expenses of the underlying Fidelity Central Funds are not included in the Fund's expense ratio. The Fund indirectly bears its proportionate share of the expenses of any underlying Fidelity Central Funds.
G Amount does not include the portfolio activity of any underlying Fidelity Central Funds.
H Investment income per share reflects a special dividend which amounted to $.03 per share. Excluding the special dividend, the ratio of net investment income (loss) to average net assets would have been (.12)%.
I For the period May 18, 2006 (commencement of operations) to October 31, 2006.
J Expense ratios reflect operating expenses of the class. Expenses before reductions do not reflect amounts reimbursed by the investment adviser or reductions from brokerage service arrangements or other expense offset arrangements and do not represent the amount paid by the class during periods when reimbursements or reductions occur. Expense ratios before reductions for start-up periods may not be representative of longer-term operating periods. Expenses net of fee waivers reflect expenses after reimbursement by the investment adviser but prior to reductions from brokerage service arrangements or other expense offset arrangements. Expenses net of all reductions represent the net expenses paid by the class.
K Amount represents less than $.01 per share.
See accompanying notes which are an integral part of the financial statements.
Annual Report
Financial Highlights - Class C
Years ended October 31, | 2008 | 2007 | 2006 I |
Selected Per-Share Data | | | |
Net asset value, beginning of period | $ 12.92 | $ 10.56 | $ 10.00 |
Income from Investment Operations | | | |
Net investment income (loss) E | .13 | .09 | .02 H |
Net realized and unrealized gain (loss) | (6.47) | 2.29 | .54 |
Total from investment operations | (6.34) | 2.38 | .56 |
Distributions from net investment income | (.08) | - | - |
Distributions from net realized gain | (.62) | (.02) | - |
Total distributions | (.70) | (.02) | - |
Redemption fees added to paid in capital E, K | - | - | - |
Net asset value, end of period | $ 5.88 | $ 12.92 | $ 10.56 |
Total Return B, C, D | (51.80)% | 22.56% | 5.60% |
Ratios to Average Net Assets F, J | | | |
Expenses before reductions | 2.17% | 2.07% | 2.47% A |
Expenses net of fee waivers, if any | 2.17% | 2.07% | 2.25% A |
Expenses net of all reductions | 2.16% | 2.05% | 2.21% A |
Net investment income (loss) | 1.30% | .80% | .54% A, H |
Supplemental Data | | | |
Net assets, end of period (000 omitted) | $ 1,784 | $ 5,996 | $ 2,183 |
Portfolio turnover rate G | 68% | 59% | 29% A |
A Annualized
B Total returns for periods of less than one year are not annualized.
C Total returns would have been lower had certain expenses not been reduced during the periods shown.
D Total returns do not include the effect of the contingent deferred sales charge.
E Calculated based on average shares outstanding during the period.
F Fees and expenses of the underlying Fidelity Central Funds are not included in the Fund's expense ratio. The Fund indirectly bears its proportionate share of the expenses of any underlying Fidelity Central Funds.
G Amount does not include the portfolio activity of any underlying Fidelity Central Funds.
H Investment income per share reflects a special dividend which amounted to $.03 per share. Excluding the special dividend, the ratio of net investment income (loss) to average net assets would have been (.12)%.
I For the period May 18, 2006 (commencement of operations) to October 31, 2006.
J Expense ratios reflect operating expenses of the class. Expenses before reductions do not reflect amounts reimbursed by the investment adviser or reductions from brokerage service arrangements or other expense offset arrangements and do not represent the amount paid by the class during periods when reimbursements or reductions occur. Expense ratios before reductions for start-up periods may not be representative of longer-term operating periods. Expenses net of fee waivers reflect expenses after reimbursement by the investment adviser but prior to reductions from brokerage service arrangements or other expense offset arrangements. Expenses net of all reductions represent the net expenses paid by the class.
K Amount represents less than $.01 per share.
See accompanying notes which are an integral part of the financial statements.
Annual Report
Financial Highlights - International Value
Years ended October 31, | 2008 | 2007 | 2006 H |
Selected Per-Share Data | | | |
Net asset value, beginning of period | $ 13.06 | $ 10.61 | $ 10.00 |
Income from Investment Operations | | | |
Net investment income (loss) D | .24 | .22 | .07 G |
Net realized and unrealized gain (loss) | (6.54) | 2.29 | .54 |
Total from investment operations | (6.30) | 2.51 | .61 |
Distributions from net investment income | (.19) | (.04) | - |
Distributions from net realized gain | (.62) | (.02) | - |
Total distributions | (.81) | (.06) | - |
Redemption fees added to paid in capital D, J | - | - | - |
Net asset value, end of period | $ 5.95 | $ 13.06 | $ 10.61 |
Total Return B, C | (51.34)% | 23.81% | 6.10% |
Ratios to Average Net Assets E, I | | | |
Expenses before reductions | 1.10% | 1.03% | 1.50% A |
Expenses net of fee waivers, if any | 1.10% | 1.03% | 1.25% A |
Expenses net of all reductions | 1.09% | 1.02% | 1.21% A |
Net investment income (loss) | 2.37% | 1.84% | 1.54% A, G |
Supplemental Data | | | |
Net assets, end of period (000 omitted) | $ 160,777 | $ 381,148 | $ 221,130 |
Portfolio turnover rate F | 68% | 59% | 29% A |
A Annualized
B Total returns for periods of less than one year are not annualized.
C Total returns would have been lower had certain expenses not been reduced during the periods shown.
D Calculated based on average shares outstanding during the period.
E Fees and expenses of the underlying Fidelity Central Funds are not included in the Fund's expense ratio. The Fund indirectly bears its proportionate share of the expenses of any underlying Fidelity Central Funds.
F Amount does not include the portfolio activity of any underlying Fidelity Central Funds.
G Investment income per share reflects a special dividend which amounted to $.03 per share. Excluding the special dividend, the ratio of net investment income (loss) to average net assets would have been .88%.
H For the period May 18, 2006 (commencement of operations) to October 31, 2006.
I Expense ratios reflect operating expenses of the class. Expenses before reductions do not reflect amounts reimbursed by the investment adviser or reductions from brokerage service arrangements or other expense offset arrangements and do not represent the amount paid by the class during periods when reimbursements or reductions occur. Expense ratios before reductions for start-up periods may not be representative of longer-term operating periods. Expenses net of fee waivers reflect expenses after reimbursement by the investment adviser but prior to reductions from brokerage service arrangements or other expense offset arrangements. Expenses net of all reductions represent the net expenses paid by the class.
J Amount represents less than $.01 per share.
See accompanying notes which are an integral part of the financial statements.
Annual Report
Financial Highlights - Institutional Class
Years ended October 31, | 2008 | 2007 | 2006 H |
Selected Per-Share Data | | | |
Net asset value, beginning of period | $ 13.07 | $ 10.61 | $ 10.00 |
Income from Investment Operations | | | |
Net investment income (loss) D | .25 | .22 | .07 G |
Net realized and unrealized gain (loss) | (6.54) | 2.30 | .54 |
Total from investment operations | (6.29) | 2.52 | .61 |
Distributions from net investment income | (.20) | (.04) | - |
Distributions from net realized gain | (.62) | (.02) | - |
Total distributions | (.82) | (.06) | - |
Redemption fees added to paid in capital D, J | - | - | - |
Net asset value, end of period | $ 5.96 | $ 13.07 | $ 10.61 |
Total Return B, C | (51.27)% | 23.91% | 6.10% |
Ratios to Average Net Assets E, I | | | |
Expenses before reductions | 1.02% | .98% | 1.38% A |
Expenses net of fee waivers, if any | 1.02% | .98% | 1.25% A |
Expenses net of all reductions | 1.01% | .96% | 1.21% A |
Net investment income (loss) | 2.45% | 1.89% | 1.54% A, G |
Supplemental Data | | | |
Net assets, end of period (000 omitted) | $ 1,052 | $ 3,965 | $ 3,064 |
Portfolio turnover rate F | 68% | 59% | 29% A |
A Annualized
B Total returns for periods of less than one year are not annualized.
C Total returns would have been lower had certain expenses not been reduced during the periods shown.
D Calculated based on average shares outstanding during the period.
E Fees and expenses of the underlying Fidelity Central Funds are not included in the Fund's expense ratio. The Fund indirectly bears its proportionate share of the expenses of any underlying Fidelity Central Funds.
F Amount does not include the portfolio activity of any underlying Fidelity Central Funds.
G Investment income per share reflects a special dividend which amounted to $.03 per share. Excluding the special dividend, the ratio of net investment income (loss) to average net assets would have been .88%.
H For the period May 18, 2006 (commencement of operations) to October 31, 2006.
I Expense ratios reflect operating expenses of the class. Expenses before reductions do not reflect amounts reimbursed by the investment adviser or reductions from brokerage service arrangements or other expense offset arrangements and do not represent the amount paid by the class during periods when reimbursements or reductions occur. Expense ratios before reductions for start-up periods may not be representative of longer-term operating periods. Expenses net of fee waivers reflect expenses after reimbursement by the investment adviser but prior to reductions from brokerage service arrangements or other expense offset arrangements. Expenses net of all reductions represent the net expenses paid by the class.
J Amount represents less than $.01 per share.
See accompanying notes which are an integral part of the financial statements.
Annual Report
Notes to Financial Statements
For the period ended October 31, 2008
1. Organization.
Fidelity International Value Fund (the Fund) is a fund of Fidelity Investment Trust (the trust) and is authorized to issue an unlimited number of shares. The trust is registered under the Investment Company Act of 1940, as amended (the 1940 Act), as an open-end management investment company organized as a Massachusetts business trust. The Fund offers Class A, Class T, Class B, Class C, International Value and Institutional Class shares, each of which has equal rights as to assets and voting privileges. Each class has exclusive voting rights with respect to matters that affect that class. Class B shares will automatically convert to Class A shares after a holding period of seven years from the initial date of purchase. Investment income, realized and unrealized capital gains and losses, the common expenses of the Fund, and certain fund-level expense reductions, if any, are allocated on a pro rata basis to each class based on the relative net assets of each class to the total net assets of the Fund. Each class differs with respect to transfer agent and distribution and service plan fees incurred. Certain expense reductions also differ by class.
The Fund's investments in emerging markets can be subject to social, economic, regulatory, and political uncertainties and can be extremely volatile.
2. Investments in Fidelity Central Funds.
The Fund may invest in Fidelity Central Funds, which are open-end investment companies available only to other investment companies and accounts managed by Fidelity Management & Research Company (FMR) and its affiliates. The Fund's Schedule of Investments lists each of the Fidelity Central Funds held as of period end, if any, as an investment of the Fund, but does not include the underlying holdings of each Fidelity Central Fund. As an Investing Fund, the Fund indirectly bears its proportionate share of the expenses of the underlying Fidelity Central Funds.
The Money Market Central Funds seek preservation of capital and current income and are managed by Fidelity Investments Money Management, Inc. (FIMM), an affiliate of FMR.
A complete unaudited list of holdings for each Fidelity Central Fund is available upon request or at the SEC's web site at www.sec.gov. In addition, the financial statements of the Fidelity Central Funds, which are not covered by the Fund's Report of Independent Registered Public Accounting Firm, are available on the SEC's web site or upon request.
3. Significant Accounting Policies.
The financial statements have been prepared in conformity with accounting principles generally accepted in the United States of America, which require management to make certain estimates and assumptions at the date of the financial statements. Actual results could differ from those estimates. The following summarizes the significant accounting policies of the Fund:
Annual Report
3. Significant Accounting Policies - continued
Security Valuation. Investments are valued as of 4:00 p.m. Eastern time on the last calendar day of the period. Wherever possible, the Fund uses independent pricing services approved by the Board of Trustees to value its investments.
Equity securities, including restricted securities, for which market quotations are readily available, are valued at the last reported sale price or official closing price as reported by an independent pricing service on the primary market or exchange on which they are traded. In the event there were no sales during the day or closing prices are not available, securities are valued at the last quoted bid price. Investments in open-end mutual funds, including Fidelity Central Funds, are valued at their closing net asset value each business day. Short-term securities with remaining maturities of sixty days or less for which quotations are not readily available are valued at amortized cost, which approximates value.
When current market prices or quotations are not readily available or reliable, valuations may be determined in good faith in accordance with procedures adopted by the Board of Trustees. Factors used in determining value may include significant market or security specific events, changes in interest rates and credit quality, and developments in foreign markets which are monitored by evaluating the performance of ADRs, futures contracts and exchange-traded funds. The frequency with which these procedures are used cannot be predicted and may be utilized to a significant extent. The value of securities used for net asset value (NAV) calculation under these procedures may differ from published prices for the same securities.
Foreign Currency. The Fund uses foreign currency contracts to facilitate transactions in foreign-denominated securities. Losses from these transactions may arise from changes in the value of the foreign currency or if the counterparties do not perform under the contracts' terms.
Foreign-denominated assets, including investment securities, and liabilities are translated into U.S. dollars at the exchange rate at period end. Purchases and sales of investment securities, income and dividends received and expenses denominated in foreign currencies are translated into U.S. dollars at the exchange rate in effect on the transaction date.
The effects of exchange rate fluctuations on investments are included with the net realized and unrealized gain (loss) on investment securities. Other foreign currency transactions resulting in realized and unrealized gain (loss) are disclosed separately.
Annual Report
Notes to Financial Statements - continued
3. Significant Accounting Policies - continued
Investment Transactions and Income. For financial reporting purposes, the Fund's investment holdings and NAV include trades executed through the end of the last business day of the period. The NAV per share for processing shareholder transactions is calculated as of the close of business of the New York Stock Exchange (NYSE), normally 4:00 p.m. Eastern time and includes trades executed through the end of the prior business day. Gains and losses on securities sold are determined on the basis of identified cost. Dividend income is recorded on the ex-dividend date, except for certain dividends from foreign securities where the ex-dividend date may have passed, which are recorded as soon as the Fund is informed of the ex-dividend date. Non-cash dividends included in dividend income, if any, are recorded at the fair market value of the securities received. Interest income and distributions from the Fidelity Central Funds are accrued as earned. Interest income includes coupon interest and amortization of premium and accretion of discount on debt securities. Investment income is recorded net of foreign taxes withheld where recovery of such taxes is uncertain.
Expenses. Most expenses of the trust can be directly attributed to a fund. Expenses which cannot be directly attributed are apportioned among each Fund in the trust. Expense estimates are accrued in the period to which they relate and adjustments are made when actual amounts are known.
Income Tax Information and Distributions to Shareholders. Each year, the Fund intends to qualify as a regulated investment company by distributing substantially all of its taxable income and realized gains under Subchapter M of the Internal Revenue Code and filing its U.S. federal tax return. As a result, no provision for income taxes is required. The Fund is subject to the provisions of FASB Interpretation No. 48, Accounting for Uncertainties in Income Taxes (FIN 48). FIN 48 sets forth a minimum threshold for financial statement recognition of the benefit of a tax position taken or expected to be taken in a tax return. The implementation of FIN 48 did not result in any unrecognized tax benefits in the accompanying financial statements. Each of the Fund's federal tax returns for the prior three fiscal years remains subject to examination by the Internal Revenue Service (IRS). Foreign taxes are provided for based on the Fund's understanding of the tax rules and rates that exist in the foreign markets in which it invests.
Distributions are recorded on the ex-dividend date. Income dividends and capital gain distributions are declared separately for each class. Income and capital gain distributions are determined in accordance with income tax regulations, which may differ from generally accepted accounting principles. In addition, the Fund will claim a portion of the payment made to redeeming shareholders as a distribution for income tax purposes.
Capital accounts within the financial statements are adjusted for permanent book-tax differences. These adjustments have no impact on net assets or the results of operations. Temporary book-tax differences will reverse in a subsequent period.
Annual Report
3. Significant Accounting Policies - continued
Income Tax Information and Distributions to Shareholders - continued
Book-tax differences are primarily due to foreign currency transactions, certain foreign taxes, passive foreign investment companies (PFIC), capital loss carryforwards and losses deferred due to wash sales.
The tax-basis components of distributable earnings and the federal tax cost as of period end were as follows:
Unrealized appreciation | $ 807,051 |
Unrealized depreciation | (130,345,335) |
Net unrealized appreciation (depreciation) | (129,538,284) |
Undistributed ordinary income | 2,463,569 |
Capital loss carryforward | (17,062,233) |
| |
Cost for federal income tax purposes | $ 300,193,526 |
The tax character of distributions paid was as follows:
| October 31, 2008 | October 31, 2007 |
Ordinary Income | $ 14,016,131 | $ 1,536,462 |
Long-term Capital Gains | 10,264,635 | - |
Total | $ 24,280,766 | $ 1,536,462 |
Short-Term Trading (Redemption) Fees. Shares held in the Fund less than 30 days are subject to a redemption fee equal to 1.00% of the proceeds of the redeemed shares. All redemption fees, including any estimated redemption fees paid by FMR, are retained by the Fund and accounted for as an addition to paid in capital.
New Accounting Pronouncement. In September 2006, Statement of Financial Accounting Standards No. 157, Fair Value Measurements (SFAS 157), was issued and is effective for fiscal years beginning after November 15, 2007. SFAS 157 defines fair value, establishes a framework for measuring fair value and results in expanded disclosures about fair value measurements.
4. Operating Policies.
Repurchase Agreements. FMR has received an Exemptive Order from the Securities and Exchange Commission (the SEC) which permits the Fund and other affiliated entities of FMR to transfer uninvested cash balances into joint trading accounts which are then invested in repurchase agreements. The Fund may also invest directly with institutions in repurchase agreements. Repurchase agreements are collateralized by government or non-government securities. Upon settlement date, collateral is held in segregated accounts with custodian banks and may be obtained in the event of a default of the counterparty. The
Annual Report
Notes to Financial Statements - continued
4. Operating Policies - continued
Repurchase Agreements - continued
Fund monitors, on a daily basis, the value of the collateral to ensure it is at least equal to the principal amount of the repurchase agreement (including accrued interest). In the event of a default by the counterparty, realization of the collateral proceeds could be delayed, during which time the value of the collateral may decline.
5. Purchases and Sales of Investments.
Purchases and sales of securities, other than short-term securities, aggregated $212,491,909 and $242,763,038, respectively.
6. Fees and Other Transactions with Affiliates.
Management Fee. FMR and its affiliates provide the Fund with investment management related services for which the Fund pays a monthly management fee. The management fee is the sum of an individual fund fee rate that is based on an annual rate of .45% of the Fund's average net assets and a group fee rate that averaged .26% during the period. The group fee rate is based upon the average net assets of all the mutual funds advised by FMR. The group fee rate decreases as assets under management increase and increases as assets under management decrease. In addition, the management fee is subject to a performance adjustment (up to a maximum of ± .20% of the Fund's average net assets over a 36 month performance period). The upward or downward adjustment to the management fee is based on the relative investment performance of the retail class of the Fund, International Value as compared to an appropriate benchmark index. For the period, the total annual management fee rate, including the performance adjustment, was .72% of the Fund's average net assets.
Distribution and Service Plan. In accordance with Rule 12b-1 of the 1940 Act, the Fund has adopted separate Distribution and Service Plans for each class of shares. Certain classes pay Fidelity Distributors Corporation (FDC), an affiliate of FMR, separate Distribution and Service Fees, each of which is based on an annual percentage of each class' average net assets. In addition, FDC may pay financial intermediaries for selling shares of the Fund and providing shareholder support services. For the period, the Distribution and Service Fee rates and the total amounts paid to and retained by FDC were as follows:
| Distribution
Fee | Service
Fee | Paid to
FDC | Retained
by FDC |
Class A | -% | .25% | $ 13,754 | $ 2,352 |
Class T | .25% | .25% | 20,752 | 3,584 |
Class B | .75% | .25% | 21,357 | 18,195 |
Class C | .75% | .25% | 44,262 | 14,734 |
| | | $ 100,125 | $ 38,865 |
Annual Report
6. Fees and Other Transactions with Affiliates - continued
Sales Load. FDC receives a front-end sales charge of up to 5.75% for selling Class A shares, and 3.50% for selling Class T shares, some of which is paid to financial intermediaries for selling shares of the Fund. FDC receives the proceeds of contingent deferred sales charges levied on Class A, Class T, Class B, and Class C redemptions. These charges depend on the holding period. The deferred sales charges range from 5% to 1% for Class B, 1% for Class C, 1.00% to .50% for certain purchases of Class A shares and .25% for certain purchases of Class T shares.
For the period, sales charge amounts retained by FDC were as follows:
| Retained
by FDC |
Class A | $ 6,886 |
Class T | 1,276 |
Class B* | 3,402 |
Class C* | 626 |
| $ 12,190 |
* When Class B and Class C shares are initially sold, FDC pays commissions from its own resources to financial intermediaries through which the sales are made.
Transfer Agent Fees. Fidelity Investments Institutional Operations Company, Inc. (FIIOC), an affiliate of FMR, is the transfer, dividend disbursing and shareholder servicing agent for each class of the Fund. FIIOC receives account fees and asset-based fees that vary according to the account size and type of account of the shareholders of the respective classes of the Fund. FIIOC pays for typesetting, printing, and mailing of shareholder reports, except proxy statements. Prior to January 1, 2008, Fidelity Service Company, Inc. (FSC), also an affiliate of FMR was the transfer agent for International Value. For the period, the total transfer agent fees paid by each class were as follows:
| Amount | % of
Average
Net Assets |
Class A | $ 16,622 | .30 |
Class T | 12,810 | .31 |
Class B | 6,621 | .31 |
Class C | 13,325 | .30 |
International Value | 701,661 | .24 |
Institutional Class | 4,375 | .16 |
| $ 755,414 | |
Annual Report
Notes to Financial Statements - continued
6. Fees and Other Transactions with Affiliates - continued
Accounting and Security Lending Fees. FSC, an affiliate of FMR, maintains the Fund's accounting records. The accounting fee is based on the level of average net assets for the month. Under a separate contract, FSC administers the security lending program. The security lending fee is based on the number and duration of lending transactions.
Brokerage Commissions. The Fund placed a portion of its portfolio transactions with brokerage firms which are affiliates of the investment adviser. The commissions paid to these affiliated firms were $982 for the period.
7. Committed Line of Credit.
The Fund participates with other funds managed by FMR in a $4.2 billion credit facility (the "line of credit") to be utilized for temporary or emergency purposes to fund shareholder redemptions or for other short-term liquidity purposes. The Fund has agreed to pay commitment fees on its pro rata portion of the line of credit, which amounted to $652 and is reflected in Miscellaneous Expense on the Statement of Operations. During the period, there were no borrowings on this line of credit.
8. Security Lending.
The Fund lends portfolio securities from time to time in order to earn additional income. On the settlement date of the loan, the Fund receives collateral (in the form of U.S. Treasury obligations, letters of credit and/or cash) against the loaned securities and maintains collateral in an amount not less than 100% of the market value of the loaned securities during the period of the loan. The market value of the loaned securities is determined at the close of business of the Fund and any additional required collateral is delivered to the Fund on the next business day. If the borrower defaults on its obligation to return the securities loaned because of insolvency or other reasons, a fund could experience delays and costs in recovering the securities loaned or in gaining access to the collateral. Any cash collateral received is invested in the Fidelity Securities Lending Cash Central Fund. The value of loaned securities and cash collateral at period end are disclosed on the Fund's Statement of Assets and Liabilities. Security lending income represents the income earned on investing cash collateral, less fees and expenses associated with the loan, plus any premium payments that may be received on the loan of certain types of securities. Security lending income is presented in the Statement of Operations as a component of income from Fidelity Central Funds. Net income from lending portfolio securities during the period amounted to $417,002.
9. Expense Reductions.
Many of the brokers with whom FMR places trades on behalf of the Fund provided services to the Fund in addition to trade execution. These services included payments of certain expenses on behalf of the Fund totaling $34,143 for the period.
Annual Report
10. Other.
The Fund's organizational documents provide former and current trustees and officers with a limited indemnification against liabilities arising in connection with the performance of their duties to the Fund. In the normal course of business, the Fund may also enter into contracts that provide general indemnifications. The Fund's maximum exposure under these arrangements is unknown as this would be dependent on future claims that may be made against the Fund. The risk of material loss from such claims is considered remote.
During the period, Lehman Brothers Holdings, Inc. and certain of its affiliates (LBHI) sought protection under the insolvency laws of their jurisdictions of organization, including the United States, the United Kingdom and Japan. At the time LBHI's insolvency proceedings were instituted, the Fund had outstanding securities trades with counterparties affiliated with LBHI. As a result of the insolvency proceedings, LBHI is unable to fulfill its commitments and, in certain cases, the Fund may have terminated its trades and related agreements with the relevant entities and, where appropriate, is in the process of initiating claims for damages. FMR believes that the financial impact to the Fund relating to the terminated trades and agreements is immaterial.
11. Distributions to Shareholders.
Distributions to shareholders of each class were as follows:
Years ended October 31, | 2008 | 2007 |
From net investment income | | |
Class A | $ 71,381 | $ 5,613 |
Class T | 53,705 | 4,267 |
Class B | 15,783 | - |
Class C | 37,642 | - |
International Value | 5,325,187 | 956,069 |
Institutional Class | 59,203 | 12,567 |
Total | $ 5,562,901 | $ 978,516 |
From net realized gain | | |
Class A | $ 297,020 | $ 3,983 |
Class T | 246,645 | 4,693 |
Class B | 128,753 | 1,788 |
Class C | 295,420 | 4,566 |
International Value | 17,561,793 | 536,333 |
Institutional Class | 188,234 | 6,583 |
Total | $ 18,717,865 | $ 557,946 |
Annual Report
Notes to Financial Statements - continued
12. Share Transactions.
Transactions for each class of shares were as follows:
| Shares | Dollars |
Years ended October 31, | 2008 | 2007 | 2008 | 2007 |
Class A | | | | |
Shares sold | 298,063 | 556,341 | $ 3,154,503 | $ 6,434,905 |
Reinvestment of distributions | 30,184 | 863 | 357,686 | 9,431 |
Shares redeemed | (312,021) | (237,384) | (3,010,663) | (2,953,175) |
Net increase (decrease) | 16,226 | 319,820 | $ 501,526 | $ 3,491,161 |
Class T | | | | |
Shares sold | 169,412 | 281,943 | $ 1,740,848 | $ 3,296,913 |
Reinvestment of distributions | 21,586 | 806 | 255,358 | 8,796 |
Shares redeemed | (228,991) | (60,435) | (2,152,407) | (714,379) |
Net increase (decrease) | (37,993) | 222,314 | $ (156,201) | $ 2,591,330 |
Class B | | | | |
Shares sold | 48,187 | 114,852 | $ 472,858 | $ 1,342,524 |
Reinvestment of distributions | 10,866 | 151 | 128,544 | 1,653 |
Shares redeemed | (105,867) | (33,404) | (916,142) | (398,508) |
Net increase (decrease) | (46,814) | 81,599 | $ (314,740) | $ 945,669 |
Class C | | | | |
Shares sold | 114,256 | 337,076 | $ 1,072,554 | $ 3,929,869 |
Reinvestment of distributions | 22,711 | 319 | 268,223 | 3,483 |
Shares redeemed | (297,329) | (80,082) | (2,692,615) | (988,817) |
Net increase (decrease) | (160,362) | 257,313 | $ (1,351,838) | $ 2,944,535 |
International Value | | | | |
Shares sold | 13,343,931 | 26,426,338 | $ 131,489,328 | $ 309,978,984 |
Reinvestment of distributions | 1,810,134 | 127,337 | 21,468,187 | 1,391,798 |
Shares redeemed | (17,329,561) | (18,219,061) | (166,721,411) | (220,454,791) |
Net increase (decrease) | (2,175,496) | 8,334,614 | $ (13,763,896) | $ 90,915,991 |
Institutional Class | | | | |
Shares sold | 50,248 | 75,655 | $ 566,166 | $ 870,496 |
Reinvestment of distributions | 6,826 | 692 | 80,952 | 7,564 |
Shares redeemed | (183,848) | (61,819) | (1,700,120) | (714,302) |
Net increase (decrease) | (126,774) | 14,528 | $ (1,053,002) | $ 163,758 |
Annual Report
To the Trustees of Fidelity Investment Trust and Shareholders of Fidelity International Value Fund:
We have audited the accompanying statement of assets and liabilities of Fidelity International Value Fund (the Fund), a fund of Fidelity Investment Trust, including the schedule of investments, as of October 31, 2008, and the related statement of operations for the year then ended, the statement of changes in net assets for each of the two years in the period then ended, and the financial highlights for each of the two years in the period then ended and for the period from May 18, 2006 (commencement of operations) to October 31, 2006. These financial statements and financial highlights are the responsibility of the Fund's management. Our responsibility is to express an opinion on these financial statements and financial highlights based on our audits.
We conducted our audits in accordance with standards of the Public Company Accounting Oversight Board (United States). Those standards require that we plan and perform the audit to obtain reasonable assurance about whether the financial statements and financial highlights are free of material misstatement. The Fund is not required to have, nor were we engaged to perform, an audit of its internal control over financial reporting. Our audits included consideration of internal control over financial reporting as a basis for designing audit procedures that are appropriate in the circumstances, but not for the purpose of expressing an opinion on the effectiveness of the Fund's internal control over financial reporting. Accordingly, we express no such opinion. An audit also includes examining, on a test basis, evidence supporting the amounts and disclosures in the financial statements, assessing the accounting principles used and significant estimates made by management, as well as evaluating the overall financial statement presentation. Our procedures included confirmation of securities owned as of October 31, 2008, by correspondence with the custodians and brokers; where replies were not received from brokers, we performed other auditing procedures. We believe that our audits provide a reasonable basis for our opinion.
In our opinion, the financial statements and financial highlights referred to above present fairly, in all material respects, the financial position of Fidelity International Value Fund as of October 31, 2008, the results of its operations for the year then ended, the changes in its net assets for each of the two years in the period then ended, and its financial highlights for each of the two years in the period then ended, and the financial highlights for each of the two years in the period then ended, and for the period from May 18, 2006 (commencement of operations) to October 31, 2006 in conformity with accounting principles generally accepted in the United States of America.
/s/ Deloitte & Touche LLP
DELOITTE & TOUCHE LLP
Boston, Massachusetts
December 19, 2008
Annual Report
The Trustees, Member of the Advisory Board, and executive officers of the trust and fund, as applicable, are listed below. The Board of Trustees governs the fund and is responsible for protecting the interests of shareholders. The Trustees are experienced executives who meet periodically throughout the year to oversee the fund's activities, review contractual arrangements with companies that provide services to the fund, and review the fund's performance. Except for Edward C. Johnson 3d and James C. Curvey, each of the Trustees oversees 220 funds advised by FMR or an affiliate. Messrs. Johnson and Curvey oversee 379 funds advised by FMR or an affiliate.
The Trustees hold office without limit in time except that (a) any Trustee may resign; (b) any Trustee may be removed by written instrument, signed by at least two-thirds of the number of Trustees prior to such removal; (c) any Trustee who requests to be retired or who has become incapacitated by illness or injury may be retired by written instrument signed by a majority of the other Trustees; and (d) any Trustee may be removed at any special meeting of shareholders by a two-thirds vote of the outstanding voting securities of the trust. Each Trustee who is not an interested person (as defined in the 1940 Act) (Independent Trustee), shall retire not later than the last day of the calendar year in which his or her 72nd birthday occurs. The Independent Trustees may waive this mandatory retirement age policy with respect to individual Trustees. The executive officers and Advisory Board Member hold office without limit in time, except that any officer and Advisory Board Member may resign or may be removed by a vote of a majority of the Trustees at any regular meeting or any special meeting of the Trustees. Except as indicated, each individual has held the office shown or other offices in the same company for the past five years.
The fund's Statement of Additional Information (SAI) includes more information about the Trustees. To request a free copy, call Fidelity at 1-877-208-0098.
Interested Trustees*:
Correspondence intended for each Trustee who is an interested person may be sent to Fidelity Investments, 82 Devonshire Street, Boston, Massachusetts 02109.
Name, Age; Principal Occupation |
Edward C. Johnson 3d (78) |
| Year of Election or Appointment:1984 Mr. Johnson is Chairman of the Board of Trustees. Mr. Johnson serves as Chief Executive Officer, Chairman, and a Director of FMR LLC; Chairman and a Director of FMR; Chairman and a Director of Fidelity Research & Analysis Company (FRAC); Chairman and a Director of Fidelity Investments Money Management, Inc.; and Chairman and a Director of FMR Co., Inc. In addition, Mr. Johnson serves as Chairman and Director of FIL Limited. Previously, Mr. Johnson served as President of FMR LLC (2006-2007). |
James C. Curvey (73) |
| Year of Election or Appointment: 2007 Mr. Curvey also serves as Trustee (2007-present) of other investment companies advised by FMR. Mr. Curvey is a Director of FMR and FMR Co., Inc. (2007-present). Mr. Curvey is also Vice Chairman (2006-
present) and Director of FMR LLC. In addition, Mr. Curvey serves as an Overseer for the Boston Symphony Orchestra and a member of the Trustees of Villanova University. |
* Trustees have been determined to be "Interested Trustees" by virtue of, among other things, their affiliation with the trust or various entities under common control with FMR. FMR Corp. merged with and into FMR LLC on October 1, 2007. Any references to FMR LLC for prior periods are deemed to be references to the prior entity.
Independent Trustees:
Correspondence intended for each Independent Trustee (that is, the Trustees other than the Interested Trustees) may be sent to Fidelity Investments, P.O. Box 55235, Boston, Massachusetts 02205-5235.
Name, Age; Principal Occupation |
Dennis J. Dirks (60) |
| Year of Election or Appointment: 2005 Prior to his retirement in May 2003, Mr. Dirks was Chief Operating Officer and a member of the Board of The Depository Trust & Clearing Corporation (DTCC) (1999-2003). He also served as President, Chief Operating Officer, and Board member of The Depository Trust Company (DTC) (1999-2003) and President and Board member of the National Securities Clearing Corporation (NSCC) (1999-2003). In addition, Mr. Dirks served as a Trustee and a member of the Finance Committee of Manhattan College (2005-2008), and as Chief Executive Officer and Board member of the Government Securities Clearing Corporation (2001-2003) and Chief Executive Officer and Board member of the Mortgage-Backed Securities Clearing Corporation (2001-2003). Mr. Dirks also serves as a Trustee and a member of the Finance Committee of AHRC of Nassau County (2006-present). |
Alan J. Lacy (55) |
| Year of Election or Appointment: 2008 Mr. Lacy serves as Senior Adviser (2007-present) of Oak Hill Capital Partners, L.P. (a private equity firm). Mr. Lacy also served as Chief Executive Officer (2000-2005) and Vice Chairman (2005-2006) of Sears Holdings Corporation and Sears, Roebuck and Co. (retail). In addition, Mr. Lacy serves as a member of the Board of Directors of The Western Union Company (global money transfer, 2006-present) and Bristol-Myers Squibb (global pharmaceuticals, 2007-present). Mr. Lacy is a Trustee of the National Parks Conservation Association and The Field Museum of Natural History. |
Ned C. Lautenbach (64) |
| Year of Election or Appointment: 2000 Mr. Lautenbach is Chairman of the Independent Trustees (2006-present). Mr. Lautenbach is an Advisory Partner of Clayton, Dubilier & Rice, Inc. (private equity investment firm). Previously, Mr. Lautenbach was with the International Business Machines Corporation (IBM) from 1968 until his retirement in 1998. Mr. Lautenbach serves as a Director of Eaton Corporation (diversified industrial) as well as the Philharmonic Center for the Arts in Naples, Florida. He also is a member of the Board of Trustees of Fairfield University (2005-present), as well as a member of the Council on Foreign Relations. Previously, Mr. Lautenbach served as a Director of Sony Corporation (2006-2007). |
Joseph Mauriello (64) |
| Year of Election or Appointment: 2008 Prior to his retirement in January 2006, Mr. Mauriello served in numerous senior management positions including Deputy Chairman and Chief Operating Officer (2004-2005), and Vice Chairman of Financial Services (2002-2004) of KPMG LLP US (professional services firm, 1965-
2005). Mr. Mauriello currently serves as a member of the Board of Directors of XL Capital Ltd. (global insurance and re-insurance company, 2006-present) and of Arcadia Resources Inc. (health care services and products, 2007-present). He also served as a Director of the Hamilton Funds of the Bank of New York (2006-2007). |
Cornelia M. Small (64) |
| Year of Election or Appointment: 2005 Ms. Small is a member of the Investment Committee, and Chair (2008-present) and a member of the Board of Trustees of Smith College. Ms. Small also serves on the Investment Committee of the Berkshire Taconic Community Foundation (2008-present). Previously, Ms. Small served as Chairperson of the Investment Committee (2002-2008) of Smith College and as Co-Chair (2000-2003) of the Annual Fund for the Fletcher School of Law and Diplomacy. In addition, she served as Chief Investment Officer, Director of Global Equity Investments, and a member of the Board of Directors of Scudder, Stevens & Clark and Scudder Kemper Investments. |
William S. Stavropoulos (69) |
| Year of Election or Appointment: 2001 Mr. Stavropoulos is Chairman Emeritus of the Board of Directors of The Dow Chemical Company, where he previously served in numerous senior management positions, including President (1993-2000; 2002-
2003), CEO (1995-2000; 2002-2004), Chairman of the Executive Committee (2000-2006), and as a member of the Board of Directors (1990-2006). Currently, he is a Director of Teradata Corporation (data warehousing and technology solutions, 2008-present), Chemical Financial Corporation, Maersk Inc. (industrial conglomerate), Tyco International, Inc. (multinational manufacturing and services, 2007-present), and a member of the Advisory Board for Metalmark Capital (private equity investment firm, 2005-present). He is a special advisor to Clayton, Dubilier & Rice, Inc. (private equity investment). In addition, Mr. Stavropoulos is a member of the University of Notre Dame Advisory Council for the College of Science. |
David M. Thomas (59) |
| Year of Election or Appointment: 2008 Previously, Mr. Thomas served as Executive Chairman (2005-2006) and Chairman and Chief Executive Officer (2000-2005) of IMS Health, Inc. (pharmaceutical and healthcare information solutions). In addition, Mr. Thomas serves as a member of the Board of Directors of Fortune Brands, Inc. (consumer products holding company), and Interpublic Group of Companies, Inc. (marketing communication, 2004-present). |
Michael E. Wiley (58) |
| Year of Election or Appointment: 2008 Mr. Wiley also serves as a member of the Board of Trustees of the University of Tulsa (2000-2006; 2007-present). He serves as a Director of Tesoro Corporation (independent oil refiner and marketer, 2005-
present), and a Director of Bill Barrett Corporation (exploration and production company, 2005-present). In addition, he also serves as a Director of Post Oak Bank (privately-held bank, 2004-present). Previously, Mr. Wiley served as a Sr. Energy Advisor of Katzenbach Partners, LLC (consulting firm, 2006-2007), as an Advisory Director of Riverstone Holdings (private investment firm), Chairman, President, and CEO of Baker Hughes, Inc. (oilfield services company, 2000-2004), and as Director of Spinnaker Exploration Company (exploration and production company, 2001-2005). |
Advisory Board Member and Executive Officers**:
Correspondence intended for each executive officer and Mr. Lynch may be sent to Fidelity Investments, 82 Devonshire Street, Boston, Massachusetts 02109.
Name, Age; Principal Occupation |
Peter S. Lynch (64) |
| Year of Election or Appointment: 2003 Member of the Advisory Board of Fidelity's Equity and High Income Funds. Mr. Lynch is Vice Chairman and a Director of FMR, and Vice Chairman (2001-present) and a Director of FMR Co., Inc. Previously, Mr. Lynch served as a Trustee of the Fidelity funds (1990-2003). In addition, he serves as a Trustee of Boston College and as the Chairman of the Inner-City Scholarship Fund. Previously, Mr. Lynch served on the Special Olympics International Board of Directors (1997-2006). |
Kenneth B. Robins (39) |
| Year of Election or Appointment: 2008 President and Treasurer of Fidelity's Equity and High Income Funds. Mr. Robins is an employee of Fidelity Investments (2004-present). Before joining Fidelity Investments, Mr. Robins worked at KPMG LLP, where he was a partner in KPMG's department of professional practice (2002-2004). |
Walter C. Donovan (46) |
| Year of Election or Appointment: 2007 Vice President of Fidelity's Equity Funds. Mr. Donovan also serves as President of FMR and FMR Co., Inc., and Executive Vice President of Fidelity Investments Money Management, Inc. (2007-present). Previously, Mr. Donovan served as Executive Vice President of FMR and FMR Co., Inc. (2005-2007) and Senior Vice President of FMR (2003-2005) and FMR Co., Inc. (2004-2005). |
Eric M. Wetlaufer (46) |
| Year of Election or Appointment: 2006 Vice President of Fidelity's International Equity Funds. Mr. Wetlaufer also serves as Group Chief Investment Officer of FMR. Mr. Wetlaufer is Chairman, Chief Executive Officer, and President of Fidelity Management & Research (Hong Kong) Limited (2008-present); Chairman, Chief Executive Officer, President, and a Director of Fidelity Management & Research (Japan) Inc. (2008-present); Chairman and Chief Executive Officer (2007-present) and President and a Director (2006-present) of Fidelity Management & Research (U.K.) Inc. and President and a Director of Fidelity Research & Analysis Company (2006-present). Before joining Fidelity Investments in 2005, Mr. Wetlaufer was a partner in Oxhead Capital Management (2004-2005) and a Chief Investment Officer of Putnam Investments (1997-2003). |
Scott C. Goebel (40) |
| Year of Election or Appointment: 2008 Secretary and Chief Legal Officer (CLO) of the Fidelity funds. Mr. Goebel also serves as General Counsel, Secretary, and Senior Vice President of FMR (2008-present); Deputy General Counsel of FMR LLC; Chief Legal Secretary of Fidelity Management & Research (Hong Kong) Limited (2008-present) and Assistant Secretary of Fidelity Management & Research (Japan) Inc. (2008-present). Previously, Mr. Goebel served as Assistant Secretary of the Funds (2007-2008) and as Vice President and Secretary of Fidelity Distributors Corporation (FDC) (2005-2007). |
John B. McGinty, Jr. (46) |
| Year of Election or Appointment: 2008 Assistant Secretary of Fidelity's Equity and High Income Funds. Mr. McGinty is an employee of Fidelity Investments (2004-present). Mr. McGinty also serves as Senior Vice President, Secretary, and Chief Legal Officer of FDC (2007-present). Before joining Fidelity Investments, Mr. McGinty practiced law at Ropes & Gray, LLP. |
Holly C. Laurent (54) |
| Year of Election or Appointment: 2008 Anti-Money Laundering (AML) Officer of the Fidelity funds. Ms. Laurent is an employee of Fidelity Investments. Previously, Ms. Laurent was Senior Vice President and Head of Legal for Fidelity Business Services India Pvt. Ltd. (2006-2008), Senior Vice President, Deputy General Counsel and Group Head for FMR LLC (2005-2006). |
Christine Reynolds (50) |
| Year of Election or Appointment: 2008 Chief Financial Officer of the Fidelity funds. Ms. Reynolds became President of Fidelity Pricing and Cash Management Services (FPCMS) in August 2008. She served as Chief Operating officer of FPCMS from 2007 through July 2008. Previously, Ms. Reynolds served as President, Treasurer, and Anti-Money Laundering officer of the Fidelity funds (2004-2007). Before joining Fidelity Investments, Ms. Reynolds worked at PricewaterhouseCoopers LLP (PwC) (1980-2002), where she was an audit partner with PwC's investment management practice. |
Kenneth A. Rathgeber (61) |
| Year of Election or Appointment: 2004 Chief Compliance Officer of Fidelity's Equity and High Income Funds. Mr. Rathgeber is Chief Compliance Officer of Fidelity Management & Research (Hong Kong) Limited (2008-present), Fidelity Management & Research (Japan) Inc. (2008-present), FMR (2005-present), FMR Co., Inc. (2005-present), Fidelity Management & Research (U.K.) Inc. (2005-
present), Fidelity Research & Analysis Company (2005-present), Fidelity Investments Money Management, Inc. (2005-present), and Strategic Advisers, Inc. (2005-present). |
Bryan A. Mehrmann (47) |
| Year of Election or Appointment: 2005 Deputy Treasurer of the Fidelity funds. Mr. Mehrmann is an employee of Fidelity Investments. Previously, Mr. Mehrmann served as Vice President of Fidelity Investments Institutional Services Group (FIIS)/Fidelity Investments Institutional Operations Corporation, Inc. (FIIOC) Client Services (1998-2004). |
Adrien E. Deberghes (41) |
| Year of Election or Appointment: 2008 Deputy Treasurer of Fidelity's Equity and High Income Funds. Mr. Deberghes is an employee of Fidelity Investments (2008-present). Previously, Mr. Deberghes served as Senior Vice President of Mutual Fund Administration at State Street Corporation (2007-2008), Senior Director of Mutual Fund Administration at Investors Bank & Trust (2005-2007), and Director of Finance for Dunkin' Brands (2000-2005). |
Robert G. Byrnes (41) |
| Year of Election or Appointment: 2005 Assistant Treasurer of the Fidelity funds. Mr. Byrnes is an employee of Fidelity Investments (2005-present). Previously, Mr. Byrnes served as Vice President of Fidelity Pricing and Cash Management Services (FPCMS) (2003-2005). Before joining Fidelity Investments, Mr. Byrnes worked at Deutsche Asset Management where he served as Vice President of the Investment Operations Group (2000-2003). |
Peter L. Lydecker (54) |
| Year of Election or Appointment: 2004 Assistant Treasurer of the Fidelity funds. Mr. Lydecker is an employee of Fidelity Investments. |
Paul M. Murphy (61) |
| Year of Election or Appointment: 2007 Assistant Treasurer of the Fidelity funds. Mr. Murphy is an employee of Fidelity Investments (2007-present). Previously, Mr. Murphy served as Chief Financial Officer of the Fidelity Funds (2005-2006), Vice President and Associate General Counsel of FMR (2007), and Senior Vice President of Fidelity Pricing and Cash Management Services (FPCMS) (1994-2007). |
Gary W. Ryan (50) |
| Year of Election or Appointment: 2005 Assistant Treasurer of the Fidelity funds. Mr. Ryan is an employee of Fidelity Investments. Previously, Mr. Ryan served as Vice President of Fund Reporting in Fidelity Pricing and Cash Management Services (FPCMS) (1999-2005). |
** FMR Corp. merged with and into FMR LLC on October 1, 2007. Any references to FMR LLC for prior periods are deemed to be references to the prior entity.
Annual Report
Class A designates 50%, Class T designates 52%, Class B designates 60%, and Class C designates 59% of the dividends distributed during the fiscal year as amounts which may be taken into account as a dividend for purposes of the maximum rate under section 1(h)(11) of the Internal Revenue Code.
The amounts per share which represent income derived from sources within, and taxes paid to, foreign countries or possessions of the United States are as follows:
| Pay Date | Income | Taxes |
Class A | 12/10/2007 | $0.188 | $0.0319 |
| | | |
Class T | 12/10/2007 | $0.183 | $0.0319 |
| | | |
Class B | 12/10/2007 | $0.159 | $0.0319 |
| | | |
Class C | 12/10/2007 | $0.160 | $0.0319 |
The fund will notify shareholders in January 2009 of amounts for use in preparing 2008 income tax returns.
Annual Report
A special meeting of the fund's shareholders was held on December 13, 2007. The results of votes taken among shareholders on the proposals before them are reported below. Each vote reported represents one dollar of net asset value held on the record date for the meeting.
PROPOSAL 1 |
To amend the Declaration of Trust to reduce the required quorum for shareholder meetings.A |
| # of
Votes | % of
Votes |
Affirmative | 45,014,793,255.82 | 80.372 |
Against | 6,871,112,667.08 | 12.268 |
Abstain | 2,163,456,438.02 | 3.863 |
Broker
Non-Votes | 1,958,633,563.89 | 3.497 |
TOTAL | 56,007,995,924.81 | 100.000 |
PROPOSAL 2 |
To elect the nominees specified below as Trustees.A |
James C. Curvey |
Affirmative | 53,384,952,361.03 | 95.317 |
Withheld | 2,623,043,563.78 | 4.683 |
TOTAL | 56,007,995,924.81 | 100.000 |
Dennis J. Dirks |
Affirmative | 53,595,104,608.67 | 95.692 |
Withheld | 2,412,891,316.14 | 4.308 |
TOTAL | 56,007,995,924.81 | 100.000 |
Albert R. Gamper, Jr. |
Affirmative | 53,570,235,221.69 | 95.647 |
Withheld | 2,437,760,703.12 | 4.353 |
TOTAL | 56,007,995,924.81 | 100.000 |
George H. Heilmeier |
Affirmative | 53,166,350,588.50 | 94.926 |
Withheld | 2,841,645,336.31 | 5.074 |
TOTAL | 56,007,995,924.81 | 100.000 |
| # of
Votes | % of
Votes |
Edward C. Johnson 3d |
Affirmative | 53,230,508,654.93 | 95.041 |
Withheld | 2,777,487,269.88 | 4.959 |
TOTAL | 56,007,995,924.81 | 100.000 |
James H. Keyes |
Affirmative | 53,549,161,456.52 | 95.610 |
Withheld | 2,458,834,468.29 | 4.390 |
TOTAL | 56,007,995,924.81 | 100.000 |
Marie L. Knowles |
Affirmative | 53,543,925,066.86 | 95.601 |
Withheld | 2,464,070,857.95 | 4.399 |
TOTAL | 56,007,995,924.81 | 100.000 |
Ned C. Lautenbach |
Affirmative | 53,547,116,322.50 | 95.606 |
Withheld | 2,460,879,602.31 | 4.394 |
TOTAL | 56,007,995,924.81 | 100.000 |
Cornelia M. Small |
Affirmative | 53,564,793,514.25 | 95.638 |
Withheld | 2,443,202,410.56 | 4.362 |
TOTAL | 56,007,995,924.81 | 100.000 |
William S. Stavropoulos |
Affirmative | 53,426,544,502.76 | 95.391 |
Withheld | 2,581,451,422.05 | 4.609 |
TOTAL | 56,007,995,924.81 | 100.000 |
Kenneth L. Wolfe |
Affirmative | 53,229,881,790.63 | 95.040 |
Withheld | 2,778,114,134.18 | 4.960 |
TOTAL | 56,007,995,924.81 | 100.000 |
A Denotes trust-wide proposal and voting results. |
Annual Report
Proxy Voting Results
A special meeting of the fund's shareholders was held on April 16, 2008. The results of votes taken among shareholders on the proposal before them are reported below. Each vote reported represents one dollar of net asset value held on the record date for the meeting.
PROPOSAL 1 |
To elect a Board of Trustees.A |
| # of
Votes | % of
Votes |
James C. Curvey |
Affirmative | 44,485,656,811.55 | 94.702 |
Withheld | 2,488,551,854.62 | 5.298 |
TOTAL | 46,974,208,666.17 | 100.000 |
Dennis J. Dirks |
Affirmative | 44,706,671,638.31 | 95.173 |
Withheld | 2,267,537,027.86 | 4.827 |
TOTAL | 46,974,208,666.17 | 100.000 |
Edward C. Johnson 3d |
Affirmative | 44,294,881,638.16 | 94.296 |
Withheld | 2,679,327,028.01 | 5.704 |
TOTAL | 46,974,208,666.17 | 100.000 |
Alan J. Lacy |
Affirmative | 44,685,373,413.16 | 95.127 |
Withheld | 2,288,835,253.01 | 4.873 |
TOTAL | 46,974,208,666.17 | 100.000 |
Ned C. Lautenbach |
Affirmative | 44,634,541,379.41 | 95.019 |
Withheld | 2,339,667,286.76 | 4.981 |
TOTAL | 46,974,208,666.17 | 100.000 |
Joseph Mauriello |
Affirmative | 44,683,962,099.80 | 95.124 |
Withheld | 2,290,246,566.37 | 4.876 |
TOTAL | 46,974,208,666.17 | 100.000 |
Cornelia M. Small |
Affirmative | 44,671,688,375.36 | 95.098 |
Withheld | 2,302,520,290.81 | 4.902 |
TOTAL | 46,974,208,666.17 | 100.000 |
| # of
Votes | % of
Votes |
William S. Stavropoulos |
Affirmative | 44,465,262,087.61 | 94.659 |
Withheld | 2,508,946,578.56 | 5.341 |
TOTAL | 46,974,208,666.17 | 100.000 |
David M. Thomas |
Affirmative | 44,694,340,813.87 | 95.147 |
Withheld | 2,279,867,852.30 | 4.853 |
TOTAL | 46,974,208,666.17 | 100.000 |
Michael E. Wiley |
Affirmative | 44,686,513,174.78 | 95.130 |
Withheld | 2,287,695,491.39 | 4.870 |
TOTAL | 46,974,208,666.17 | 100.000 |
A Denotes trust-wide proposal and voting results.
Annual Report
Board Approval of Investment Advisory Contracts and Management Fees
Fidelity International Value Fund
Each year, typically in July, the Board of Trustees, including the Independent Trustees (together, the Board), votes on the renewal of the management contract and sub-advisory agreements (together, the Advisory Contracts) for the fund. The Board, assisted by the advice of fund counsel and Independent Trustees' counsel, requests and considers a broad range of information throughout the year.
The Board meets regularly and, acting directly and through its separate committees, requests and receives information concerning, and considers at each of its meetings factors that are relevant to, its annual consideration of the renewal of the fund's Advisory Contracts, including the services and support provided to the fund and its shareholders. At the time of the renewal, the Board had 12 standing committees, each composed of Independent Trustees with varying backgrounds, to which the Board has assigned specific subject matter responsibilities in order to enhance effective decision-making by the Board. Each committee has a written charter outlining the structure and purposes of the committee. The Board also meets as needed to consider matters specifically related to the Board's annual consideration of the renewal of Advisory Contracts.
At its July 2008 meeting, the Board of Trustees, including the Independent Trustees, unanimously determined to renew the fund's Advisory Contracts. In reaching its determination, the Board considered all factors it believed relevant, including (i) the nature, extent, and quality of the services to be provided to the fund and its shareholders (including the investment performance of the fund); (ii) the competitiveness of the fund's management fee and total expenses; (iii) the total costs of the services to be provided by and the profits to be realized by Fidelity from its relationship with the fund; (iv) the extent to which economies of scale would be realized as the fund grows; and (v) whether fee levels reflect these economies of scale, if any, for the benefit of fund shareholders. The Board also approved agreements with foreign sub-advisers Fidelity Management & Research (Japan) Inc. and Fidelity Management & Research (Hong Kong) Limited, as well as amendments to the fund's agreement with Fidelity Management & Research (U.K.) Inc.
In considering whether to renew the Advisory Contracts for the fund, the Board ultimately reached a determination, with the assistance of fund counsel and Independent Trustees' counsel and through the exercise of its business judgment, that the renewal of the Advisory Contracts and the compensation to be received by Fidelity under the management contract is consistent with Fidelity's fiduciary duty under applicable law. The Board's decision to renew the Advisory Contracts was not based on any single factor noted above, but rather was based on a comprehensive consideration of all the information provided to the Board at its meetings throughout the year. The Board, in reaching its determination to renew the Advisory Contracts, is aware that shareholders in the fund have a broad range of investment choices available to them, including a wide choice among mutual funds offered by competitors to Fidelity, and that the fund's shareholders, with the opportunity to review and weigh the disclosure provided by the fund in its prospectus and other public disclosures, have chosen to invest in this fund, managed by Fidelity.
Annual Report
Board Approval of Investment Advisory Contracts and
Management Fees - continued
Nature, Extent, and Quality of Services Provided. The Board considered staffing within the investment adviser, FMR, and the sub-advisers (together, the Investment Advisers), including the backgrounds of the fund's investment personnel and the fund's investment objective and discipline. The Independent Trustees also had discussions with senior management of Fidelity's investment operations and investment groups. The Board considered the structure of the portfolio manager compensation program and whether this structure provides appropriate incentives.
Resources Dedicated to Investment Management and Support Services. The Board reviewed the size, education, and experience of the Investment Advisers' investment staff, their use of technology, and the Investment Advisers' approach to recruiting, training, and retaining portfolio managers and other research, advisory, and management personnel. The Board noted that Fidelity's analysts have access to a variety of technological tools that enable them to perform both fundamental and quantitative analysis and to specialize in various disciplines. The Board considered Fidelity's extensive global research capabilities that enable the Investment Advisers to aggregate data from various sources in an effort to produce positive investment results. The Board also considered that Fidelity's portfolio managers and analysts have access to daily portfolio attribution that allows for monitoring of a fund's portfolio, as well as an electronic communication system that provides immediate real-time access to research concerning issuers and credit enhancers.
Shareholder and Administrative Services. The Board considered (i) the nature, extent, quality, and cost of advisory, administrative, distribution, and shareholder services performed by the Investment Advisers and their affiliates under the Advisory Contracts and under separate agreements covering transfer agency, pricing and bookkeeping, and securities lending services for the fund; (ii) the nature and extent of the Investment Advisers' supervision of third party service providers, principally custodians and subcustodians; and (iii) the resources devoted to, and the record of compliance with, the fund's compliance policies and procedures. The Board also reviewed the allocation of fund brokerage, including allocations to brokers affiliated with the Investment Advisers, the use of brokerage commissions to pay fund expenses, and the use of "soft" commission dollars to pay for research services. The Board further considered that Fidelity voluntarily pays for market data out of its own resources.
The Board noted that the growth of fund assets across the complex allows Fidelity to reinvest in the development of services designed to enhance the value or convenience of the Fidelity funds as investment vehicles. These services include 24-hour access to account information and market information through phone representatives and over the Internet, and investor education materials and asset allocation tools.
Annual Report
Investment in a Large Fund Family. The Board considered the benefits to shareholders of investing in a Fidelity fund, including the benefits of investing in a fund that is part of a large family of funds offering a variety of investment disciplines and providing for a large variety of mutual fund investor services. For example, fund shareholders are offered the privilege of exchanging shares of the fund for shares of other Fidelity funds, as set forth in the fund's prospectus, without paying a sales charge. The Board noted that Fidelity has taken a number of actions over the previous year that benefited particular funds, including (i) dedicating additional resources to investment research and to restructure the investment research teams; (ii) contractually agreeing to reduce the management fees on Fidelity's Institutional Money Market Funds and launching Class IV and Institutional Class of certain of these funds; (iii) reducing the transfer agent fees for the Fidelity Select Portfolios and Investor Class of the VIP funds; and (iv) launching Class K of 29 equity funds as a lower-fee class available to certain employer-sponsored retirement plans.
Investment Performance. The Board considered whether the fund has operated within its investment objective, as well as its record of compliance with its investment restrictions. It also reviewed the fund's absolute investment performance for each class, as well as the fund's relative investment performance for each class measured against (i) a broad-based securities market index, and (ii) a custom peer group of mutual funds deemed appropriate by the Board. Because the fund had been in existence less than three calendar years, the following chart considered by the Board shows, for the one-year period ended December 31, 2007, the total returns of Institutional Class (Class I) and Class B of the fund, the total return of a broad-based securities market index ("benchmark"), and a range of total returns of a custom peer group of mutual funds defined by FMR based on categories assigned by Morningstar, Inc. The returns of Institutional Class (Class I) and Class B show the performance of the highest and lowest performing classes, respectively. The box within each chart shows the 25th percentile return (bottom of box) and the 75th percentile return (top of box) of the peer group. Returns shown above the box are in the first quartile and returns shown below the box are in the fourth quartile. The percentage beaten number noted below each chart corresponds to the percentile box and represents the percentage of funds in the peer group whose performance was equal to or lower than that of the fund. The fund's custom peer group, defined by FMR, is a peer group that FMR believes provides a more meaningful performance comparison than the peer group assigned by Morningstar, Inc., which assigns mutual funds to categories based on their investment styles as measured by their underlying portfolio holdings.
Annual Report
Board Approval of Investment Advisory Contracts and
Management Fees - continued
Fidelity International Value Fund
The Board reviewed the fund's relative investment performance against its peer group and stated that the performance of Institutional Class (Class I) of the fund was in the second quartile for the period shown. The Board also stated that the investment performance of Institutional Class (Class I) of the fund compared favorably to its benchmark for the period shown. The Board considered that the variations in performance among the fund's classes reflect the variations in class expenses, which result in lower performance for higher expense classes. The Board stated that it is difficult to evaluate in any comprehensive fashion the performance of the fund, in light of its relatively recent commencement of operations.
The Board also considered that the fund's management fee is subject to upward or downward adjustment depending upon whether, and to what extent, the fund's investment performance for the performance period exceeds, or is exceeded by, the record (over the same period) of a Board-approved performance adjustment index. The Board realizes that the performance adjustment provides FMR with a strong economic incentive to seek to achieve superior performance for the fund's shareholders and helps to more closely align the interests of FMR and the fund's shareholders.
The Board considered that FMR has taken steps to refocus and strengthen equity research, equity portfolio management, and compliance.
Based on its review, and giving particular weight to the nature and quality of the resources dedicated by the Investment Advisers to maintain and improve relative performance, the Board concluded that the nature, extent, and quality of the services provided to the fund will benefit the fund's shareholders, particularly in light of the Board's view that the fund's shareholders benefit from investing in a fund that is part of a large family of funds offering a variety of investment disciplines and services.
Annual Report
Competitiveness of Management Fee and Total Fund Expenses. The Board considered the fund's management fee and total expenses compared to "mapped groups" of competitive funds and classes. Fidelity creates "mapped groups" by combining similar Lipper investment objective categories that have comparable management fee characteristics. Combining Lipper investment objective categories aids the Board's management fee and total expense comparisons by broadening the competitive group used for comparison and by reducing the number of universes to which various Fidelity funds are compared. The Board also considered supplemental information about how the fund's management fee and total expenses ranked relative to groups based on Lipper classifications, which take into account a fund's market capitalization and style.
The Board considered two proprietary management fee comparisons for the 12-month (or shorter) periods shown in the chart below. The group of Lipper funds used by the Board for management fee comparisons is referred to below as the "Total Mapped Group." The Total Mapped Group comparison focuses on a fund's standing relative to the total universe of comparable funds available to investors, in terms of gross management fees before expense reimbursements or caps, and without giving effect to the fund's performance adjustment. "TMG %" represents the percentage of funds in the Total Mapped Group that had management fees that were lower than the fund's. For example, a TMG % of 14% means that 86% of the funds in the Total Mapped Group had higher management fees than the fund. The "Asset-Size Peer Group" (ASPG) comparison focuses on a fund's standing relative to non-Fidelity funds similar in size to the fund within the Total Mapped Group. The ASPG represents at least 15% of the funds in the Total Mapped Group with comparable asset size and management fee characteristics, subject to a minimum of 50 funds (or all funds in the Total Mapped Group if fewer than 50). Additional information, such as the ASPG quartile in which the fund's management fee ranked and the impact of the fund's performance adjustment, is also included in the chart and considered by the Board.
Annual Report
Board Approval of Investment Advisory Contracts and
Management Fees - continued
Fidelity International Value Fund

The Board noted that the fund's management fee ranked below the median of its Total Mapped Group and below the median of its ASPG for 2007. The Board also noted the effect of the fund's negative performance adjustment on the fund's management fee ranking. The Board noted that the performance adjustment for 2007 represents calculations for performance periods that differ from the period shown in the performance chart above.
Based on its review, the Board concluded that the fund's management fee was fair and reasonable in light of the services that the fund receives and the other factors considered.
In its review of each class's total expenses, the Board considered the fund's management fee as well as other fund or class expenses, as applicable, such as transfer agent fees, pricing and bookkeeping fees, fund-paid 12b-1 fees, and custodial, legal, and audit fees. The Board also noted the effects of any waivers and reimbursements on fees and expenses, as well as the impact of the fund's performance adjustment. As part of its review, the Board also considered current and historical total expenses of each class of the fund compared to competitive fund median expenses. Each class of the fund is compared to those funds and classes in the Total Mapped Group (used by the Board for management fee comparisons) that have a similar sales load structure.
The Board noted that the total expenses of each of Class A, Class B, Class C, Institutional Class, and Fidelity International Value (retail class) ranked below its competitive median for 2007, and the total expenses of Class T ranked above its competitive median for 2007. The Board considered that the total expenses of Class T were above the median primarily because its 12b-1 fee is higher than the typical front-end load class. The Board noted that the fund offers multiple classes, each of which has a different sales load and 12b-1 fee structure, and that the multiple structures are intended to offer a range of pricing options for the intermediary market. The Board also noted that the total expenses of the classes vary primarily by the level of their 12b-1 fees, although differences in transfer agent fees may also cause expenses to vary from class to class.
Annual Report
In its review of total expenses, the Board also considered Fidelity fee structures and other information on clients that FMR and its affiliates service in other competitive markets, such as other mutual funds advised or subadvised by FMR or its affiliates, pension plan clients, and other institutional clients.
Based on its review, the Board concluded that the total expenses of each class of the fund were reasonable, although in one case above the median of the universe presented for comparison, in light of the services that the fund and its shareholders receive and the other factors considered.
Costs of the Services and Profitability. The Board considered the revenues earned and the expenses incurred by Fidelity in conducting the business of developing, marketing, distributing, managing, administering and servicing the fund and its shareholders. The Board also considered the level of Fidelity's profits in respect of all the Fidelity funds.
On an annual basis, FMR presents to the Board Fidelity's profitability for the fund. Fidelity calculates the profitability for each fund, as well as aggregate profitability for groups of Fidelity funds and all Fidelity funds, using a series of detailed revenue and cost allocation methodologies which originate with the audited books and records of Fidelity. The Audit Committee of the Board reviews any significant changes from the prior year's methodologies.
PricewaterhouseCoopers LLP (PwC), independent registered public accounting firm and auditor to Fidelity and certain Fidelity funds, has been engaged annually by the Board as part of the Board's assessment of the results of Fidelity's profitability analysis. PwC's engagement includes the review and assessment of Fidelity's methodologies used in determining the revenues and expenses attributable to Fidelity's mutual fund business, and completion of agreed-upon procedures surrounding the mathematical accuracy of fund profitability and its conformity to allocation methodologies. After considering PwC's reports issued under the engagement and information provided by Fidelity, the Board believes that while other allocation methods may also be reasonable, Fidelity's profitability methodologies are reasonable in all material respects.
The Board has also reviewed Fidelity's non-fund businesses and any fall-out benefits related to the mutual fund business as well as cases where Fidelity's affiliates may benefit from or be related to the fund's business.
Annual Report
Board Approval of Investment Advisory Contracts and
Management Fees - continued
The Board considered the costs of the services provided by and the profits realized by Fidelity in connection with the operation of the fund and determined that the amount of profit is a fair entrepreneurial profit for the management of the fund.
Economies of Scale. The Board considered whether there have been economies of scale in respect of the management of the Fidelity funds, whether the Fidelity funds (including the fund) have appropriately benefited from any such economies of scale, and whether there is potential for realization of any further economies of scale. The Board considered the extent to which the fund will benefit from economies of scale through increased services to the fund, through waivers or reimbursements, or through fee or expense reductions.
The Board recognized that the fund's management contract incorporates a "group fee" structure, which provides for lower group fee rates as total fund assets under FMR's management increase, and for higher group fee rates as total fund assets under FMR's management decrease. FMR determines the group fee rates based on a tiered asset "breakpoint" schedule. The Board considered that the group fee is designed to deliver the benefits of economies of scale to fund shareholders when total fund assets increase, even if assets of any particular fund are unchanged or have declined, because some portion of Fidelity's costs are attributable to services provided to all Fidelity funds, and all funds benefit if those costs can be allocated among more assets. The Board concluded that, given the group fee structure, fund shareholders will achieve a certain level of economies of scale as assets under FMR's management increase at the fund complex level, regardless of whether Fidelity achieves any such economies of scale.
The Board further concluded that any potential economies of scale are being shared between fund shareholders and Fidelity in an appropriate manner.
Additional Information Requested by the Board. In order to develop fully the factual basis for consideration of the Fidelity funds' Advisory Contracts, the Board requested and received additional information on certain topics, including (i) fund performance trends and actions to be taken by FMR to improve certain funds' overall performance; (ii) portfolio manager changes that have occurred during the past year; (iii) Fidelity's fund profitability methodology, the profitability of certain fund service providers, and profitability trends for certain funds; (iv) Fidelity's compensation structure for portfolio managers and key personnel, including its effects on fund profitability and the extent to which portfolio manager compensation is linked to fund performance; (v) Fidelity's fee structures and rationale for recommending different fees among categories of funds; and (vi) Fidelity's rationale for recommending which funds should have a performance adjustment component as part of their management fees.
Based on its evaluation of all of the conclusions noted above, and after considering all material factors, the Board ultimately concluded that the advisory fee structures are fair and reasonable, and that the fund's Advisory Contracts should be renewed.
Annual Report
Investment Adviser
Fidelity Management & Research Company
Boston, MA
Investment Sub-Advisers
FMR Co., Inc.
Fidelity Management & Research
(U.K.) Inc.
Fidelity Management & Research
(Hong Kong) Limited
Fidelity Management & Research
(Japan) Inc.
Fidelity Research & Analysis Company
FIL Investment Advisors
Fidelity Investments Japan Limited
FIL Investment Advisors (U.K.) Ltd.
General Distributor
Fidelity Distributors Corporation
Boston, MA
Transfer and Service Agents
Fidelity Investments Institutional Operations Company, Inc.
Boston, MA
Fidelity Service Company, Inc.
Boston, MA
Custodian
The Northern Trust Company
Chicago, IL
AFIV-UANN-1208
1.827496.102
(Fidelity Investment logo)(registered trademark)
Fidelity Advisor
International Value
Fund - Institutional Class
Annual Report
October 31, 2008
Institutional Class is
a class of Fidelity®
International Value Fund
(2_fidelity_logos) (Registered_Trademark)
Contents
Chairman's Message | <Click Here> | Ned Johnson's message to shareholders. |
Performance | <Click Here> | How the fund has done over time. |
Management's Discussion | <Click Here> | The manager's review of fund performance, strategy and outlook. |
Shareholder Expense Example | <Click Here> | An example of shareholder expenses. |
Investment Changes | <Click Here> | A summary of major shifts in the fund's investments over the past six months. |
Investments | <Click Here> | A complete list of the fund's investments with their market values. |
Financial Statements | <Click Here> | Statements of assets and liabilities, operations, and changes in net assets, as well as financial highlights. |
Notes | <Click Here> | Notes to financial statements. |
Report of Independent Registered Public Accounting Firm | <Click Here> | |
Trustees and Officers | <Click Here> | |
Distributions | <Click Here> | |
Proxy Voting Results | <Click Here> | |
Board Approval of Investment Advisory Contracts and Management Fees | <Click Here> | |
To view a fund's proxy voting guidelines and proxy voting record for the 12-month period ended June 30, visit http://www.fidelity.com (search for "proxy voting guidelines") or visit the Securities and Exchange Commission's (SEC) web site at http://www.sec.gov. You may also call 1-877-208-0098 to request a free copy of the proxy voting guidelines.
Standard & Poor's, S&P and S&P 500 are registered service marks of The McGraw-Hill Companies, Inc. and have been licensed for use by Fidelity Distributors Corporation.
Other third party marks appearing herein are the property of their respective owners.
All other marks appearing herein are registered or unregistered trademarks or service marks of FMR LLC or an affiliated company.
Annual Report
This report and the financial statements contained herein are submitted for the general information of the shareholders of the fund. This report is not authorized for distribution to prospective investors in the fund unless preceded or accompanied by an effective prospectus.
A fund files its complete schedule of portfolio holdings with the SEC for the first and third quarters of each fiscal year on Form N-Q. Forms N-Q are available on the SEC's web site at http://www.sec.gov. A fund's Forms N-Q may be reviewed and copied at the SEC's Public Reference Room in Washington, DC. Information regarding the operation of the SEC's Public Reference Room may be obtained by calling 1-800-SEC-0330. For a complete list of a fund's portfolio holdings, view the most recent holdings listing, semiannual report, or annual report on Fidelity's web site at http://www.fidelity.com or http://www.advisor.fidelity.com, as applicable.
NOT FDIC INSURED · MAY LOSE VALUE · NO BANK GUARANTEE
Neither the fund nor Fidelity Distributors Corporation is a bank.
Annual Report
(photo_of_Edward_C_Johnson_3d)
Dear Shareholder:
Turmoil has been the watchword for the world's securities markets in 2008, with domestic and international stocks down sharply amid the global credit squeeze. A flight to quality boosted returns for U.S. Treasuries, one of the few asset classes with positive results heading into the latter stages of the year. Financial markets are always unpredictable, but there are a number of time-tested principles that can put the historical odds in your favor.
One of the basic tenets is to invest for the long term. Over time, riding out the markets' inevitable ups and downs has proven much more effective than selling into panic or chasing the hottest trend. Even missing only a few of the markets' best days can significantly diminish investor returns. Patience also affords the benefits of compounding - of earning interest on additional income or reinvested dividends and capital gains. There are tax advantages and cost benefits to consider as well. The more you sell, the more taxes you pay, and the more you trade, the higher the costs. While staying the course doesn't eliminate risk, it can considerably lessen the effect of short-term declines.
You can further manage your investing risk through diversification. And today, more than ever, geographic diversification should be taken into account. Studies indicate that asset allocation is the single most important determinant of a portfolio's long-term success. The right mix of stocks, bonds and cash - aligned to your particular risk tolerance and investment objective - is very important. Age-appropriate rebalancing is also an essential aspect of asset allocation. For younger investors, an emphasis on equities - which historically have been the best-performing asset class over time - is encouraged. As investors near their specific goal, such as retirement or sending a child to college, consideration may be given to replacing volatile assets (e.g. common stocks) with more-stable fixed investments (bonds or savings plans).
A third investment principle - investing regularly - can help lower the average cost of your purchases. Investing a certain amount of money each month or quarter helps ensure you won't pay for all your shares at market highs. This strategy - known as dollar cost averaging - also reduces unconstructive "emotion" from investing, helping shareholders avoid selling weak performers just prior to an upswing, or chasing a hot performer just before a correction.
We invite you to contact us via the Internet, through our Investor Centers or over the phone. It is our privilege to provide you the information you need to make the investments that are right for you.
Sincerely,
/s/Edward C. Johnson 3d
Edward C. Johnson 3d
Annual Report
Average annual total return reflects the change in the value of an investment, assuming reinvestment of the class' dividend income and capital gains (the profits earned upon the sale of securities that have grown in value, if any) and assuming a constant rate of performance each year. The $10,000 table and the fund's returns do not reflect the deduction of taxes that a shareholder would pay on fund distributions or the redemption of fund shares. During periods of reimbursement by Fidelity, a fund's total return will be greater than it would be had the reimbursement not occurred. How a fund did yesterday is no guarantee of how it will do tomorrow.
Average Annual Total Returns
Periods ended October 31, 2008 | Past 1
year | Life of
fundA |
Institutional Class | -51.27% | -16.57% |
A From May 18, 2006.
$10,000 Over Life of Fund
Let's say hypothetically that $10,000 was invested in Fidelity Advisor International Value Fund - Institutional Class on May 18, 2006, when the fund started. The chart shows how the value of your investment would have changed, and also shows how the MSCI® Europe, Australasia, Far East (MSCI EAFE®) Value Index performed over the same period.
Annual Report
Comments from George Stairs, Portfolio Manager of Fidelity Advisor International Value Fund
In a dramatic reversal of what had been a multiyear global growth story, international stocks fell long and hard during the 12 months ending October 31, 2008, especially so during the latter stages of the period and mostly as a result of fallout from the financial crisis that emanated from the United States. The viral spread of this financial contagion - which began in the U.S. subprime mortgage market, then seized up the credit markets, hobbled major financial institutions and eventually slowed economic growth worldwide - left virtually no corner of the globe untouched. Developed international equity markets - as gauged by the MSCI® Europe, Australasia, Far East (EAFE®) Index, which monitors established markets outside the U.S. and Canada - fell 46.54%, while the Standard & Poor's 500SM Index, a measure of U.S. stocks, dropped 36.10%. Among countries constituting at least 1% of the EAFE index, Switzerland had the "least worst" showing, falling roughly 32%, followed by Japan, where stocks slid by around 37%. Meanwhile, the weakest overall performance came from Belgium, where stocks slipped by nearly 70%. In the United Kingdom, the largest component of the index, equities were down almost 48%. Emerging markets were the weakest performers among the global economies, declining 56.22% as measured by the MSCI Emerging Markets Index.
For the year, the fund's Institutional Class shares fell 51.27%, compared with a 48.32% decline for the MSCI EAFE Value index, both returns reflecting the extremely poor performance of equities across the international markets. From a sector allocation perspective, the fund was properly positioned, particularly with its big underweighting in financials and slight overweightings in utilities and energy, which helped performance versus the index. Where it underperformed was in stock selection, with the greatest damage coming from picks in the banks, energy, utilities and media groups, as well as in materials. Among the biggest detractors were such names as UniCredit, a large Italian bank; Petroleum Geo-Services, a Norwegian energy services firm not held in the index; and BP, the big British integrated oil firm, which did relatively well and hurt us because we were significantly underweighted in the stock and eventually sold the position. Productive stock selection in the pharmaceuticals, biotechnology and life science group, as well as in diversified financials and transportation, offset some of our shortfall versus the MSCI benchmark. Top contributors included Swiss drug maker Roche Holding and Japanese passenger rail system East Japan Railway.
The views expressed above reflect those of the portfolio manager(s) only through the end of the period as stated on the cover of this report and do not necessarily represent the views of Fidelity or any other person in the Fidelity organization. Any such views are subject to change at any time based upon market or other conditions and Fidelity disclaims any responsibility to update such views. These views may not be relied on as investment advice and, because investment decisions for a Fidelity fund are based on numerous factors, may not be relied on as an indication of trading intent on behalf of any Fidelity fund.
Annual Report
Shareholder Expense Example
As a shareholder of the Fund, you incur two types of costs: (1) transaction costs, including sales charges (loads) on purchase payments or redemption proceeds, redemption fees, and (2) ongoing costs, including management fees, distribution and/or service (12b-1) fees and other Fund expenses. This Example is intended to help you understand your ongoing costs (in dollars) of investing in the Fund and to compare these costs with the ongoing costs of investing in other mutual funds.
The Example is based on an investment of $1,000 invested at the beginning of the period and held for the entire period (May 1, 2008 to October 31, 2008).
Actual Expenses
The first line of the accompanying table for each class of the Fund provides information about actual account values and actual expenses. You may use the information in this line, together with the amount you invested, to estimate the expenses that you paid over the period. Simply divide your account value by $1,000.00 (for example, an $8,600 account value divided by $1,000.00 = 8.6), then multiply the result by the number in the first line for a class of the Fund under the heading entitled "Expenses Paid During Period" to estimate the expenses you paid on your account during this period. A small balance maintenance fee of $12.00 that is charged once a year may apply for certain accounts with a value of less than $2,000. This fee is not included in the table below. If it was, the estimate of expenses you paid during the period would be higher, and your ending account value lower, by this amount. In addition, the Fund, as a shareholder in the underlying Fidelity Central Funds, will indirectly bear its pro rata share of the fees and expenses incurred by the underlying Fidelity Central Funds. These fees and expenses are not included in the Fund's annualized expense ratio used to calculate the expense estimate in the table below.
Hypothetical Example for Comparison Purposes
The second line of the accompanying table for each class of the Fund provides information about hypothetical account values and hypothetical expenses based on a Class' actual expense ratio and an assumed rate of return of 5% per year before expenses, which is not the Class' actual return. The hypothetical account values and expenses may not be used to estimate the actual ending account balance or expenses you paid for the period. You may use this information to compare the ongoing costs of investing in the Fund and other funds. To do so, compare this 5% hypothetical example with the 5% hypothetical examples that appear in the shareholder reports of the other funds. A small balance maintenance fee of $12.00 that is charged once a year may apply for certain accounts with a value of less than $2,000. This fee is not included in the table below. If it was, the estimate of expenses you paid during the period would be higher, and your ending account value lower, by this amount. In addition, the Fund, as a shareholder in the underlying Fidelity Central Funds, will indirectly bear its pro rata share of the fees and expenses incurred by the underlying Fidelity Central Funds. These fees and expenses are not included in the Fund's annualized expense ratio used to calculate the expense estimate in the table below.
Please note that the expenses shown in the table are meant to highlight your ongoing costs only and do not reflect any transaction costs. Therefore, the second line of the table is useful in comparing ongoing costs only, and will not help you determine the relative total costs of owning different funds. In addition, if these transactional costs were included, your costs would have been higher.
Annual Report
| Annualized
Expense Ratio | Beginning
Account Value
May 1, 2008 | Ending
Account Value
October 31, 2008 | Expenses Paid
During Period*
May 1, 2008 to October 31, 2008 |
Class A | 1.41% | | | |
Actual | | $ 1,000.00 | $ 534.70 | $ 5.44 |
HypotheticalA | | $ 1,000.00 | $ 1,018.05 | $ 7.15 |
Class T | 1.66% | | | |
Actual | | $ 1,000.00 | $ 534.40 | $ 6.40 |
HypotheticalA | | $ 1,000.00 | $ 1,016.79 | $ 8.42 |
Class B | 2.16% | | | |
Actual | | $ 1,000.00 | $ 532.60 | $ 8.32 |
HypotheticalA | | $ 1,000.00 | $ 1,014.28 | $ 10.94 |
Class C | 2.16% | | | |
Actual | | $ 1,000.00 | $ 533.10 | $ 8.32 |
HypotheticalA | | $ 1,000.00 | $ 1,014.28 | $ 10.94 |
International Value | 1.10% | | | |
Actual | | $ 1,000.00 | $ 535.60 | $ 4.25 |
HypotheticalA | | $ 1,000.00 | $ 1,019.61 | $ 5.58 |
Institutional Class | 1.00% | | | |
Actual | | $ 1,000.00 | $ 536.00 | $ 3.86 |
HypotheticalA | | $ 1,000.00 | $ 1,020.11 | $ 5.08 |
A 5% return per year before expenses
* Expenses are equal to each Class' annualized expense ratio, multiplied by the average account value over the period, multiplied by 184/366 (to reflect the one-half year period).
Annual Report
Investment Changes (Unaudited)
Geographic Diversification (% of fund's net assets) |
As of October 31, 2008 |
| Japan 19.6% |
| United Kingdom 14.2% |
| Germany 13.5% |
| France 11.5% |
| Switzerland 7.5% |
| Italy 4.8% |
| Spain 3.6% |
| Norway 3.0% |
| Cayman Islands 2.6% |
| Other 19.7% |

Percentages are adjusted for the effect of futures contracts, if applicable. |
|
As of April 30, 2008 |
| Japan 17.8% |
| United Kingdom 14.8% |
| Germany 11.3% |
| France 8.8% |
| Switzerland 6.1% |
| Spain 5.3% |
| United States of America 4.5% |
| Italy 4.5% |
| Norway 4.4% |
| Other 22.5% |

Percentages are adjusted for the effect of futures contracts, if applicable. |
Asset Allocation |
| % of fund's
net assets | % of fund's net assets
6 months ago |
Stocks | 99.2 | 97.1 |
Short-Term Investments and Net Other Assets | 0.8 | 2.9 |
Top Ten Stocks as of October 31, 2008 |
| % of fund's
net assets | % of fund's net assets
6 months ago |
Royal Dutch Shell PLC Class A sponsored ADR (United Kingdom, Oil, Gas & Consumable Fuels) | 3.7 | 2.7 |
Toyota Motor Corp. (Japan, Automobiles) | 3.5 | 2.5 |
Roche Holding AG (participation certificate) (Switzerland, Pharmaceuticals) | 3.4 | 2.4 |
Muenchener Rueckversicherungs-Gesellschaft AG (Reg.) (Germany, Insurance) | 3.0 | 1.9 |
E.ON AG (Germany, Electric Utilities) | 2.9 | 2.1 |
Mitsui & Co. Ltd. (Japan, Trading Companies & Distributors) | 2.6 | 2.8 |
Total SA sponsored ADR (France, Oil, Gas & Consumable Fuels) | 2.6 | 1.6 |
AXA SA sponsored ADR (France, Insurance) | 2.6 | 2.2 |
UniCredit SpA (Italy, Commercial Banks) | 2.5 | 3.1 |
Allianz AG sponsored ADR (Germany, Insurance) | 2.4 | 2.5 |
| 29.2 | |
Market Sectors as of October 31, 2008 |
| % of fund's
net assets | % of fund's net assets
6 months ago |
Financials | 32.2 | 33.1 |
Energy | 14.9 | 15.4 |
Consumer Discretionary | 9.5 | 10.2 |
Industrials | 9.2 | 9.6 |
Utilities | 8.2 | 6.2 |
Telecommunication Services | 7.0 | 4.4 |
Materials | 5.9 | 6.7 |
Health Care | 5.1 | 3.5 |
Information Technology | 4.0 | 4.7 |
Consumer Staples | 3.2 | 3.3 |
Annual Report
Investments October 31, 2008
Showing Percentage of Net Assets
Common Stocks - 98.4% |
| Shares | | Value |
Australia - 2.1% |
AMP Ltd. | 388,042 | | $ 1,410,774 |
Macquarie Airports unit | 462,720 | | 657,723 |
Macquarie Group Ltd. (d) | 34,191 | | 677,961 |
Macquarie Infrastructure Group unit | 593,083 | | 776,966 |
TOTAL AUSTRALIA | | 3,523,424 |
Bermuda - 0.7% |
Seadrill Ltd. | 128,500 | | 1,237,198 |
Brazil - 1.4% |
Petroleo Brasileiro SA - Petrobras sponsored ADR | 49,700 | | 1,336,433 |
Uniao de Bancos Brasileiros SA (Unibanco) GDR | 15,100 | | 952,508 |
TOTAL BRAZIL | | 2,288,941 |
Canada - 1.3% |
Canadian Natural Resources Ltd. | 8,100 | | 408,560 |
First Quantum Minerals Ltd. | 34,000 | | 716,205 |
Nexen, Inc. | 29,800 | | 473,024 |
Petrobank Energy & Resources Ltd. (a) | 33,800 | | 644,717 |
TOTAL CANADA | | 2,242,506 |
Cayman Islands - 2.6% |
Chaoda Modern Agriculture (Holdings) Ltd. | 1,478,800 | | 1,041,847 |
Subsea 7, Inc. (a) | 41,000 | | 325,902 |
Transocean, Inc. (a) | 37,739 | | 3,107,052 |
TOTAL CAYMAN ISLANDS | | 4,474,801 |
China - 0.4% |
China Construction Bank Corp. (H Shares) | 939,000 | | 465,815 |
Nine Dragons Paper (Holdings) Ltd. | 1,087,000 | | 187,456 |
TOTAL CHINA | | 653,271 |
Cyprus - 0.4% |
Marfin Popular Bank Public Co. | 182,371 | | 617,712 |
Denmark - 0.1% |
Vestas Wind Systems AS (a) | 4,500 | | 184,319 |
Finland - 1.1% |
Fortum Oyj | 13,200 | | 324,404 |
Nokia Corp. sponsored ADR | 98,600 | | 1,496,748 |
TOTAL FINLAND | | 1,821,152 |
France - 11.5% |
Accor SA | 13,400 | | 521,331 |
Common Stocks - continued |
| Shares | | Value |
France - continued |
AXA SA sponsored ADR (d) | 231,500 | | $ 4,331,365 |
BNP Paribas SA | 49,400 | | 3,566,744 |
Compagnie de St. Gobain | 13,700 | | 528,639 |
GDF Suez | 33,989 | | 1,519,294 |
Renault SA | 9,400 | | 288,089 |
Total SA: | | | |
Series B | 43,700 | | 2,404,087 |
sponsored ADR | 80,500 | | 4,462,920 |
Unibail-Rodamco | 12,072 | | 1,810,615 |
TOTAL FRANCE | | 19,433,084 |
Germany - 13.3% |
Allianz AG sponsored ADR | 527,900 | | 4,001,482 |
BASF AG | 16,700 | | 561,558 |
Daimler AG | 114,700 | | 3,957,150 |
E.ON AG | 130,300 | | 4,984,860 |
GEA Group AG | 11,600 | | 169,522 |
GFK AG | 21,800 | | 430,496 |
Muenchener Rueckversicherungs-Gesellschaft AG (Reg.) | 38,200 | | 5,070,095 |
RWE AG | 37,300 | | 3,117,125 |
Tognum AG | 29,900 | | 332,442 |
TOTAL GERMANY | | 22,624,730 |
Greece - 0.4% |
Public Power Corp. of Greece | 51,600 | | 638,043 |
Hong Kong - 1.7% |
China Overseas Land & Investment Ltd. | 450,000 | | 508,167 |
Swire Pacific Ltd. (A Shares) | 340,300 | | 2,396,628 |
TOTAL HONG KONG | | 2,904,795 |
India - 0.7% |
Satyam Computer Services Ltd. sponsored ADR | 63,600 | | 1,000,428 |
Suzlon Energy Ltd. | 177,784 | | 161,161 |
TOTAL INDIA | | 1,161,589 |
Ireland - 1.2% |
Bank of Ireland | 134,771 | | 397,944 |
C&C Group PLC | 103,600 | | 150,697 |
CRH PLC sponsored ADR (d) | 68,800 | | 1,455,808 |
TOTAL IRELAND | | 2,004,449 |
Israel - 0.4% |
Israel Chemicals Ltd. | 69,400 | | 672,725 |
Common Stocks - continued |
| Shares | | Value |
Italy - 4.2% |
ENI SpA sponsored ADR | 32,300 | | $ 1,552,015 |
Fiat SpA | 49,200 | | 391,029 |
Finmeccanica SpA | 73,400 | | 898,002 |
UniCredit SpA | 1,740,700 | | 4,259,013 |
TOTAL ITALY | | 7,100,059 |
Japan - 19.6% |
Aeon Co. Ltd. | 172,700 | | 1,655,948 |
Canon, Inc. | 12,350 | | 432,125 |
Denso Corp. | 76,100 | | 1,483,158 |
East Japan Railway Co. | 243 | | 1,729,101 |
Ibiden Co. Ltd. | 20,300 | | 379,722 |
JSR Corp. | 49,500 | | 558,325 |
Konica Minolta Holdings, Inc. | 183,500 | | 1,205,039 |
Miraca Holdings, Inc. | 68,600 | | 1,106,238 |
Mitsubishi Estate Co. Ltd. | 25,000 | | 446,561 |
Mitsui & Co. Ltd. | 464,000 | | 4,495,703 |
Nomura Holdings, Inc. | 47,000 | | 445,271 |
Obic Co. Ltd. | 3,880 | | 474,898 |
ORIX Corp. | 27,620 | | 2,837,621 |
Osaka Gas Co. Ltd. | 872,000 | | 3,084,319 |
Sumitomo Corp. | 97,000 | | 853,367 |
Sumitomo Metal Industries Ltd. | 330,000 | | 848,697 |
Sumitomo Mitsui Financial Group, Inc. | 132 | | 529,143 |
Sumitomo Trust & Banking Co. Ltd. | 117,000 | | 541,809 |
Takeda Pharmaceutical Co. Ltd. | 22,200 | | 1,102,956 |
Tokuyama Corp. | 295,000 | | 1,493,853 |
Toyota Motor Corp. | 150,800 | | 5,888,579 |
Xebio Co. Ltd. | 61,200 | | 1,044,818 |
Yamada Denki Co. Ltd. | 12,060 | | 656,394 |
TOTAL JAPAN | | 33,293,645 |
Kazakhstan - 0.4% |
JSC Halyk Bank of Kazakhstan unit | 140,800 | | 598,400 |
Korea (South) - 0.2% |
Shinhan Financial Group Co. Ltd. | 15,390 | | 375,570 |
Mexico - 0.6% |
America Movil SAB de CV Series L sponsored ADR | 33,200 | | 1,027,208 |
Netherlands - 1.5% |
Heineken NV (Bearer) | 20,200 | | 681,411 |
Common Stocks - continued |
| Shares | | Value |
Netherlands - continued |
ING Groep NV sponsored ADR (d) | 54,600 | | $ 508,326 |
Koninklijke KPN NV | 99,100 | | 1,395,644 |
TOTAL NETHERLANDS | | 2,585,381 |
Norway - 3.0% |
DnB Nor ASA | 200,000 | | 1,159,067 |
Orkla ASA (A Shares) | 348,750 | | 2,321,704 |
Petroleum Geo-Services ASA (a) | 195,250 | | 972,230 |
StatoilHydro ASA sponsored ADR | 32,200 | | 647,220 |
TOTAL NORWAY | | 5,100,221 |
Philippines - 0.7% |
Philippine Long Distance Telephone Co. sponsored ADR | 29,100 | | 1,190,190 |
Russia - 0.9% |
OAO Gazprom sponsored ADR | 78,300 | | 1,601,235 |
Singapore - 1.2% |
DBS Group Holdings Ltd. | 272,000 | | 2,076,311 |
South Africa - 0.5% |
Impala Platinum Holdings Ltd. | 82,100 | | 847,890 |
Spain - 3.6% |
Banco Bilbao Vizcaya Argentaria SA sponsored ADR (d) | 127,800 | | 1,482,480 |
Banco Santander SA | 174,400 | | 1,886,164 |
Telefonica SA sponsored ADR | 47,800 | | 2,653,378 |
TOTAL SPAIN | | 6,022,022 |
Sweden - 0.5% |
Telefonaktiebolaget LM Ericsson (B Shares) | 132,600 | | 902,487 |
Switzerland - 7.5% |
EFG International | 63,690 | | 1,370,798 |
Nestle SA (Reg.) | 20,489 | | 796,584 |
Roche Holding AG (participation certificate) | 37,748 | | 5,771,438 |
Sonova Holding AG | 18,842 | | 782,727 |
Swiss Life Holding AG | 9,690 | | 872,940 |
Zurich Financial Services AG (Reg.) | 15,415 | | 3,126,685 |
TOTAL SWITZERLAND | | 12,721,172 |
Taiwan - 0.3% |
Advanced Semiconductor Engineering, Inc. | 390,993 | | 166,477 |
Hon Hai Precision Industry Co. Ltd. (Foxconn) | 174,000 | | 422,010 |
TOTAL TAIWAN | | 588,487 |
Common Stocks - continued |
| Shares | | Value |
Thailand - 0.1% |
Total Access Communication PCL unit | 216,000 | | $ 154,379 |
Turkey - 0.1% |
Turkiye Garanti Bankasi AS (a) | 82,000 | | 133,873 |
United Kingdom - 14.2% |
Aegis Group PLC | 821,800 | | 865,981 |
Anglo American PLC (United Kingdom) | 38,195 | | 958,243 |
BAE Systems PLC | 224,200 | | 1,260,064 |
Barratt Developments PLC | 40,600 | | 50,538 |
BHP Billiton PLC | 23,200 | | 393,900 |
British American Tobacco PLC (United Kingdom) | 11,500 | | 315,398 |
easyJet PLC (a) | 169,400 | | 844,962 |
HBOS PLC | 394,809 | | 646,392 |
HSBC Holdings PLC (United Kingdom) (Reg.) | 86,205 | | 1,020,905 |
Informa PLC | 135,400 | | 458,674 |
Man Group PLC | 203,100 | | 1,172,449 |
Misys PLC | 222,200 | | 397,821 |
National Grid PLC | 30,100 | | 339,038 |
Prudential PLC | 252,728 | | 1,269,382 |
Rio Tinto PLC (Reg.) | 26,100 | | 1,219,037 |
Royal Bank of Scotland Group PLC | 1,135,181 | | 1,250,266 |
Royal Dutch Shell PLC Class A sponsored ADR | 112,700 | | 6,289,791 |
Tesco PLC | 106,000 | | 580,714 |
Vodafone Group PLC | 372,400 | | 716,303 |
Vodafone Group PLC sponsored ADR | 195,812 | | 3,773,297 |
Xstrata PLC | 11,800 | | 201,806 |
TOTAL UNITED KINGDOM | | 24,024,961 |
TOTAL COMMON STOCKS (Cost $290,059,335) | 166,826,230 |
Nonconvertible Preferred Stocks - 0.8% |
| | | |
Germany - 0.2% |
ProSiebenSat.1 Media AG | 89,600 | | 270,434 |
Italy - 0.6% |
Fiat SpA (Risp) | 27,800 | | 126,000 |
Telecom Italia SpA (Risp) | 1,172,100 | | 986,350 |
TOTAL ITALY | | 1,112,350 |
TOTAL NONCONVERTIBLE PREFERRED STOCKS (Cost $3,399,874) | 1,382,784 |
Money Market Funds - 1.5% |
| Shares | | Value |
Fidelity Cash Central Fund, 1.81% (b) | 807,368 | | $ 807,368 |
Fidelity Securities Lending Cash Central Fund, 2.67% (b)(c) | 1,638,860 | | 1,638,860 |
TOTAL MONEY MARKET FUNDS (Cost $2,446,228) | 2,446,228 |
TOTAL INVESTMENT PORTFOLIO - 100.7% (Cost $295,905,437) | | 170,655,242 |
NET OTHER ASSETS - (0.7)% | | (1,169,534) |
NET ASSETS - 100% | $ 169,485,708 |
Legend |
(a) Non-income producing |
(b) Affiliated fund that is available only to investment companies and other accounts managed by Fidelity Investments. The rate quoted is the annualized seven-day yield of the fund at period end. A complete unaudited listing of the fund's holdings as of its most recent quarter end is available upon request. |
(c) Investment made with cash collateral received from securities on loan. |
(d) Security or a portion of the security is on loan at period end. |
Affiliated Central Funds |
Information regarding fiscal year to date income earned by the Fund from investments in Fidelity Central Funds is as follows: |
Fund | Income earned |
Fidelity Cash Central Fund | $ 102,969 |
Fidelity Securities Lending Cash Central Fund | 417,002 |
Total | $ 519,971 |
Income Tax Information |
At October 31, 2008, the fund had a capital loss carryforward of approximately $17,062,233 all of which will expire on October 31, 2016. |
See accompanying notes which are an integral part of the financial statements.
Annual Report
Statement of Assets and Liabilities
| October 31, 2008 |
| | |
Assets | | |
Investment in securities, at value (including securities loaned of $1,573,351) - See accompanying schedule: Unaffiliated issuers (cost $293,459,209) | $ 168,209,014 | |
Fidelity Central Funds (cost $2,446,228) | 2,446,228 | |
Total Investments (cost $295,905,437) | | $ 170,655,242 |
Foreign currency held at value (cost $11,124) | | 11,206 |
Receivable for investments sold | | 782,358 |
Receivable for fund shares sold | | 126,211 |
Dividends receivable | | 756,476 |
Distributions receivable from Fidelity Central Funds | | 13,358 |
Prepaid expenses | | 110 |
Other receivables | | 10,852 |
Total assets | | 172,355,813 |
| | |
Liabilities | | |
Payable for investments purchased | $ 787,826 | |
Payable for fund shares redeemed | 235,454 | |
Accrued management fee | 76,047 | |
Distribution fees payable | 4,028 | |
Other affiliated payables | 62,661 | |
Other payables and accrued expenses | 65,229 | |
Collateral on securities loaned, at value | 1,638,860 | |
Total liabilities | | 2,870,105 |
| | |
Net Assets | | $ 169,485,708 |
Net Assets consist of: | | |
Paid in capital | | $ 310,179,781 |
Undistributed net investment income | | 5,906,440 |
Accumulated undistributed net realized gain (loss) on investments and foreign currency transactions | | (21,368,384) |
Net unrealized appreciation (depreciation) on investments and assets and liabilities in foreign currencies | | (125,232,129) |
Net Assets | | $ 169,485,708 |
See accompanying notes which are an integral part of the financial statements.
Annual Report
Statement of Assets and Liabilities - continued
| October 31, 2008 |
| | |
Calculation of Maximum Offering Price
Class A:
Net Asset Value and redemption price per share ($2,854,331 ÷ 481,103 shares) | | $ 5.93 |
| | |
Maximum offering price per share (100/94.25 of $5.93) | | $ 6.29 |
Class T:
Net Asset Value and redemption price per share ($2,086,796 ÷ 353,285 shares) | | $ 5.91 |
| | |
Maximum offering price per share (100/96.50 of $5.91) | | $ 6.12 |
Class B:
Net Asset Value and offering price per share ($930,749 ÷ 158,228 shares)A | | $ 5.88 |
| | |
Class C:
Net Asset Value and offering price per share ($1,784,476 ÷ 303,662 shares)A | | $ 5.88 |
| | |
| | |
International Value:
Net Asset Value, offering price and redemption price per share ($160,777,143 ÷ 27,001,723 shares) | | $ 5.95 |
| | |
Institutional Class:
Net Asset Value, offering price and redemption price per share ($1,052,213 ÷ 176,561 shares) | | $ 5.96 |
A Redemption price per share is equal to net asset value less any applicable contingent deferred sales charge.
See accompanying notes which are an integral part of the financial statements.
Annual Report
Financial Statements - continued
Statement of Operations
| Year ended October 31, 2008 |
| | |
Investment Income | | |
Dividends | | $ 11,310,376 |
Income from Fidelity Central Funds | | 519,971 |
| | 11,830,347 |
Less foreign taxes withheld | | (1,004,576) |
Total income | | 10,825,771 |
| | |
Expenses | | |
Management fee
Basic fee | $ 2,219,944 | |
Performance adjustment | 37,496 | |
Transfer agent fees | 755,414 | |
Distribution fees | 100,125 | |
Accounting and security lending fees | 166,400 | |
Custodian fees and expenses | 74,291 | |
Independent trustees' compensation | 1,436 | |
Registration fees | 82,664 | |
Audit | 62,472 | |
Legal | 1,823 | |
Miscellaneous | 51,367 | |
Total expenses before reductions | 3,553,432 | |
Expense reductions | (34,143) | 3,519,289 |
Net investment income (loss) | | 7,306,482 |
Realized and Unrealized Gain (Loss) Net realized gain (loss) on: | | |
Investment securities: | | |
Unaffiliated issuers (net of foreign taxes of $20,535) | (21,080,305) | |
Foreign currency transactions | (178,048) | |
Total net realized gain (loss) | | (21,258,353) |
Change in net unrealized appreciation (depreciation) on: Investment securities | (181,075,670) | |
Assets and liabilities in foreign currencies | 12,629 | |
Total change in net unrealized appreciation (depreciation) | | (181,063,041) |
Net gain (loss) | | (202,321,394) |
Net increase (decrease) in net assets resulting from operations | | $ (195,014,912) |
See accompanying notes which are an integral part of the financial statements.
Annual Report
Statement of Changes in Net Assets
| Year ended
October 31,
2008 | Year ended
October 31,
2007 |
Increase (Decrease) in Net Assets | | |
Operations | | |
Net investment income (loss) | $ 7,306,482 | $ 6,846,508 |
Net realized gain (loss) | (21,258,353) | 23,723,355 |
Change in net unrealized appreciation (depreciation) | (181,063,041) | 43,769,419 |
Net increase (decrease) in net assets resulting
from operations | (195,014,912) | 74,339,282 |
Distributions to shareholders from net investment income | (5,562,901) | (978,516) |
Distributions to shareholders from net realized gain | (18,717,865) | (557,946) |
Total distributions | (24,280,766) | (1,536,462) |
Share transactions - net increase (decrease) | (16,138,151) | 101,052,444 |
Redemption fees | 26,598 | 30,746 |
Total increase (decrease) in net assets | (235,407,231) | 173,886,010 |
| | |
Net Assets | | |
Beginning of period | 404,892,939 | 231,006,929 |
End of period (including undistributed net investment income of $5,906,440 and undistributed net investment income of $6,624,232, respectively) | $ 169,485,708 | $ 404,892,939 |
See accompanying notes which are an integral part of the financial statements.
Annual Report
Financial Highlights - Class A
Years ended October 31, | 2008 | 2007 | 2006 I |
Selected Per-Share Data | | | |
Net asset value, beginning of period | $ 13.02 | $ 10.60 | $ 10.00 |
Income from Investment Operations | | | |
Net investment income (loss) E | .21 | .18 | .06 H |
Net realized and unrealized gain (loss) | (6.53) | 2.29 | .54 |
Total from investment operations | (6.32) | 2.47 | .60 |
Distributions from net investment income | (.15) | (.03) | - |
Distributions from net realized gain | (.62) | (.02) | - |
Total distributions | (.77) | (.05) | - |
Redemption fees added to paid in capital E, K | - | - | - |
Net asset value, end of period | $ 5.93 | $ 13.02 | $ 10.60 |
Total Return B, C, D | (51.50)% | 23.43% | 6.00% |
Ratios to Average Net Assets F, J | | | |
Expenses before reductions | 1.42% | 1.38% | 1.75% A |
Expenses net of fee waivers, if any | 1.42% | 1.38% | 1.50% A |
Expenses net of all reductions | 1.41% | 1.37% | 1.46% A |
Net investment income (loss) | 2.05% | 1.49% | 1.29% A, H |
Supplemental Data | | | |
Net assets, end of period (000 omitted) | $ 2,854 | $ 6,052 | $ 1,537 |
Portfolio turnover rate G | 68% | 59% | 29% A |
A Annualized
B Total returns for periods of less than one year are not annualized.
C Total returns would have been lower had certain expenses not been reduced during the periods shown.
D Total returns do not include the effect of the sales charges.
E Calculated based on average shares outstanding during the period.
F Fees and expenses of the underlying Fidelity Central Funds are not included in the Fund's expense ratio. The Fund indirectly bears its proportionate share of the expenses of any underlying Fidelity Central Funds.
G Amount does not include the portfolio activity of any underlying Fidelity Central Funds.
H Investment income per share reflects a special dividend which amounted to $.03 per share. Excluding the special dividend, the ratio of net investment income (loss) to average net assets would have been .63%.
I For the period May 18, 2006 (commencement of operations) to October 31, 2006.
J Expense ratios reflect operating expenses of the class. Expenses before reductions do not reflect amounts reimbursed by the investment adviser or reductions from brokerage service arrangements or other expense offset arrangements and do not represent the amount paid by the class during periods when reimbursements or reductions occur. Expense ratios before reductions for start-up periods may not be representative of longer-term operating periods. Expenses net of fee waivers reflect expenses after reimbursement by the investment adviser but prior to reductions from brokerage service arrangements or other expense offset arrangements. Expenses net of all reductions represent the net expenses paid by the class.
K Amount represents less than $.01 per share.
See accompanying notes which are an integral part of the financial statements.
Annual Report
Financial Highlights - Class T
Years ended October 31, | 2008 | 2007 | 2006 I |
Selected Per-Share Data | | | |
Net asset value, beginning of period | $ 12.99 | $ 10.59 | $ 10.00 |
Income from Investment Operations | | | |
Net investment income (loss) E | .18 | .15 | .05 H |
Net realized and unrealized gain (loss) | (6.50) | 2.29 | .54 |
Total from investment operations | (6.32) | 2.44 | .59 |
Distributions from net investment income | (.14) | (.02) | - |
Distributions from net realized gain | (.62) | (.02) | - |
Total distributions | (.76) | (.04) | - |
Redemption fees added to paid in capital E, K | - | - | - |
Net asset value, end of period | $ 5.91 | $ 12.99 | $ 10.59 |
Total Return B, C, D | (51.60)% | 23.13% | 5.90% |
Ratios to Average Net Assets F, J | | | |
Expenses before reductions | 1.67% | 1.60% | 2.01% A |
Expenses net of fee waivers, if any | 1.67% | 1.60% | 1.75% A |
Expenses net of all reductions | 1.66% | 1.58% | 1.71% A |
Net investment income (loss) | 1.80% | 1.27% | 1.04% A, H |
Supplemental Data | | | |
Net assets, end of period (000 omitted) | $ 2,087 | $ 5,081 | $ 1,789 |
Portfolio turnover rate G | 68% | 59% | 29% A |
A Annualized
B Total returns for periods of less than one year are not annualized.
C Total returns would have been lower had certain expenses not been reduced during the periods shown.
D Total returns do not include the effect of the sales charges.
E Calculated based on average shares outstanding during the period.
F Fees and expenses of the underlying Fidelity Central Funds are not included in the Fund's expense ratio. The Fund indirectly bears its proportionate share of the expenses of any underlying Fidelity Central Funds.
G Amount does not include the portfolio activity of any underlying Fidelity Central Funds.
H Investment income per share reflects a special dividend which amounted to $.03 per share. Excluding the special dividend, the ratio of net investment income (loss) to average net assets would have been .38%.
I For the period May 18, 2006 (commencement of operations) to October 31, 2006.
J Expense ratios reflect operating expenses of the class. Expenses before reductions do not reflect amounts reimbursed by the investment adviser or reductions from brokerage service arrangements or other expense offset arrangements and do not represent the amount paid by the class during periods when reimbursements or reductions occur. Expense ratios before reductions for start-up periods may not be representative of longer-term operating periods. Expenses net of fee waivers reflect expenses after reimbursement by the investment adviser but prior to reductions from brokerage service arrangements or other expense offset arrangements. Expenses net of all reductions represent the net expenses paid by the class.
K Amount represents less than $.01 per share.
See accompanying notes which are an integral part of the financial statements.
Annual Report
Financial Highlights - Class B
Years ended October 31, | 2008 | 2007 | 2006 I |
Selected Per-Share Data | | | |
Net asset value, beginning of period | $ 12.93 | $ 10.56 | $ 10.00 |
Income from Investment Operations | | | |
Net investment income (loss) E | .13 | .09 | .02 H |
Net realized and unrealized gain (loss) | (6.48) | 2.29 | .54 |
Total from investment operations | (6.35) | 2.38 | .56 |
Distributions from net investment income | (.08) | - | - |
Distributions from net realized gain | (.62) | (.01) | - |
Total distributions | (.70) | (.01) | - |
Redemption fees added to paid in capital E, K | - | - | - |
Net asset value, end of period | $ 5.88 | $ 12.93 | $ 10.56 |
Total Return B, C, D | (51.85)% | 22.59% | 5.60% |
Ratios to Average Net Assets F, J | | | |
Expenses before reductions | 2.18% | 2.10% | 2.50% A |
Expenses net of fee waivers, if any | 2.18% | 2.10% | 2.25% A |
Expenses net of all reductions | 2.17% | 2.08% | 2.21% A |
Net investment income (loss) | 1.29% | .77% | .54% A, H |
Supplemental Data | | | |
Net assets, end of period (000 omitted) | $ 931 | $ 2,651 | $ 1,304 |
Portfolio turnover rate G | 68% | 59% | 29% A |
A Annualized
B Total returns for periods of less than one year are not annualized.
C Total returns would have been lower had certain expenses not been reduced during the periods shown.
D Total returns do not include the effect of the contingent deferred sales charge.
E Calculated based on average shares outstanding during the period.
F Fees and expenses of the underlying Fidelity Central Funds are not included in the Fund's expense ratio. The Fund indirectly bears its proportionate share of the expenses of any underlying Fidelity Central Funds.
G Amount does not include the portfolio activity of any underlying Fidelity Central Funds.
H Investment income per share reflects a special dividend which amounted to $.03 per share. Excluding the special dividend, the ratio of net investment income (loss) to average net assets would have been (.12)%.
I For the period May 18, 2006 (commencement of operations) to October 31, 2006.
J Expense ratios reflect operating expenses of the class. Expenses before reductions do not reflect amounts reimbursed by the investment adviser or reductions from brokerage service arrangements or other expense offset arrangements and do not represent the amount paid by the class during periods when reimbursements or reductions occur. Expense ratios before reductions for start-up periods may not be representative of longer-term operating periods. Expenses net of fee waivers reflect expenses after reimbursement by the investment adviser but prior to reductions from brokerage service arrangements or other expense offset arrangements. Expenses net of all reductions represent the net expenses paid by the class.
K Amount represents less than $.01 per share.
See accompanying notes which are an integral part of the financial statements.
Annual Report
Financial Highlights - Class C
Years ended October 31, | 2008 | 2007 | 2006 I |
Selected Per-Share Data | | | |
Net asset value, beginning of period | $ 12.92 | $ 10.56 | $ 10.00 |
Income from Investment Operations | | | |
Net investment income (loss) E | .13 | .09 | .02 H |
Net realized and unrealized gain (loss) | (6.47) | 2.29 | .54 |
Total from investment operations | (6.34) | 2.38 | .56 |
Distributions from net investment income | (.08) | - | - |
Distributions from net realized gain | (.62) | (.02) | - |
Total distributions | (.70) | (.02) | - |
Redemption fees added to paid in capital E, K | - | - | - |
Net asset value, end of period | $ 5.88 | $ 12.92 | $ 10.56 |
Total Return B, C, D | (51.80)% | 22.56% | 5.60% |
Ratios to Average Net Assets F, J | | | |
Expenses before reductions | 2.17% | 2.07% | 2.47% A |
Expenses net of fee waivers, if any | 2.17% | 2.07% | 2.25% A |
Expenses net of all reductions | 2.16% | 2.05% | 2.21% A |
Net investment income (loss) | 1.30% | .80% | .54% A, H |
Supplemental Data | | | |
Net assets, end of period (000 omitted) | $ 1,784 | $ 5,996 | $ 2,183 |
Portfolio turnover rate G | 68% | 59% | 29% A |
A Annualized
B Total returns for periods of less than one year are not annualized.
C Total returns would have been lower had certain expenses not been reduced during the periods shown.
D Total returns do not include the effect of the contingent deferred sales charge.
E Calculated based on average shares outstanding during the period.
F Fees and expenses of the underlying Fidelity Central Funds are not included in the Fund's expense ratio. The Fund indirectly bears its proportionate share of the expenses of any underlying Fidelity Central Funds.
G Amount does not include the portfolio activity of any underlying Fidelity Central Funds.
H Investment income per share reflects a special dividend which amounted to $.03 per share. Excluding the special dividend, the ratio of net investment income (loss) to average net assets would have been (.12)%.
I For the period May 18, 2006 (commencement of operations) to October 31, 2006.
J Expense ratios reflect operating expenses of the class. Expenses before reductions do not reflect amounts reimbursed by the investment adviser or reductions from brokerage service arrangements or other expense offset arrangements and do not represent the amount paid by the class during periods when reimbursements or reductions occur. Expense ratios before reductions for start-up periods may not be representative of longer-term operating periods. Expenses net of fee waivers reflect expenses after reimbursement by the investment adviser but prior to reductions from brokerage service arrangements or other expense offset arrangements. Expenses net of all reductions represent the net expenses paid by the class.
K Amount represents less than $.01 per share.
See accompanying notes which are an integral part of the financial statements.
Annual Report
Financial Highlights - International Value
Years ended October 31, | 2008 | 2007 | 2006 H |
Selected Per-Share Data | | | |
Net asset value, beginning of period | $ 13.06 | $ 10.61 | $ 10.00 |
Income from Investment Operations | | | |
Net investment income (loss) D | .24 | .22 | .07 G |
Net realized and unrealized gain (loss) | (6.54) | 2.29 | .54 |
Total from investment operations | (6.30) | 2.51 | .61 |
Distributions from net investment income | (.19) | (.04) | - |
Distributions from net realized gain | (.62) | (.02) | - |
Total distributions | (.81) | (.06) | - |
Redemption fees added to paid in capital D, J | - | - | - |
Net asset value, end of period | $ 5.95 | $ 13.06 | $ 10.61 |
Total Return B, C | (51.34)% | 23.81% | 6.10% |
Ratios to Average Net Assets E, I | | | |
Expenses before reductions | 1.10% | 1.03% | 1.50% A |
Expenses net of fee waivers, if any | 1.10% | 1.03% | 1.25% A |
Expenses net of all reductions | 1.09% | 1.02% | 1.21% A |
Net investment income (loss) | 2.37% | 1.84% | 1.54% A, G |
Supplemental Data | | | |
Net assets, end of period (000 omitted) | $ 160,777 | $ 381,148 | $ 221,130 |
Portfolio turnover rate F | 68% | 59% | 29% A |
A Annualized
B Total returns for periods of less than one year are not annualized.
C Total returns would have been lower had certain expenses not been reduced during the periods shown.
D Calculated based on average shares outstanding during the period.
E Fees and expenses of the underlying Fidelity Central Funds are not included in the Fund's expense ratio. The Fund indirectly bears its proportionate share of the expenses of any underlying Fidelity Central Funds.
F Amount does not include the portfolio activity of any underlying Fidelity Central Funds.
G Investment income per share reflects a special dividend which amounted to $.03 per share. Excluding the special dividend, the ratio of net investment income (loss) to average net assets would have been .88%.
H For the period May 18, 2006 (commencement of operations) to October 31, 2006.
I Expense ratios reflect operating expenses of the class. Expenses before reductions do not reflect amounts reimbursed by the investment adviser or reductions from brokerage service arrangements or other expense offset arrangements and do not represent the amount paid by the class during periods when reimbursements or reductions occur. Expense ratios before reductions for start-up periods may not be representative of longer-term operating periods. Expenses net of fee waivers reflect expenses after reimbursement by the investment adviser but prior to reductions from brokerage service arrangements or other expense offset arrangements. Expenses net of all reductions represent the net expenses paid by the class.
J Amount represents less than $.01 per share.
See accompanying notes which are an integral part of the financial statements.
Annual Report
Financial Highlights - Institutional Class
Years ended October 31, | 2008 | 2007 | 2006 H |
Selected Per-Share Data | | | |
Net asset value, beginning of period | $ 13.07 | $ 10.61 | $ 10.00 |
Income from Investment Operations | | | |
Net investment income (loss) D | .25 | .22 | .07 G |
Net realized and unrealized gain (loss) | (6.54) | 2.30 | .54 |
Total from investment operations | (6.29) | 2.52 | .61 |
Distributions from net investment income | (.20) | (.04) | - |
Distributions from net realized gain | (.62) | (.02) | - |
Total distributions | (.82) | (.06) | - |
Redemption fees added to paid in capital D, J | - | - | - |
Net asset value, end of period | $ 5.96 | $ 13.07 | $ 10.61 |
Total Return B, C | (51.27)% | 23.91% | 6.10% |
Ratios to Average Net Assets E, I | | | |
Expenses before reductions | 1.02% | .98% | 1.38% A |
Expenses net of fee waivers, if any | 1.02% | .98% | 1.25% A |
Expenses net of all reductions | 1.01% | .96% | 1.21% A |
Net investment income (loss) | 2.45% | 1.89% | 1.54% A, G |
Supplemental Data | | | |
Net assets, end of period (000 omitted) | $ 1,052 | $ 3,965 | $ 3,064 |
Portfolio turnover rate F | 68% | 59% | 29% A |
A Annualized
B Total returns for periods of less than one year are not annualized.
C Total returns would have been lower had certain expenses not been reduced during the periods shown.
D Calculated based on average shares outstanding during the period.
E Fees and expenses of the underlying Fidelity Central Funds are not included in the Fund's expense ratio. The Fund indirectly bears its proportionate share of the expenses of any underlying Fidelity Central Funds.
F Amount does not include the portfolio activity of any underlying Fidelity Central Funds.
G Investment income per share reflects a special dividend which amounted to $.03 per share. Excluding the special dividend, the ratio of net investment income (loss) to average net assets would have been .88%.
H For the period May 18, 2006 (commencement of operations) to October 31, 2006.
I Expense ratios reflect operating expenses of the class. Expenses before reductions do not reflect amounts reimbursed by the investment adviser or reductions from brokerage service arrangements or other expense offset arrangements and do not represent the amount paid by the class during periods when reimbursements or reductions occur. Expense ratios before reductions for start-up periods may not be representative of longer-term operating periods. Expenses net of fee waivers reflect expenses after reimbursement by the investment adviser but prior to reductions from brokerage service arrangements or other expense offset arrangements. Expenses net of all reductions represent the net expenses paid by the class.
J Amount represents less than $.01 per share.
See accompanying notes which are an integral part of the financial statements.
Annual Report
Notes to Financial Statements
For the period ended October 31, 2008
1. Organization.
Fidelity International Value Fund (the Fund) is a fund of Fidelity Investment Trust (the trust) and is authorized to issue an unlimited number of shares. The trust is registered under the Investment Company Act of 1940, as amended (the 1940 Act), as an open-end management investment company organized as a Massachusetts business trust. The Fund offers Class A, Class T, Class B, Class C, International Value and Institutional Class shares, each of which has equal rights as to assets and voting privileges. Each class has exclusive voting rights with respect to matters that affect that class. Class B shares will automatically convert to Class A shares after a holding period of seven years from the initial date of purchase. Investment income, realized and unrealized capital gains and losses, the common expenses of the Fund, and certain fund-level expense reductions, if any, are allocated on a pro rata basis to each class based on the relative net assets of each class to the total net assets of the Fund. Each class differs with respect to transfer agent and distribution and service plan fees incurred. Certain expense reductions also differ by class.
The Fund's investments in emerging markets can be subject to social, economic, regulatory, and political uncertainties and can be extremely volatile.
2. Investments in Fidelity Central Funds.
The Fund may invest in Fidelity Central Funds, which are open-end investment companies available only to other investment companies and accounts managed by Fidelity Management & Research Company (FMR) and its affiliates. The Fund's Schedule of Investments lists each of the Fidelity Central Funds held as of period end, if any, as an investment of the Fund, but does not include the underlying holdings of each Fidelity Central Fund. As an Investing Fund, the Fund indirectly bears its proportionate share of the expenses of the underlying Fidelity Central Funds.
The Money Market Central Funds seek preservation of capital and current income and are managed by Fidelity Investments Money Management, Inc. (FIMM), an affiliate of FMR.
A complete unaudited list of holdings for each Fidelity Central Fund is available upon request or at the SEC's web site at www.sec.gov. In addition, the financial statements of the Fidelity Central Funds, which are not covered by the Fund's Report of Independent Registered Public Accounting Firm, are available on the SEC's web site or upon request.
3. Significant Accounting Policies.
The financial statements have been prepared in conformity with accounting principles generally accepted in the United States of America, which require management to make certain estimates and assumptions at the date of the financial statements. Actual results could differ from those estimates. The following summarizes the significant accounting policies of the Fund:
Annual Report
3. Significant Accounting Policies - continued
Security Valuation. Investments are valued as of 4:00 p.m. Eastern time on the last calendar day of the period. Wherever possible, the Fund uses independent pricing services approved by the Board of Trustees to value its investments.
Equity securities, including restricted securities, for which market quotations are readily available, are valued at the last reported sale price or official closing price as reported by an independent pricing service on the primary market or exchange on which they are traded. In the event there were no sales during the day or closing prices are not available, securities are valued at the last quoted bid price. Investments in open-end mutual funds, including Fidelity Central Funds, are valued at their closing net asset value each business day. Short-term securities with remaining maturities of sixty days or less for which quotations are not readily available are valued at amortized cost, which approximates value.
When current market prices or quotations are not readily available or reliable, valuations may be determined in good faith in accordance with procedures adopted by the Board of Trustees. Factors used in determining value may include significant market or security specific events, changes in interest rates and credit quality, and developments in foreign markets which are monitored by evaluating the performance of ADRs, futures contracts and exchange-traded funds. The frequency with which these procedures are used cannot be predicted and may be utilized to a significant extent. The value of securities used for net asset value (NAV) calculation under these procedures may differ from published prices for the same securities.
Foreign Currency. The Fund uses foreign currency contracts to facilitate transactions in foreign-denominated securities. Losses from these transactions may arise from changes in the value of the foreign currency or if the counterparties do not perform under the contracts' terms.
Foreign-denominated assets, including investment securities, and liabilities are translated into U.S. dollars at the exchange rate at period end. Purchases and sales of investment securities, income and dividends received and expenses denominated in foreign currencies are translated into U.S. dollars at the exchange rate in effect on the transaction date.
The effects of exchange rate fluctuations on investments are included with the net realized and unrealized gain (loss) on investment securities. Other foreign currency transactions resulting in realized and unrealized gain (loss) are disclosed separately.
Annual Report
Notes to Financial Statements - continued
3. Significant Accounting Policies - continued
Investment Transactions and Income. For financial reporting purposes, the Fund's investment holdings and NAV include trades executed through the end of the last business day of the period. The NAV per share for processing shareholder transactions is calculated as of the close of business of the New York Stock Exchange (NYSE), normally 4:00 p.m. Eastern time and includes trades executed through the end of the prior business day. Gains and losses on securities sold are determined on the basis of identified cost. Dividend income is recorded on the ex-dividend date, except for certain dividends from foreign securities where the ex-dividend date may have passed, which are recorded as soon as the Fund is informed of the ex-dividend date. Non-cash dividends included in dividend income, if any, are recorded at the fair market value of the securities received. Interest income and distributions from the Fidelity Central Funds are accrued as earned. Interest income includes coupon interest and amortization of premium and accretion of discount on debt securities. Investment income is recorded net of foreign taxes withheld where recovery of such taxes is uncertain.
Expenses. Most expenses of the trust can be directly attributed to a fund. Expenses which cannot be directly attributed are apportioned among each Fund in the trust. Expense estimates are accrued in the period to which they relate and adjustments are made when actual amounts are known.
Income Tax Information and Distributions to Shareholders. Each year, the Fund intends to qualify as a regulated investment company by distributing substantially all of its taxable income and realized gains under Subchapter M of the Internal Revenue Code and filing its U.S. federal tax return. As a result, no provision for income taxes is required. The Fund is subject to the provisions of FASB Interpretation No. 48, Accounting for Uncertainties in Income Taxes (FIN 48). FIN 48 sets forth a minimum threshold for financial statement recognition of the benefit of a tax position taken or expected to be taken in a tax return. The implementation of FIN 48 did not result in any unrecognized tax benefits in the accompanying financial statements. Each of the Fund's federal tax returns for the prior three fiscal years remains subject to examination by the Internal Revenue Service (IRS). Foreign taxes are provided for based on the Fund's understanding of the tax rules and rates that exist in the foreign markets in which it invests.
Distributions are recorded on the ex-dividend date. Income dividends and capital gain distributions are declared separately for each class. Income and capital gain distributions are determined in accordance with income tax regulations, which may differ from generally accepted accounting principles. In addition, the Fund will claim a portion of the payment made to redeeming shareholders as a distribution for income tax purposes.
Capital accounts within the financial statements are adjusted for permanent book-tax differences. These adjustments have no impact on net assets or the results of operations. Temporary book-tax differences will reverse in a subsequent period.
Annual Report
3. Significant Accounting Policies - continued
Income Tax Information and Distributions to Shareholders - continued
Book-tax differences are primarily due to foreign currency transactions, certain foreign taxes, passive foreign investment companies (PFIC), capital loss carryforwards and losses deferred due to wash sales.
The tax-basis components of distributable earnings and the federal tax cost as of period end were as follows:
Unrealized appreciation | $ 807,051 |
Unrealized depreciation | (130,345,335) |
Net unrealized appreciation (depreciation) | (129,538,284) |
Undistributed ordinary income | 2,463,569 |
Capital loss carryforward | (17,062,233) |
| |
Cost for federal income tax purposes | $ 300,193,526 |
The tax character of distributions paid was as follows:
| October 31, 2008 | October 31, 2007 |
Ordinary Income | $ 14,016,131 | $ 1,536,462 |
Long-term Capital Gains | 10,264,635 | - |
Total | $ 24,280,766 | $ 1,536,462 |
Short-Term Trading (Redemption) Fees. Shares held in the Fund less than 30 days are subject to a redemption fee equal to 1.00% of the proceeds of the redeemed shares. All redemption fees, including any estimated redemption fees paid by FMR, are retained by the Fund and accounted for as an addition to paid in capital.
New Accounting Pronouncement. In September 2006, Statement of Financial Accounting Standards No. 157, Fair Value Measurements (SFAS 157), was issued and is effective for fiscal years beginning after November 15, 2007. SFAS 157 defines fair value, establishes a framework for measuring fair value and results in expanded disclosures about fair value measurements.
4. Operating Policies.
Repurchase Agreements. FMR has received an Exemptive Order from the Securities and Exchange Commission (the SEC) which permits the Fund and other affiliated entities of FMR to transfer uninvested cash balances into joint trading accounts which are then invested in repurchase agreements. The Fund may also invest directly with institutions in repurchase agreements. Repurchase agreements are collateralized by government or non-government securities. Upon settlement date, collateral is held in segregated accounts with custodian banks and may be obtained in the event of a default of the counterparty. The
Annual Report
Notes to Financial Statements - continued
4. Operating Policies - continued
Repurchase Agreements - continued
Fund monitors, on a daily basis, the value of the collateral to ensure it is at least equal to the principal amount of the repurchase agreement (including accrued interest). In the event of a default by the counterparty, realization of the collateral proceeds could be delayed, during which time the value of the collateral may decline.
5. Purchases and Sales of Investments.
Purchases and sales of securities, other than short-term securities, aggregated $212,491,909 and $242,763,038, respectively.
6. Fees and Other Transactions with Affiliates.
Management Fee. FMR and its affiliates provide the Fund with investment management related services for which the Fund pays a monthly management fee. The management fee is the sum of an individual fund fee rate that is based on an annual rate of .45% of the Fund's average net assets and a group fee rate that averaged .26% during the period. The group fee rate is based upon the average net assets of all the mutual funds advised by FMR. The group fee rate decreases as assets under management increase and increases as assets under management decrease. In addition, the management fee is subject to a performance adjustment (up to a maximum of ± .20% of the Fund's average net assets over a 36 month performance period). The upward or downward adjustment to the management fee is based on the relative investment performance of the retail class of the Fund, International Value as compared to an appropriate benchmark index. For the period, the total annual management fee rate, including the performance adjustment, was .72% of the Fund's average net assets.
Distribution and Service Plan. In accordance with Rule 12b-1 of the 1940 Act, the Fund has adopted separate Distribution and Service Plans for each class of shares. Certain classes pay Fidelity Distributors Corporation (FDC), an affiliate of FMR, separate Distribution and Service Fees, each of which is based on an annual percentage of each class' average net assets. In addition, FDC may pay financial intermediaries for selling shares of the Fund and providing shareholder support services. For the period, the Distribution and Service Fee rates and the total amounts paid to and retained by FDC were as follows:
| Distribution
Fee | Service
Fee | Paid to
FDC | Retained
by FDC |
Class A | -% | .25% | $ 13,754 | $ 2,352 |
Class T | .25% | .25% | 20,752 | 3,584 |
Class B | .75% | .25% | 21,357 | 18,195 |
Class C | .75% | .25% | 44,262 | 14,734 |
| | | $ 100,125 | $ 38,865 |
Annual Report
6. Fees and Other Transactions with Affiliates - continued
Sales Load. FDC receives a front-end sales charge of up to 5.75% for selling Class A shares, and 3.50% for selling Class T shares, some of which is paid to financial intermediaries for selling shares of the Fund. FDC receives the proceeds of contingent deferred sales charges levied on Class A, Class T, Class B, and Class C redemptions. These charges depend on the holding period. The deferred sales charges range from 5% to 1% for Class B, 1% for Class C, 1.00% to .50% for certain purchases of Class A shares and .25% for certain purchases of Class T shares.
For the period, sales charge amounts retained by FDC were as follows:
| Retained
by FDC |
Class A | $ 6,886 |
Class T | 1,276 |
Class B* | 3,402 |
Class C* | 626 |
| $ 12,190 |
* When Class B and Class C shares are initially sold, FDC pays commissions from its own resources to financial intermediaries through which the sales are made.
Transfer Agent Fees. Fidelity Investments Institutional Operations Company, Inc. (FIIOC), an affiliate of FMR, is the transfer, dividend disbursing and shareholder servicing agent for each class of the Fund. FIIOC receives account fees and asset-based fees that vary according to the account size and type of account of the shareholders of the respective classes of the Fund. FIIOC pays for typesetting, printing, and mailing of shareholder reports, except proxy statements. Prior to January 1, 2008, Fidelity Service Company, Inc. (FSC), also an affiliate of FMR was the transfer agent for International Value. For the period, the total transfer agent fees paid by each class were as follows:
| Amount | % of
Average
Net Assets |
Class A | $ 16,622 | .30 |
Class T | 12,810 | .31 |
Class B | 6,621 | .31 |
Class C | 13,325 | .30 |
International Value | 701,661 | .24 |
Institutional Class | 4,375 | .16 |
| $ 755,414 | |
Annual Report
Notes to Financial Statements - continued
6. Fees and Other Transactions with Affiliates - continued
Accounting and Security Lending Fees. FSC, an affiliate of FMR, maintains the Fund's accounting records. The accounting fee is based on the level of average net assets for the month. Under a separate contract, FSC administers the security lending program. The security lending fee is based on the number and duration of lending transactions.
Brokerage Commissions. The Fund placed a portion of its portfolio transactions with brokerage firms which are affiliates of the investment adviser. The commissions paid to these affiliated firms were $982 for the period.
7. Committed Line of Credit.
The Fund participates with other funds managed by FMR in a $4.2 billion credit facility (the "line of credit") to be utilized for temporary or emergency purposes to fund shareholder redemptions or for other short-term liquidity purposes. The Fund has agreed to pay commitment fees on its pro rata portion of the line of credit, which amounted to $652 and is reflected in Miscellaneous Expense on the Statement of Operations. During the period, there were no borrowings on this line of credit.
8. Security Lending.
The Fund lends portfolio securities from time to time in order to earn additional income. On the settlement date of the loan, the Fund receives collateral (in the form of U.S. Treasury obligations, letters of credit and/or cash) against the loaned securities and maintains collateral in an amount not less than 100% of the market value of the loaned securities during the period of the loan. The market value of the loaned securities is determined at the close of business of the Fund and any additional required collateral is delivered to the Fund on the next business day. If the borrower defaults on its obligation to return the securities loaned because of insolvency or other reasons, a fund could experience delays and costs in recovering the securities loaned or in gaining access to the collateral. Any cash collateral received is invested in the Fidelity Securities Lending Cash Central Fund. The value of loaned securities and cash collateral at period end are disclosed on the Fund's Statement of Assets and Liabilities. Security lending income represents the income earned on investing cash collateral, less fees and expenses associated with the loan, plus any premium payments that may be received on the loan of certain types of securities. Security lending income is presented in the Statement of Operations as a component of income from Fidelity Central Funds. Net income from lending portfolio securities during the period amounted to $417,002.
9. Expense Reductions.
Many of the brokers with whom FMR places trades on behalf of the Fund provided services to the Fund in addition to trade execution. These services included payments of certain expenses on behalf of the Fund totaling $34,143 for the period.
Annual Report
10. Other.
The Fund's organizational documents provide former and current trustees and officers with a limited indemnification against liabilities arising in connection with the performance of their duties to the Fund. In the normal course of business, the Fund may also enter into contracts that provide general indemnifications. The Fund's maximum exposure under these arrangements is unknown as this would be dependent on future claims that may be made against the Fund. The risk of material loss from such claims is considered remote.
During the period, Lehman Brothers Holdings, Inc. and certain of its affiliates (LBHI) sought protection under the insolvency laws of their jurisdictions of organization, including the United States, the United Kingdom and Japan. At the time LBHI's insolvency proceedings were instituted, the Fund had outstanding securities trades with counterparties affiliated with LBHI. As a result of the insolvency proceedings, LBHI is unable to fulfill its commitments and, in certain cases, the Fund may have terminated its trades and related agreements with the relevant entities and, where appropriate, is in the process of initiating claims for damages. FMR believes that the financial impact to the Fund relating to the terminated trades and agreements is immaterial.
11. Distributions to Shareholders.
Distributions to shareholders of each class were as follows:
Years ended October 31, | 2008 | 2007 |
From net investment income | | |
Class A | $ 71,381 | $ 5,613 |
Class T | 53,705 | 4,267 |
Class B | 15,783 | - |
Class C | 37,642 | - |
International Value | 5,325,187 | 956,069 |
Institutional Class | 59,203 | 12,567 |
Total | $ 5,562,901 | $ 978,516 |
From net realized gain | | |
Class A | $ 297,020 | $ 3,983 |
Class T | 246,645 | 4,693 |
Class B | 128,753 | 1,788 |
Class C | 295,420 | 4,566 |
International Value | 17,561,793 | 536,333 |
Institutional Class | 188,234 | 6,583 |
Total | $ 18,717,865 | $ 557,946 |
Annual Report
Notes to Financial Statements - continued
12. Share Transactions.
Transactions for each class of shares were as follows:
| Shares | Dollars |
Years ended October 31, | 2008 | 2007 | 2008 | 2007 |
Class A | | | | |
Shares sold | 298,063 | 556,341 | $ 3,154,503 | $ 6,434,905 |
Reinvestment of distributions | 30,184 | 863 | 357,686 | 9,431 |
Shares redeemed | (312,021) | (237,384) | (3,010,663) | (2,953,175) |
Net increase (decrease) | 16,226 | 319,820 | $ 501,526 | $ 3,491,161 |
Class T | | | | |
Shares sold | 169,412 | 281,943 | $ 1,740,848 | $ 3,296,913 |
Reinvestment of distributions | 21,586 | 806 | 255,358 | 8,796 |
Shares redeemed | (228,991) | (60,435) | (2,152,407) | (714,379) |
Net increase (decrease) | (37,993) | 222,314 | $ (156,201) | $ 2,591,330 |
Class B | | | | |
Shares sold | 48,187 | 114,852 | $ 472,858 | $ 1,342,524 |
Reinvestment of distributions | 10,866 | 151 | 128,544 | 1,653 |
Shares redeemed | (105,867) | (33,404) | (916,142) | (398,508) |
Net increase (decrease) | (46,814) | 81,599 | $ (314,740) | $ 945,669 |
Class C | | | | |
Shares sold | 114,256 | 337,076 | $ 1,072,554 | $ 3,929,869 |
Reinvestment of distributions | 22,711 | 319 | 268,223 | 3,483 |
Shares redeemed | (297,329) | (80,082) | (2,692,615) | (988,817) |
Net increase (decrease) | (160,362) | 257,313 | $ (1,351,838) | $ 2,944,535 |
International Value | | | | |
Shares sold | 13,343,931 | 26,426,338 | $ 131,489,328 | $ 309,978,984 |
Reinvestment of distributions | 1,810,134 | 127,337 | 21,468,187 | 1,391,798 |
Shares redeemed | (17,329,561) | (18,219,061) | (166,721,411) | (220,454,791) |
Net increase (decrease) | (2,175,496) | 8,334,614 | $ (13,763,896) | $ 90,915,991 |
Institutional Class | | | | |
Shares sold | 50,248 | 75,655 | $ 566,166 | $ 870,496 |
Reinvestment of distributions | 6,826 | 692 | 80,952 | 7,564 |
Shares redeemed | (183,848) | (61,819) | (1,700,120) | (714,302) |
Net increase (decrease) | (126,774) | 14,528 | $ (1,053,002) | $ 163,758 |
Annual Report
To the Trustees of Fidelity Investment Trust and Shareholders of Fidelity International Value Fund:
We have audited the accompanying statement of assets and liabilities of Fidelity International Value Fund (the Fund), a fund of Fidelity Investment Trust, including the schedule of investments, as of October 31, 2008, and the related statement of operations for the year then ended, the statement of changes in net assets for each of the two years in the period then ended, and the financial highlights for each of the two years in the period then ended and for the period from May 18, 2006 (commencement of operations) to October 31, 2006. These financial statements and financial highlights are the responsibility of the Fund's management. Our responsibility is to express an opinion on these financial statements and financial highlights based on our audits.
We conducted our audits in accordance with standards of the Public Company Accounting Oversight Board (United States). Those standards require that we plan and perform the audit to obtain reasonable assurance about whether the financial statements and financial highlights are free of material misstatement. The Fund is not required to have, nor were we engaged to perform, an audit of its internal control over financial reporting. Our audits included consideration of internal control over financial reporting as a basis for designing audit procedures that are appropriate in the circumstances, but not for the purpose of expressing an opinion on the effectiveness of the Fund's internal control over financial reporting. Accordingly, we express no such opinion. An audit also includes examining, on a test basis, evidence supporting the amounts and disclosures in the financial statements, assessing the accounting principles used and significant estimates made by management, as well as evaluating the overall financial statement presentation. Our procedures included confirmation of securities owned as of October 31, 2008, by correspondence with the custodians and brokers; where replies were not received from brokers, we performed other auditing procedures. We believe that our audits provide a reasonable basis for our opinion.
In our opinion, the financial statements and financial highlights referred to above present fairly, in all material respects, the financial position of Fidelity International Value Fund as of October 31, 2008, the results of its operations for the year then ended, the changes in its net assets for each of the two years in the period then ended, and its financial highlights for each of the two years in the period then ended, and the financial highlights for each of the two years in the period then ended, and for the period from May 18, 2006 (commencement of operations) to October 31, 2006 in conformity with accounting principles generally accepted in the United States of America.
/s/ Deloitte & Touche LLP
DELOITTE & TOUCHE LLP
Boston, Massachusetts
December 19, 2008
Annual Report
The Trustees, Member of the Advisory Board, and executive officers of the trust and fund, as applicable, are listed below. The Board of Trustees governs the fund and is responsible for protecting the interests of shareholders. The Trustees are experienced executives who meet periodically throughout the year to oversee the fund's activities, review contractual arrangements with companies that provide services to the fund, and review the fund's performance. Except for Edward C. Johnson 3d and James C. Curvey, each of the Trustees oversees 220 funds advised by FMR or an affiliate. Messrs. Johnson and Curvey oversee 379 funds advised by FMR or an affiliate.
The Trustees hold office without limit in time except that (a) any Trustee may resign; (b) any Trustee may be removed by written instrument, signed by at least two-thirds of the number of Trustees prior to such removal; (c) any Trustee who requests to be retired or who has become incapacitated by illness or injury may be retired by written instrument signed by a majority of the other Trustees; and (d) any Trustee may be removed at any special meeting of shareholders by a two-thirds vote of the outstanding voting securities of the trust. Each Trustee who is not an interested person (as defined in the 1940 Act) (Independent Trustee), shall retire not later than the last day of the calendar year in which his or her 72nd birthday occurs. The Independent Trustees may waive this mandatory retirement age policy with respect to individual Trustees. The executive officers and Advisory Board Member hold office without limit in time, except that any officer and Advisory Board Member may resign or may be removed by a vote of a majority of the Trustees at any regular meeting or any special meeting of the Trustees. Except as indicated, each individual has held the office shown or other offices in the same company for the past five years.
The fund's Statement of Additional Information (SAI) includes more information about the Trustees. To request a free copy, call Fidelity at 1-877-208-0098.
Interested Trustees*:
Correspondence intended for each Trustee who is an interested person may be sent to Fidelity Investments, 82 Devonshire Street, Boston, Massachusetts 02109.
Name, Age; Principal Occupation |
Edward C. Johnson 3d (78) |
| Year of Election or Appointment:1984 Mr. Johnson is Chairman of the Board of Trustees. Mr. Johnson serves as Chief Executive Officer, Chairman, and a Director of FMR LLC; Chairman and a Director of FMR; Chairman and a Director of Fidelity Research & Analysis Company (FRAC); Chairman and a Director of Fidelity Investments Money Management, Inc.; and Chairman and a Director of FMR Co., Inc. In addition, Mr. Johnson serves as Chairman and Director of FIL Limited. Previously, Mr. Johnson served as President of FMR LLC (2006-2007). |
James C. Curvey (73) |
| Year of Election or Appointment: 2007 Mr. Curvey also serves as Trustee (2007-present) of other investment companies advised by FMR. Mr. Curvey is a Director of FMR and FMR Co., Inc. (2007-present). Mr. Curvey is also Vice Chairman (2006-
present) and Director of FMR LLC. In addition, Mr. Curvey serves as an Overseer for the Boston Symphony Orchestra and a member of the Trustees of Villanova University. |
* Trustees have been determined to be "Interested Trustees" by virtue of, among other things, their affiliation with the trust or various entities under common control with FMR. FMR Corp. merged with and into FMR LLC on October 1, 2007. Any references to FMR LLC for prior periods are deemed to be references to the prior entity.
Independent Trustees:
Correspondence intended for each Independent Trustee (that is, the Trustees other than the Interested Trustees) may be sent to Fidelity Investments, P.O. Box 55235, Boston, Massachusetts 02205-5235.
Name, Age; Principal Occupation |
Dennis J. Dirks (60) |
| Year of Election or Appointment: 2005 Prior to his retirement in May 2003, Mr. Dirks was Chief Operating Officer and a member of the Board of The Depository Trust & Clearing Corporation (DTCC) (1999-2003). He also served as President, Chief Operating Officer, and Board member of The Depository Trust Company (DTC) (1999-2003) and President and Board member of the National Securities Clearing Corporation (NSCC) (1999-2003). In addition, Mr. Dirks served as a Trustee and a member of the Finance Committee of Manhattan College (2005-2008), and as Chief Executive Officer and Board member of the Government Securities Clearing Corporation (2001-2003) and Chief Executive Officer and Board member of the Mortgage-Backed Securities Clearing Corporation (2001-2003). Mr. Dirks also serves as a Trustee and a member of the Finance Committee of AHRC of Nassau County (2006-present). |
Alan J. Lacy (55) |
| Year of Election or Appointment: 2008 Mr. Lacy serves as Senior Adviser (2007-present) of Oak Hill Capital Partners, L.P. (a private equity firm). Mr. Lacy also served as Chief Executive Officer (2000-2005) and Vice Chairman (2005-2006) of Sears Holdings Corporation and Sears, Roebuck and Co. (retail). In addition, Mr. Lacy serves as a member of the Board of Directors of The Western Union Company (global money transfer, 2006-present) and Bristol-Myers Squibb (global pharmaceuticals, 2007-present). Mr. Lacy is a Trustee of the National Parks Conservation Association and The Field Museum of Natural History. |
Ned C. Lautenbach (64) |
| Year of Election or Appointment: 2000 Mr. Lautenbach is Chairman of the Independent Trustees (2006-present). Mr. Lautenbach is an Advisory Partner of Clayton, Dubilier & Rice, Inc. (private equity investment firm). Previously, Mr. Lautenbach was with the International Business Machines Corporation (IBM) from 1968 until his retirement in 1998. Mr. Lautenbach serves as a Director of Eaton Corporation (diversified industrial) as well as the Philharmonic Center for the Arts in Naples, Florida. He also is a member of the Board of Trustees of Fairfield University (2005-present), as well as a member of the Council on Foreign Relations. Previously, Mr. Lautenbach served as a Director of Sony Corporation (2006-2007). |
Joseph Mauriello (64) |
| Year of Election or Appointment: 2008 Prior to his retirement in January 2006, Mr. Mauriello served in numerous senior management positions including Deputy Chairman and Chief Operating Officer (2004-2005), and Vice Chairman of Financial Services (2002-2004) of KPMG LLP US (professional services firm, 1965-
2005). Mr. Mauriello currently serves as a member of the Board of Directors of XL Capital Ltd. (global insurance and re-insurance company, 2006-present) and of Arcadia Resources Inc. (health care services and products, 2007-present). He also served as a Director of the Hamilton Funds of the Bank of New York (2006-2007). |
Cornelia M. Small (64) |
| Year of Election or Appointment: 2005 Ms. Small is a member of the Investment Committee, and Chair (2008-present) and a member of the Board of Trustees of Smith College. Ms. Small also serves on the Investment Committee of the Berkshire Taconic Community Foundation (2008-present). Previously, Ms. Small served as Chairperson of the Investment Committee (2002-2008) of Smith College and as Co-Chair (2000-2003) of the Annual Fund for the Fletcher School of Law and Diplomacy. In addition, she served as Chief Investment Officer, Director of Global Equity Investments, and a member of the Board of Directors of Scudder, Stevens & Clark and Scudder Kemper Investments. |
William S. Stavropoulos (69) |
| Year of Election or Appointment: 2001 Mr. Stavropoulos is Chairman Emeritus of the Board of Directors of The Dow Chemical Company, where he previously served in numerous senior management positions, including President (1993-2000; 2002-
2003), CEO (1995-2000; 2002-2004), Chairman of the Executive Committee (2000-2006), and as a member of the Board of Directors (1990-2006). Currently, he is a Director of Teradata Corporation (data warehousing and technology solutions, 2008-present), Chemical Financial Corporation, Maersk Inc. (industrial conglomerate), Tyco International, Inc. (multinational manufacturing and services, 2007-present), and a member of the Advisory Board for Metalmark Capital (private equity investment firm, 2005-present). He is a special advisor to Clayton, Dubilier & Rice, Inc. (private equity investment). In addition, Mr. Stavropoulos is a member of the University of Notre Dame Advisory Council for the College of Science. |
David M. Thomas (59) |
| Year of Election or Appointment: 2008 Previously, Mr. Thomas served as Executive Chairman (2005-2006) and Chairman and Chief Executive Officer (2000-2005) of IMS Health, Inc. (pharmaceutical and healthcare information solutions). In addition, Mr. Thomas serves as a member of the Board of Directors of Fortune Brands, Inc. (consumer products holding company), and Interpublic Group of Companies, Inc. (marketing communication, 2004-present). |
Michael E. Wiley (58) |
| Year of Election or Appointment: 2008 Mr. Wiley also serves as a member of the Board of Trustees of the University of Tulsa (2000-2006; 2007-present). He serves as a Director of Tesoro Corporation (independent oil refiner and marketer, 2005-
present), and a Director of Bill Barrett Corporation (exploration and production company, 2005-present). In addition, he also serves as a Director of Post Oak Bank (privately-held bank, 2004-present). Previously, Mr. Wiley served as a Sr. Energy Advisor of Katzenbach Partners, LLC (consulting firm, 2006-2007), as an Advisory Director of Riverstone Holdings (private investment firm), Chairman, President, and CEO of Baker Hughes, Inc. (oilfield services company, 2000-2004), and as Director of Spinnaker Exploration Company (exploration and production company, 2001-2005). |
Advisory Board Member and Executive Officers**:
Correspondence intended for each executive officer and Mr. Lynch may be sent to Fidelity Investments, 82 Devonshire Street, Boston, Massachusetts 02109.
Name, Age; Principal Occupation |
Peter S. Lynch (64) |
| Year of Election or Appointment: 2003 Member of the Advisory Board of Fidelity's Equity and High Income Funds. Mr. Lynch is Vice Chairman and a Director of FMR, and Vice Chairman (2001-present) and a Director of FMR Co., Inc. Previously, Mr. Lynch served as a Trustee of the Fidelity funds (1990-2003). In addition, he serves as a Trustee of Boston College and as the Chairman of the Inner-City Scholarship Fund. Previously, Mr. Lynch served on the Special Olympics International Board of Directors (1997-2006). |
Kenneth B. Robins (39) |
| Year of Election or Appointment: 2008 President and Treasurer of Fidelity's Equity and High Income Funds. Mr. Robins is an employee of Fidelity Investments (2004-present). Before joining Fidelity Investments, Mr. Robins worked at KPMG LLP, where he was a partner in KPMG's department of professional practice (2002-2004). |
Walter C. Donovan (46) |
| Year of Election or Appointment: 2007 Vice President of Fidelity's Equity Funds. Mr. Donovan also serves as President of FMR and FMR Co., Inc., and Executive Vice President of Fidelity Investments Money Management, Inc. (2007-present). Previously, Mr. Donovan served as Executive Vice President of FMR and FMR Co., Inc. (2005-2007) and Senior Vice President of FMR (2003-2005) and FMR Co., Inc. (2004-2005). |
Eric M. Wetlaufer (46) |
| Year of Election or Appointment: 2006 Vice President of Fidelity's International Equity Funds. Mr. Wetlaufer also serves as Group Chief Investment Officer of FMR. Mr. Wetlaufer is Chairman, Chief Executive Officer, and President of Fidelity Management & Research (Hong Kong) Limited (2008-present); Chairman, Chief Executive Officer, President, and a Director of Fidelity Management & Research (Japan) Inc. (2008-present); Chairman and Chief Executive Officer (2007-present) and President and a Director (2006-present) of Fidelity Management & Research (U.K.) Inc. and President and a Director of Fidelity Research & Analysis Company (2006-present). Before joining Fidelity Investments in 2005, Mr. Wetlaufer was a partner in Oxhead Capital Management (2004-2005) and a Chief Investment Officer of Putnam Investments (1997-2003). |
Scott C. Goebel (40) |
| Year of Election or Appointment: 2008 Secretary and Chief Legal Officer (CLO) of the Fidelity funds. Mr. Goebel also serves as General Counsel, Secretary, and Senior Vice President of FMR (2008-present); Deputy General Counsel of FMR LLC; Chief Legal Secretary of Fidelity Management & Research (Hong Kong) Limited (2008-present) and Assistant Secretary of Fidelity Management & Research (Japan) Inc. (2008-present). Previously, Mr. Goebel served as Assistant Secretary of the Funds (2007-2008) and as Vice President and Secretary of Fidelity Distributors Corporation (FDC) (2005-2007). |
John B. McGinty, Jr. (46) |
| Year of Election or Appointment: 2008 Assistant Secretary of Fidelity's Equity and High Income Funds. Mr. McGinty is an employee of Fidelity Investments (2004-present). Mr. McGinty also serves as Senior Vice President, Secretary, and Chief Legal Officer of FDC (2007-present). Before joining Fidelity Investments, Mr. McGinty practiced law at Ropes & Gray, LLP. |
Holly C. Laurent (54) |
| Year of Election or Appointment: 2008 Anti-Money Laundering (AML) Officer of the Fidelity funds. Ms. Laurent is an employee of Fidelity Investments. Previously, Ms. Laurent was Senior Vice President and Head of Legal for Fidelity Business Services India Pvt. Ltd. (2006-2008), Senior Vice President, Deputy General Counsel and Group Head for FMR LLC (2005-2006). |
Christine Reynolds (50) |
| Year of Election or Appointment: 2008 Chief Financial Officer of the Fidelity funds. Ms. Reynolds became President of Fidelity Pricing and Cash Management Services (FPCMS) in August 2008. She served as Chief Operating officer of FPCMS from 2007 through July 2008. Previously, Ms. Reynolds served as President, Treasurer, and Anti-Money Laundering officer of the Fidelity funds (2004-2007). Before joining Fidelity Investments, Ms. Reynolds worked at PricewaterhouseCoopers LLP (PwC) (1980-2002), where she was an audit partner with PwC's investment management practice. |
Kenneth A. Rathgeber (61) |
| Year of Election or Appointment: 2004 Chief Compliance Officer of Fidelity's Equity and High Income Funds. Mr. Rathgeber is Chief Compliance Officer of Fidelity Management & Research (Hong Kong) Limited (2008-present), Fidelity Management & Research (Japan) Inc. (2008-present), FMR (2005-present), FMR Co., Inc. (2005-present), Fidelity Management & Research (U.K.) Inc. (2005-
present), Fidelity Research & Analysis Company (2005-present), Fidelity Investments Money Management, Inc. (2005-present), and Strategic Advisers, Inc. (2005-present). |
Bryan A. Mehrmann (47) |
| Year of Election or Appointment: 2005 Deputy Treasurer of the Fidelity funds. Mr. Mehrmann is an employee of Fidelity Investments. Previously, Mr. Mehrmann served as Vice President of Fidelity Investments Institutional Services Group (FIIS)/Fidelity Investments Institutional Operations Corporation, Inc. (FIIOC) Client Services (1998-2004). |
Adrien E. Deberghes (41) |
| Year of Election or Appointment: 2008 Deputy Treasurer of Fidelity's Equity and High Income Funds. Mr. Deberghes is an employee of Fidelity Investments (2008-present). Previously, Mr. Deberghes served as Senior Vice President of Mutual Fund Administration at State Street Corporation (2007-2008), Senior Director of Mutual Fund Administration at Investors Bank & Trust (2005-2007), and Director of Finance for Dunkin' Brands (2000-2005). |
Robert G. Byrnes (41) |
| Year of Election or Appointment: 2005 Assistant Treasurer of the Fidelity funds. Mr. Byrnes is an employee of Fidelity Investments (2005-present). Previously, Mr. Byrnes served as Vice President of Fidelity Pricing and Cash Management Services (FPCMS) (2003-2005). Before joining Fidelity Investments, Mr. Byrnes worked at Deutsche Asset Management where he served as Vice President of the Investment Operations Group (2000-2003). |
Peter L. Lydecker (54) |
| Year of Election or Appointment: 2004 Assistant Treasurer of the Fidelity funds. Mr. Lydecker is an employee of Fidelity Investments. |
Paul M. Murphy (61) |
| Year of Election or Appointment: 2007 Assistant Treasurer of the Fidelity funds. Mr. Murphy is an employee of Fidelity Investments (2007-present). Previously, Mr. Murphy served as Chief Financial Officer of the Fidelity Funds (2005-2006), Vice President and Associate General Counsel of FMR (2007), and Senior Vice President of Fidelity Pricing and Cash Management Services (FPCMS) (1994-2007). |
Gary W. Ryan (50) |
| Year of Election or Appointment: 2005 Assistant Treasurer of the Fidelity funds. Mr. Ryan is an employee of Fidelity Investments. Previously, Mr. Ryan served as Vice President of Fund Reporting in Fidelity Pricing and Cash Management Services (FPCMS) (1999-2005). |
** FMR Corp. merged with and into FMR LLC on October 1, 2007. Any references to FMR LLC for prior periods are deemed to be references to the prior entity.
Annual Report
Institutional Class designates 46% of the dividends distributed in December during the fiscal year as amounts which may be taken into account as a dividend for purposes of the maximum rate under section 1(h)(11) of the Internal Revenue Code.
The amounts per share which represent income derived from sources within, and taxes paid to, foreign countries or possessions of the United States are as follows:
| Pay Date | Income | Taxes |
Institutional Class | 12/10/2007 | $0.207 | $0.0319 |
The fund will notify shareholders in January 2009 of amounts for use in preparing 2008 income tax returns.
Annual Report
A special meeting of the fund's shareholders was held on December 13, 2007. The results of votes taken among shareholders on the proposals before them are reported below. Each vote reported represents one dollar of net asset value held on the record date for the meeting.
PROPOSAL 1 |
To amend the Declaration of Trust to reduce the required quorum for shareholder meetings.A |
| # of
Votes | % of
Votes |
Affirmative | 45,014,793,255.82 | 80.372 |
Against | 6,871,112,667.08 | 12.268 |
Abstain | 2,163,456,438.02 | 3.863 |
Broker
Non-Votes | 1,958,633,563.89 | 3.497 |
TOTAL | 56,007,995,924.81 | 100.000 |
PROPOSAL 2 |
To elect the nominees specified below as Trustees.A |
James C. Curvey |
Affirmative | 53,384,952,361.03 | 95.317 |
Withheld | 2,623,043,563.78 | 4.683 |
TOTAL | 56,007,995,924.81 | 100.000 |
Dennis J. Dirks |
Affirmative | 53,595,104,608.67 | 95.692 |
Withheld | 2,412,891,316.14 | 4.308 |
TOTAL | 56,007,995,924.81 | 100.000 |
Albert R. Gamper, Jr. |
Affirmative | 53,570,235,221.69 | 95.647 |
Withheld | 2,437,760,703.12 | 4.353 |
TOTAL | 56,007,995,924.81 | 100.000 |
George H. Heilmeier |
Affirmative | 53,166,350,588.50 | 94.926 |
Withheld | 2,841,645,336.31 | 5.074 |
TOTAL | 56,007,995,924.81 | 100.000 |
| # of
Votes | % of
Votes |
Edward C. Johnson 3d |
Affirmative | 53,230,508,654.93 | 95.041 |
Withheld | 2,777,487,269.88 | 4.959 |
TOTAL | 56,007,995,924.81 | 100.000 |
James H. Keyes |
Affirmative | 53,549,161,456.52 | 95.610 |
Withheld | 2,458,834,468.29 | 4.390 |
TOTAL | 56,007,995,924.81 | 100.000 |
Marie L. Knowles |
Affirmative | 53,543,925,066.86 | 95.601 |
Withheld | 2,464,070,857.95 | 4.399 |
TOTAL | 56,007,995,924.81 | 100.000 |
Ned C. Lautenbach |
Affirmative | 53,547,116,322.50 | 95.606 |
Withheld | 2,460,879,602.31 | 4.394 |
TOTAL | 56,007,995,924.81 | 100.000 |
Cornelia M. Small |
Affirmative | 53,564,793,514.25 | 95.638 |
Withheld | 2,443,202,410.56 | 4.362 |
TOTAL | 56,007,995,924.81 | 100.000 |
William S. Stavropoulos |
Affirmative | 53,426,544,502.76 | 95.391 |
Withheld | 2,581,451,422.05 | 4.609 |
TOTAL | 56,007,995,924.81 | 100.000 |
Kenneth L. Wolfe |
Affirmative | 53,229,881,790.63 | 95.040 |
Withheld | 2,778,114,134.18 | 4.960 |
TOTAL | 56,007,995,924.81 | 100.000 |
A Denotes trust-wide proposal and voting results. |
Annual Report
Proxy Voting Results
A special meeting of the fund's shareholders was held on April 16, 2008. The results of votes taken among shareholders on the proposal before them are reported below. Each vote reported represents one dollar of net asset value held on the record date for the meeting.
PROPOSAL 1 |
To elect a Board of Trustees.A |
| # of
Votes | % of
Votes |
James C. Curvey |
Affirmative | 44,485,656,811.55 | 94.702 |
Withheld | 2,488,551,854.62 | 5.298 |
TOTAL | 46,974,208,666.17 | 100.000 |
Dennis J. Dirks |
Affirmative | 44,706,671,638.31 | 95.173 |
Withheld | 2,267,537,027.86 | 4.827 |
TOTAL | 46,974,208,666.17 | 100.000 |
Edward C. Johnson 3d |
Affirmative | 44,294,881,638.16 | 94.296 |
Withheld | 2,679,327,028.01 | 5.704 |
TOTAL | 46,974,208,666.17 | 100.000 |
Alan J. Lacy |
Affirmative | 44,685,373,413.16 | 95.127 |
Withheld | 2,288,835,253.01 | 4.873 |
TOTAL | 46,974,208,666.17 | 100.000 |
Ned C. Lautenbach |
Affirmative | 44,634,541,379.41 | 95.019 |
Withheld | 2,339,667,286.76 | 4.981 |
TOTAL | 46,974,208,666.17 | 100.000 |
Joseph Mauriello |
Affirmative | 44,683,962,099.80 | 95.124 |
Withheld | 2,290,246,566.37 | 4.876 |
TOTAL | 46,974,208,666.17 | 100.000 |
Cornelia M. Small |
Affirmative | 44,671,688,375.36 | 95.098 |
Withheld | 2,302,520,290.81 | 4.902 |
TOTAL | 46,974,208,666.17 | 100.000 |
| # of
Votes | % of
Votes |
William S. Stavropoulos |
Affirmative | 44,465,262,087.61 | 94.659 |
Withheld | 2,508,946,578.56 | 5.341 |
TOTAL | 46,974,208,666.17 | 100.000 |
David M. Thomas |
Affirmative | 44,694,340,813.87 | 95.147 |
Withheld | 2,279,867,852.30 | 4.853 |
TOTAL | 46,974,208,666.17 | 100.000 |
Michael E. Wiley |
Affirmative | 44,686,513,174.78 | 95.130 |
Withheld | 2,287,695,491.39 | 4.870 |
TOTAL | 46,974,208,666.17 | 100.000 |
A Denotes trust-wide proposal and voting results.
Annual Report
Board Approval of Investment Advisory Contracts and Management Fees
Fidelity International Value Fund
Each year, typically in July, the Board of Trustees, including the Independent Trustees (together, the Board), votes on the renewal of the management contract and sub-advisory agreements (together, the Advisory Contracts) for the fund. The Board, assisted by the advice of fund counsel and Independent Trustees' counsel, requests and considers a broad range of information throughout the year.
The Board meets regularly and, acting directly and through its separate committees, requests and receives information concerning, and considers at each of its meetings factors that are relevant to, its annual consideration of the renewal of the fund's Advisory Contracts, including the services and support provided to the fund and its shareholders. At the time of the renewal, the Board had 12 standing committees, each composed of Independent Trustees with varying backgrounds, to which the Board has assigned specific subject matter responsibilities in order to enhance effective decision-making by the Board. Each committee has a written charter outlining the structure and purposes of the committee. The Board also meets as needed to consider matters specifically related to the Board's annual consideration of the renewal of Advisory Contracts.
At its July 2008 meeting, the Board of Trustees, including the Independent Trustees, unanimously determined to renew the fund's Advisory Contracts. In reaching its determination, the Board considered all factors it believed relevant, including (i) the nature, extent, and quality of the services to be provided to the fund and its shareholders (including the investment performance of the fund); (ii) the competitiveness of the fund's management fee and total expenses; (iii) the total costs of the services to be provided by and the profits to be realized by Fidelity from its relationship with the fund; (iv) the extent to which economies of scale would be realized as the fund grows; and (v) whether fee levels reflect these economies of scale, if any, for the benefit of fund shareholders. The Board also approved agreements with foreign sub-advisers Fidelity Management & Research (Japan) Inc. and Fidelity Management & Research (Hong Kong) Limited, as well as amendments to the fund's agreement with Fidelity Management & Research (U.K.) Inc.
In considering whether to renew the Advisory Contracts for the fund, the Board ultimately reached a determination, with the assistance of fund counsel and Independent Trustees' counsel and through the exercise of its business judgment, that the renewal of the Advisory Contracts and the compensation to be received by Fidelity under the management contract is consistent with Fidelity's fiduciary duty under applicable law. The Board's decision to renew the Advisory Contracts was not based on any single factor noted above, but rather was based on a comprehensive consideration of all the information provided to the Board at its meetings throughout the year. The Board, in reaching its determination to renew the Advisory Contracts, is aware that shareholders in the fund have a broad range of investment choices available to them, including a wide choice among mutual funds offered by competitors to Fidelity, and that the fund's shareholders, with the opportunity to review and weigh the disclosure provided by the fund in its prospectus and other public disclosures, have chosen to invest in this fund, managed by Fidelity.
Annual Report
Board Approval of Investment Advisory Contracts and
Management Fees - continued
Nature, Extent, and Quality of Services Provided. The Board considered staffing within the investment adviser, FMR, and the sub-advisers (together, the Investment Advisers), including the backgrounds of the fund's investment personnel and the fund's investment objective and discipline. The Independent Trustees also had discussions with senior management of Fidelity's investment operations and investment groups. The Board considered the structure of the portfolio manager compensation program and whether this structure provides appropriate incentives.
Resources Dedicated to Investment Management and Support Services. The Board reviewed the size, education, and experience of the Investment Advisers' investment staff, their use of technology, and the Investment Advisers' approach to recruiting, training, and retaining portfolio managers and other research, advisory, and management personnel. The Board noted that Fidelity's analysts have access to a variety of technological tools that enable them to perform both fundamental and quantitative analysis and to specialize in various disciplines. The Board considered Fidelity's extensive global research capabilities that enable the Investment Advisers to aggregate data from various sources in an effort to produce positive investment results. The Board also considered that Fidelity's portfolio managers and analysts have access to daily portfolio attribution that allows for monitoring of a fund's portfolio, as well as an electronic communication system that provides immediate real-time access to research concerning issuers and credit enhancers.
Shareholder and Administrative Services. The Board considered (i) the nature, extent, quality, and cost of advisory, administrative, distribution, and shareholder services performed by the Investment Advisers and their affiliates under the Advisory Contracts and under separate agreements covering transfer agency, pricing and bookkeeping, and securities lending services for the fund; (ii) the nature and extent of the Investment Advisers' supervision of third party service providers, principally custodians and subcustodians; and (iii) the resources devoted to, and the record of compliance with, the fund's compliance policies and procedures. The Board also reviewed the allocation of fund brokerage, including allocations to brokers affiliated with the Investment Advisers, the use of brokerage commissions to pay fund expenses, and the use of "soft" commission dollars to pay for research services. The Board further considered that Fidelity voluntarily pays for market data out of its own resources.
The Board noted that the growth of fund assets across the complex allows Fidelity to reinvest in the development of services designed to enhance the value or convenience of the Fidelity funds as investment vehicles. These services include 24-hour access to account information and market information through phone representatives and over the Internet, and investor education materials and asset allocation tools.
Annual Report
Investment in a Large Fund Family. The Board considered the benefits to shareholders of investing in a Fidelity fund, including the benefits of investing in a fund that is part of a large family of funds offering a variety of investment disciplines and providing for a large variety of mutual fund investor services. For example, fund shareholders are offered the privilege of exchanging shares of the fund for shares of other Fidelity funds, as set forth in the fund's prospectus, without paying a sales charge. The Board noted that Fidelity has taken a number of actions over the previous year that benefited particular funds, including (i) dedicating additional resources to investment research and to restructure the investment research teams; (ii) contractually agreeing to reduce the management fees on Fidelity's Institutional Money Market Funds and launching Class IV and Institutional Class of certain of these funds; (iii) reducing the transfer agent fees for the Fidelity Select Portfolios and Investor Class of the VIP funds; and (iv) launching Class K of 29 equity funds as a lower-fee class available to certain employer-sponsored retirement plans.
Investment Performance. The Board considered whether the fund has operated within its investment objective, as well as its record of compliance with its investment restrictions. It also reviewed the fund's absolute investment performance for each class, as well as the fund's relative investment performance for each class measured against (i) a broad-based securities market index, and (ii) a custom peer group of mutual funds deemed appropriate by the Board. Because the fund had been in existence less than three calendar years, the following chart considered by the Board shows, for the one-year period ended December 31, 2007, the total returns of Institutional Class (Class I) and Class B of the fund, the total return of a broad-based securities market index ("benchmark"), and a range of total returns of a custom peer group of mutual funds defined by FMR based on categories assigned by Morningstar, Inc. The returns of Institutional Class (Class I) and Class B show the performance of the highest and lowest performing classes, respectively. The box within each chart shows the 25th percentile return (bottom of box) and the 75th percentile return (top of box) of the peer group. Returns shown above the box are in the first quartile and returns shown below the box are in the fourth quartile. The percentage beaten number noted below each chart corresponds to the percentile box and represents the percentage of funds in the peer group whose performance was equal to or lower than that of the fund. The fund's custom peer group, defined by FMR, is a peer group that FMR believes provides a more meaningful performance comparison than the peer group assigned by Morningstar, Inc., which assigns mutual funds to categories based on their investment styles as measured by their underlying portfolio holdings.
Annual Report
Board Approval of Investment Advisory Contracts and
Management Fees - continued
Fidelity International Value Fund

The Board reviewed the fund's relative investment performance against its peer group and stated that the performance of Institutional Class (Class I) of the fund was in the second quartile for the period shown. The Board also stated that the investment performance of Institutional Class (Class I) of the fund compared favorably to its benchmark for the period shown. The Board considered that the variations in performance among the fund's classes reflect the variations in class expenses, which result in lower performance for higher expense classes. The Board stated that it is difficult to evaluate in any comprehensive fashion the performance of the fund, in light of its relatively recent commencement of operations.
The Board also considered that the fund's management fee is subject to upward or downward adjustment depending upon whether, and to what extent, the fund's investment performance for the performance period exceeds, or is exceeded by, the record (over the same period) of a Board-approved performance adjustment index. The Board realizes that the performance adjustment provides FMR with a strong economic incentive to seek to achieve superior performance for the fund's shareholders and helps to more closely align the interests of FMR and the fund's shareholders.
The Board considered that FMR has taken steps to refocus and strengthen equity research, equity portfolio management, and compliance.
Based on its review, and giving particular weight to the nature and quality of the resources dedicated by the Investment Advisers to maintain and improve relative performance, the Board concluded that the nature, extent, and quality of the services provided to the fund will benefit the fund's shareholders, particularly in light of the Board's view that the fund's shareholders benefit from investing in a fund that is part of a large family of funds offering a variety of investment disciplines and services.
Annual Report
Competitiveness of Management Fee and Total Fund Expenses. The Board considered the fund's management fee and total expenses compared to "mapped groups" of competitive funds and classes. Fidelity creates "mapped groups" by combining similar Lipper investment objective categories that have comparable management fee characteristics. Combining Lipper investment objective categories aids the Board's management fee and total expense comparisons by broadening the competitive group used for comparison and by reducing the number of universes to which various Fidelity funds are compared. The Board also considered supplemental information about how the fund's management fee and total expenses ranked relative to groups based on Lipper classifications, which take into account a fund's market capitalization and style.
The Board considered two proprietary management fee comparisons for the 12-month (or shorter) periods shown in the chart below. The group of Lipper funds used by the Board for management fee comparisons is referred to below as the "Total Mapped Group." The Total Mapped Group comparison focuses on a fund's standing relative to the total universe of comparable funds available to investors, in terms of gross management fees before expense reimbursements or caps, and without giving effect to the fund's performance adjustment. "TMG %" represents the percentage of funds in the Total Mapped Group that had management fees that were lower than the fund's. For example, a TMG % of 14% means that 86% of the funds in the Total Mapped Group had higher management fees than the fund. The "Asset-Size Peer Group" (ASPG) comparison focuses on a fund's standing relative to non-Fidelity funds similar in size to the fund within the Total Mapped Group. The ASPG represents at least 15% of the funds in the Total Mapped Group with comparable asset size and management fee characteristics, subject to a minimum of 50 funds (or all funds in the Total Mapped Group if fewer than 50). Additional information, such as the ASPG quartile in which the fund's management fee ranked and the impact of the fund's performance adjustment, is also included in the chart and considered by the Board.
Annual Report
Board Approval of Investment Advisory Contracts and
Management Fees - continued
Fidelity International Value Fund

The Board noted that the fund's management fee ranked below the median of its Total Mapped Group and below the median of its ASPG for 2007. The Board also noted the effect of the fund's negative performance adjustment on the fund's management fee ranking. The Board noted that the performance adjustment for 2007 represents calculations for performance periods that differ from the period shown in the performance chart above.
Based on its review, the Board concluded that the fund's management fee was fair and reasonable in light of the services that the fund receives and the other factors considered.
In its review of each class's total expenses, the Board considered the fund's management fee as well as other fund or class expenses, as applicable, such as transfer agent fees, pricing and bookkeeping fees, fund-paid 12b-1 fees, and custodial, legal, and audit fees. The Board also noted the effects of any waivers and reimbursements on fees and expenses, as well as the impact of the fund's performance adjustment. As part of its review, the Board also considered current and historical total expenses of each class of the fund compared to competitive fund median expenses. Each class of the fund is compared to those funds and classes in the Total Mapped Group (used by the Board for management fee comparisons) that have a similar sales load structure.
The Board noted that the total expenses of each of Class A, Class B, Class C, Institutional Class, and Fidelity International Value (retail class) ranked below its competitive median for 2007, and the total expenses of Class T ranked above its competitive median for 2007. The Board considered that the total expenses of Class T were above the median primarily because its 12b-1 fee is higher than the typical front-end load class. The Board noted that the fund offers multiple classes, each of which has a different sales load and 12b-1 fee structure, and that the multiple structures are intended to offer a range of pricing options for the intermediary market. The Board also noted that the total expenses of the classes vary primarily by the level of their 12b-1 fees, although differences in transfer agent fees may also cause expenses to vary from class to class.
Annual Report
In its review of total expenses, the Board also considered Fidelity fee structures and other information on clients that FMR and its affiliates service in other competitive markets, such as other mutual funds advised or subadvised by FMR or its affiliates, pension plan clients, and other institutional clients.
Based on its review, the Board concluded that the total expenses of each class of the fund were reasonable, although in one case above the median of the universe presented for comparison, in light of the services that the fund and its shareholders receive and the other factors considered.
Costs of the Services and Profitability. The Board considered the revenues earned and the expenses incurred by Fidelity in conducting the business of developing, marketing, distributing, managing, administering and servicing the fund and its shareholders. The Board also considered the level of Fidelity's profits in respect of all the Fidelity funds.
On an annual basis, FMR presents to the Board Fidelity's profitability for the fund. Fidelity calculates the profitability for each fund, as well as aggregate profitability for groups of Fidelity funds and all Fidelity funds, using a series of detailed revenue and cost allocation methodologies which originate with the audited books and records of Fidelity. The Audit Committee of the Board reviews any significant changes from the prior year's methodologies.
PricewaterhouseCoopers LLP (PwC), independent registered public accounting firm and auditor to Fidelity and certain Fidelity funds, has been engaged annually by the Board as part of the Board's assessment of the results of Fidelity's profitability analysis. PwC's engagement includes the review and assessment of Fidelity's methodologies used in determining the revenues and expenses attributable to Fidelity's mutual fund business, and completion of agreed-upon procedures surrounding the mathematical accuracy of fund profitability and its conformity to allocation methodologies. After considering PwC's reports issued under the engagement and information provided by Fidelity, the Board believes that while other allocation methods may also be reasonable, Fidelity's profitability methodologies are reasonable in all material respects.
The Board has also reviewed Fidelity's non-fund businesses and any fall-out benefits related to the mutual fund business as well as cases where Fidelity's affiliates may benefit from or be related to the fund's business.
Annual Report
Board Approval of Investment Advisory Contracts and
Management Fees - continued
The Board considered the costs of the services provided by and the profits realized by Fidelity in connection with the operation of the fund and determined that the amount of profit is a fair entrepreneurial profit for the management of the fund.
Economies of Scale. The Board considered whether there have been economies of scale in respect of the management of the Fidelity funds, whether the Fidelity funds (including the fund) have appropriately benefited from any such economies of scale, and whether there is potential for realization of any further economies of scale. The Board considered the extent to which the fund will benefit from economies of scale through increased services to the fund, through waivers or reimbursements, or through fee or expense reductions.
The Board recognized that the fund's management contract incorporates a "group fee" structure, which provides for lower group fee rates as total fund assets under FMR's management increase, and for higher group fee rates as total fund assets under FMR's management decrease. FMR determines the group fee rates based on a tiered asset "breakpoint" schedule. The Board considered that the group fee is designed to deliver the benefits of economies of scale to fund shareholders when total fund assets increase, even if assets of any particular fund are unchanged or have declined, because some portion of Fidelity's costs are attributable to services provided to all Fidelity funds, and all funds benefit if those costs can be allocated among more assets. The Board concluded that, given the group fee structure, fund shareholders will achieve a certain level of economies of scale as assets under FMR's management increase at the fund complex level, regardless of whether Fidelity achieves any such economies of scale.
The Board further concluded that any potential economies of scale are being shared between fund shareholders and Fidelity in an appropriate manner.
Additional Information Requested by the Board. In order to develop fully the factual basis for consideration of the Fidelity funds' Advisory Contracts, the Board requested and received additional information on certain topics, including (i) fund performance trends and actions to be taken by FMR to improve certain funds' overall performance; (ii) portfolio manager changes that have occurred during the past year; (iii) Fidelity's fund profitability methodology, the profitability of certain fund service providers, and profitability trends for certain funds; (iv) Fidelity's compensation structure for portfolio managers and key personnel, including its effects on fund profitability and the extent to which portfolio manager compensation is linked to fund performance; (v) Fidelity's fee structures and rationale for recommending different fees among categories of funds; and (vi) Fidelity's rationale for recommending which funds should have a performance adjustment component as part of their management fees.
Based on its evaluation of all of the conclusions noted above, and after considering all material factors, the Board ultimately concluded that the advisory fee structures are fair and reasonable, and that the fund's Advisory Contracts should be renewed.
Annual Report
Investment Adviser
Fidelity Management & Research Company
Boston, MA
Investment Sub-Advisers
FMR Co., Inc.
Fidelity Management & Research
(U.K.) Inc.
Fidelity Management & Research
(Hong Kong) Limited
Fidelity Management & Research
(Japan) Inc.
Fidelity Research & Analysis Company
FIL Investment Advisors
Fidelity Investments Japan Limited
FIL Investment Advisors (U.K.) Ltd.
General Distributor
Fidelity Distributors Corporation
Boston, MA
Transfer and Service Agents
Fidelity Investments Institutional Operations Company, Inc.
Boston, MA
Fidelity Service Company, Inc.
Boston, MA
Custodian
The Northern Trust Company
Chicago, IL
AFIVI-UANN-1208
1.827488.102
Item 2. Code of Ethics
As of the end of the period, October 31, 2008, Fidelity Investment Trust (the trust) has adopted a code of ethics, as defined in Item 2 of Form N-CSR, that applies to its President and Treasurer and its Chief Financial Officer. A copy of the code of ethics is filed as an exhibit to this Form N-CSR.
Item 3. Audit Committee Financial Expert
The Board of Trustees of the trust has determined that Joseph Mauriello is an audit committee financial expert, as defined in Item 3 of Form N-CSR. Mr. Mauriello is independent for purposes of Item 3 of Form N-CSR.
Item 4. Principal Accountant Fees and Services
Fees and Services
The following table presents fees billed by Deloitte & Touche LLP, the member firms of Deloitte Touche Tohmatsu, and their respective affiliates (collectively, "Deloitte Entities") in each of the last two fiscal years for services rendered to Fidelity Aggressive International Fund, Fidelity Diversified International Fund, Fidelity Emerging Europe, Middle East, Africa (EMEA) Fund, Fidelity Europe Capital Appreciation Fund, Fidelity International Small Cap Fund, Fidelity International Small Cap Opportunities Fund, Fidelity International Value Fund, Fidelity Total International Equity Fund, and Fidelity Worldwide Fund (the "Funds"):
Services Billed by Deloitte Entities
October 31, 2008 FeesA, B, C
| Audit Fees | Audit-Related Fees | Tax Fees | All Other Fees |
Fidelity Aggressive International Fund | $49,000 | $- | $6,600 | $- |
Fidelity Diversified International Fund | $97,000 | $- | $6,600 | $- |
Fidelity Emerging Europe, Middle East, Africa (EMEA) Fund | $41,000 | $- | $5,800 | $- |
Fidelity Europe Capital Appreciation Fund | $43,000 | $- | $5,600 | $- |
Fidelity International Small Cap Fund | $102,000 | $- | $6,600 | $- |
Fidelity International Small Cap Opportunities Fund | $49,000 | $- | $5,600 | $- |
Fidelity International Value Fund | $49,000 | $- | $5,600 | $- |
Fidelity Total International Equity Fund | $46,000 | $- | $6,200 | $- |
Fidelity Worldwide Fund | $50,000 | $- | $5,600 | $- |
October 31, 2007 FeesA, B, C
| Audit Fees | Audit-Related Fees | Tax Fees | All Other Fees |
Fidelity Aggressive International Fund | $48,000 | $- | $6,200 | $- |
Fidelity Diversified International Fund | $138,000 | $- | $6,200 | $- |
Fidelity Emerging Europe, Middle East, Africa (EMEA) Fund | $- | $- | $- | $- |
Fidelity Europe Capital Appreciation Fund | $46,000 | $- | $5,200 | $- |
Fidelity International Small Cap Fund | $95,000 | $- | $6,200 | $- |
Fidelity International Small Cap Opportunities Fund | $53,000 | $- | $5,200 | $- |
Fidelity International Value Fund | $46,000 | $- | $5,200 | $- |
Fidelity Total International Equity Fund | $- | $- | $- | $- |
Fidelity Worldwide Fund | $51,000 | $- | $5,200 | $- |
A Amounts may reflect rounding.
B Fidelity Emerging Europe, Middle East, Africa (EMEA) Fund commenced operations on May 8, 2008.
C Fidelity Total International Equity Fund commenced operations on November 1, 2007.
The following table presents fees billed by PricewaterhouseCoopers LLP ("PwC") in each of the last two fiscal years for services rendered to Fidelity Canada Fund, Fidelity China Region Fund, Fidelity Emerging Markets Fund, Fidelity Europe Fund, Fidelity International Discovery Fund, Fidelity International Growth Fund, Fidelity Japan Fund, Fidelity Japan Smaller Companies Fund, Fidelity Latin America Fund, Fidelity Nordic Fund, Fidelity Overseas Fund, Fidelity Pacific Basin Fund and Fidelity Southeast Asia Fund (the "Funds"):
Services Billed by PwC
October 31, 2008 FeesA, B
| Audit Fees | Audit-Related Fees | Tax Fees | All Other Fees |
Fidelity Canada Fund | $63,000 | $- | $5,600 | $5,100 |
Fidelity China Region Fund | $56,000 | $- | $8,300 | $2,500 |
Fidelity Emerging Markets Fund | $80,000 | $- | $44,700 | $5,500 |
Fidelity Europe Fund | $69,000 | $- | $5,600 | $4,900 |
Fidelity International Discovery Fund | $86,000 | $- | $18,500 | $11,200 |
Fidelity International Growth Fund | $37,000 | $- | $2,700 | $1,500 |
Fidelity Japan Fund | $58,000 | $- | $5,600 | $2,600 |
Fidelity Japan Smaller Companies Fund | $46,000 | $- | $8,300 | $1,900 |
Fidelity Latin America Fund | $79,000 | $- | $5,600 | $5,700 |
Fidelity Nordic Fund | $46,000 | $- | $8,300 | $2,000 |
Fidelity Overseas Fund | $76,000 | $- | $5,600 | $7,600 |
Fidelity Pacific Basin Fund | $56,000 | $- | $39,700 | $2,100 |
Fidelity Southeast Asia Fund | $76,000 | $- | $12,800 | $4,100 |
October 31, 2007 FeesA, B
| Audit Fees | Audit-Related Fees | Tax Fees | All Other Fees |
Fidelity Canada Fund | $70,000 | $- | $4,800 | $3,400 |
Fidelity China Region Fund | $56,000 | $- | $4,800 | $1,900 |
Fidelity Emerging Markets Fund | $86,000 | $- | $58,700 | $3,800 |
Fidelity Europe Fund | $75,000 | $- | $4,800 | $4,300 |
Fidelity International Discovery Fund | $98,000 | $- | $47,100 | $8,400 |
Fidelity International Growth Fund | $- | $- | $- | $- |
Fidelity Japan Fund | $63,000 | $- | $4,800 | $2,400 |
Fidelity Japan Smaller Companies Fund | $50,000 | $- | $4,800 | $1,800 |
Fidelity Latin America Fund | $83,000 | $- | $4,800 | $4,000 |
Fidelity Nordic Fund | $53,000 | $- | $4,800 | $1,600 |
Fidelity Overseas Fund | $90,000 | $- | $4,800 | $6,600 |
Fidelity Pacific Basin Fund | $60,000 | $- | $68,400 | $1,900 |
Fidelity Southeast Asia Fund | $79,000 | $- | $17,600 | $3,000 |
A Amounts may reflect rounding.
B Fidelity International Growth Fund commenced operations on November 1, 2007.
The following table presents fees billed by PwC and Deloitte Entities that were required to be approved by the Audit Committee for services that relate directly to the operations and financial reporting of the Funds and that are rendered on behalf of Fidelity Management & Research Company ("FMR") and entities controlling, controlled by, or under common control with FMR (not including any sub-adviser whose role is primarily portfolio management and is subcontracted with or overseen by another investment adviser) that provide ongoing services to the Funds ("Fund Service Providers"):
Services Billed by Deloitte Entities
| October 31, 2008A | October 31, 2007A |
Audit-Related Fees | $745,000 | $ - |
Tax Fees | $- | $- |
All Other Fees | $- | $-B |
A Amounts may reflect rounding.
B Reflects current period presentation.
Services Billed by PwC
| October 31, 2008A | October 31, 2007A |
Audit-Related Fees | $2,110,000 | $- |
Tax Fees | $- | $- |
All Other Fees | $185,000 | $275,000 |
A Amounts may reflect rounding.
"Audit-Related Fees" represent fees billed for assurance and related services that are reasonably related to the performance of the fund audit or the review of the fund's financial statements and that are not reported under Audit Fees.
"Tax Fees" represent fees billed for tax compliance, tax advice or tax planning that relate directly to the operations and financial reporting of the fund.
"All Other Fees" represent fees billed for assurance services provided to the fund or Fund Service Provider that relate directly to the operations and financial reporting of the fund, excluding those services that are reported under Audit Fees, Audit-Related Fees or Tax Fees.
Assurance services must be performed by an independent public accountant.
* * *
The aggregate non-audit fees billed by PwC and Deloitte Entities for services rendered to the Funds, FMR (not including any sub-adviser whose role is primarily portfolio management and is subcontracted with or overseen by another investment adviser), and any Fund Service Provider for each of the last two fiscal years of the Funds are as follows:
Billed By | October 31, 2008 A | October 31, 2007 A |
PwC | $3,220,000 | $2,275,000 |
Deloitte Entities | $1,440,000 | $705,000 |
A Amounts may reflect rounding.
The trust's Audit Committee has considered non-audit services that were not pre-approved that were provided by PwC and Deloitte Entities to Fund Service Providers to be compatible with maintaining the independence of PwC and Deloitte Entities in their audits of the Funds, taking into account representations from PwC and Deloitte Entities, in accordance with Independence Standards Board Standard No. 1, regarding their independence from the Funds and their related entities and FMR's review of the appropriateness and permissibility under applicable law of such non-audit services prior to their provision to the Fund Service Providers.
Audit Committee Pre-Approval Policies and Procedures
The Fidelity fund's Audit Committee must pre-approve all audit and non-audit services provided by a fund's independent registered public accounting firm relating to the operations or financial reporting of the fund. Prior to the commencement of any audit or non-audit services to a fund, the Audit Committee reviews the services to determine whether they are appropriate and permissible under applicable law.
The Audit Committee has adopted policies and procedures to, among other purposes, provide a framework for the Committee's consideration of non-audit services by the audit firms that audit the Fidelity funds. The policies and procedures require that any non-audit service provided by a fund audit firm to a Fidelity fund and any non-audit service provided by a fund auditor to a Fund Service Provider that relates directly to the operations and financial reporting of a Fidelity fund ("Covered Service") are subject to approval by the Audit Committee before such service is provided.
All Covered Services must be approved in advance of provision of the service either: (i) by formal resolution of the Audit Committee, or (ii) by oral or written approval of the service by the Chair of the Audit Committee (or if the Chair is unavailable, such other member of the Audit Committee as may be designated by the Chair to act in the Chair's absence). The approval contemplated by (ii) above is permitted where the Treasurer determines that action on such an engagement is necessary before the next meeting of the Audit Committee.
Non-audit services provided by a fund audit firm to a Fund Service Provider that do not relate directly to the operations and financial reporting of a Fidelity fund are reported to the Audit Committee on a periodic basis.
Non-Audit Services Approved Pursuant to Rule 2-01(c)(7)(i)(C) and (ii) of Regulation S-X ("De Minimis Exception")
There were no non-audit services approved or required to be approved by the Audit Committee pursuant to the De Minimis Exception during the Funds' last two fiscal years relating to services provided to (i) the Funds or (ii) any Fund Service Provider that relate directly to the operations and financial reporting of the Funds.
Item 5. Audit Committee of Listed Registrants
Not applicable.
Item 6. Investments
(a) Not applicable.
(b) Not applicable
Item 7. Disclosure of Proxy Voting Policies and Procedures for Closed-End Management Investment Companies
Not applicable.
Item 8. Portfolio Managers of Closed-End Management Investment Companies
Not applicable.
Item 9. Purchase of Equity Securities by Closed-End Management Investment Company and Affiliated Purchasers
Not applicable.
Item 10. Submission of Matters to a Vote of Security Holders
There were no material changes to the procedures by which shareholders may recommend nominees to the trust's Board of Trustees.
Item 11. Controls and Procedures
(a)(i) The President and Treasurer and the Chief Financial Officer have concluded that the trust's disclosure controls and procedures (as defined in Rule 30a-3(c) under the Investment Company Act) provide reasonable assurances that material information relating to the trust is made known to them by the appropriate persons, based on their evaluation of these controls and procedures as of a date within 90 days of the filing date of this report.
(a)(ii) There was no change in the trust's internal control over financial reporting (as defined in Rule 30a-3(d) under the Investment Company Act) that occurred during the second fiscal quarter of the period covered by this report that has materially affected, or is reasonably likely to materially affect, the trust's internal control over financial reporting.
Item 12. Exhibits
(a) | (1) | Code of Ethics pursuant to Item 2 of Form N-CSR is filed and attached hereto as EX-99.CODE ETH. |
(a) | (2) | Certification pursuant to Rule 30a-2(a) under the Investment Company Act of 1940 (17 CFR 270.30a-2(a)) is filed and attached hereto as Exhibit 99.CERT. |
(a) | (3) | Not applicable. |
(b) | | Certification pursuant to Rule 30a-2(b) under the Investment Company Act of 1940 (17 CFR 270.30a-2(b)) is furnished and attached hereto as Exhibit 99.906CERT. |
SIGNATURES
Pursuant to the requirements of the Securities Exchange Act of 1934 and the Investment Company Act of 1940, the registrant has duly caused this report to be signed on its behalf by the undersigned, thereunto duly authorized.
Fidelity Investment Trust
By: | /s/Kenneth B. Robins |
| Kenneth B. Robins |
| President and Treasurer |
| |
Date: | January 5, 2009 |
Pursuant to the requirements of the Securities Exchange Act of 1934 and the Investment Company Act of 1940, this report has been signed below by the following persons on behalf of the registrant and in the capacities and on the dates indicated.
By: | /s/Kenneth B. Robins |
| Kenneth B. Robins |
| President and Treasurer |
| |
Date: | January 5, 2009 |
By: | /s/Christine Reynolds |
| Christine Reynolds |
| Chief Financial Officer |
| |
Date: | January 5, 2009 |